Effects of Quartz Powder on the Microstructure and Key Properties of Cement Paste


Department of Architectural Engineering, Kangwon National University, Chuncheon-Si 200-701, Korea
*
Author to whom correspondence should be addressed.
Sustainability 2018, 10(10), 3369; https://doi.org/10.3390/su10103369
Submission received: 21 August 2018
/
Revised: 4 September 2018
/
Accepted: 6 September 2018
/
Published: 20 September 2018
(This article belongs to the Special Issue Sustainable Construction Materials)
Abstract
:This paper compares the effects of the water-to-binder (w/b) ratio and quartz contents on the properties of cement–quartz paste. The w/b ratios of the paste mixtures specimens are 0.5 and 0.2, and the quartz powder contents are 0, 10, and 20%. At the age of 1, 3, 7, and 28 days, compressive strength test, X-ray fluorescence (XRF) spectroscopy, X-ray diffraction (XRD), mercury intrusion porosimetry (MIP), scanning electron microscopy (SEM), isothermal calorimetry, and thermogravimetric (TG) analysis were performed. The experimental results show that the quartz powder mainly has the dilution effect and crystal nucleation effect on cement hydration, and the addition of quartz powder does not change the type of hydration product. The effect of quartz powder on cement hydration is closely related to the w/b ratio. In the case of a low w/b ratio of 0.2, the addition of quartz powder did not impair the compressive strength of paste. For different w/b ratios (0.5 and 0.2) and various quartz powder contents (0, 10, and 20%) at different ages (1, 3, 7, and 28 days), there is a uniform linear relationship between strength and porosity. Similarly, there is a uniform linear relationship between chemically bound water and calcium hydroxide, between heat of hydration and compressive strength, and between chemically bound water and compressive strength. At the same time, the effect of the partial replacement of cement by quartz powder on sustainability is considered in this paper.
1. Introduction
Around the world, the construction industry is one of the main causes of carbon dioxide (CO2) release. The process of making cement and the energy consumption in construction causes serious problems as a result of CO2 emissions. It is estimated that about one ton of CO2 can be released into the air by the production of one ton of Portland cement [1]. Therefore, with the purpose of reducing the amount of cement, additives with a lower cost than ordinary Portland cement (OPC) are used in cement-based materials to save energy and reduce pollution. Although the feasibility of fly ash, volcanic ash, and steel slag as a cement replacement material has been researched and studied [2,3,4,5], many regions in the world encounter problems regarding a stable supply of these supplementary cementitious materials. Accordingly, in order to reduce the cement content in concrete and develop new cementing material, all available materials need to be carefully studied.
Quartz powder is commonly used in the manufacture of high-performance concrete and ultra-high-performance concrete (UHPC). Quartz powder is considered to be chemically inert at normal ambient temperatures, but is not completely inert at high temperatures and high pH values [6].
The added inert substances have relatively little hydraulic effect on cement [7]. Inert fillers (such as plastic powder) only dilute Portland cement. Nonetheless, it has been shown that the hydration degree of cement could be increased by fillers based on the study of the combination of a non-hydraulic filler (rutile powder) and the main components [8]. When these inert materials are mixed with Portland cement, although there is no chemical reaction [9], they have physical effects and can also accelerate the hydration reaction of the clinker component. This phenomenon may be the result of the fillers providing more nucleation sites for calcium silicate hydrate (C-S-H) growth [10,11,12,13]. Stark et al. [14] performed a study to observe the nucleation and growth of C-S-H Phases on mineral admixtures such as quartz and calcite. Bentz et al. [15] also demonstrated that the early hydration of cement was accelerated and the time of initial setting was reduced by limestone and quartz powder.
Although abundant studies have been performed about quartz powder blended concrete, there are some points which have not been considered in previous studies. First, in previous studies, the w/b ratios of specimens are generally higher than 0.3. For concrete with a very low w/b ratio of 0.2, the available experimental results are very limited. Second, for producing UHPC, the w/b ratio is about 0.2. Quartz powder and silica fume are generally used together as UHPC components [16]. However, the effect of one individual component—such as quartz powder—on the properties of concrete has not been fully clarified.
This study compared the effects of w/b ratios (0.5 and 0.2) and quartz contents (0, 10, and 20%) on the performance of cement–quartz paste. Moreover, this study not only analyzes the relationship between compressive strength and porosity and the relationship between chemically bound water and calcium hydroxide, but also analyzes the relationship between hydration heat and compressive strength, and the relationship between chemically bound water and compressive strength. The experimental methods and analyses used herein include compressive strength test, X-ray fluorescence (XRF) spectroscopy, X-ray diffraction (XRD), mercury intrusion porosimetry (MIP), scanning electron microscopy (SEM), isothermal calorimetry, and thermogravimetric (TG) analysis.
2. Materials and Methods
2.1. Paste Constituents
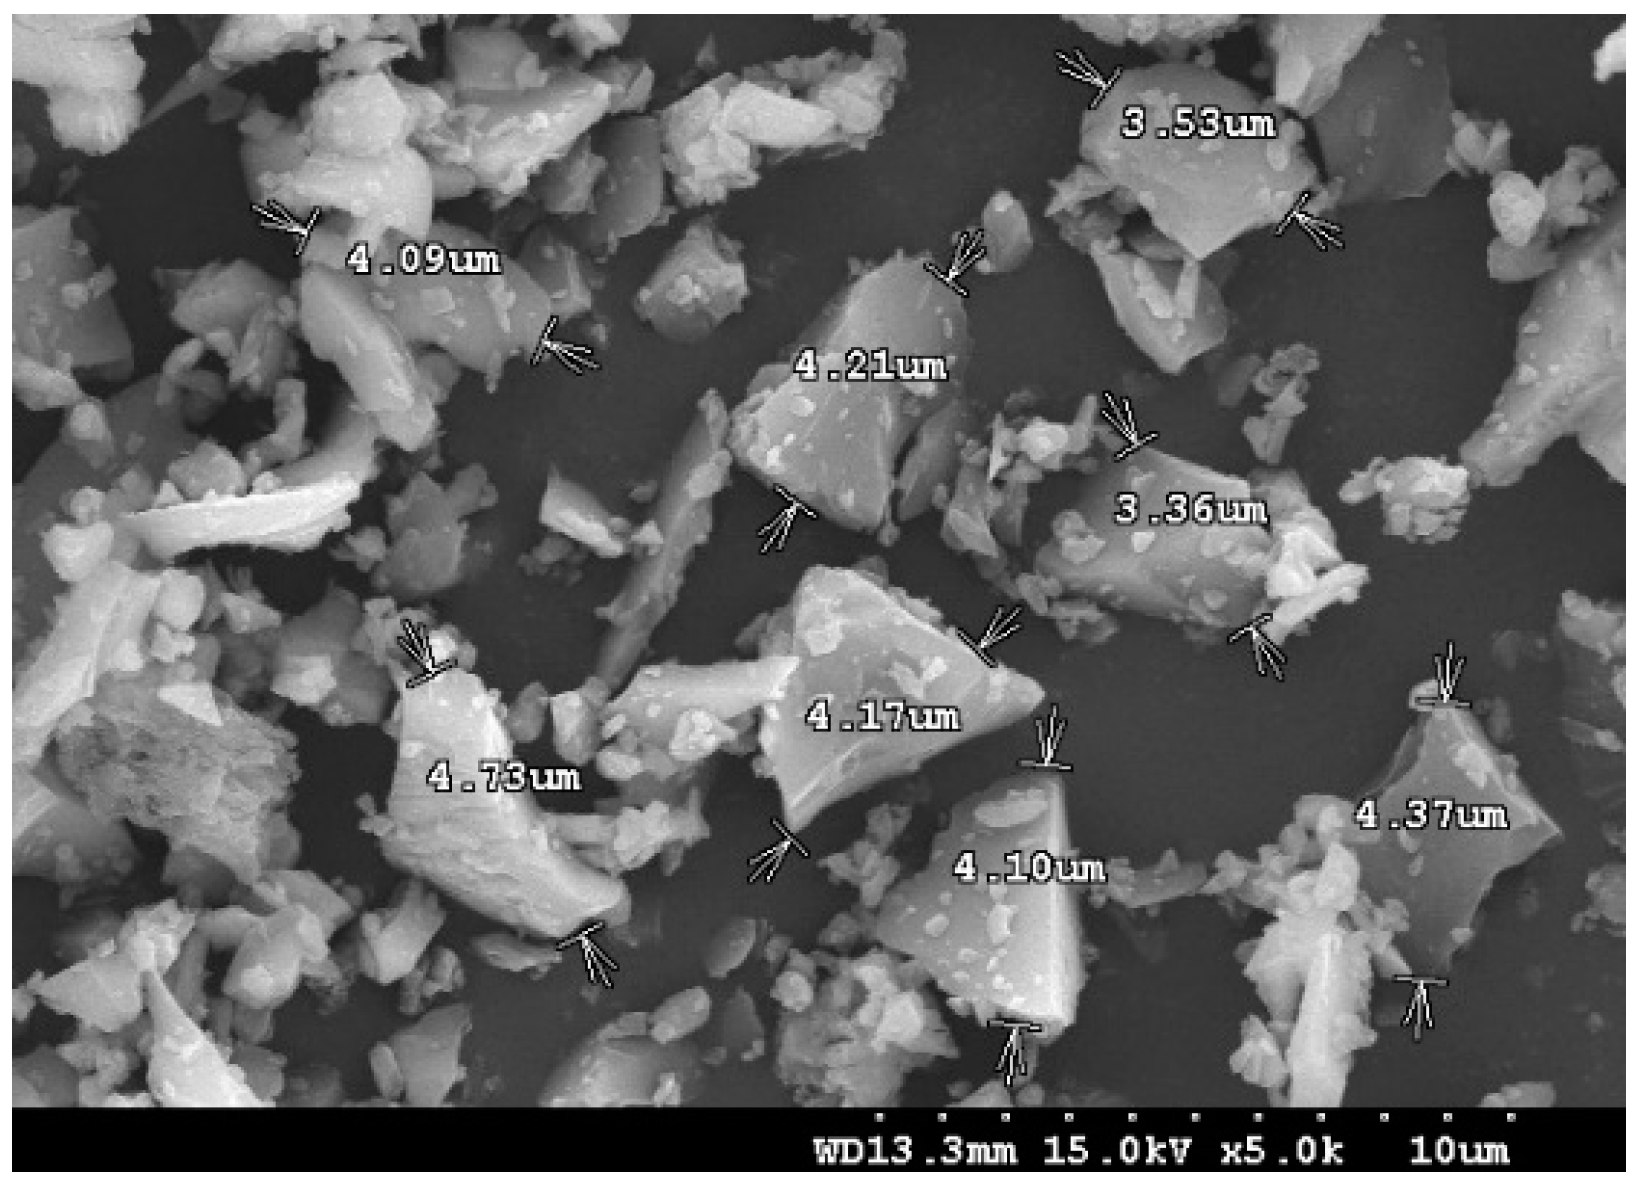
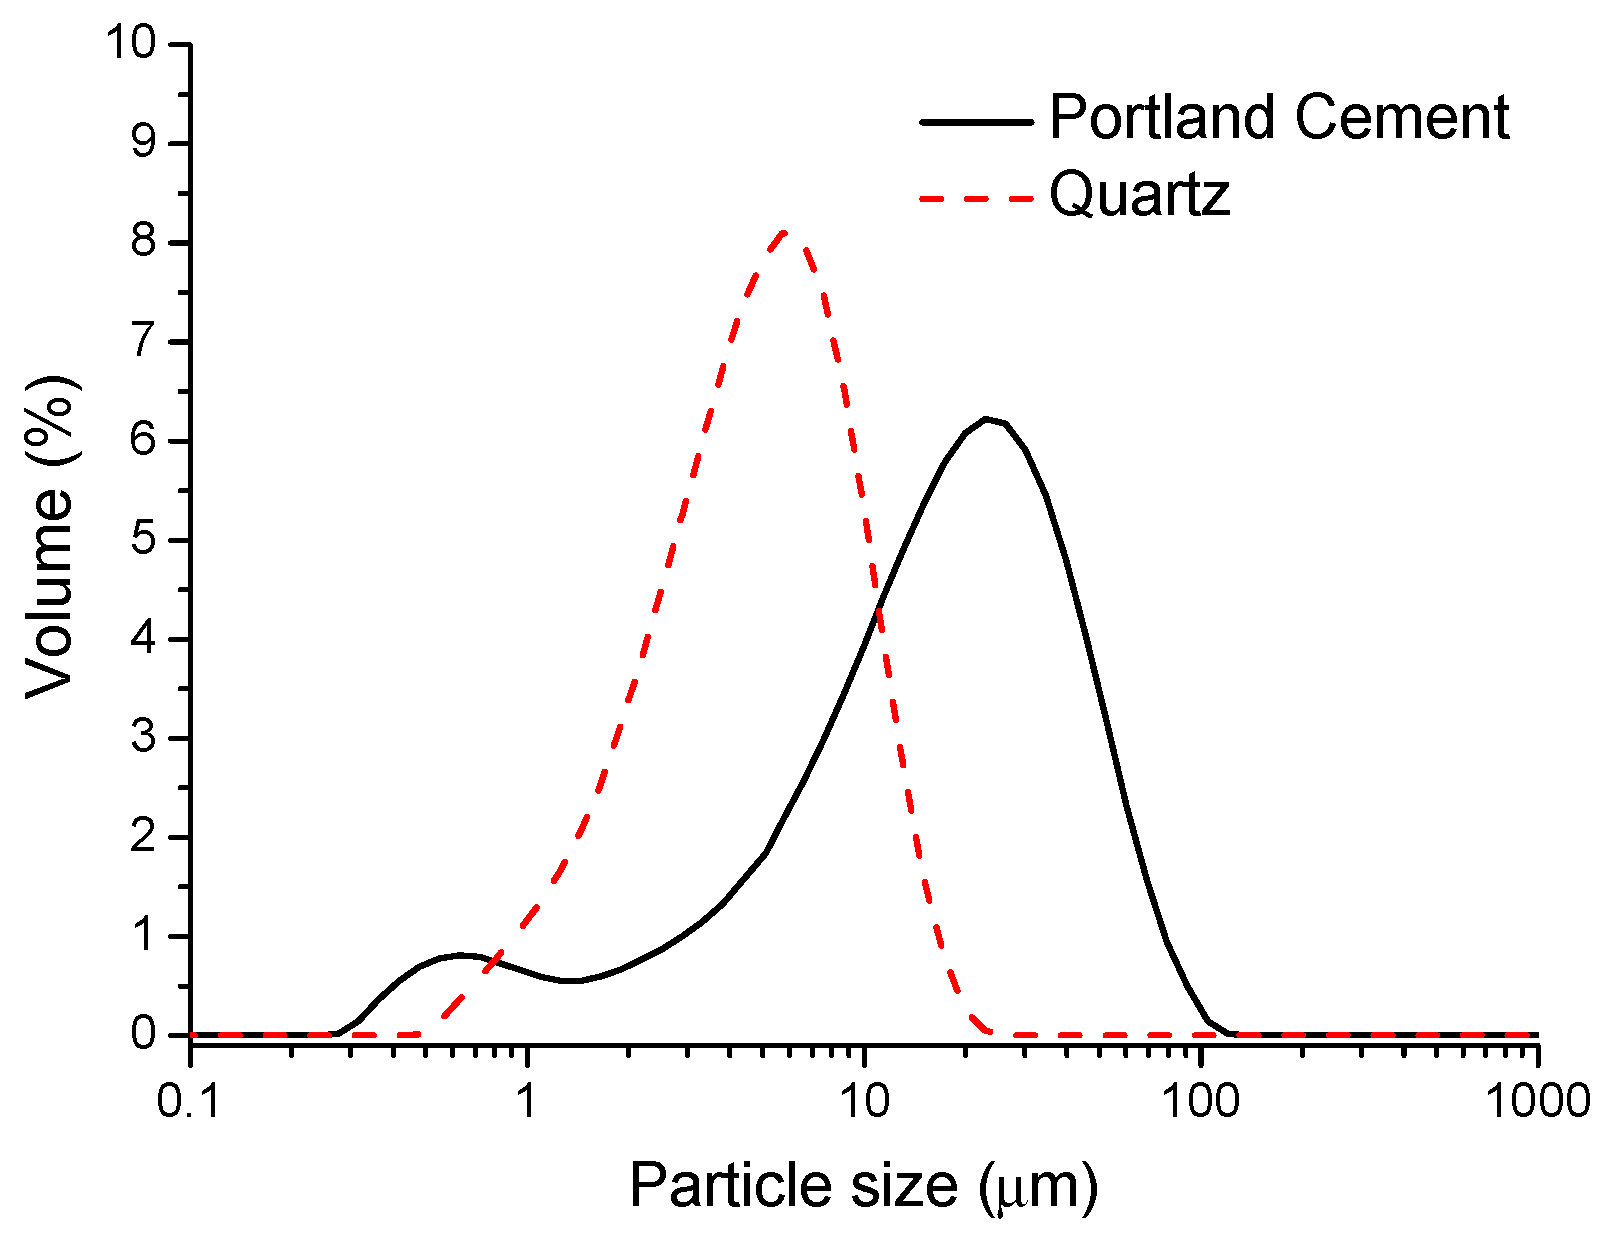
Table 1 shows the chemical constituents of Type I ordinary Portland cement (OPC) and quartz powder from XRF, which were provided by the SsangYong Company and the SAC Corporation of the Republic of Korea, respectively. The powder is irregular, with sharp clear edges of quartz particles, which can be observed through SEM (Figure 1). The particle size of OPC and quartz powder on average was 18.73 μm and 4.56 μm, respectively, as obtained from the particle size distribution (PSD) analysis (Figure 2).
2.2. Mixture Proportions
The mix proportions of various binder pastes are listed in Table 2. Six paste mixtures were investigated and labeled as 02-00, 02-10, 02-20, 05-00, 05-10, and 05-20. Quartz powder was used as the partial replacement of cement at the levels of 10% and 20% by weight and compared with the performance of Portland cement alone, when used in binder pastes. A polycarboxylate-based high-range water-reducing admixture (HRWRA) at a dosage of 1% of the binder by weight was added to the binder pastes prepared with a low w/b ratio of 0.2 to increase their workability. HRWRA was not required for the binder pastes prepared with a high w/b ratio of 0.5.
2.3. Test Methods
2.3.1. Compressive Strength Testing
With the purpose of studying the effect of quartz powder on the compressive strength development of pastes, the paste mixtures were separately mixed in a mechanical mixer and cast in a 50 × 50 × 50 mm metal cube mold, then covered with plastic wrap. After one day, the mold was removed, the paste samples were sealed with plastic wrap, and then finally placed in a 20 °C chamber for 1, 3, 7, and 28 days until the specimens were tested. The strength results were obtained based on the average results of the individual tests on the three paste samples.
2.3.2. Mercury Intrusion Porosimetry (MIP)
In this study, the Autopore IV Series Automatic Mercury Porosimeter was used; it contains a low-pressure system and two high-pressure systems, and its maximum pressure can reach up to 414 MPa. Since the dryness degree of the samples will significantly affect the time required for vacuuming, it is necessary to ensure that the paste samples are dry before the experiments. The paste samples were soaked in acetone for several days and placed in a vacuum oven for seven days. During the experiment, the paste samples were placed in a dilatometer (sample container), and then the dilatometer was loaded into the mercury porosimeter for testing. The test was performed at both low pressure and high pressure
2.3.3. Scanning Electron Microscopy (SEM)
The SEM test was conducted for the flaky paste samples using a high-resolution field emission SEM (S-4300/HITACHI). The surface of the paste samples was coated with metal platinum by E-1010/HITACHI
2.3.4. Isothermal Calorimetry
Through an isothermal calorimeter (TAM Air), the heat evolution rate and the cumulative hydration heat of the binders were measured at 20 °C within 72 h. The binder paste mixtures were prepared through external mixing. The mixing speed of the mixer used for internal mixing is too slow, which can result in uneven mixing, resulting in inaccurate experimental results. Scrivener et al. [17] indicated that the use of external mixing is a preferable choice if initial heat evolution processes are not of interest. Therefore, all paste samples were mixed externally. With the purpose of avoiding the temperature differences between the paste and the calorimeter’s internal environment, the binder and water were kept at temperatures close to 20 °C prior to mixing. After mixing by a mechanical mixer, 5 g of evenly selected paste was added into the vial and placed into the calorimeter quickly.
2.3.5. X-ray Powder Diffraction (XRD)
X-ray powder diffraction was used to analyze the specimens at the curing ages of 1 and 28 days for the determination of the crystalline phases.
The pastes were milled with an appropriate amount of anhydrous acetone in an agate mortar, and then placed in a vacuum drying oven for 2 h to allow the acetone to evaporate. The analysis was performed based on a PANalytical X’pert-pro MPD diffractometer with CuKα radiation (λ = 1.5406 Å). The electric current was 30 mA and the working voltage was 40 kV. The specimens were scanned from 5° to 80° (2θ) with a 0.013° (2θ) step size and an accumulated time per step of 8.67 s. The data were analyzed by X’pert Highscore plus the PDF2004 database.
2.3.6. Thermogravimetric Analysis (TGA)
The paste samples, after the compressive strength test, were ground into powder, soaked in acetone for one week, and then placed in a vacuum oven to dry before the beginning of the test. The TGA data of the prepared powdered samples were measured using a LABSYS EVO Series. Approximately 10 mg of each powdered sample was placed loosely in an alumina pan. The samples were decomposed at a temperature range from room temperature to 105 °C at a rate of 10 °C/min and kept at 105 °C for 30 min, then heated from 105 °C to 1050 °C at a rate of 10 °C/min. Nitrogen was constantly supplied during the test. An experimentally determined baseline was used to correct the results.
3. Results and Discussion
3.1. Compressive Strength
Figure 3 and Figure 4 show the development of compressive strength for up to 28 days of the specimens with w/b ratios of 0.5 and 0.2, respectively. For the binder paste mixtures with a w/b ratio of 0.5 at the age of one day, the strength slightly decreased with the increased amount of quartz powder. However, as the age increases, the downward trend becomes more and more obvious. At the age of 28 days, the compressive strength of 05-10 and 05-20 binder paste mixes was 12.2 MPa and 19.0 MPa lower than that of the control mixture, respectively. After the addition of quartz powder with a smaller particle size than the cement particles, the bleeding phenomenon of the paste was reduced; therefore, an improvement in the early strength of binder paste was expected. At the same time, because of the heterogeneous nucleation effect after the addition of quartz, the hydration of cement is accelerated [10,18]. However, because the cement content is significantly reduced with the use of quartz powder, the strength also decreases when a higher amount of quartz is included in the paste mixture.
At the age of one day, the compressive strength of the binder paste mixtures including quartz powder decreased significantly for the w/b of 0.2, as compared to the control mix. This is because of the increase in the amount of HRWRA added relative to the cement component, which delayed the hydration of cement. However, at the ages of 3, 7, and 28 days, the strengths of 02-00, 02-10, and 02-20 mixtures were almost the same, and the 28-day compressive strength of 02-10 and 02-20 binder pastes only decreased by 1.3 MPa and 3.0 MPa, respectively, as compared to the control paste. This shows a similar trend to that of Kadri et al. [9]. This is possibly because the hydration of Portland cement cannot be fully performed due to a lack of space at a low w/c ratio, and the addition of quartz powder can improve the effective w/c ratio and increase the degree of hydration. Overall, the addition of quartz powder contributes to promote the hydration of cement in the binder pastes prepared with a low w/b and has little influence on the strength of paste.
3.2. Pore Structure
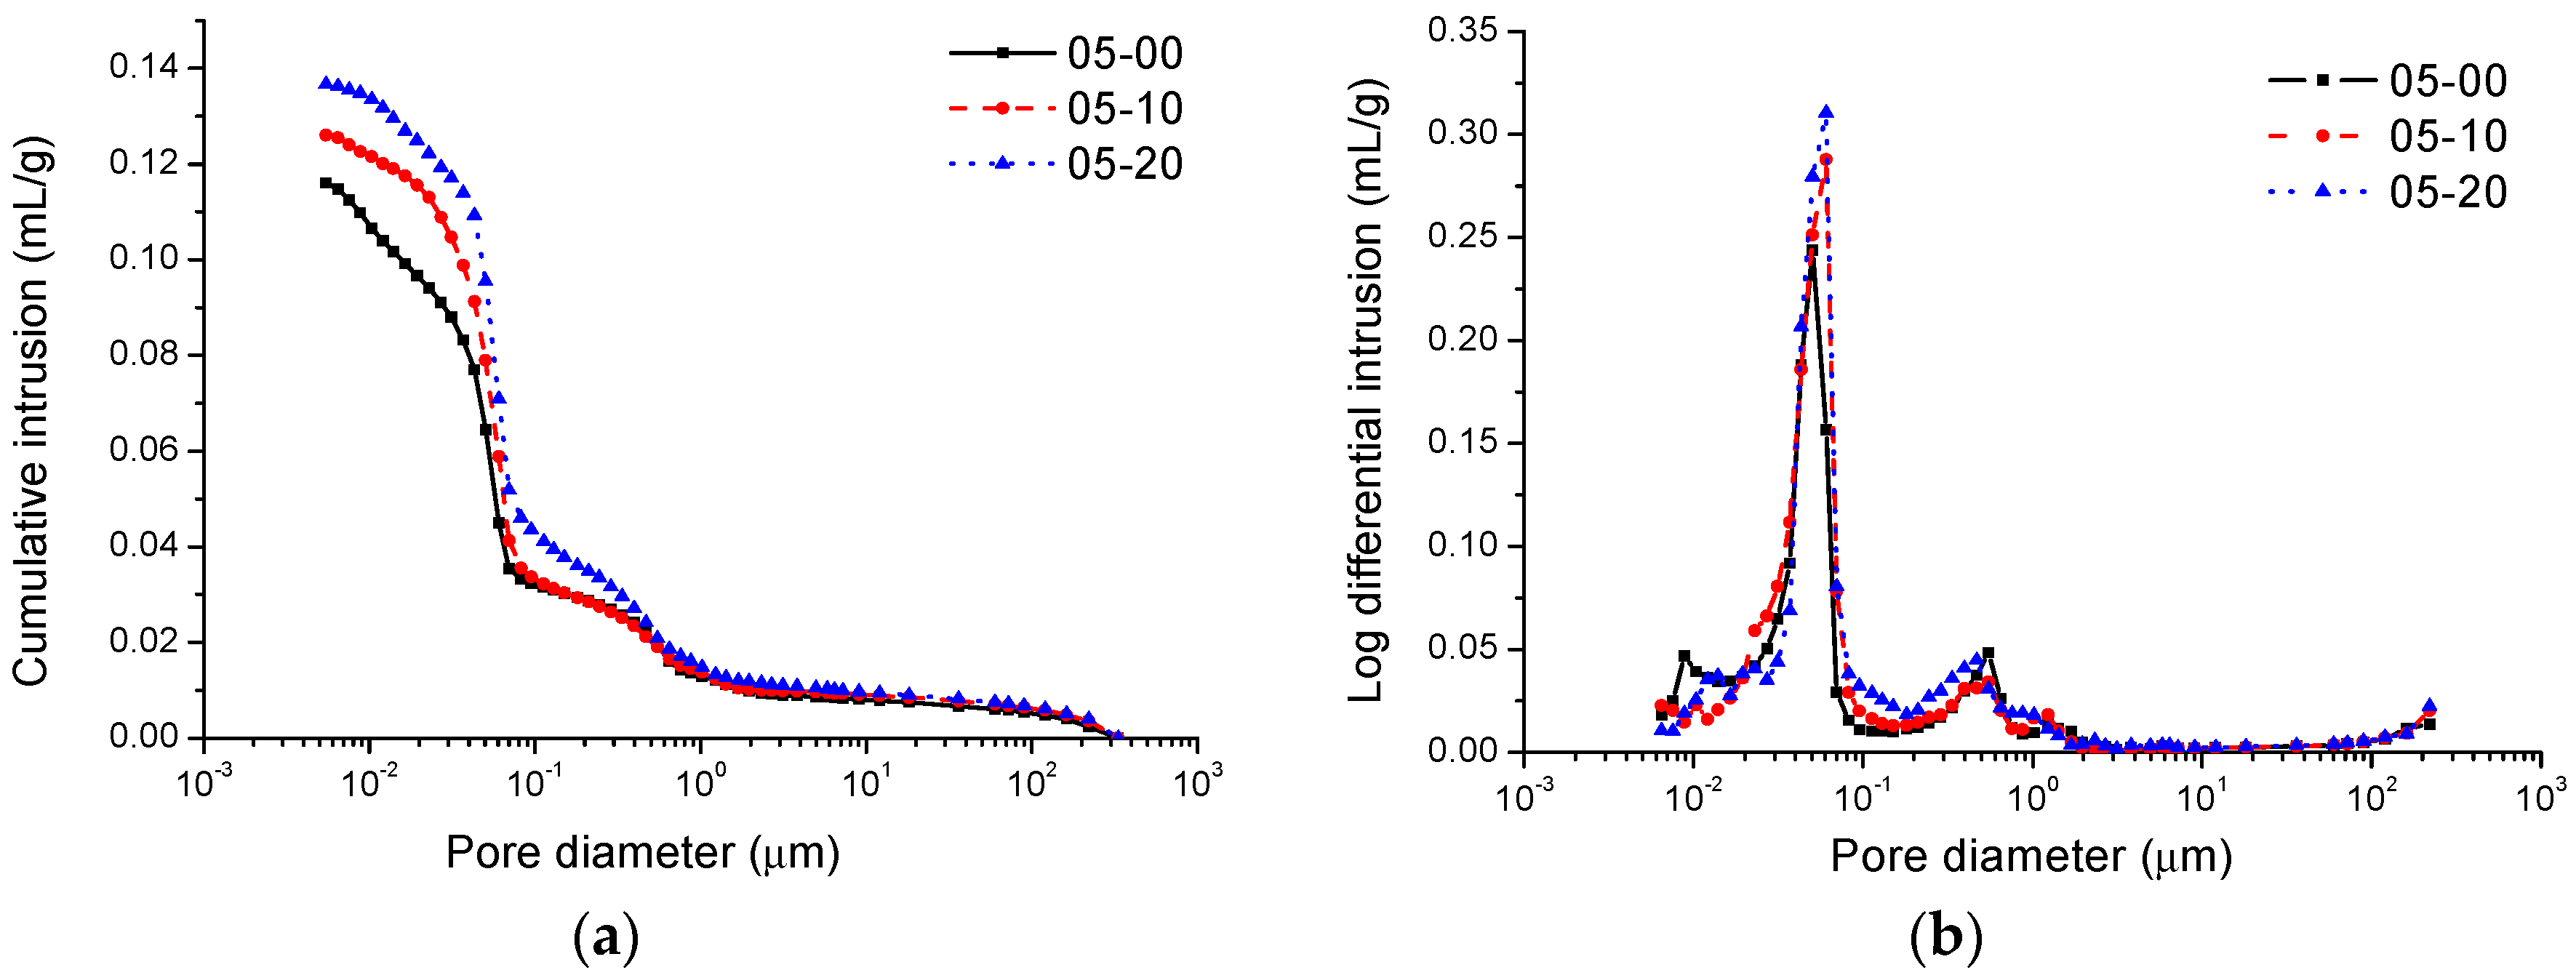
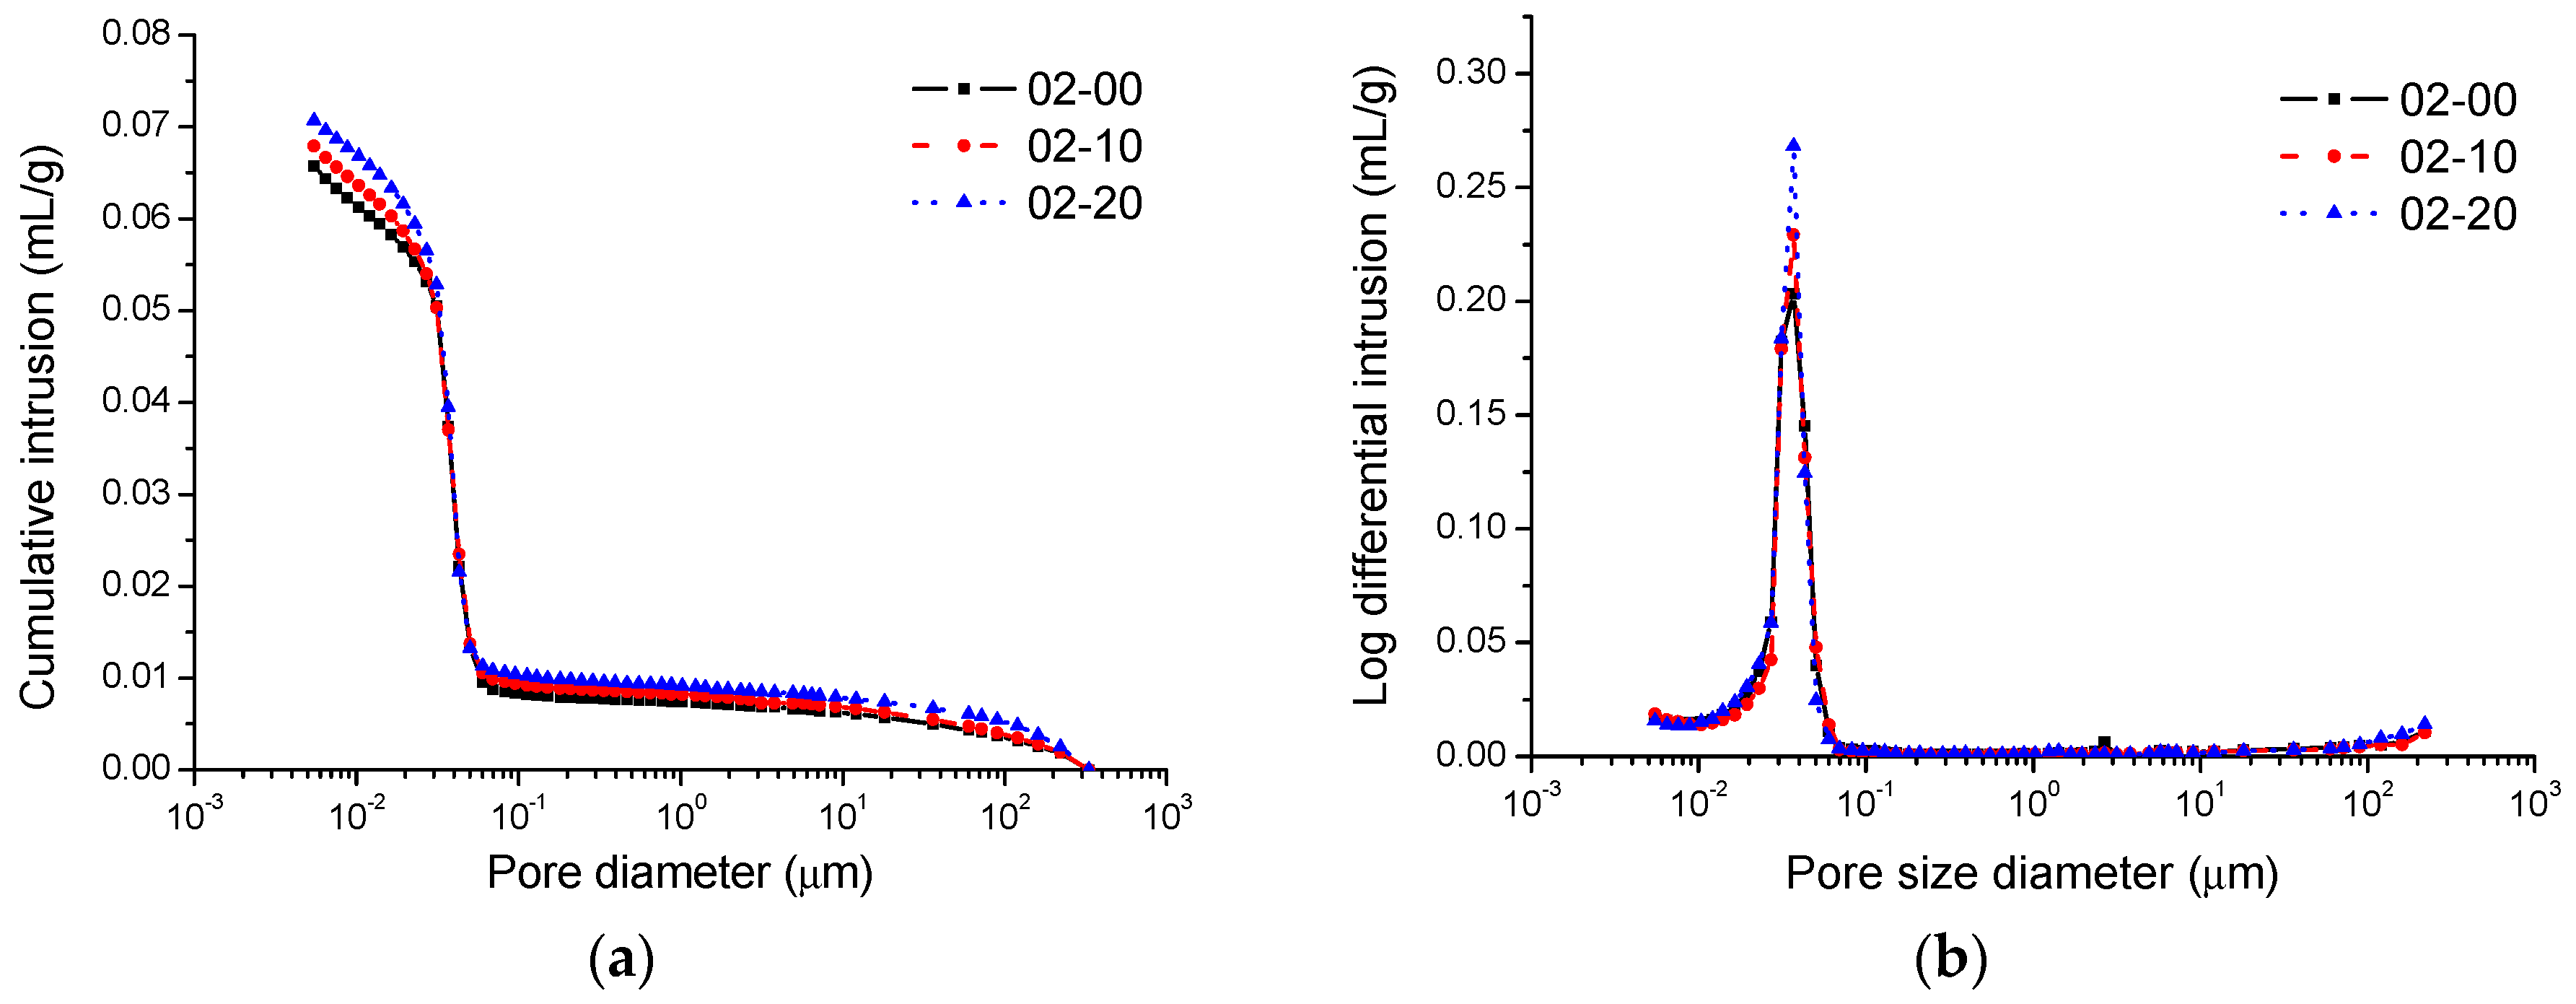
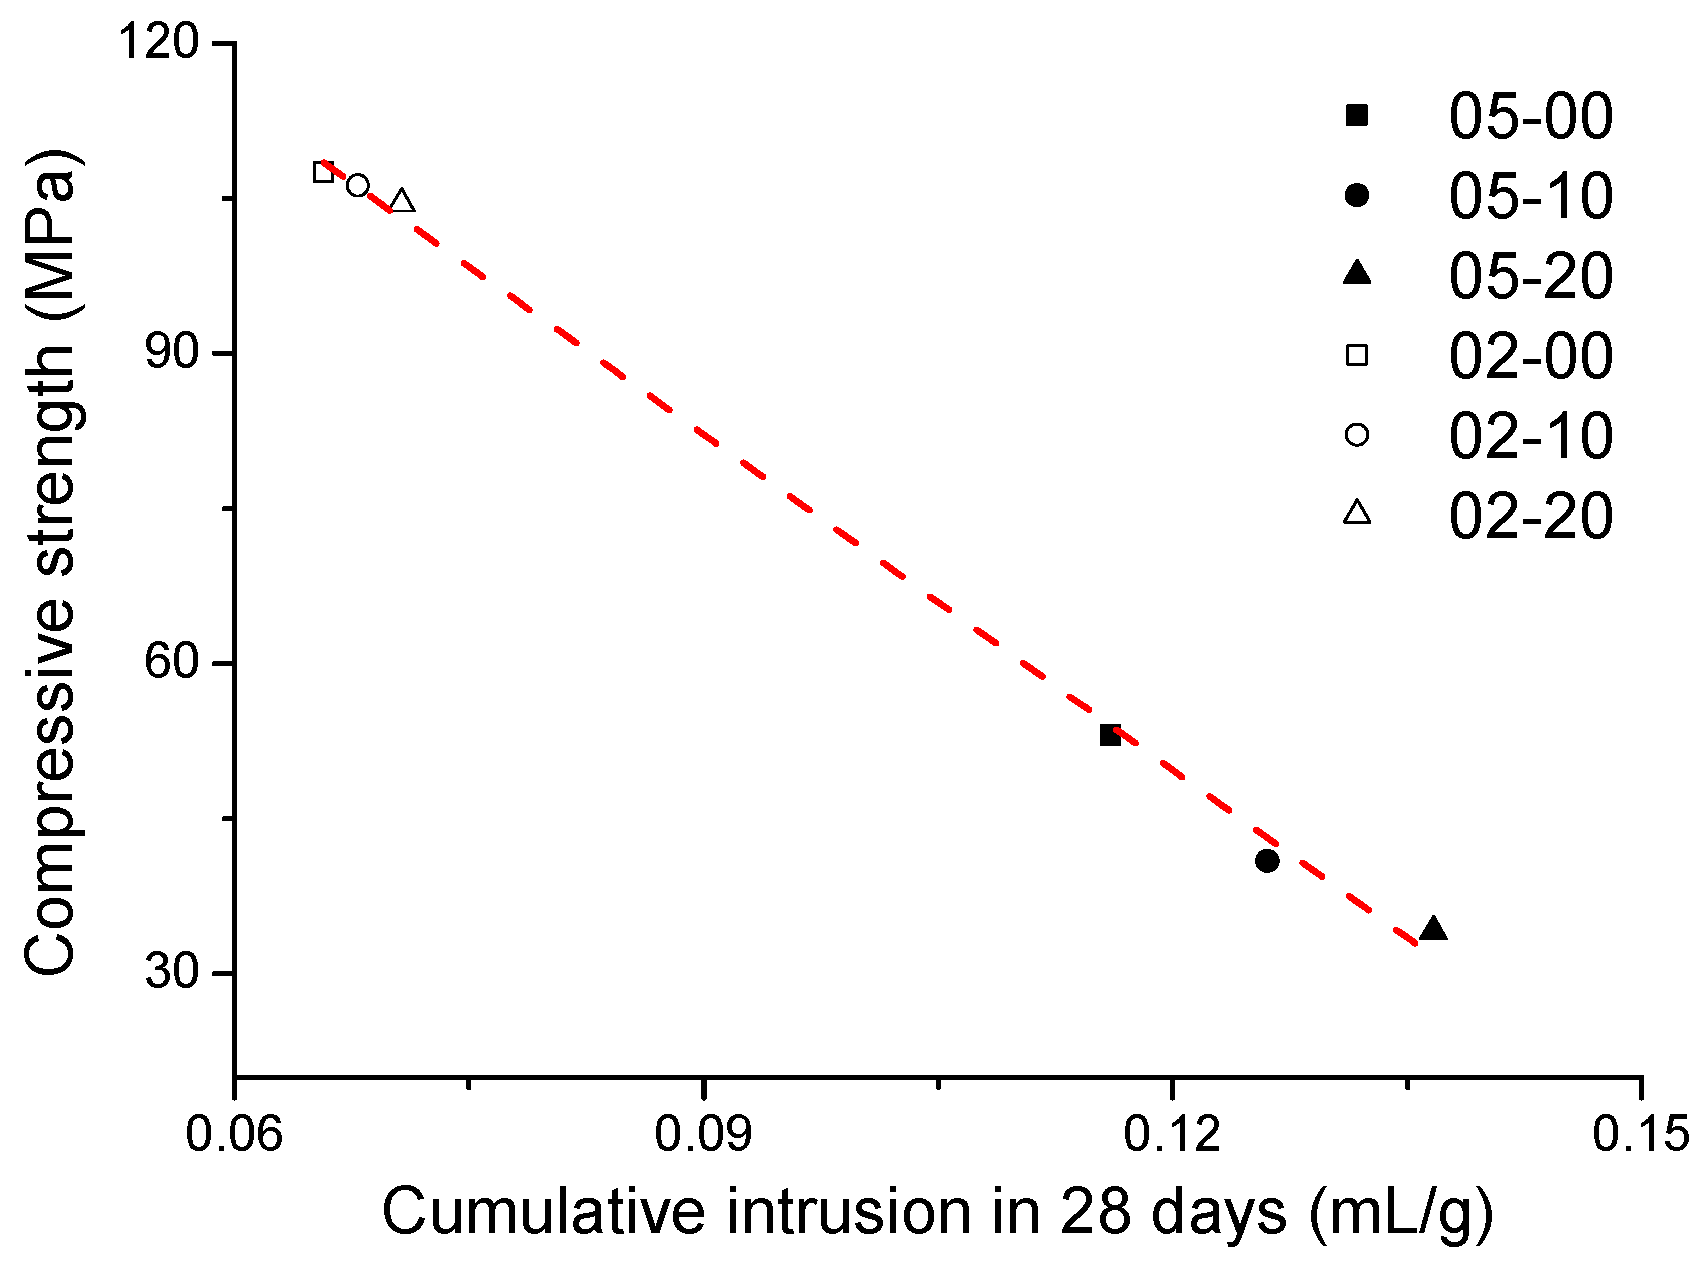
Figure 5 and Figure 6 show the pore size distribution in the 28-day old pastes prepared with a w/b of 0.5 and 0.2, respectively. It can be seen from the results that after the quartz powder is incorporated into the cement paste at a w/b ratio of 0.5, the capillary pores increase. They increase with the increase of the amount of quartz powder added. Because the quartz powder is a chemically inert material, it could not produce hydration products to fill the space originally filled by the cement hydration product, thus resulting in a higher porosity. The results were almost identical for the three mixes at the w/b of 0.2, and the 02-10 and 02-20 binder pastes had only slightly more capillary pores than the corresponding control paste. Because of the relatively small distance between the particles themselves, the addition of quartz powder had no significant effect on the pore size of the cementitious materials with a low w/b ratio. As shown in Figure 7, it can be seen that the accumulative intrusion pores are related to the compressive strength; that is, the compressive strength decreases as the accumulative intrusion pores increase [19].
3.3. Paste Microstructure
Figure 8 shows the scanning electron microscope images of all pastes after curing for 28 days. In the case of the binder pastes prepared with a w/b ratio of 0.5, it can be seen that as the quartz powder is added, the amount of pores increases. In particular, in Figure 8c, it can be clearly seen that the cement hydration product covers the surface of the quartz powder particles. This observation is also consistent with the heterogeneous crystal nucleation theory. In the paste samples with a w/b ratio of 0.2, a dense C-S-H product can be seen. With the addition of quartz powder, it seems that there is no effect on the microstructure of the cement paste, and the pores of the cement pastes are not significantly increased. This is consistent with the experimental results of the MIP.
3.4. Heat of Hydration
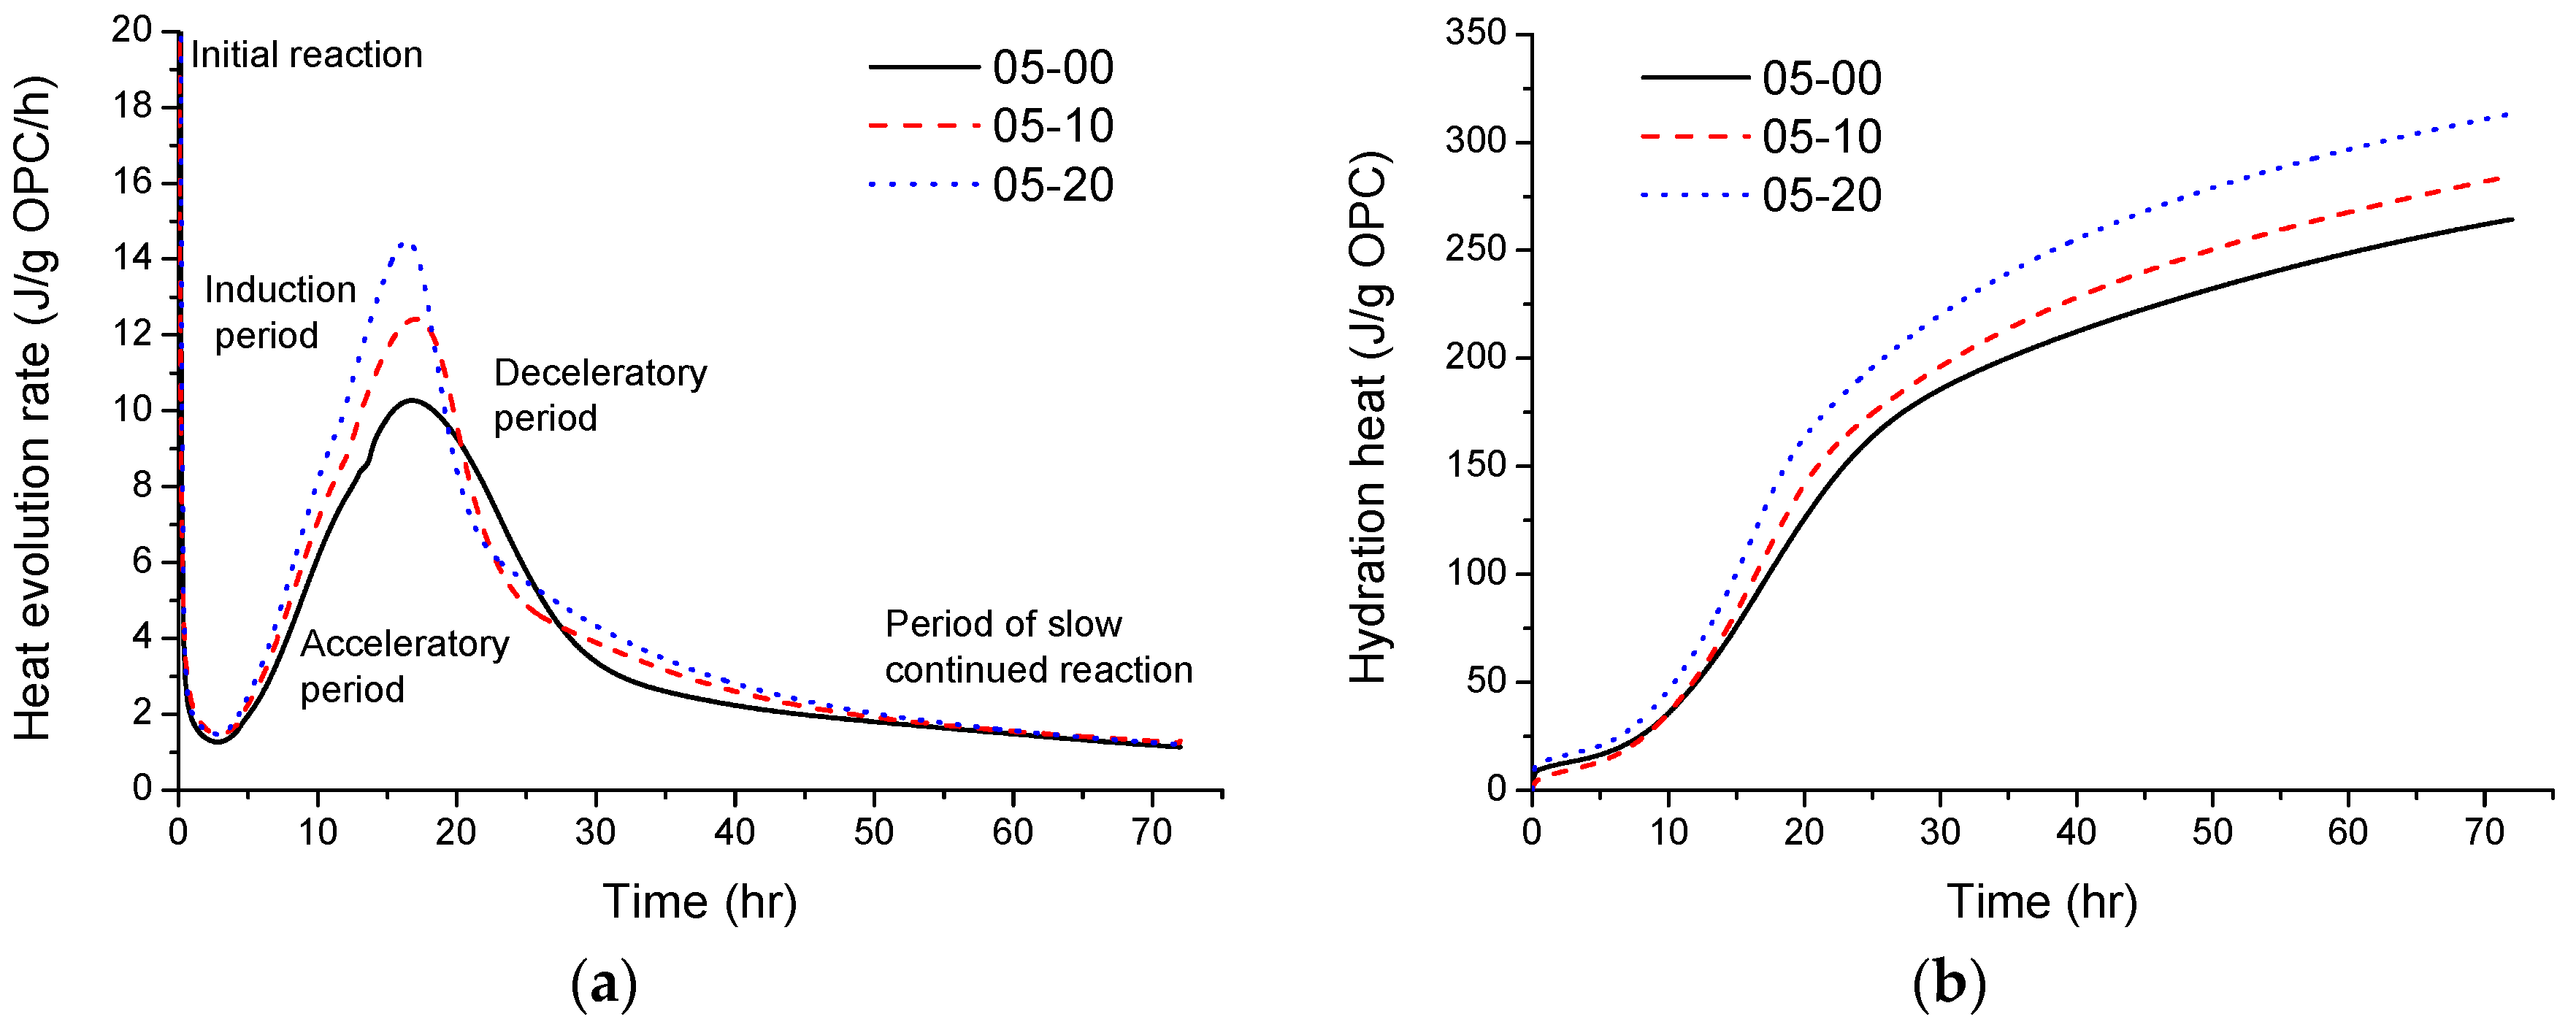
Figure 9 shows the heat of the hydration evolution rate and the cumulative heat of hydration of the pastes with different contents of quartz powder at the w/b ratio of 0.5. The results are normalized per gram of OPC. According to Taylor [20], the cement hydration reaction is divided into five periods in the literature: namely the initial reaction period, induction period, acceleration period, deceleration period, and slow continued reaction period. It can be clearly seen from the heat of the hydration evolution rate graph in Figure 9a that the reaction was accelerated by the quartz powder at the acceleration period and formed a second exothermic peak with a high and narrow shape. As shown in Figure 10, the slope of the acceleration period was calculated from the lowest point of the induction period to the highest point of the second exothermic peak in Figure 9a. It was found that the slope of the acceleration period was positively related to the substitution rate of quartz powder. Moreover, after adding quartz powder, the overall cement hydration reaction was amplified, which may be due to the reaction of the aluminate phase [20], and then the crystals began to crystallize and grew at this time [21].
As shown in Figure 9b, after adding quartz powder, the heat release of the cement obviously increased, and the heat release increased with the increase of the replacement rate. It can be further seen that the hydration of cement is promoted by the quartz powder after curing for three days.
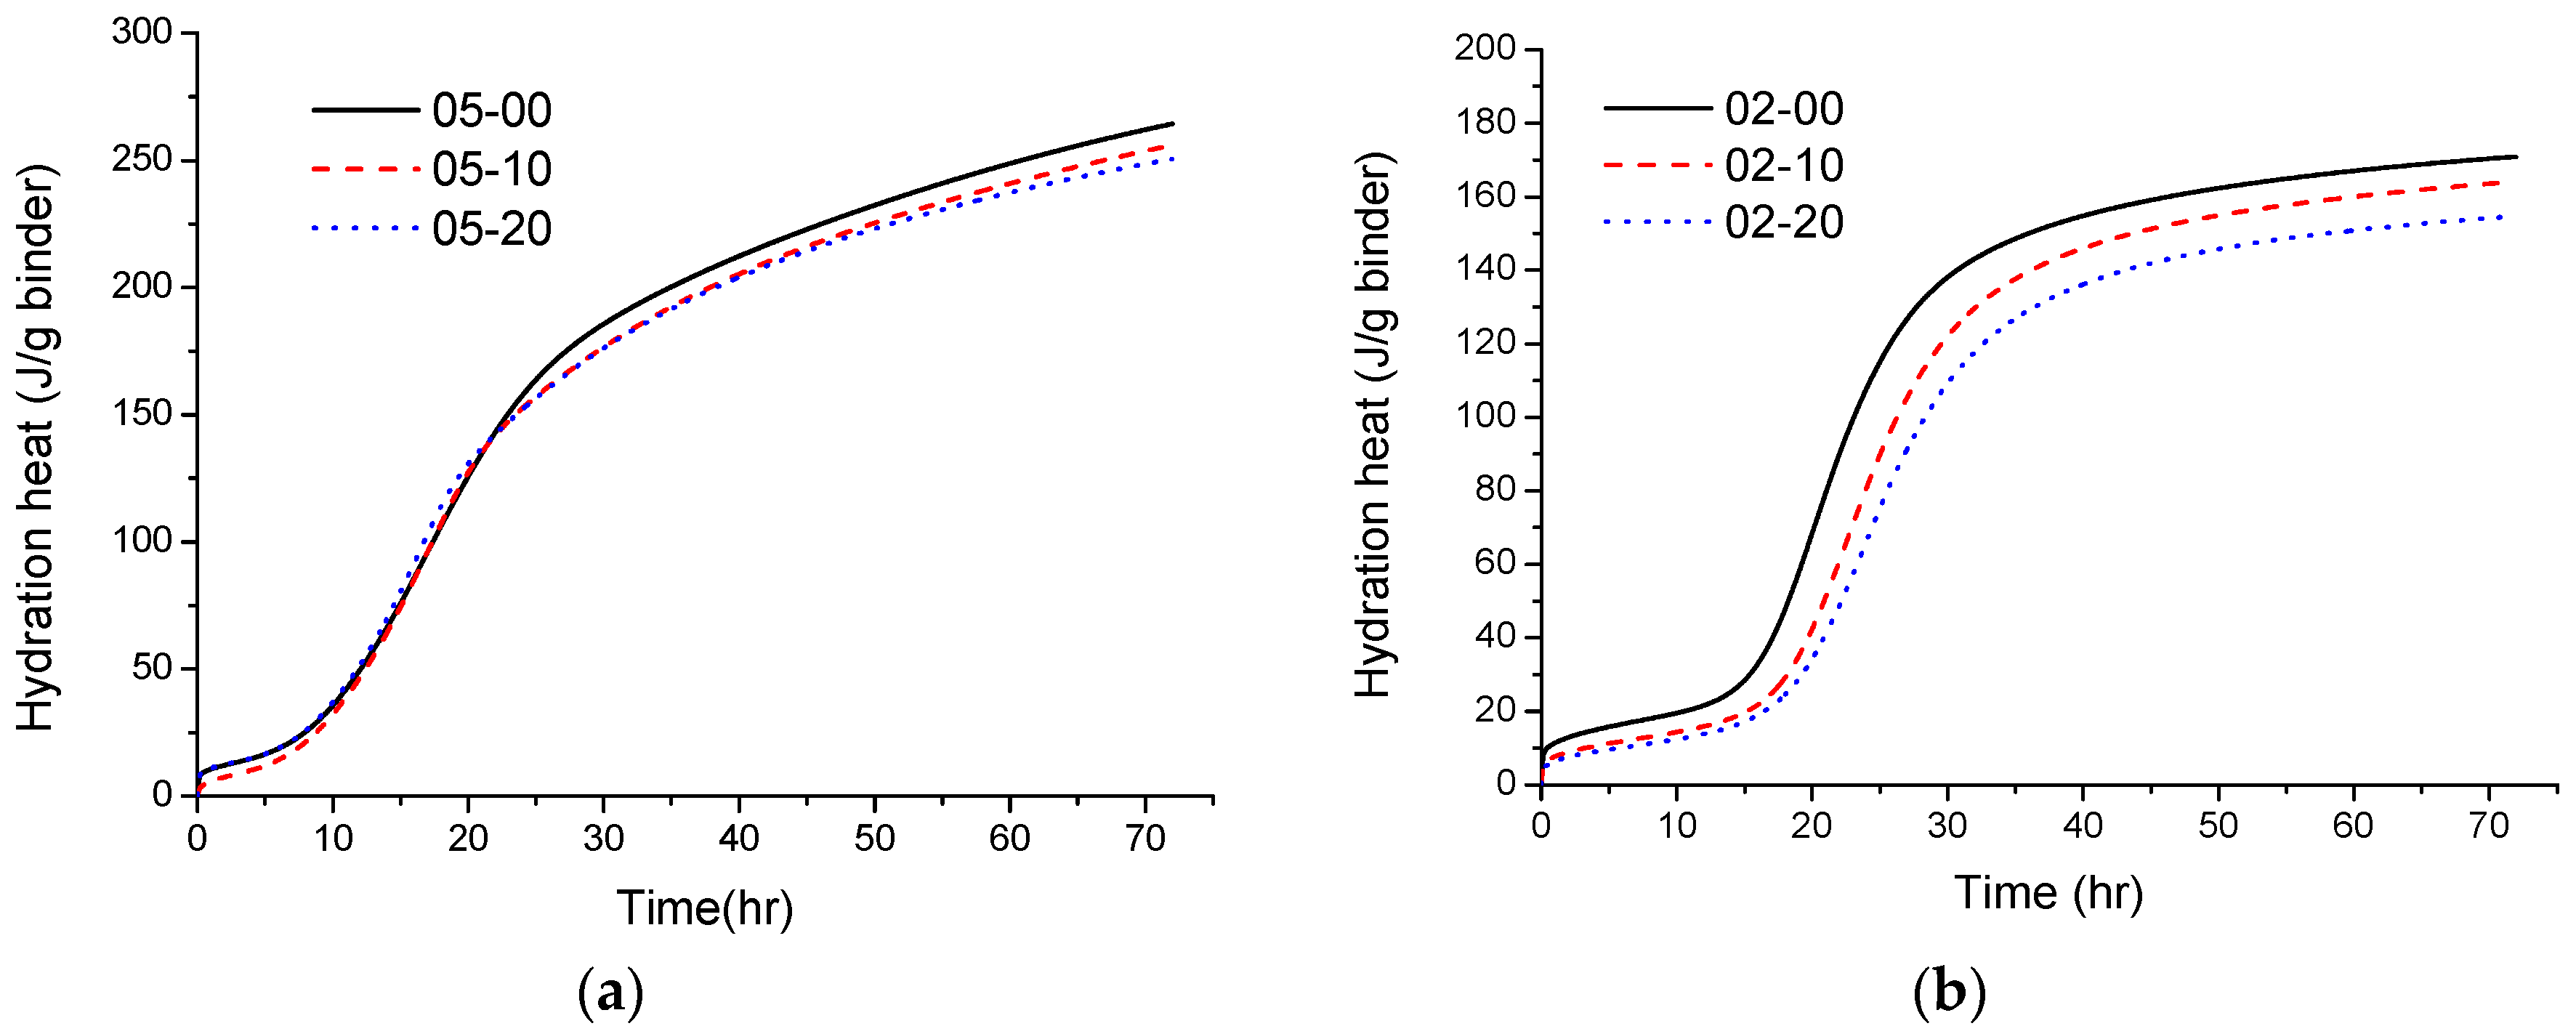
Figure 11 shows the hydration heat evolution rate and the cumulative heat of hydration of the biner pastes at the w/b ratio of 0.2. As shown in Figure 11a, the appearance of the second exothermic peak of both 02-10 and 02-20 was delayed. That is because the additional amount of water-reducing admixture increases with respect to the cement component, and thus delayed the hydration. This reduced the gain in strength during the early age and therefore the strengths of 02-10 and 02-20 mixtures were significantly lower than that of the control mixture 02-00 at the age of one day. Also, the second peak did not rise significantly in comparison with the binder paste mixtures with the w/b ratio of 0.5, as shown in Figure 9. This also shows that, at a low w/b ratio, there is no obvious effect of adding quartz powder on the dilution of cement. However, in Figure 11b, it can be found that the cumulative exotherm of 02-10 and 02-20 paste mixtures is higher than that of the control paste, indicating that, at low w/b ratio pastes, the quartz powder also promotes the early hydration of cement.
Moreover, as shown in Figure 12, the results are normalized per gram of binders. The cumulative heat of hydration of the binders including quartz powder was lower than that of OPC. When the w/b was 0.5 (Figure 12a), the binder paste 05-20 could be compared with the binder paste 05-00, wherein the cumulative hydration heat decreased by 5.24%. However, when the w/b was 0.2 (Figure 12b), the cumulative hydration heat of 02-20 mixture was lower than that of 02-00 mixture and the value was reduced by 9.46%. It is shown here that, in the case of a low w/b, adding quartz powder to the cementitious materials can reduce the exothermic heat of the pastes.
3.5. Thermogravimetric Analysis
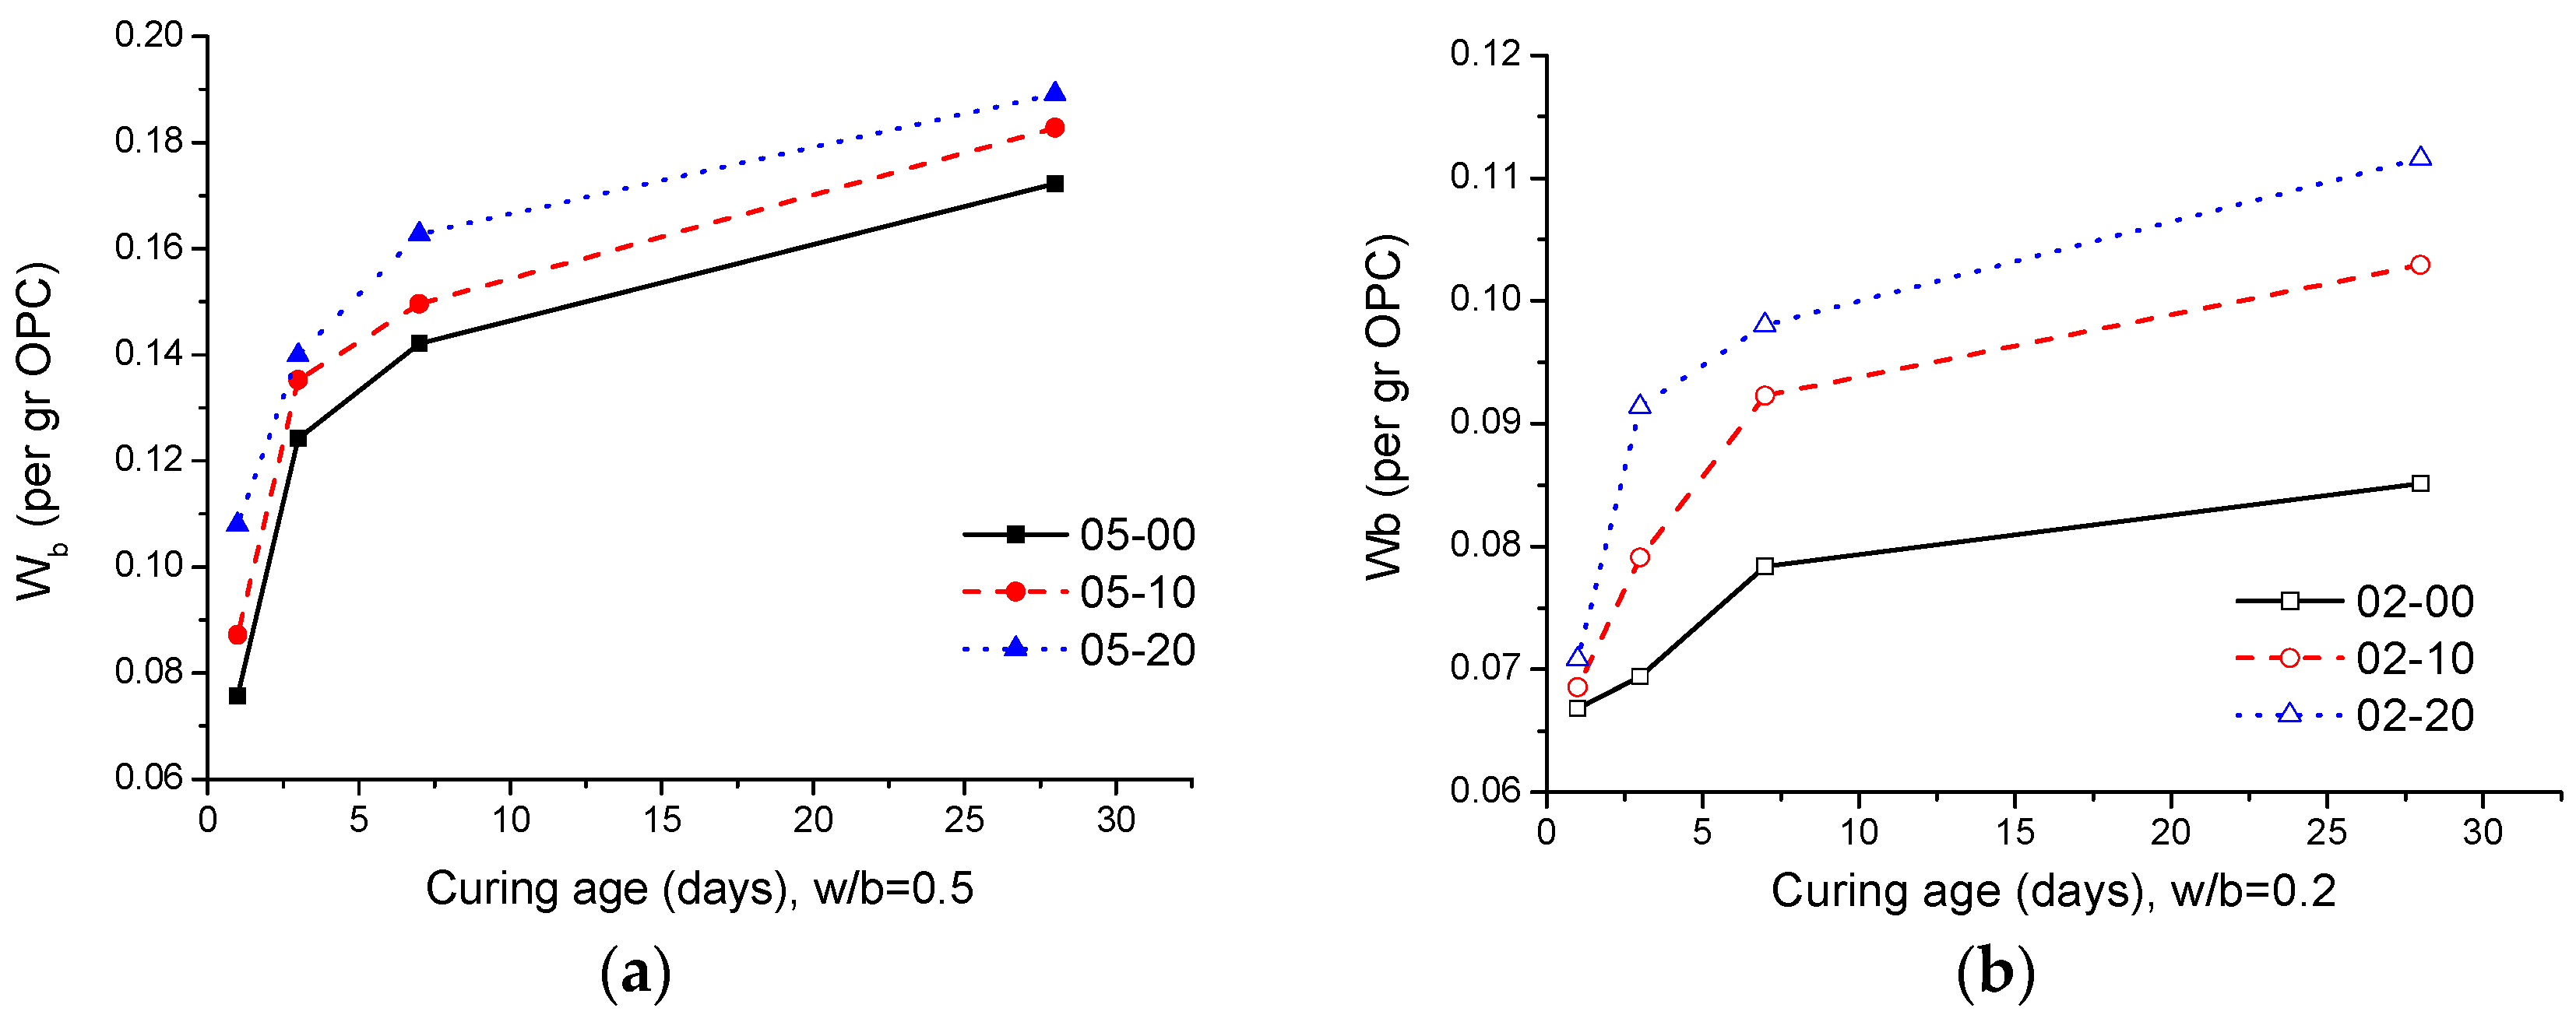
The chemically bound water content (Wb) and calcium hydroxide (CH) content are important parameters for the study of cement hydration. The calculated results obtained by TGA are shown in Figure 13 and Figure 14. It can be seen that the amount of Wb and CH are relatively low in the case of the binder pastes prepared with a low w/b ratio. Similar results were found in the study of Tuan et al. [22]. The possible reason for this is that the cement is not fully hydrated because the w/b ratio is relatively low. It is also evident from the experimental results that in the samples with a w/b ratio of 0.5, if 20 wt% of quartz powder is added, the Wb content and CH content significantly increase at the age of one day (refer to Figure 13a and Figure 14a). For the pastes with a w/b ratio of 0.2, the Wb and CH contents did not increase significantly at the age of one day, but a significant increase was observed after three days. This is because the use of the HRWRA delayed the early hydration. The overall TGA results were consistent with the results of compressive strength test and isothermal calorimetry.
The Wb and CH contents of the binder pastes prepared with the w/b ratio of 0.2 were significantly lower than those of the pastes made with the w/b ratio of 0.5. In low w/b ratio pastes, this is attributable to the insufficient space available to accommodate more hydration products [23]. When the quartz powder replaces part of the cement in the system, the cement concentration is diluted so that more Wb and CH are produced. However, at the curing age of 28 days, for a high w/b ratio, the binder paste 05-20 could be compared with the binder paste 05-00, wherein the Wb and CH contents increased by 9.8% and 8.7%, respectively, whereas at a low w/b ratio, the binder paste 02-20 could be compared to the binder paste 02-00, wherein the Wb and CH contents increased by 31.1% and 29.5%, respectively. Therefore, under the circumstance of low w/b ratio, the cement hydration is promoted by the additional quartz powder more obviously in comparison to the case of high w/b ratio. One of the reasons for this may be that at low water to cement (w/c) ratios, the degree of the change in the w/c ratio has a greater effect on the degree of hydration, as compared with high w/c ratios (the w/c ratio of the 05-20 binder paste is 0.625, and the w/c ratio of the 02-20 binder paste is 0.25).
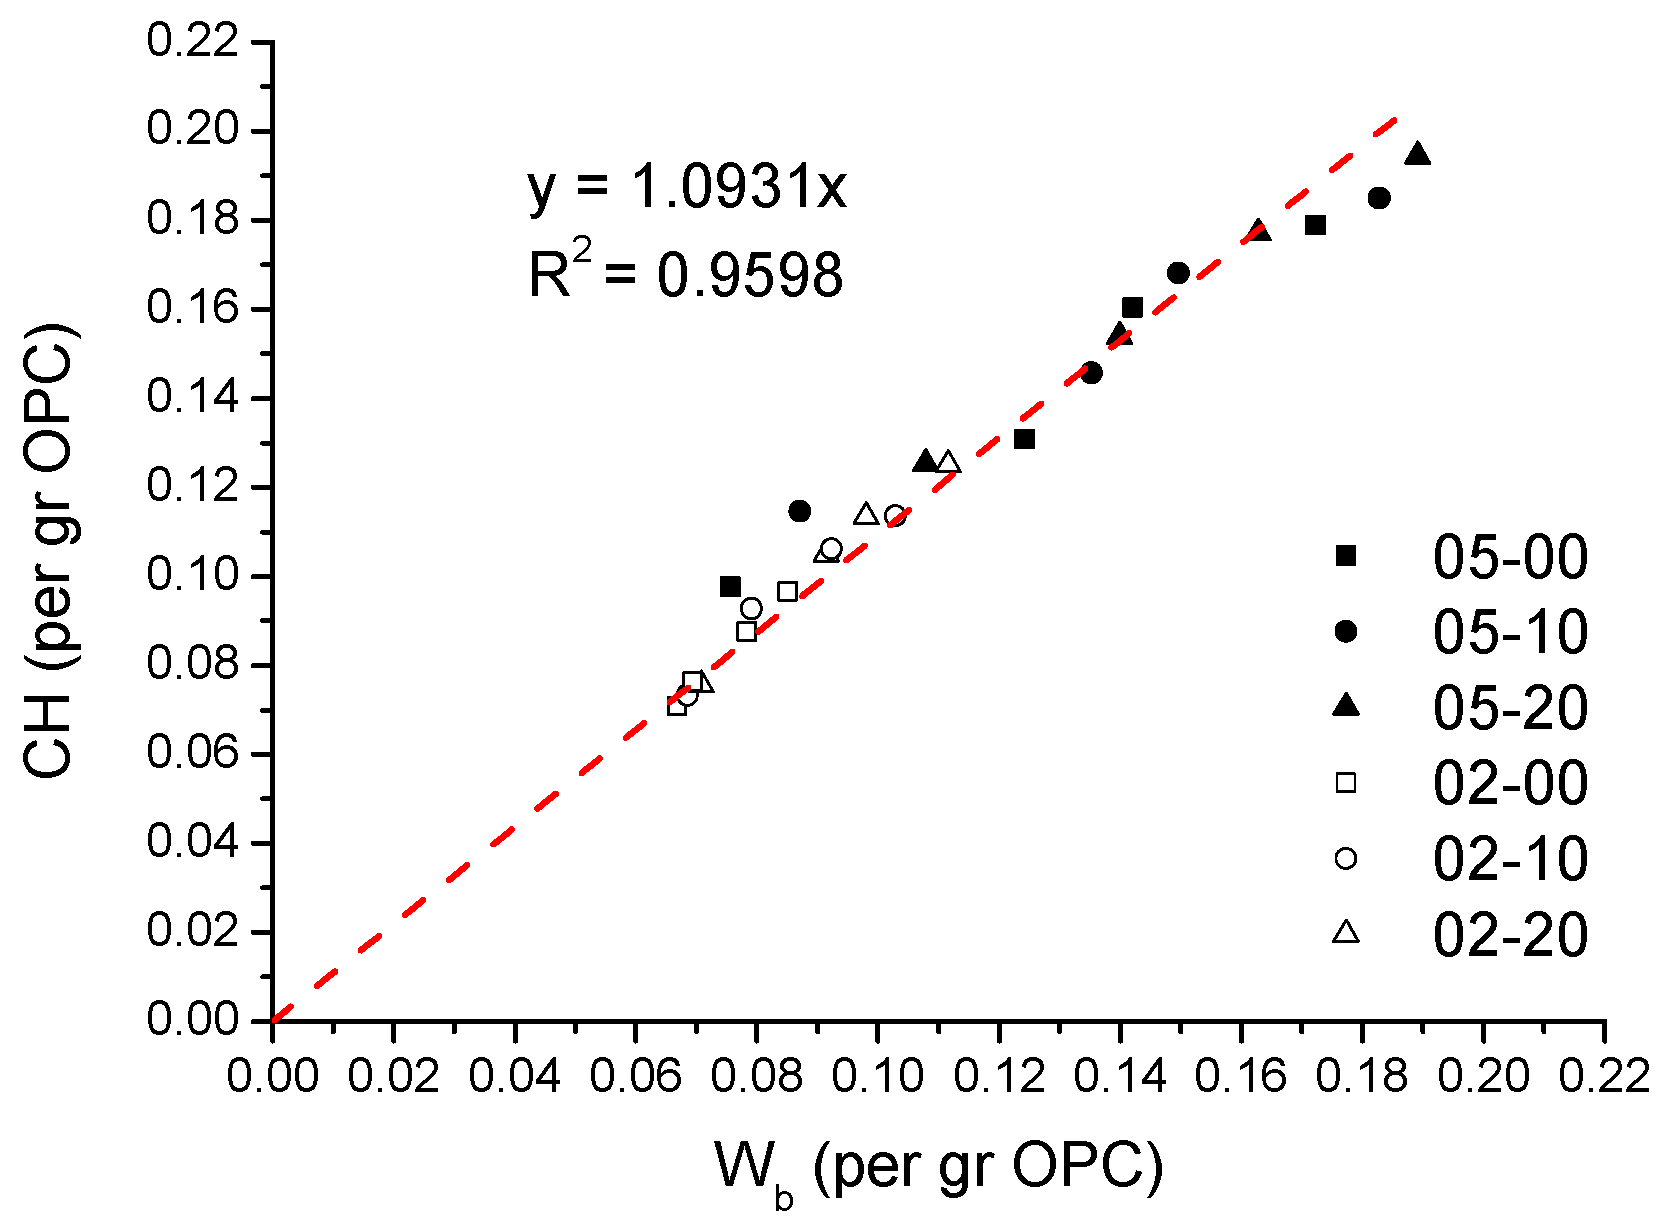
The variations in the CH and Wb contents of all binder paste mixtures are shown in Figure 15. It is obvious from Figure 15 that, regardless of the w/b ratio, CH and Wb are directly proportional. This result is basically the same as that described by Panel and Hansen [24]. In the results of Panel and Hansen, the relationship between chemically bound water and CH content is almost linear, which also passes through the origin, and the slope is about 1 [24]. This slope value is similar to the value obtained in the present study.
3.6. X-ray Powder Diffraction
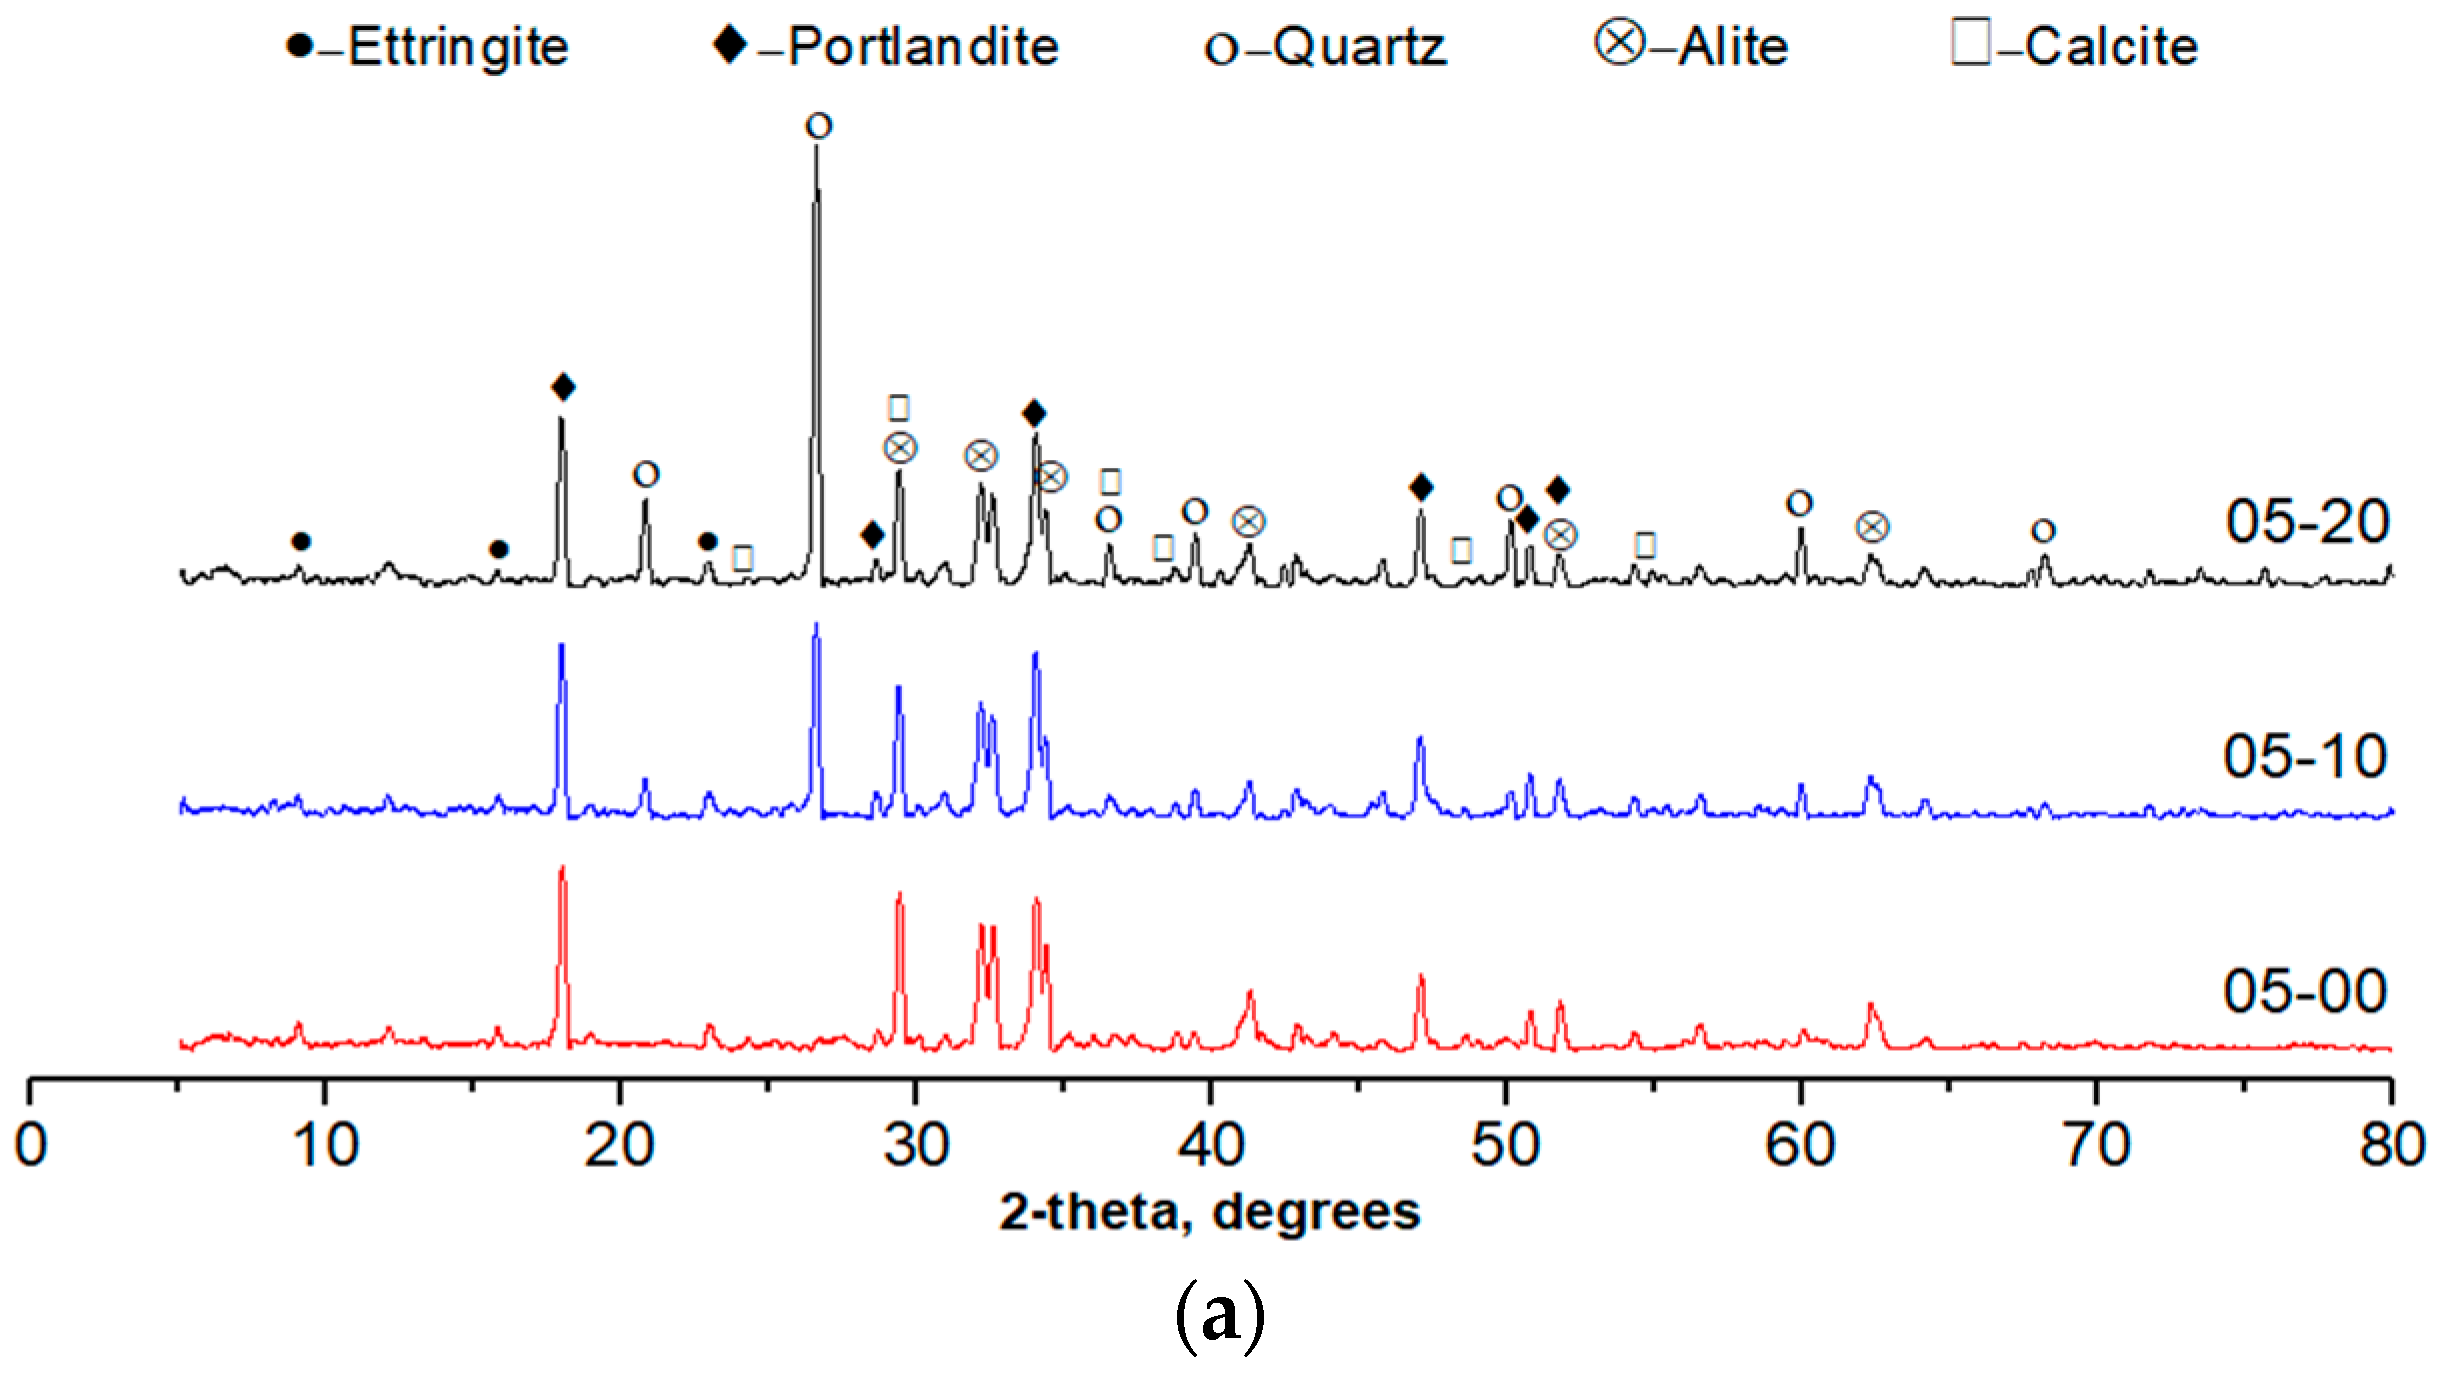
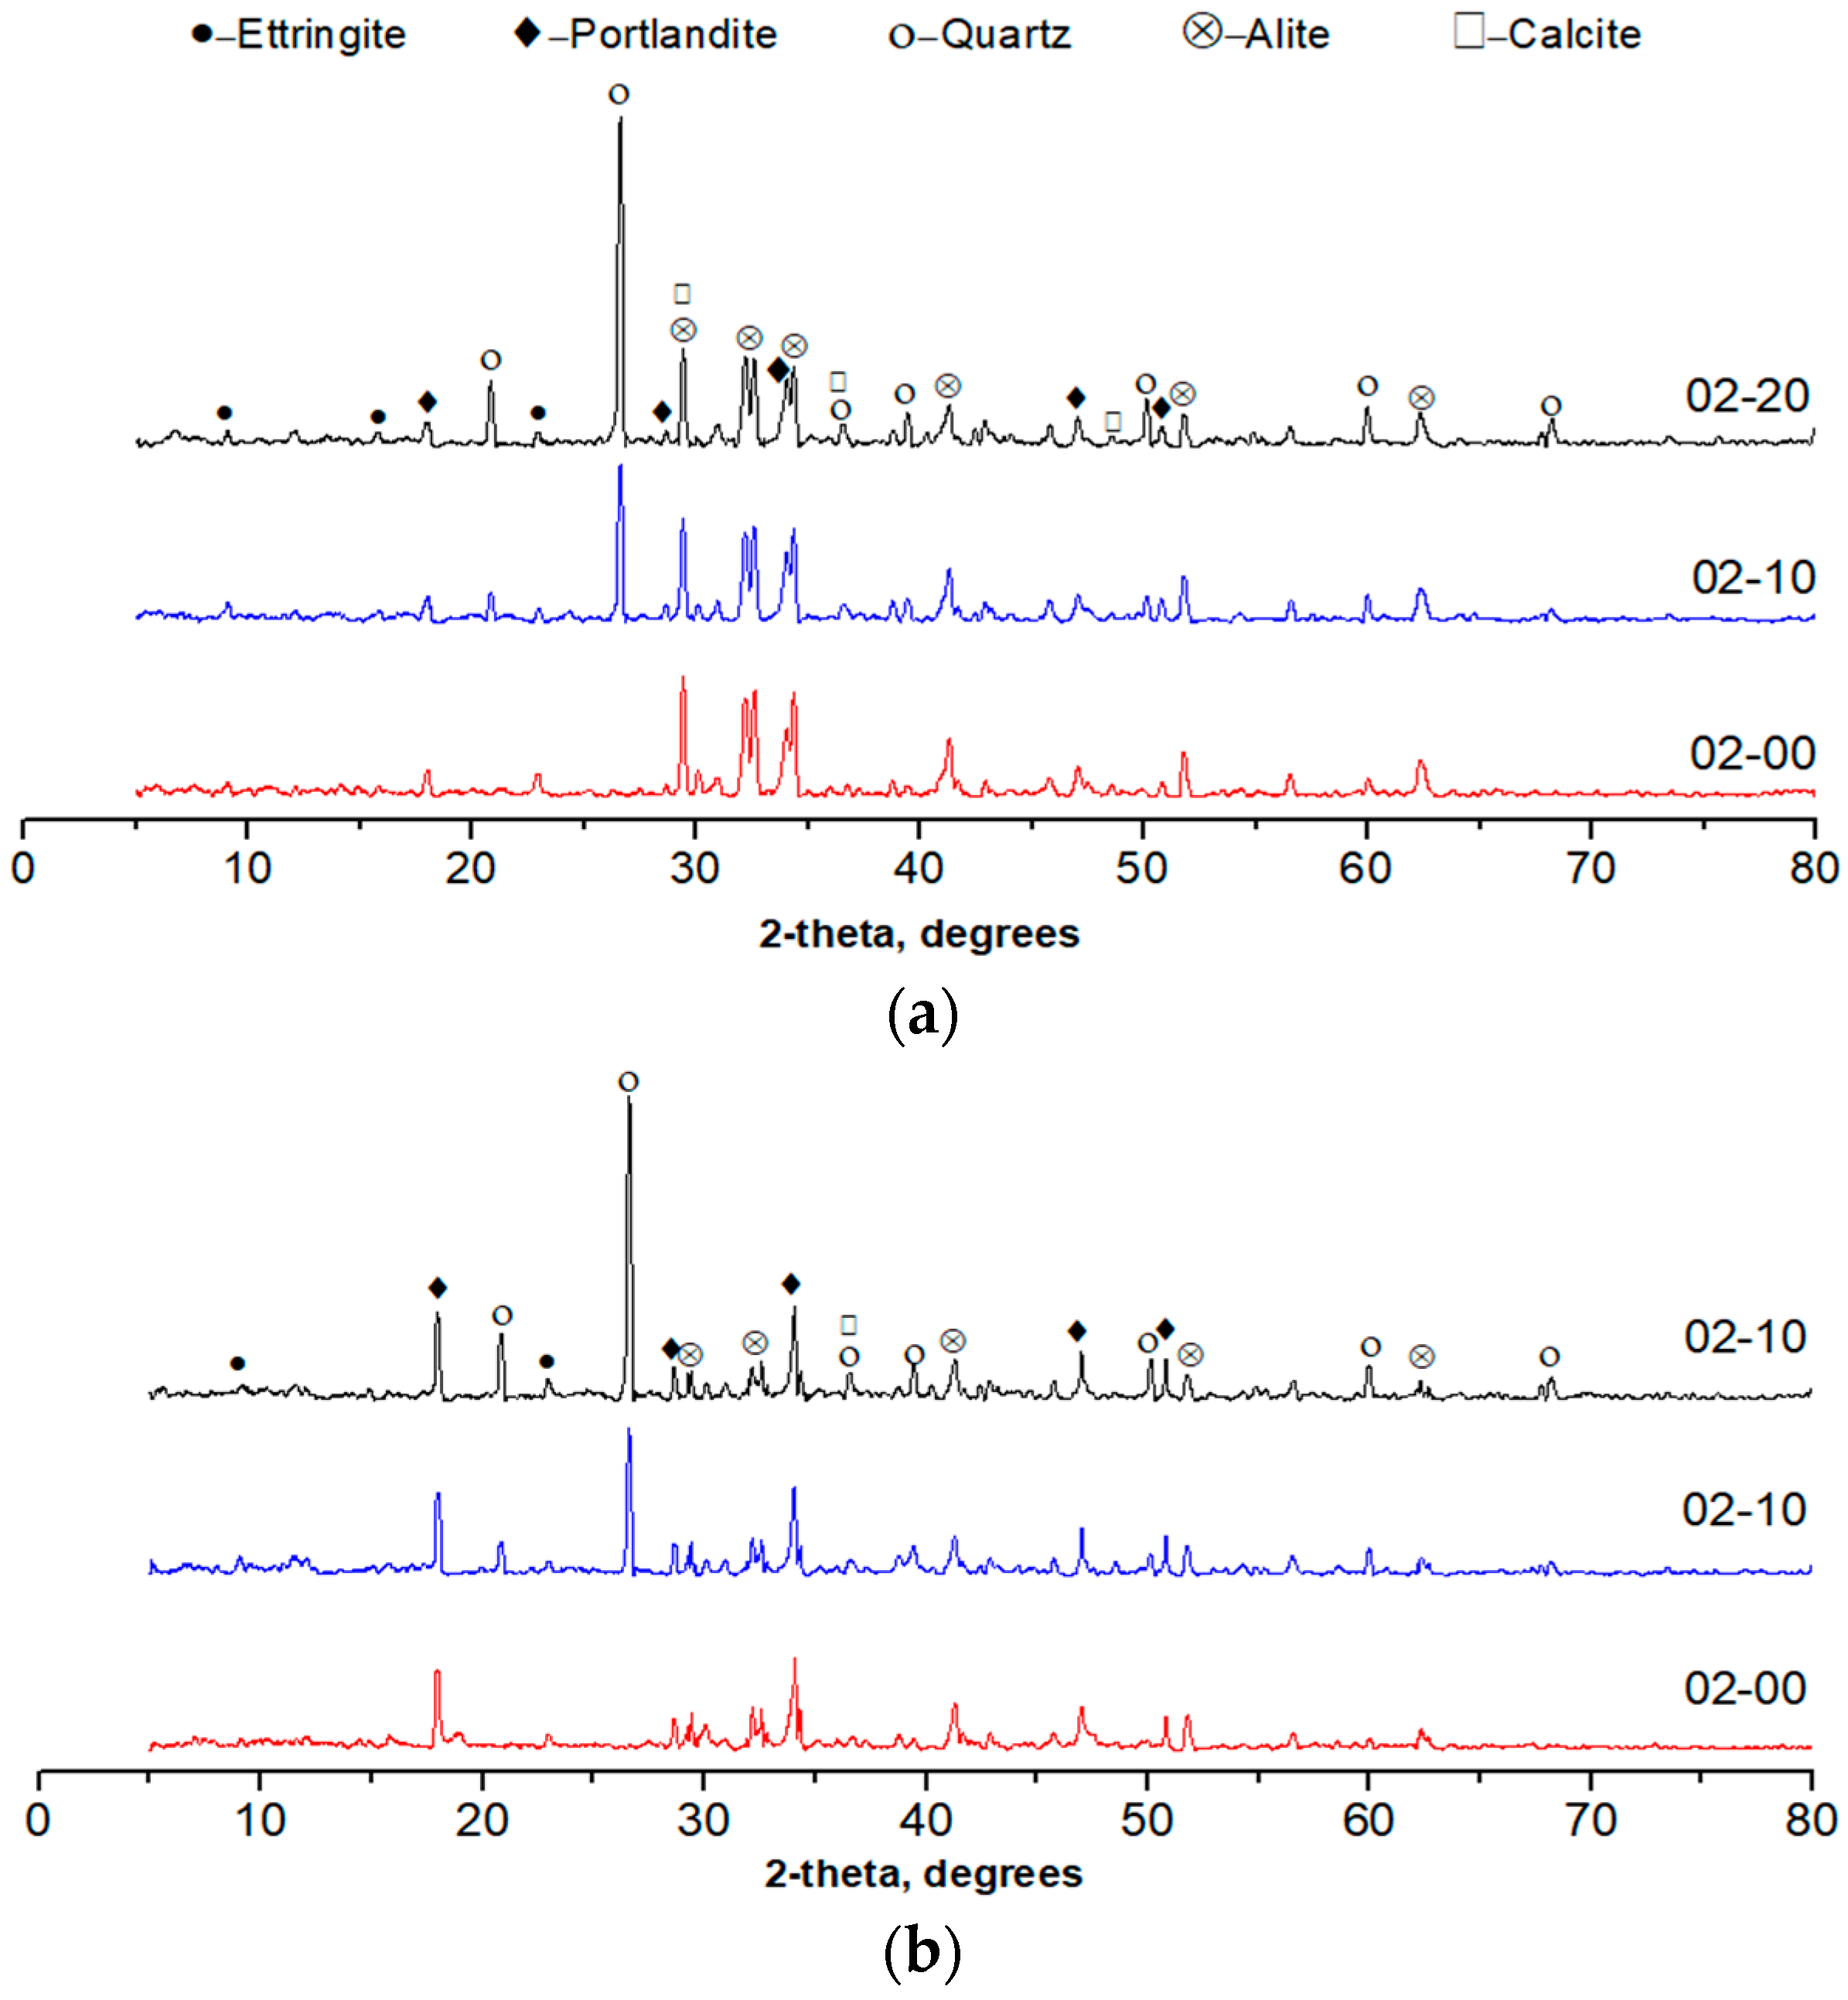
At the ages of 1 and 28 days, the crystal phases of all binder pastes were analyzed by XRD. Figure 16 and Figure 17 show the XRD patterns for the binder paste mixtures prepared with the w/b ratio of 0.5 and 0.2, respectively. It was found that ettringite, portlandite, alite, and calcite were the main crystal phases, which were basically consistent with the results of Rupasinghe et al. [25]. The XRD results indicated the presence of residual calcite in all paste samples. This may be caused by carbonization during the sample preparation. It can also be seen from Figure 16 that, with the hydration of the paste samples, the intensity of the portlandite peak (main peak at 18° 2θ, 34° 2θ, and 47° 2θ) increased significantly. The portlandite peaks of 05-00, 05-10, and 05-20 pastes reveal that the amount of portlandite increased as the quartz powder was incorporated in the paste mixture. In contrast, the peaks of alite (main peak at 29° 2θ and 32° 2θ) reveal that, the intensity of alite decreased significantly with hydration time. For the XRD pattern in Figure 17, where the w/b ratio is 0.2, the portlandite crystal phase can also be detected, but its intensity is very weak. This is considered to be because of the effect of the water-reducing admixture, which delayed cement hydration. This is consistent with the results obtained from the TG analysis. In Figure 17b, it is shown clearly that the intensity of portlandite increased with the increase of the amount of substitution of quartz powder.
3.7. Comparison between Cumulative Heat of Hydration and Chemically Bound Water
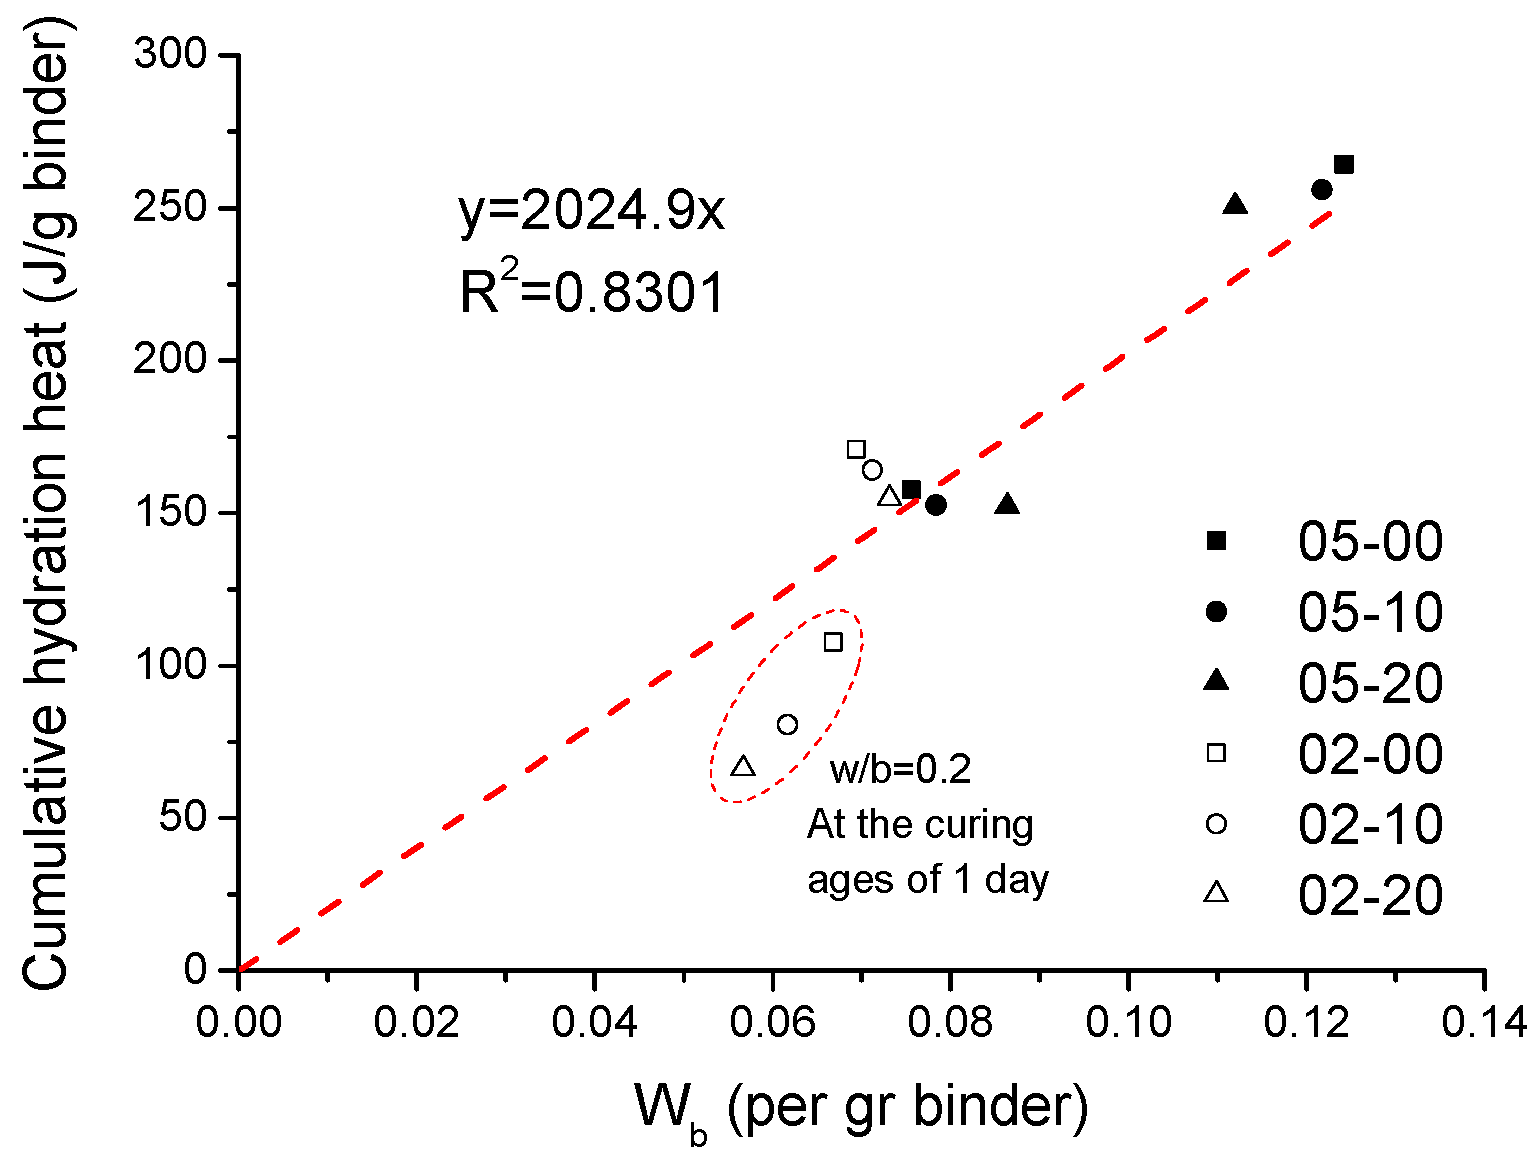
As the hydration progressed, both the cumulative heat of hydration and chemically bound water increased. Figure 18 shows that the cumulative heat of hydration of the cementitious material during the three-day period was proportional to the total amount of the chemically bound water: y = 2024.9x (where y is the cumulative heat and x is the chemically bound water). The correlation coefficient R2 was 0.8301. In the result of Panel and Hansen [24], the relationship between hydration heat and chemically bound water is also roughly linear, and the slope is about 2000 [24]. This slope value is similar to our value.
The binder paste samples of 02-00, 02-10, and 02-20 had a lower cumulative hydration heat value at the age of one day. This may be because of the use of the external mixing method in the isothermal calorimetry experiment, which resulted in heat being released during the mixing of the pastes, which could not be detected by the isothermal calorimeter. Since a longer mixing time is required in the case of the binder paste mixtures with a w/b ratio of 0.2 (the mixing time for the binder pastes with the w/b = 0.2 is 10 min; the mixing time for the binder pastes with the w/b = 0.5 is 2 min), this results in more heat loss during mixing, and so the experimental value would be lower than the regression value.
3.8. Comparison between Compressive Strength and Chemically Bound Water
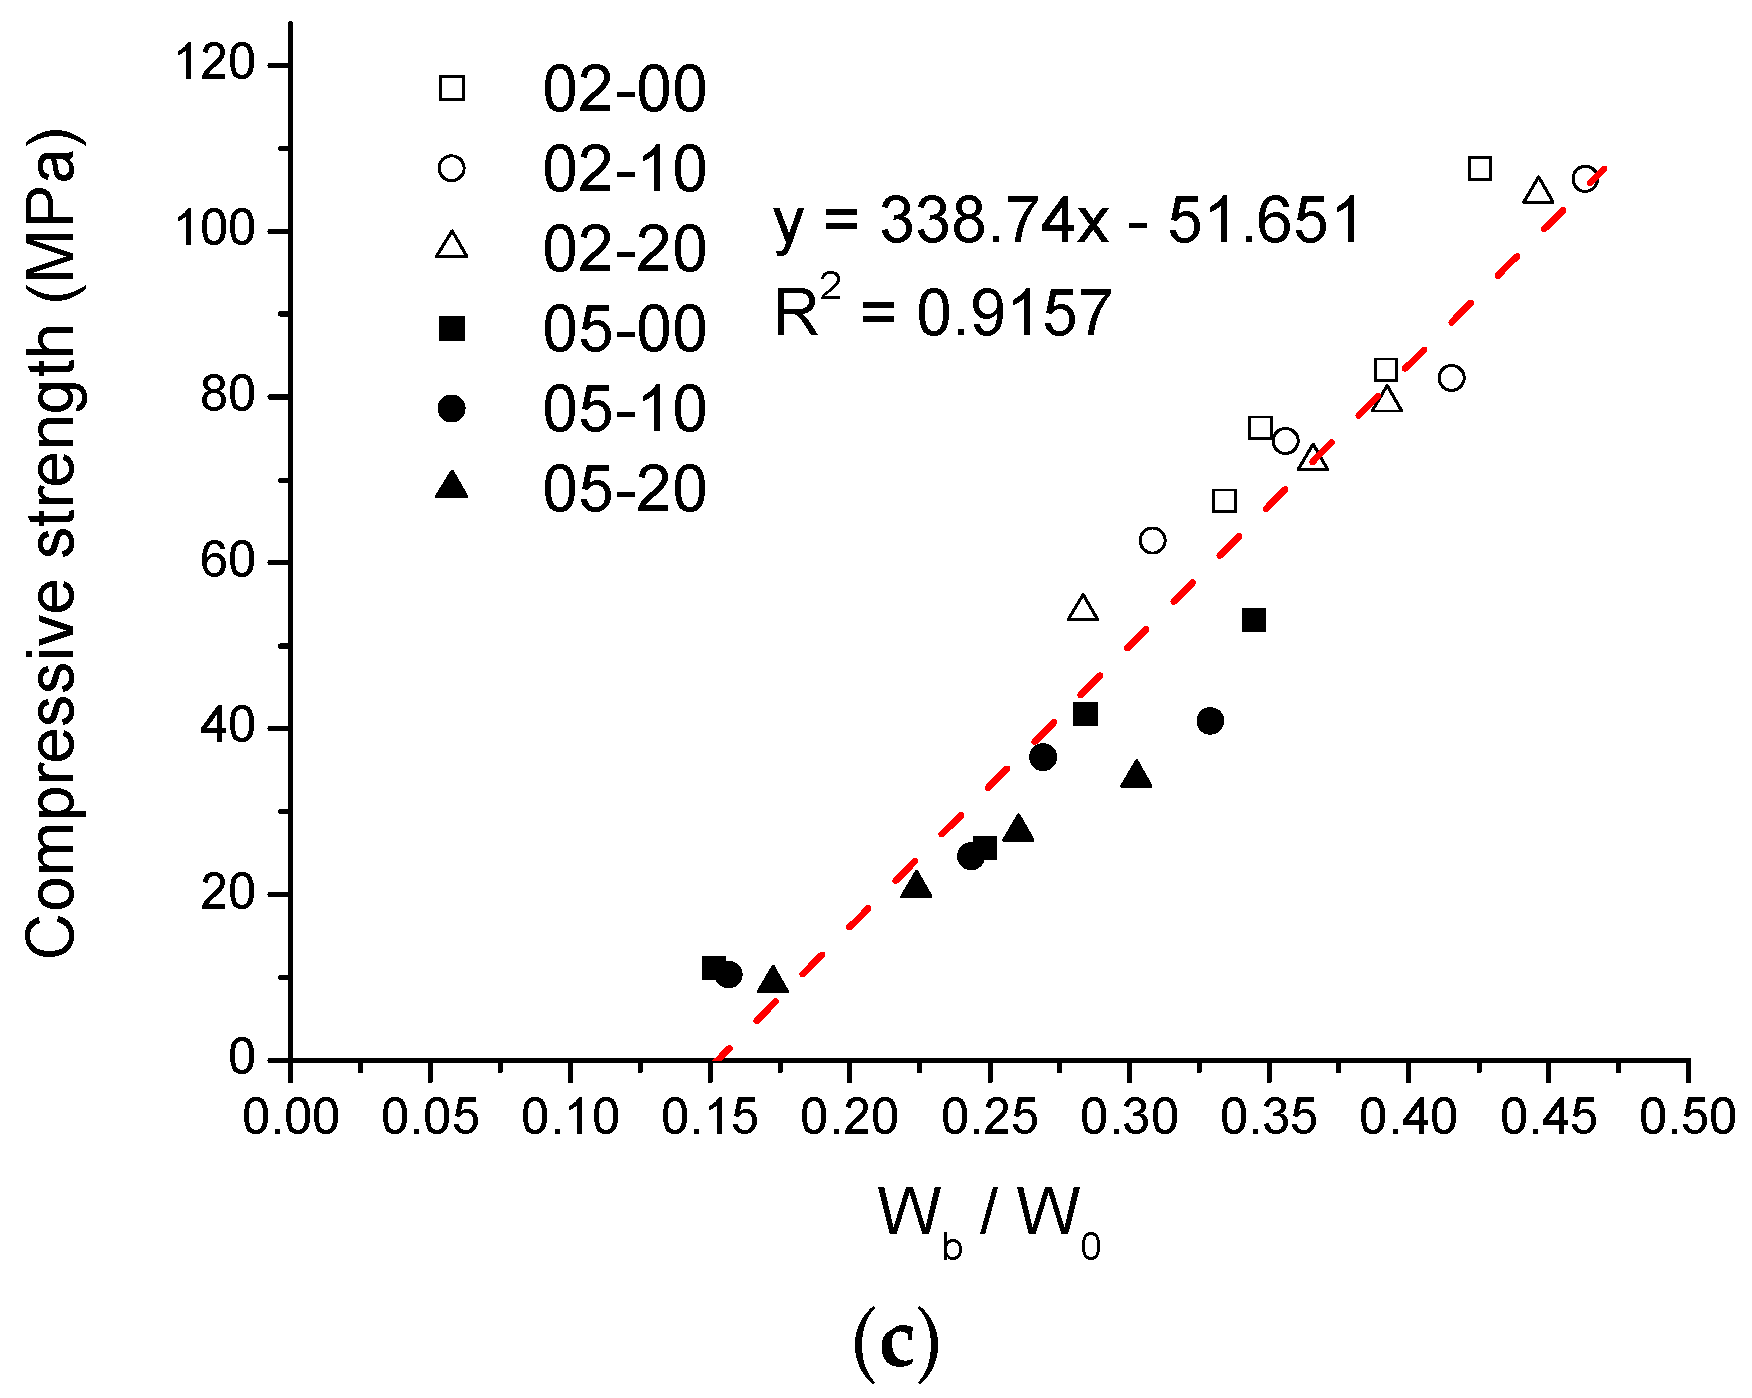
From Figure 19a,b, it is obvious that the relationship between the compressive strength and chemically bound water of the binder pastes incorporating quartz powder can be established. The relationship for the binder pastes with a w/b ratio of 0.5 was y = 416.77x − 23.895 and the correlation coefficient R2 is 0.919, while the binder pastes with a w/b ratio of 0.2 have the following relationship: y = 1483.1x − 31.065 and the correlation coefficient R2 was 0.8929. It was noticed that the strength of the cementitious material began to develop after a certain amount of bound water was formed in the beginning of the hydration reaction. Although the w/b ratio and the relationship between compressive strength and chemically bound water are different for two series of binder pastes, the linear regression was performed to observe the relation between the compressive strength and the ratio of the chemically bound water to all water (W0) in the paste samples, as shown in Figure 19c. The relationship between them is y = 338.74x − 51.651 and the correlation coefficient R2 is 0.9157. It is evident from Figure 19c that there is a linear relationship between the compressive strength and the ratio of the chemically bound water to all water in the paste samples, regardless of the w/b ratio, since the hydration reaction already took place at the beginning of the mixing. However, the strength begins at the time of the final setting. Figure 19c also fully illustrates this phenomenon.
3.9. Sustainability
The global warming potentials (GWPs) of the raw materials used in this study are given in Table 3, according to references [26,27,28]. Based on the GWP value of each raw material and the mixture proportions, the amount of CO2 emissions per unit volume of each paste was calculated. This calculation only considers the pastes used in this experiment, regardless of the influence of aggregates, as well as CO2 emissions during transportation and mixing [28].
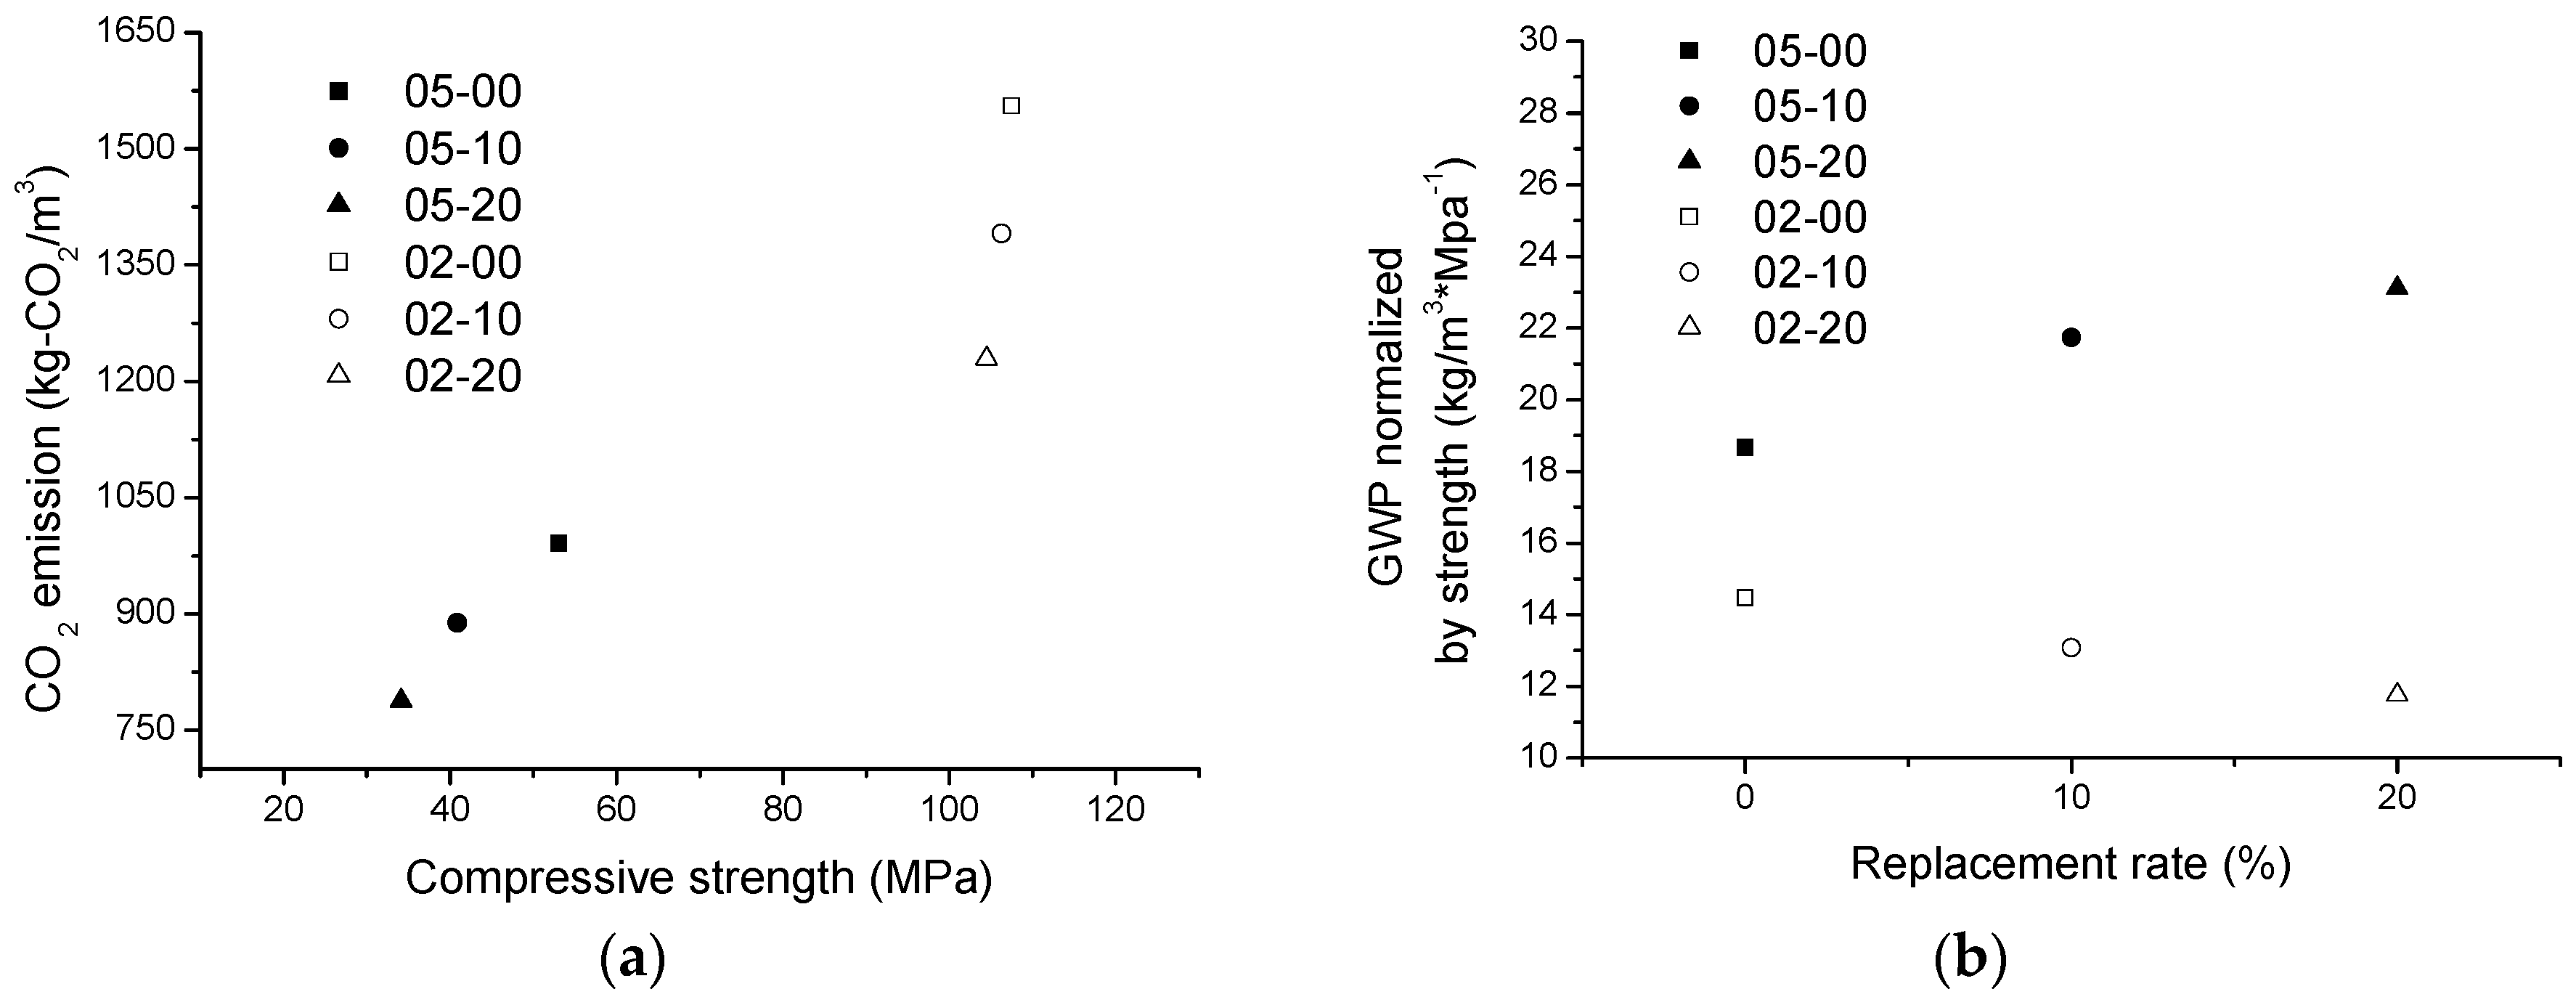
As shown in Figure 20a, the CO2 emissions per unit volume of paste increased as the compressive strength of the pastes increased, regardless of the w/b ratio. On the other hand, as shown in Figure 20b, the CO2 emissions per unit volume of each paste were divided by the 28-day compressive strength of each paste; that is, the compressive strength was normalized. It can be seen that at a high w/b ratio, as the amount of the quartz powder increases, the CO2 emissions per unit compressive strength also increased. However, at low w/b ratios, the addition of quartz powder could reduce the CO2 emissions per unit of compressive strength significantly. Therefore, it can be concluded that in reducing the CO2 emissions, the replacement of quartz powder in the case of a low w/b ratio is more advantageous than in the case of a high w/b ratio.
4. Conclusions
In this study, experiments were conducted to examine the effects of quartz powder on the microstructure and key properties of cement paste at different ages. The experimental results are concluded as follows:
- When the w/b is 0.5, the compressive strength of the pastes with quartz powder significantly decreases. From the MIP and SEM tests, the porosity of the paste is increased significantly due to the incorporation of quartz powder. However, when the w/b ratio is 0.2, the strength of the pastes mixed with quartz powder shows no significant difference from that of the control paste and the porosity is almost the same;
- The heat of the hydration of the pastes was tested: in the acceleration period, when the w/b is 0.5, the addition of quartz powder can promote cement hydration. At a low w/b, the cumulative heat release of the quartz powder pastes is higher than the control, which also indicates that when the w/b ratio of the paste used is low, the quartz powder can also promote the early hydration of cement;
- According to the results obtained from TGA, when the w/b ratio is low, the addition of quartz powder can promote the hydration of cement significantly compared to a high w/b ratio. Similar results are also obtained from XRD analysis;
- The compressive strength and cumulative hydration heat of binder pastes are well-correlated with their chemically bound water; the cumulative hydration heat is proportional to the total chemically bound water. Also, regardless of the w/b ratio, the compressive strength of binder pastes shows a good linear relation with the ratio of chemically bound water to all water.
Author Contributions
R.-S.L. and X.-Y.W. conceived and designed the experiments; R.-S.L. and G.-Y.Z. performed the experiments; R.-S.L. and X.-Y.W. analyzed the data and wrote the paper.
Acknowledgments
This research was supported by Basic Science Research Program through the National Research Foundation of Korea (NRF) funded by the Ministry of Science, ICT & Future Planning (No. 2015R1A5A1037548) and an NRF grant (NRF-2017R1C1B1010076).
Conflicts of Interest
The authors declare no conflict of interest.
References
- Worrell, E.; Price, L.; Martin, N.; Hendriks, C.; Meida, L.O. Carbon dioxide emissions from the global cement industry1. Annu. Rev. Energy Environ. 2001, 26, 303–329. [Google Scholar] [CrossRef]
- Bentz, D.P. Best Practices Guide for High-Volume Fly Ash Concretes: Assuring Properties and Performance; Technical Note (NIST TN)-1812; National Institute of Standards and Technology, US department of Commerce: Gaithersburg, MD, USA, 2013. [CrossRef]
- Howard, I.L.; Shannon, J.; Cost, V.T.; Stovall, M. Davis Wade Stadium Expansion and Renovation: Performance of Concrete Produced with Portland-Limestone Cement, Fly Ash, and Slag Cement. J. Mater. Civ. Eng. 2015, 27, 04015044. [Google Scholar] [CrossRef]
- Menéndez, G.; Bonavetti, V.; Irassar, E.F. Strength development of ternary blended cement with limestone filler and blast-furnace slag. Cem. Concr. Compos. 2003, 25, 61–67. [Google Scholar] [CrossRef]
- Shannon, J.; Howard, I.L.; Tim Cost, V. Potential of Portland-Limestone Cement to Improve Performance of Concrete Made with High Slag Cement and Fly Ash Replacement Rates. J. Test. Eval. 2017, 45, 873–889. [Google Scholar] [CrossRef]
- Suraneni, P.; Weiss, J. Examining the pozzolanicity of supplementary cementitious materials using isothermal calorimetry and thermogravimetric analysis. Cem. Concr. Compos. 2017, 83, 273–278. [Google Scholar] [CrossRef]
- Mehta, P.K. Pozzolanic and Cementitious By-Products as Mineral Admixtures for Concrete—A critical Review. Spec. Publ. 1983, 79, 1–46. [Google Scholar]
- Rahhal, V.; Talero, R. Early hydration of portland cement with crystalline mineral additions. Cem. Concr. Compos. 2005, 35, 1285–1291. [Google Scholar] [CrossRef]
- Kadri, E.H.; Aggoun, S.; De Schutter, G.; Ezziane, K. Combined effect of chemical nature and fineness of mineral powders on Portland cement hydration. Mater. Struct. 2010, 43, 665–673. [Google Scholar] [CrossRef]
- Berodier, E.; Scrivener, K. Understanding the filler effect on the nucleation and growth of C-S-H. J. Am. Ceram. Soc. 2014, 97, 3764–3773. [Google Scholar] [CrossRef]
- Gutteridge, W.A.; Dalziel, J.A. Filler cement: The effect of the secondary component on the hydration of Portland cement. Part 2: Fine hydraulic binders. Cem. Concr. Res. 1990, 20, 853–861. [Google Scholar] [CrossRef]
- Oey, T.; Kumar, A.; Bullard, J.W.; Neithalath, N.; Sant, G. The filler effect: The influence of filler content and surface area on cementitious reaction rates. J. Am. Ceram. Soc. 2013, 96, 1978–1990. [Google Scholar] [CrossRef]
- Garrault-Gauffinet, S.; Nonat, A. Experimental investigation of calcium silicate hydrate (C-S-H) nucleation. J. Cryst. Growth 1999, 200, 565–574. [Google Scholar] [CrossRef]
- Stark, J.; Moser, B.; Bellmann, F. Nucleation and Growth of C-S-H Phases on Mineral Admixtures; Springer: Berlin, Germany, 2007; ISBN 9783540724476. [Google Scholar]
- Bentz, D.P.; Ferraris, C.F.; Jones, S.Z.; Lootens, D.; Zunino, F. Limestone and silica powder replacements for cement: Early-age performance. Cem. Concr. Compos. 2017, 78, 43–56. [Google Scholar] [CrossRef] [PubMed] [Green Version]
- He, Y.; Mao, R.; Lü, L.; Hu, S. Hydration products of cement-silica fume-quartz powder mixture under different curing regimes. J. Wuhan Univ. Tech. Mater. Sci. Ed. 2017, 32, 598–602. [Google Scholar] [CrossRef]
- Scrivener, K.; Snellings, R.; Lothenbach, B. A Practical Guide to Microstructural Analysis of Cementitious Materials Edited; CRC Press: Boca Raton, FL, USA, 2016; ISBN 978-1-4987-3865-1. [Google Scholar]
- Scherer, G.W.; Zhang, J.; Thomas, J.J. Nucleation and growth models for hydration of cement. Cem. Concr. Res. 2012, 42, 982–993. [Google Scholar] [CrossRef]
- Mehta, P.K.; Monteiro, P.J.M. Concrete: Microstructure, Properties, and Materials; McGraw-Hill: New York, NY, USA, 2006; ISBN 0071589198. [Google Scholar]
- Taylor, H.F.W. Cement Chemistry, 2nd ed.; Thomas Telford: London, UK, 1997; ISBN 0727725920. [Google Scholar]
- Krstulović, R.; Dabić, P. A conceptual model of the cement hydration process. Cem. Concr. Res. 2000, 30, 693–698. [Google Scholar] [CrossRef]
- Van Tuan, N.; Ye, G.; Van Breugel, K.; Copuroglu, O. Hydration and microstructure of ultra high performance concrete incorporating rice husk ash. Cem. Concr. Res. 2011, 41, 1104–1111. [Google Scholar] [CrossRef]
- Neville, A.M. Properties of Concrete, 4th and final eds.; Hohn Wiley Sons: Hoboken, NJ, USA, 1997; ISBN 0-582-23070-5. [Google Scholar]
- Pane, I.; Hansen, W. Investigation of blended cement hydration by isothermal calorimetry and thermal analysis. Cem. Concr. Res. 2005, 35, 1155–1164. [Google Scholar] [CrossRef]
- Rupasinghe, M.; San Nicolas, R.; Mendis, P.; Sofi, M.; Ngo, T. Investigation of strength and hydration characteristics in nano-silica incorporated cement paste. Cem. Concr. Compos. 2017, 80, 17–30. [Google Scholar] [CrossRef]
- Hendriks, C.A.; Worrell, E.; de Jager, D.; Blok, K.; Riemer, P. Emission Reduction of Greenhouse Gases from the Cement Industry; Ieaghg: Cheltenham, UK, 2004; pp. 1–11. [Google Scholar] [CrossRef]
- Müller, H.S.; Haist, M.; Vogel, M. Assessment of the sustainability potential of concrete and concrete structures considering their environmental impact, performance and lifetime. Constr. Build. Mater. 2014, 67, 321–337. [Google Scholar] [CrossRef]
- Yang, K.-H.; Jung, Y.-B.; Cho, M.-S.; Tae, S.-H. Effect of supplementary cementitious materials on reduction of CO2 emissions from concrete. J. Clean. Prod. 2015, 103, 774–783. [Google Scholar] [CrossRef]
Figure 1.
SEM micrograph of quartz powder.

Figure 2.
Particle size distributions of Portland cement and quartz powder.

Figure 3.
Compressive strength results of different binder pastes (w/b = 0.5).
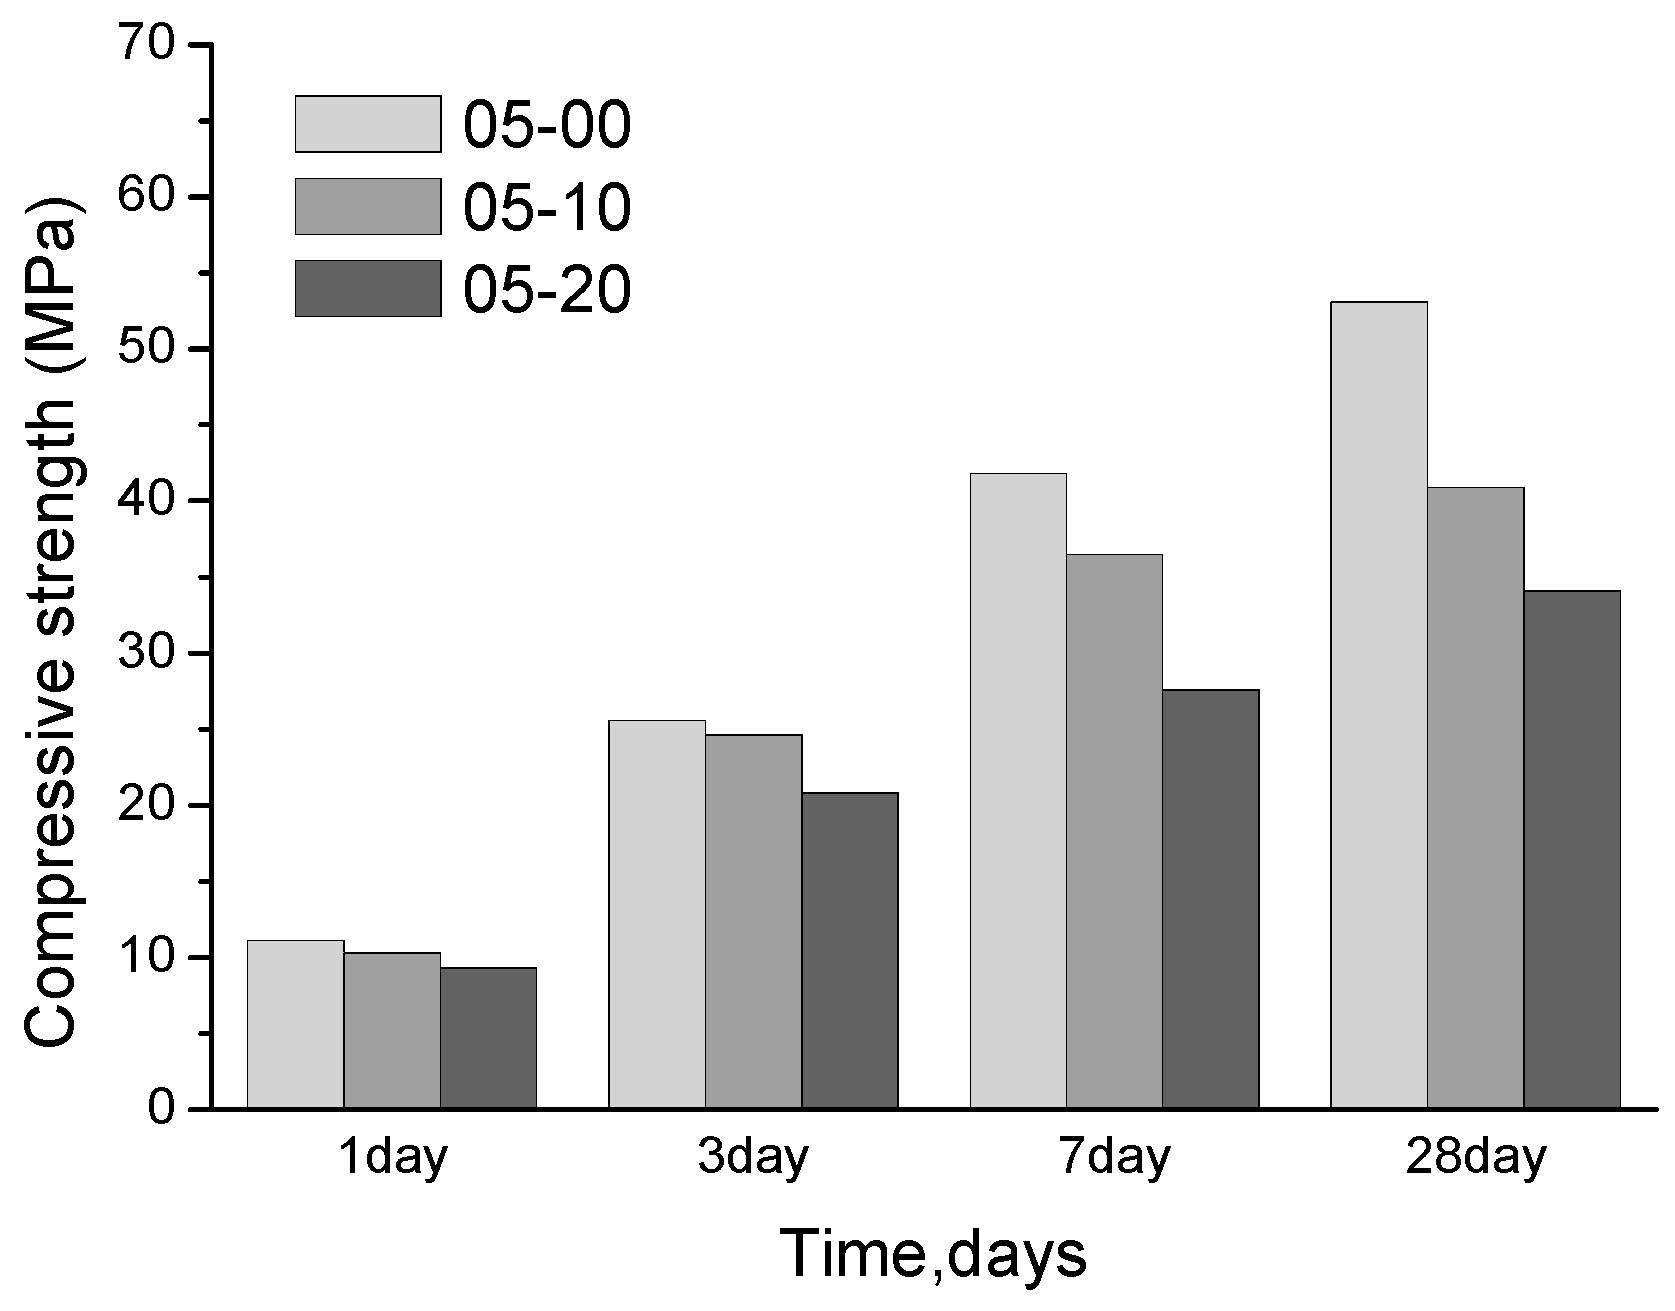
Figure 4.
Compressive strength results of different binder pastes (w/b = 0.2).
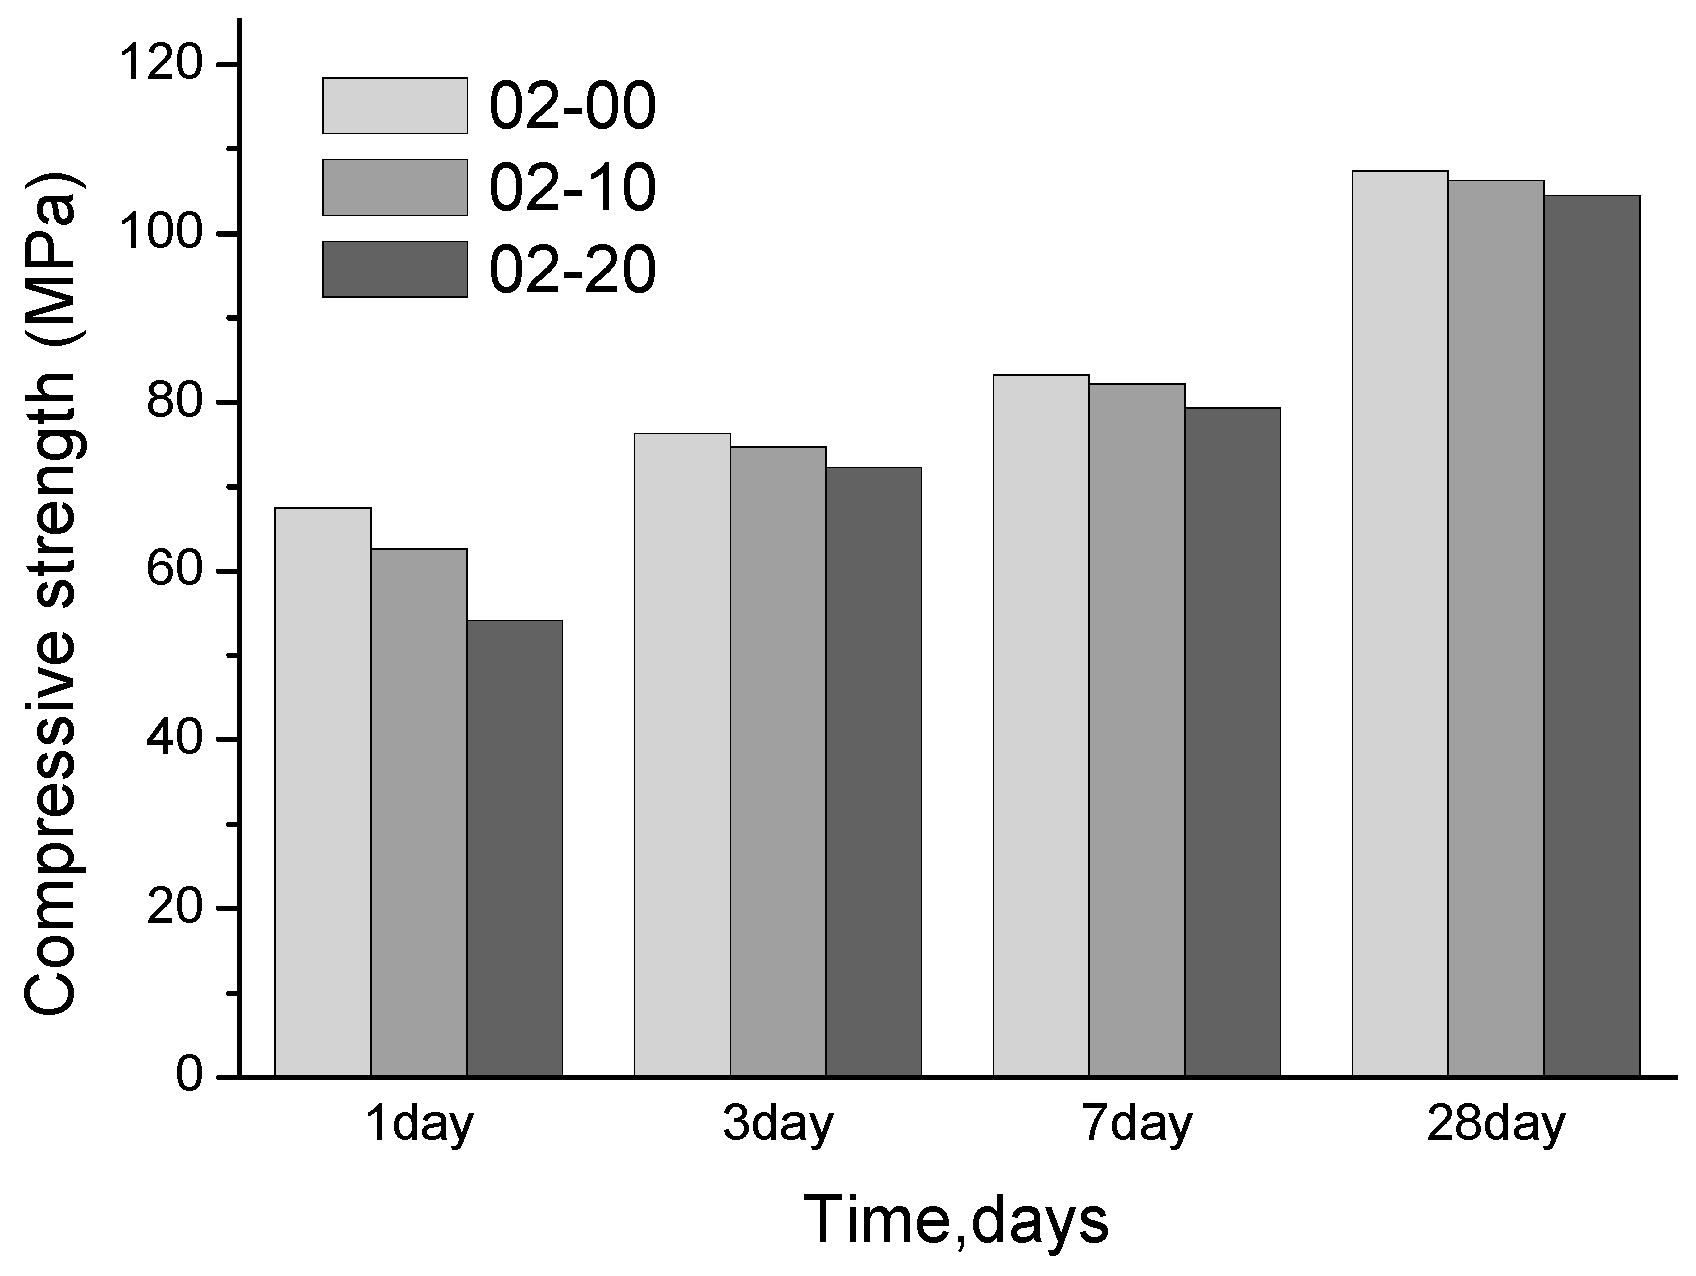
Figure 5.
Pore size distribution in 28-day old pastes with a w/b of 0.5. (a) Cumulative intrusion volume; (b) differential curves.
Figure 5.
Pore size distribution in 28-day old pastes with a w/b of 0.5. (a) Cumulative intrusion volume; (b) differential curves.

Figure 6.
Pore size distribution in 28-day old pastes with a w/b of 0.2. (a) Cumulative intrusion volume; (b) differential curves.
Figure 6.
Pore size distribution in 28-day old pastes with a w/b of 0.2. (a) Cumulative intrusion volume; (b) differential curves.

Figure 7.
Relationship between compressive strength and accumulative intrusion pores.

Figure 8.
SEM images of various 28-day old pastes. (a) 05-00; (b) 05-10; (c) 05-20; (d) 02-00; (e) 02-10; (f) 02-20.
Figure 8.
SEM images of various 28-day old pastes. (a) 05-00; (b) 05-10; (c) 05-20; (d) 02-00; (e) 02-10; (f) 02-20.
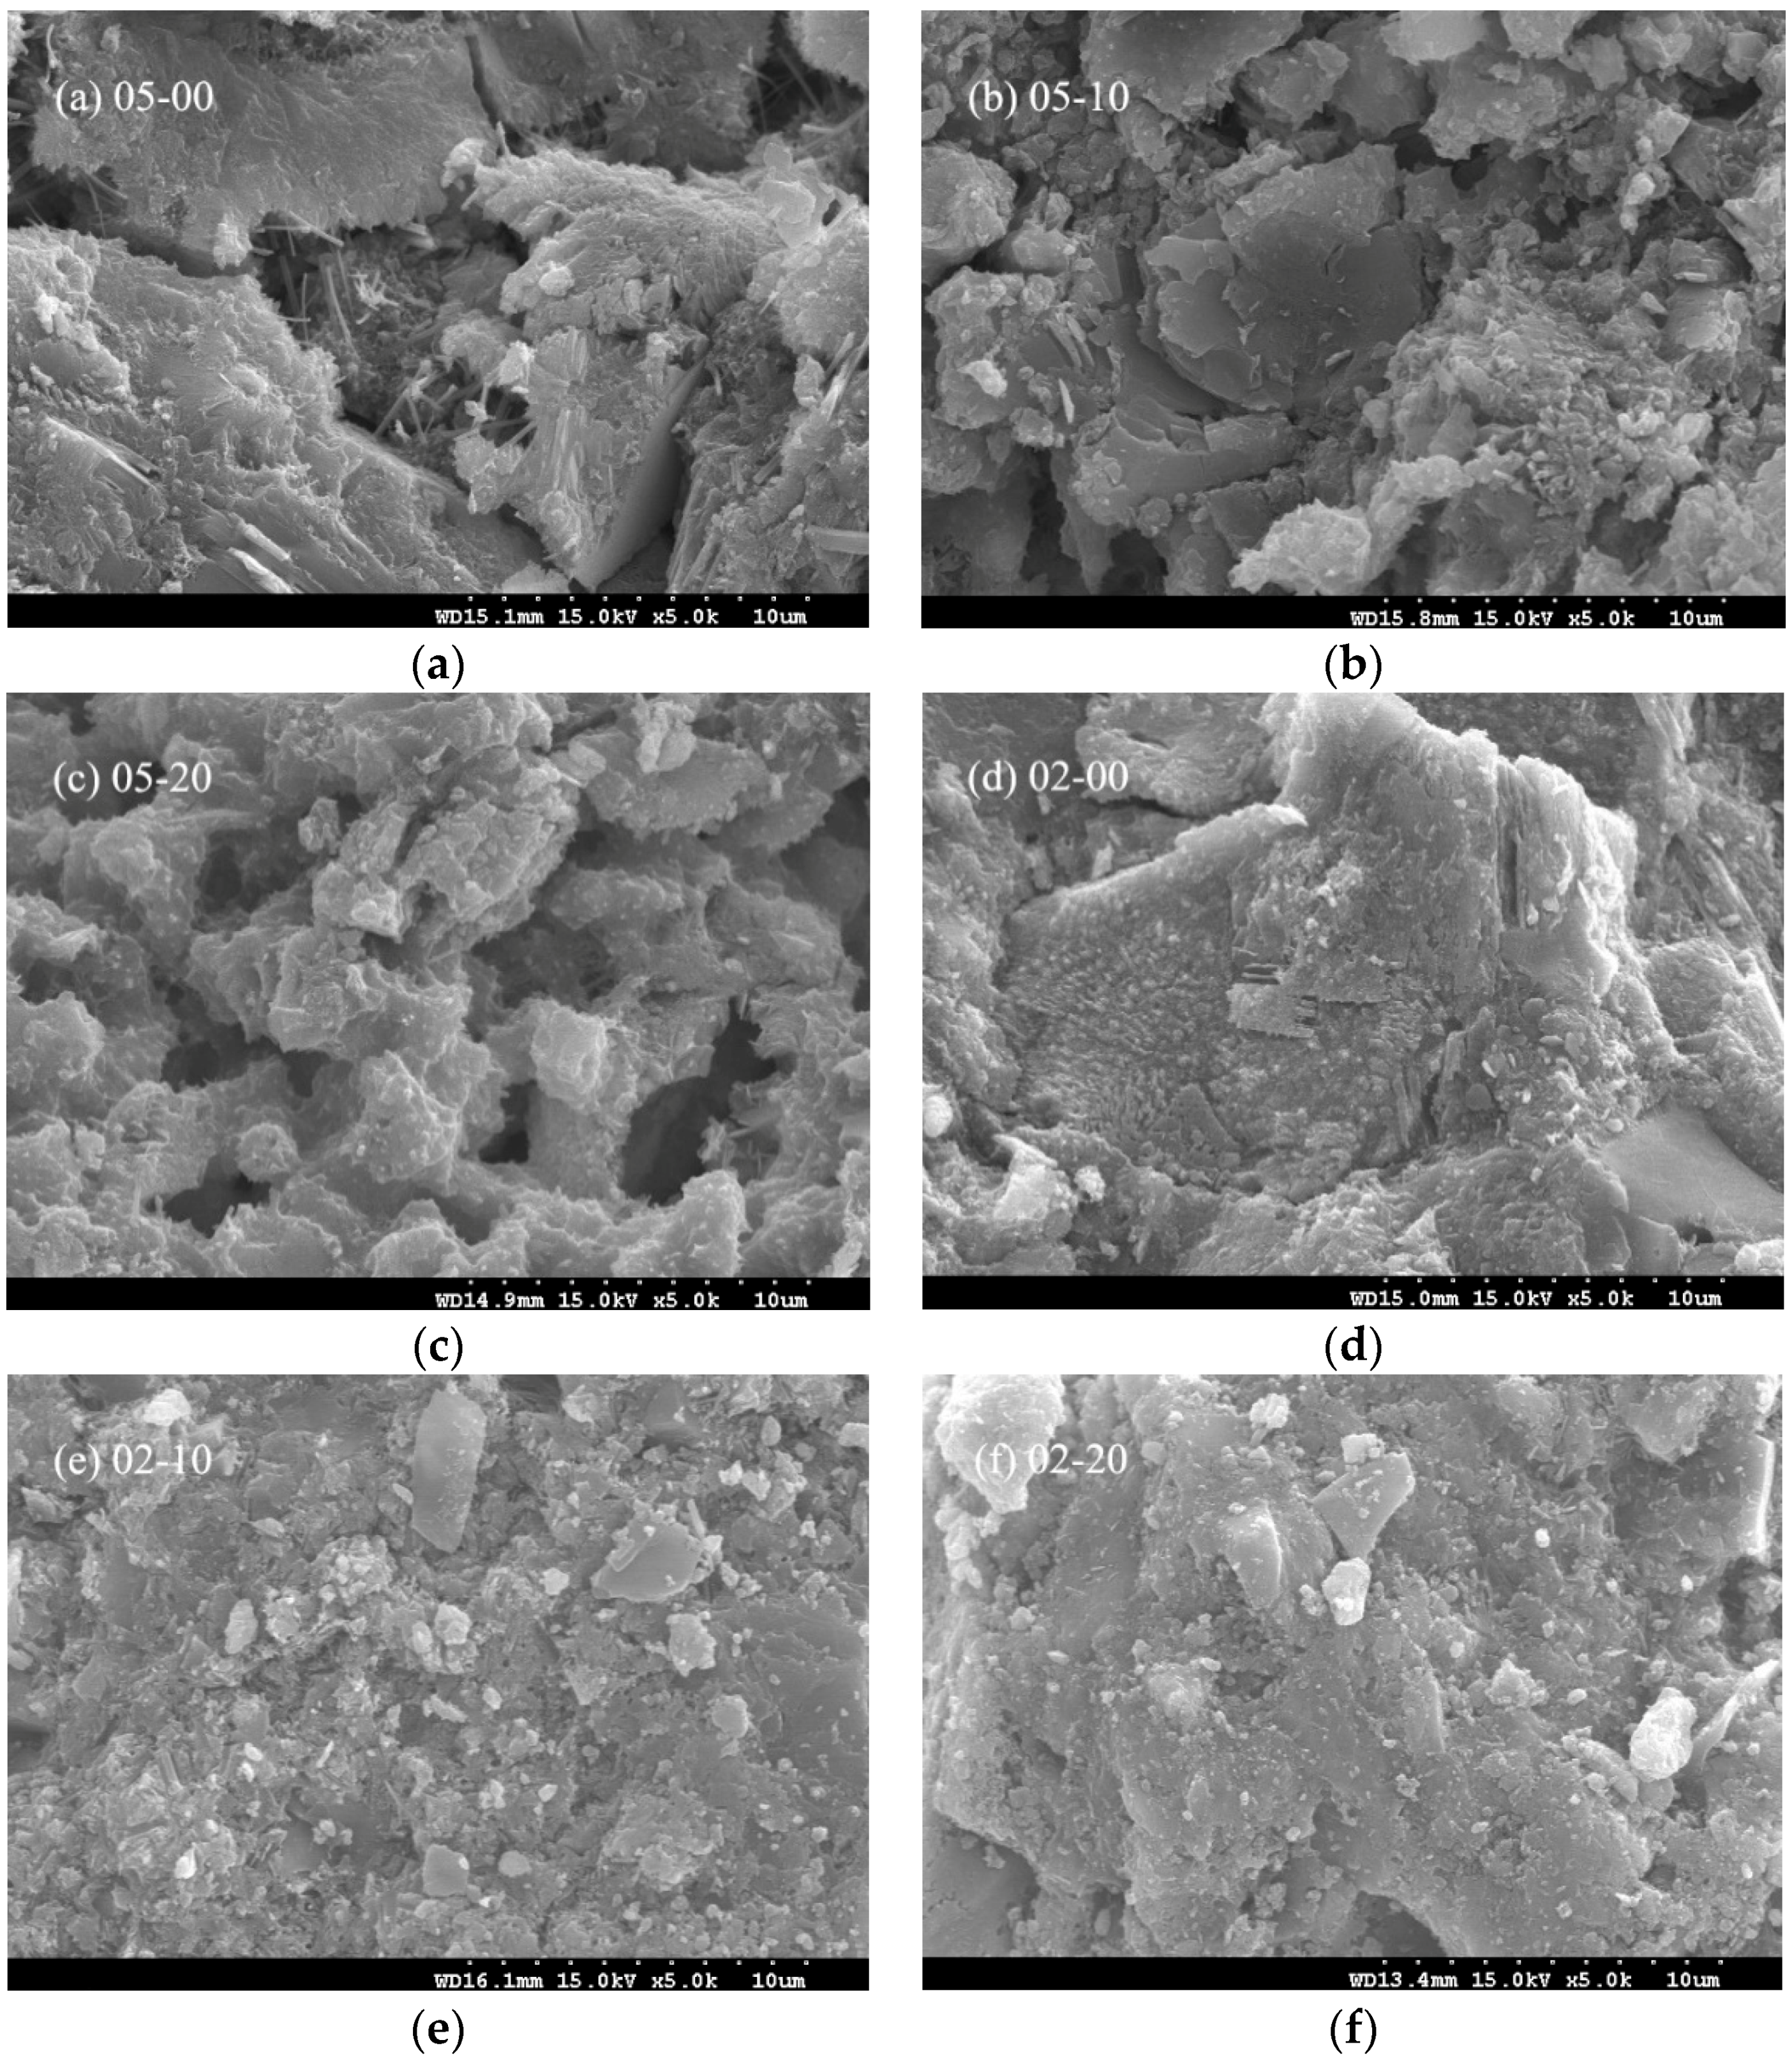
Figure 9.
Heat of hydration of binder pastes containing quartz powder at 20 °C. (a) Hydration heat evolution rate and (b) cumulative hydration heat (w/b = 0.5).
Figure 9.
Heat of hydration of binder pastes containing quartz powder at 20 °C. (a) Hydration heat evolution rate and (b) cumulative hydration heat (w/b = 0.5).

Figure 10.
Relationship between the quartz powder substitution rate and slope in the acceleration period.
Figure 10.
Relationship between the quartz powder substitution rate and slope in the acceleration period.
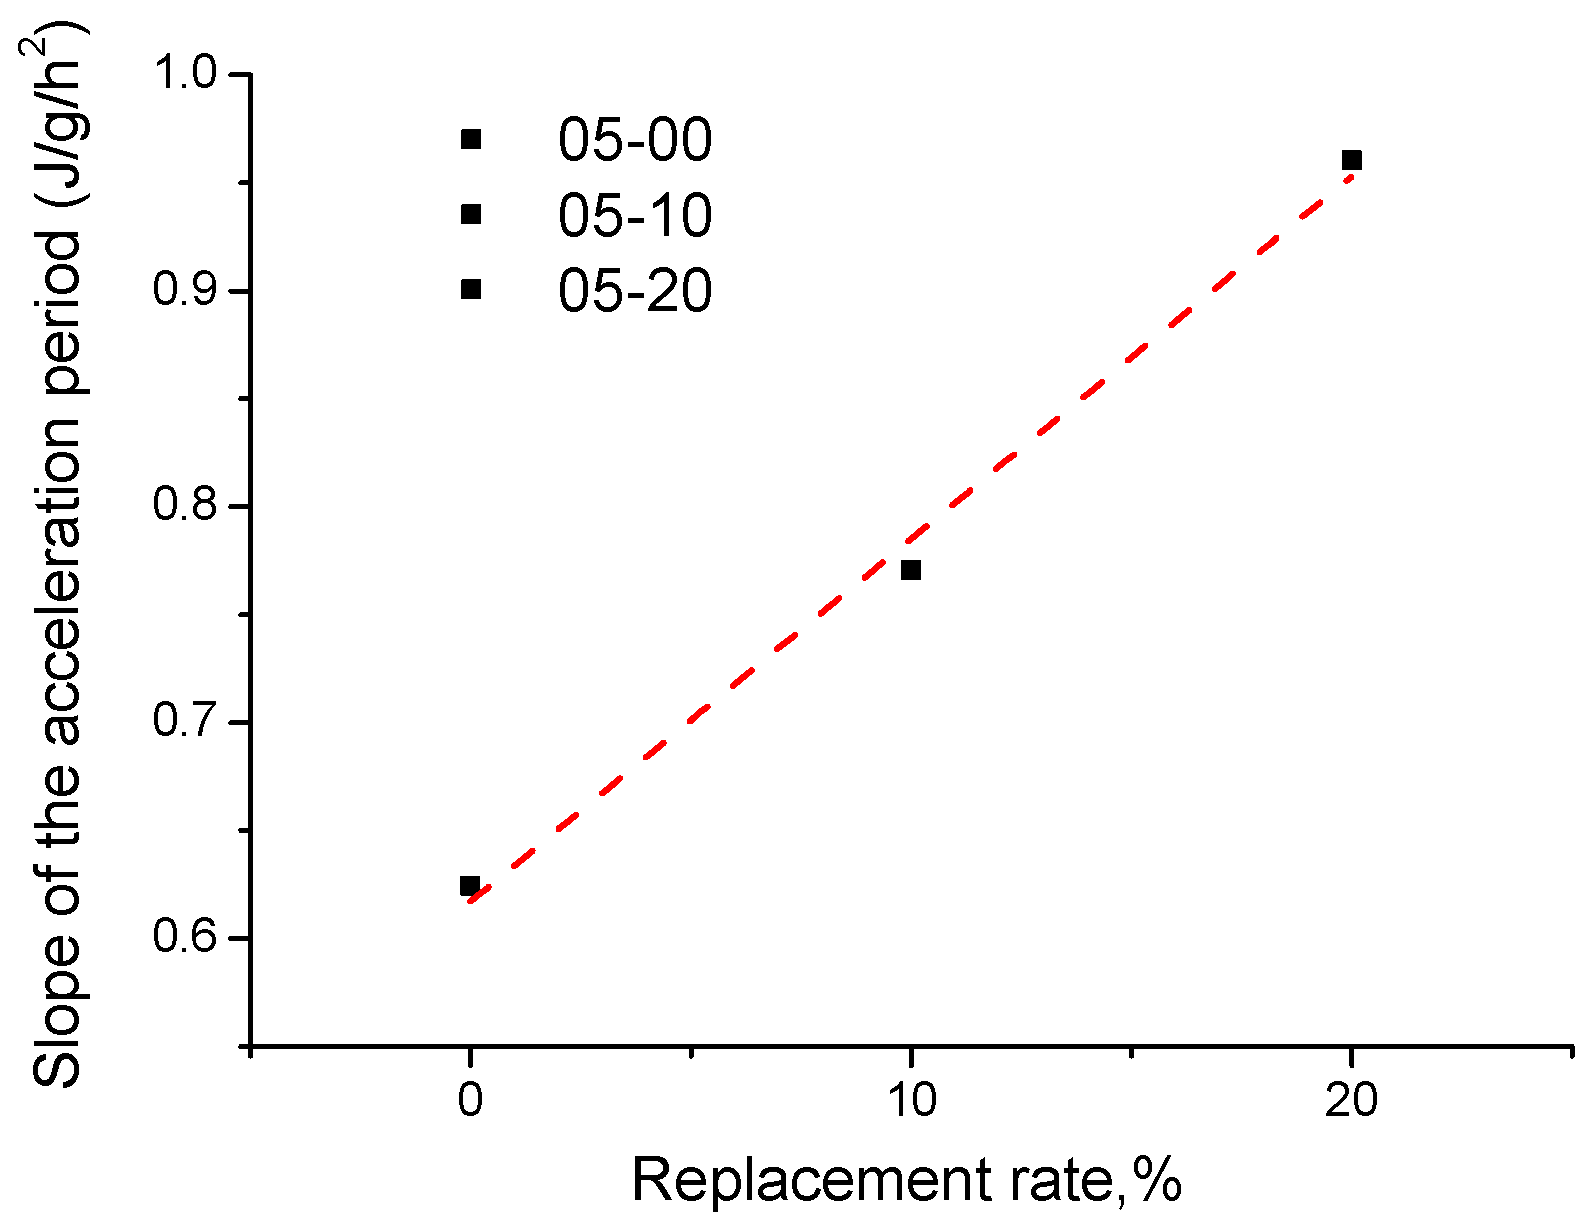
Figure 11.
Heat of hydration of binder pastes containing quartz powder at 20 °C. (a) Hydration heat evolution rate and (b) cumulative hydration heat (w/b = 0.2).
Figure 11.
Heat of hydration of binder pastes containing quartz powder at 20 °C. (a) Hydration heat evolution rate and (b) cumulative hydration heat (w/b = 0.2).
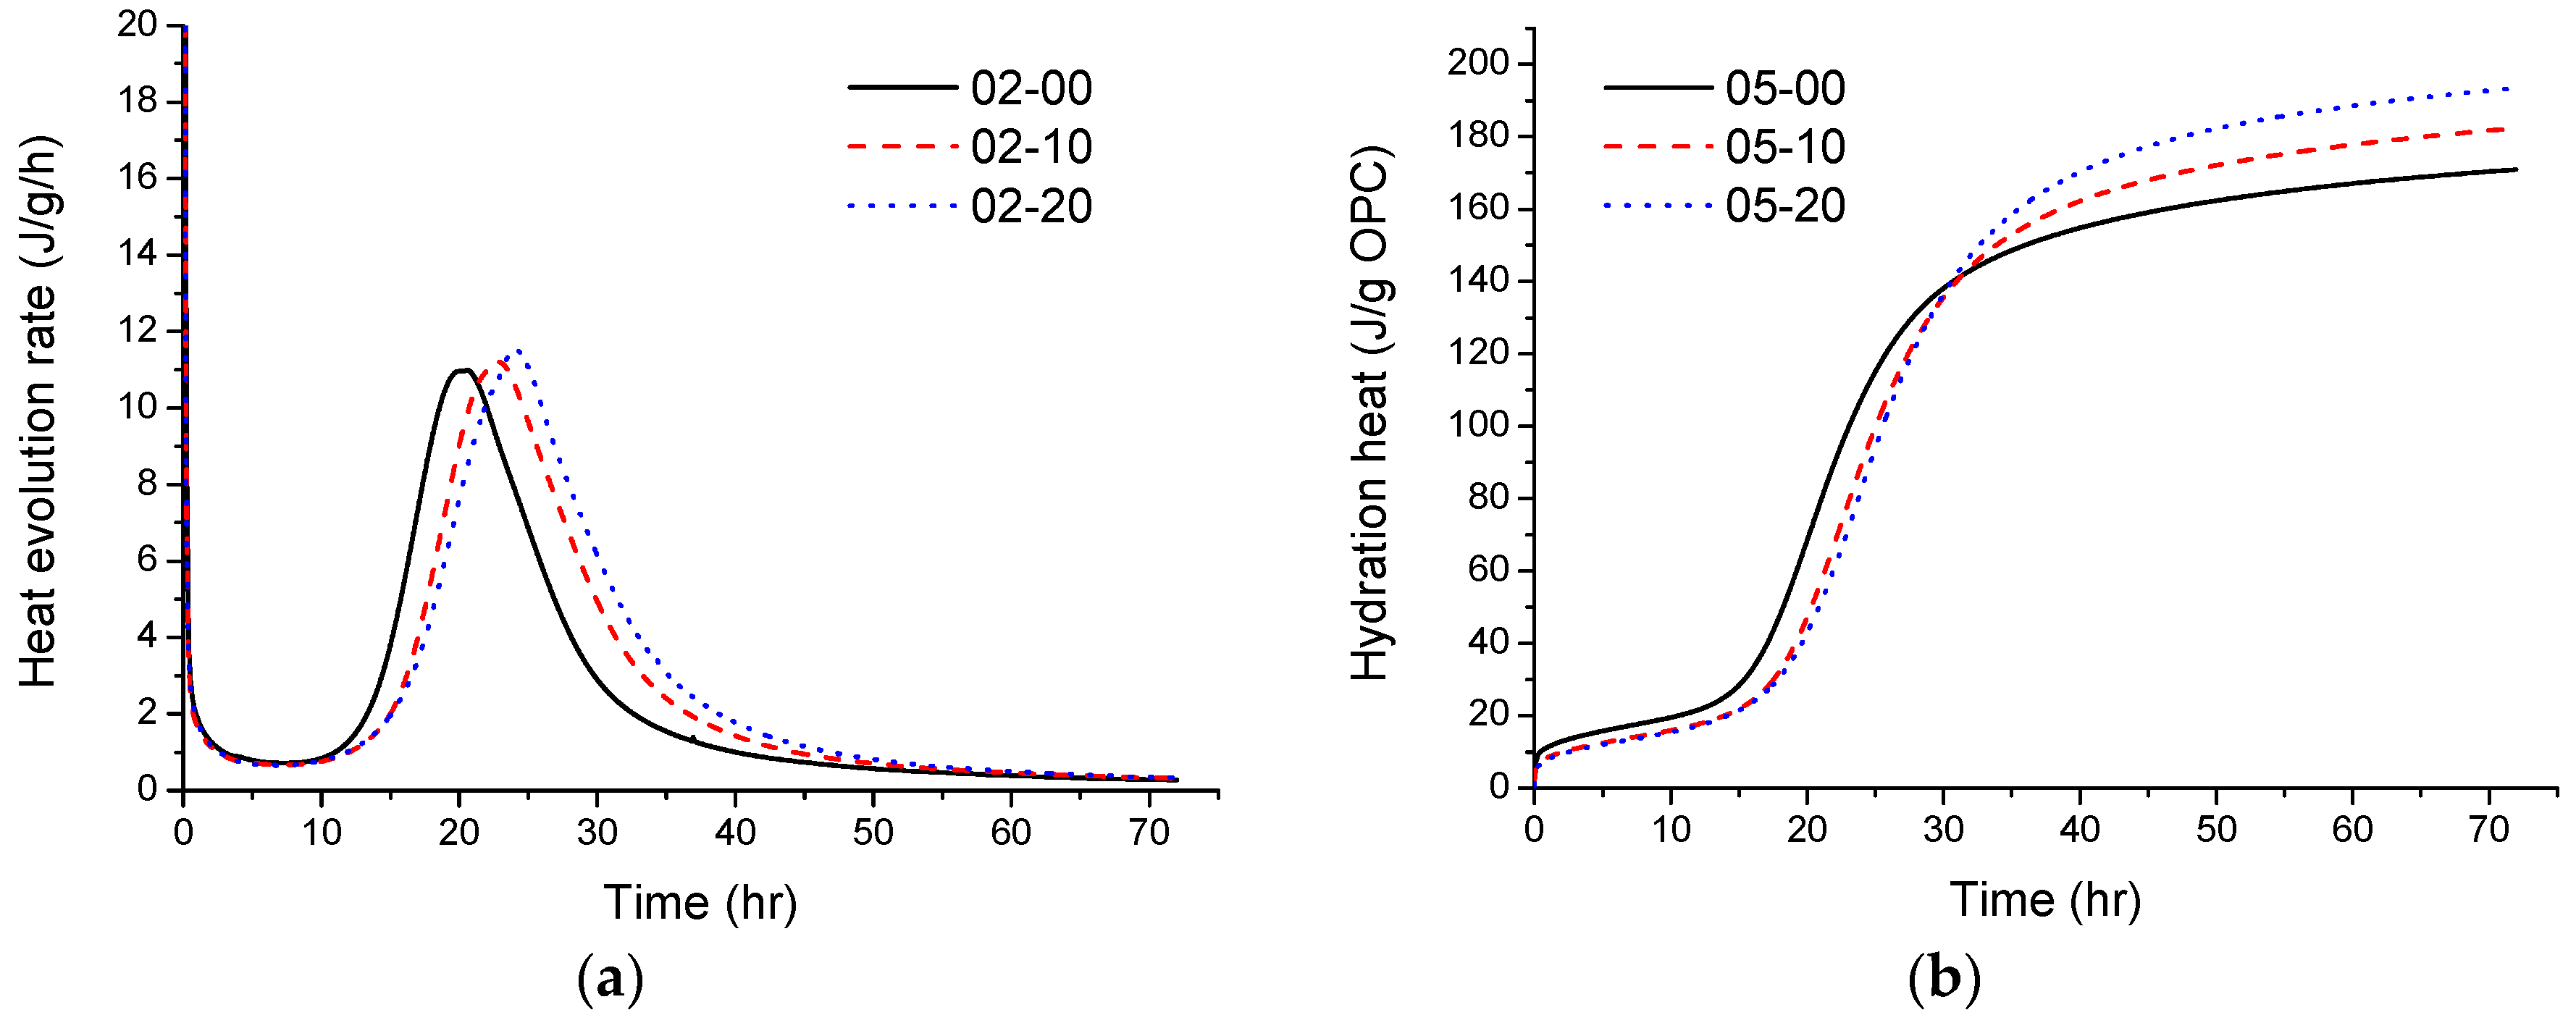
Figure 12.
Heat of hydration of binder pastes including quartz powder at 20 °C. (a) w/b = 0.5 and (b) w/b = 0.2.
Figure 12.
Heat of hydration of binder pastes including quartz powder at 20 °C. (a) w/b = 0.5 and (b) w/b = 0.2.

Figure 13.
Chemically bound water content per gram of ordinary Portland cement (OPC). (a) w/b = 0.5, and (b) w/b = 0.2.
Figure 13.
Chemically bound water content per gram of ordinary Portland cement (OPC). (a) w/b = 0.5, and (b) w/b = 0.2.

Figure 14.
Calcium hydroxide (CH) content per gram of OPC. (a) w/b = 0.5, and (b) w/b = 0.2.

Figure 15.
Relation between CH and Wb.

Figure 16.
XRD curves obtained for binder paste samples containing quartz powder at (a) 1 day; (b) 28 days (w/b = 0.5).
Figure 16.
XRD curves obtained for binder paste samples containing quartz powder at (a) 1 day; (b) 28 days (w/b = 0.5).

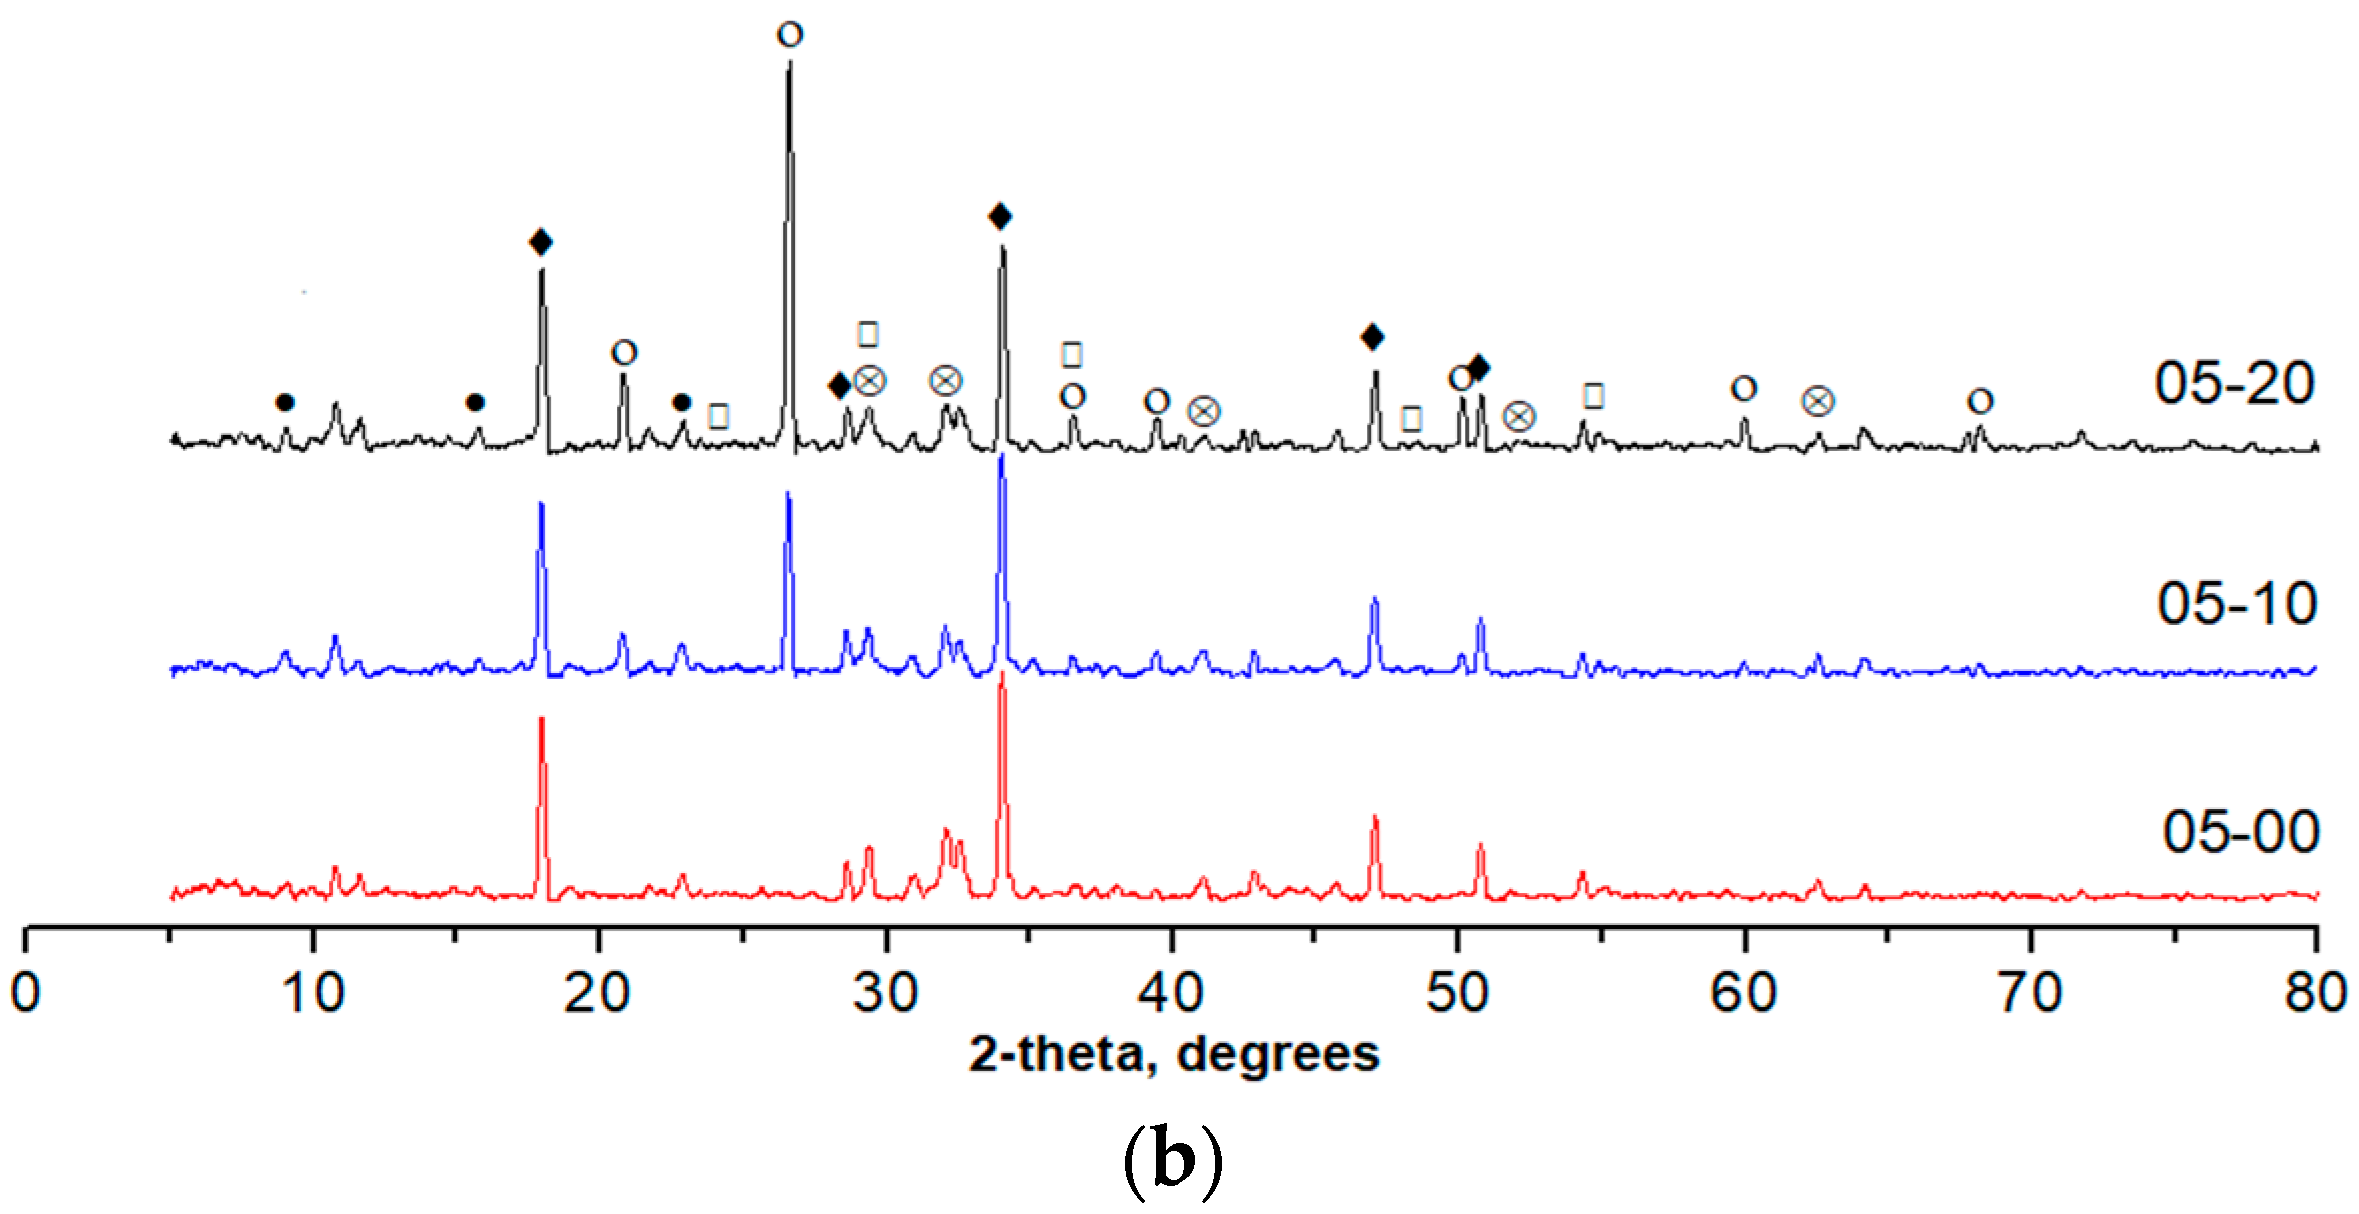
Figure 17.
XRD curves obtained for binder paste samples containing quartz powder at (a) 1 day; (b) 28 days (w/b = 0.2).
Figure 17.
XRD curves obtained for binder paste samples containing quartz powder at (a) 1 day; (b) 28 days (w/b = 0.2).

Figure 18.
Relations between cumulative hydration heat and chemically bound water.

Figure 19.
Comparison between compressive strength and chemically bound water. (a) w/b = 0.5; (b) w/b = 0.2; and (c) relations between compressive strength and Wb/W0.
Figure 19.
Comparison between compressive strength and chemically bound water. (a) w/b = 0.5; (b) w/b = 0.2; and (c) relations between compressive strength and Wb/W0.
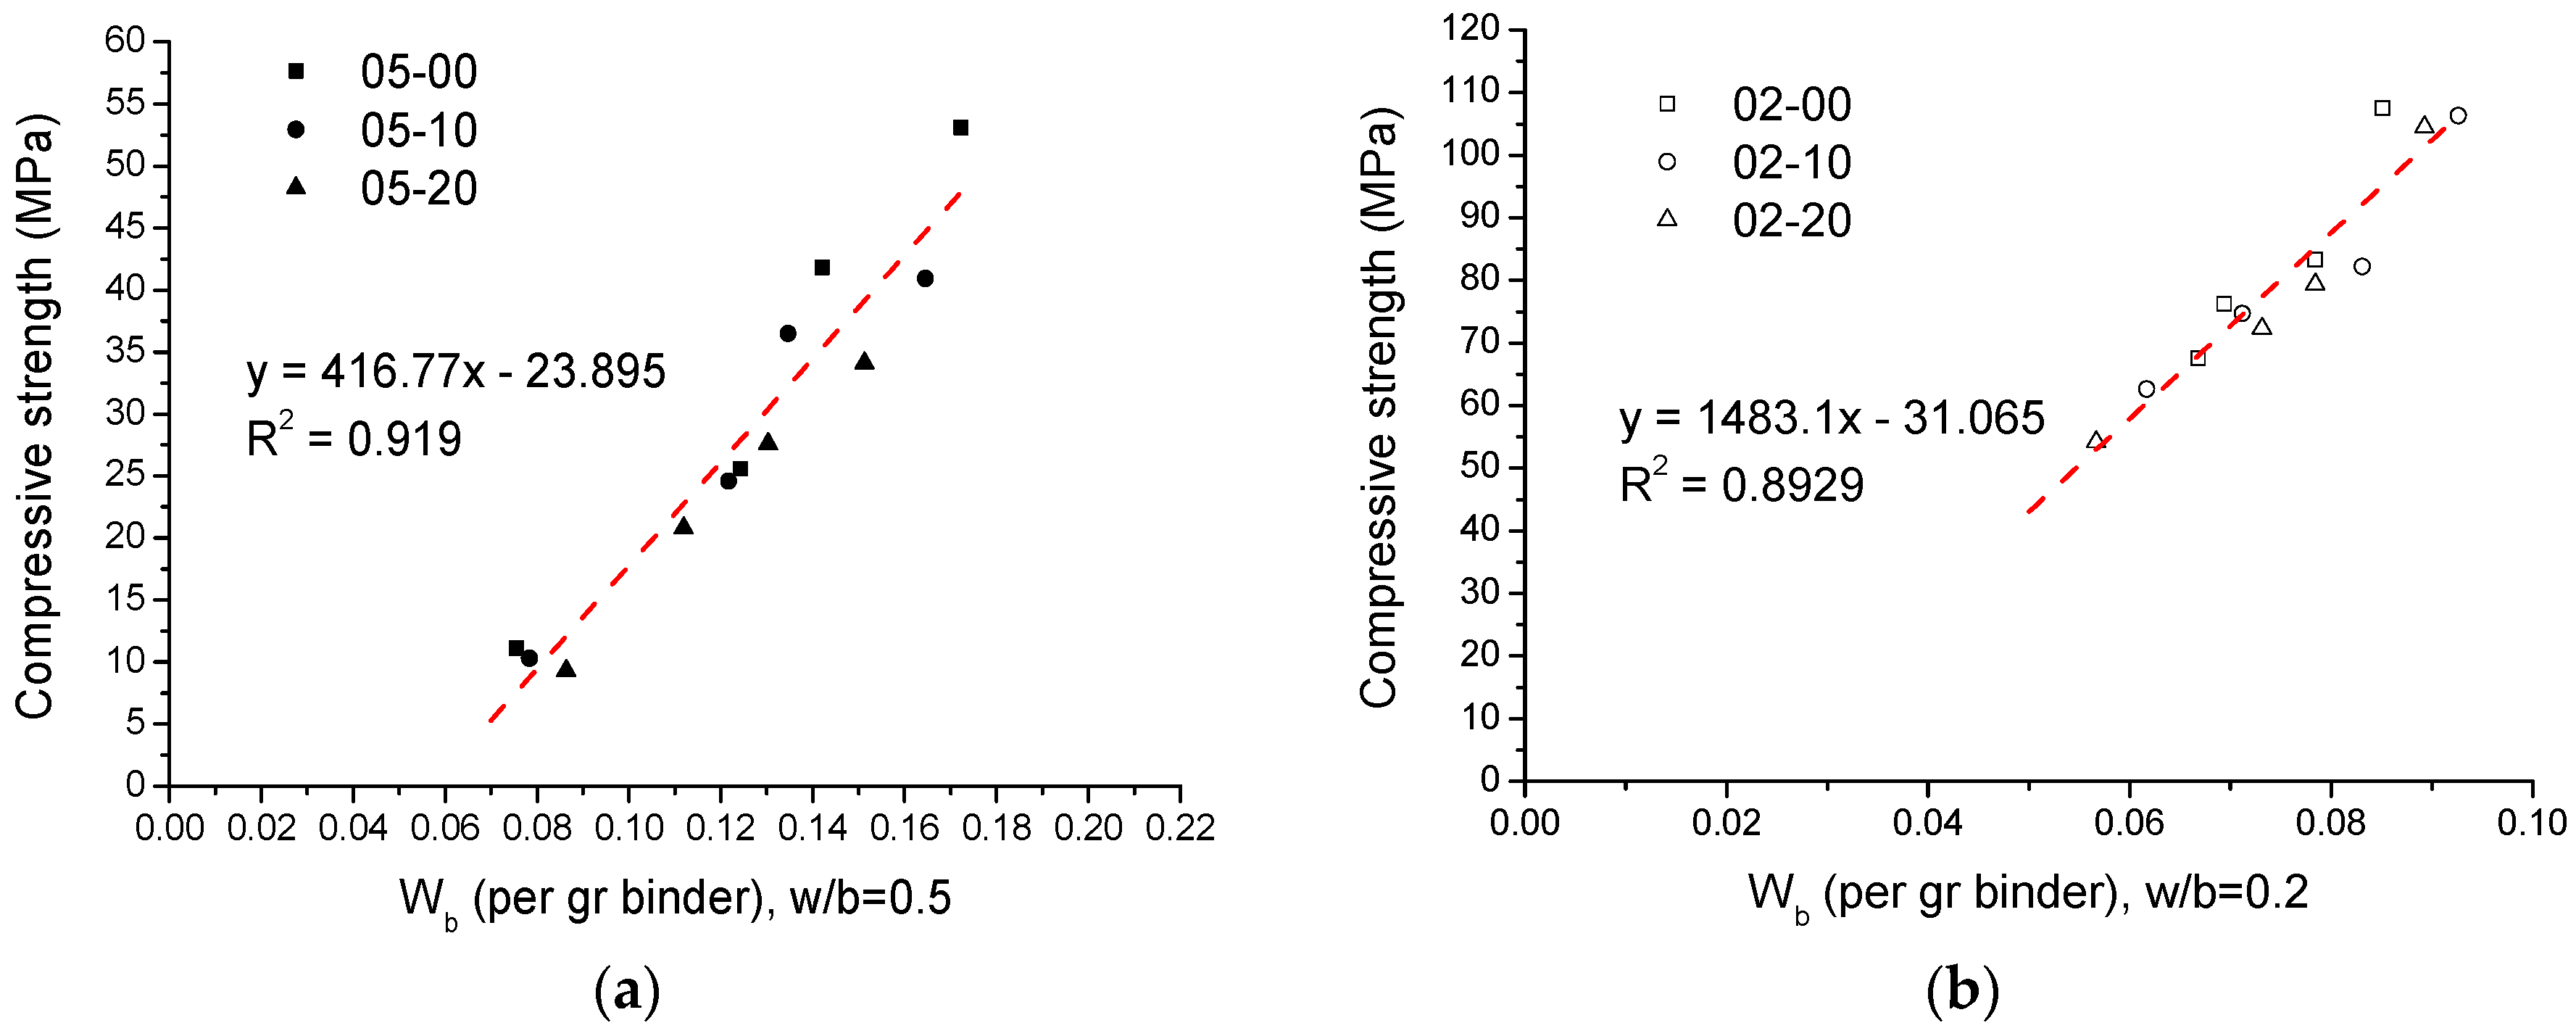

Figure 20.
(a) Relationship between CO2 emissions and 28-day strength. (b) Relationship between quartz powder replacement rate and CO2 emissions normalized by strength.
Figure 20.
(a) Relationship between CO2 emissions and 28-day strength. (b) Relationship between quartz powder replacement rate and CO2 emissions normalized by strength.


Table 1.
Chemical compositions of Portland cement and quartz powder obtained from XRF spectroscopy.
| Chemical Component (% wt) | SiO2 | Al2O3 | Fe2O3 | CaO | MgO | MnO | TiO2 | SO3 | ZnO | P2O5 | K2O | LOI 1 |
|---|---|---|---|---|---|---|---|---|---|---|---|---|
| Cement | 20.4 | 4.55 | 2.54 | 63.1 | 3.15 | 0.07 | 0.23 | 2.28 | 0.06 | 0.14 | 1.4 | 0.68 |
| Quartz powder | 99.0 | 0.25 | - | - | - | - | 0.11 | - | - | - | - | 0.62 |
1 Loss on ignition.
Table 2.
Mix proportions of various binder pastes.
| Mix No. | %OPC | %Quartz | w/b | %HRWRA |
|---|---|---|---|---|
| 05-00 | 100 | 0 | 0.5 | - |
| 05-10 | 90 | 10 | 0.5 | - |
| 05-20 | 80 | 20 | 0.5 | - |
| 02-00 | 100 | 0 | 0.2 | 1 |
| 02-10 | 90 | 10 | 0.2 | 1 |
| 02-20 | 80 | 20 | 0.2 | 1 |
HRWRA: high-range water-reducing admixture; OPC: ordinary Portland cement.
© 2018 by the authors. Licensee MDPI, Basel, Switzerland. This article is an open access article distributed under the terms and conditions of the Creative Commons Attribution (CC BY) license (http://creativecommons.org/licenses/by/4.0/).
Share and Cite
MDPI and ACS Style
Lin, R.-S.; Wang, X.-Y.; Zhang, G.-Y. Effects of Quartz Powder on the Microstructure and Key Properties of Cement Paste. Sustainability 2018, 10, 3369. https://doi.org/10.3390/su10103369
AMA Style
Lin R-S, Wang X-Y, Zhang G-Y. Effects of Quartz Powder on the Microstructure and Key Properties of Cement Paste. Sustainability. 2018; 10(10):3369. https://doi.org/10.3390/su10103369
Chicago/Turabian StyleLin, Run-Sheng, Xiao-Yong Wang, and Gui-Yu Zhang. 2018. "Effects of Quartz Powder on the Microstructure and Key Properties of Cement Paste" Sustainability 10, no. 10: 3369. https://doi.org/10.3390/su10103369
Note that from the first issue of 2016, this journal uses article numbers instead of page numbers. See further details here.