Impact of Energy Consumption on Air Quality in Jiangsu Province of China

1
School of Management, China University of Mining and Technology, Xuzhou 221116, China
2
School of Economics, Zhejiang University of Finance & Economics, Hangzhou 310018, China
*
Author to whom correspondence should be addressed.
Sustainability 2018, 10(1), 94; https://doi.org/10.3390/su10010094
Submission received: 19 November 2017
/
Revised: 26 December 2017
/
Accepted: 29 December 2017
/
Published: 2 January 2018
Abstract
:Air quality has become an important sustainability concern for China’s highly developed economic regions. Taking Jiangsu Province as a case, this study investigates the effect of energy consumption on air quality when both considering and not considering control variables, such as industrial structure, energy consumption structure and energy efficiency from 2006 to 2015 and further explores the influence of the related policies on air quality and the relationship between energy consumption and air quality. One important finding is that the relationship between energy consumption and the air quality index of Jiangsu Province shows a U-shaped curve and it is now in the increasing part of the curve, which reveals the effectiveness of controlling energy consumption in improving air quality. Another important finding is that, when considering the effect of related polices, there is still a U-shaped curve relationship between energy consumption and air quality index, with the opening of curve becoming bigger and the influence of energy consumption on air quality becoming more obvious. Moreover, although air quality is improved whether considering policies separately or together, the effect of combined policies is better than is the effect of a separate policy. This not only reflects the effectiveness of related polices but also shows the importance of policy coordination. Furthermore, a 1% optimization of industrial structure inhibits air quality index by 0.0054%, while the relationship of energy efficiency and energy consumption structure with air quality is inconsistent with theoretical analysis. This implies that, in practice, there is still room for improvement in both energy saving and emission reduction and even in air quality improvement. This study may help the stakeholders, whether from Jiangsu Province, other provinces in China or other countries at the global level, identify the impacts of energy consumption on air quality and formulate effective energy saving and air quality improvement policies in conjunction with their economic characteristics.
1. Introduction
China’s economy has seen rapid development in recent years, in line with serious environmental problems; the issue of ambient air quality has aroused widespread concern. “China’s Environmental Status Bulletin 2015” shows that more than 70 prefecture-level cities of the Beijing-Tianjin-Hebei Region had 1710 severe and above pollution days (times) and issued 154 heavy pollution weather warnings. Only 73 out of 338 prefecture-level cities reached the ambient air quality standards, while 265 of the cities, accounting for 78.4% of the total, failed to meet the urban environmental air quality standards. In the ranking of the Environmental Performance Index Report (2016) published by Yale University, China’s overall air quality ranked second last in the world, only slightly better than that of Bangladesh. In practice, under the industrial-driven growth model, air pollution is mainly due to energy consumption [1,2]. Air quality problems are very prominent in China’s Jiangsu Province, which is a major province in terms of its economy and its energy consumption. In 2015, Jiangsu Province’s GDP reached 701.168 billion Yuan and the total energy consumption reached 302.21 million tons of standard coal. In the period of “The Twelfth Five-Year Development Plan”, a 3.23% average annual growth rate of energy consumption in Jiangsu contributed to an average annual economic growth of 9.6%. “The Environmental Status Bulletin of Jiangsu (2012–2015)” points out that 13 provincial cities of Jiangsu did not reach the second level of national air quality standards in 2012–2015. From the perspective of policies, Jiangsu Province began to implement the “two steps of reduction, six steps of governance and three steps of improvement action (‘236’ Action)” at the end of 2016. “Two steps of reduction” aims to reduce the total coal consumption and backward production capacity of chemical industry into a key account. Specifically, “six steps of governance” focuses on the management of the water environment in Taihu Lake in terms of household refuse, black smelly water, livestock pollution, volatile organic pollutants and environmental hazards. “Three steps of improvement action” aims to enhance the level of ecological protection, environmental economic policy control and environmental supervision and law enforcement. “236 Action” not only points out that the problem of supply side is at the root of environmental problems but also emphasizes the importance of structural reform, addressing improvement of both industrial structure and energy consumption structure. In addition, it particularly points out that the focus of supply-side structural reform in the energy sector helps related stakeholders to improve energy efficiency.
From the perspective of research, many scholars have paid considerable attention to air quality problems. Amegah and Agyei-Mensah [3] have pointed out that the deterioration of air quality problems is becoming increasingly serious. Many factors influence air quality; these include natural factors, economic factors, energy factors and social factors [4,5,6,7]. Air pollution has not only affected our environmental climate but also endangers plants and human health [8,9,10]. In addition, it should be noted that understanding the cause of air quality deterioration is the first step in improving air quality effectively. Given that, most scholars have explored the relationship between energy consumption and air quality (the main emissions) from the perspective of total energy consumption and consumption structure. In terms of total energy consumption, based on data from India, Indonesia, Brazil and China from 1970 to 2012, Alam et al. [11] used the methods of the Autoregressive Distributed Lag () boundary test to show that energy consumption has boosted carbon dioxide emissions. Lun et al. [12] also believe that energy consumption is the major contributor to carbon emissions. In addition, in a study of the correlations among energy consumption, air pollution and other related variables in Pakistan in 1975–2012, Khan et al. [13] have proposed that there is a significant positive correlation and one-way causal relationship, in both the short and the long term, between energy consumption and air pollution. Similar conclusions have also been obtained by other researches, such as Pan et al. [14], Sharmina et al. [15], Song et al. [16], Wang et al. [17] and Nasreen et al. [18]. In addition, from the perspective of structure, Yang et al. [19] used the logarithmic mean Divisia index () method to confirm that Chinese energy consumption, energy structure and processing technology affects sulfur dioxide levels and thus, have proposed that controlling energy consumption and optimizing energy structure will be the most effective method for sulfur dioxide reduction. Zhu et al. [20] analyzed the dynamic relationship between the main air pollutants and nine main kinds of energy consumption factors in Beijing based on the dynamic matrix analysis. They found that energy consumption structure had a significant impact on air quality and that different types of energy consumption factors affecting air quality vary in different directions. Mai et al. [21] have claimed that, although coal-based energy consumption structure brought economic benefits to the related regions in China, it was also the main source of air pollutants. Ru [22], Wu et al. [23] and Tsao et al. [24] have all emphasized that optimizing energy consumption structure may have an important effect in improving air quality. Considering the measures for improving air quality, Wang [25] has proposed that we should control energy consumption to solve environmental pollution issues, given the significant correlation between energy consumption and environmental pollution problems. Alvarez-Herranz et al. [26] have pointed out that higher energy demand leads to a larger share of fossil sources in the energy mix, thereby increasing greenhouse gas () emissions. This study has also confirmed the positive effect of energy innovation on environmental pollution. It has been noted that renewable energy sources help to improve air quality. Both Borrego et al. [27] and Martinez [28] have found that advanced technology and plans, in terms of monitoring and assessment, help improve air quality. In addition, some scholars have proposed that air quality could be improved effectively through a series of measures, such as industrial structure optimization, energy structure improvement, technological progress, environmental protection investment increase and energy-saving [29,30,31,32,33,34].
In summary, most studies have confirmed the relationship between energy consumption and air quality and have primarily focused on general analysis of pollutant emissions and energy structure. This provides some research ideas and reference directions for future scholars and lays down a certain theoretical foundation for further discussion on air quality improvement. However, the paths by which energy consumption has affected air quality have received less research attention. Moreover, in China, scholars tend to focus on the impact of consumption of one or more energy sources on some air pollution indicators and cannot grasp the overall relationship between the two. More importantly, most research is aimed at the average level within a sample interval and fails to consider the effect of policy determinants. Therefore, from the perspective of energy consumption, this paper analyzes the mechanism underlying the effect of energy consumption on air quality, based on the existing theoretical foundation and explores the coupling relationship between energy consumption and air quality in Jiangsu Province, in addition to measuring comprehensively how the former affects the latter. Furthermore, this study uses the method of Regression Discontinuity Design to investigate how related policies influence the relationship between energy consumption and air quality and attempts to provide a reference for the reasonable policy establishment of air quality improvement.
Section 2 of this paper analyzes the mechanism of the impact of energy consumption on air quality. Section 3 determines the coupling relationship between energy consumption and air quality of Jiangsu Province. Section 4 and Section 5 provide empirical analysis of how energy consumption affects air quality, in addition to the influence of relevant policies on the relationship between energy consumption and air quality. Conclusions are given in Section 6.
2. Impact Mechanism of Energy Consumption on Air Quality
Based on the previous studies, the factors causing pollutant emissions can be divided into direct and indirect factors. The former mainly refers to energy-related factors, while the latter refers to socioeconomic factors [35]. Regarding the direct factors, this study mainly examines the impact of these factors on air quality and analyzes the improvement paths of air quality. This relationship is shown in Figure 1.
In the system of “Energy-Economy-Air quality”, energy is the driving force of economic growth; meanwhile, energy consumption can lead to air quality deterioration and damage economic sustainable development. In their study of the three main ways by which economic growth affects the environment, Grossman and Krueger [36] concluded that the impact of energy consumption on air quality is a comprehensive embodiment of three effects: scale effect, structure effect and technology effect. In respects of scale effect, economic activities inevitably lead to pollutant emissions and the structure of the pollutants is always changing. Notably, economic growth requires increased input, which will increase the usage of resources and thus could lead to more serious pollutant emissions and bring about deterioration of the quality of the environment. From an economic point of view, energy use has played an important role in promoting regional economic development. With the rapid development of economy, our social economic system had burned more energy to meet our daily needs, which inevitably brought about a series of issues in terms of ecology destroy and environment pollution. Therefore, the influence of energy consumption resulted from anthropogenic activities on air quality would become more prominent.
With respect to the structure effect, input and output structure changes as the economy improves. As the input and output structure improves, the level of emissions per unit of output will drop and the quality of the environment will improve. According to the framework of this study, structure mainly includes industry structure and energy consumption structure. Many scholars have confirmed the positive correlation between industrial structure and air quality, specifically, that industrial structure optimization can improve air quality. Most researchers [37,38,39] have pointed out that industries’ proportion of high pollution and high energy consumption in the economic structure is too high, mainly increasing the severity of fog and haze. Industrial structure, which mainly affects air quality through “three wastes” (waste water, waste gas and solid wastes) is caused by pollution in industrial production. Air quality has a constraint on industrial structure, which was known as resource constraints, pollutant-producing constraints, and economic constraints [40]. Notably, As Wang’s study only considers COD and SO2 emissions, his definition of pollutant-producing constraints mainly refers to the emission of COD, SO2, waste water and waste gas emissions, whereby these emissions cannot exceed the total emissions of COD, SO2, waste water and waste gas in a local area [40]. Moreover, energy consumption structure has a direct impact on pollutant emissions and air quality. Scholars have also formed a unified understanding of this aspect. Also, the large consumption of fossil energy including coal, oil and natural gas had caused serious harm to our environment since industrial revolution.
With respect to technology effects, technological progress affects air quality in two ways. On the one hand, assuming that other factors remain the same, technological progress can boost productivity and improve resource efficiency, thereby reducing air quality pollution. On the other hand, effective reduction of emissions per unit of output and improvement of air quality can be achieved and clean technology can develop and replace dirty technology continuously, in addition to achieving cyclic utilization of resources.
Given the situation in China, the coal-dominated energy consumption structure will be hard to change in a short time; the proportion of coal used for primary energy consumption has been around 70% for a long time. The emission of pollutants, especially through coal combustion of fossil fuel combustion, has directly led to air quality deterioration. Additionally, social economic systems supported by air environmental resources rely on the scale of energy consumption [2]. The contradiction between the environment and resources’ utilization is formed in the process of economic development. Thus, we should curtail energy use and reduce pollutant emissions from the perspective of total energy consumption and energy structure. Coordinated development of energy and the environment can be promoted by several means, including policy, technology, management, environmental regulation, market mechanism and investment in pollution abatement [41] and thus, the related stakeholders can promote sustainable development of society and economy. Overall, the scale effect deteriorates air quality, whereas structural optimization and technical improvements enhance air quality. Therefore, the impact of energy consumption on air quality depends on the interplay among different effects. Conversely, the constraints of air quality on energy activities are becoming more and more prominent [2]. This also highlights the significance of this study.
3. Decoupling the Relationship between Energy Consumption and Air Quality
The World Bank and the Organization for Economic Cooperation and Development have presented the concept of “decoupling”. Although their descriptions are different, the nature is the same. The environment is harmed by the consumption of fossil fuels and ecological deterioration in the process of economic growth and wealth accumulation in the industrialized age. Thus, the aim of decoupling is to break the coupling relationship between environmental hazards (including energy consumption and ecological pollution) and economic growth and reduce the impact on the environment. According to the decoupling theory, absolute decoupling describes a situation when carbon dioxide emissions are declining while energy consumption is increasing continuously. If the rate of reduction of carbon dioxide emissions is greater than the rate of reduction of energy consumption, this can be regarded as relative decoupling; moreover, if the rate of reduction of carbon dioxide emissions is nearly the same with the rate of reduction of energy consumption, the two are not decoupled [42].
Based on the above analysis, we believe that, if energy consumption and air quality are in a relative decoupling situation, it is meaningful to study air quality from the perspective of energy consumption [42]. It is recognized that controlling the growth of energy consumption can effectively improve air quality. Therefore, we first try to determine the decoupling relationship between energy consumption and air quality in Jiangsu Province. According to the definition of decoupling, the decoupling index can be expressed as Equation (1).
where is the ith decoupling index of air quality ( and represents four quarters in a year), is the ith energy consumption index and is the ith air quality index. The air quality index here is an index calculated by the air quality index value based on . For example, is in denotes the energy consumption index of divided by . is the air quality index value of divided by . It is noted that the air quality index (), as described in the following definition of air quality in Section 4.2.1, is a dimensionless index that quantitatively describes the air quality and is different from here. The sample interval of this paper is –, so energy consumption and air quality of is taken as the base period to calculate and . Decoupling coefficients between energy consumption and air quality of Jiangsu during 2006–2015 are shown in Figure 2.
Figure 2 shows that decoupling coefficients between energy consumption and air quality in Jiangsu are in 0–1, namely, and the rate of air quality deterioration is exceeding the energy consumption, which means that the relationship between energy consumption and air quality in Jiangsu Province is in the situation of relative decoupling. This also shows that it is practically significant to research the impact of energy consumption on air quality in Jiangsu Province.
4. Models and Data
4.1. Models
The most classic research on the relationship between economic development and environmental quality is the Environmental Kuznets Curve () [43]. Although there are some studies, for instance, Arrow et al. [44] had criticized the theory but the fundamental basis regarding the theory was not affected and thus the approach had received considerable attention in academic research. Actually, many scholars have also extended the EKC theory according to economic practice. This paper attempts to explore the relationship between energy consumption and air quality. We use air quality index and to denote the general environmental quality and income, respectively and then construct a general model of economic aggregate and air quality, which can be shown as Equation (2):
where is the random disturbance term. Further, we estimate model (2) based on the (Data sources are shown in Table 1). The result reflected that the relationship between the economic aggregate and air quality in Jiangsu Province, namely, it showed a U-shaped curve (Since the third item of does not pass the significance test, it is eliminated and a model with quadratic relations between them is estimated and we get α0, α1 and α2 are 32.4821, −6.3212 and 0.3538, respectively. The corresponding T values are 2.2867, −2.0357 and 2.0887, respectively.). Therefore, the general relationship with quadratic relations can be described as model (3).
where is the random disturbance term. Moreover, this paper attempts to use to substitute in Equation (3) to investigate the relationship between energy consumption and air quality. Therefore, we firstly need to determine the relationship between and . According to the scholars by Jiang et al. [45], the linear relationship between them had been fully discussed and thus this method had been employed here (With estimation, we get the relationship between and , as . The values of the constant term and the first term are −4.8217 and 10.5967, respectively; the value is 112.1910. The equation passes significance tests.). Notably, the regression analysis regarding the relationship between and performed in this paper primarily was used to judge the curve shape, rather than explore the coefficient between them. Similarly, by substituting the relationship between the two into Equation (3) (Substituting the relationship between the two into Equation (3) we get: .), a basic model with quadratic relations used to explore the relationship between energy consumption and air quality of Jiangsu Province can be described as follows:
where is the random disturbance variable. is a constant term. , is the “elastic coefficient”, whose essence is the effect (intensity) of energy consumption, the square of energy consumption on air quality. If , there is a “pulling effect” of energy consumption on the air quality index-specifically, air quality deteriorates; while, if , there is “inhibition effect” of energy consumption on air quality index, specifically, air quality optimizes.
Based on the theoretical analysis of this paper, the path variables, such as structural and technical factors, as control variables should be considered added into Equation (4). Notably, structure variables include both industrial structure and energy consumption structure; for the technology variable, taking the research of Wu et al. [46] and Zhou [47] as reference, this paper uses energy efficiency as a substitution variable. We then get Equation (5):
where , and represent industrial structure, energy efficiency and energy consumption structure, respectively. is a random disturbance. denotes the “elastic coefficient”. It is important to point out that the substitution variable of the industrial structure and energy consumption structure in this paper is the proportion of the tertiary industry account for GDP and the proportion of the coal consumption account for total energy consumption, respectively. Thus, the greater the , the more optimized the industrial structure, while, the smaller the , the more optimized is the energy structure. Based on this, if , industrial structure optimization will result in an increase of the air quality index; specifically, air quality deteriorates. However, the opposite is true for . The situation is the same in Equations (6)–(8).
Only with the influence of government intervention, environmental regulation, technology diffusion and other factors is likely to appear as an inverted U-shaped curve [48]. In addition, government environmental policies impact the environment–income relations [49]. In view of that, this paper attempts to further investigate the impact of policy variables on the relationship between energy consumption and air quality based on model (5). For the estimation method, as Regression Discontinuity () assumes that samples around breakpoints are randomly distributed, specifically, that the other characteristics of these samples are the same and without significant difference, this method can solve the problem of omitted variables in the empirical process [50]. Therefore, has a great advantage in policy evaluation and causal inference. Thus, this paper further explores the role of related policies with . Specifically, if the implementation of policies is the task that must be strictly taken for the affected objects, Deterministic Regression Discontinuity () can be used. However, because of the influence of geographical factors and policy implementation, the above conditions may not be met at a certain period. Therefore, Fuzzy Regression Discontinuity () is further used in this paper [51]. could be achieved by Two Stage Least Squares (), equivalent to instrumental variable regression [52,53]. According to the fundamental principle of the , the regression equation of the first stage can be expressed as follows:
where is a policy factor. and are the random disturbance variables. Also, (6) and (7) are the reduced equations of endogenous variables. The parameter values in these equations could be estimated by the method of the OLS, which would be substituted as the corresponding endogenous variables. Moreover, by linearizing the non-linear equation, the OLS could be employed here due to have an advantage in solving linear equations. Accordingly, assuming , substituting into the Equation (5) and then we can obtain the structural equation of air quality as (8), where is the random disturbance variable.
It is particularly noteworthy that we need to estimate coefficients in Equation (8) based on the method of the OLS, namely, the will be used here, which enviably brings about the endogenous test for instrumental variables and the corresponding results. For that, two explanations need to be given here. Firstly, according to the mentioned above, the mission of the here only generate a tool variable in the first stage. However, using the , the consistent estimator for structure parameters would be obtained based on the method of instrumental variables in the second stage. If instrumental variable of each endogenous variable can be selected in a predetermined variable, the most pervasive forms of instrumental variable would be linear combination from all predetermined variables in this model. Therefore, the reduced equations of endogenous variables can be used as the instrumental variable based on the . Secondly, the parametric estimations from the reduced equations in the first stage had been deem as instrumental variables, which obviously had solved its uniqueness and rationality, namely, it also means that the correlation between instrumental variables and the corresponding endogenous variables is the strongest. Thus, the instrumental variables and the results of endogeneity test is not required here.
4.2. Data
4.2.1. Variables
There are six variables used in this paper. They are total energy consumption, air quality, economic aggregate, industrial structure, energy efficiency and energy consumption structure. A description of related variables is shown in Table 1.
4.2.2. Data Sources
(1) Total energy consumption (). Since there are no statistical data for quarterly energy consumption of Jiangsu Province, thus, we need to transform yearly energy consumption data into quarterly data. According to the study by Xu [54], the method regarding how to transform could be divided into three types, such as the theory of Denton proportion, the Bassie method and Arima model-based method. However, limitation by data availability, ratio connection method usually is widely used by a number of researchers, namely, industrial added value is employed to change yearly energy consumption data into quarterly data. Actually, on the one hand, linear relationship between energy consumption and GDP did exist, which had been verified as mentioned above. On the other hand, under the economic growth pattern driven by the secondary industry, total energy consumption in Jiangsu Province were primarily from industrial sector [55]. Therefore, we take the proportion of the quarterly industrial added value accounted for the annual GDP in Jiangsu as weight and change yearly energy consumption data into quarterly data. It should be note that, although this method in our paper would bring about the loss of information in data, it will not alter the global changing trend of the time-series data to a large extent. Also, considering that total energy consumption in Jiangsu Province are significant related to that of the whole China [56], therefore, the quarterly industrial added value of Jiangsu from 2006 to 2015 is converted from yearly and quarterly data of the industrial added value of China and yearly data of all the industrial added value of Jiangsu. Yearly data for total energy consumption of Jiangsu Province from 2006 to 2014 are from the “Jiangsu Statistical Yearbook (2007–2015)”. Data for 2015 come from the website of the Jiangsu provincial economic and Information Committee (http://www.jseic.gov.cn/index.html). In addition, yearly and quarterly data for the industrial added value of China from 2006 to 2015 are from the “Statistical Communique of National Economic and Social Development (2006–2015)”. Yearly data of all the industrial added value of Jiangsu in 2006–2015 are from the “Statistical Communique of Jiangsu Province on Economic and Social Development (2006–2015)”.
(2) Air quality (). The level of air quality is judged by the concentration of pollutants in the air. In general, the air pollution index () can be used to evaluate the air quality situation. The main pollutants involved in evaluation of air quality are inhalable particles (PM10), sulfur dioxide () and nitrogen dioxide (). The larger the index, the more serious the air pollution. Ambient Air Quality Standards published by the State Council in the first half of 2012 point out that the air quality index () substitutes the original air pollution index () to describe the air quality. Compared with , adds three pollutants: fine particulate matter (PM2.5), ozone () and carbon monoxide (). Notably, our paper primarily focused on exploring the change trend of air pollution in Jiangsu, rather than analyzed the numerical value of the two indices. Based on this, we take to measure in 2006–2012 and take to in 2014–2015. Generally, the higher the value of the or , the worse the air quality. This needs further explanation, as follows:
First, as there are no statistical data for and from 15 January 2013 to 31 December 2013, the average of the air quality indices for the first, second, third and fourth quarters of 2014 and 2015 is taken as an alternative to the air quality index for each quarter of 2013.
Second, because the data cannot be obtained for some cities, we take it as a default value in this paper. Therefore, we calculate the average of the annual concentration of each quarter in Nanjing, Wuxi, Xuzhou, Changzhou, Suzhou, Nantong, Lianyungang, Huai’an, Yancheng, Yangzhou, Zhenjiang, Taizhou and Suqian when calculating the 2014–2015 quarterly air quality index.
Third, since the air quality is difficult to measure with a comprehensive indicator, this paper argues that both the air pollution index and the air quality index can represent air quality and does not consider converting of the two indices.
Fourth, this paper only tries to study the trend of change of air quality pollution and does not focus on investigating the specific numerical situation. Thus, we take the average number of quarterly daily air quality indices as a substitution variable of air quality. There is no unit. These data sets are from the Ministry of Environmental Protection of the PRC of China.
(3) Economic aggregate (. Quarterly is calculated by regional (aggregate-value) in Jiangsu Province. Regional (aggregate-value) comes from the National Bureau of Statistics of China. The unit is million yuan.
(4) Industrial structure (). We take the proportion of tertiary industry added value account for to measure industrial structure. Limited by data availability, parts of previous studies thought tertiary industrial structure in Jiangsu is similar to tertiary industry’s added value of China in a short term [57,58]. Thus, quarterly data of tertiary industry’s added value of Jiangsu Province are calculated through yearly data of the proportion of the Jiangsu account for China by Quarterly data of tertiary industry’s added value of China. Quarterly data of tertiary industry’s added value of China come from the “Statistical Communique of National Economic and Social Development (2006–2015)”. Yearly data of Jiangsu and China come from the website of the National Bureau of Statistics of China (http://www.stats.gov.cn).
(5) Energy efficiency (). According to the definition of energy efficiency proposed by Wang et al. [59], the reciprocal of energy intensity is used in this paper and the “unit energy consumption of ” (/total energy consumption) is adopted as an indicator of overall energy efficiency. The unit is hundred million yuan/ten thousand tons of standard coal.
(6) Structure of energy consumption (). China’s energy resource endowment determines that the structure of energy consumption can only be taken as the main body of coal in a certain period of time. Therefore, the proportion of the coal consumption share of the total energy consumption is used as a substitution variable of energy structure [60]. Actually, previous studies found that certain relationship between coal consumption and regional GDP may exist in the process of economic development [61,62] and thus coal consumption share could be calculated based on that connection. Therefore, quarterly data of the coal consumption of Jiangsu are calculated through the proportion of the quarterly account for annual data by the yearly coal consumption of Jiangsu. The yearly data of coal consumption and of Jiangsu in 2006–2014 come from “National Bureau of Statistics of China” and the data for 2015 come from the “Statistical Communique of Jiangsu Province (2015)”.
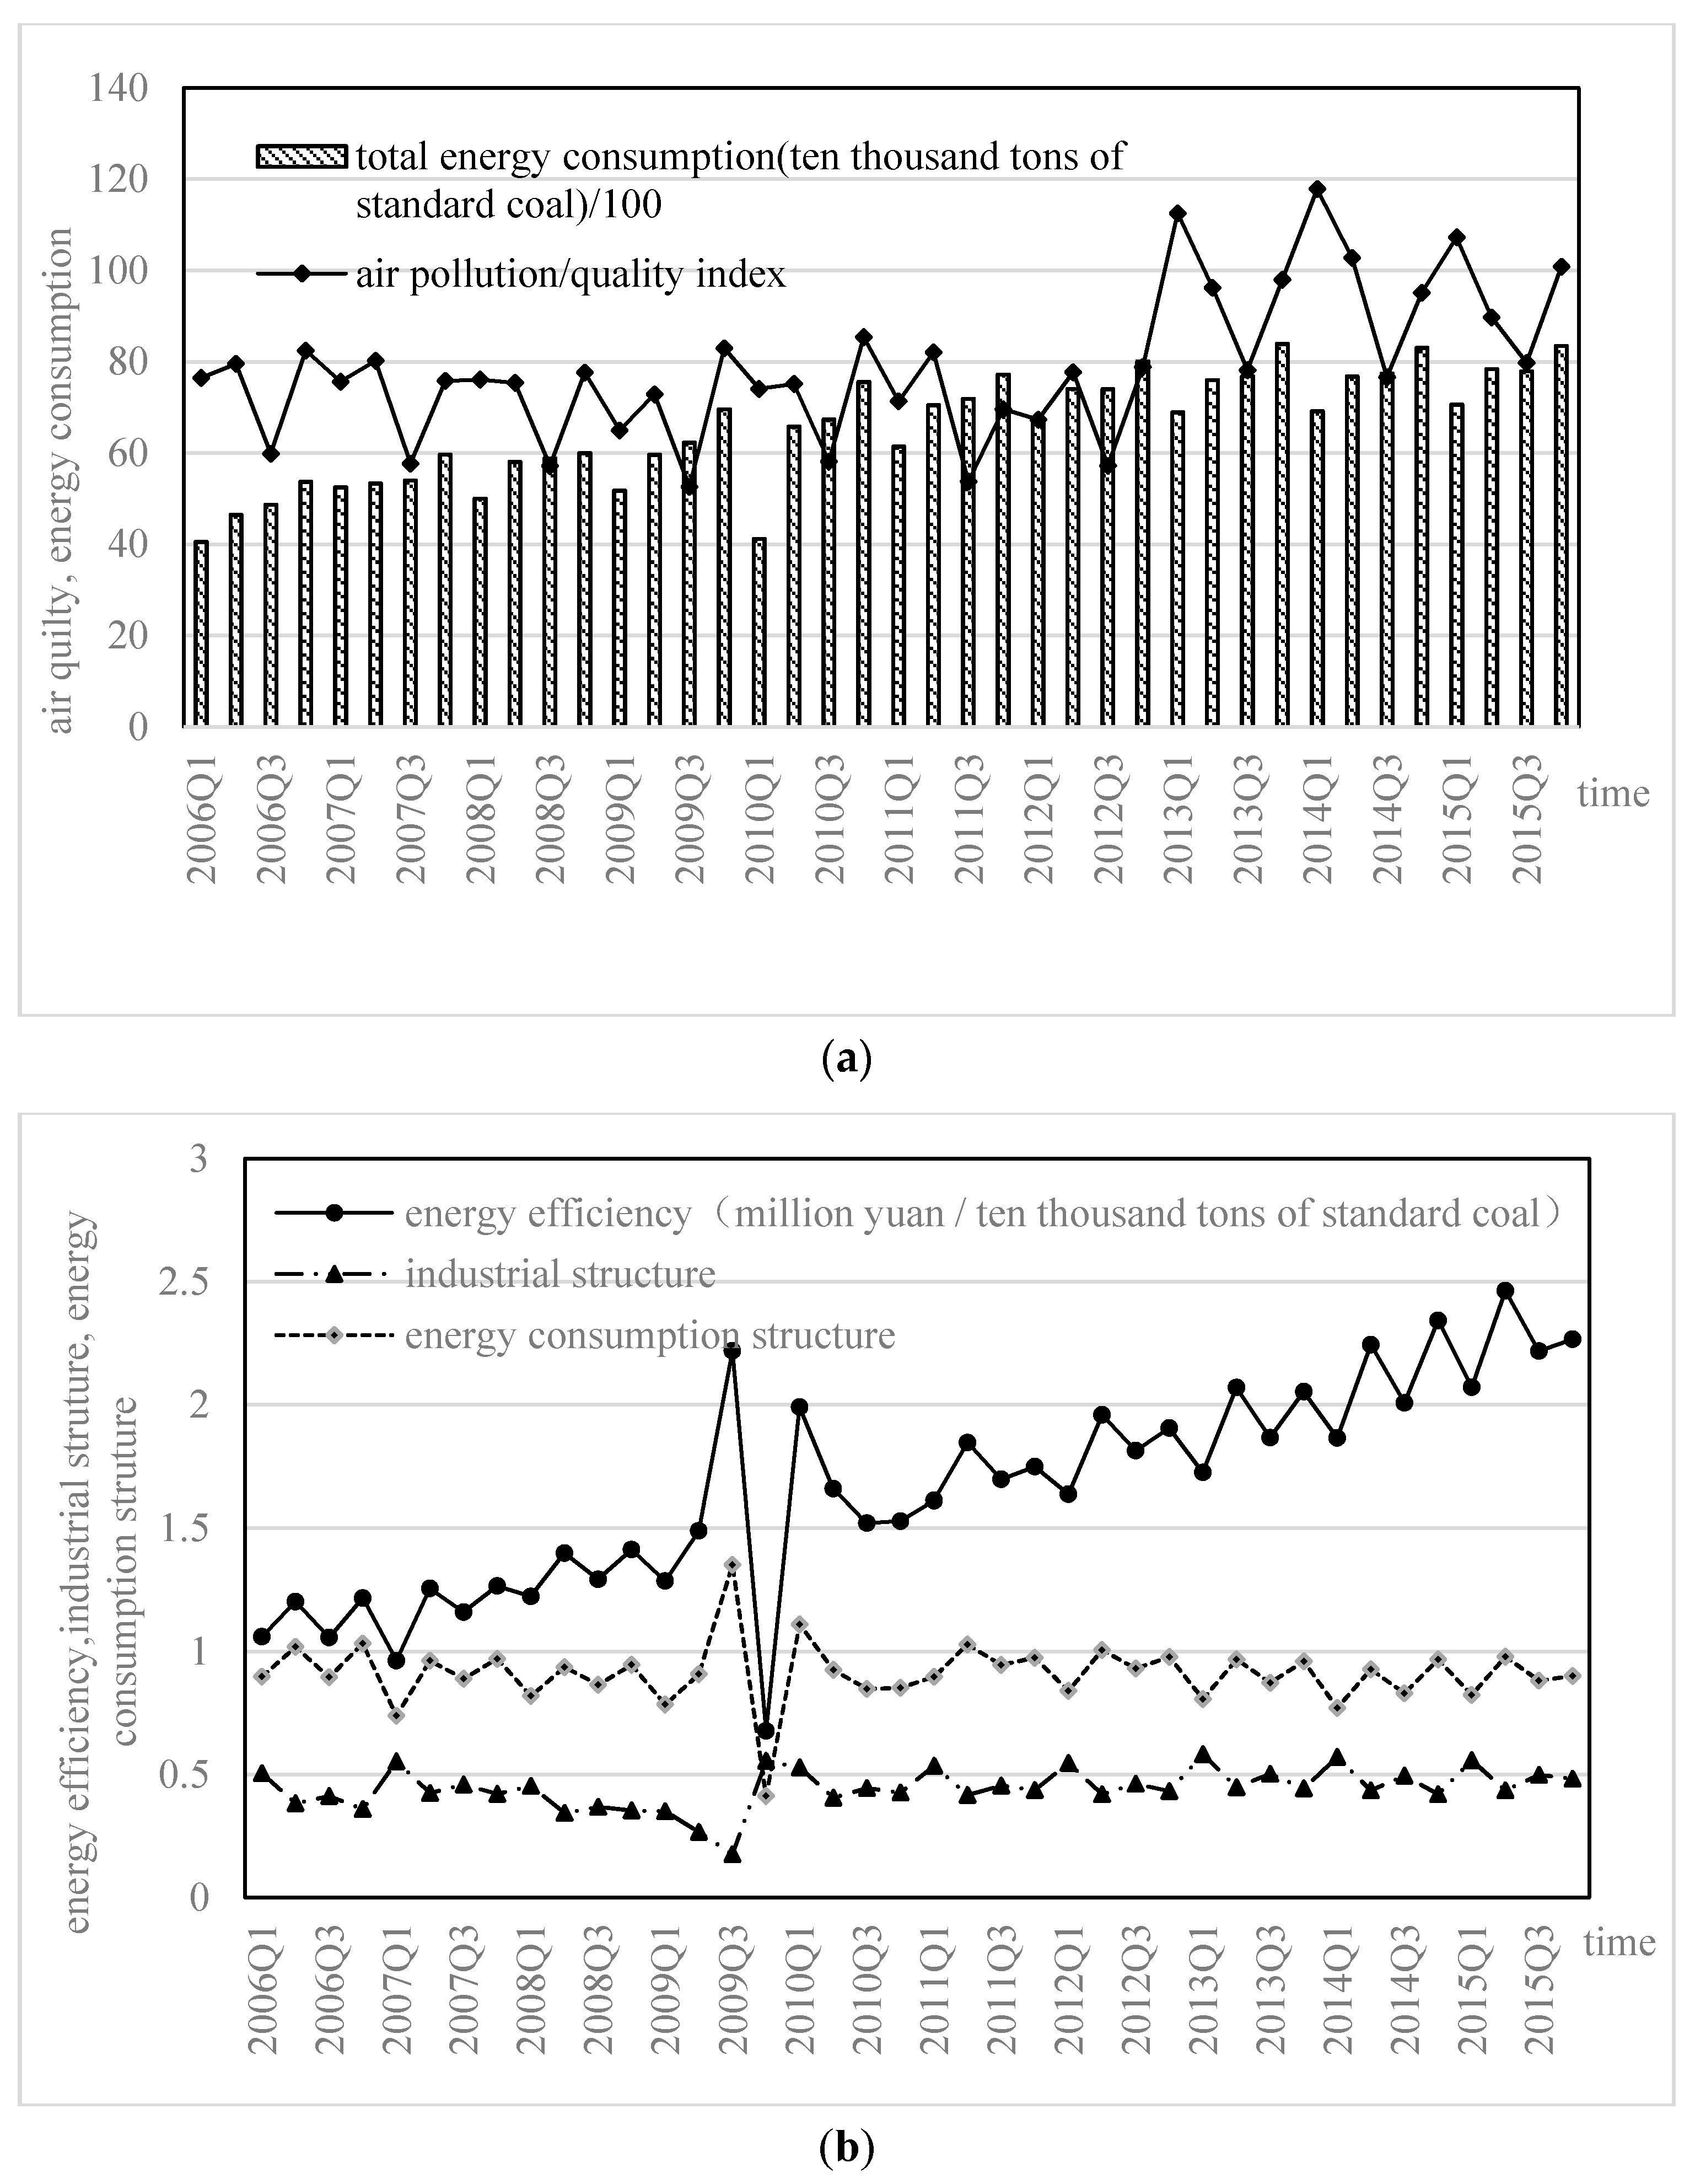
Changes of related variables in the sampled interval are given in Figure 3. To facilitate the observation of the sequence change, the total energy consumption in Figure 3a is divided by 102, based on the original sequence but it does not change the trend.
As displayed in Figure 3a,b, firstly, the air quality index, energy consumption, industrial structure and energy consumption structure in Jiangsu Province show a rising trend, although they are relatively flat from 2006–2015. Specifically, the air quality index remains basically the same in each quarter during 2006–2015 and the index for the third quarter is less than that in the others. In fact, the air quality may be better because temperature is more moderate in the third quarter than in the others, while the consumption of fossil, electricity, coal and other energy is relatively less. Overall, the air quality index of Jiangsu Province has increased significantly faster since 2013, which may be because the addition of PM2.5, and indicators made the description of air quality more accurate. Secondly, the total energy consumption increases year by year and the annual energy consumption increases with the increase of the quarter. Quarterly energy efficiency in each year is in the state of “rising–falling–rising”, that is, compared to the first quarter, there is a rise in the second; besides, there is a fall in the third quarter over the second and there is a rise in the fourth quarter over the third. Changes in industrial structure are similar to energy efficiency. The range of fluctuations of energy consumption structure is 0.80–1.11, which is relatively steady overall. Changes of industrial structure and energy consumption structure have something in common; specifically, after the second quarter of 2010, both change more slowly than before. In fact, in “The Eleventh Five-Year Plan of Jiangsu” it is proposed to adhere to maintain the new road to industrialization, effectively change the mode of economic growth, speed up industrial restructuring and limit the development of high energy consumption industries. Based on this, “The Twelfth Five-Year Plan of Jiangsu” proposes to vigorously develop new energy, new materials, energy saving and environmental protection industries; improve resource utilization efficiency; and optimize the energy structure. Therefore, industrial structure and energy consumption structure do not change much.
5. Empirical Results and Analysis
5.1. General Model Estimates
We used the method to test whether the related sequences in model (5) are stationary. The results show that the values of , , , and are −2.8044, −10.6779, −6.7515, −6.0233 and −7.0031, respectively. The absolute value is higher than that at the critical value of 10% significance level and the sequences are all I (1). Furthermore, Johansen cointegration and a Granger causality test were performed based on differential sequences. The findings show that there is a long-term equilibrium relationship between energy consumption and air quality in Jiangsu Province, at the 1% confidence level and a two-way causal relationship, with a confidence level of 5%. Based on this, Table 2 shows the OLS estimation results of the model.
Notably, firstly, T-statistic is slightly significant, R-squared is very low in the estimation results reported in Table 2 but the F-statistic passes the test at the 5% significant level, which suggests that linear relationship between dependent variable and explanatory variable is significant on the whole and thus the estimated econometrics model is reliable.
Secondly, as for the possible reason regarding some explanatory variables with insignificant, there’re amounts of determinants affecting air quality. Our paper only selects explanatory variables from the perspective of energy consumption and thus the significant in terms of estimated results inevitably may be effected. Also, some explanatory variables have a lagging effect on air quality and our paper does not consider that. Thirdly, the study primarily focuses on investigating the influence of the related policies on air quality and exploring the relationship between energy consumption and air quality based on the method of regression discontinuity. While considering control variables, the significant in terms of the estimated model and the explanatory variables both have increased, which means that the impact of the related policies is very effective. Therefore, the regression results in Table 2 are reported here and thus the global relationship between energy consumption and air quality could be obtained based on this method.
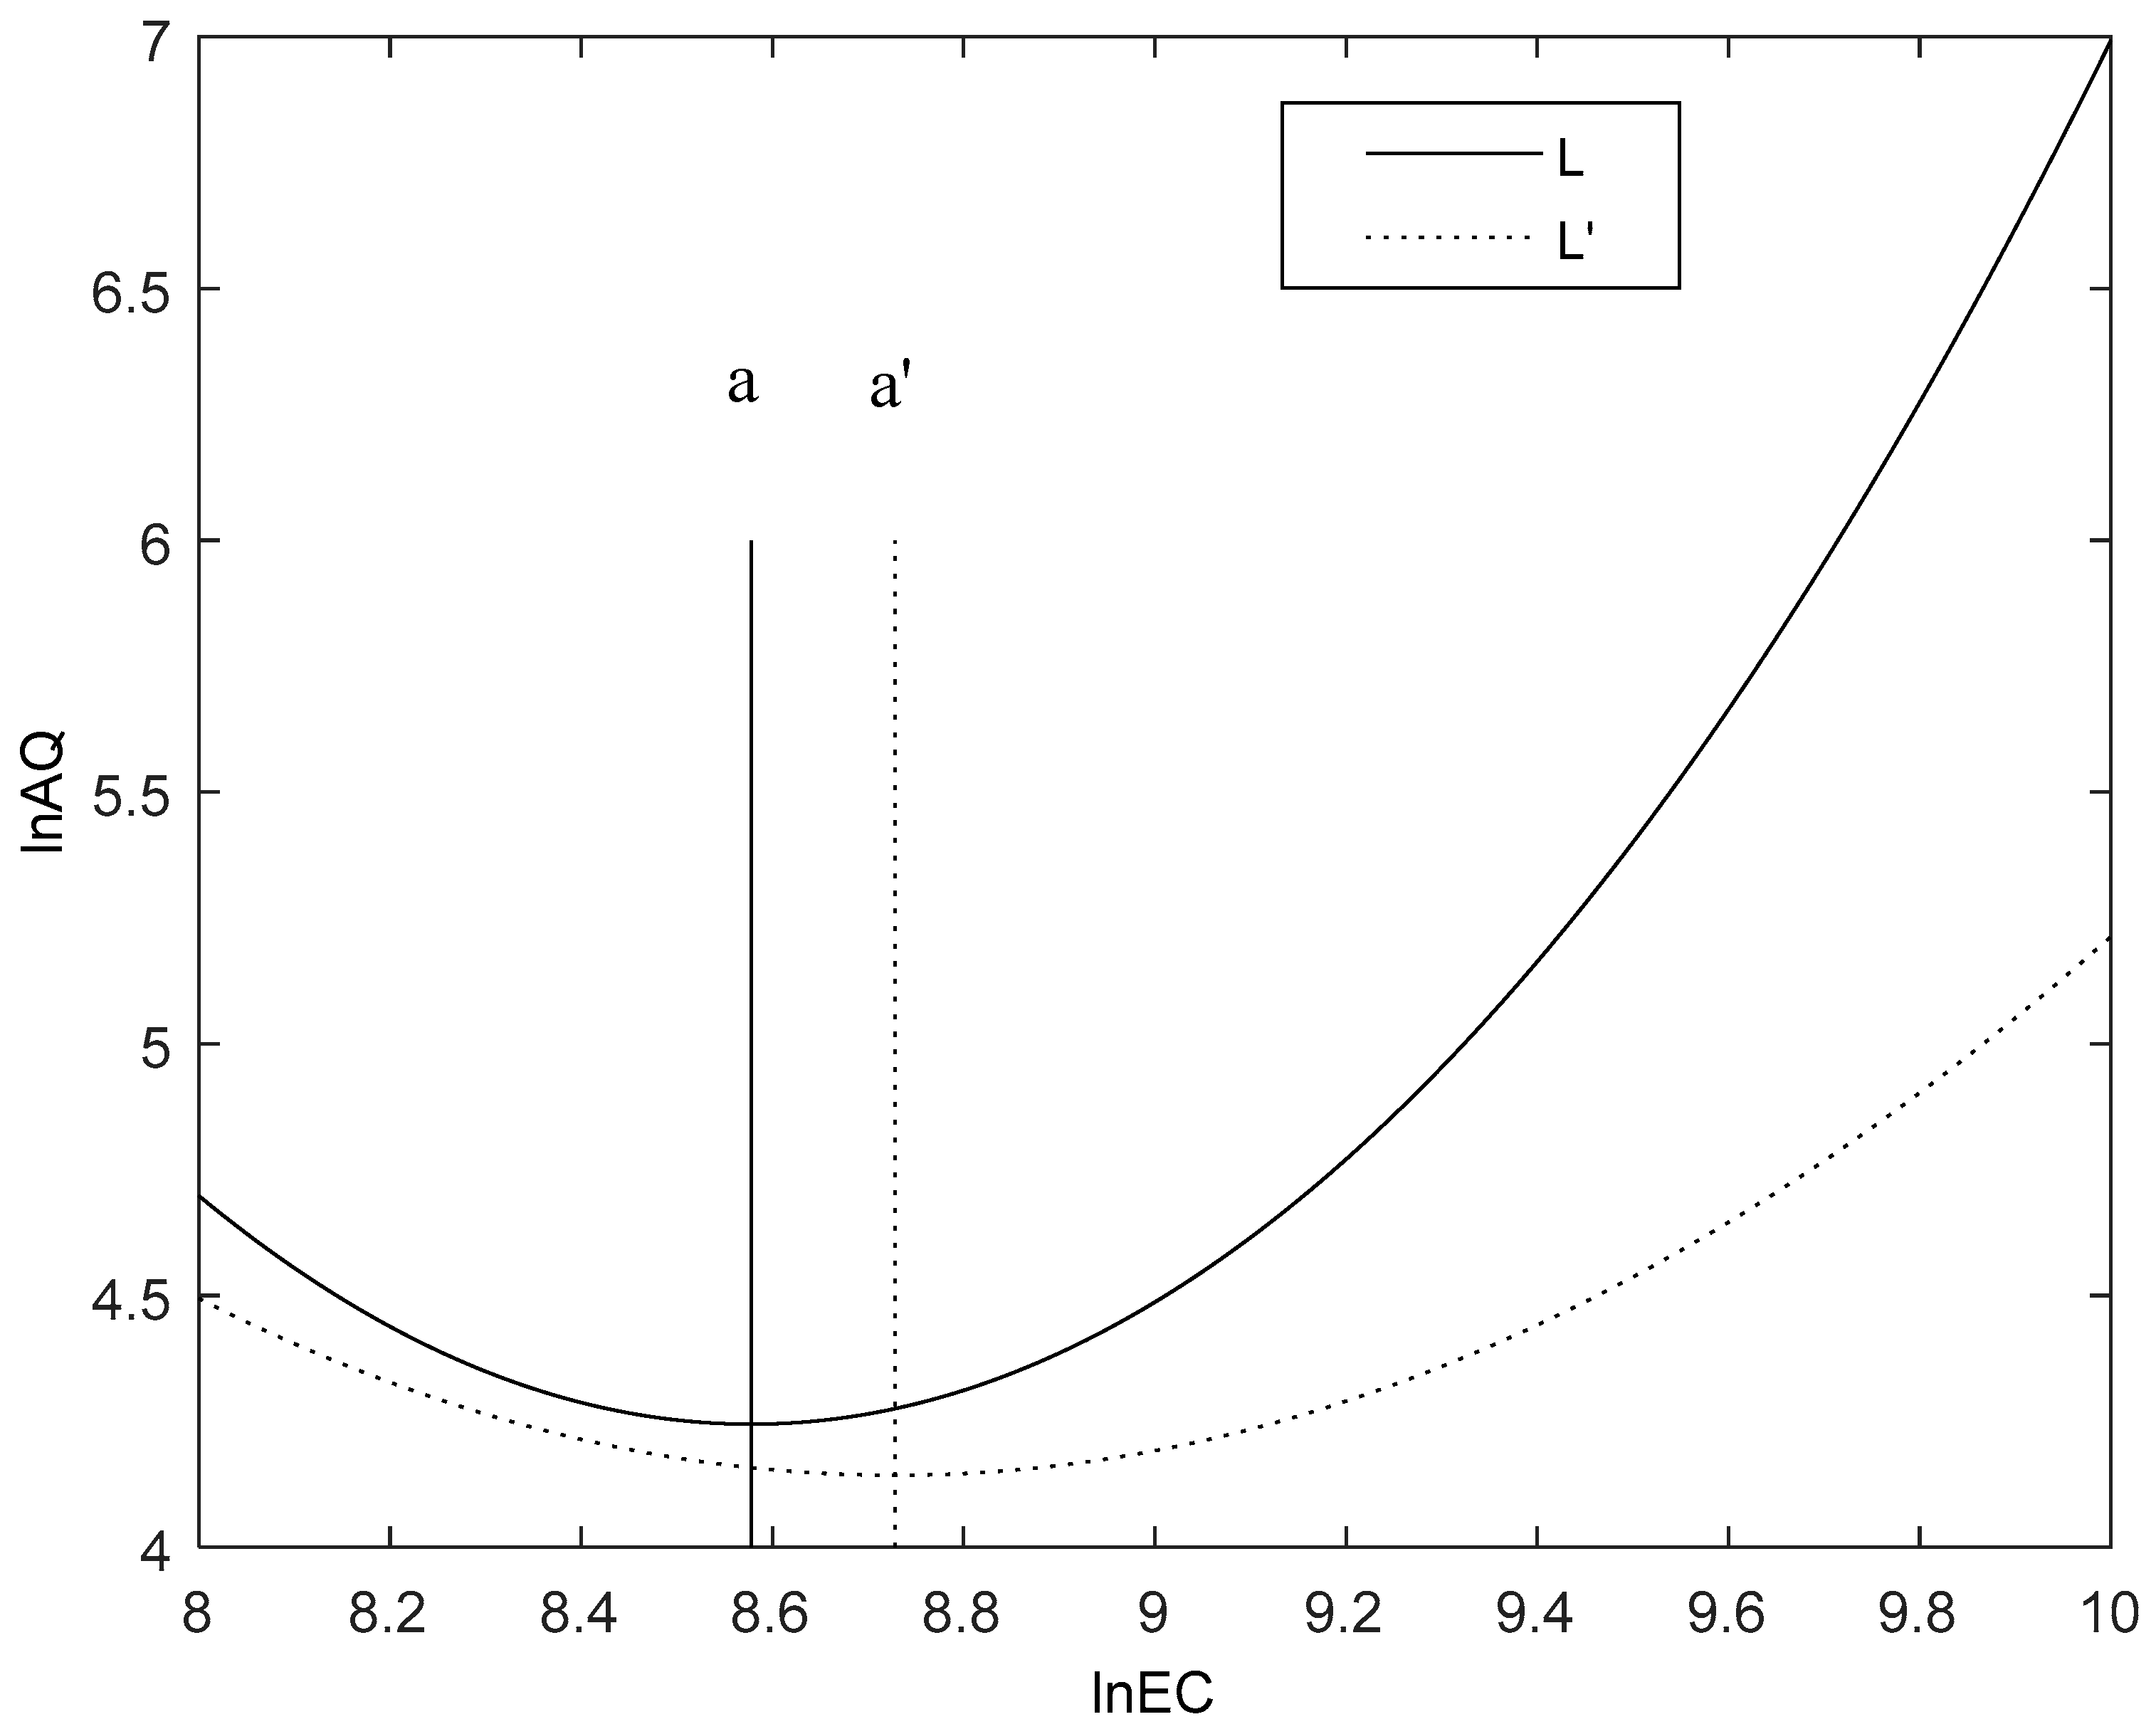
Further, based on the results of the fitting, we get the relationship between energy consumption and air quality, both with and without considering control variables in Jiangsu Province, as shown in Figure 4.
(1) There is a U-shaped Curve relationship between energy consumption and air quality in Jiangsu Province. Actually, the classic Environmental Kuznets Curve did illustrate that there exists the inverted U-shaped relationship between environmental quality and economic growth. However, due to the huge national differences among regions and industries, the Environmental Kuznets Curve usually shows a different shaped relationship like the inverted U-shaped, the N-shaped and the U-shaped. For instance, Dong et al. [63] found that there existed the U-shaped relationship between air pollution and GDP, which was consistent with our study here. Specifically, being one of the major provinces of economy and energy consumption, economic development of Jiangsu Province is extraordinarily fast from 2006 to 2015. In addition, the speed of economic growth is faster than that of environmental pollution, namely, with the development of regional economic in Jiangsu, the degree of environmental pollution decrease. Hereafter, along with the slowing of the regional economy, under the economic growth pattern driven by the secondary industry, the degree of environmental pollution increases significantly, namely, with the development of regional economic in Jiangsu, the degree of environmental pollution increase.
(2) Compared with the estimation results without control variables, (Estimation result of model (4) is, where the symmetry axis is , the value corresponds to the constant and the first and the second terms are 1.8687, −1.8191 and 1.8468 respectively. value is 4.4536. The equation passes the significant test.) the symmetry axis moves to the right from to ; namely, the total energy consumption at the inflection point is larger. This shows that industrial structure, energy consumption structure and energy efficiency can influence air quality. Gao et al. [64] and Li and Zeng [65] also found that the three variables can effectively influence air quality. This further affirms the rationality of related models in this paper. In addition, the opening of the U-shaped curve becomes larger, which indicates that the overall effect of energy consumption on air quality is gentler when considering control variables. Namely, on the left side of the symmetry axis of the U-shaped curve, with the increase of energy consumption, the air quality index decreases more slowly. In other words, the air quality optimization is slower. Meanwhile, on the right side of the symmetry axis, the speed of air pollution is slower as energy consumption increases. This indicates that the addition of control variables does not change the U-shaped relationship between energy consumption and air quality but it effectively influences the effect of energy consumption on air quality and the effect becomes smaller. At present, the relationship between energy consumption and air quality of Jiangsu Province is in the rising part of the U-shaped curve; namely, as energy consumption increases, air quality deteriorates, which proves the effectiveness of improving air quality through controlling energy consumption.
(3) When industrial structure, energy efficiency and energy consumption structure changes by 1%, the air quality index changes by 0.1904%, 0.3517% and −0.4480% respectively and the direction of effect is inconsistent with theoretical analyses by some scholars [21,60]. This reveals that the structure and efficiency paths do not have a significant effect on air quality improvement in Jiangsu Province in the sample interval. In fact, first, in terms of sequence characteristics, the range of fluctuations of industrial structure, energy consumption structure and energy efficiency of Jiangsu Province is modest; second, the impact of energy consumption on air quality is a comprehensive result of many factors, with the final effect depending on the interplay of all factors—thus, the effects of the path variables might be offset by the effects of other factors; third, the energy consumption structure is subject to resource endowment and the technology level cannot be optimized quickly in the short term—meanwhile, because of the rebound effect of technology, the improvement of energy efficiency is not conducive to energy saving and emissions’ reduction in the short term. These are mostly result in the insignificant effect of energy structure and energy efficiency on air quality; fourth, this result also reveals that there is still considerable room to improve air quality through taking full advantage of these paths.
5.2. Regression Discontinuity Design
5.2.1. Discontinuity Selection
Overall, we choose the Newey-West (NW) Kernel Estimation to determine the coefficient covariance matrix and then take the Unweighted-Max F (UDMax) of Bai-Perron Global L breaks vs. none to determine both the numbers and the location of discontinuity; the results are shown in Table 3.
As can be seen from Table 3, there are three discontinuities of the relationship between energy consumption and air quality of Jiangsu Province during 2006–2015; these are in 2007Q3, 2011Q3 and 2013Q1 respectively. We have mentioned that the statistical index of air quality changed from to from 2013. Therefore, we only consider the discontinuity during 2006–2012 in this paper. Thus, 2007Q3 and 2011Q3 are taken as discontinuities. The National Development and Reform Commission of China published “The Eleventh Five-Year of Energy Development Plan” (“The Eleventh Five-Year of Energy Development Plan” is issued by Chinese government in April 2007. This plan primarily proposed a national energy strategy on energy development objective, resources development and allocation and future direction of energy reform, which had been regarded as an action plan for China’s energy development in the future.) (hereinafter referred to as policy 1) on 10 April 2007 and Jiangsu Province disclosed “The Twelfth Five-Year Plan of Forestry Industry Development of Jiangsu Province” (According to “The Twelfth Five-Year Plan of Forestry Industry Development of the State Forestry Bureau” and “The Twelfth Five-Year Plan of National Economic and Social Development of Jiangsu Province”, Jiangsu Province formulated “The Twelfth Five-Year Plan of Forestry Industry Development” on 1 August 2011. The aim of this plan primarily was to construct green Jiangsu and accelerated the transformation of forestry development pattern. In general, this plan addressed the guiding thought, fundamental principle and objectives and layout for Jiangsu Province’s forestry development in the twelfth five-year plan.) (hereinafter referred to as policy 2) on 1 August 2011. It can be seen that the time of policy 1 is 2007Q2, which seems to be inconsistent with the discontinuity. In fact, on the one hand, this is because of the lag of policies, while, on the other hand, the related policies have a direct effect on energy consumption. Thus, we choose 2007Q3 as a discontinuity. In addition, the assessment index system of policy 2 consists of six categories of functional indicators and twenty one elements of indicators. The policy proposes to strengthen the management of forest resources, reduce the discharge of forestry, reduce energy consumption and improve energy efficiency. Thus, we choose the policy for the corresponding policy at the discontinuity of 2011Q3.
5.2.2. Local Average Treatment Effect of Policy Implementation
According to the analysis above, we use the method of regression discontinuity based on these quarterly data between 2006 and 2015 with total 40 sets, which could meet our research needs. The discontinuity should be observed visually before applying Regression Discontinuity. As shown in Figure 5, where , and , is the dividing line of air quality and energy consumption affected by policy 1 and policy 2, respectively. As shown in Figure 5a, the average value of air quality indicators at discontinuity is significantly reduced in terms of the impact of policy implementation on air quality. The intercept decreases from 75.6867 to 71.1955. This means that the local treatment of the effect of policy 1 implement to air quality is approximately −4.4911. The average value of the air quality index decreases significantly at discontinuity and the intercept decreases from 75.6867 to approximately 67.3923, which indicates that the local treatment effect of air quality under policy 2 is approximately −3.8032. In addition, Figure 5b shows that the impact of the two policies on energy consumption has also changed significantly at discontinuity. Air quality and energy consumption have obvious discontinuities, which affirms the existence of causality. We will discuss this in detail in our empirical research.
5.3. Estimation Results
We begin our calculation from the implementation of policy 1, taking the data from 2007Q3 and later as the treatment group and the data before 2007Q3 as the control group. In the regression discontinuity, a sample point cannot belong to both a treatment group and a control group [66,67]. Therefore, taking the work by Brolloet al. [68] as reference, we take the average of all the discontinuities to do the sample cutting. Assuming that the , , discontinuities are that the range of the treatment group near the discontinuity is (, ), the range of the control group is (, ). While the control group and the treatment group of the first and the last discontinuity can only be ensured to be equal to the corresponding treatment group and the control group. Using the definition of dummy variables by Liu et al. [69], we take and as dummy variables, representing “The Eleventh Five-Year Plan of Energy Development” and “The Twelfth Five-Year Plan of Forestry Development of Jiangsu Province”, respectively. Thus, since 2007Q3; otherwise, . Similarly, since 2011Q3; otherwise, . Based on this, models (6)–(8) are estimated and the results are given in Table 4.
(1) The regression results of Equation (6) show that policy 1, policy 2 and the combination of the two have a significant positive impact on energy consumption. When considering these two policies separately, the effects of policy 1 and policy 2 on energy consumption are 0.0273 and 0.1800 respectively. In fact, policy 1 aims at achieving energy conservation and environmental protection and an important part of policy 2 is the development of forestry strategic emerging industries. The empirical results show that the implementation of the two policies increases the energy consumption of Jiangsu Province and, when comprehensively considering the two policies, the impact on energy consumption increases by 0.0557 and 0.0193, respectively. This is because, on the one hand, the total energy consumption is caused by many factors and the effect of this policy on energy consumption is likely to be offset by the effects of other factors; on the other hand, as coal-based energy consumption structure is difficult to change in the short term, the policy lag is longer.
(2) The regression results of Equation (7) show that policy 1, policy 2 and the combination of the two have a negative significant impact on air quality. While considering these two policies separately, the effects of policy 1 and policy 2 on air quality are 0.2469 and 0.0234, respectively. One of the objectives for policy 1 is environmental protection and policy 2 stresses the need to accelerate the construction of the ecological culture system, which can improve air quality. The empirical results also confirm the effectiveness of the two policies. In addition, when considering these two policies comprehensively, improvement of the air quality is increased, reaching 0.2712 and 0.0866, respectively. This further emphasizes the importance of policy coordination.
(3) The impact of energy consumption on air quality is changed when the policy and control variables are considered. The relationship between energy consumption on air quality still takes the form of a U-shaped curve. When the policy and control variables are not taken into consideration, first, the symmetry axis moves to the right from to , which indicates that the total energy consumption increases when air quality is optimal and shows that the addition of policy and control variables can either reduce or offset the air quality deterioration caused by the increase of energy consumption. Second, the opening of the U-shaped curve becomes smaller, which indicates that the air quality affected by energy consumption is more significant when policy and control variables are considered.
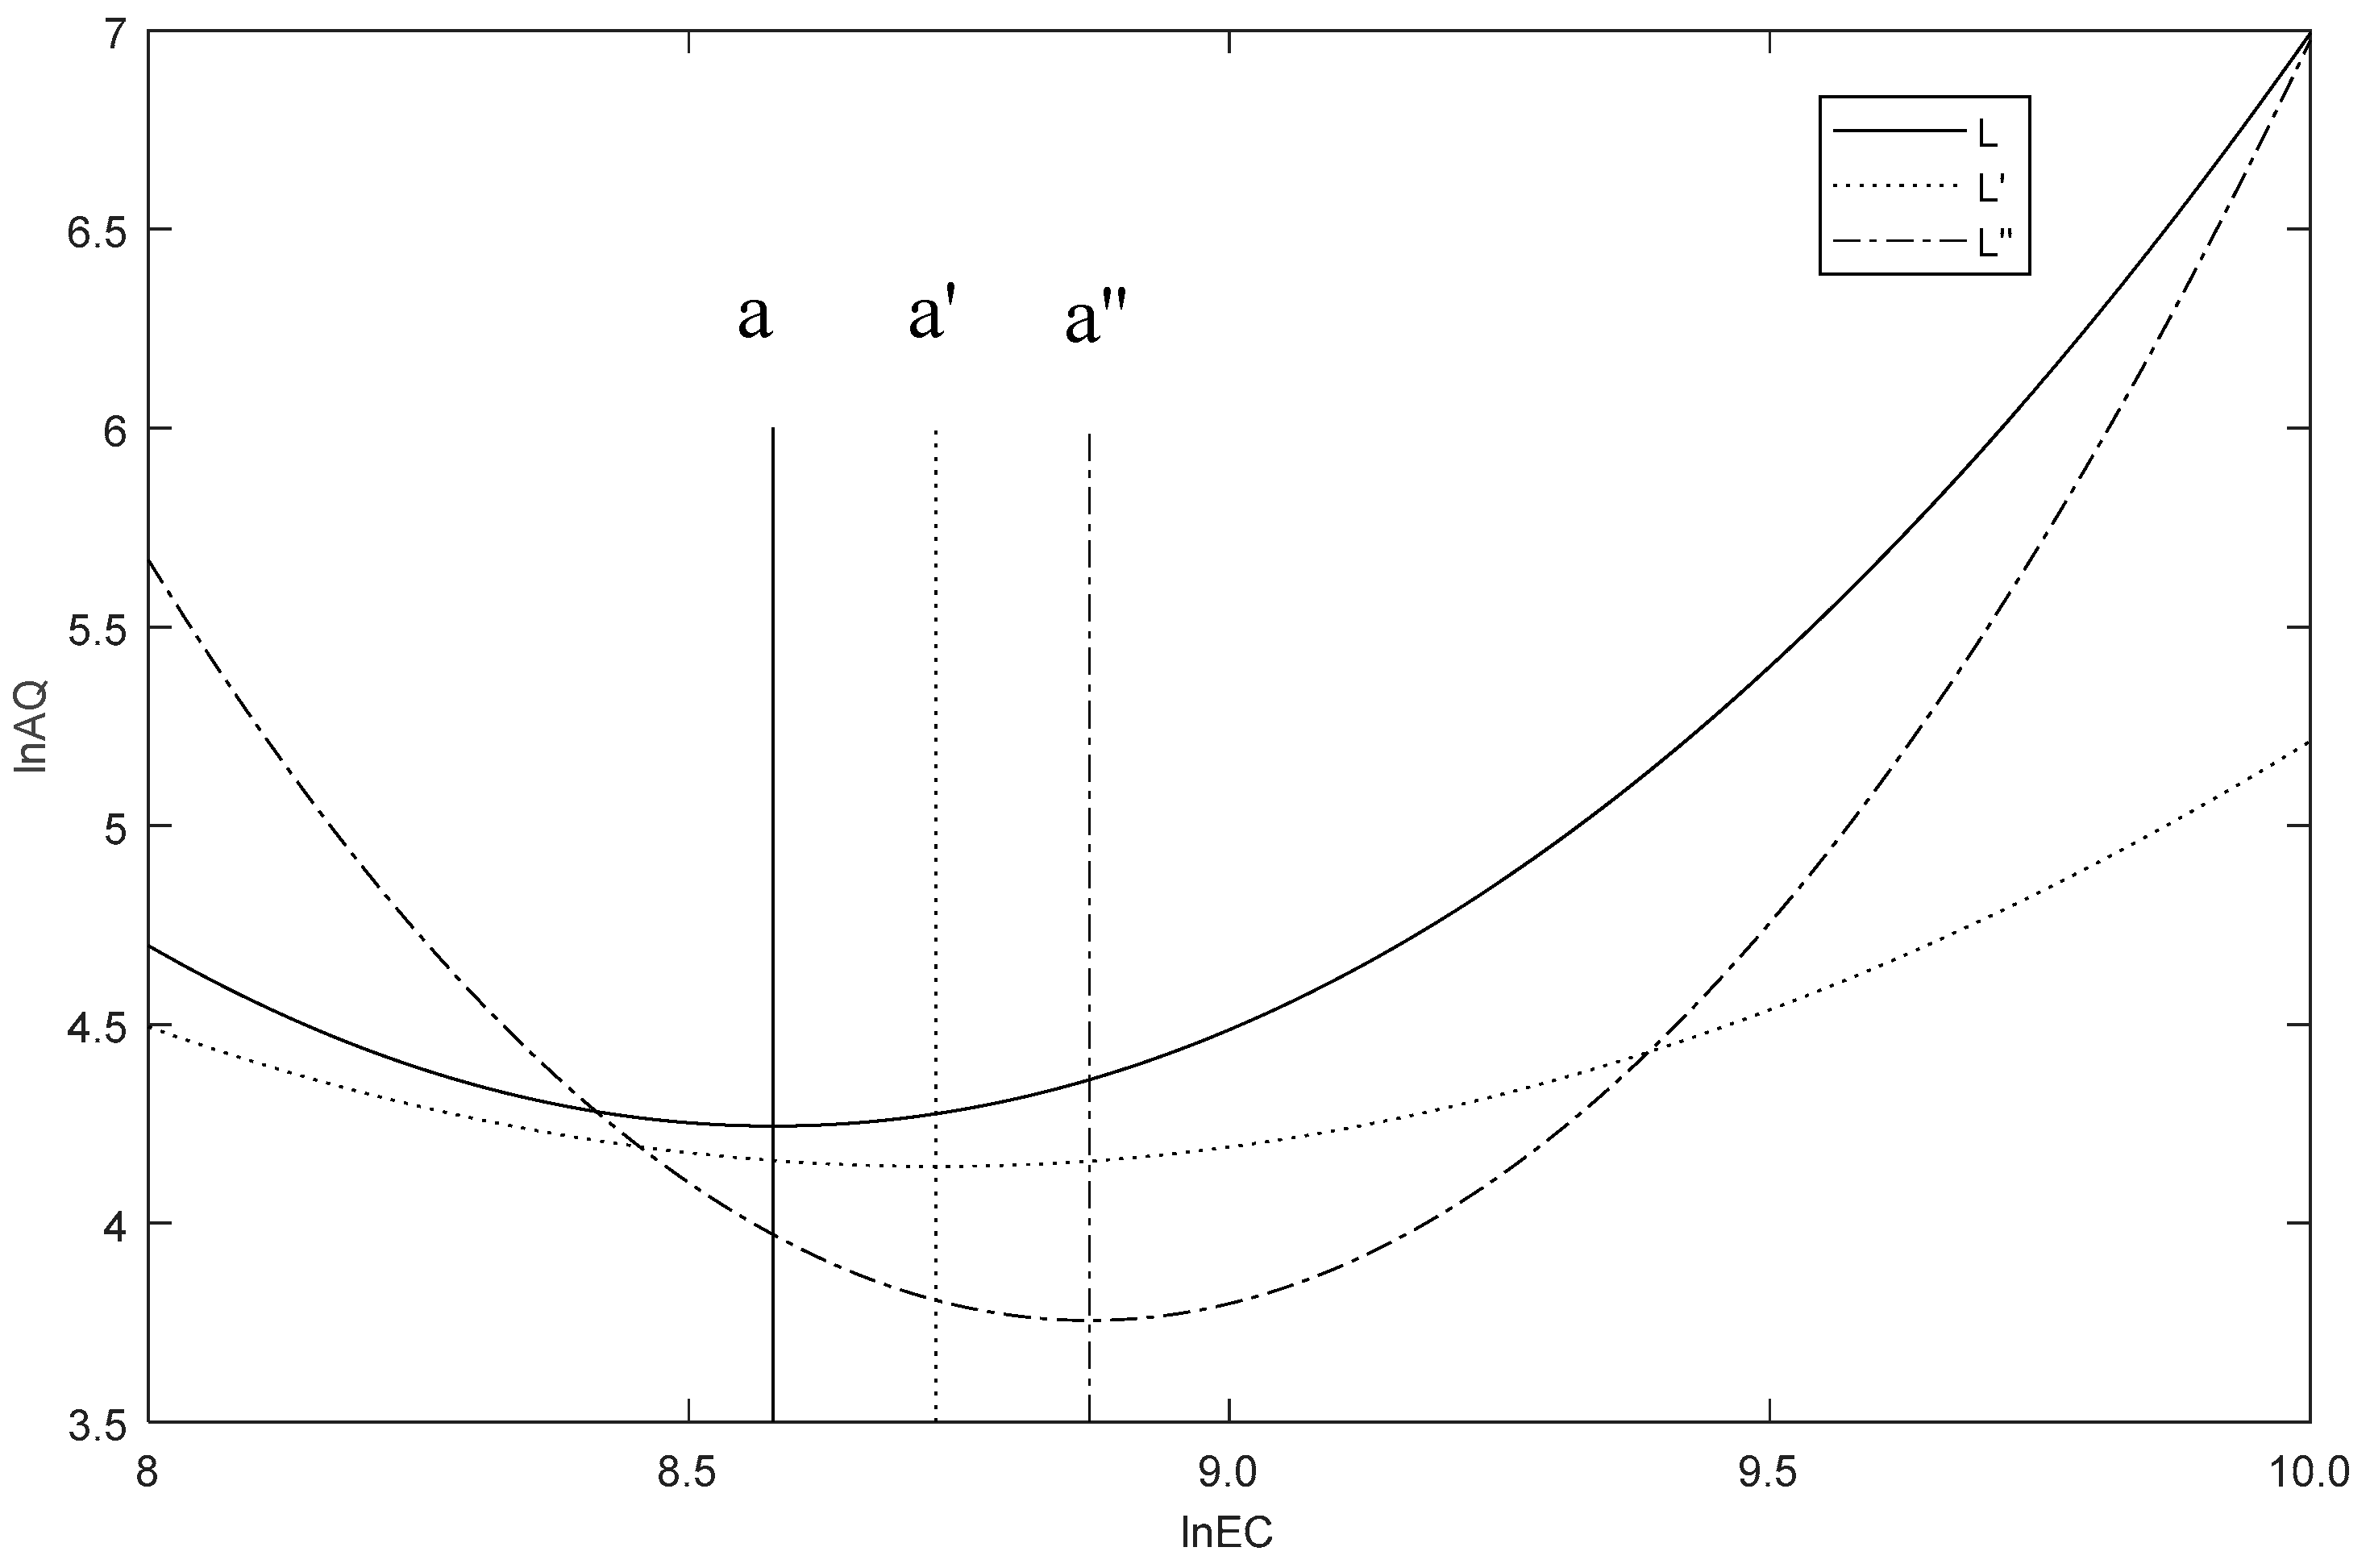
(4) When considering the policies, the relationship between air quality and energy consumption is still shown as a U-shaped curve but the effect of the related variables on air quality has changed. First, the symmetry axis moves to the right from to ; moreover, according to Figure 6, the total energy consumption increases when the air quality is optimal and the air quality index is smaller than is the case without considering policy variables, which reflects the effectiveness of the policies. Second, the opening of the U-shaped curve becomes smaller, which indicates that the effect of energy consumption on air quality is more significant. Meanwhile, on the left-hand side of the symmetry axis, the air quality index reduces more quickly with the increase of energy consumption, i.e. energy consumption has a greater impact on air quality; on the right-hand side, air pollution accelerates as energy consumption increases, which indicates that it is effective to improve air quality through controlling energy consumption by policies in order to improve air quality. Third, with regard to the path variables, when the proportion of the third industry increases by 1%, the air quality index falls by 0.0054%. This shows that policies’ implementation improves the effect of industrial structure optimization on improving air quality. When energy efficiency and energy consumption structure change by 1%, the air quality index changes by 0.8143% and −1.0676%, respectively; this indicates that energy consumption structure and technical factors do not play an effective role in improving air quality in sample interval.
6. Conclusions
This paper explores the effect of energy consumption on air quality in Jiangsu Province and further investigates the influence of related policies on the relationship between energy consumption and air quality, based on the Regression Discontinuity Design method. Our main conclusions are as follows:
First, there is a U-shaped curve relationship between energy consumption and air quality of Jiangsu Province and we are now in the ascending part of the curve. This indicates that controlling energy consumption can effectively improve air quality. Second, when controlled variables are added in related models, the U-shaped curve moves to the right and the influence of energy consumption on air quality flattens. This shows that, when considering the effect of industrial structure, energy efficiency and energy consumption structure, the increasing rate of air pollution due to rising energy consumption slows downs. This reflects the fact that that changing technology and structure can effectively influence the relationship between energy consumption and air quality. Third, related policies can affect both energy consumption and air quality. On the one hand, they have played an important role in improving air quality and the combined effect of policies is more significant that is that of a single policy; on the other hand, when considering related policies, the impact of energy consumption on air quality becomes more significant. This reflects the effectiveness of related policies and shows the importance of policy coordination. Fourth, in the research period, optimization of industrial structure of Jiangsu Province has had a certain extent effect on the improvement of air quality, while there has been no evidence of any effect of energy structure and energy efficiency on air quality. This shows that there is further room for improvement of energy structure and technology in controlling energy consumption and even improving air quality.
From the perspective of practice, combined with the empirical results, the relationship of energy consumption and air quality of Jiangsu Province is in the rising stage of a U-shaped curve. Therefore, it is both necessary and urgent to control energy consumption to improve air quality. In addition, the empirical results show that technology improvement and structural optimization can effectively influence the relationship between energy consumption and air quality. Thus, there is still considerable room for air quality improvement by controlling energy consumption via these paths. Moreover, the ratio of coal consumption in primary energy resources’ consumption of Jiangsu Province is well above the average level of China, while the structure of the three industries and technical input in Jiangsu Province are both ahead of the average level of China. Therefore, in the long run, full attention should be paid to improving technical input and optimizing energy structure, especially the latter. In terms of policies, on the one hand, the energy consumption structure should be optimized to form a clean and diversified structure, i.e. not only should clean energy be further explored and exploited but also the clean and efficient utilization of fossil energy should be promoted; on the other hand, based on “The Thirteenth Five-Year Development Plan of Jiangsu”, the government should accelerate green transformation of the mode of production and lifestyle, constantly improve the efficiency of resource utilizing and effectively improve the effect of technology on enhancing air quality.
Furthermore, the results of the empirical study reveal that the air quality improvement effect of industrial structure optimization is appearing gradually. Furthermore, Jiangsu Province should keep the principles of low consumption, low pollution and high efficiency in industrial structure adjustment and further promote the “Green Project” of energy structure. Meanwhile, the air pollution situation and constraint must be taken into consideration when formulating industrial restructuring policies [40]. Finally, empirical research shows that related polices of the Chinese government and Jiangsu Province have played a positive role in improving air quality and that coordination between multiple policies can magnify the effect of air quality improvement. Therefore, in practice, more emphasis should be placed on coordinating policies. Also, on the one hand, apart from administrative type direct regulation policies, indirect regulation policies, such as price and fiscal tools should be fully developed; on the other hand, the government should not only guide the coordination of air quality improvement in different regions of Jiangsu Province but also take into account the establishment of the policy systems of different provinces in China. To sum up, for the stakeholders, whether from Jiangsu Province, other provinces in China or other countries at the global level, our findings could not only be beneficial to identifying impacts of energy consumption on air quality but also be helpful to effectively formulate targeted regional environmental and energy policies.
Acknowledgments
The authors are grateful for the Key Program of National Statistical Science Research of China (No. 2016LZ13), the Ministry of Education of Humanities and Social Science project of China (No.16YJAZH015), the National Natural Science Foundation of China (No. 71742001, 41501133), the natural science foundation project of Jiangxi Province (No. 20171BAA218012) and the Social Science Planning Project (No. 15YJ36).
Author Contributions
Lingyun He and Zhangqi Zhong conceived and designed the framework. Fang Yin, Zhangqi Zhong and Deqing Wang collected and analyzed the data. All authors contributed to the writing.
Conflicts of Interest
The authors declare no conflicts of interest.
References
- Wang, Z.S. Analysis on the current situation of energy consumption structure and environmental air quality in Tianjin province. Chin. Energy 2009, 31, 35–37. [Google Scholar]
- Yan, G. Model of the energy consumption pattern of Pearl River Felta under constraints of air quality. Acta Sci. Circumst. 2011, 31, 1493–1500. [Google Scholar]
- Amegah, A.K.; Agyei-Mensah, S. Urban air pollution in Sub-Saharan Africa: Time for action. Environ. Pollut. 2017, 220, 738–743. [Google Scholar] [CrossRef] [PubMed]
- Zhao, J.; Chen, S.; Wang, H.; Ren, Y.; Du, K.; Xu, W.; Zheng, H.; Jiang, B. Quantifying the impacts of socio-economic factors on air quality in Chinese cities from 2000 to 2009. Environ. Pollut. 2012, 167, 148–154. [Google Scholar] [CrossRef] [PubMed]
- Chen, Y.L.; Xie, B.G.; Yang, Y. Distribution of the urban air quality in the major city clusters in China and the influencing factors. J. Arid Land Resour. Environ. 2015, 11, 99–103. [Google Scholar]
- Sun, L.; Wei, J.; Duan, D.H.; Guo, Y.M.; Yang, D.X.; Jia, C.; Mi, X.T. Impact of land-use and land-cover change on urban air quality in representative cities of China. J. Atmos. Sol. Terr. Phys. 2016, 142, 43–54. [Google Scholar] [CrossRef]
- Awbi, H.B. Ventilation for good indoor air quality and energy efficiency. Energy Procedia 2017, 112, 277–286. [Google Scholar] [CrossRef]
- Van Zelm, R.; Preiss, P.; van Goethem, T.; Van Dingenen, R.; Huijbregts, M.; Van Dingenend, R.; Huijbregtsa, M. Regionalized life cycle impact assessment of air pollution on the global scale: Damage to human health and vegetation. Atmos. Environ. 2016, 134, 129–137. [Google Scholar] [CrossRef] [Green Version]
- Tang, G.; Zhao, P.; Wang, Y.; Gao, W.; Cheng, M.; Xin, J.; Li, X.; Wang, Y. Mortality and air pollution in Beijing: The long-term relationship. Atmos. Environ. 2017, 150, 238–243. [Google Scholar] [CrossRef]
- Young, S.S.; Richard, L.S.; Keneth, K.L. Air quality and acute deaths in California, 2000–2012. Regul. Toxicol. Pharmacol. 2017, 88, 173–184. [Google Scholar] [CrossRef] [PubMed]
- Alam, M.M.; Murad, M.W.; Noman, A.H.M.; Ozturk, I. Relationships among carbon emissions, economic growth, energy consumption and population growth: Testing Environmental Kuznets Curve hypothesis for Brazil, China, India and Indonesia. Ecol. Indic. 2016, 70, 466–479. [Google Scholar] [CrossRef]
- Lun, F.; Canadell, J.G.; Xu, Z.Q.; He, L.; Yuan, Z.; Zhang, D.; Li, W.H.; Liu, M.C. Residential energy consumption and associated carbon emission in forest rural area in China: A case study in Weichang County. J. Mt. Sci. 2014, 11, 792–804. [Google Scholar] [CrossRef]
- Khan, M.M.; Zaman, K.; Irfan, D.; Awan, U.; Ali, G.; Kyophilavong, P.; Shahbaz, M.; Naseem, I. Triangular relationship among energy consumption, air pollution and water resources in Pakistan. J. Clean. Prod. 2016, 112, 1375–1385. [Google Scholar] [CrossRef]
- Pan, D.; Chan, M.; Deng, S.; Lin, Z. The effects of external wall insulation thickness on annual cooling and heating energy uses under different climates. Appl. Energy 2012, 97, 313–318. [Google Scholar] [CrossRef]
- Sharmin, T.; Gül, M.; Li, X.; Ganev, V.; Nikolaidis, I.; Al-Hussein, M. Monitoring building energy consumption, thermal performance and indoor air quality in a cold climate region. Sustain. Cities Soc. 2014, 13, 57–68. [Google Scholar] [CrossRef]
- Song, M.L.; Zheng, W.P.; Wang, Z.Y. Environmental efficiency and energy consumption of highway transportation systems in China. Int. J. Prod. Econ. 2015, 9, 1–9. [Google Scholar] [CrossRef]
- Wang, F.; Wang, H.Y.; Wang, Y.L. Tests analysis of heating energy consumption and indoor air quality in northeastern rural dwellings of China. Procedia Eng. 2016, 146, 17–23. [Google Scholar] [CrossRef]
- Nasreen, S.; Anwar, S.; Ozturk, I. Financial stability, energy consumption and environmental quality: Evidence from South Asian economies. Renew. Sustain. Energy Rev. 2017, 67, 105–1122. [Google Scholar] [CrossRef]
- Yang, X.; Wang, S.; Zhang, W.; Li, J.; Zou, Y. Impacts of energy consumption, energy structure and treatment technology on SO2 emissions: A multi-scale LMDI decomposition analysis in China. Appl. Energy 2016, 184, 714–726. [Google Scholar] [CrossRef]
- Zhu, Z.Y.; Rao, L.Y.; Yu, X.X.; Zhu, M.X. Air quality and dynamic relationship with energy consumption structure in Beijing. Environ. Monit. China 2014, 30, 4–9. [Google Scholar]
- Mai, C.P.; Lian, S.Q.; Niu, S.W. Analysis of the energy consumption structure and the ambient air quality in Gansu province. J. Lanzhou Univ. Nat. Sci. 2014, 50, 508–512. [Google Scholar]
- Ru, L.J. Analysis on Consuming Present Situation of Energy and the Countermeasures of Improving Urban Environmental Air Quality in Taiyuan City; Taiyuan SCI-Tech: Taiyuan, China, 2003; pp. 18–19. [Google Scholar]
- Wu, L.J.; Cheng, W.Y.; Zhang, L. The relationship between energy consumption structure and the quality of atmospheric environment-an example in an area of Chengdu. Environ. Sci. Manag. 2009, 34, 166–169. [Google Scholar]
- Tsao, C.C.; Campbell, J.E.; Mena-Carrasco, M.; Spak, S.N.; Carmichael, G.R.; Chen, Y. Biofuels that cause land-Use change may have much larger Non-GHG air quality dmissions than fossil fuels. Environ. Sci. Technol. 2012, 46, 10835–10841. [Google Scholar] [CrossRef] [PubMed]
- Wang, Q.Y. Energy and environment: Problems and solutions in China. Energy Environ. 2005, 4, 4–11. [Google Scholar]
- Alvarez-Herranz, A.; Balsalobre-Lorente, D.; Shahbaz, M.; Cantos, J.M. Energy innovation and renewable energy consumption in the correction ofair pollution levels. Energy Policy 2017, 105, 386–397. [Google Scholar] [CrossRef]
- Borrego, C.; Coutinho, M.; Costa, A.M.; Ginja, J.; Ribeiro, C.; Monteiro, A.; Ribeiro, I.; Valente, J.; Amorim, J.H.; Martins, H.; et al. Challenges for a new air quality directive: The role of monitoring and modelling techniques. Urban Clim. 2015, 14, 328–341. [Google Scholar] [CrossRef]
- Martínez, C.I.P. Energy and sustainable development in cities: A case study of Bogotá. Energy 2015, 92, 612–621. [Google Scholar] [CrossRef]
- Han, Y.F.; Ma, M.T.; Song, L.Y. Analysis on the changing trend of atmospheric environment quality in Beijing in recent years. Environ. Sustain. Dev. 2009, 6, 4–6. [Google Scholar]
- Zhang, X.; Wu, L.; Zhang, R.; Deng, S.; Zhang, Y.; Wu, J.; Li, Y.; Lin, L.; Li, L.; Wang, Y.; et al. Evaluating the relationships among economic growth, energy consumption, air emissions and air environmental protection investment in China. Renew. Sustain. Energy Rev. 2013, 18, 259–270. [Google Scholar] [CrossRef]
- Wei, W.X.; Ma, X.L. Optimal policy for energy structure adjustment and haze governance in China. China Popul. Resour. Environ. 2015, 25, 6–14. [Google Scholar]
- Gratsea, M.; Liakakou, E.; Mihalopoulos, N.; Adamopoulos, A.; Tsilibari, E.; Gerasopoulos, E. The combined effect of reduced fossil fuel consumption and increasing biomass combustion on Athens’ air quality, as inferred from long term CO measurements. Sci. Total Environ. 2017, 592, 115–123. [Google Scholar] [CrossRef] [PubMed]
- Wang, W.; Li, Q.; Lou, Y.; Yang, X. Nexus of energy saving and air quality in China’s energy industries during the 12th Five Year Period. Energy Procedia 2017, 105, 3824–3829. [Google Scholar] [CrossRef]
- Xue, Y.; Tian, H.; Yan, J.; Zhou, Z.; Wang, J.; Nie, L.; Pan, T.; Zhou, J.; Hua, S.; Wang, Y.; et al. Temporal trends and spatial variation characteristics of primary air pollutants emissions from coal-fired industrial boilers in Beijing, China. Environ. Pollut. 2016, 213, 717–726. [Google Scholar] [CrossRef] [PubMed]
- Jayasooriya, V.M.; Ng, A.; Muthukumaran, S.; Perera, B.C. Green infrastructure practices for improvement of urban air quality. Urban For. Urban Green. 2017, 21, 34–47. [Google Scholar] [CrossRef]
- Grossman, G.; Krueger, A. Environmental impacts of a North American free trade agreement. Soc. Sci. Electron. Publ. 1992, 8, 223–250. [Google Scholar]
- Ma, L.M.; Zhang, X. The Spatial effects of China’s haze pollution and the impact on economy and energy structure. China Ind. Econ. 2014, 4, 19–31. [Google Scholar]
- Wang, L.P.; Chen, J. Socio-economic influential factors of haze pollution in China: Empirical study by EBA model using spatial panel data. Acta Sci. Circumst. 2016, 36, 3833–3839. [Google Scholar]
- Shao, S.; Li, X.; Cao, J.H.; Yang, L.L. Economic policy choice of china’s haze management-From the perspective of spatial spillover effect. Econ. Res. 2016, 9, 73–88. [Google Scholar]
- Wang, L. Study on Industrial Structure Optimization of Jiangsu Province under Environmental Constraints; Jiangnan University: Wuxi, China, 2008. [Google Scholar]
- Omer, A.M. Energy, environment and sustainable development. Renew. Sustain. Energy Rev. 2008, 12, 2265–2300. [Google Scholar] [CrossRef]
- Du, X.W.; Yang, B.; Liu, X.L. Decoupling analysis of China’s economic development, energy consumption and carbon emission. China Popul. Resour. Environ. 2015, 25, 1–7. [Google Scholar]
- Apergis, N.; Christou, C.; Gupta, R. Are there environmental kuznets curves for US state-level CO2 emissions? Renew. Sustain. Energy Rev. 2017, 69, 551–558. [Google Scholar] [CrossRef]
- Arrow, K.; Bolin, B.; Costanza, R.; Dasgupta, P.; Folke, C.; Holling, C.S.; Jansson, B.O.; Levin, S.; Mäler, K.G.; Perrings, C.; et al. Economic growth, carrying capital and environment. Science 1995, 286, 520–521. [Google Scholar] [CrossRef] [PubMed]
- Jiang, L.; Folmer, H.; Ji, M. The drivers of energy intensity in China: A spatial panel data approach. China Econ. Rev. 2014, 31, 351–360. [Google Scholar] [CrossRef]
- Wu, F.L.; Zhou, Y.; Chen, J.H. An empirical study on the relationship between energy consumption and economic development in China. J. Cent. South Univ. Soc. Sci. 2013, 19, 29–35. [Google Scholar]
- Zhou, J.Q. Study on the convergence of carbon intensity and its influencing factors in China. J. Guangdong Univ. Financ. Econ. 2014, 2, 12–20. [Google Scholar]
- Casson, M.C.; Giusta, M.D.; Kambhampati, U.S. Formal and informal institutions and development. World Dev. 2010, 38, 137–141. [Google Scholar] [CrossRef]
- Zhang, X.G.; Zhong, M.C. A further study on the environmental kuznets curve-from the perspective of government regulation. J. Zhongnan Univ. Econ. Law 2009, 50, 40–44. [Google Scholar]
- Hahn, J.; Todd, P.; Van der Klaauw, W. Identification and estimation of treatment effects with a regression-discontinuity design. Econometrica 2001, 69, 201–209. [Google Scholar] [CrossRef]
- Lee, D.; Lemieux, T. Regression discontinuity designs in economics. J. Econ. Lit. 2010, 48, 281–335. [Google Scholar] [CrossRef]
- Cook, T. Waiting for life to arrive: A history of the regression-Discontinuity design in psychology, statistics and economics. J. Econom. 2008, 142, 636–654. [Google Scholar] [CrossRef]
- Meng, L. Evaluating China’s poverty alleviation program: A regression discontinuity approach. J. Public 2013, 101, 1–11. [Google Scholar] [CrossRef]
- Xu, Q. Research on the benchmarking methods of quarterly GDP and annual GDP. Stat. Res. 2003, 3, 19–23. [Google Scholar]
- Wang, X.; Feng, Z. Energy consumption with sustainable development in developing country: A case in Jiangsu, China. Energy Policy 2003, 31, 1679–1684. [Google Scholar] [CrossRef]
- Zhou, N.; Levine, M.D.; Price, L. Overview of current energy-efficiency policies in China. Energy Policy 2010, 38, 6439–6452. [Google Scholar] [CrossRef]
- Zhong, Z.; Huang, R.; Tang, Q.; Cong, X.; Wang, Z. China’s provincial CO2 emissions embodied in trade with implications for regional climate policy. Front. Earth Sci. 2015, 9, 77–90. [Google Scholar] [CrossRef]
- Zhang, Y.J.; Da, Y.B. The decomposition of energy-related carbon emission and its decoupling with economic growth in China. Renew. Sustain. Energy Rev. 2015, 41, 1255–1266. [Google Scholar] [CrossRef]
- Wang, J.J.; Shi, D.; Zhang, C. The impact of energy price on energy efficiency: An empirical analysis based on global data. Econ. Manag. 2014, 12, 13–23. [Google Scholar]
- Xu, L.N.; Zhao, T.; Liu, G.W.; Sun, J.S. Analysis on dynamic effect of energy intensity change and energy structure and industrial structure in China. Inq. Econ. Issues 2013, 7, 40–44. [Google Scholar]
- Govindaraju, V.G.R.C.; Tang, C.F. The dynamic links between CO2 emissions, economic growth and coal consumption in China and India. Appl. Energy 2013, 104, 310–318. [Google Scholar] [CrossRef]
- Hao, Y.; Zhang, Z.Y.; Liao, H.; Wei, Y.M. China’s farewell to coal: A forecast of coal consumption through 2020. Energy Policy 2015, 86, 444–455. [Google Scholar] [CrossRef]
- Dong, X.B.; Yin, J.J.; Wen, Y.B. Environmental quality, governmental regulation and economic growth: An extensive endogenous framework. China Natl. Law Econ. Collect. Pap. 2012, 6, 49–62. [Google Scholar]
- Gao, C.Y.; Lian, S.Q.; Niu, S.W. Status of industrial energy consumption and air pollution of three cities in Western China. J. Lanzhou Univ. Nat. Sci. 2014, 50, 240–244. [Google Scholar]
- Li, J.L.; Zeng, T. Analysis on the principal component of factors affecting air quality in Beijing: From 2000–2011 years of experience data. Ecol. Econ. 2017, 189, 167–171. [Google Scholar]
- Xie, L.F.; Yan, C.M.; Li, G.X.; XU, Y.C.; Zhang, Y.; Zhao, Y.W. Responses of water environment pollution in industrial structure of Jiangsu Province. Bull. Soil Water Conserv. 2016, 2, 307–313. [Google Scholar]
- Xi, P.H.; Liang, R.B. The impact of air pollution on local government’s environmental protection investment-based on multi-regression discontinuity design. Stat. Res. 2015, 32, 76–83. [Google Scholar]
- Brollo, F.; Nannicini, T.; Perotti, R.; Tabellini, G. The political resource curse. Am. Econ. Rev. 2013, 103, 1759–1796. [Google Scholar] [CrossRef]
- Liu, S.L.; Zhou, S.J.; Hu, A.G. Compulsory education law and the return rate of urban education in China: Based on regression discontinuity design. Econ. Res. 2016, 2, 154–167. [Google Scholar]
Figure 1.
The impacting mechanism of energy consumption on air quality.
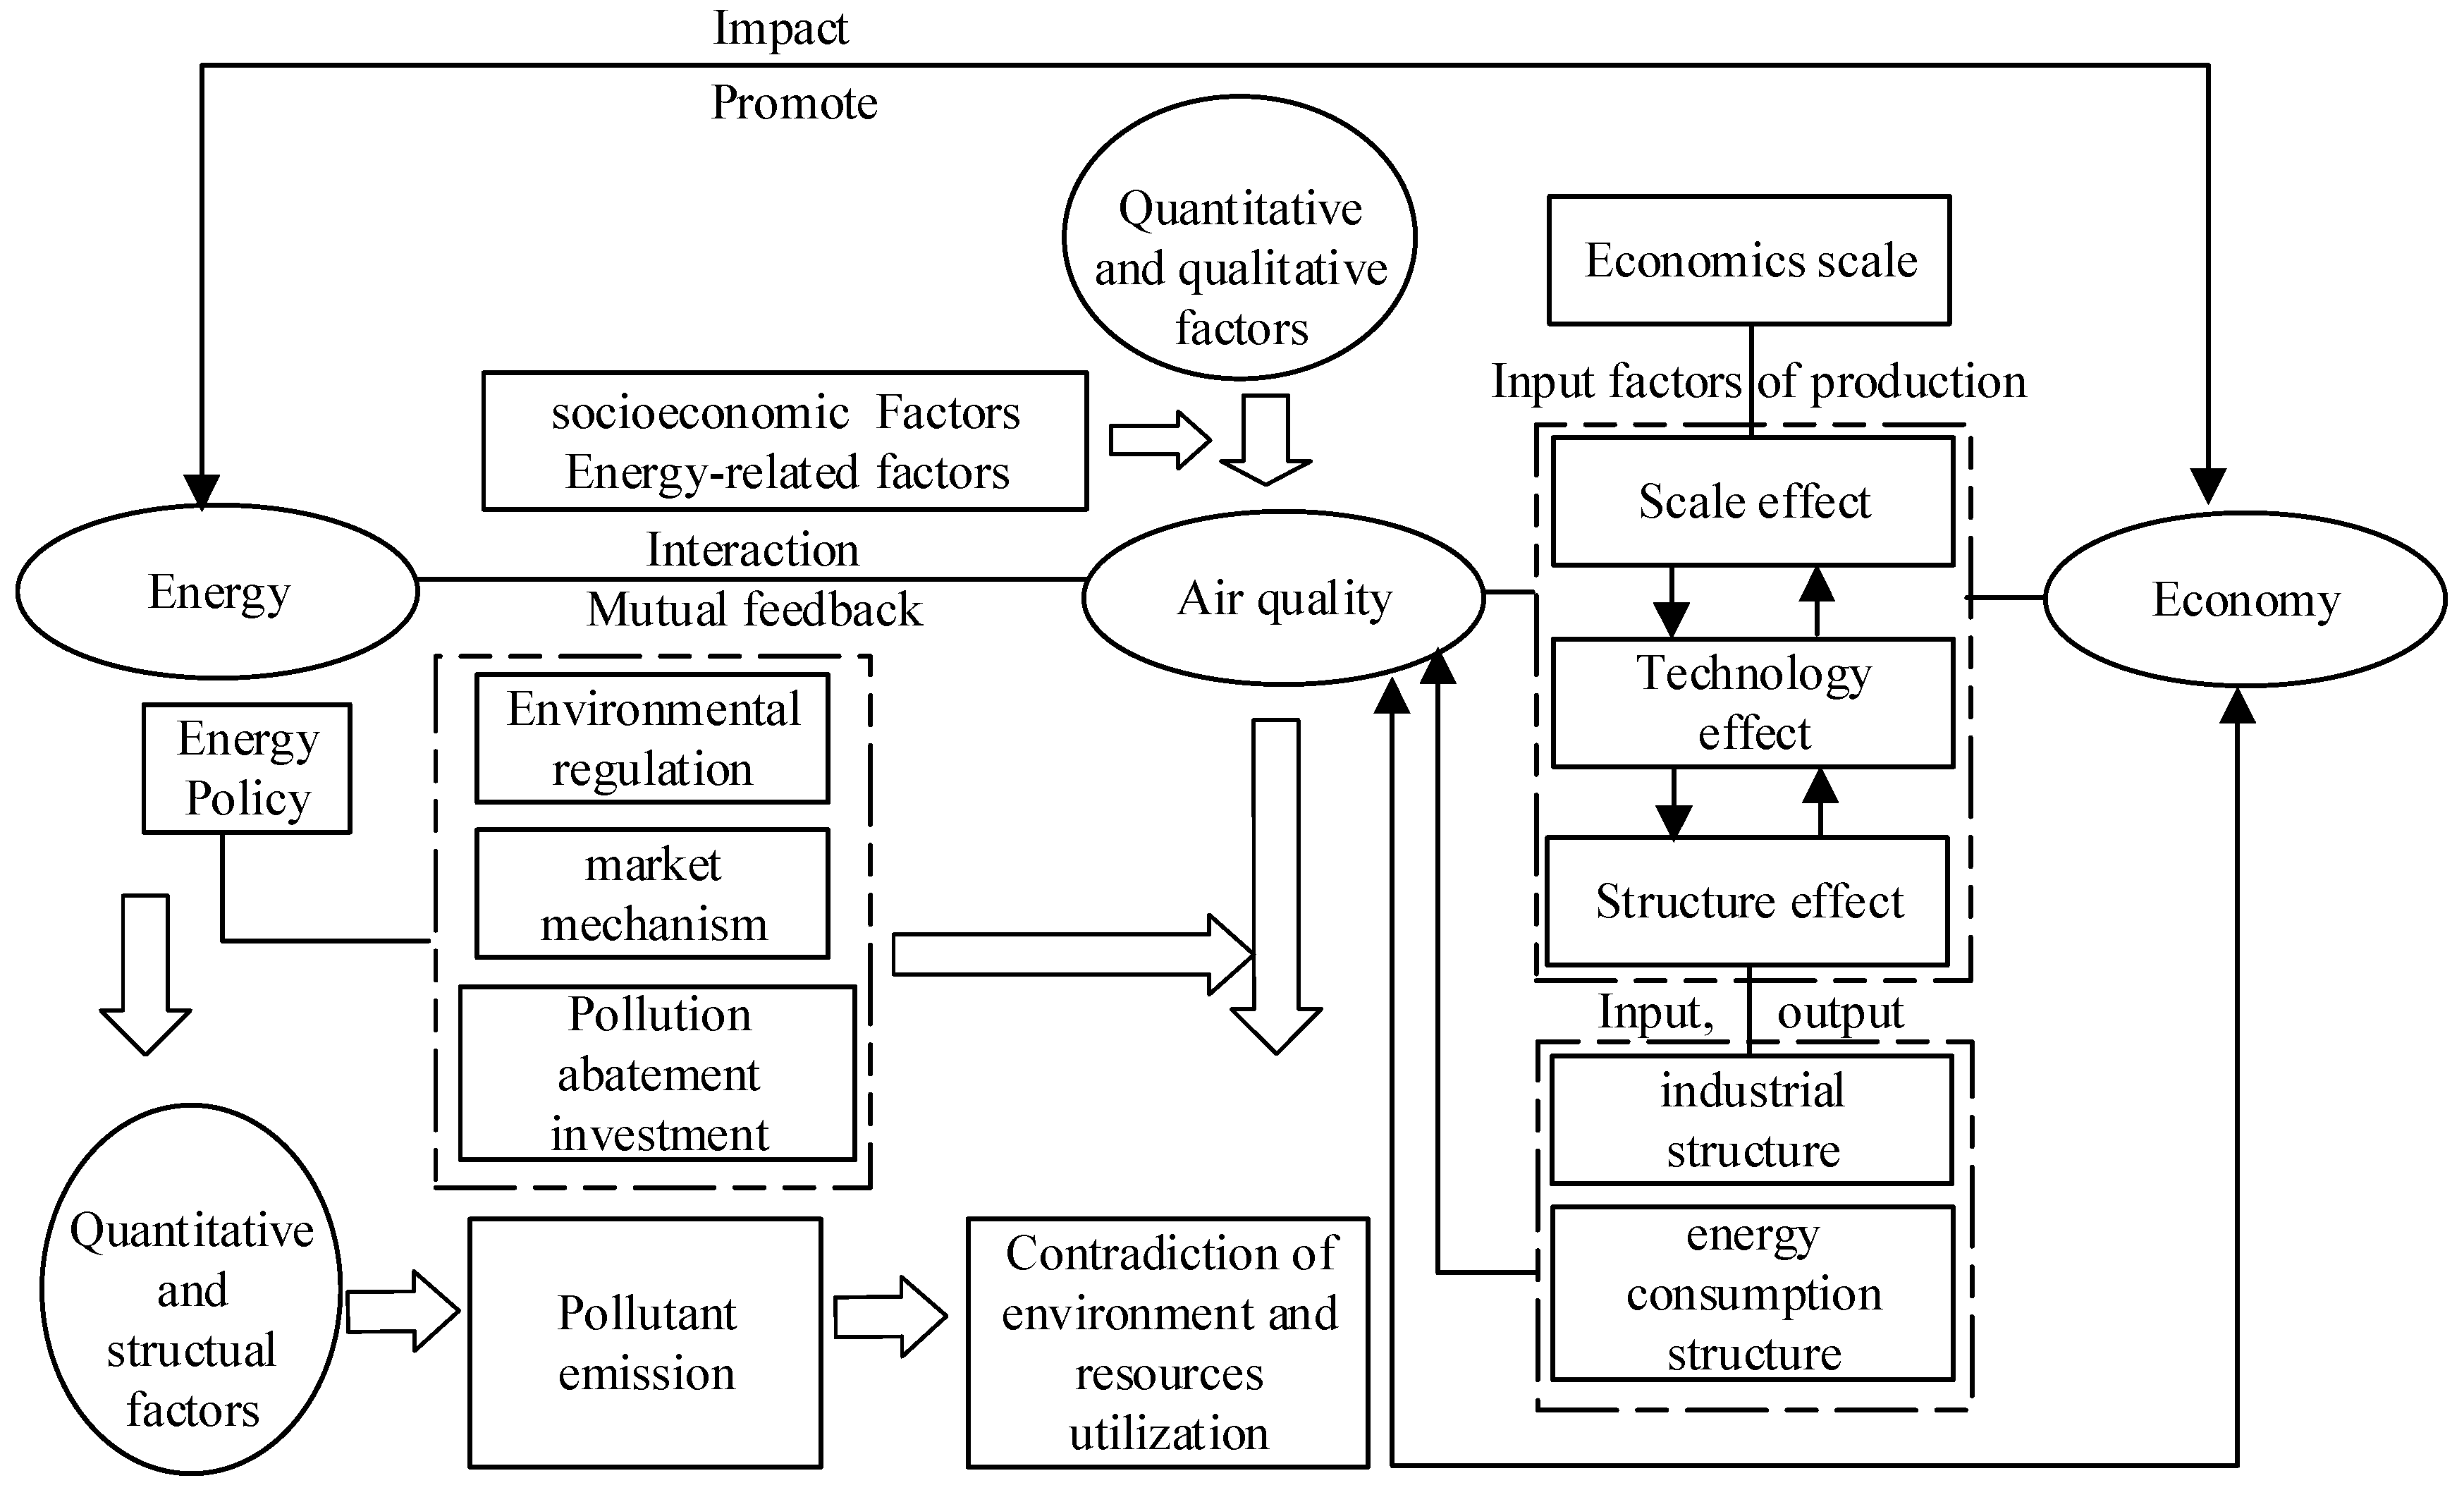
Figure 2.
Quarterly decoupling coefficients of Jiangsu Province during 2006–2015.

Figure 3.
(a) Changes in quarterly air quality and total energy consumption in Jiangsu Province in 2006–2015. (b) Changes in quarterly energy efficiency, industrial structure and structure of energy consumption in Jiangsu Province during 2006–2015.
Figure 3.
(a) Changes in quarterly air quality and total energy consumption in Jiangsu Province in 2006–2015. (b) Changes in quarterly energy efficiency, industrial structure and structure of energy consumption in Jiangsu Province during 2006–2015.

Figure 4.
The relationship between energy consumption and air quality in Jiangsu Province. Note: and denote the estimation curve with and without considering control variables, respectively; and are the corresponding symmetry axis of and respectively.
Figure 4.
The relationship between energy consumption and air quality in Jiangsu Province. Note: and denote the estimation curve with and without considering control variables, respectively; and are the corresponding symmetry axis of and respectively.

Figure 5.
(a) Changes in air quality after the implementation of the policy. (b) Changes in energy consumption after the implementation of the policy.
Figure 5.
(a) Changes in air quality after the implementation of the policy. (b) Changes in energy consumption after the implementation of the policy.
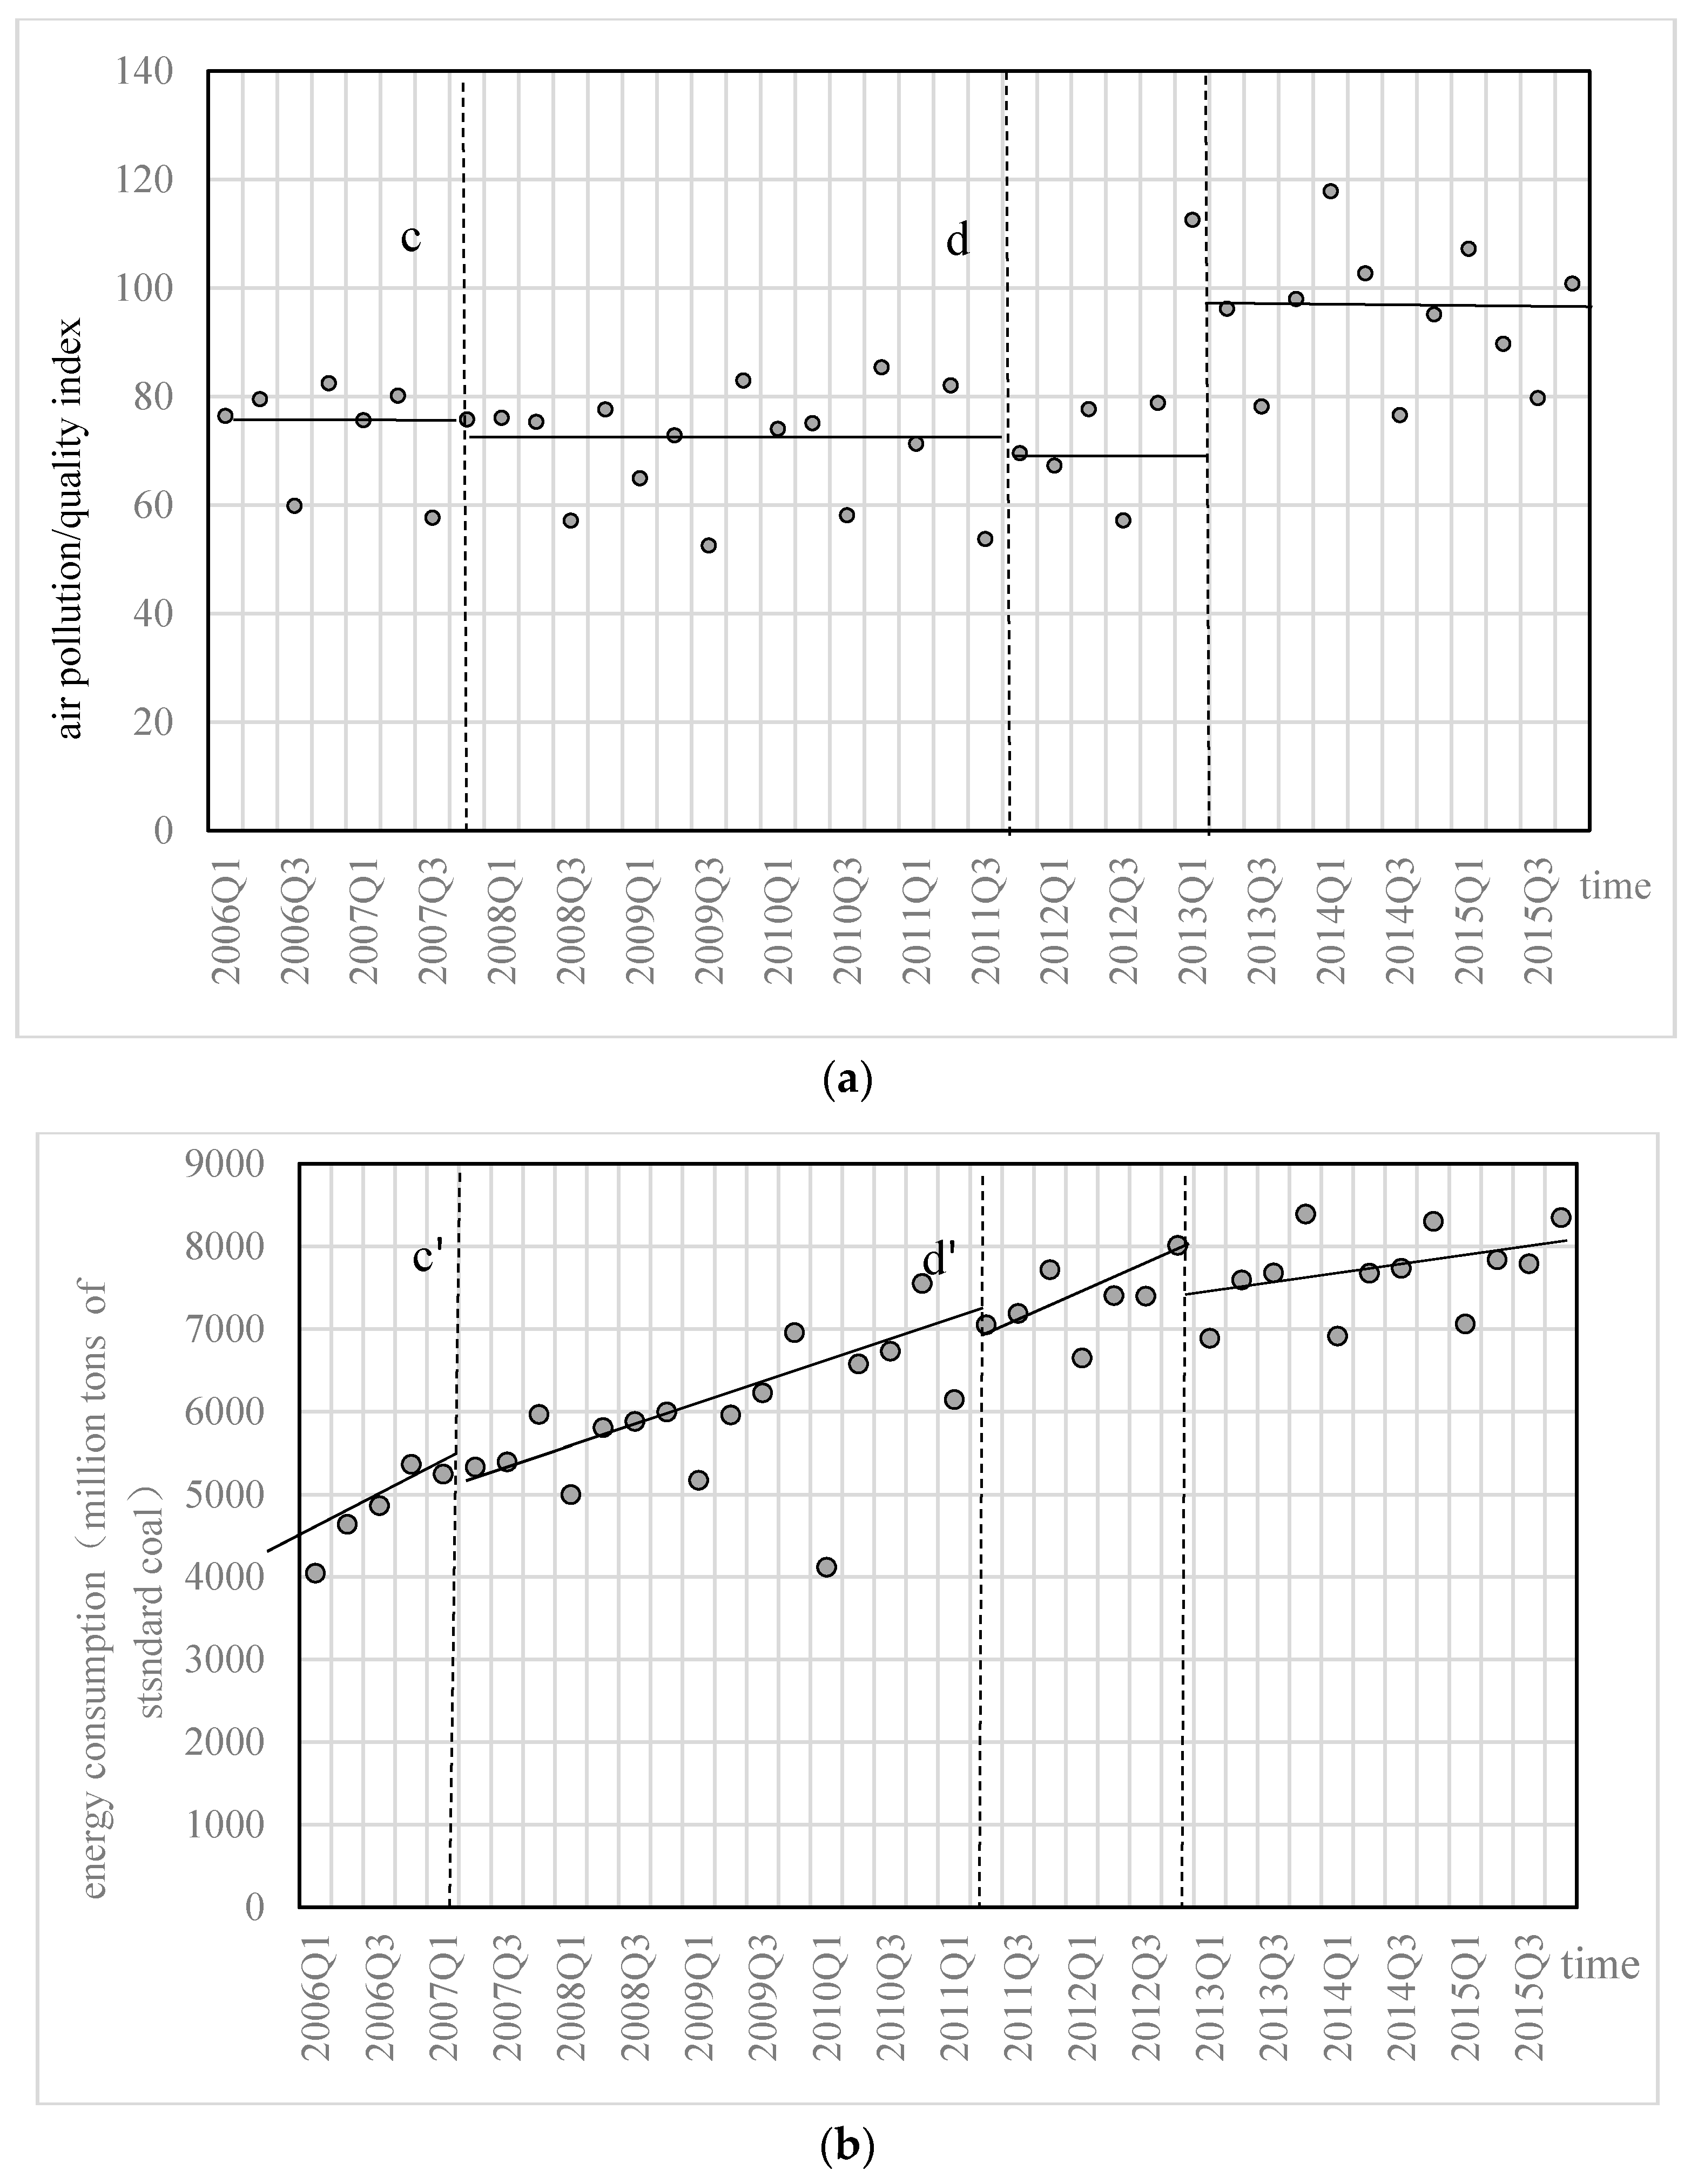
Figure 6.
The relationship curves between energy consumption and air quality in Jiangsu under different scenarios. Note: is the estimation curve when considering policy and control variables; is the corresponding symmetry axis of .
Figure 6.
The relationship curves between energy consumption and air quality in Jiangsu under different scenarios. Note: is the estimation curve when considering policy and control variables; is the corresponding symmetry axis of .


Table 1.
Variables’ description.
| Variable | Symbol | Unit | Index Description |
|---|---|---|---|
| Total energy consumption | EC | ten thousand tons of standard coal | energy consumption (Standard coal equivalent) |
| Air quality | AQ | / | measured with API and AQI |
| Economic aggregate | GDP | million yuan | the gross regional domestic product |
| Industrial structure | S | / | the proportion of the tertiary industry added value account for GDP |
| Energy efficiency | E | million yuan/ten thousand tons of standard coal | the reciprocal of energy intensity, the “unit energy consumption of GDP” (GDP/total energy consumption) |
| structure of energy consumption | ECS | / | the proportion of coal consumption account for total energy consumption |
Table 2.
The estimation results, after considering control variables.
| Parameter | Estimated Value | Standard Deviation | T Statistic | p Value |
|---|---|---|---|---|
| 54.5467 | 61.1095 | 0.8947 | 0.3772 | |
| −11.5494 | 14.1032 | −0.8189 | 0.4185 | |
| 0.6616 | 0.8130 | 0.8137 | 0.4215 | |
| 0.1904 | 0.1745 | 1.0910 | 0.2829 | |
| 0.3517 | 0.2197 | 1.6009 | 0.1186 | |
| −0.4480 | 0.3273 | −1.3687 | 0.1801 | |
| R2 | 0.3388 | mean of dependent variable | 4.3477 | |
| adjusted R2 | 0.2416 | Standard deviation of dependent variable | 0.1990 | |
| residual sum of squares | 1.0206 | Durbin-Watson statistic | 2.2276 | |
| F statistic | 3.4850 | probability (F statistics) | 0.0119 ** | |
Note: ** means reject Null hypothesis at the 5% significant level.
Table 3.
Results of Discontinuity determination.
| Variable | Coefficient | Standard Deviation | T Statistic | p Value |
|---|---|---|---|---|
| 2006Q1–2007Q2 | ||||
| LnEC | 0.5086 | 0.0051 | 99.9779 | 0.0000 |
| 2007Q3–2011Q2 | ||||
| LnEC | 0.4893 | 0.0042 | 115.5377 | 0.0000 |
| 2011Q3–2012Q4 | ||||
| LnEC | 0.4716 | 0.0054 | 86.8691 | 0.0000 |
| 2013Q1–2015Q4 | ||||
| LnEC | 0.5095 | 0.0052 | 97.8075 | 0.0000 |
Note: the p-values of zero listed here are directly from the default setting in the program.
Table 4.
Estimation results of regression discontinuity.
| ① | ② | ③ | ||
| Logarithmic energy consumption simplified equation | ||||
| 0.0273 (0.0745) | 0.0830 (00687) | |||
| 0.1800 (0.0161) | 0.1993 (0.0627) | |||
| R2 | 0.6740 | 0.7379 | 0.7487 | |
| Logarithmic air quality simplification equation | ||||
| −0.2469 (0.01012) | −0.2712 (0.1049) | |||
| −0.0234 (0.0998) | −0.0866 (0.0958) | |||
| R2 | 0.4225 | 0.3252 | 0.4360 | |
| Logarithmic air quality structural equation | ||||
| Parameter | Estimated Value | Standard deviation | T statistic | p value |
| 202.3432 | 18.6481 | 10.8506 | 0.0000 *** | |
| −44.7747 | 4.2625 | −10.5045 | 0.0000 *** | |
| 2.5238 | 0.2433 | 10.3717 | 0.0000 *** | |
| −0.0054 | 0.0358 | −0.1505 | 0.8813 | |
| 0.8143 | 0.0684 | 11.9113 | 0.0000 *** | |
| −1.0676 | 0.0923 | 11.9113 | 0.0000 *** | |
Note: The values in parentheses are standard errors. “①, ② and ③” indicate, respectively, the influence of “The Eleventh Five-Year Energy Development Plan”, “The Twelfth Five-Year Plan of Forestry Industry Development of Jiangsu Province” and the two policies on relationship between energy consumption and air quality. The p-values of zero listed here are directly from the default setting in the program. *** means reject Null hypothesis at the 1% significant level.
© 2018 by the authors. Licensee MDPI, Basel, Switzerland. This article is an open access article distributed under the terms and conditions of the Creative Commons Attribution (CC BY) license (http://creativecommons.org/licenses/by/4.0/).
Share and Cite
MDPI and ACS Style
He, L.; Zhong, Z.; Yin, F.; Wang, D. Impact of Energy Consumption on Air Quality in Jiangsu Province of China. Sustainability 2018, 10, 94. https://doi.org/10.3390/su10010094
AMA Style
He L, Zhong Z, Yin F, Wang D. Impact of Energy Consumption on Air Quality in Jiangsu Province of China. Sustainability. 2018; 10(1):94. https://doi.org/10.3390/su10010094
Chicago/Turabian StyleHe, Lingyun, Zhangqi Zhong, Fang Yin, and Deqing Wang. 2018. "Impact of Energy Consumption on Air Quality in Jiangsu Province of China" Sustainability 10, no. 1: 94. https://doi.org/10.3390/su10010094
Note that from the first issue of 2016, this journal uses article numbers instead of page numbers. See further details here.