Measuring the Sustainability of a Manufacturing Process: A Conceptual Framework

Industrial Engineering Post Graduation Program, Universidade Nove de Julho, São Paulo 01504-001, Brazil
*
Author to whom correspondence should be addressed.
Sustainability 2018, 10(1), 81; https://doi.org/10.3390/su10010081
Submission received: 27 November 2017
/
Revised: 20 December 2017
/
Accepted: 28 December 2017
/
Published: 30 December 2017
(This article belongs to the Section Economic and Business Aspects of Sustainability)
Abstract
:Recently, besides recurrent financial gains, industries have been required to boost their environmental and social performance to fulfil the demands of several stakeholders. Moreover, the need to measure the sustainability of manufacturing processes is recognized because the production and operations managers need to know how they are contributing to the triple bottom line of their respective companies. To do that, many initiatives have been developed although all of them face some limitations: (a) they are only appropriate for the company as a whole, which makes their application for a manufacturing process difficult; (b) they consider the measures for sustainability (economic, environmental and social) as separate variables with no integration among them, which could become a methodological difficulty in case indicators move in different directions; or (c) they are too complicated to be used as a practical tool on the factory floor. Hence, this study proposes a framework to evaluate the sustainability level of a manufacturing process, integrating the economic, environmental, and social variables into a single combined measure. A case study exemplifies how the proposed procedure can be applied in real-world situations.
1. Introduction
In the last few decades, sustainability has been the focus of intense discussions due to the vital role of the manufacturing activities in value creation in national economies and their environmental and social impacts [1]. Industries have also been required to foster their environmental and social performance to comply with the demands of and pressures from several stakeholders [2,3,4]. Therefore, the quest for sustainability involves not only environmental and social gains, but also the pursuit of improved economic performance [5,6,7].
In line with this concept, Garetti and Taisch [8] define sustainable manufacturing as the capacity to use natural resources in such a way that the economic, environmental, and social aspects are attained, minimizing the adverse impacts of industrial operations on the environment. Manufacturing companies are expected to include the three aspects of sustainability (economic, environmental, and social) as part of their strategies and activities, establishing a dynamic balance among them [9,10]. Therefore, firms have adopted several models to evaluate and measure their sustainability level. The initiatives most commonly observed in the literature and in practice are detailed in the following paragraphs.
Elkington [11] indicated that the measurement of sustainability should go beyond the traditional considerations of return on investment, profits, and shareholder value. Consequently, the triple bottom line (TBL) concept was proposed. Besides economic aspects, environmental and social factors should be considered to measure those interrelated features considering the so-called three Ps: profits, people, and planet. This concept enabled the establishment of the TBL index, which is an aggregate measure of the sustainability performance of a company as a dynamic balance among economic growth, environmental improvement, and social equity. Despite being called an index, TBL is measured considering the three pillars of sustainability individually, not as an aggregate [12].
Measuring each sustainability aspect as a separate variable presents a practical problem when evaluating the global sustainability of a company in case variables evolve in different directions. As an example, suppose that in a given company, there is a serious problem in a piece of equipment that generates an excessive loss of working hours due to accidents suffered by machine operators. To solve this issue, the industrial engineering department suggests that reducing the machine speed (increasing the production cycle time) would eliminate the operator accidents almost completely. In terms of sustainability, this solution (a) improves the social aspect because the number of accidents is drastically reduced, and (b) worsens the economic aspect because the production cost is increased (higher cycle time). In this case, what happens to the overall sustainability of the company? Does it improve? Does it worsen? Or does it remain unchanged? Without a single measure that integrates the three aspects of sustainability, this question cannot be answered.
In 1999, many leading firms in the United States, Europe, and Japan decided to become sustainable companies and adopted many initiatives to improve the environmental and social performance of their products, processes, and facilities [5]. Nevertheless, they faced the challenge of tracking their evolution towards sustainability. To support the decision-makers, the authors [5] proposed a model to measure the sustainable performance considering: (a) the resource and value indicators; (b) the environmental, economic, and social dimensions; (c) the life cycle of products; and (d) combining leading and lagging indicators. To measure sustainability, they proposed an 11-step process. As a starting point, the organization should define its sustainability policy and identify the key performance indicators, establishing the objectives. Then, it should recognize the specific indicators for the organization. However, the specialists involved in the model implementation process should initially define the measurement scope that could be just a product, a process, or the organization as a whole. The three aspects of sustainability considered in this model were treated as separate measures, not as an aggregate unit.
The Dow Jones Sustainability Index (DJSI) World, established in 1999, is a global indicator of the financial performance of the world’s most sustainable companies listed on the New York Stock Exchange. The index presupposes that sustainability is the ability to create long-term shareholder value by managing opportunities and risks associated with economic, environmental, and social development [13]. It is measured considering the top 10% of the most sustainable companies in each industry. “On any given day, the index value is the quotient of the total float-adjusted market capitalization of the index’s constituents and its divisor” ([14], p. 12). Note that the DJSI is a financial index that measures the overall performance of the most sustainable companies, not the specific values of economic, environmental, and social performance.
One of the most commonly used tools to evaluate the sustainability of companies is the Global Reporting Initiative (GRI). Since the early 1990s, a wide set of sustainability indicators have been proposed to support firms of any size to understand and communicate their contributions to sustainable development. These indicators consider the economic, environmental, and social impacts of companies aiming at attaining present needs without compromising future generations [15]. The current version of the GRI Report (G4) defines the required principles to build a thorough and comprehensive description of the most important aspects of sustainability in line with the triple bottom line. However, the GRI report measures the sustainable performance of a company as a whole, making it difficult to use it in a part of the company, i.e., a manufacturing process. Moreover, besides considering the three pillars of sustainability, there is no integration among them to evaluate the sustainability as a whole [16].
The Sustainability Metrics of the Institution of Chemical Engineers (IChemE) proposes several indicators used to assess the sustainability performance of process industries. Such a model is in line with the GRI principles and directives and considers the triple bottom line as the “environmental responsibility, economic return (wealth creation), and social development’’ ([17], p. 4).
Azapagic [18] developed a model to evaluate the sustainable performance of mining companies through the proposal of a set of indicators for economic, environmental, and social variables. The indices used were in line with those proposed by the GRI initiative aiming at standardizing the sustainability reports to enable a cross-comparison among the firms. To accomplish that, it was necessary to adopt or exclude some specific indicators not compatible with the mining industry. Delai and Takahashi [19] suggested a referential model to measure the sustainability of companies and to support the companies in implementing sustainable actions. The model was developed considering the strongest aspects of GRI and IChemE models and included four phases: definition of sustainability objectives and goals; measurement of economic, environmental, and social indicators; communication of the results; and continuous evaluation of the sustainable aspects of the company. The sustainability indicators were not integrated into a single measure and the model was difficult to apply for evaluating the sustainability of a manufacturing process.
Finally, Marques et al. [20] proposed a model to evaluate the sustainability of urban water services (UWS), assuming five dimensions: the financial, environmental, and social aspects in addition to governance and asset management. They suggested an additive aggregation model relying on partial scores for each dimension that ended up defining the UWS sustainability level. Despite considering a single measurement to evaluate sustainability, the proposed concept can only be applied to UWS; it is not suitable for manufacturing processes.
There are many other initiatives developed to measure the sustainability level of companies, but they are less commonly used. They include the ISO Environmental Performance Evaluation [21]; the Dashboard of Sustainability [22]; the Barometer of Sustainability Index [23]; the United Nations of Sustainable Development [24]; the ETHOS Corporate Social Responsibility Indicators [25]; the Enterprise Sustainability Index [26]; the Environment Performance Sustainability [7]; the OECD Core Environmental Indicators [27]; and the Food Product Index [28].
Besides evaluating the sustainability performance of companies, previous studies also recognized the need to measure the sustainability of manufacturing processes, considering that the production and operations managers need specific tools to evaluate how they are contributing to the triple bottom line of their respective companies. For this purpose, several initiatives were developed.
Veleva and Ellenbecker [29] identified the need to assess the sustainable production as defined by the Lowell Center for Sustainable Production at the University of Massachusetts—Lowell. The authors proposed a new framework relying on the core and supplemental indicators to improve the way companies were measuring their path towards sustainable manufacturing systems. The model included an eight-step process to implement 22 core sustainable performance indicators and evaluated the sustainability aspects separately.
Labuschagne et al. [9] recognized that existing models to measure overall business sustainability were not adequate to assess the three pillars of sustainability at the manufacturing operations level. Hence, they proposed a framework to be applied to the production system instead of the entire firm to overcome the difficulty presented by previous models. The framework included four levels: the corporate responsibility strategy; the company strategy split into two initiatives: operational and social; the operational initiative evaluated considering the three dimensions of sustainability; and the criteria adopted in each sustainability dimension. Even though this model was designed to be applied at the operational level, its application to measuring the sustainability of a manufacturing process is too complicated and difficult to apply in real-world situations. Moreover, the three sustainability aspects are assumed as standalone concepts with no integration.
Tseng et al. [30] defined sustainable production indicators considering the interdependence between the criteria selected to measure the three pillars of sustainability and the fuzziness of their subjective awareness. They used a combination of fuzzy measures and analytical network process (ANP) approach to propose a large number of sustainable production indicators to evaluate the sustainability of a manufacturing process by monitoring the evolution of each selected indicator.
Following the same objectives proposed by Labuschagne et al. [9], Jung et al. [31] reviewed several sustainability indicators available in the literature and proposed a classification method for quantifiable indicators related to manufacturing operations. They considered five dimensions for sustainability: “environmental stewardship, economic growth, social well-being, technological advancement, and performance management” (p. 150). As a result, more than 200 different indicators were suggested. The manufacturing sustainability measurement was performed considering the progress of each one of the five dimensions.
Subic et al. [32] proposed a new “capability assessment tool” to recognize the capability gaps related to sustainable production. To do that, they identified 170 capabilities grouped into areas such as energy management, resource consumption, carbon emissions, waste generation and reduction, and environmental practices required for sustainable manufacturing. The production sustainability measurement was made through a radar graph considering 18 dimensions (axis). The performance in each dimension was then indicated in a graph, generating a polygon. The area of the resulting figure represented the sustainability performance of the manufacturing process.
A more comprehensive approach was taken by Linke et al. [33] to generate a forthright procedure for measuring the sustainability of discrete production processes. Besides the usual selection of sustainability indicators, the study proposed diverse forms of their normalization. The normalized indices were then simplified to a single sustainability indicator using a utility breakdown to enable a direct comparison among different process variations. Even though Linke et al. [33] offer a single measure to evaluate the sustainability of a manufacturing process by combining the three dimensions of sustainability, the utilization of subjective normalization factors can make its implementation rather complicated on the factory floor.
Although it is not exactly in line with the focus of the present study, Shankar et al. [34] integrated advanced manufacturing techniques with sustainable manufacturing. For that purpose, the authors evaluated many drivers of advanced sustainable production calibrated through the opinions of experts in the field. Then, an analytical hierarchy process (AHP) was used to prioritize the most relevant drivers. Shankar et al. [34] did not consider the sustainability aspects (economic, environmental, and social) to determine the sustainability performance of the production process, which makes it inadequate to support our current research.
Helleno et al. [35] proposed a conceptual model to incorporate sustainability indicators into the value stream mapping (VSM) approach usually applied to manufacturing processes. In principle, their framework was considered a part of the VSM technique for the inclusion of environmental and social variables, in addition to the typical processes and material and information flows considered in traditional VSM applications. Even though the proposed framework considered a single KPI to measure the performance of each sustainability aspect, it does not propose a single measure to aggregate them.
Finally, Kluczek [36] used a multi-criteria method to assess the sustainability of a production process, considering four aspects: technical, economic, environmental, and social. The author defined a rank for activity areas in manufacturing considering the sustainability objectives of a company. As part of this framework, the author proposed a measure called “degree of sustainability in manufacturing,” which was simply calculated as the average of the four indicators for each sustainability aspect. Even though the proposed method allows the integration of the sustainability aspects into a single measure, the utilization of AHP with a weighted scale makes this framework not very user-friendly for the manufacturing floor use.
Considering the methods to evaluate the sustainability performance of a manufacturing process (the main objective of this study), all the aforementioned models suffer from certain limitations: (a) they are applicable for the company as a whole or are not adequate for the sustainability measurement of manufacturing processes, (b) they consider the measures for the triple bottom line aspects as separate variables with no integration among them. This could present a methodological difficulty if different sustainability measures evolve in diverse directions, or (c) they are too complicated to be used as a practical tool by the practitioners on the factory floor.
Therefore, this study proposes a conceptual framework to measure the sustainability level of a specific manufacturing process, integrating the economic, environmental, and social variables into a single measure that will adequately overcome the methodological limitations of previous studies.
2. Materials and Methods
This work proposes a conceptual evaluation of the sustainability of a manufacturing process. A part of the suggested framework is regarded as an index that allows the integration of the three pillars of sustainability into a single measure. This work can be methodologically categorised as a conceptual paper where the literature review on sustainability is complemented by theoretical work and a practical example to support the recommended framework [37,38].
2.1. Proposal for Measuring the Sustainability Level of a Manufacturing Process
As discussed in Section 1, the sustainability of a company or a manufacturing process should consider the following three pillars: economic, environmental, and social sustainability.
Let us assume that the economic aspects associated with a given manufacturing process “P” are represented by a set of “n” financial variables designated by f1, f2, f3,..., fn. Hence, a vector represented by its transposed version (f′P) (Equation (1)) can characterize the financial performance of process “P”.
As part of its conceptual framework, this study defines the financial performance level of a manufacturing process “P” (Pf) as the length of vector f′P. Johnson and Wichern [39] state that the length of vector f’P can be determined using Equation (2):
Conversely, let us assume that the environmental features linked to a given manufacturing process “P” are characterized by a set of “m” environmental variables designated by e1, e2, e3,..., em. Hence, a vector represented by its transposed version (e′P), as shown in Equation (3), can illustrate the environmental performance of process “P”.
Similarly, the environmental performance level of a manufacturing process “P” (Pe) is the length of the vector e’P, which can be calculated using Equation (4).
Finally, the social aspect related to a certain manufacturing process “P” is represented by a set of “p” social variables designated by s1, s2, s3,..., sp. Hereafter, a vector represented by its transposed version (s′P) (Equation (5)) demonstrates the environmental performance of process “P”.
Therefore, the social performance level of a manufacturing process “P” (Ps) is the length of vector s′P (Equation (6)).
The analysis of the way the performance level indicators were built shows the problems in the execution if care is not taken when defining how to measure the indicators. For the adequate and precise utilization of the concepts proposed herein, two safeguards are required. First, all indicators should have the same order of magnitude with indicators expressed as a percentage in their unitary form or in any other arrangement to adjust their measurement unit. Second, all indicators should be built in such a way that they evolve in the same direction, i.e., if the value of the indicators increases, the performance they measure improves, or vice-versa.
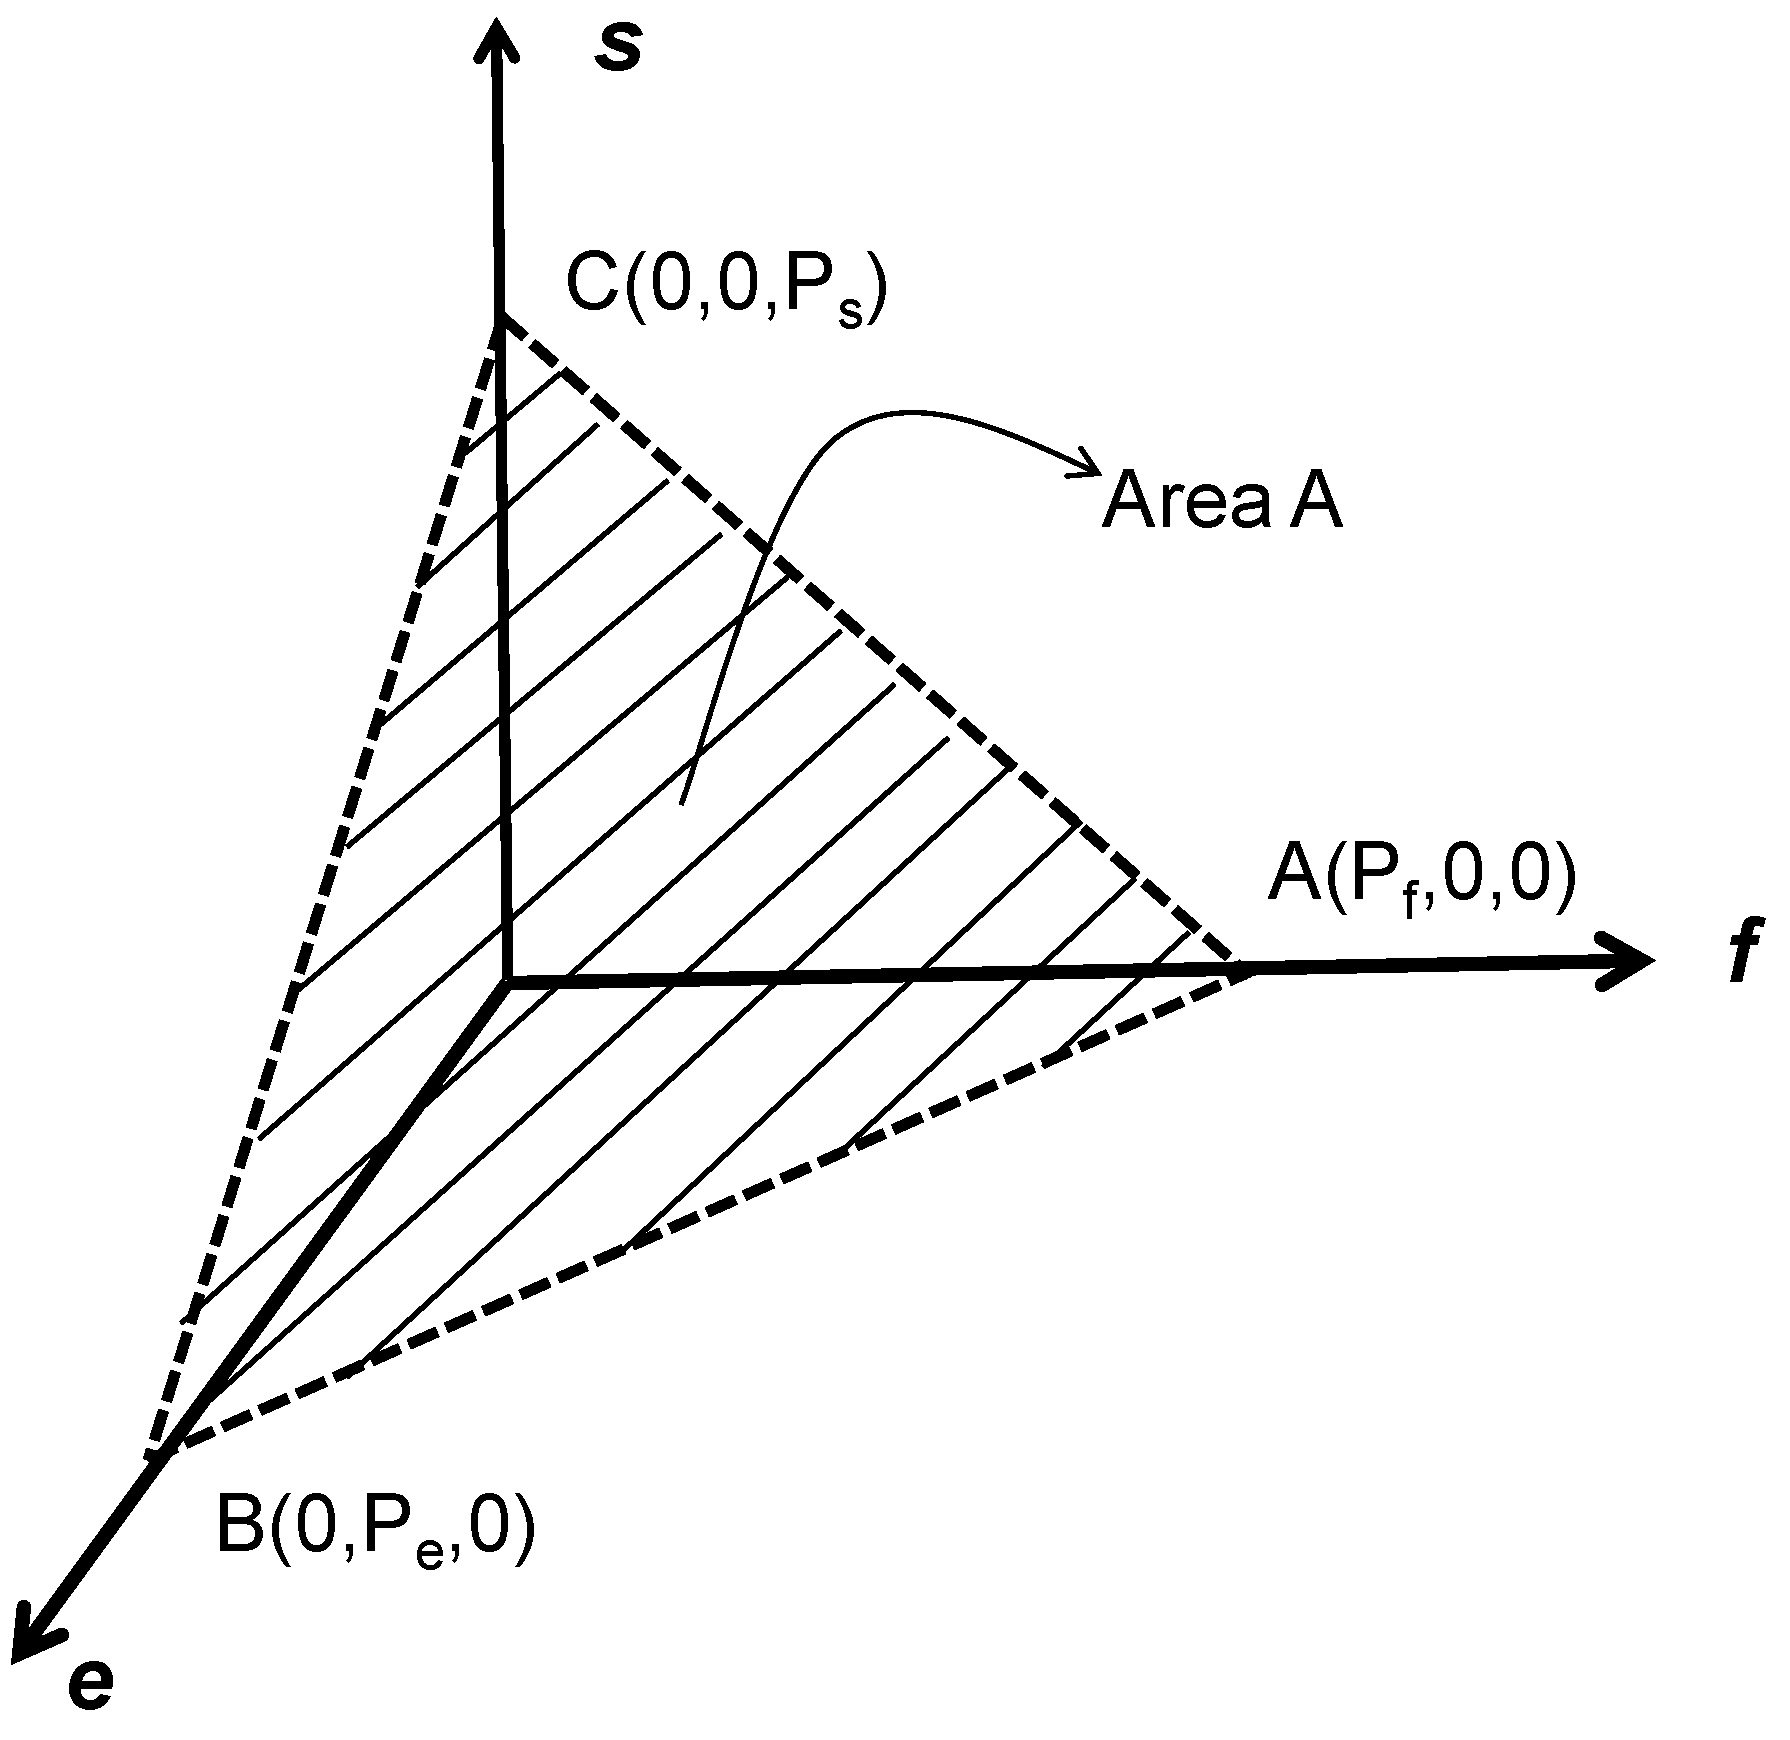
However, measuring the sustainability level of a production process using three different indicators (economic, environmental and social) can present a practical limitation as explained in Section 1. To overcome this difficulty, this work proposes to establish a single combined measure to characterize the sustainability level of a manufacturing process (SP): Let us consider an R3 Cartesian orthogonal reference system where each axis represents one of the three sustainability pillars as shown in Figure 1 (the financial axis-f; the environmental axis-e; the social axis-s). In each axis, let us mark the respective performance level, calculated using Equations (2), (4), and (6), respectively, which defines three points: A(Pf,0,0), B(0,Pe,0), and C(0,0,Ps).
The three points, A, B, and C, in this R3 Cartesian orthogonal reference system, forms a triangle. The sustainability level of the manufacturing process “P” (SP) is defined as the area defined by the triangle ABC to overcome the previously mentioned practical limitations. In fact, it is now possible to determine what happens to the sustainability level of the process after the changes were made to eliminate the problems. Let us assume that the area of the triangle ABC is A1 before the changes were made and A2 after the changes (after increasing Ps and reducing Pf). If A2 > A1, the sustainability level of the manufacturing process “P” increases. If A2 < A1, the sustainability level decreases. If A2 = A1, it remains unchanged.
Following the development, the area of the triangle ABC (sustainability level of manufacturing process “P”) can be determined as follows. First, the length of each side of triangle ABC is calculated [40]:
Then, the area P is calculated using Heron’s formula [40]:
In summary, the framework to determine the sustainability level of the manufacturing process “P” can be established through the following steps:
- ○
- Select the variables that describe the economic aspects of process “P” (f1, f2, …, fn);
- ○
- Do the same for the environmental aspects (e1, e2, …, em);
- ○
- Do the same for the social aspects (s1, s2, …, sp);
- ○
- Calculate the economic performance of process “P” using Equation (2);
- ○
- Calculate the environmental performance of process “P” using Equation (4);
- ○
- Calculate the social performance of process “P” using Equation (6);
- ○
- Calculate the area A of triangle ABC using Equations (7) through (10). Area A represents the sustainability level of manufacturing process “P”.
It will then be possible to monitor the progress of the sustainability level of a given manufacturing process by repeating these steps through time. If the area “A” increases, the sustainability level will improve; otherwise, it will be decreasing or will remain constant.
To improve the understanding of its practical applications, this framework was applied to a CNC machining lathe that produces non-ferrous metal parts for industrial applications.
2.2. Selection of the Manufacturing Process to Support the Case Study
To exemplify how the proposed framework for measuring the sustainability level of a manufacturing process could be applied to a real-world situation, a case study was developed. The researchers used the manufacturing data provided by a sustainability-conscious non-ferrous metal part producer that manufactures finished machine parts from cast blanks in their own foundry.
According to Ritzman and Krajewski [41], a manufacturing process is any activity that starts with one or more inputs, transforming and adding value to them, and generating one or more products. According to this definition and considering the recommendations made by Garriston et al. [42], among all the possible industrial processes/equipment, the researchers chose a CNC machining lathe operating six days per week on a three-shift basis, based on three main reasons: (a) it encompassed a set of sustainability indicators adequately to demonstrate the application of the proposed framework; (b) it was used to machine several types of complex cylindrical parts, very similar to each other (to avoid mixing problems); and (c) it presented an operational problem whose resolution affected several sustainability indicators. These characteristics made this equipment suitable for this study.
The selected equipment is a Mazak CNC lathe, model Quick Turn Nexus 250, with a capacity to turn parts up to 380 mm in diameter, with a displacement of 230 mm in axis “x” and 575 mm in axis “z”. Its operating power is 26 kW. It occupies a floor space of 2930 mm × 1978 mm. Its operation follows the standard process parameters for each machined part. Since the parts manufactured in this machine were very similar, the changes in machining parameters (other than the cycle time) were negligible. All the machined parts were made of cast bronze. Typical values used were 4000 rpm, feed 0.2 mm/turn, and depth of cut 0.1 mm.
The company that operates this machine monitors a set of economic, environmental, and social indicators (Table 1). In Table 1, unusual units were used to measure sustainability indicators because, to properly apply the proposed framework, indicators should have the same order of magnitude and should be built in such a way that they evolve in the same direction (in this case, the higher, the better). Therefore, based on the actual values provided by the company, the authors adjusted the measuring units to incorporate those two safeguards and allow an adequate utilization of the proposed method.
Values required to determine the sustainability indicators are obtained by the industrial engineering department on a monthly basis; i.e., at the end of each month, the industrial engineer that supervises the machining area gathers all the needed data from several sources to calculate the indicators, which are then made available to the management and decision-makers of the company. The results expressed in Table 1 reflect the monthly average values for the second half of 2016.
3. Results of the Case Study
This machining centre had an operational problem; the company reported that the number of lost hours due to accidents was significantly higher than in similar machines operated in the same environment. One kaizen team deployed to assess this issue stated that the problem occurred during the part unloading operation. To minimize the cycle time, the operators attempted to remove the finished part while it was still spinning at a reduced speed. As it is impossible for the operator to evaluate how fast the part is moving, sometimes this unloading action ends up provoking small injuries to the operator’s fingers. They are not serious wounds but enough to cause loss of work hours (usually a couple of days).
To eliminate this problem, the kaizen team implemented a lock on the machine door that would allow the operator to open it only after the spindle was completely stopped. This modification required some adjustments to the CNC programs, which resulted in an increase of 3% in the cycle time and the labour cost, 1% in the setup time, and 1.5% in electric energy costs. After the implementation of these modifications and allowing some time for the process to stabilize, the number of lost hours due to accidents in this CNC machining lathe dropped significantly, by 37%, to values comparable to other pieces of equipment in the same area. These new inputs were adjusted by the authors to comply with the selected measuring units. Table 2 shows the values of the sustainability indicators after the intervention of the kaizen team.
To easily compare the results before and after the process intervention, Equations (2), (4), and (6) were applied to calculate the effect of changes on the economic, environmental, and social performance of the CNC machining lathe. These results are summarized in Table 3.
This example clearly shows the problem associated with not having a single measure of the sustainability level of a manufacturing process. The kaizen team intervention improved the social performance of the machine under evaluation (from 68.45 to 84.27) (Table 3). However, this improvement adversely affected both the environmental (from 83.19 to 82.84) and the economic (from 54.56 to 53.08) performance. In general, the gains were more significant than the losses, resulting in an overall sustainability improvement achieved with the intervention in the CNC machining lathe. If the differences were not significant, it would be difficult to reach a conclusion about the effect of the process change on the overall sustainability level. However, the framework proposed in this study contributes to overcoming that issue by calculating a unique measure to evaluate the sustainability level of the process by applying Equations (7)–(10) (Table 4).
In the case study, the modifications implemented in the manufacturing process improved the overall sustainability level of the CNC machining lathe by 7.5% (from 147.4 to 158.1) (Table 4). Despite different magnitudes of environmental, economic, and social performance measures, this framework considered even the small variations in the opposite directions (not intuitive when considered individually) in determining the overall impact on the sustainability level.
4. Discussion and Conclusions
The framework proposed here closes some gaps identified in the literature. First, it allows the evaluation of the sustainability of manufacturing processes providing managers with a tool to assess the effect of their operational actions and to contribute to the improvement of the triple bottom line of their companies. This surpasses the limitations observed in several sustainability models such as the Dow Jones Sustainability Index [13], GRI [16], the Sustainability Metrics of the Institution of Chemical Engineers [17] and the models proposed by Elkington [11], Azapagic [18], Labuschagne et al. [9], and Delai and Takahashi [19].
The framework also suggested a method to integrate the three aspects of sustainability (economic, environmental, and social) into a single measure, making it possible to overcome the constraints in evaluating the sustainability at the manufacturing process level. Hence, the proposed framework has a significant advantage over the initiatives reported in the literature such as Subic [32], Linke et al. [33], Shankar et al. [34], Helleno et al. [35], and Kluczeck [36].
Consequently, the suggested framework contributes to both the theory and the practical applications of sustainability evaluation methods. On the theoretical side, this work proposes a new and innovative way to evaluate the sustainability level of a manufacturing process using a single measure, which was not contemplated as proposed here in the extant literature. On the practical side, the framework provides a user-friendly tool for manufacturing managers to measure the impact of their actions on the improvement of the triple bottom line of their firms.
The proposed framework has some limitations. First, the application of the framework considered only one manufacturing process/equipment with unusual characteristics. The authors recommend the utilization of the proposed framework in several other manufacturing processes to validate its use in more complex situations. Second, the case study presented here only aimed at showing the framework operation in a real-world situation. However, in more complex scenarios, if care is not taken during the selection of sustainability indicators, different sets of indices for each piece of equipment could be obtained, making it difficult to assess the sustainability for the entire manufacturing area. Further research is needed to develop new criteria and guidelines to establish sustainability indicators that enable a single set of measures to be used in the same manufacturing area for different types of equipment.
Acknowledgments
The authors are grateful to the Research Backing Fund from UNINOVE—Universidade Nove de Julho for providing the financial support needed to develop this work.
Author Contributions
Wagner Cezar Lucato was responsible for the development of the conceptual model and the writing of the paper. Athos Paulo Tadeu Pacchini was responsible for the literature search and José Carlos da Silva Santos for performing the case study.
Conflicts of Interest
The authors declare no conflict of interest.
References
- Camioto, F.C.; Mariano, E.B.; Rebelatto, D.A.N. Efficiency in Brazil’s industrial sectors in terms of energy and sustainable development. Environ. Sci. Policy 2014, 37, 50–60. [Google Scholar] [CrossRef]
- Kleindorfer, P.R.; Singhal, K.; Van Wassenhove, L.N. Sustainable Operations Management. Prod. Oper. Manag. 2005, 14, 482–492. [Google Scholar] [CrossRef]
- Tajbakhsh, A.; Hassini, E. A Data Envelopment Analysis Framework to Evaluate Sustainability in Supply Chain Networks. J. Clean. Prod. 2015, 105, 74–86. [Google Scholar] [CrossRef]
- Wieczorek, A. Sustainability transitions in developing countries: Major insights and their implications for research and policy. Environ. Sci. Policy 2017, (in press). [Google Scholar] [CrossRef]
- Fiksel, J.; Mcdaniel, J.; Mendenhall, C. Measuring Progress towards Sustainability Principles, Process and Best Practices; Battelle Memorial Institute: Columbus, OH, USA, 1999. [Google Scholar]
- Schneider, A.; Meins, E. Two Dimensions of Corporate Sustainability Assessment: Towards a Comprehensive Framework. Bus. Strateg. Environ. 2012, 21, 211–222. [Google Scholar] [CrossRef]
- Prescott-Allen, R. The Wellbeing of Nations: A Country-by-Country Index of Quality of Life and the Environment; Island Press: Washington, DC, USA, 2001. [Google Scholar]
- Garetti, M.; Taisch, M. Sustainable Manufacturing: Trends and Research Challenges. Prod. Plan. Control 2012, 23, 83–104. [Google Scholar] [CrossRef]
- Labuschagne, C.; Brent, A.C.; Erck, V. Assessing the Sustainability Performance of Industries. J. Clean. Prod. 2015, 13, 373–385. [Google Scholar] [CrossRef]
- Elkington, J. Towards the sustainable corporation: Win-win-win Business Strategies for Sustainable Development. Calif. Manag. Rev. 1994, 36, 90–100. [Google Scholar] [CrossRef]
- Elkington, J. Cannibals with Forks: The Triple Bottom Line of the 21st Century Business; New Society Publishers: Oxford, UK, 1997. [Google Scholar]
- Chen, T. Competitive and Sustainable Manufacturing in the Age of Globalization. Sustainability 2017, 9, 26. [Google Scholar] [CrossRef]
- Robecosam. Dow Jones Sustainability Indices—Methodology. 2017. Available online: http://www.sustainability-indices.com/index-family-overview/djsi-family-overview/index.jsp (accessed on 15 July 2017).
- Blitzer, D.M. Dow Jones Sustainability Indices Methodology; S&P Dow Jones: New York, NY, USA, 2017. [Google Scholar]
- Boulter, J.; Goodchild, L. GRI Year in Review: A New Phase: The Growth of Sustainability Reporting; Global Reporting Initiative (GRI): Amsterdam, The Netherlands, 2011. [Google Scholar]
- GRI. G4: Sustainability Reporting Guidelines; Global Reporting Initiative (GRI): Amsterdam, The Netherlands, 2013. [Google Scholar]
- IChemE. The Sustainability Metrics; Institution of Chemical Engineers (IChemE): Warwickshire, UK, 2005; Available online: http://www.icheme.org/~/media/Documents/Subject%20Groups/Sustainability/Newsletters/Sustainability%20Metrics.pdf (accessed on 17 July 2017).
- Azapagic, A. Developing a Framework for Sustainable Development Indicators for Mining and Mineral Industry. J. Clean. Prod. 2004, 12, 639–662. [Google Scholar] [CrossRef]
- Delai, I.; Takahashi, S. Sustainability measurement system: A reference model proposal. Soc. Responsib. J. 2011, 7, 438–471. [Google Scholar] [CrossRef]
- Marques, R.; Cruz, N.F.; Pires, J. Measuring the sustainability of urban water services. Environ. Sci. Policy 2015, 54, 142–151. [Google Scholar] [CrossRef]
- ISO. Environmental Management-Environmental Performance Evaluation–Guidelines, ISO 14031:1999(E); ISO–International Organization for Standardization: Geneva, Switzerland, 1999. [Google Scholar]
- Hardi, P.; Zdan, T.J. The Dashboard of Sustainability; IISD: Winnipeg, MB, Canada, 2000. [Google Scholar]
- Schmidt, W.; Taylor, A. Ford of Europe’s product sustainability index. In Proceedings of the 13th CIRP International Conference on Life Cycle Engineering, Leuven, Belgium, 15 September 2006; pp. 5–10. [Google Scholar]
- United Nations Committee on Sustainable Development (UN-CSD). Indicators of Sustainable Development: Guidelines and Methodologies, 3rd ed.; The United Nations: New York, NY, USA, 2007; Available online: http://www.un.org/esa/sustdev/natlinfo/indicators/guidelines.pdf (accessed on 14 July 2017).
- Ethos. Indicators of Corporate Social Responsibility; Instituto ETHOS: São Paulo, Brazil, 2007; Available online: https://www3.ethos.org.br/wp-content/uploads/2013/02/Ethos-Indicators-on-Corporate-Social-Responsibility-2007.pdf (accessed on 16 July 2017).
- BM&FBovespa. Índice de Sustentabilidade Empresarial (ISI); BM&FBovespa: São Paulo, Brazil, 2010; Available online: http://www.bmfbovespa.com.br/pt_br/produtos/indices/indices-de-sustentabilidade/indice-de-sustentabilidade-empresarial-ise.htm (accessed on 17 July 2017).
- OECD. OECD Environmental Indicators: Development, Measurement and Use; OECD Environmental Performance and Information Division: Paris, France, 2003; Available online: https://www.oecd.org/env/indicators-modelling-outlooks/24993546.pdf (accessed on 16 July 2017).
- Hsu, A.; Alexandre, N.; Cohen, S.; Jao, P.; Khusainova, E.; Mosteller, D.; Peng, Y.; Rosengarten, C.; Schwartz, J.D.; Spawn, A.; et al. 2016 Environmental Performance Index; Yale University: New Haven, CT, USA, 2016; Available online: http://www.epi.yale.edu/sites/default/files/2016EPI_Full_Report_opt.pdf (accessed on 15 July 2017).
- Veleva, V.; Ellenbecker, M. Indicators of Sustainable Production: Framework and Methodology. J. Clean. Prod. 2001, 105, 74–86. [Google Scholar] [CrossRef]
- Tseng, M.L.; Devinagracia, L.; Devinagracia, R. Evaluating firm’s sustainable production indicators in uncertainty. Comput. Ind. Eng. 2009, 57, 1393–1403. [Google Scholar] [CrossRef]
- Jung, C.B.; Carrel, J.; Sarkar, P.; Feng, S.C. Categorization of indicators for sustainable manufacturing. Ecol. Indic. 2013, 24, 148–157. [Google Scholar] [CrossRef]
- Subic, A.; Shabani, B.; Hedayati, M.; Crossin, E. Performance Analysis of the Capability Assessment Tool for Sustainable Manufacturing. Sustainability 2013, 5, 3543–3561. [Google Scholar] [CrossRef]
- Linke, B.S.; Cormanb, G.J.; Dornfeldb, D.A.; Tönissen, S. Sustainability indicators for discrete manufacturing processes applied to grinding technology. J. Manuf. Syst. 2013, 32, 556–563. [Google Scholar] [CrossRef]
- Shankar, K.M.; Kumar, P.U.; Kannan, D. Analyzing the Drivers of Advanced Sustainable Manufacturing System Using AHP Approach. Sustainability 2016, 8, 824. [Google Scholar] [CrossRef] [Green Version]
- Helleno, A.L.; Moraes, A.J.I.; Simon, A.T. Integrating sustainability indicators and Lean Manufacturing to assess manufacturing processes: Application case studies in Brazilian industry. J. Clean. Prod. 2017, 153, 405–416. [Google Scholar] [CrossRef]
- Kluczek, A. An overall multi-criteria approach to sustainability assessment of manufacturing processes. Proc. Manuf. 2017, 8, 136–143. [Google Scholar] [CrossRef]
- Bryman, A. Research Methods and Organization Studies; Routledge: London, UK, 1995. [Google Scholar]
- Collins, J.; Hussey, R. Business Research Methods; McGraw-Hill: New York, NY, USA, 2007. [Google Scholar]
- Johnson, R.A.; Wichern, D.W. Applied Multivariate Statistical Analysis; Prentice-Hall: Upper Saddle River, NJ, USA, 1998. [Google Scholar]
- Ryan, M. Geometry for Dummies, 2nd ed.; For Dummies Books: New York, NY, USA, 2015. [Google Scholar]
- Ritzman, L.P.; Krajewski, L.J. Foundations of Operations Management; Pearson Education: New York, NY, USA, 2003. [Google Scholar]
- Garretson, I.C.; Mani, M.; Leong, S.; Lyons, K.W.; Haapala, K.R. Terminology to support manufacturing process characterization and assessment for sustainable production. J. Clean. Prod. 2016, 139, 986–1000. [Google Scholar] [CrossRef]
Figure 1.
The R3 Cartesian orthogonal reference system proposed by this work.


Table 1.
Initial sustainability indicators used for CNC machining lathe.
| Dimension | Indicators | Values | Measuring Units |
|---|---|---|---|
| Environmental | e1—scrap generation | 14.28 | Parts/kg |
| e2—soluble oil consumption | 40.81 | Parts/10 L | |
| e3—tool insert consumption | 55.55 | Parts/4 cutting edges | |
| e4—electric energy consumption | 44.34 | Parts/10 kWh | |
| Economic | f1—cycle time | 48.78 | Parts/h |
| f2—setup time | 22.22 | Parts/min | |
| f3—labour cost | 10.16 | Parts/US$10.00 | |
| Social | s1—illumination level | 16.20 | Lux × 10⁻¹ |
| s2—lost hours due to accidents | 55.20 | Parts/h × 10 | |
| s3—training hours | 38.20 | h/part × 10⁻⁴ | |
| s4—noise level | 15.45 | (dB standard/dB actual) × 10 |
Source: Researched Company.
Table 2.
Sustainability indicators after kaizen team intervention.
| Dimension | Indicators | Values | Measuring Units |
|---|---|---|---|
| Environmental | e1—scrap generation | 14.28 | Parts/kg |
| e2—soluble oil consumption | 40.81 | Parts/10 L | |
| e3—tool insert consumption | 55.55 | Parts/4 cutting edges | |
| e4—electric energy consumption | 43.68 | Parts/10 kwh | |
| Economic | f1—cycle time | 47.29 | Parts/h |
| f2—setup time | 21.99 | Parts/min | |
| f3—labour cost | 9.86 | Parts/US$10.00 | |
| Social | s1—illumination level | 16.20 | Lux × 10⁻¹ |
| s2—lost hours due to accidents | 71.70 | Parts/h × 10 | |
| s3—training hours | 38.20 | h/part × 10⁻⁴ | |
| s4—noise level | 15.45 | (dB standard/dB actual) × 10 |
Source: Researched Company.
Table 3.
Comparison of environmental, economic and social performances.
| Initial | After Intervention | ||||
|---|---|---|---|---|---|
| Dimension | Indicators | Values | Performance | Values | Performance |
| Environmental | e1—scrap generation | 14.28 | 83.19 | 14.28 | 82.84 |
| e2—soluble oil consumption | 40.81 | 40.81 | |||
| e3—tool insert consumption | 55.55 | 55.55 | |||
| e4—electric energy consumption | 44.34 | 43.68 | |||
| Economic | f1—cycle time | 48.78 | 54.56 | 47.29 | 53.08 |
| f2—setup time | 22.22 | 21.99 | |||
| f3—labour cost | 10.16 | 9.86 | |||
| Social | s1—illumination level | 16.20 | 68.45 | 16.20 | 84.27 |
| s2—lost hours due to accidents | 52.20 | 71.70 | |||
| s3—training hours | 38.20 | 38.20 | |||
| s4—noise level | 15.45 | 15.45 | |||
Table 4.
Measurement of the sustainability levels of the CNC machining lathe.
| Initial | After Intervention | |||||
|---|---|---|---|---|---|---|
| Dimensions | Performance (Pi) | AB/BC/AC | Process Sustainability Level | Performance (Pi) | AB/BC/AC | Process Sustainability Level |
| Environmental | 83.19 | 99.49 | 147.38 | 82.84 | 98.39 | 158.08 |
| Economic | 54.56 | 87.53 | 53.08 | 99.59 | ||
| Social | 68.45 | 107.73 | 84.27 | 118.17 | ||
© 2017 by the authors. Licensee MDPI, Basel, Switzerland. This article is an open access article distributed under the terms and conditions of the Creative Commons Attribution (CC BY) license (http://creativecommons.org/licenses/by/4.0/).
Share and Cite
MDPI and ACS Style
Lucato, W.C.; Santos, J.C.d.S.; Pacchini, A.P.T. Measuring the Sustainability of a Manufacturing Process: A Conceptual Framework. Sustainability 2018, 10, 81. https://doi.org/10.3390/su10010081
AMA Style
Lucato WC, Santos JCdS, Pacchini APT. Measuring the Sustainability of a Manufacturing Process: A Conceptual Framework. Sustainability. 2018; 10(1):81. https://doi.org/10.3390/su10010081
Chicago/Turabian StyleLucato, Wagner Cezar, José Carlos da Silva Santos, and Athos Paulo Tadeu Pacchini. 2018. "Measuring the Sustainability of a Manufacturing Process: A Conceptual Framework" Sustainability 10, no. 1: 81. https://doi.org/10.3390/su10010081
Note that from the first issue of 2016, this journal uses article numbers instead of page numbers. See further details here.