1. Introduction
Tourist destinations’ competitiveness is based on their ability to offer attractive and up-to-date lodging and infrastructures [
1,
2,
3,
4,
5,
6,
7,
8,
9,
10]. Today, competitiveness can also be seen in terms of the image conveyed by lodgings and destinations [
11,
12,
13]. In the digital age, there is an intensive exchange of information between users and companies and lodgings’ image on the Internet is a critical factor in their competitiveness [
14]. Opinions shared by customers on specialized pages build an online reputation that is the basis for many customer purchasing decisions [
15,
16,
17]. This information also determines the competitive positioning of lodgings and tourist destinations [
18].
A tourist destination is composed of a set of resources and capacities organized to obtain a level of competitiveness that guarantees its sustainability [
10]. Therefore, it is a complex network of various actors involved in achieving their individual and collective objectives through the products and services offered [
5,
19,
20,
21,
22,
23,
24,
25,
26,
27]. Due to the digitalization of tourism markets, the image and promotion of tourist destinations are dynamic factors that must be constantly monitored to maintain competitiveness [
28,
29]. In this context, tourist destinations’ organization allows them to achieve a competitive positioning in relation to their main competitors [
18]. This process requires leadership, usually by the authorized public administration, in order to coordinate the various stakeholders involved [
8,
30,
31,
32].
A destination’s competitiveness is based on environmental, cultural and economic sustainability, offering higher value to its customers compared to other competing destinations [
33,
34,
35]. In this context, destinations compete with each other, which means that destination marketing organizations (DMO) need tools to establish their market positioning [
36]. Hooley et al. [
37] (p. 105) state that “the competitive positioning a firm chooses to occupy is a combination of its choice of target market and the differential advantage it is seeking to create as a means of securing that market”. Therefore, the destination’s positioning should be based on consumers’ needs. Companies competing in a market are assessed by customers on the basis of a number of variables or attributes [
38].
Currently, the Internet makes a large amount of quantitative and qualitative information available to users and managers that can be used to determine the competitive positioning of lodgings and tourist destinations [
18]. This information collected in specialized databases shapes the online reputation of hospitality firms, if they are analyzed individually and destinations, when analyzing lodging offer as a whole. As a result, the performance of companies and tourist destinations increasingly depends on the reputation generated by social media [
39,
40,
41,
42]. The quantitative variables that are usually evaluated by clients on specialized websites measure the quality of the perceived service and the perceived value [
43]. Thus, some authors have proposed new variables based on the aforementioned scales, such as the average service quality and added value, where quality of service and lodging price are linked [
18]. In this regard, the competitive positioning of tourist destinations can be determined from these quantitative variables evaluated by customers.
The aim of this study is to design and implement a methodology for positioning tourist destinations based on their lodging offer. To this end, the quantitative variables measured with the online scale of customer evaluation on the Booking.com website will be used. Other variables such as average quality of service, value perceived and added value will also be included. To the extent that the customer obtains a competitive value offer for the services sought, s/he will be more likely to pay a higher price, which will lead to an increase in destinations’ productivity [
44,
45].
This paper begins by reviewing the literature on online reputation and the quantitative variables used to measure it, as well as the empirical methodology to be used to determine the competitive positioning of three tourist destinations: South of Gran Canaria (Canary Islands, Spain), South of Tenerife (Canary Islands, Spain) and Agadir (Morocco). The results obtained are developed from the perspective of the average quality of service, added value and price. In addition, a multiple regression analysis is carried out to determine the relationship between the perceived quality average and the perceived value in each destination studied. Finally, the main conclusions obtained are presented, as well as the implications for research and practice of the proposed methodology for the competitive positioning of tourist destinations.
2. Literature Review
Customers’ online opinions can be shared through quantitative variables or qualitative comments [
46]. These opinions generate a state of opinion that shapes what is known as the online reputation, which is made up of a series of evaluations, opinions, images, or videos about the goods or services that customers contract [
17]. Einwiller [
47] states that the online reputation is an interactive process of information exchange among different actors (companies, customers and users) through different social media. In this context, the online reputation is beyond the direct control of companies, although they can influence it through a communication activity strategically aimed at customers to promote the image of goods, services, brands and companies [
48].
In the case of tourism, the introduction of digitization has meant that the online reputation largely determines the commercial and financial performance of lodging and tourism destinations [
49,
50]. Engagement and visibility are key factors in maintaining an effective communication activity on the Internet where customers can access a large amount of information about possible vacation alternatives. This situation has led to different types of research on customers’ online purchasing behavior [
51,
52,
53], the quality of the service received and customer satisfaction [
15,
54] and the pricing and revenue of lodgings [
41].
Customers’ online opinions have been researched in the tourism sector [
43]. Online customer reviews are defined by Mudambi and Schuff [
55] as the evaluations of products or services made by customers on third-party websites, which have a direct effect on the image of companies. The constant flow of information produced by clients has become a strategic factor in companies’ communication because it establishes a public evaluation of the perceived service quality and value [
18,
43,
54]. Currently, lodging managers have to constantly analyze customers’ opinions in order to evaluate the quality of the service provided and set the pricing policy [
43,
46], as an effective way to determine customer perceptions and satisfaction levels and establish dynamic competitive strategies [
51,
56,
57,
58].
Online customer evaluations on the main tourism web portals measure perceived value and perceived service quality [
18,
43]. In the specialized management and marketing literature, creating value for the final consumer is a key concept in developing a sustained competitive advantage [
59,
60,
61,
62,
63,
64]. Value must be understood from the customer’s perspective, in order to offer the most added value possible and from companies’ internal perspective because they must be competitive and profitable at the same time [
65,
66]. When a company or organization efficiently offers a higher added value than competitors, it achieves a more competitive positioning in the market [
67].
In the case of service companies, value creation determines their strategy and tactics because it is a subjective concept from the perspective of customers and service workers who perform the service [
68]. For Holbrook [
69], value creation is a relative preference related to a subject’s experience when interacting with an object, with the subject being the consumer and the object being the good or service s/he acquires. Moreover, Zeithaml [
70] carried out a study establishing four possible definitions of value: (a) low price; (b) what the customer wants in a good or service; (c) the quality the customer gets for what s/he pays; and (d) what the customer gets for what he gives. Rust and Oliver [
71] have studied the concept of value, establishing that it is directly related to the utility of the quality offered to the client and inversely related to the disutility of the price s/he has to pay.
Perceived value has been measured through different methods [
71,
72,
73] and it is related to the quality of service [
74], customer satisfaction [
75] and price paid [
76]. In the area of tourism, perceived value has been studied by Rodríguez-Díaz et al. [
18] in relation to the added value created by the lodgings and the reliability and validity of the scales of variables used by the specialized websites to obtain customer valuations [
46,
50]. An essential aspect of the academic debate in tourism is to determine the difference between quality of service and customer satisfaction. Torres [
77] states that quality of service is a process with an outcome that is generally measured in quantitative terms, whereas satisfaction is related to an overall assessment by customers, often expressed in qualitative terms through opinions. In this context, customer satisfaction is determined through content analysis of customers’ written reviews [
49,
78].
This study uses the information collected on the Booking.com website, which contains quantitative and qualitative information. In order to study the competitive positioning of tourist destinations through the ratings of their lodging offer, only the quantitative variables that measure the quality of the perceived service and the perceived value will be used [
18,
43]. It should be emphasized that, according to Prebensen et al. [
79], the perceived value in tourism is usually measured with a single-item scale, such as “value for money” or “quality-price relationship,” although some authors find this type of measurement insufficient [
80,
81]. However, the reality of Internet communication means that measurement scales have to be short in order to motivate users to respond and so they normally include only the most relevant variables related to the service to be evaluated.
Therefore, the measurement of perceived value is generally based on a single item scale closely related to the quality of the perceived service, the utility received and the price paid by customers [
50]. Conversely, perceived quality of service is often measured through scales with various items, such as location, staff, comfort, facilities, cleanliness and Wi-Fi [
43]. Price is a variable that can also be obtained directly from the Booking.com website and it is closely linked to the category [
82,
83] and the quality of service perceived by customers [
84,
85]. Thus, when the category increases, prices also increase and the effect on the value perceived by customers is negative [
46,
50].
For López-Fernández and Serrano-Bedia [
86] and O’ Connor [
78], customers demand a higher quality of service when a lodging increases its category because they have to pay a higher price. This is reflected in the value-added variable because Rodríguez-Díaz et al. [
18] demonstrated that, as the number of stars increases, the added value is reduced due to the higher price. Regarding the price in tourism, it is usually modified according to seasonality and the level of demand at any given time [
87]. Therefore, although lodgings can carry out promotions depending on the level of occupation, in general it is possible to differentiate between high and low seasons in destinations. These seasons may vary depending on the location of the destinations. In the case of the Canary Islands and Agadir, the high season coincides with winter, when most Mediterranean destinations are closed, whereas the low season is during the spring and part of the summer. Based on the above, the competitive positioning of tourist destinations will be determined based on the variables on the Booking.com scales to measure the quality of service perceived and the perceived value, price, category and value-added variable [
18].
3. Research Methodology
To determine the competitive positioning study of tourist destinations, information was obtained from 403 lodging complexes. Three tourist destinations are analyzed. Two are from the Canary Islands (Spain) (South of Gran Canaria and South of Tenerife) and one from Morocco (Agadir) and all of them are marketed through the Booking.com website. The destinations analyzed are competitive because they are all focused on the sun and beach tourism segment. They are also located below the 30th parallel north, at a similar distance to the main tourist market in central Europe. The Canary Islands receive more than 12 million tourists a year [
88], whereas Agadir and the Souss Massa Drâa region receive 4 million tourists a year [
89]. The total number of customer evaluations of the tourism companies in these destinations was 69.024. The number of lodgings in the destination of the South of Gran Canaria was 272, with 38.096 customer evaluations; in the South of Tenerife, there were 82 lodgings, with 20.950 ratings; and in the destination of Agadir, there were 49 lodgings and 9.978 customer reviews.
The Booking.com website contains ratings by real customers of lodgings where they stayed. In addition, Rodríguez-Díaz and Espino-Rodríguez [
46] demonstrate that it is the most reliable and valid database available on the Internet and the competitive positioning of destinations should be performed with the most precise information possible. The scale used by Booking.com consists of seven variables measured on a 10-point scale (1 = very bad evaluation; 10 = very good evaluation). However, Mellinas et al. [
90] indicate that the original scale has 4 points that are transformed into 10 points by means of an adjustment. For this reason, the scale is biased, as the lowest evaluation given to a customer is 2.5 points and the maximum score is 10 points.
The seven-variable scale used by Booking.com consists of: staff (S), service/facilities (F), cleanliness (Cl), comfort (Co.), location (L), Wi-Fi (W) and value for money (V) (see
Table 1). Booking.com determines the “average hotel score” (HAS) by calculating the average of all these variables on the scale. Other variables used in the analysis and obtained from the same website were “category” of lodging and “price”. The price varies throughout the year according to seasonality and, within the season, according to the level of demand. For this reason, the highest and lowest prices of each lodging have been determined in the high (winter) and low (summer) seasons for these destinations. The prices for each lodging were obtained by searching the Booking.com website in the periods of time that the sector considered the most common for high and low prices in each season. In winter, which is high season for these destinations, the highest price periods are November, February and March, with the lowest prices in the first twenty days of December and January. In the summer, prices are highest at the end of July, August and October, whereas the lowest prices are usually found in May, June and the first half of July.
In addition, two new variables have been identified: the quality average (Q) and the added value (AV). Because Wi-Fi efficiency depends on the destinations’ infrastructure, which is often beyond the control of the lodging, this variable was not included in the positioning study. Thus, the average quality (Q) variable was determined by calculating the mean of the variables that measure the perceived service: staff (S), service/facilities (F), cleanliness (Cl), comfort (Co.) and location (L). The perceived value (V) is measured on Booking.com by means of a single variable, the value for money (V). Moreover, Ye et al. (2014) performed a factorial analysis of the variables that determine the perceived quality of service in order to establish whether the scale was one-dimensional. Following this procedure,
Table 2 shows the results obtained from the factorial analyses of all the destinations as a group and each one separately. The table shows that the variance explained by all the destinations was 59.438%, whereas the destination of Gran Canaria obtained 58.534%, Tenerife 73.699% and Agadir 70.865%. The variable that achieved the lowest factor load, below 0.5, was cleanliness, with the exception of the destination of Tenerife (0.904).
The added value is quantitatively determined in this study following the procedure proposed by Rodríguez-Díaz et al. [
18], where the added value is the result of subtracting the quality average (Q) from the perceived value (V). When a customer thinks the service received corresponds to the price s/he has paid, the value added will be zero. However, if the customer believes that the price paid is higher than the service received, s/he will tend to score the perceived value below the quality average, resulting in a negative added value. Finally, if the customers view the price paid to be less than the service received, the added value will be positive because the perceived value will be higher than the quality average. The latter usually occurs in high-class lodgings, where a high standard of service quality is offered but the price paid by customers is high. In these cases, clients are often very strict and generally assess perceived value (V) below the average quality of perceived service (Q).
4. Analysis of Results
Using the variables described above, the competitive positioning analysis of tourist destinations is carried out in three stages. The first stage evaluates the value perceived by customers in tourist destinations to determine its relationship with the service, price and category variables because the latter two constructs can be evaluated with the information available on Booking.com, in addition to being theoretically closely related. Next, the competitive positioning of destinations is determined according to the quality average, added value and maximum price in high season. Finally, the competitive positioning of the lodgings according to the category is carried out, showing that companies in these destinations compete based on the variables described in the previous stage.
4.1. Customer Value Evaluation
In order to study the relationships between perceived value and perceived service quality, price and category, a multiple regression analysis was carried out, where the dependent variable was perceived value and the independent variables were five variables from the scale of perceived service, four price variables and the category of lodging variable.
Table 3 shows the results obtained for all the destinations together and then for each of them individually. The analysis of all the lodgings in the three destinations at the same time reveals that the adjusted R2 is quite high, 0.629. However, not all the variables are significantly related. The category of lodgings is significantly (0.0000) and inversely (−0.2041) related to the perceived value of the lodgings, confirming the observations of López-Fernández and Serrano-Bedia [
86], O’ Connor [
78] and Rodríguez-Díaz et al. [
18], who found that customers in higher category accommodations think they pay a higher price than the quality of service received. Other variables that are significantly and directly related to perceived value are cleanliness (0.2791), comfort (0.1518) and staff (0.1625).
The analysis of the individual destinations shows that Gran Canaria has the smallest adjusted R2, 0.505, although it is still high. In this case, only the category (−0.1346) and cleaning (0.2206) variables are significant. Meanwhile, the destination of Tenerife obtains a higher adjusted R2 of 0.601, with the same variables significantly related to the perceived value, that is, category (−0.4075) and cleanliness (0.3357). The destination of Agadir yields different results, where prices are an essential aspect of perceived value. The adjusted R2 obtained was the highest, at 0.761 but the four price levels were the only variables significantly related to perceived value. The maximum price in high season (−0.0342) and the minimum price in low season (−0.0565) maintain an inverse relationship. That is, the higher the price, the lower the value perceived by customers. By contrast, the minimum price in high season (0.0388) and the maximum price in low season (0.0425) are directly related to the perceived value. These results reflect a very important price adjustment by lodgings in order to maintain competitiveness and the required occupancy levels. In this competitive environment, higher category lodgings have to adjust their minimum prices in high season and their maximum prices in low season to attract customers. However, during the best moments of the high season, they have to raise their prices to earn income. On the minimum prices in the low season, higher category lodgings cannot undercut their prices to the level of lower categories.
4.2. Positioning Analysis by Destinations
To analyze the competitive positioning, it is necessary to define the variables that will determine how customers assess lodgings and tourist destinations. The variables used in this research are the quality average (Q) and added value (AV), which have been analyzed in relation to the price level of lodgings. Although four types of prices were available, the maximum high season price has been used, which is when the lodgings are in their optimum position. Linear and quadratic regression analyses were carried out to find the competitive positioning of the destinations and their lodging offer, in order to determine the function that best fits the variables studied. The dependent variables are the quality average (Q) and added value (AV), whereas the independent variable is the highest price in high season. Statistical analyses were conducted, first, considering all the tourism companies together. Subsequently, regression analyses were performed individually for each of the destinations.
4.2.1. Analysis of All Destinations
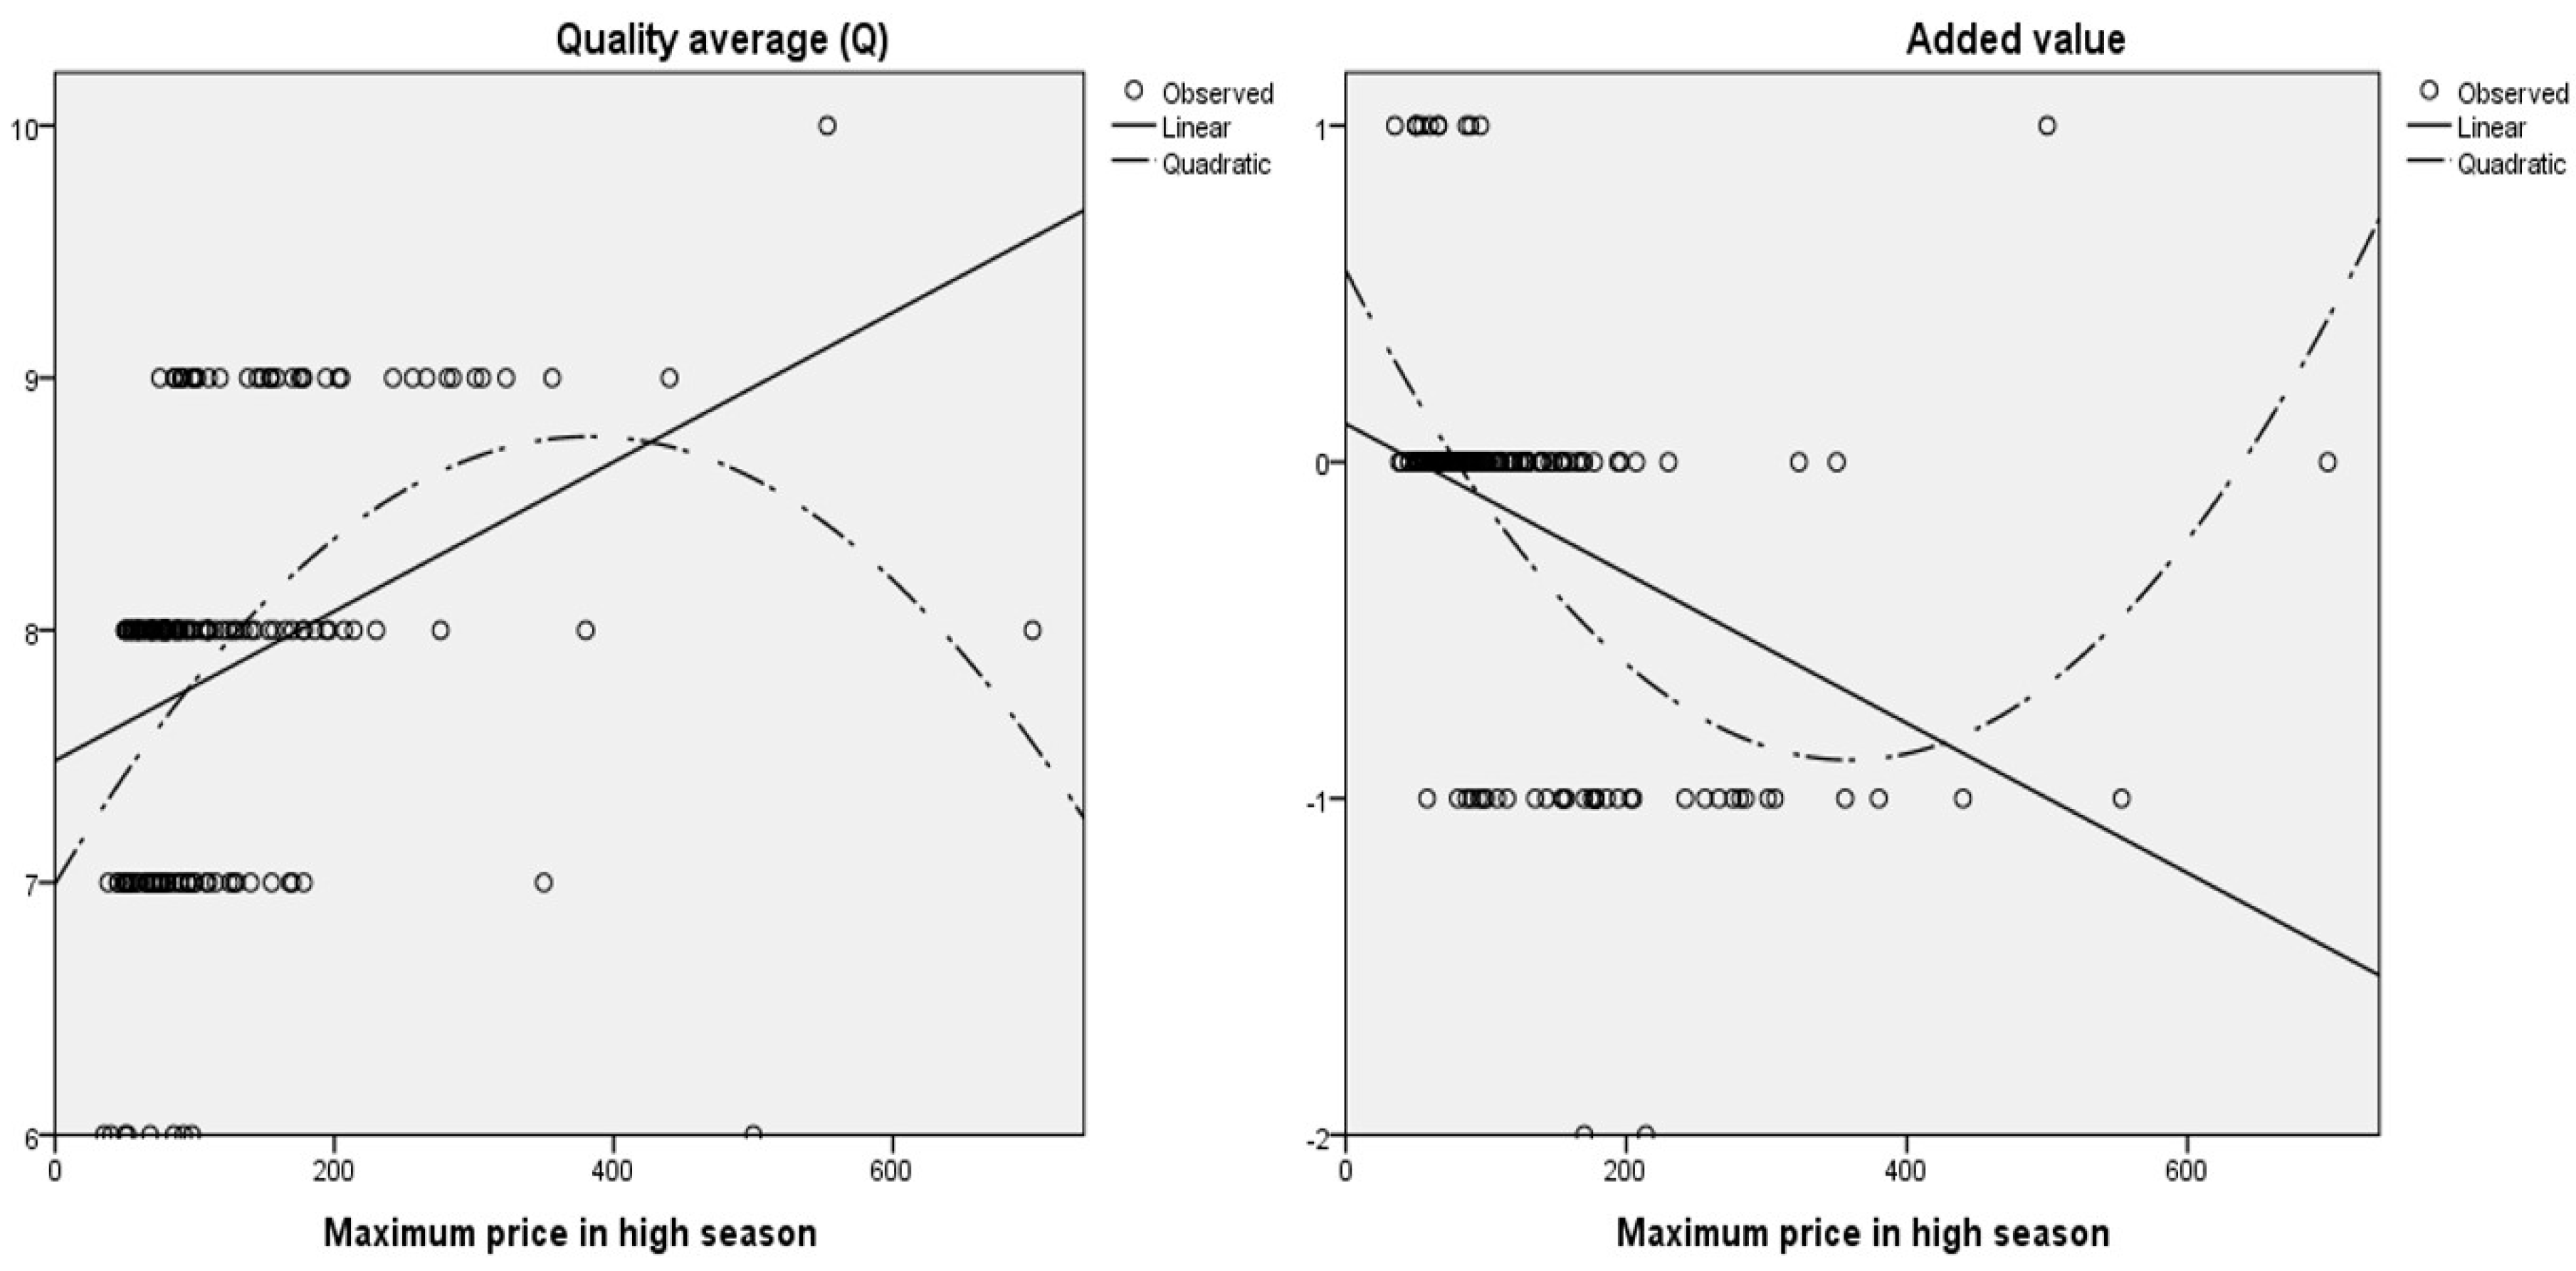
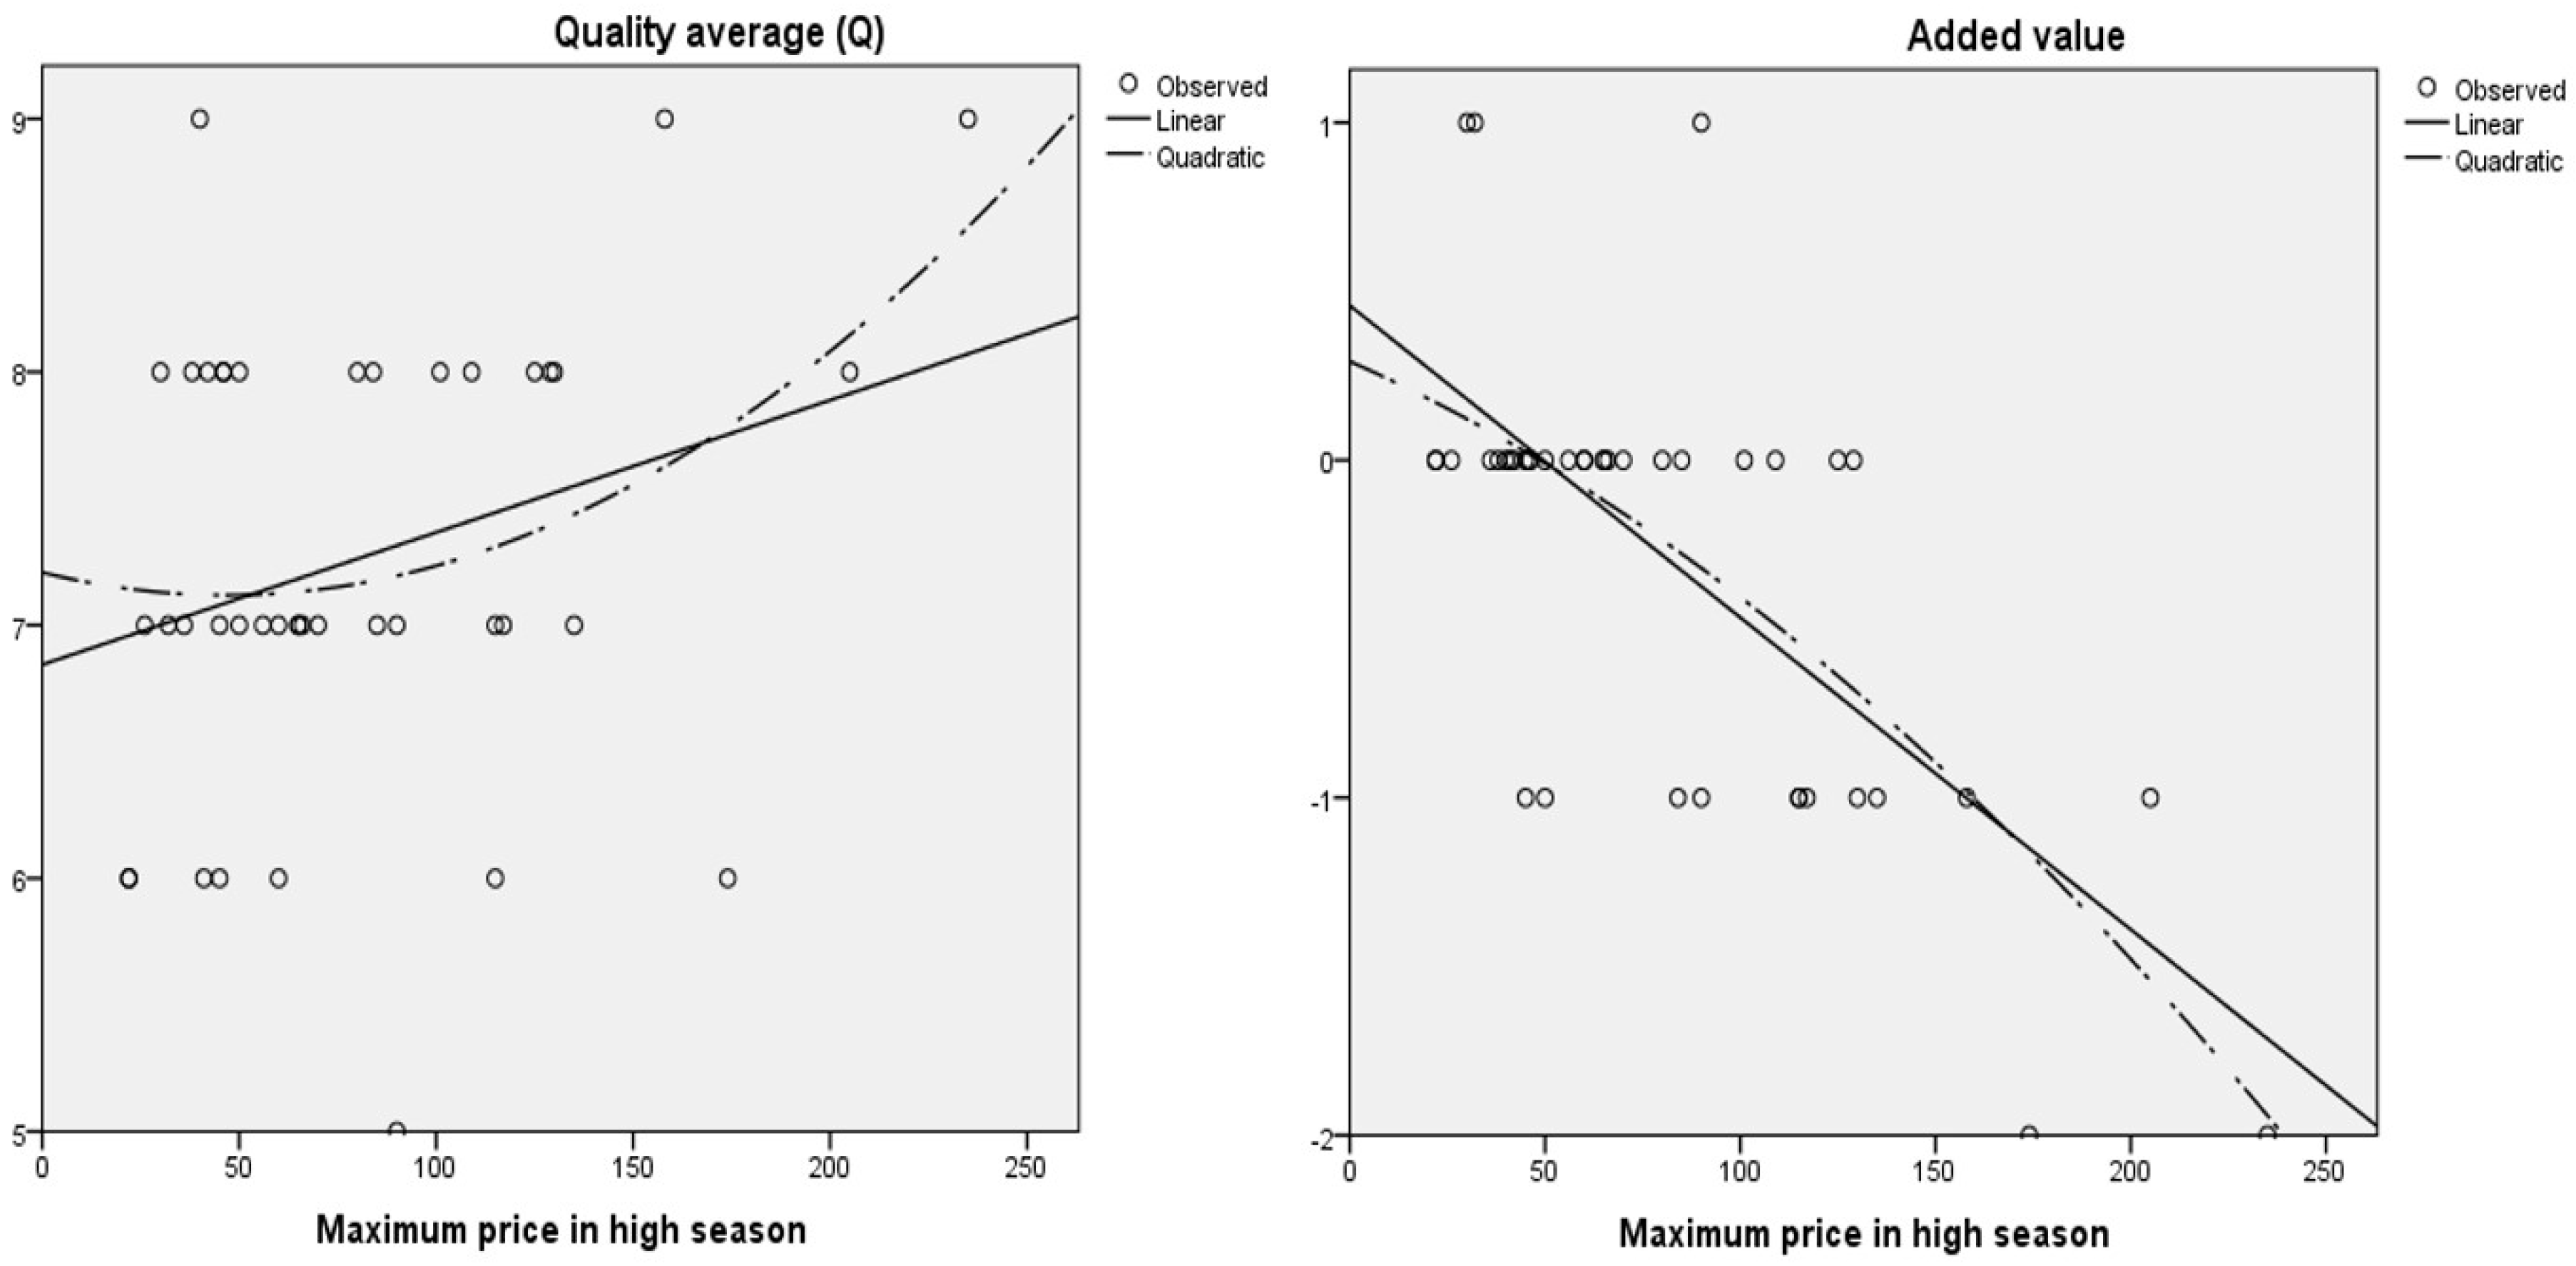
Table 4 shows the regression analysis results for all the destinations included in the study. The purpose of linear regression was to determine the trend of the offer in the destinations, whereas the quadratic function was carried out to obtain a better fit.
Table 2 shows the results obtained, where the adjusted R2 of the linear function of quality average was 0.188, the quadratic function obtained a much higher result of 0.233 and the F tests were significant.
Figure 1 shows the plots where the linear and quadratic functions are represented. The trend of the quality average variable is upward, demonstrating that, as prices rise, lodgings improve the service offered to their customers.
The other regression analysis was performed using the added value as a dependent variable and the maximum price in high season as an independent variable. In this case, the adjusted R2 of the linear function (0.180) was slightly lower than the regression of the quality average, whereas the adjusted R2 of the quadratic function was 0.310, which is a good fit in the social sciences, with a significant F test in both regressions (0.000). As
Table 4 shows, b1 parameters were negative, confirming a downward trend in both functions. These results confirm what has been stated in the academic literature [
69,
71], that is, that perceived value is a subjective concept. Likewise, it is inversely related to the price level, given that the service perceived by customers exceeds their evaluation of the perceived value when lodgings increase their category.
4.2.2. Analysis of Gran Canaria Destination
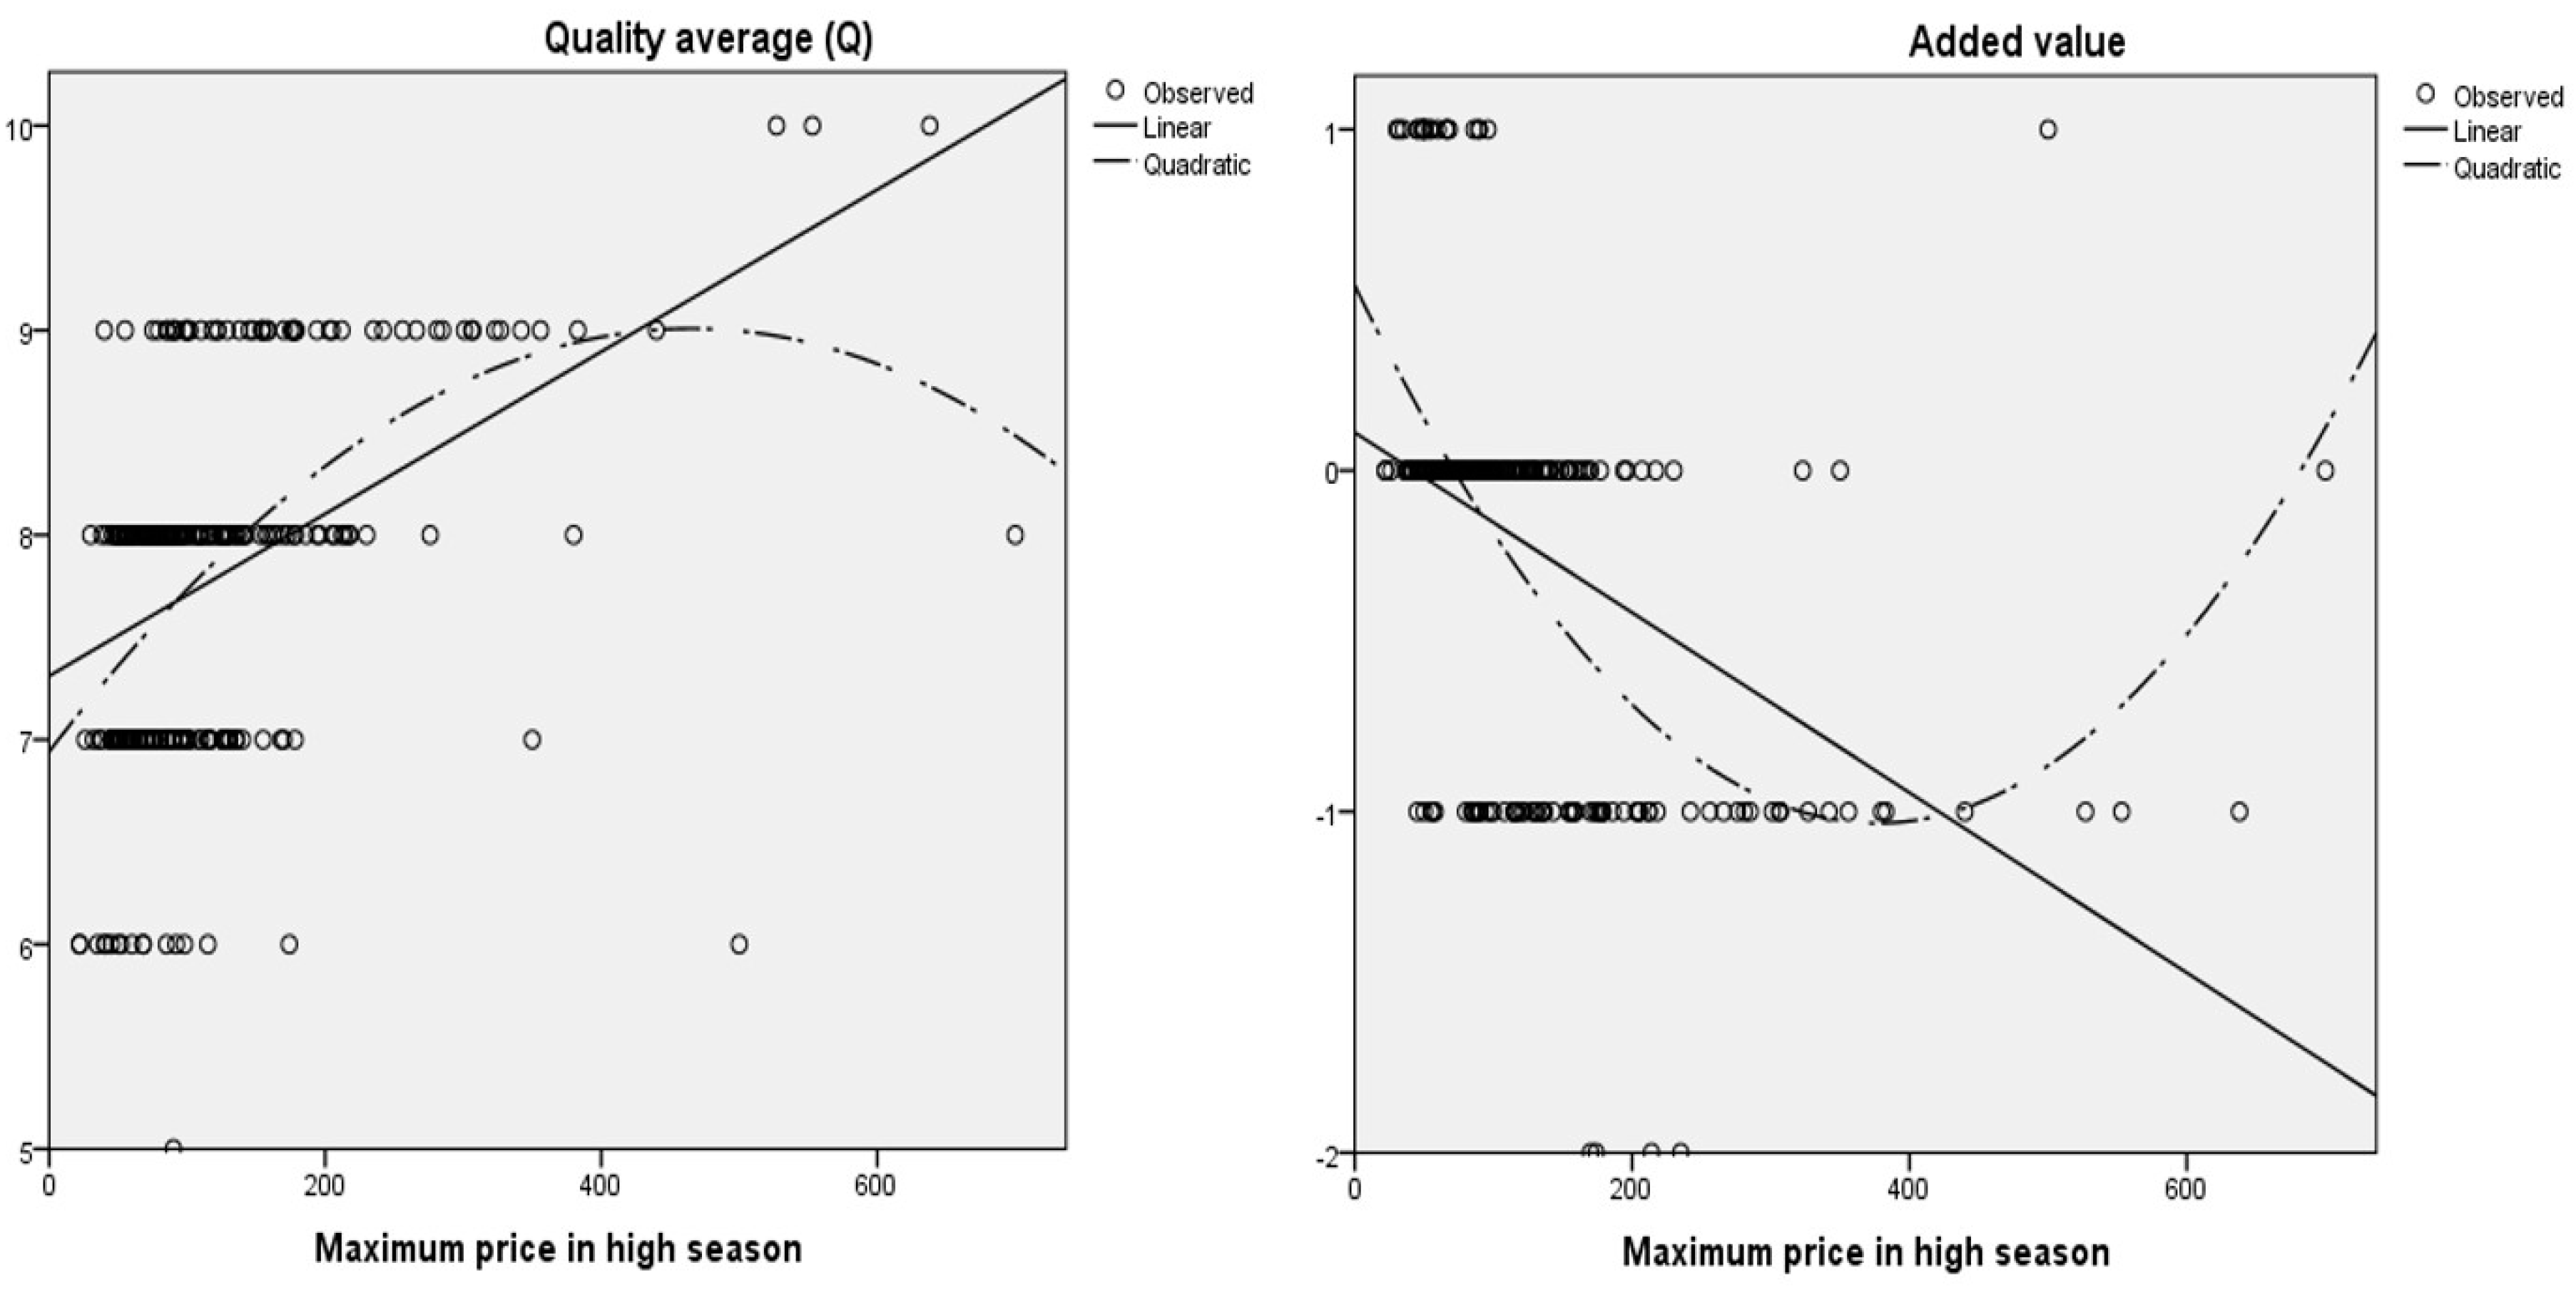
Table 5 shows the results of the regression analysis of the destination of Gran Canaria. With regard to the quality average (Q), the adjusted R2 of the linear function was 0.115, the quadratic was 0.193 and the F test was significant (0.000) in the two regressions. Parameters b1 are positive, which determines a tendency to increase as lodging prices rise. This result can be seen in
Figure 2, where the linear regression is constantly increasing, whereas the quadratic reaches its maximum at about 400€ per night and room and then declines. It should be clarified that the functions of quality average in relation to price at the Gran Canaria destination are below the average of the three destinations analyzed together. Studying the value-added variable reveals that the linear function obtained an adjusted R2 of 0.148 and a quadratic function of 0.304, with the F test demonstrating that the results are significant at 0.000. Again, these results show that the quadratic function best explains the lodging offer of this destination.
Figure 2 shows that the linear function of added value in the destination of Gran Canaria decreases less than in all the destinations together, as it has a slightly lower b1 parameter (−0.002).
4.2.3. Analysis of Tenerife Destination
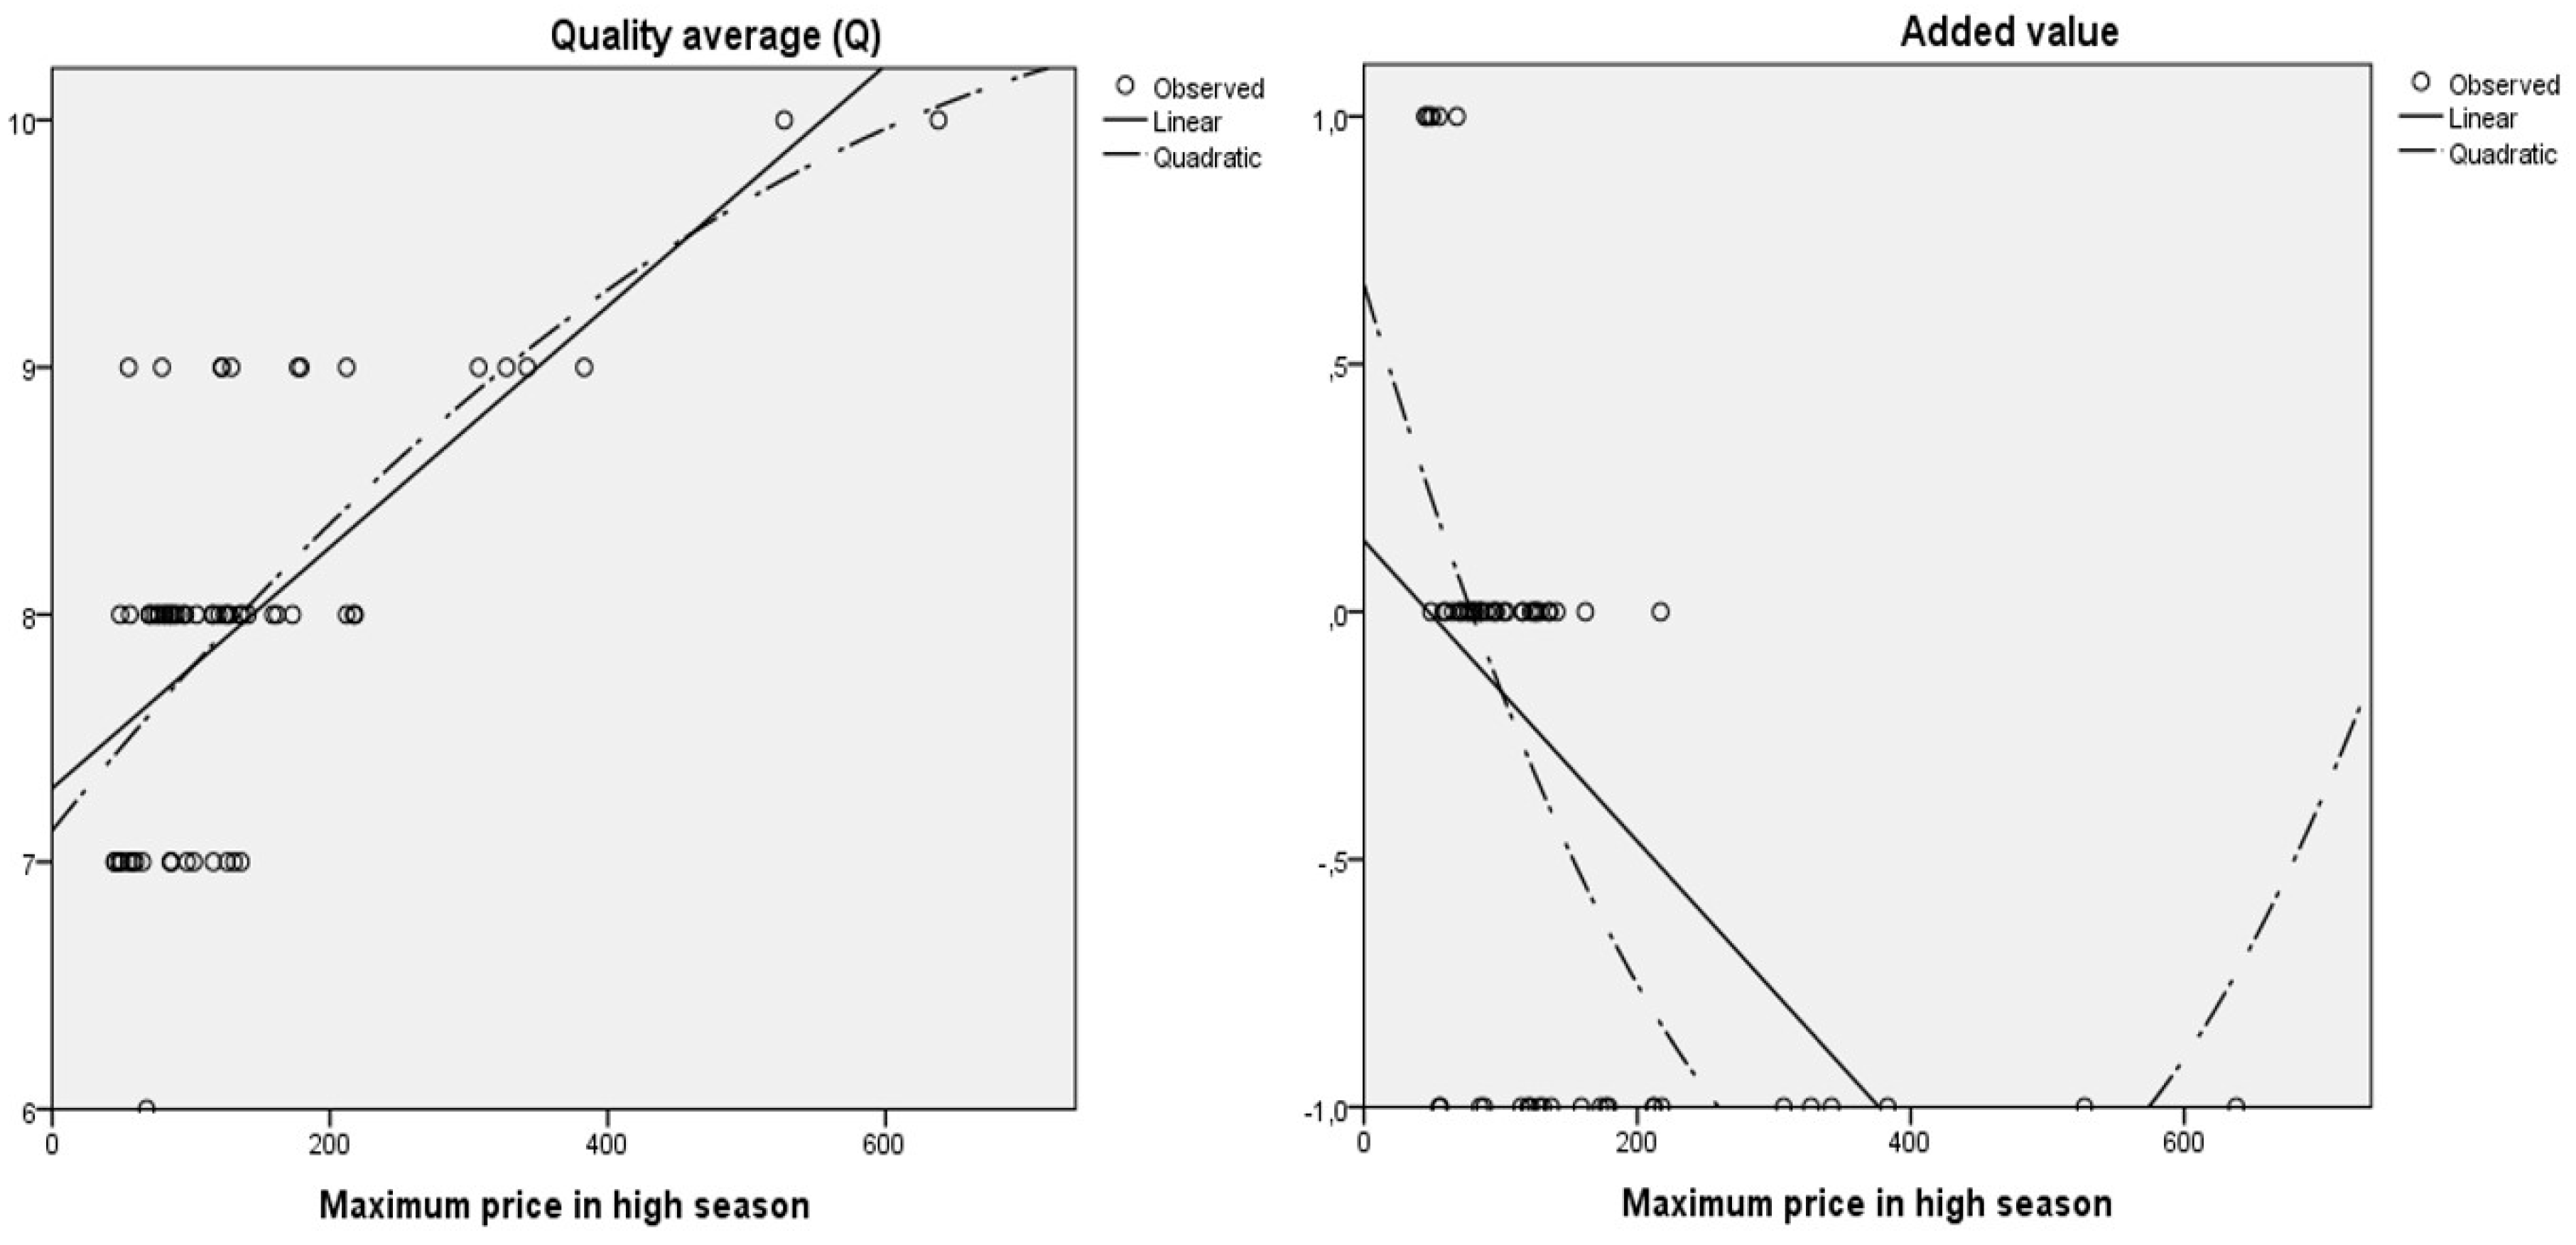
Table 6 shows the results obtained in the regression analyses carried out for the destination of Tenerife. The adjusted R2 of linear and quadratic regressions are elevated, 0.439 and 0.447, respectively. This demonstrates a greater coherence in the competitive positioning of Tenerife’s lodgings based on quality average and price. The graph in
Figure 3 clearly shows that the slope of the linear function of the quality average increases more sharply in relation to all the destinations because the parameter b1 is 0.004. In terms of added value, the adjusted R2 values are also satisfactory, especially with the quadratic function, where it reaches a value of 0.406 and the results according to the F test (0.000) are significant. The graph in
Figure 3 shows that the slope of both functions is steeper than in the destination of Gran Canaria, so that added value decreases in a greater proportion as prices increase. The figure shows that when prices reach 400€ per night, the added value decreases below −1.
4.2.4. Analysis of Agadir Destination
Table 7 shows the results obtained in the regression analysis carried out at the Agadir destination. The linear and quadratic regressions of the quality average variable obtained the worst adjusted R2, with values of 0.081 and 0.101, respectively and non-significant results according to the F test. The graph in
Figure 4 illustrates that the functions have a growth tendency without reaching the values obtained in the other two destinations. In this context, the findings show that the lowest quality average offered to customers is in the lodgings in the Agadir destination. The results obtained in the regressions of the added value variable are different, due to the fact that the adjusted R2 values are high, 0.467 in the linear function and 0.475 in the quadratic function. In these cases, the F test regressions are significant (0.000). The analysis of the added value graph shows that it is constantly decreasing, with b1 parameters of −0.009 in the linear function and −0.004 in the quadratic function. Agadir’s lodgings obtain the lowest values on the added value variable.
4.3. Positioning Analysis by Lodging Category
After performing the regression analysis for all destinations, a competitive positioning study is then carried out based on the category level of the lodgings. Lodgings are divided into two groups: those with 4 and 5 stars, on the one hand and those with 3 stars or less, on the other. To do this, a graphical representation is made showing all the lodgings differentiated by symbols, depending on the destination to which they belong. In this way, it is possible to appreciate the competitive positioning of the lodgings comparatively and, consequently, the global positioning of the hospitality offers by tourist destinations. The variables used to conduct this analysis are those used in the regression analysis: quality average, added value and maximum price in high season.
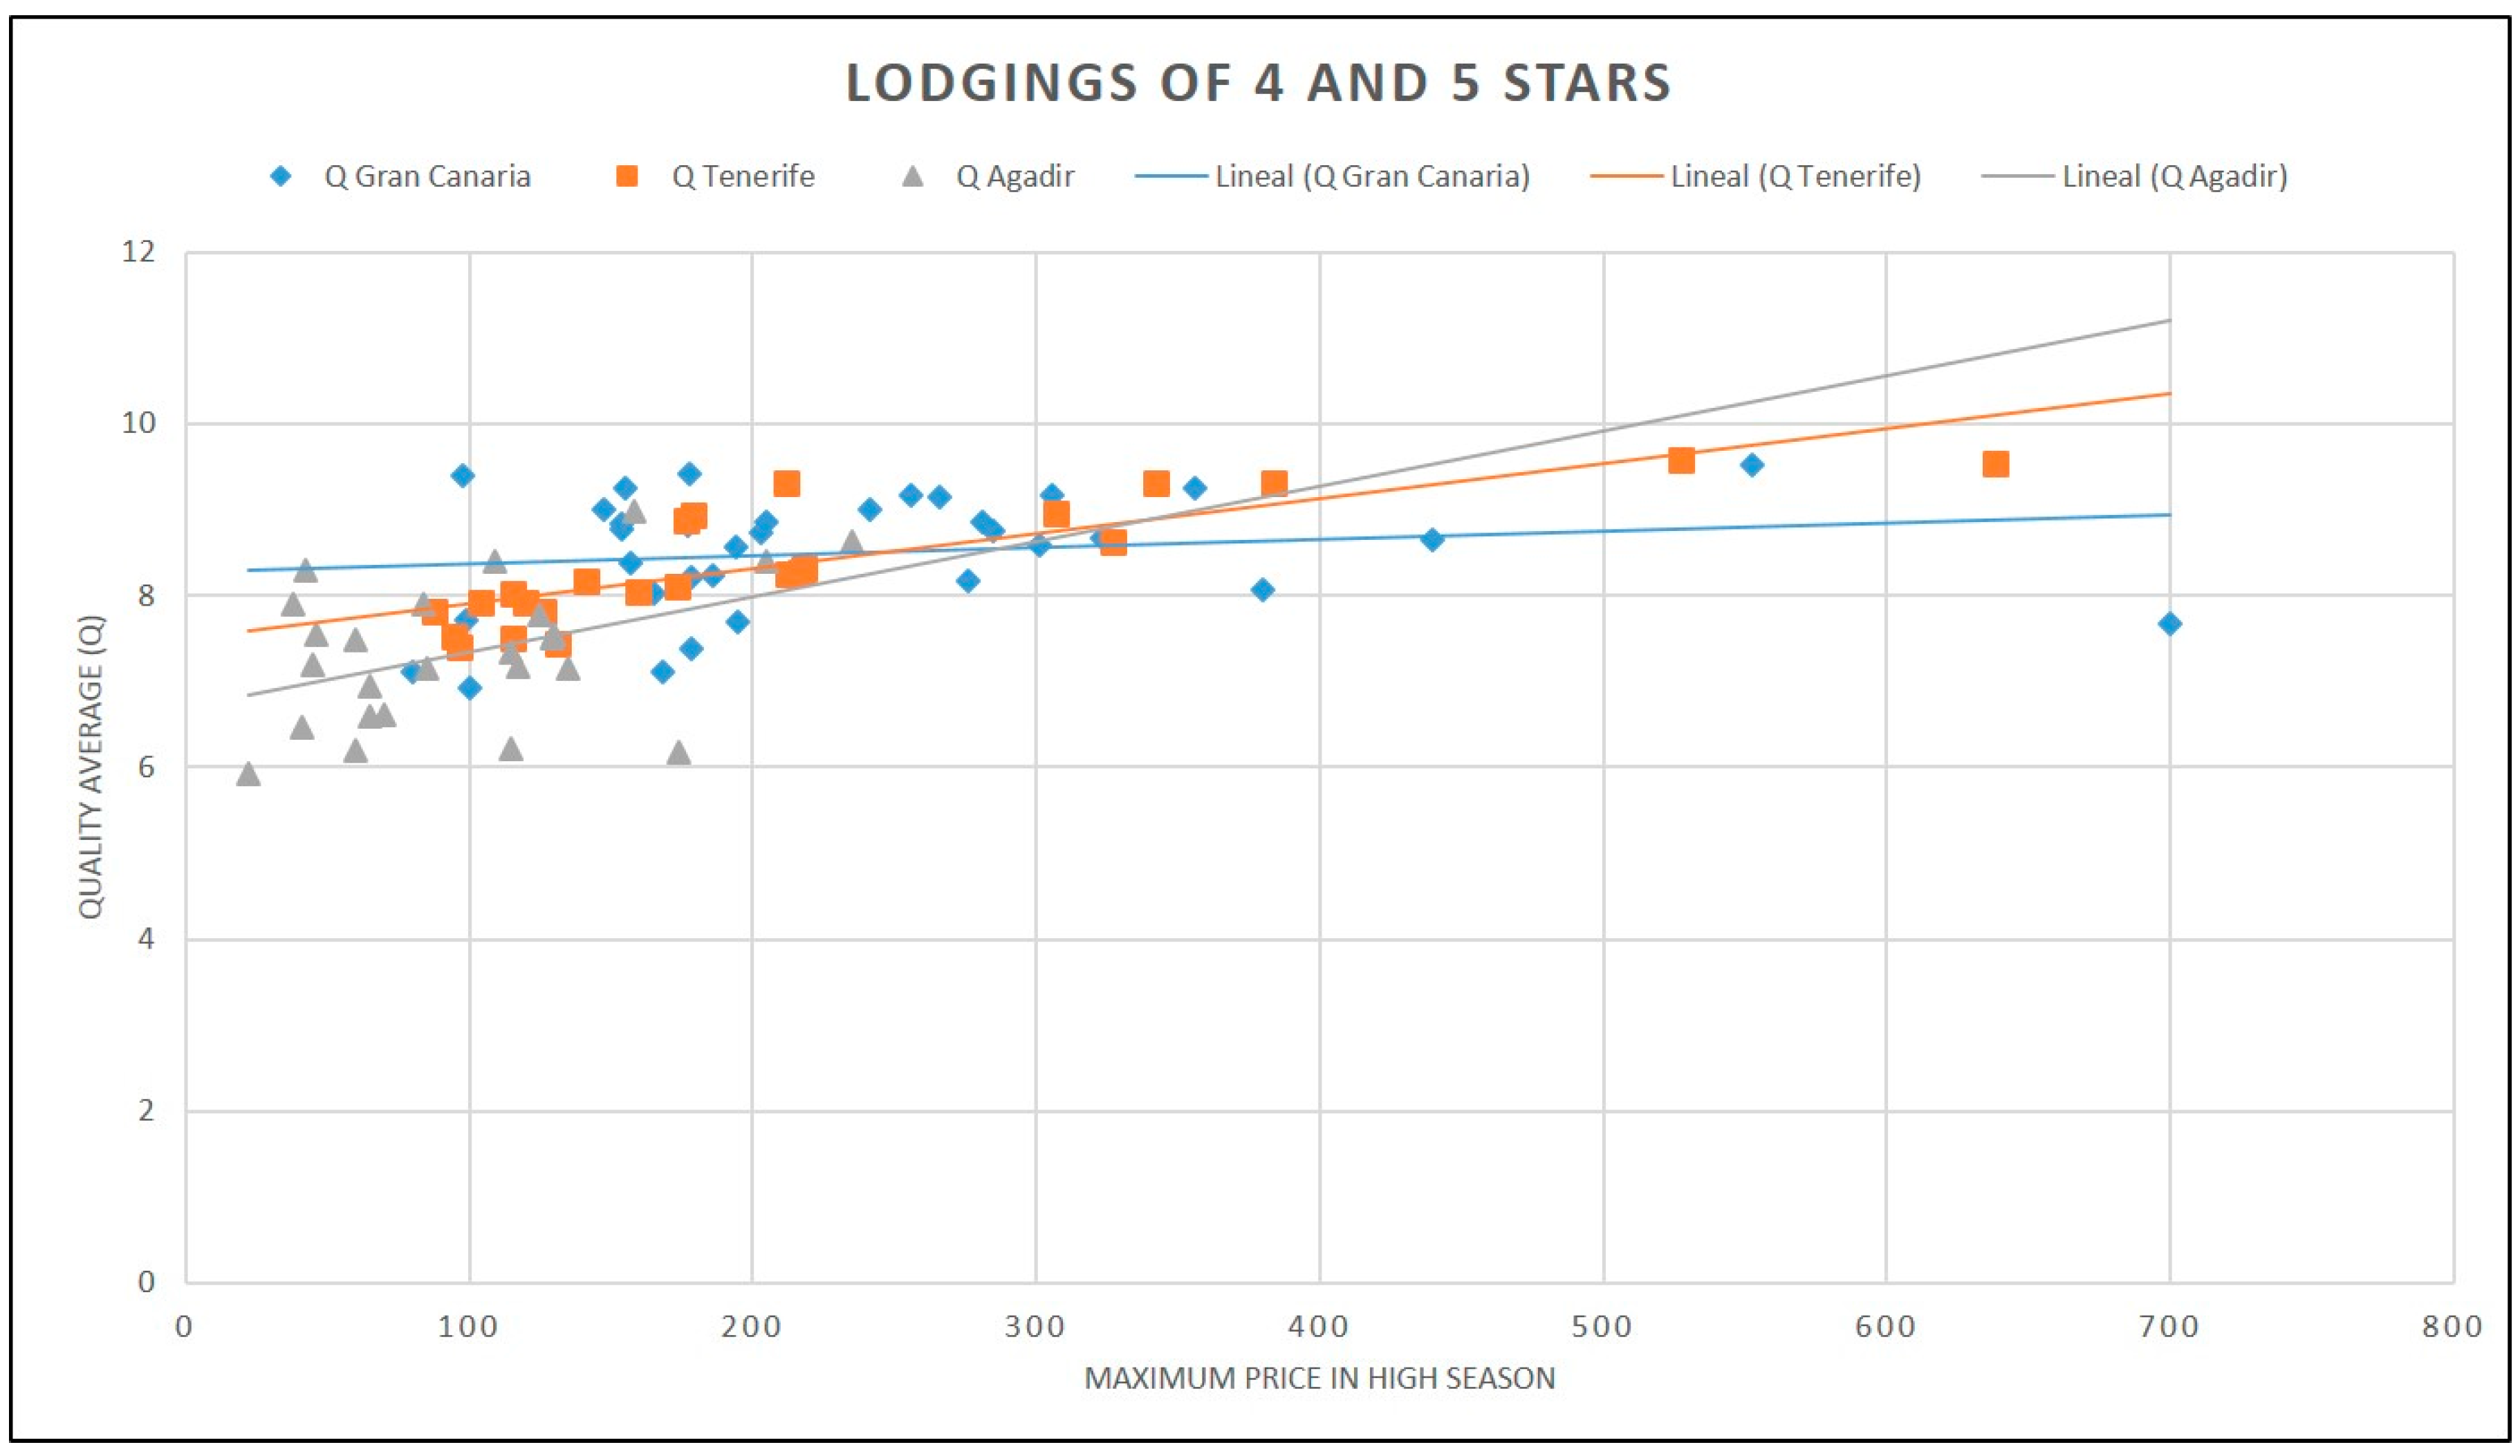
Figure 5 and
Figure 6 show the competitive positioning of the tourist destinations analyzed from the perspective of average quality and price level. It should be noted that Agadir’s 4- and 5-star hotels are positioned at a lower price. Likewise, their customers give the lowest scores for quality average. By contrast, the lodgings offered in the destinations of Gran Canaria and Tenerife in these categories are marketed at higher prices and obtain higher quality average scores. Moreover, there is an increasing trend in the quality average and price of the three destinations; in other words, the higher the price, the higher the perceived quality average.
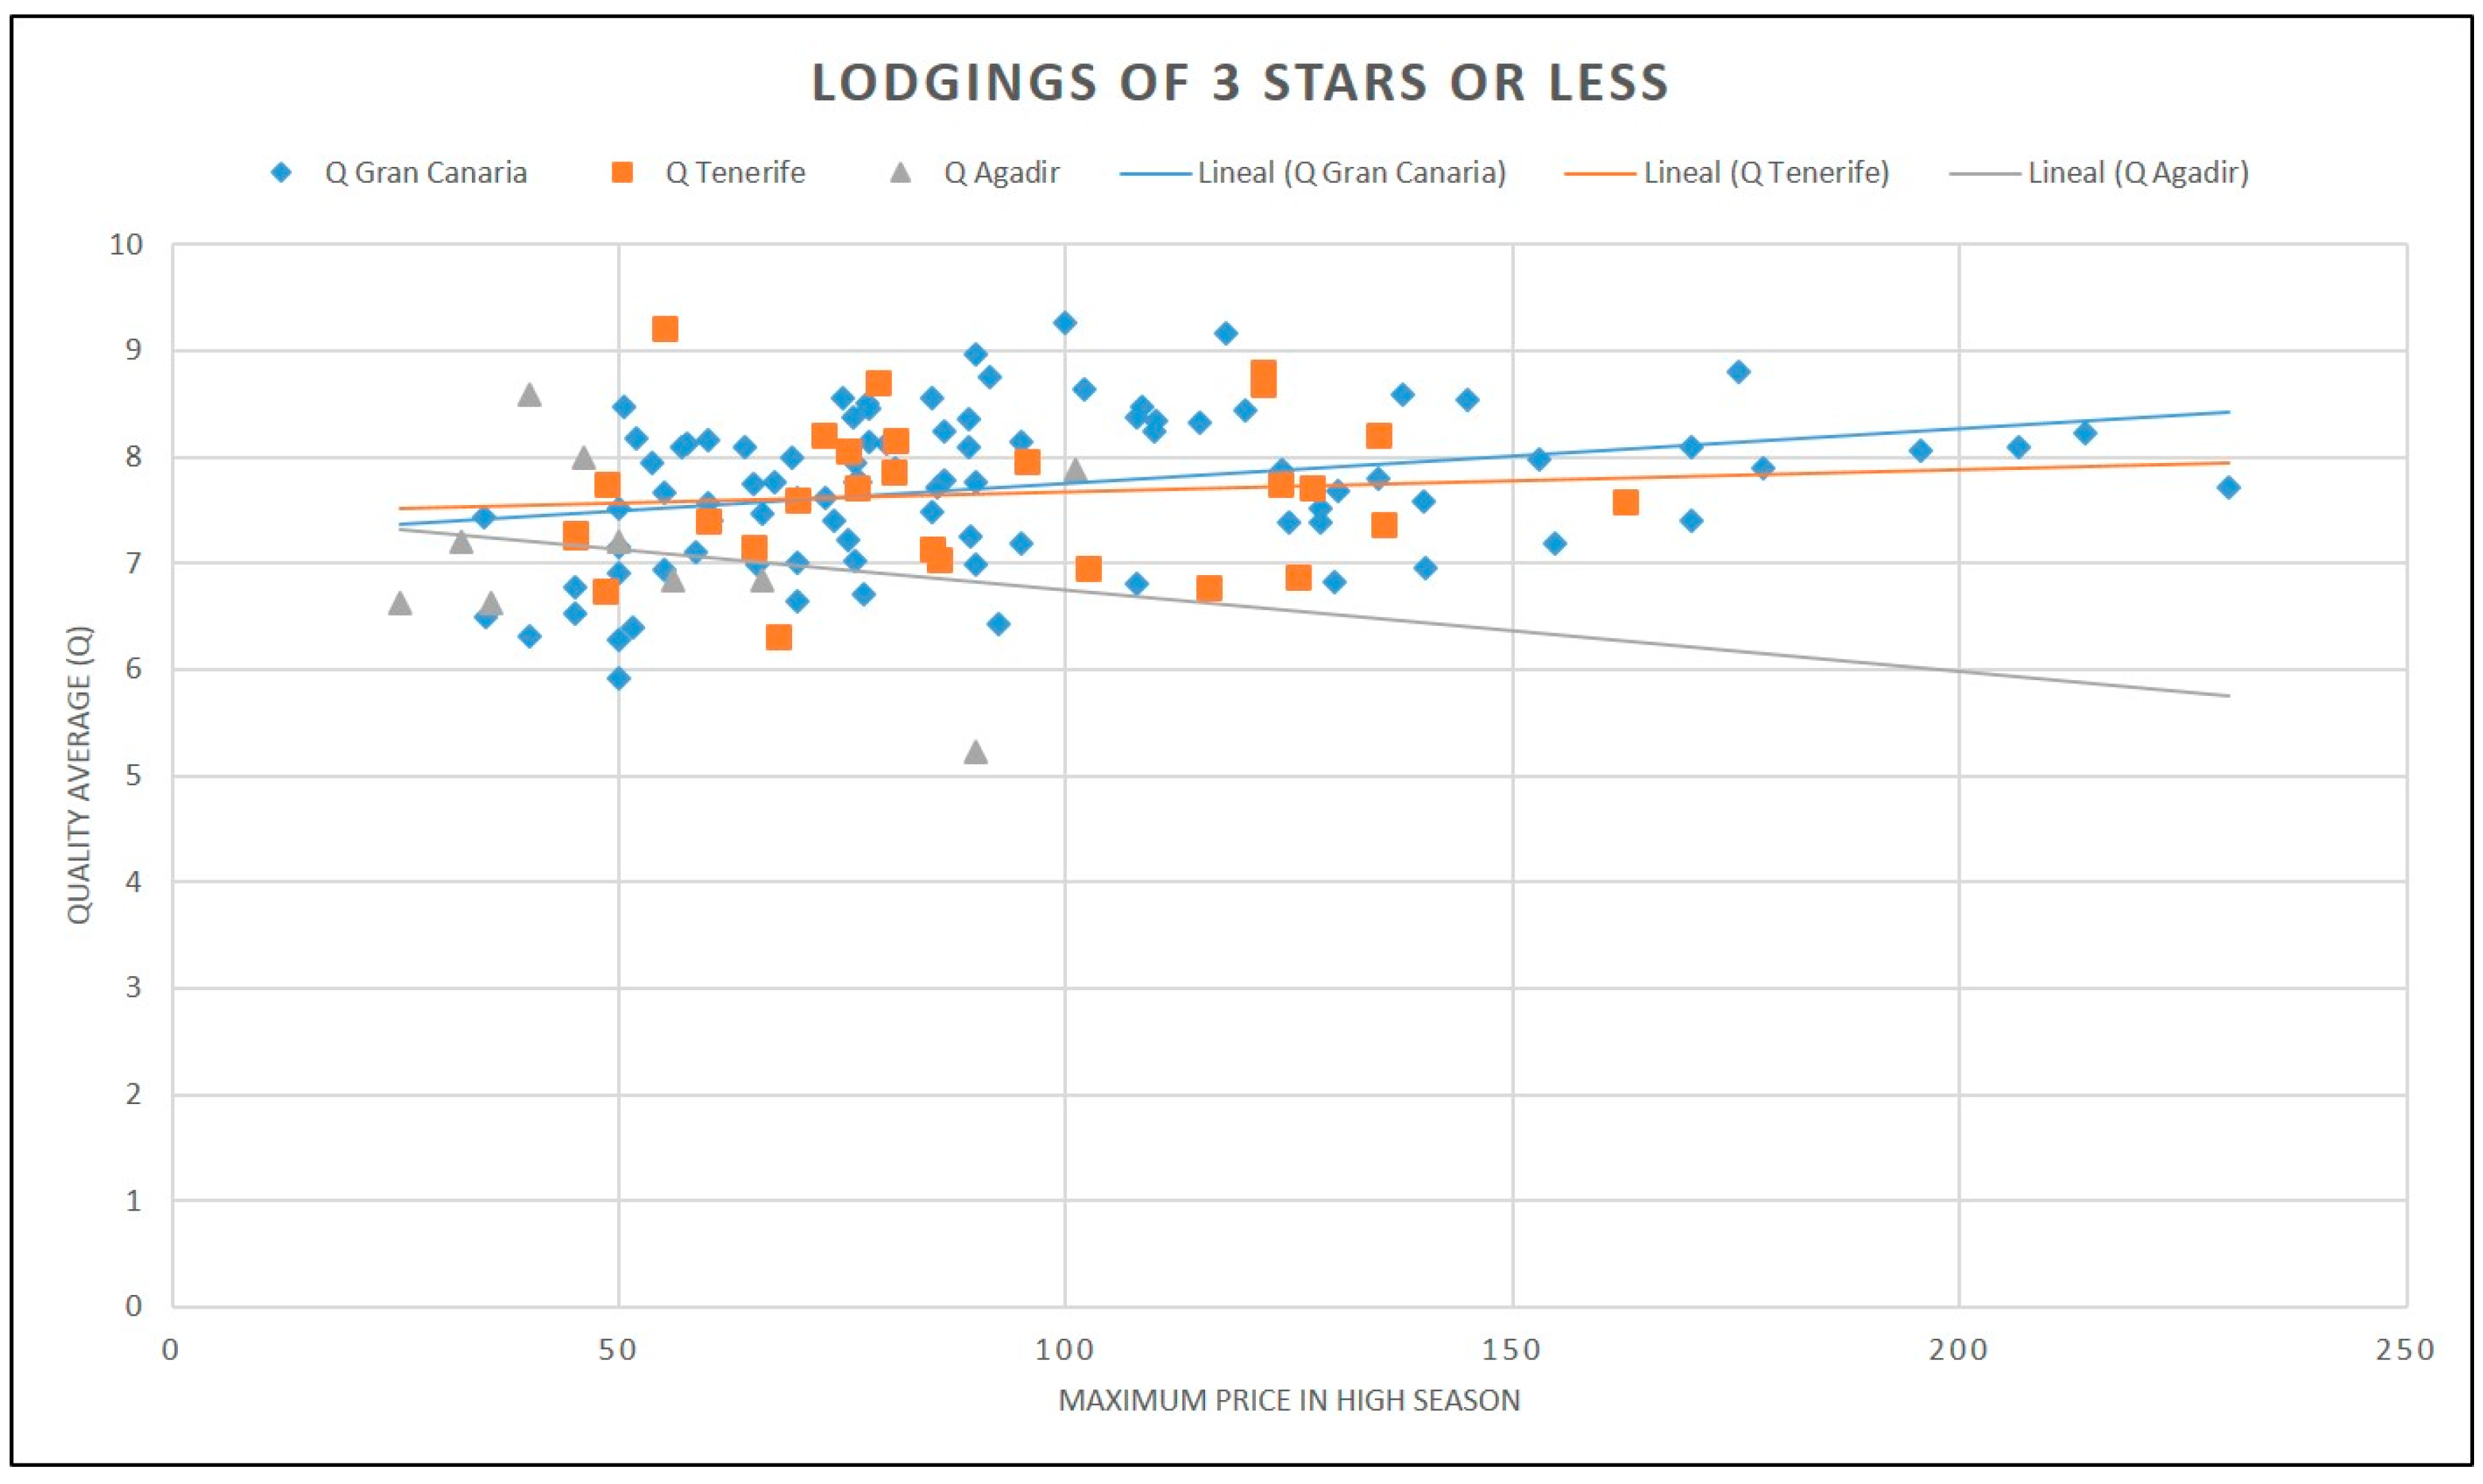
Figure 6 shows that lodgings with three stars or less concentrate their maximum offer at 50€ to 100€ per night. Again, the results confirm that the lowest prices are in the Agadir destination, whereas the highest prices are in the Gran Canaria destination. Regarding the assessment of quality average,
Figure 6 shows that most of the destinations’ offers were in the range of 7 to 9 points. This variable shows that the highest scores are for lodgings in the destinations of Gran Canaria and Tenerife.
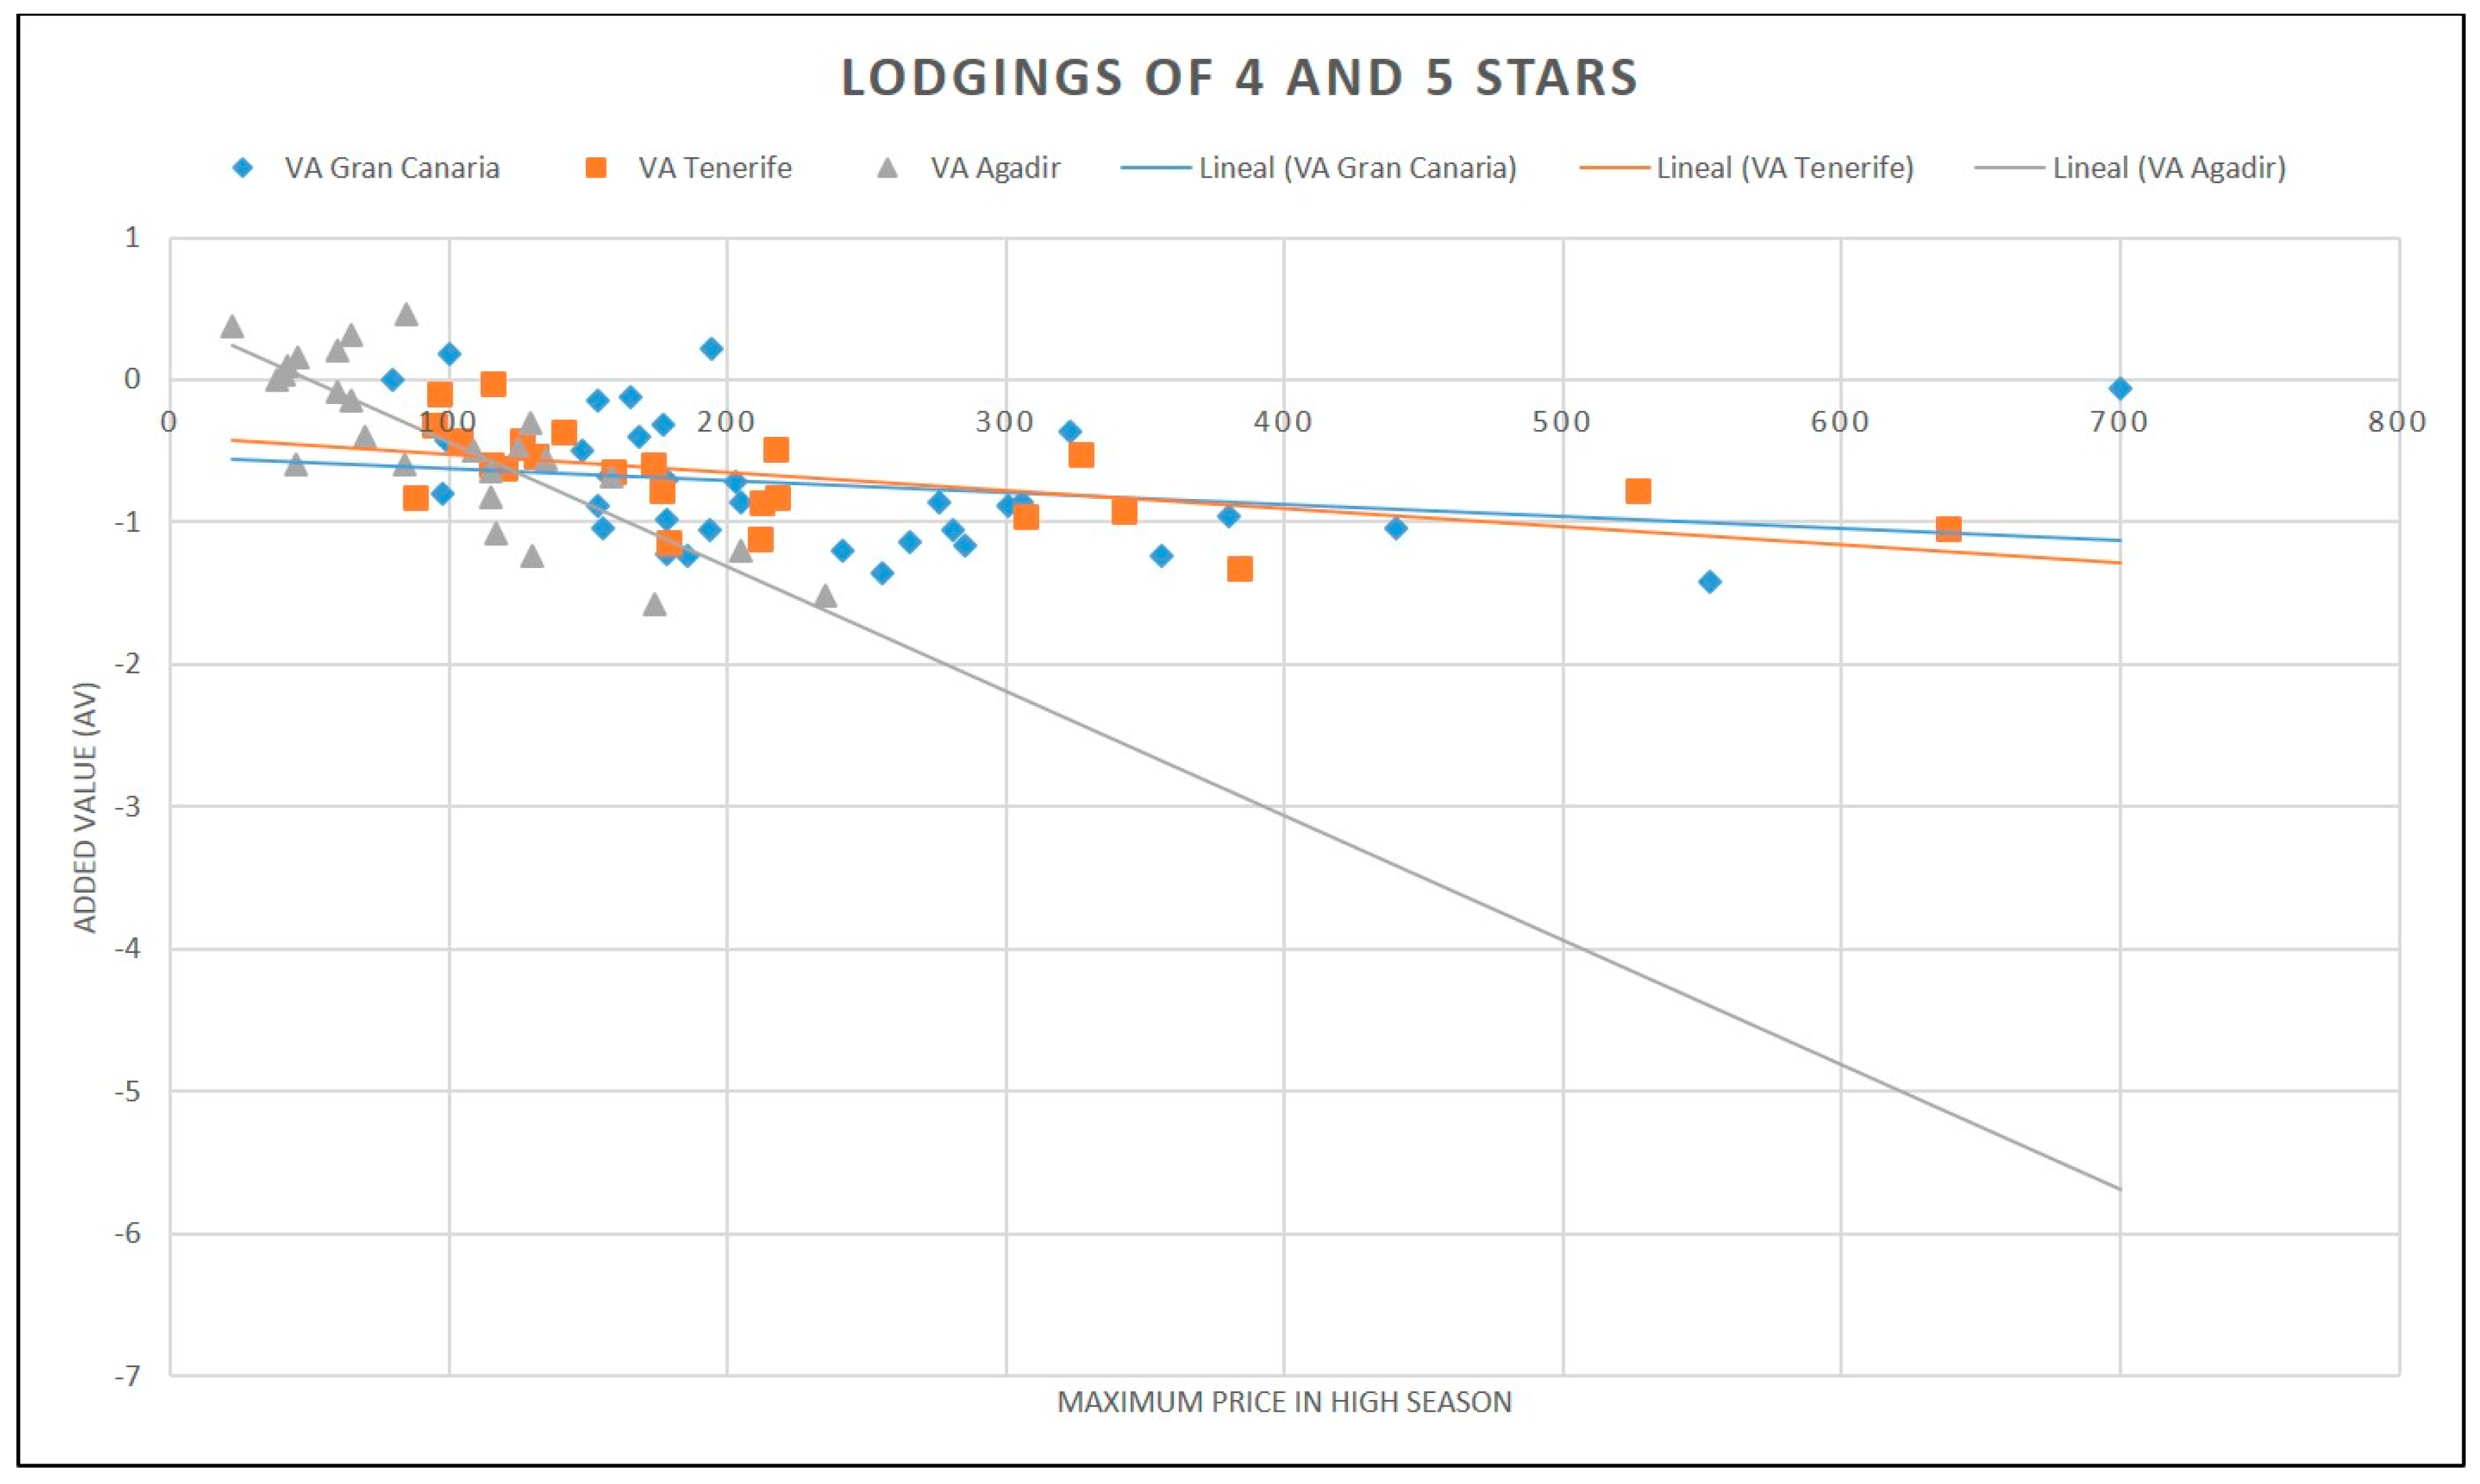
The study of the competitive positioning of tourist destinations based on added value and price is graphically represented in
Figure 7 and
Figure 8. Agadir’s 4- and 5-star lodgings show a much more downward trend than the other two destinations. Agadir also concentrates its offer in the lowest prices, obtaining the most positive added value. Regarding the destinations of Gran Canaria and Tenerife, there is a slightly downward trend but the lodgings with the highest prices have the lowest and negative, added value. This confirms the idea that customers of higher category lodgings assign a perceived service quality that is higher than the perceived value, due to the effect of high price.
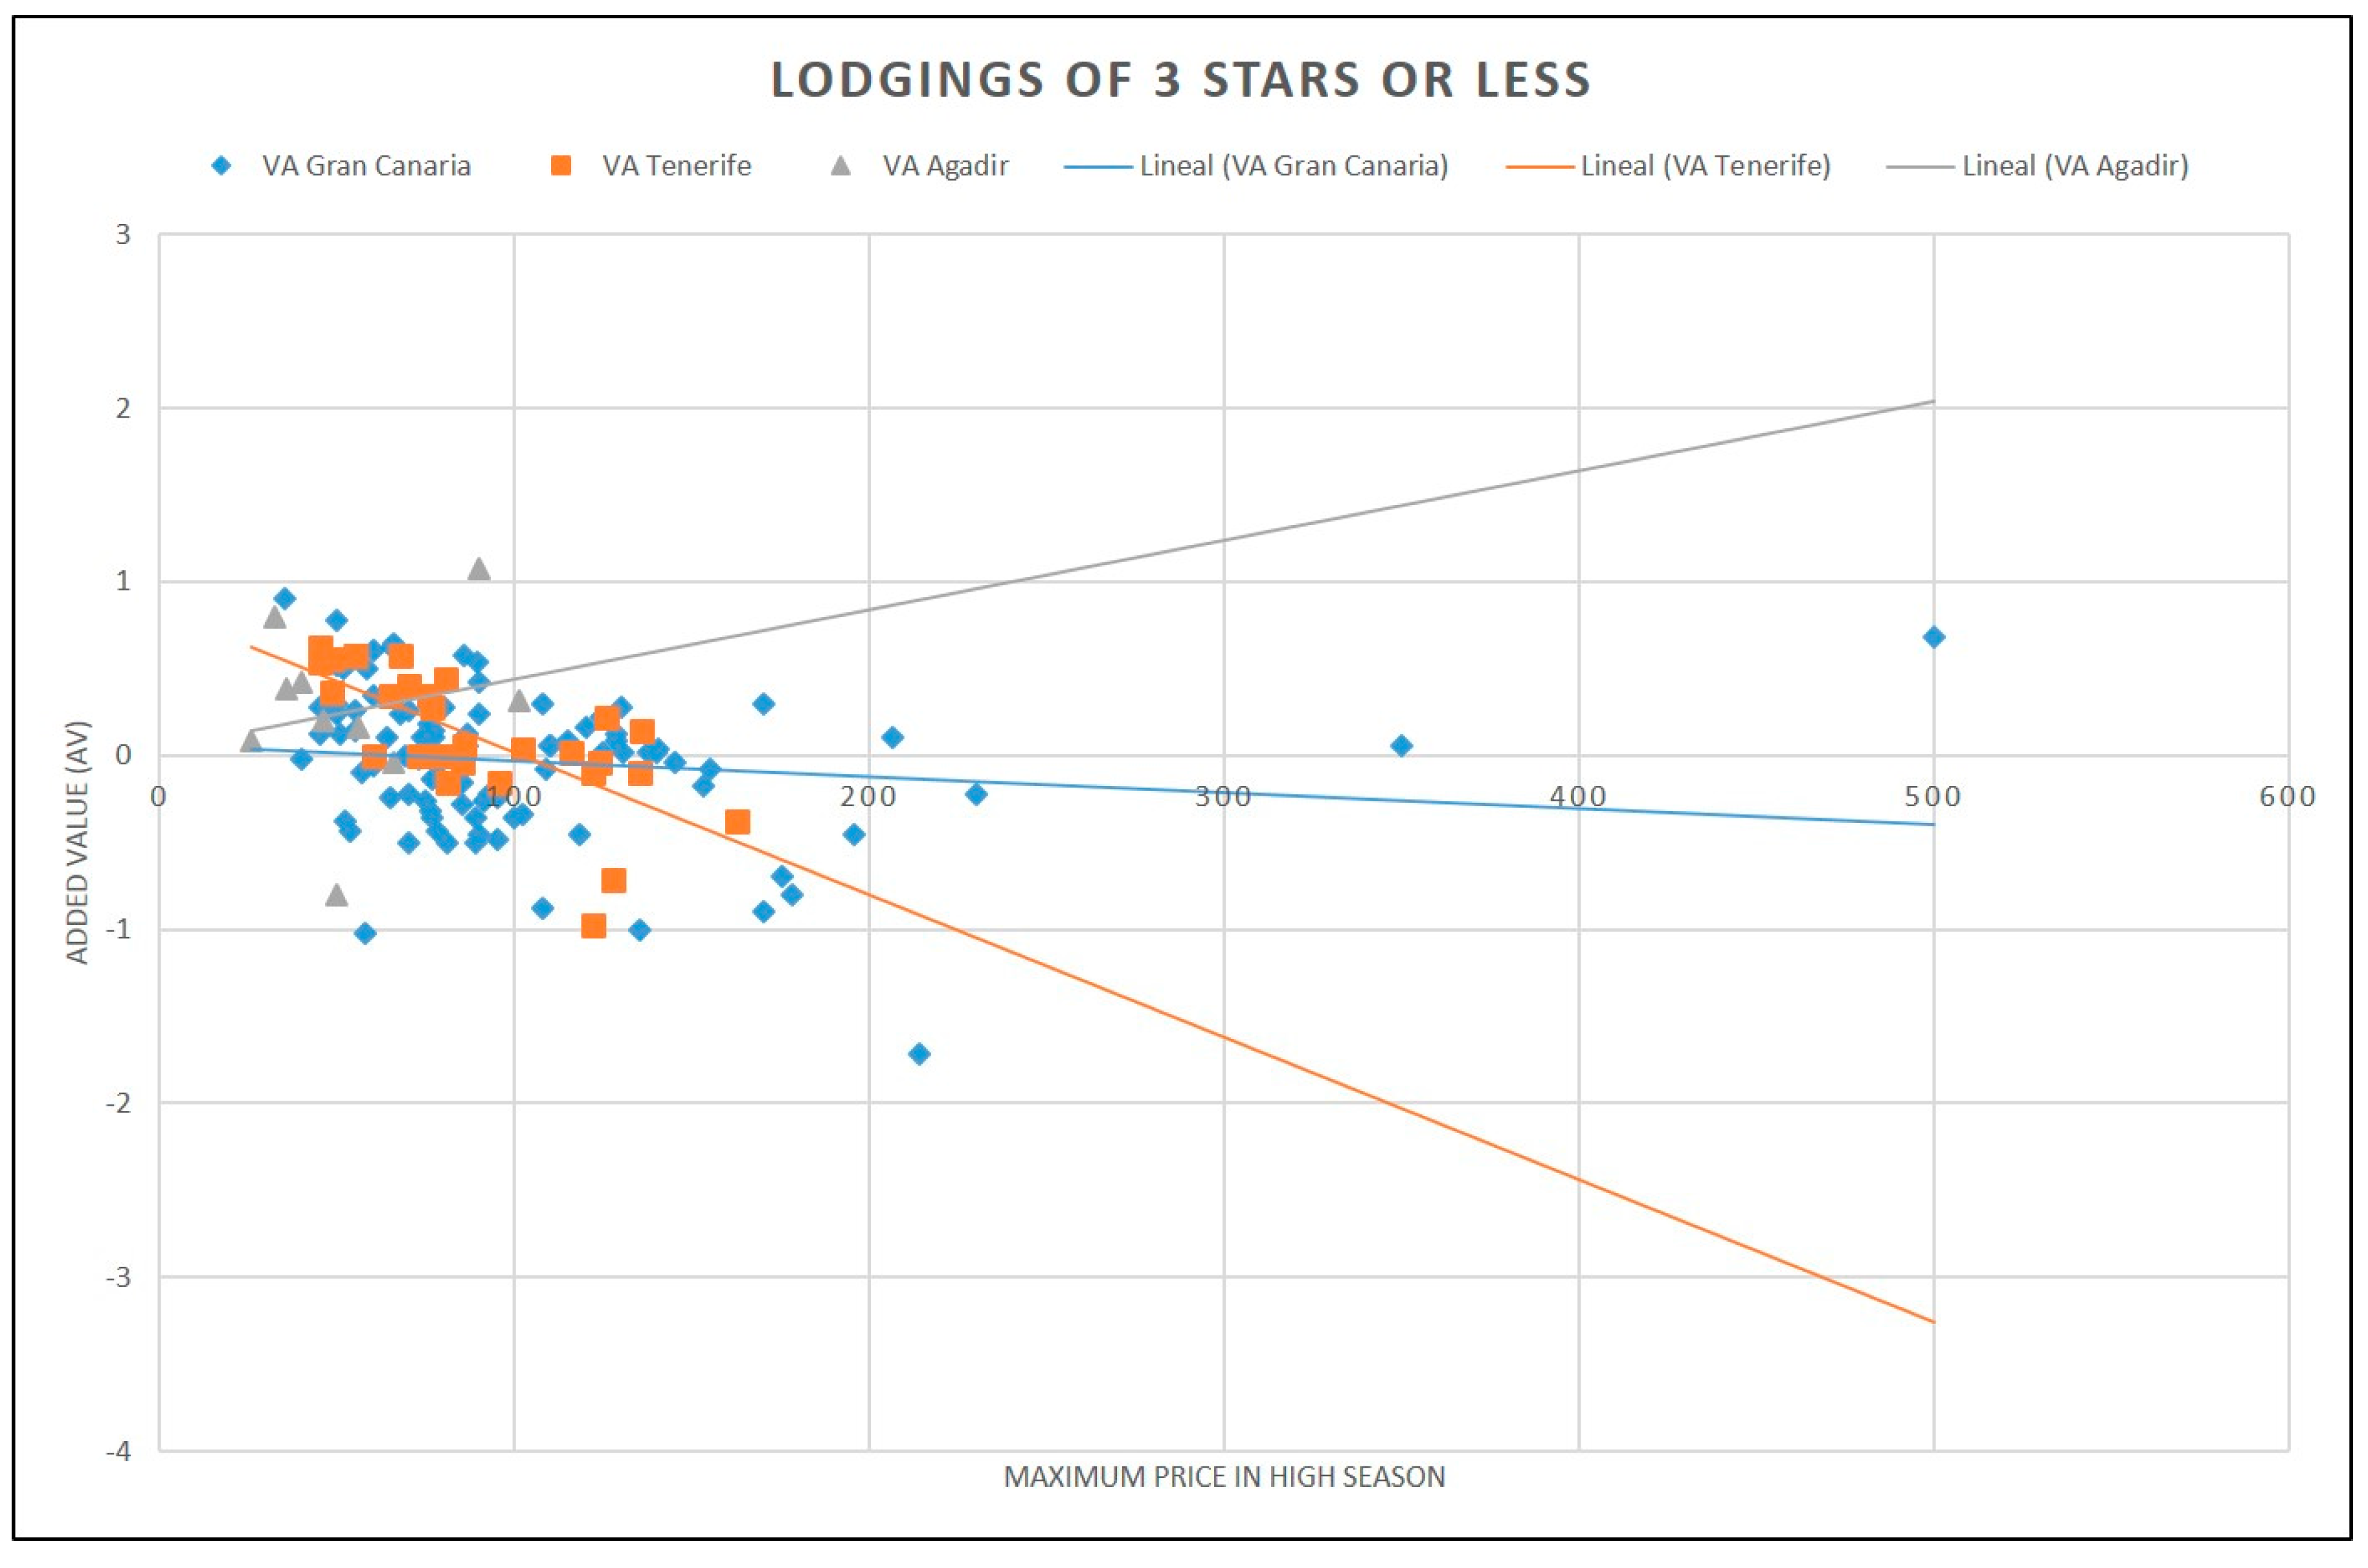
The graph of lodgings with 3 stars or less in tourist destinations shows notably different results (see
Figure 8). Accommodations with lower prices get higher added value in all three destinations. As prices increase, the trends followed by destinations are clearly different. Whereas Agadir tends to increase its added value, Tenerife tends to decrease it, receiving negative values and Gran Canaria shows a stable trend of added values around zero. The comparative analysis in
Figure 7 and
Figure 8 confirms that added value tends to decrease as prices rise, receiving negative values. In addition, in the categories of 3 stars or less, a greater similarity is shown in the customer ratings of the destination analyzed. Finally, the positioning study shows that the competition between the destinations of Gran Canaria and Tenerife is greater in the categories of 4 and 5 stars because Agadir has to offer lodgings at a lower price. However, in lower category lodgings, there is a higher level of competitiveness, as they are positioned very close.
5. Conclusions
This study has developed a methodology to determine the competitive online positioning of tourist destinations. The rise of the digital society has allowed customers to share their opinions via the Internet. This generates an image on the network that is communicated through social media and establishes the online reputation of goods, services, brands, or companies. In tourism, activity through social media is quite dynamic and has a direct influence on customers’ decision making when choosing a destination in which to spend their holidays. In this context, a large part of destinations’ competitiveness is being defined on the Internet. For this reason, the leaders and DMOs of destinations need tools to obtain knowledge about the market that can facilitate their actions.
The methodology proposed in this study is based on the measurement scale of perceived service quality and perceived value used by Booking.com. It is a scale of quantitative variables used by clients to share their ratings and opinions of contracted lodgings. The scale is implemented through a questionnaire available on the Internet and so it has to be specific and contain few variables in order to measure the main attributes. This study shows that this scale of measures satisfactorily determines the competitive positioning of the lodging offered in tourist destinations. To these variables, the variables of category and prices have been added, which are also available on the website of Booking.com. Moreover, the empirical study shows that the new variables of quality average and added value, created from the Booking.com scale and related to price, develop competitive positioning analyses of destinations that have practical and scientific research interest.
The methodology shows that the scale for measuring the perceived quality of service is one-dimensional for all destinations as a whole and for each destination individually. The variables used by Booking.com to measure this construct are cleanliness, comfort, location, service/facilities and staff. These results confirm the outcomes obtained by Ye et al. [
43] and Rodríguez-Díaz et al. [
18], who empirically show that these types of online scales to measure the perceived quality of service are one-dimensional. A multiple regression analysis was also carried out, where the dependent variable was perceived value and the independent variable was the scale of perceived quality of service, price and category of lodging. The analysis was conducted for all destinations jointly and subsequently for each of them specifically. The adjusted R2 were all very high; the lowest was for the destination of Gran Canaria (0.505) because it has the widest variety of offers, especially in non-hotel accommodations. The most relevant result was that the category of lodging is significantly and inversely related to the perceived value. This result agrees with the academic theory on value, which relates it inversely to the disutility of price. To the extent that price and category are highly interrelated, this result has been reproduced [
46,
50]. Other outstanding results are found for cleanliness, which is the quality of service variable most closely related to perceived value in the destinations of Gran Canaria and Tenerife and for price and these are the only two variables significantly related to perceived value in the Agadir destination.
In the proposed methodology to determine the competitive positioning of tourist destinations, a regression analysis of the quality average and added value variables is carried out in relation to the maximum prices in high season. The results show that quadratic functions have a better fit than linear functions. The graphs made for each destination reveal that the destination of Tenerife has a steeper slope, increasing until reaching the maximum values of quality of service. By contrast, Agadir is the destination where the lodgings have lower value, in addition to having the lowest prices. With regard to added value, the quadratic functions obtain a higher adjusted R2 value than the linear functions. The graphs show that the Agadir destination has a higher proportion of positive added value of lodgings because the lodgings offer a level of service quality at lower prices. Finally, a joint study has been carried out on accommodations in destinations differentiated by category. The graph of the average quality of 4 and 5-star accommodations shows that the destinations in Gran Canaria and Tenerife reach slightly higher values as the price rises. However, for lodgings with 3-stars or less, the values obtained by the three destinations are quite similar. In relation to the added value variable, the 4- and 5-star lodging graph shows that Agadir’s lodgings have the lowest prices and the highest added value. The analysis of accommodations with 3 stars or less shows that there is a greater balance in this type of offer.
This study has practical and research implications for tourism destinations. Destination leaders and DMOs need competitive tools to make decisions and define strategies with economic and sustainability results. The proposed methodology determines the positioning of the lodging offer vis-à-vis other competing destinations, which facilitates strategic analysis and the study of the main variables that influence customers. It is also a dynamic procedure that can constantly be updated based on the information available on specialized websites. Achieving a competitive accommodation offer means obtaining quality standards of service and added value based on the price paid by customers. To the extent that significant differences are found compared to other destinations, the actions of DMOs should focus on raising lodging managers’ awareness of the need to modify their competitive strategies.
From a research perspective, this study proposes variables and functions to define the competitive positioning of the lodging offer of destinations. In this context, a line of study is developed that can be expanded through the introduction of other variables and statistical procedures. The main limitation of this study lies in the variables with information available on the Internet. Although quantitative measurement scales consist of few variables, they have been shown to provide relevant information about the basic attributes that integrate perceived service and perceived value. Future research should perform comparative analyses of the competitive positioning of destinations, taking into account other lodging databases such as TripAdvisor and HolidayCheck. These results should be compared with those obtained with the information available on Booking.com in order to determine whether similar results are reached. Another aspect to highlight is that the methodology has been tested in three tourist destinations of great importance in the sun and beach segment. However, future research should test this methodology in other types of destinations with different strategic orientations. Finally, the variables used in the analysis are able to measure the performance of destinations’ lodging offers from the perspective of customers. Future research should examine the relationship between customer performance and the economic and financial performance of hospitality firms and tourist destinations.

 ,
, 


