Developing and Assessing Alternative Land-Use Scenarios from the MOLAND Model: A Scenario-Based Impact Analysis Approach for the Evaluation of Rapid Rail Provisions and Urban Development in the Greater Dublin Region

 and
and
Abstract
:1. Introduction
2. Methodologies for the Development and Assessment of the Land-Use Scenarios
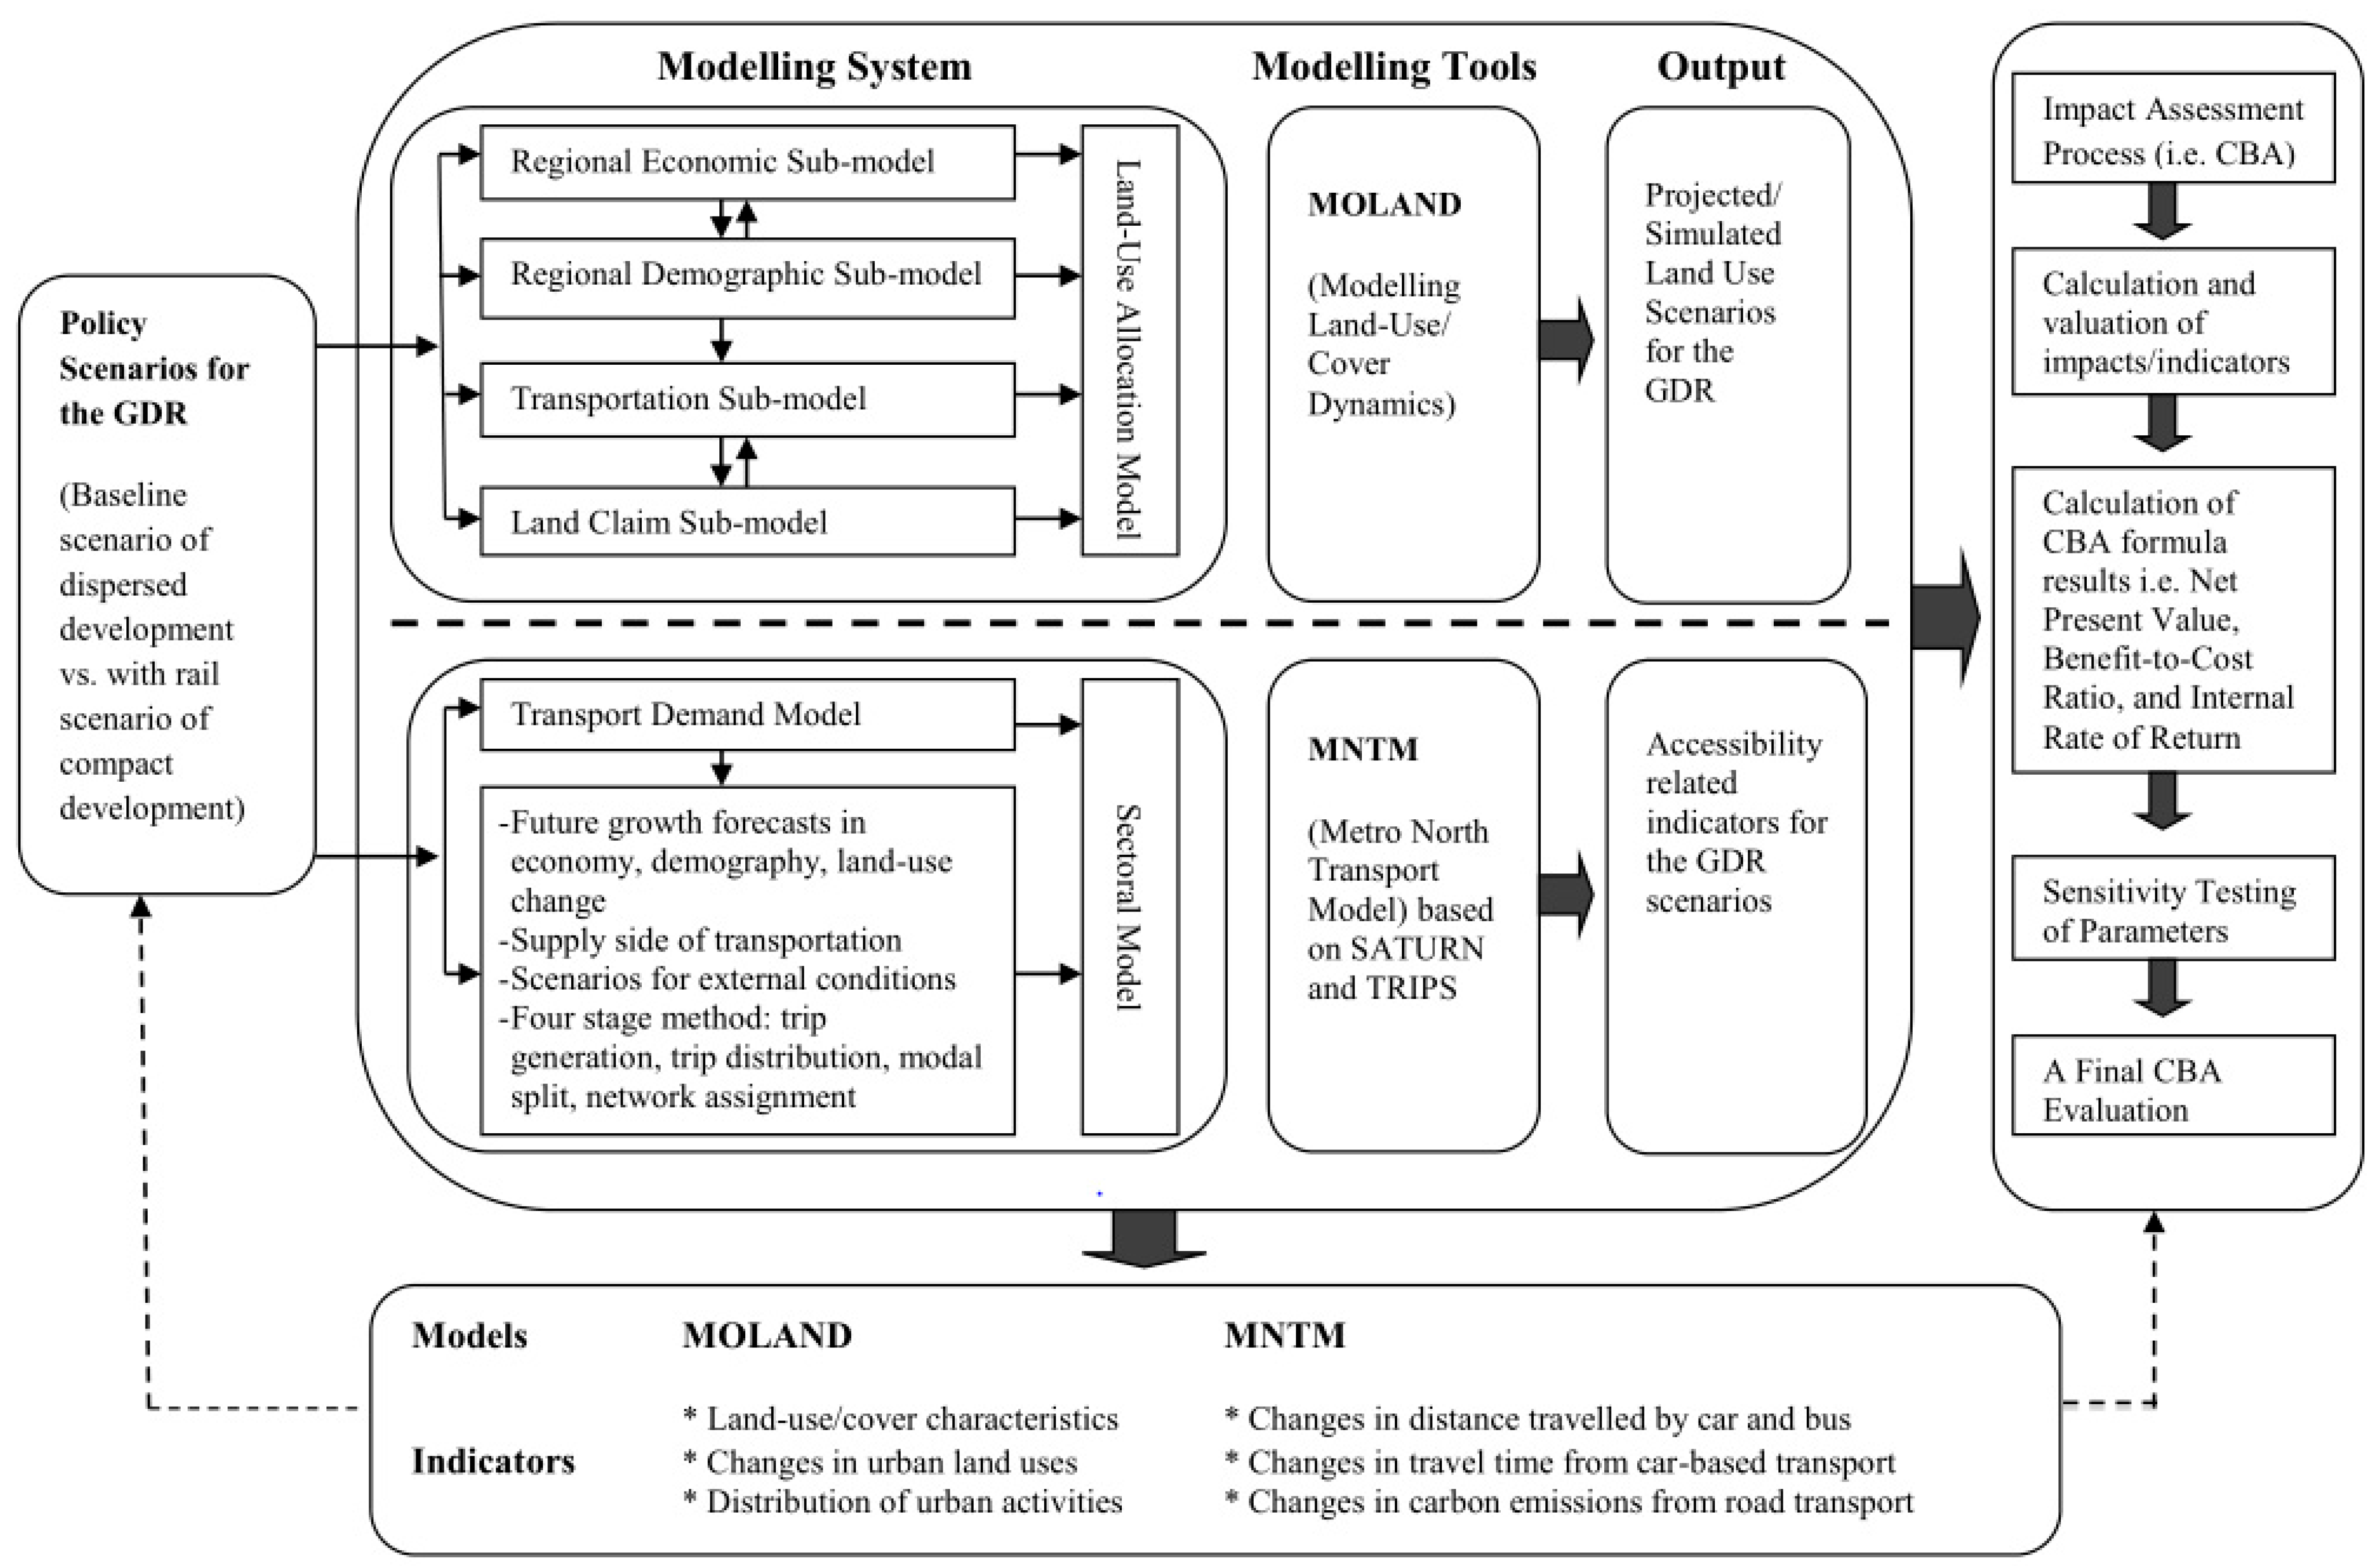
2.1. The Land-Use Modelling Framework
2.2. Evaluation Methodologies for Assessing Land-Use-Transport Impacts on Urban Development
3. Methodology
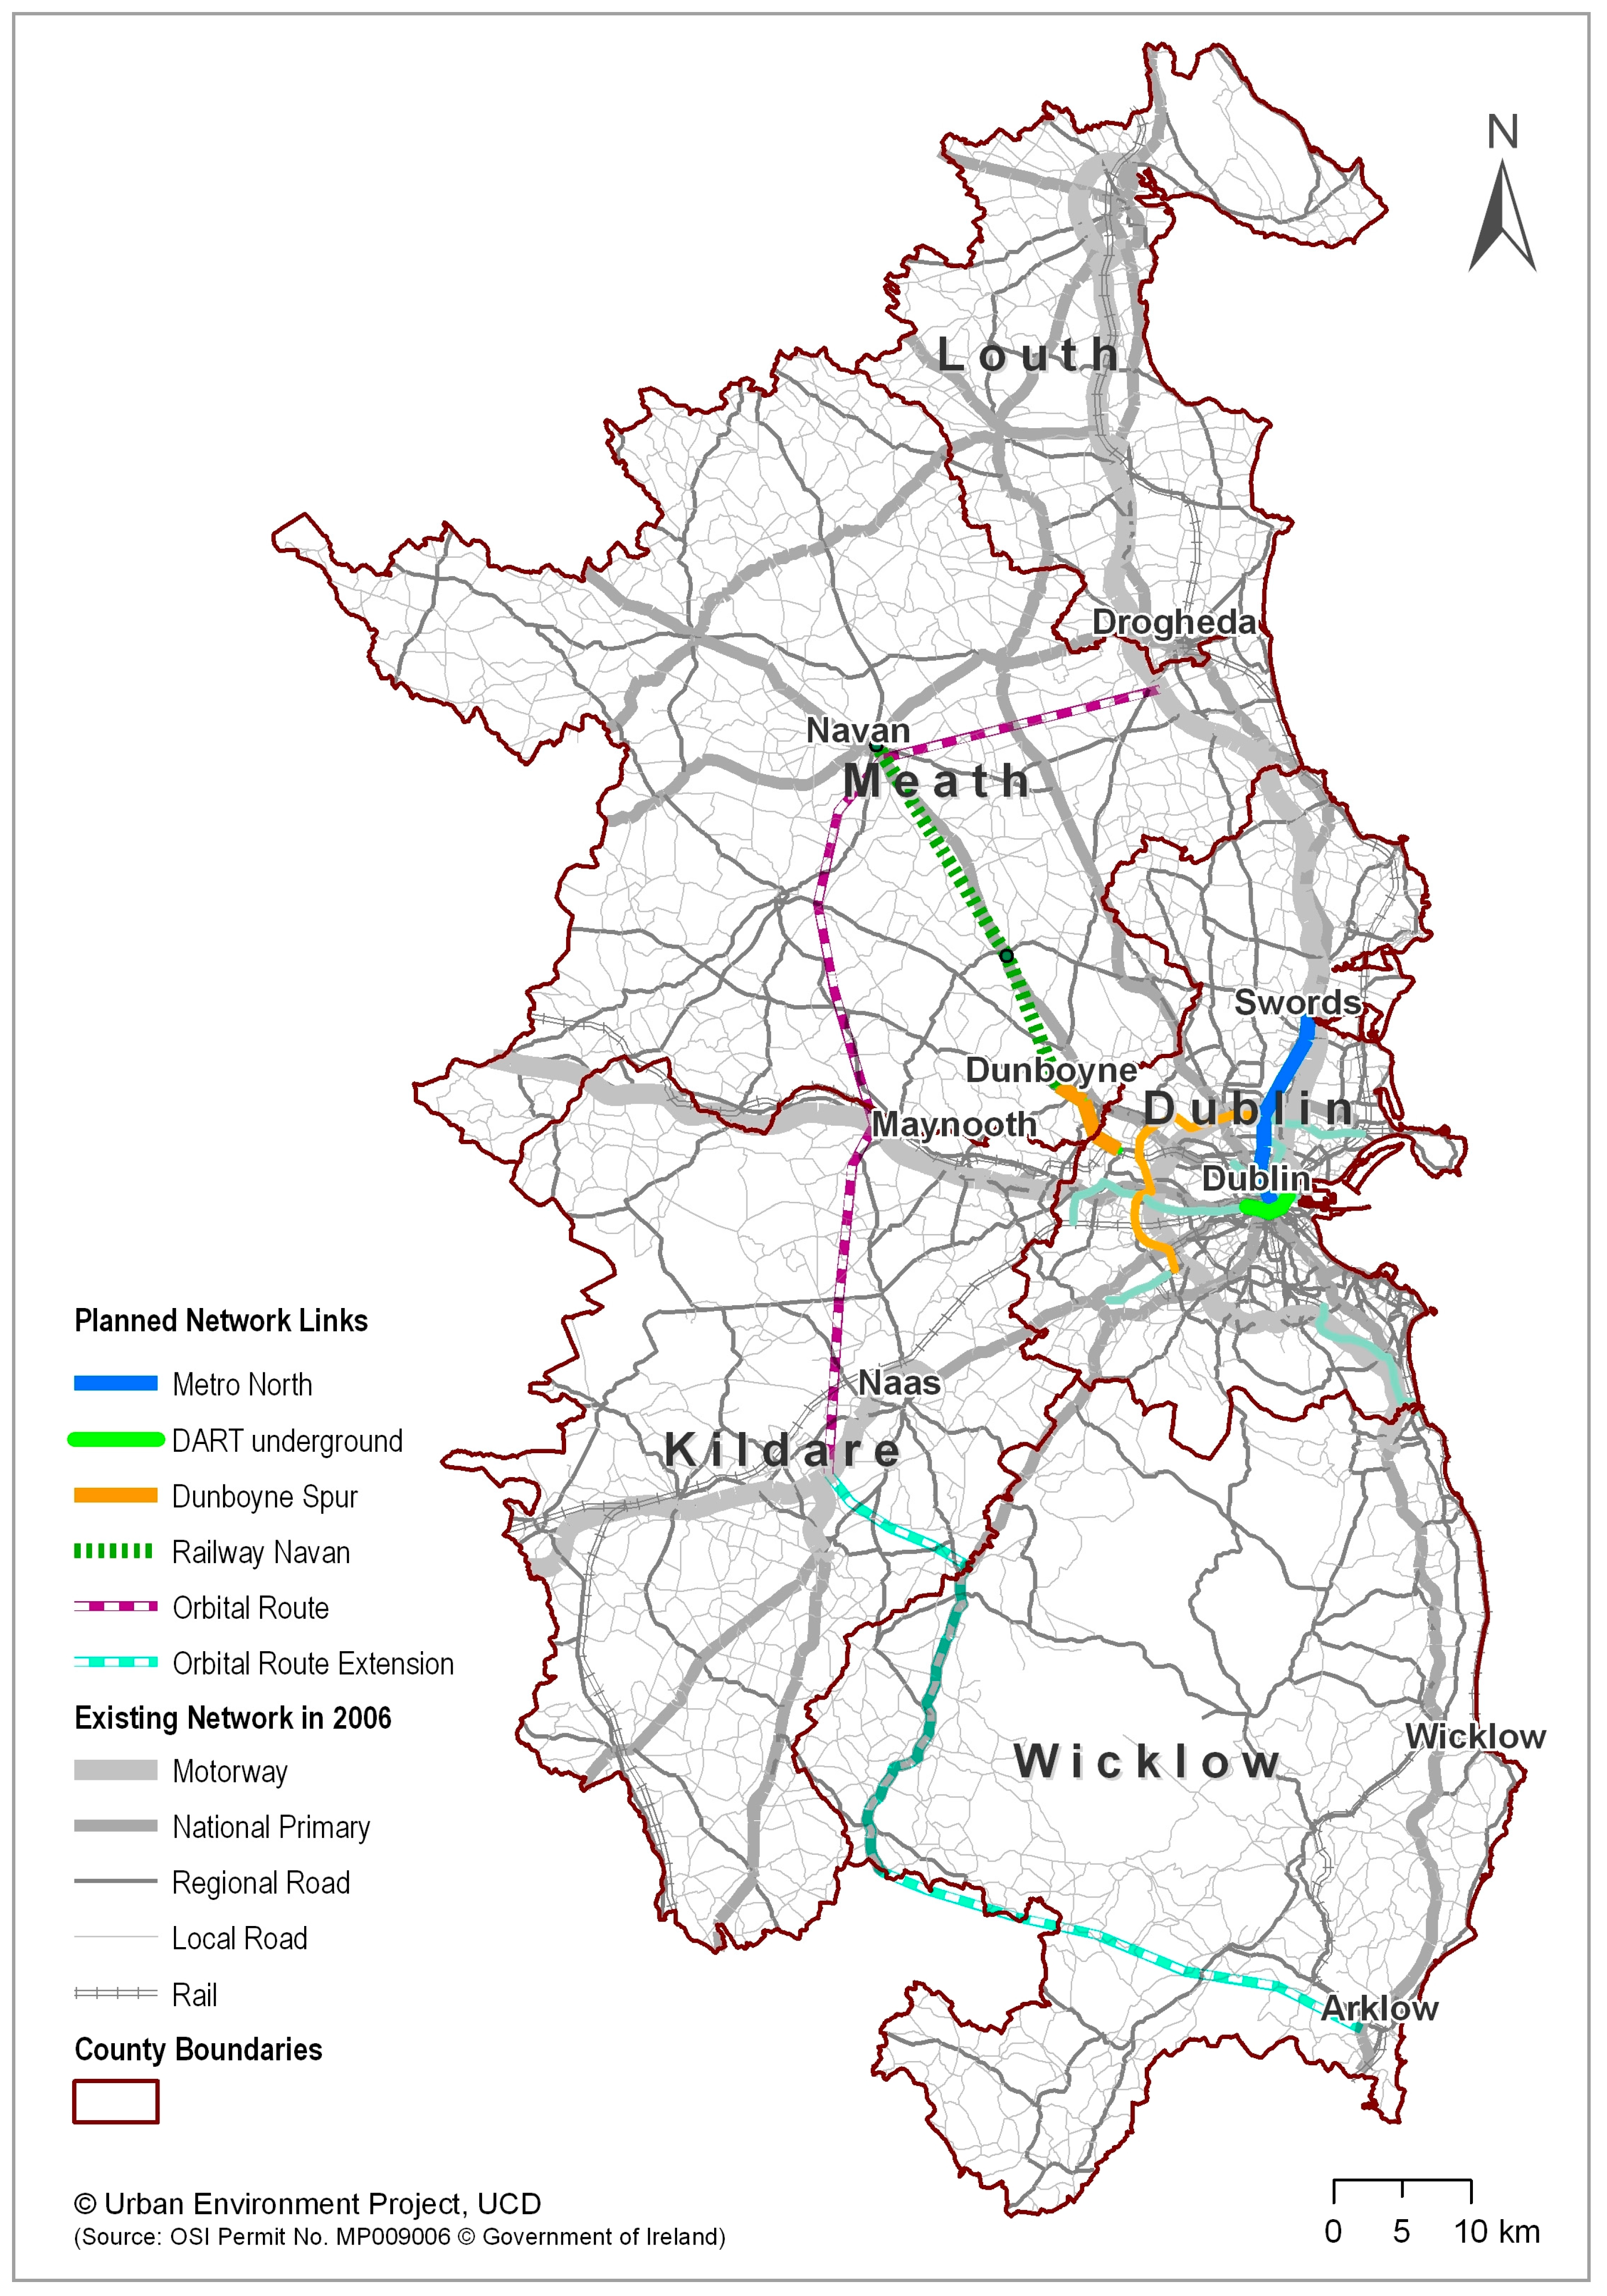
3.1. The Study Area
3.2. The Urban CA Models and the MOLAND
3.3. Application of the MOLAND Model in the GDR
3.4. Scenarios and the Land-Use-Transport Impact Assessment Methodology for the GDR
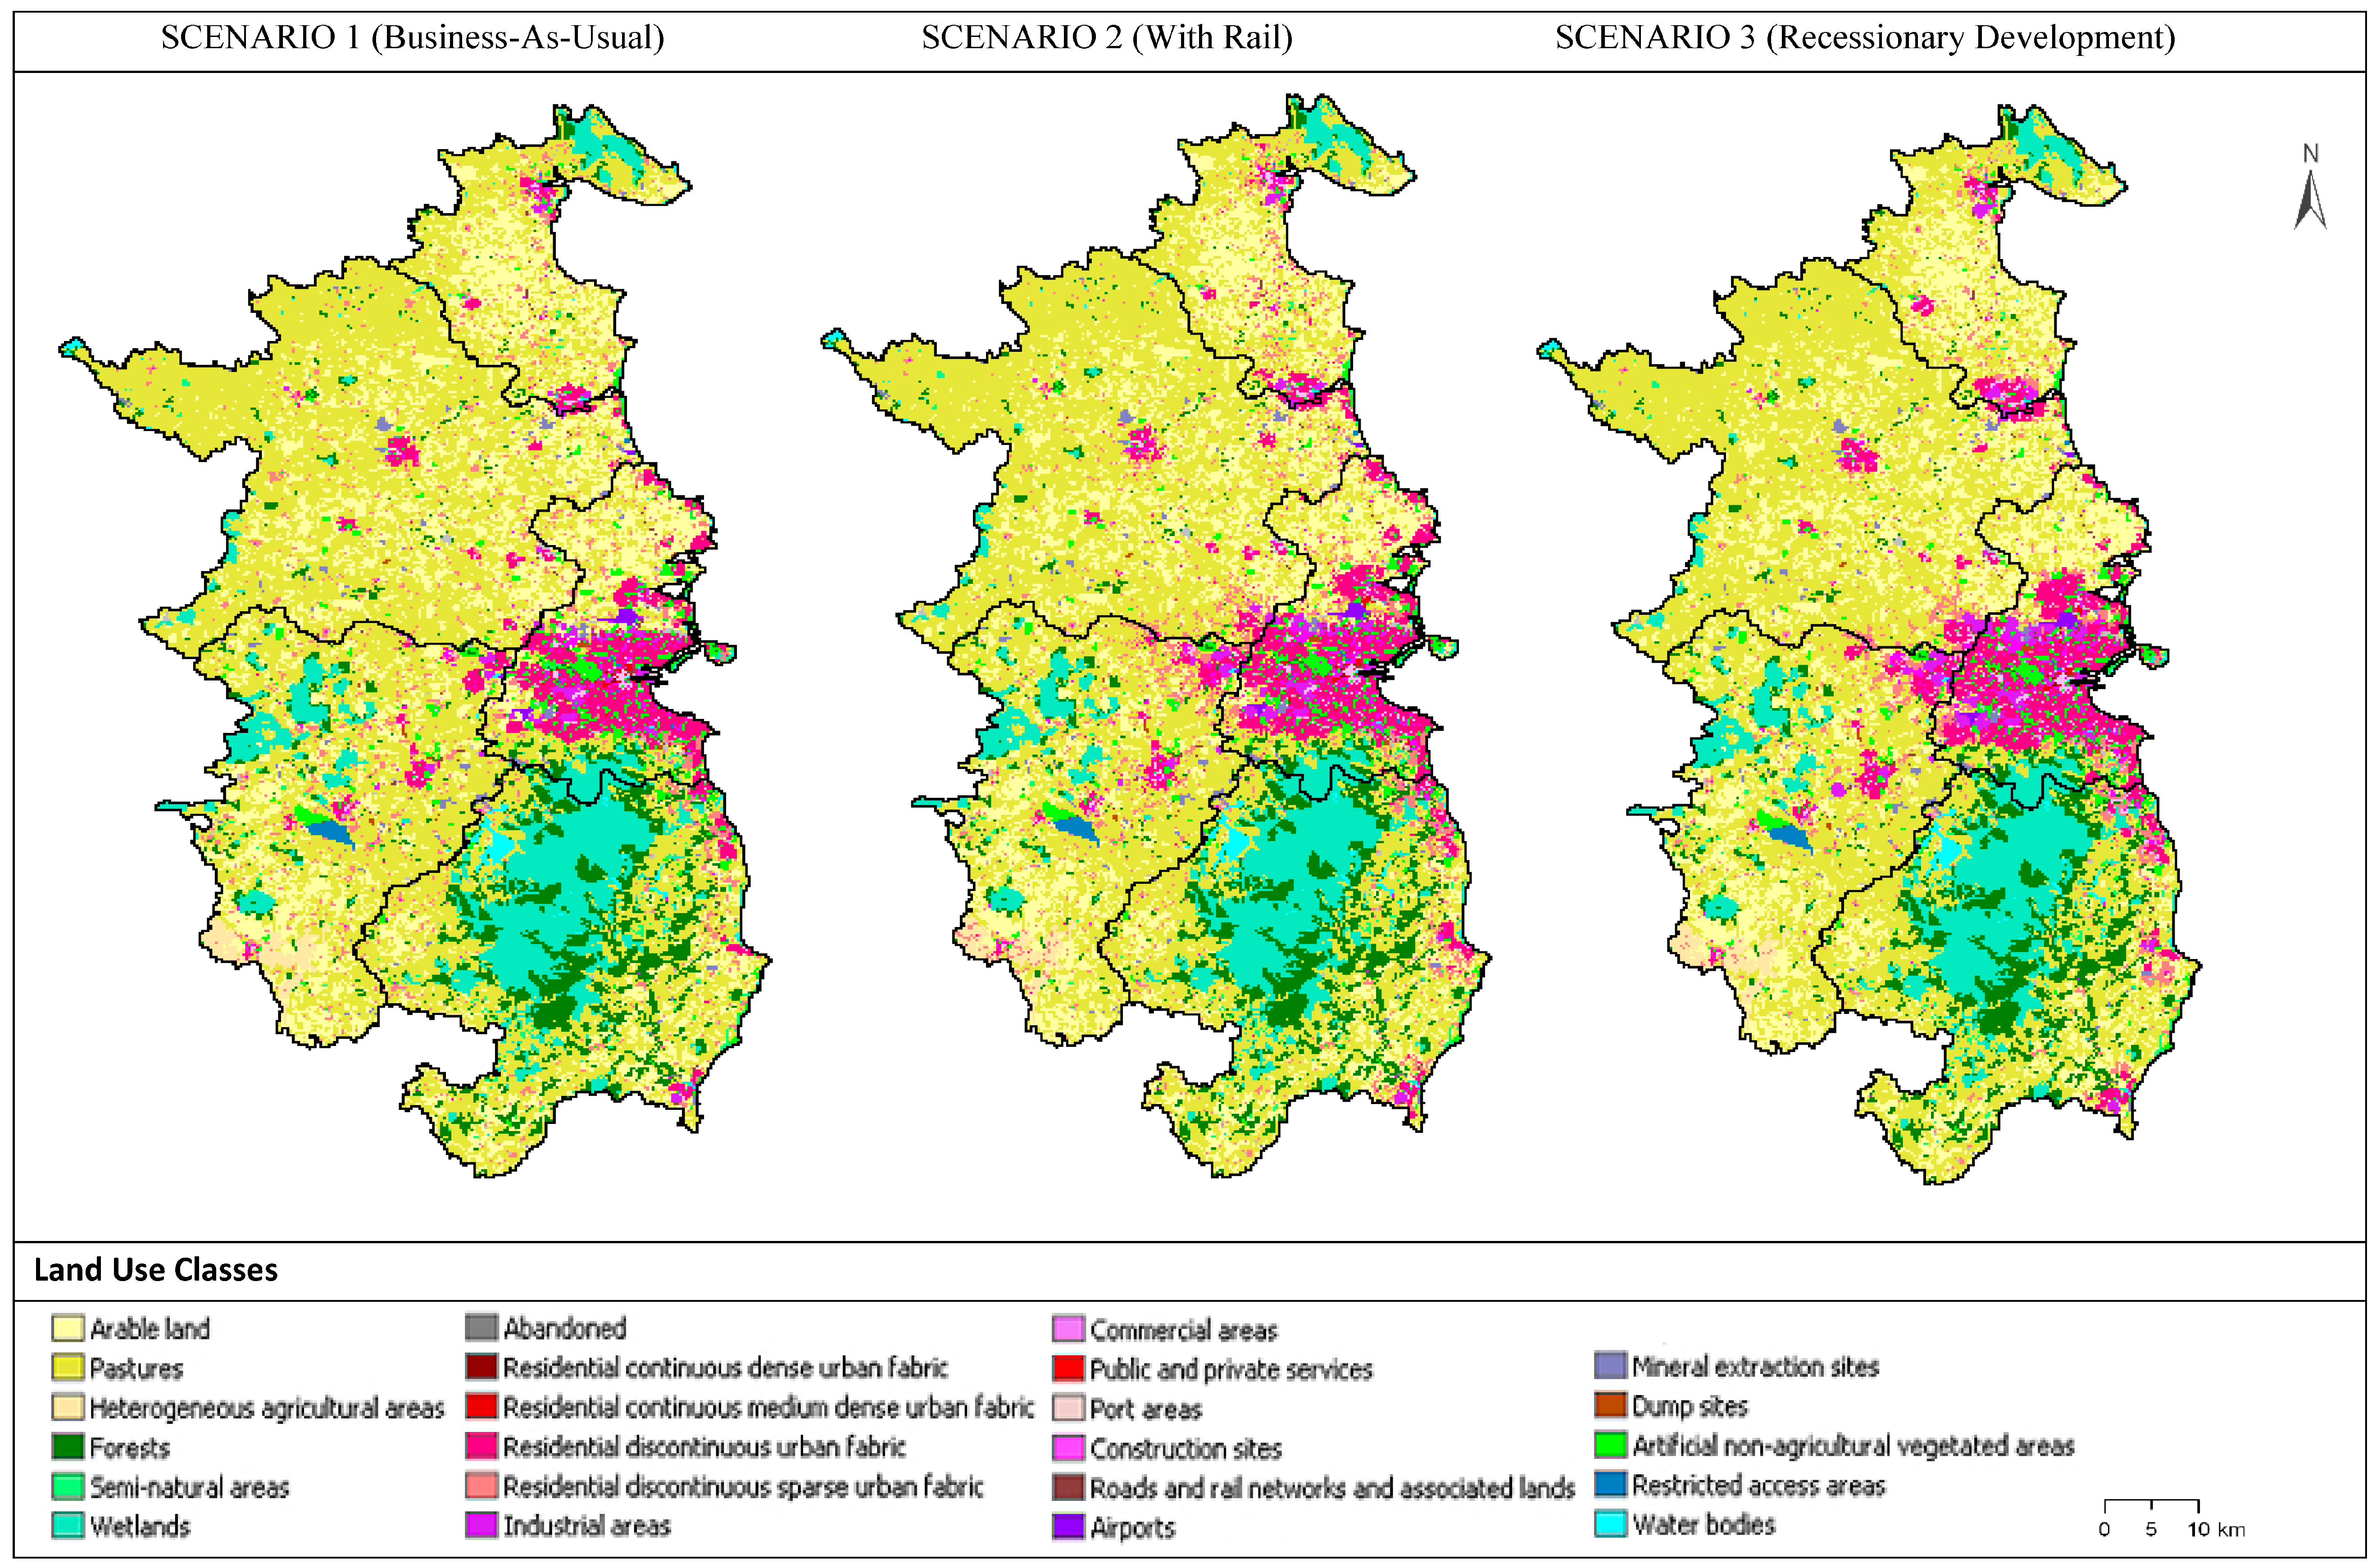
3.4.1. Policy Scenarios for the GDR
Scenario 1: Business-As-Usual
Scenario 2: Compact Development with Rail
Scenario 3: Recessionary Development
3.4.2. Evaluation Methodology for the Transport-Land-Use Impact Analysis of the Scenarios
4. Results
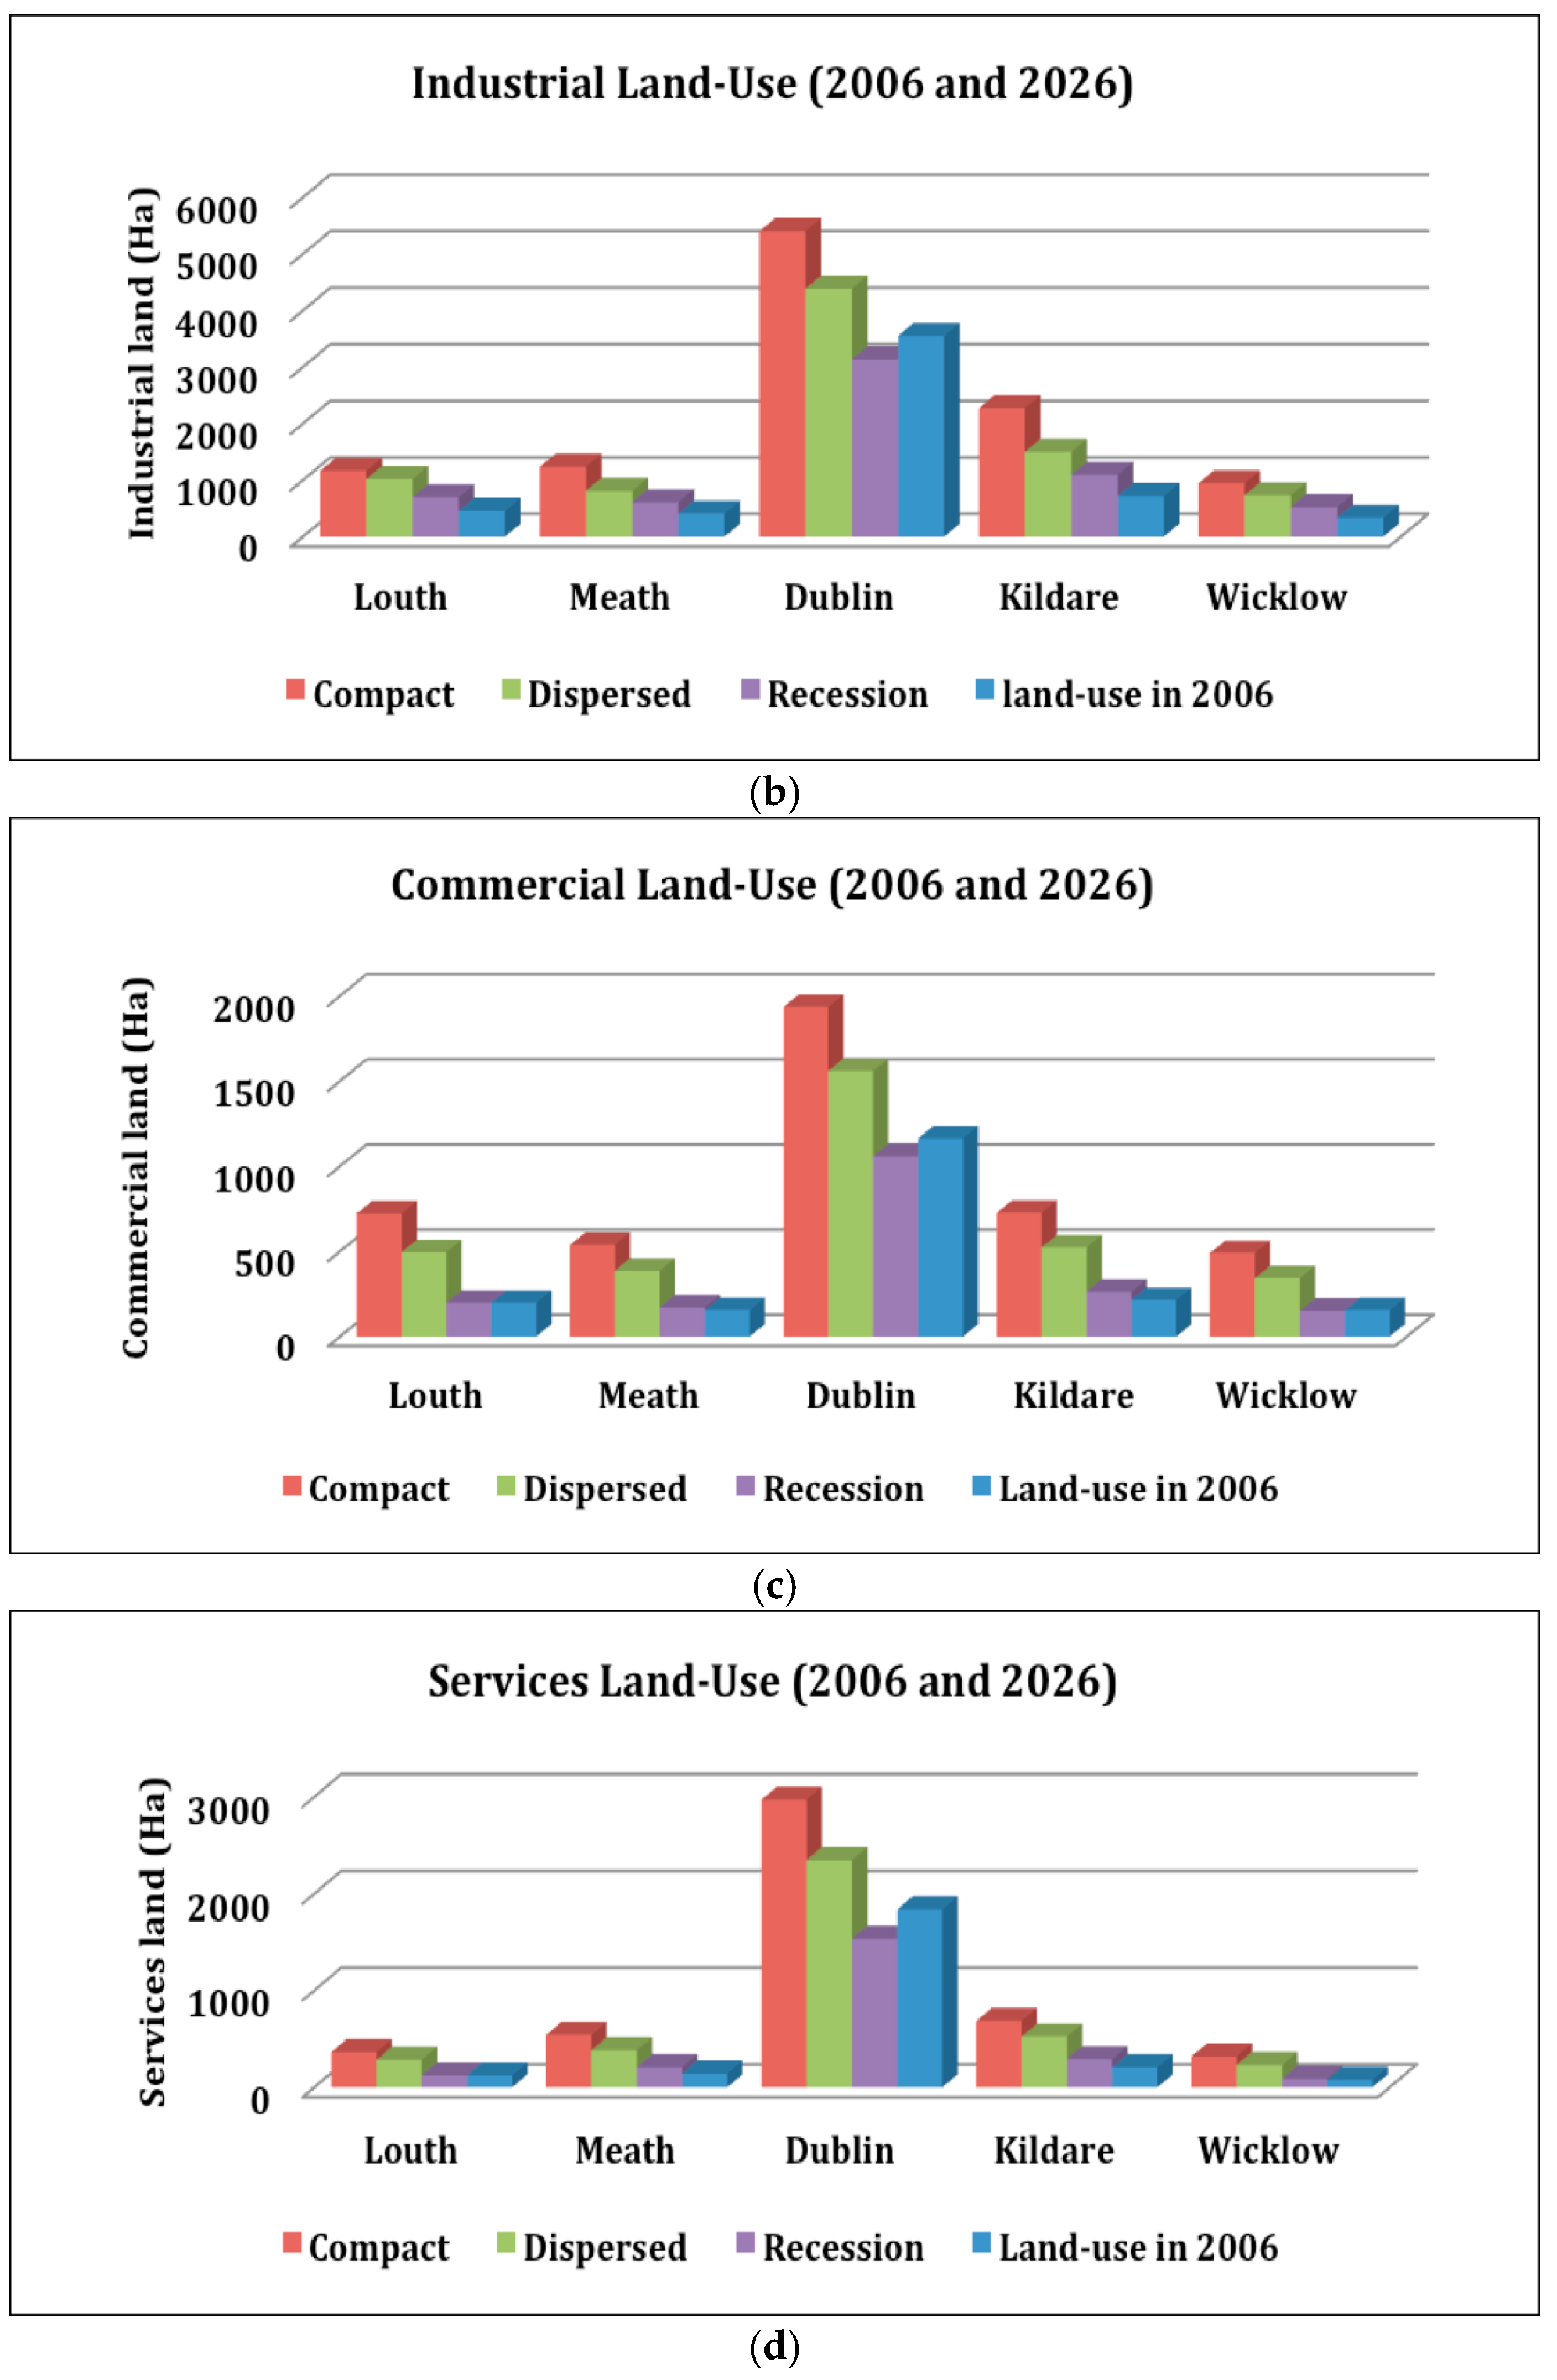
4.1. Results from the Scenario Analysis
4.2. CBA Results
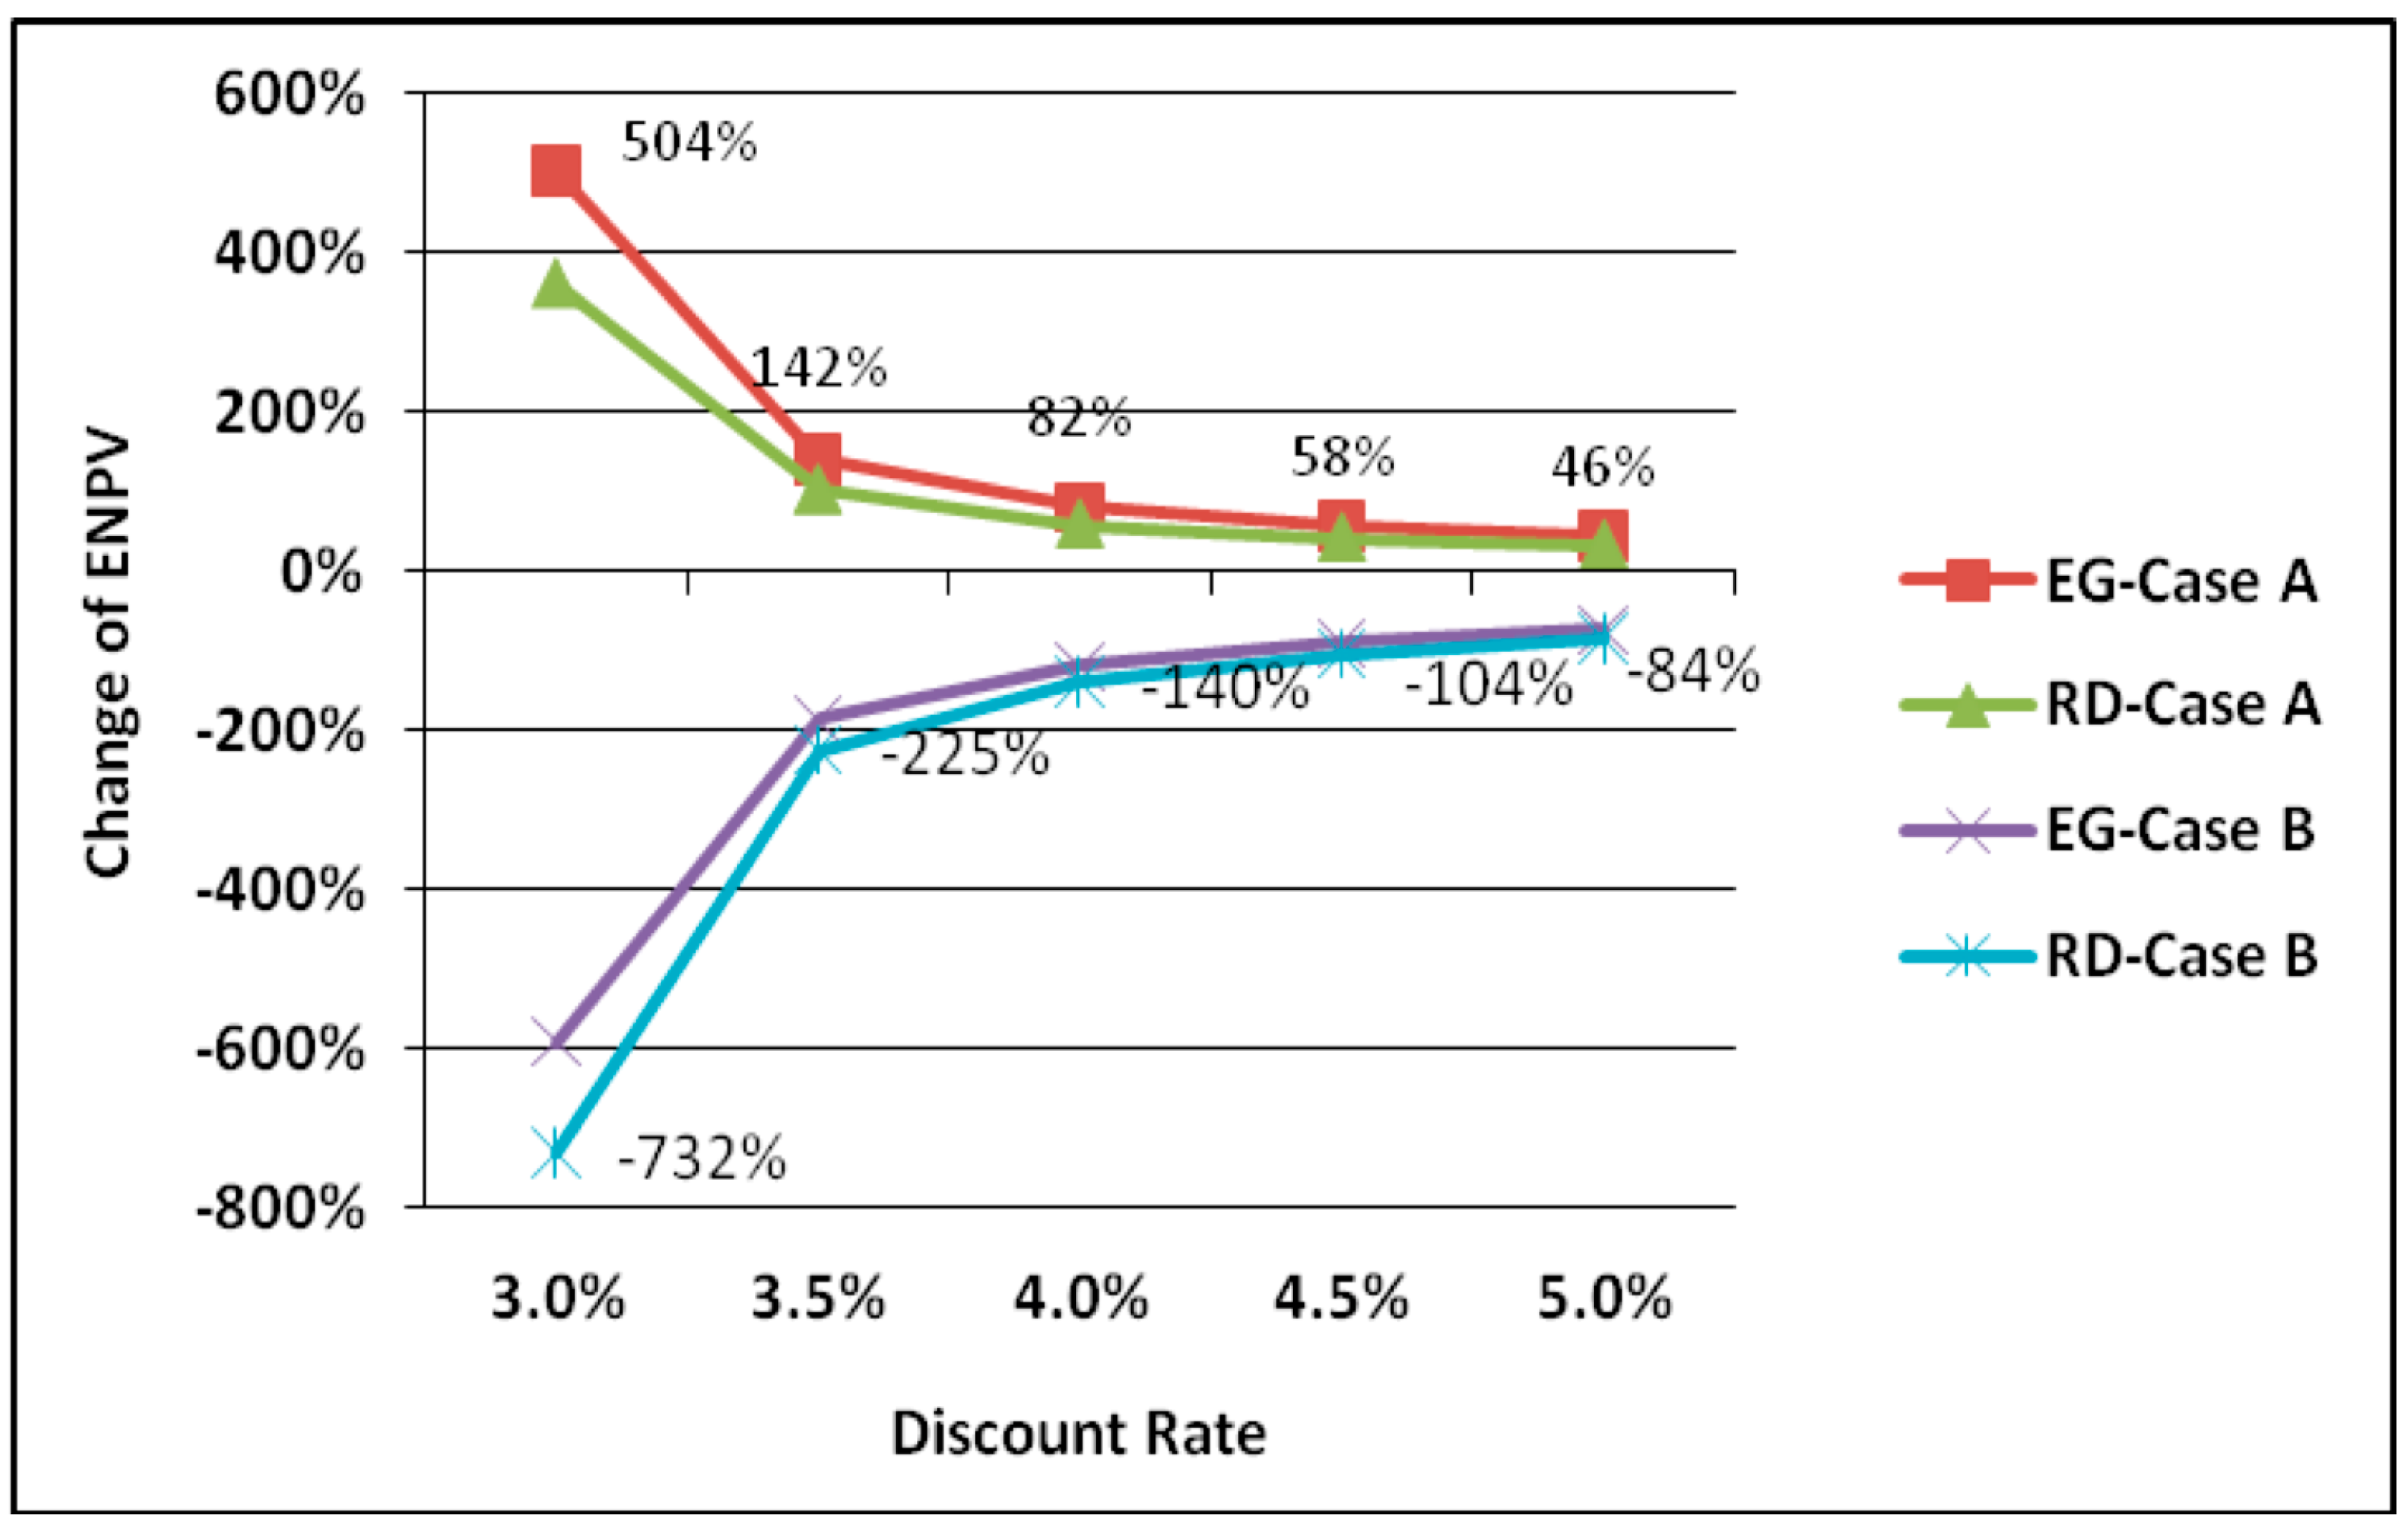
4.3. Results from Sensitivity Analysis
Recessionary Development Cases
5. Conclusions
Acknowledgments
Author Contributions
Conflicts of Interest
Appendix A

References
- European Environment Agency (EEA). Urban Sprawl in Europe: The Ignored Challenge; EEA Report No: 10/2006; European Commission Joint Research Centre/EEA: Luxembourg; Copenhagen, Denmark, 2006. [Google Scholar]
- United Nations; Centre for Human Settlements (HABITAT). The State of the World’s Cities 2004/2005: Globalization and Urban Culture; Earthscan: Abingdon, UK, 2004. [Google Scholar]
- United Nations; Centre for Human Settlements (HABITAT). Urbanization and Development: Emerging Futures; World of Cities Report; UN-Habitat: Nairobi, Kenya, 2016. [Google Scholar]
- Hillman, M. In favour of the compact city. In The Compact City: A Sustainable Urban Form? Jenks, M., Burton, E., Williams, K., Eds.; Spon Press: Oxford, UK, 1996. [Google Scholar]
- Breheny, M. The Compact cities and transport energy consumption. Trans. Inst. Br. Geogr. 1995, 20, 81–101. [Google Scholar] [CrossRef]
- Hopkins, L.D.; Zapata, M.A. (Eds.) Engaging the Future. Forecasts, Scenarios, Plans, and Projects; Lincoln Institute of Land Policy: Cambridge, MA, USA, 2007. [Google Scholar]
- Petrov, L.; Lavalle, C.; Kasankob, M. Urban land use scenarios for a tourist region in Europe: Applying the MOLAND model to Algarve, Portugal. Lands. Urban Plan. 2009, 92, 10–23. [Google Scholar] [CrossRef]
- Perez-Soba, M.; Verburg, P.H.; Koomen, E.; Hilferink, M.H.; Benito, P.; Lesschen, J.P.; Banse, M.; Woltjer, G.; Eickhout, B.; Prins, A.-G.; et al. Land Use Modelling-Implementation; European Commission: Brussels, Belgium, 2010. [Google Scholar]
- Mubareka, S.; Koomen, E.; Estreguil, C.; Lavalle, C. Development of a composite index of urban compactness for land use modelling applications. Lands. Urban Plan. 2011, 103, 303–317. [Google Scholar] [CrossRef]
- Couclelis, H. From cellular automata to urban models: A new principles for model development and implementation. Environ. Plan. B 1997, 24, 165–174. [Google Scholar] [CrossRef]
- Silva, E.A.; Clarke, K.C. Complexity, emergence and cellular urban models: Lessons learned from applying Sleuth to two Portuguese Metropolitan Areas. Eur. Plan. Stud. 2005, 13, 93–116. [Google Scholar] [CrossRef]
- White, R.; Engelen, G. Cellular automata and fractal urban form: A cellular modelling approach to the evolution of urban land-use patterns. Environ. Plan. A 1993, 25, 1175–1199. [Google Scholar] [CrossRef]
- Clarke, K.C.; Hoppen, S.; Gaydos, L. A self-modifying cellular automaton model of historical urbanization in the San Francisco Bay Area. Environ. Plan. B 1997, 24, 247–261. [Google Scholar] [CrossRef]
- Batty, M. Cities and Complexity: Understanding Cities with Cellular Automata, Agent-Based Models, and Fractals; The MIT Press: Cambridge, MA, USA, 2007. [Google Scholar]
- Barredo, J.I.; Demicheli, L.; Lavalle, C.; Kasanko, M.; McCormick, N. Modelling future urban scenarios in developing countries: An application case study in Lagos, Nigeria. Environ. Plan. B 2004, 32, 65–84. [Google Scholar] [CrossRef]
- Engelen, G.; Lavalle, C.; Barredo, J.I.; van der, M.M.; White, R. The Moland modelling framework for urban and regional land-use dynamics. In Modelling Land-Use Change; Koomen, E., Stillwell, J., Bakema, A., Scholten, H.J., Eds.; Springer: Dordrecht, The Netherlands, 2007. [Google Scholar]
- European Commission (EC). Modelling of EU Land-Use Choices and Environmental Impacts—Scoping Study; DG ENV; Bio Intelligence Services S.A.S.: Brussels, Belgium; Lvry-sur-Seine, France, 2008. [Google Scholar]
- Dadashpour, H.; Kheirodin, R.; Yaghobkhani, M.; Chamani, B. Modeling Tehran land use changes by using the MOLAND Model. J. Reg. Plan. 2015, 4, 49–64. [Google Scholar]
- Alexander, P.J.; Fealy, R.; Mills, G.M. Simulating the impact of urban development pathways on the local climate: A scenario-based analysis in the greater Dublin region, Ireland. Lands. Urban Plan. 2016, 152, 72–89. [Google Scholar] [CrossRef]
- Ustaoglu, E.; Williams, B.; Petrov, L.O. Scenario analysis of alternative land development patterns for the Leipzig-Halle Region: Implications for transport-land-use sustainability. Urban Plan. 2017, 2, 108–129. [Google Scholar] [CrossRef]
- Shahumyan, H.; White, R.; Twumasi, O.B.; Convery, S.; Williams, B.; Critchley, M.; Carthy, J.; Walsh, C.; Brennan, M. The MOLAND Model Calibration and Validation for the Greater Dublin Region; UCD UII 09/03; UCD Urban Institute Ireland: Dublin, Ireland, 2009. [Google Scholar]
- Boardman, J.; Poesen, J. Soil Erosion in Europe; John Wiley & Sons, Ltd.: Chichester, UK, 2006. [Google Scholar]
- Choi, W.; Deal, B.M. Assessing hydrological impact of potential land use change through hydrological and land use change modeling for the Kishwaukee River Basin (USA). J. Environ. Manag. 2008, 88, 1119–1130. [Google Scholar] [CrossRef] [PubMed]
- Hoogwijk, M.; Faaij, A.; Eickhout, B.; de Vries, B.; Turkenburg, W. Potential of biomass energy out to 2100 for four IPCC SRES land-use scenarios. Biomass Bioenergy 2005, 29, 225–257. [Google Scholar] [CrossRef]
- Deal, B.; Schunk, D. Spatial dynamic modeling and urban land use transformation: A simulation approach to assessing the costs of urban sprawl. Ecol. Econ. 2004, 51, 79–95. [Google Scholar] [CrossRef]
- Verburg, P.H.; van Berkel, D.B.; van Doorn, A.M.; van Eupen, M.; van den Heiligenberg, A.R.M. Trajectories of land use change in Europe: A model based exploration of rural futures. Lands. Ecol. 2010, 25, 217–232. [Google Scholar] [CrossRef] [Green Version]
- Nuissl, H.; Haase, D.; Lanzendorf, M.; Wittmer, H. Environmental impact assessment of urban land use transitions—A context-sensitive approach. Land Use Policy 2009, 26, 414–424. [Google Scholar] [CrossRef]
- Geurs, K.T.; Van Wee, B. Accessibility evaluation of land-use and transport strategies: Review and research directions. J. Transp. Geogr. 2004, 12, 127–140. [Google Scholar] [CrossRef]
- Geurs, K.T.; Zondag, B.; de Jong, G.; de Bok, M. Accessibility appraisal of land-use/transport strategies: More than just adding up travel-time savings. Transp. Res. Part D 2010, 15, 382–393. [Google Scholar] [CrossRef]
- Waddell, P. Integrated land use and transportation planning and modelling: Addressing challenges in research and practice. Transp. Rev. 2011, 31, 209–229. [Google Scholar] [CrossRef]
- Schroeder, M.J.; Lambert, J.H. Scenario-based multiple criteria analysis for infrastructure policy impacts and planning. J. Risk Res. 2011, 14, 191–214. [Google Scholar] [CrossRef]
- Hickman, R.; Saxena, S.; Banister, D.; Ashiru, O. Examining transport futures with scenario analysis and MCA. Transp. Res. A 2012, 46, 560–575. [Google Scholar] [CrossRef]
- Vermote, L.; Macharis, C.; Hollevoet, J.; Putman, K. Participatory evaluation of regional light rail scenarios: A Flemish case on sustainable mobility and land use. Environ. Sci. Policy 2014, 37, 101–120. [Google Scholar] [CrossRef]
- European Environment Agency (EEA). Land-Use Scenarios for Europe: Qualitative and Quantitative Analysis on a European Scale; EEA Technical Report No. 9/2007; EEA: Copenhagen, Denmark, 2007. [Google Scholar]
- Verburg, P.H.; Kok, K.; Pontius, R.G., Jr.; Veldkamp, A. Modelling land-use and land-cover change. In Land-Use and Land-Cover Change: Local Processes and Global Impacts; Lambin, E.F., Geist, H.J., Eds.; Springer: Dordrecht, The Netherlands, 2006. [Google Scholar]
- Martinez, F.; Araya, C. Transport and land-use benefits under location externalities. Environ. Plan. A 2000, 32, 1611–1624. [Google Scholar] [CrossRef]
- Willigers, J.; Floor, H.; van Wee, B. Accessibility indicators for location choices of offices: An application to the intraregional distributive effects of high-speed rail in the Netherlands. Environ. Plan. A 2007, 39, 2086–2098. [Google Scholar] [CrossRef]
- Geurs, K.T.; Wee Van, B.; Rietveld, P. Accessibility appraisal of integrated land-use-transport strategies: Methodology and case study for the Netherlands Randstad Area. Environ. Plan. B 2006, 33, 639–660. [Google Scholar] [CrossRef] [Green Version]
- Kwok, R.C.W.; Yeh, A.G.O. The use of modal accessibility gap as an indicator for sustainable transport development. Environ. Plan. A 2004, 36, 921–936. [Google Scholar] [CrossRef]
- Handy, S. Smart growth and the transportation-land use connection: What does the research tell us? Int. Reg. Sci. Rev. 2005, 28, 146–167. [Google Scholar] [CrossRef]
- Hayashi, Y.; Mai, X.; Kato, H. The role of rail transport for sustainable urban transport. Transp. Res. Econ. Policy 2010, 4, 161–174. [Google Scholar]
- Curtis, C.; Mellor, R. Anticipating a new railway: The relevance of transit-oriented development to businesses in a car-oriented city. Urban Policy Res. 2011, 29, 141–165. [Google Scholar] [CrossRef]
- Van Wee, B.; Van den Brink, R.; Nijland, H. Environmental impacts of high-speed rail links in cost–benefit analyses: A case study of the Dutch Zuider Zee line. Transp. Res. Part D 2003, 8, 299–314. [Google Scholar] [CrossRef]
- Janic, M. Multicriteria evaluation of high-speed rail, trans rapid Maglev and air passenger transport in Europe. Transp. Plan. Tecnol. 2003, 26, 491–512. [Google Scholar] [CrossRef]
- De Rus, G.; Nombela, G. Is investment in high speed rail socially profitable? J. Transp. Econ. Policy 2007, 41, 3–23. [Google Scholar]
- Chester, M.; Horvath, A. Life-cycle assessment of high-speed rail: The case of California. Environ. Res. Lett. 2009, 5, 014003. [Google Scholar] [CrossRef]
- Bristow, A.L.; Nellthorp, J. Transport project appraisal in the European Union. Transp. Policy 2000, 7, 51–60. [Google Scholar] [CrossRef]
- Odgaard, T.; Kelly, C.; Laird, J. Current Practice in Project Appraisal in Europe: Analysis of Country Reports. HEATCO D: 1. 2005. Available online: http://heatco.ier.uni-stuttgart.de/hd1final.pdf (accessed on 31 January 2005).
- Hayashi, Y.; Morisugi, H. International comparison of background concept and methodology of transportation project appraisal. Transp. Policy 2000, 1, 73–88. [Google Scholar] [CrossRef]
- Central Statistics Office (CSO). Population and Migration Estimates April 2017. 2017. Available online: http://www.cso.ie/en/csolatestnews/presspages/2017/populationandmigrationestimatesapril2017/ (accessed on 15 April 2017).
- Williams, B.; Nedovic-Budic, Z. The real estate bubble in Ireland. Policy context and responses. Urban Res. Pract. 2016, 9, 204–218. [Google Scholar] [CrossRef]
- Nedovic-Budic, Z.; Knaap, G.J.; Shahumyan, H.; Williams, B.; Slaev, A. Measuring urban form at community scale: Case study of Dublin, Ireland. Cities 2016, 55, 148–164. [Google Scholar] [CrossRef]
- Ustaoglu, E.; Williams, B.; Murphy, E. Integrating CBA and land-use development scenarios: Evaluation of planned rail investments in the Greater Dublin Area, Ireland. Case Stud. Transp. Policy 2017, 4, 104–121. [Google Scholar] [CrossRef]
- Grengs, J. Job accessibility and the modal mismatch in Detroit. J. Transp. Geogr. 2010, 18, 42–54. [Google Scholar] [CrossRef]
- Chetty, R.; Hendren, N.; Kline, P.; Saez, E. Where Is the Land of Opportunity? The Geography of Intergenerational Mobility in the United States; National Bureau of Economic Research: Cambridge, MA, USA, 2014. [Google Scholar]
- Ewing, R.; Hamidi, S.; Grace, J.B.; Wei, Y.D. Does urban sprawl hold down upward mobility? Lands. Urban Plan. 2016, 148, 80–88. [Google Scholar] [CrossRef]
- Levy, D.K.; McDade, Z.; Dumlao, K. Effects from Living in Mixed-Income Communities for Low-Income Families: A Review of the Literature; Urban Institute: Washington, DC, USA, 2010; Available online: www.urban.org/research/publication/effects-living-mixed-income-communities-low-income-families (accessed on 17 November 2017).
- Ewing, R.; Hamidi, S. Measuring Urban Sprawl and Validating Sprawl Measures; Metropolitan Research Center at the University of Utah for the National Cancer Institute, the Brookings Institution and Smart Growth America: Washington, DC, USA, 2014; Available online: www.arch.utah.edu/cgi-bin/wordpress-metroresearch (accessed on 10 April 2016).
- Browning, C.R.; Byron, R.A.; Calder, C.A.; Krivo, L.J.; Kwan, M.-P.; Lee, J.-Y.; Peterson, R.D. Commercial density, residential concentration, and crime: Land use patterns and violence in neighborhood context. J. Res. Crime Delinq. 2010, 47, 329–357. [Google Scholar] [CrossRef]
- Hillier, B.; Sahbaz, O. An Evidence Based Approach to Crime and Urban Design or, Can We Have Vitality, Sustainability and Security All at Once? University College London: London, UK, 2008; Available online: http://spacesyntax.com/wp-content/uploads/2011/11/Hillier-Sahbaz_An-evidence-based-approach_010408.pdf (accessed on 15 November 2017).
- Transport Infrastructure Ireland. 2017. Available online: https://www.nationaltransport.ie/projects-schemes/transport-projects/new-metro-north/ (accessed on 17 September 2017).
- Von Neumann, J. The Theory of Self-Reproducing Automata; Burks, A., Ed.; University of Illinois Press: Urbana, IL, USA, 1966. [Google Scholar]
- Schelling, T.C. Dynamic models of segregation. J. Math. Sociol. 1971, 1, 143–186. [Google Scholar] [CrossRef]
- Wolfram, S. Statistical mechanics of cellular automata. Rev. Mod. Phys. 1983, 55, 601–644. [Google Scholar] [CrossRef]
- White, R. Modelling multi-scale processes in a cellular automata framework. In Complex Artificial Environments; Portugali, J., Ed.; Springer: Berlin, Germany, 2005. [Google Scholar]
- Webster, C.J.; Wu, F. Regulation, land-use mix, and urban performance. Environ. Plan. A 1999, 31, 1529–1547. [Google Scholar] [CrossRef]
- White, R.; Engelen, G.; Uljee, I. The use of constrained cellular automata for high-resolution modelling of urban land-use dynamics. Environ. Plan. B 1997, 24, 323–343. [Google Scholar] [CrossRef]
- Lavalle, C.; Barredo, J.; McCormick, N.; Engelen, G.; White, R.; Uljee, I. The MOLAND Model for Urban and Regional Growth Forecast, a Tool for the Definition of Sustainable Development Paths; European Commission, DG-Joint Research Centre: Ispra, Italy, 2004. [Google Scholar]
- Junfeng, J.; Boerboom, L. Transition rule elicitation methods for urban cellular automata models. In Innovations in Design & Decision Support Systems in Architecture and Urban Planning; Van Leeuwen, J., Timmermans, H., Eds.; Springer: Dordrecht, The Netherlands, 2006. [Google Scholar]
- The Organisation for Economic Co-operation and Development (OECD). Impact of Transport Infrastructure Investment on Regional Development; OECD: Paris, France, 2002. [Google Scholar]
- Metz, D. The Limits to Travel: How Far Will You Go? Earthscan: Oxon, UK, 2008. [Google Scholar]
- Messina, J.P.; Evans, T.P.; Manson, S.M.; Shortridge, A.M.; Deadman, P.J.; Verburg, P.H. Complex systems models and the management of error and uncertainty. J. Land Use Sci. 2008, 3, 11–25. [Google Scholar] [CrossRef]
- European Environment Agency (EEA). CLC2006 Technical Guidelines; EEA: Copenhagen, Denmark, 2007; Volume 17. [Google Scholar]
- Shahumyan, H.; Twumasi, O.B.; Convery, S.; Foley, R.; Vaughan, E.; Casey, E.; Carthy, J.; Walsh, C.; Brennan, M. Data Preparation for the MOLAND Model Application for the Greater Dublin Region; UCD UII 09/04; UCD Urban Institute Ireland: Dublin, Ireland, 2009. [Google Scholar]
- Engelen, G.; White, R.; Uljee, I. Moland Model for Urban and Regional Growth: Model Description and User Manual; Research Institute for Knowledge Systems (RIKS): Maastricht, The Netherlands, 2004. [Google Scholar]
- Litman, T. Evaluating Transportation Land Use Impacts; Victoria Transport Policy Institute: Victoria, BC, Canada, 2008; Available online: http://www.vtpi.org.landuse.pdf (accessed on 22 February 2012).
- European Commission (EC). Guide to Cost Benefit Analysis of Investment Projects; Directorate General Regional Policy Final Report; EC: Brussels, Belgium, 2008. [Google Scholar]
- Rail Procurement Agency (RPA). Environment Impact Statement-Metro North; RPA: Dublin, Ireland, 2008; Available online: http://www.tii.ie/tii-library/railway-orders/ (accessed on 1 April 2015).
- Central Statistics Office (CSO). Regional Population Projections 2011–2026; Online Report; CSO: Cork, Ireland, 2008; Available online: http://www.cso.ie/releasespublications/reg_pop_projections.htm (accessed on 17 April 2010).
- Department of Education and Science. Department of Education and Science [Internet] Ireland. 2008. Available online: http://www.education.ie/ (accessed on 28 May 2010).
- Electricity Supply Board (ESB); ESB Networks Ltd. Statement of Charges; Online Report; ESB Networks: Dublin, Ireland, 2010; Available online: http://www.esb.ie/esbnetworks/commercial-downloads/statement_of_charges_2010.pdf (accessed on 10 April 2010).
- Department of Transport, Republic of Ireland. Goodbody Economic Consultants in Association with Atkins. Cost Benefit Parameters and Application Rules for Transport Project Appraisal; Department of Transport, Republic of Ireland: Dublin, Ireland, 2004. [Google Scholar]
- Department for Transport (DfT) UK. Values of Time and Operating Costs; TAG Unit 3.5.6; Department for Transport (DfT) UK: London, UK, 2009.
- Mackie, P.J.; Wardman, M.; Fowkes, A.; Whelan, G.; Nellthorp, J.; Bates, J. Value of Travel Time Savings in the UK; A Report to the Department for Transport UK; University of Leeds: Leeds, UK, 2003. [Google Scholar]
- Kuik, O.; Brander, L.; Nikitina, N.; Navrud, S.; Magnussen, K.; Fall, E.H. Report on the Monetary Valuation of Energy Related Impacts on Land-Use Changes, Acidification, Eutrophication, Visual Intrusion and Climate Change; Funded by EU 6th Framework Programme. 2007. Available online: http://www.feem-project.net/cases/ (accessed on 15 December 2008).
- Department for Environment, Food and Rural Affairs (DEFRA). The Social Costs of Carbon and the Shadow Price of Carbon: What They Are, and How to Use Them in Economic Appraisal in the UK; Department for Environment, Food and Rural Affairs: London, UK, 2007.
- HEATCO. Project Funded by 6th Framework Programme IER, Germany, 2004–2006; HEATCO: Stuttgart, Germany, 2007. [Google Scholar]
- UNITE. The Pilot Accounts for Ireland-Appendix Report: Deliverable 8, Annex 5; Funded by EU’s 5th RTD Framework Programme; Online Report; ITS, University of Leeds: Leeds, UK, 2003; Available online: http://www.its.leeds.ac.uk/projects/unite/ (accessed on 24 November 2008).
- Transport 21. Transport 21 Progress in Motion Ireland. 2010. Available online: https://en.wikipedia.org/wiki/Transport_21 (accessed on 15 December 2010).
- Department of Transport Ireland. Guidelines of a Common Appraisal Framework for Transport Projects and Programs; Department of Transport, Republic of Ireland: Dublin, Ireland, 2007; Available online: http://www.tcd.ie/civileng/Staff/Brian.Caulfield/4A8/DoT%20Apprasial%20Guide%20Lines.pdf (accessed on 23 March 2008).
- National Roads Authority (NRA). Project Appraisal Guidelines: Appendix 6-National Parameters Value Sheet; NRA: Dublin, Ireland, 2008. [Google Scholar]
- Lee, D.B., Jr. Methods for evaluation of transportation projects in the USA. Transp. Policy 2000, 7, 41–50. [Google Scholar] [CrossRef]
- Morisugi, H. Evaluation methodologies of transportation projects in Japan. Transp. Policy 2000, 7, 35–40. [Google Scholar] [CrossRef]
- Ustaoglu, E. A Scenario-Based Impact Evaluation of Rapid Rail Infrastructure Investments on Urban Form and Development in the Greater Dublin Area. Ph.D. Thesis, University College Dublin, Dublin, Ireland, 2011. [Google Scholar]
- Baruya, A.; Finch, D.J. Investigations of Traffic Speeds and Accidents on Urban Roads. In Proceedings of the 22nd European Transport Forum, Coventry, UK, 12–16 September 1994. [Google Scholar]
- National Transport Authority. Fingal/North Dublin Transport Study: Two-Stage Appraisal Report; AECOM Ltd.: Dublin, Ireland, 2015. [Google Scholar]
- Litman, T. Evaluating Public Transportation Health Benefits; Victoria Transport Policy Institute: Victoria, BC, Canada, 2010; Available online: http://www.apta.com/resources/reportsandpublications/Documents/APTA_Health_Benefits_Litman.pdf (accessed on 07 July 2010).
- Franco, H.O.; de Laet, C.; Peeters, A.; Jonker, J.; Mackenbach, J.; Nusselder, W. Effects of physical activity on life expectancy with cardiovascular disease. Arch. Intern. Med. 2005, 165, 2355–2360. [Google Scholar] [CrossRef] [PubMed]
- Ewing, E.; Schieber, R.; Zegeer, C.V. Urban sprawl as a risk factor in motor vehicle occupant and pedestrian fatalities. Am. J. Public Health 2003, 93, 1541–1545. [Google Scholar] [CrossRef] [PubMed]
- Rundle, A.; Diez Roux, A.V.; Freeman, L.M.; Miller, D.; Neckerman, K.M.; Weiss, C.C. The urban built environment and obesity in New York City: A multilevel analysis. Am. J. Health Promot. 2007, 21, 326–334. [Google Scholar] [CrossRef] [PubMed]
- Lee, I.-M.; Ewing, R.; Sesso, H.D. The built environment and physical activity levels: The Harward alumni health study. Am. J. Prev. Med. 2009, 37, 293–298. [Google Scholar] [CrossRef] [PubMed]
- Wang, Y.; Chau, C.K.; Ng, W.Y.; Leung, T.M. A review on the effects of physical built environment attributes on enhancing walking and cycling activity levels within residential neighbourhoods. Cities 2016, 50, 1–15. [Google Scholar] [CrossRef]
- Frank, L.; Devlin, A.; Johnstone, S.; van Loon, J. Neighbourhood Design, Travel, and Health in Metro Vancouver: Using a Walkability Index; Active Transportation Collaboratory UBC: Vancouver, BC, Canada, 2010; Available online: http://bit.ly/1I0N69F (accessed on 28 November 2011).
- Giles-Corti, B.; Bull, F.; Knuiman, M.; McCormack, G.; van Niel, K.; Timperio, A.; Christian, H.; Foster, S.; Divitini, M.; Middleton, N.; et al. The influence of urban design on neighbourhood walking following residential relocation: Longitudinal results from the RESIDE study. Soc. Sci. Med. 2013, 77, 20–30. [Google Scholar] [CrossRef] [PubMed]
- Sarkar, C.; Webster, C.; Gallacher, J. Association between adiposity outcomes and residential density: A full-data cross-sectional analysis of 419,562 UK Biobank adult participants. Lancet Planet. Health 2017, 7, e277–e288. [Google Scholar] [CrossRef]
- Wener, R.E.; Evans, G.W. A morning stroll: Levels of physical activity in car and mass transit commuting. Environ. Behav. 2007, 39, 62–74. [Google Scholar] [CrossRef]
- Yu, C.Y. Environmental supports for walking/biking and traffic safety: Income and ethnicity disparities. Prev. Med. 2014, 67, 12–16. [Google Scholar] [CrossRef] [PubMed]
- Litman, T.; Fitzroy, S. Safe Travels: Evaluating Mobility Management Traffic Safety Impacts; Victoria Transport Policy Institute: Victoria, BC, Canada, 2014; Available online: www.vtpi.org/safetrav.pdf (accessed on 15 April 2014).
- Beck, L.F.; Dellinger, A.M.; O’Neil, M.E. Motor vehicle crash injury rates by mode of travel, United States: Using exposure-based methods to quantify differences. Am. J. Epidemiol. 2007, 166, 212–218. [Google Scholar] [CrossRef] [PubMed]
- Arrington, G.B.; Cervero, R. Effects of TOD on Housing, Parking, and Travel; Report 128; Transit Cooperative Research Program; The National Academies Press: Washington, DC, USA, 2008; Available online: http://nap.edu/14179 (accessed on 18 January 2009).
- Litman, T. Understanding Smart Growth Savings: Evaluating Economic Savings and Benefits of Compact Development, and How They Are Misrepresented by Critics; Victoria Transport Policy Institute: Victoria, BC, Canada, 2017; Available online: http://www.vtpi.org/sg_save.pdf (accessed on 10 November 2017).
- Arrington, G.B.; Sloop, K.I. New transit cooperative research program: Research confirms transit-oriented developments produce fewer auto trips. ITE J. 2009, 79, 26–29. [Google Scholar]
- Kodukula, S. Rising Automobile Dependency: How to Break the Trend? Sustainable Urban Transport Technical Document No. 8; Federal Ministry for Economic Cooperation and Development: Bonn, Germany, 2011. [Google Scholar]
- Central Statistics Office (CSO). Census 1996: Volume VI—Travel to Work, School and College; Online Report; CSO: Dublin, Ireland, 1997; Available online: http://beyond2020.cso.ie/Census/TableViewer/tableView.aspx?ReportId=103491 (accessed on 18 May 2008).
- Central Statistics Office (CSO). Census 2002: Volume IX—Travel to Work, School and College; Online Report; CSO: Dublin, Ireland, 2003; Available online: http://beyond2020.cso.ie/Census/TableViewer/ tableView.aspx?ReportId=1625 (accessed on 18 May 2008).
- Central Statistics Office (CSO). Census 2006: Volume IX—Travel to Work, School and College; Online Report; CSO: Dublin, Ireland, 2007; Available online: http://beyond2020.cso.ie/Census/TableViewer/ tableView.aspx?ReportId=76542 (accessed on 18 May 2008).
- Murphy, E. Spatial restructuring and commuting efficiency in Dublin. J. Irish Urban Stud. 2004, 3, 25–38. [Google Scholar]


| Business-As-Usual Scenario: | Compact Development with Rail Scenario: | Recessionary Development Scenario: | |
|---|---|---|---|
| Continuous Economic Growth | Continuous Economic Growth | Prolonged Recession | |
| Population | Steady population growth:
| Steady population growth:
| Moderate population growth:
|
| Economic Trends |
|
|
|
| Spatial Development/ Planning |
|
|
|
| Transport |
|
|
|
| Overall Trends |
|
|
|
| Impacts/Indicators | Impact Evaluation Data of With-Rail Scenario vs. Business-as-Usual Scenario |
|---|---|
| 1. Capital costs of rail infrastructure investment | Direct construction cost estimates include the following: Land acquisition costs, railway infrastructure, stations, civil engineering works, operational systems, planning and design. Source: RPA [78]. |
| 2. Greenfield land values | Total amount of greenfield land within 1km catchment area of Metro North and estimated change of the value of greenfield land across with rail and business-as-usual scenarios. Source: RPA [78]. |
| 3. Provision of public services |
|
| 4. Accident rates/future accident risks and accident costs | Three types of data are specified:
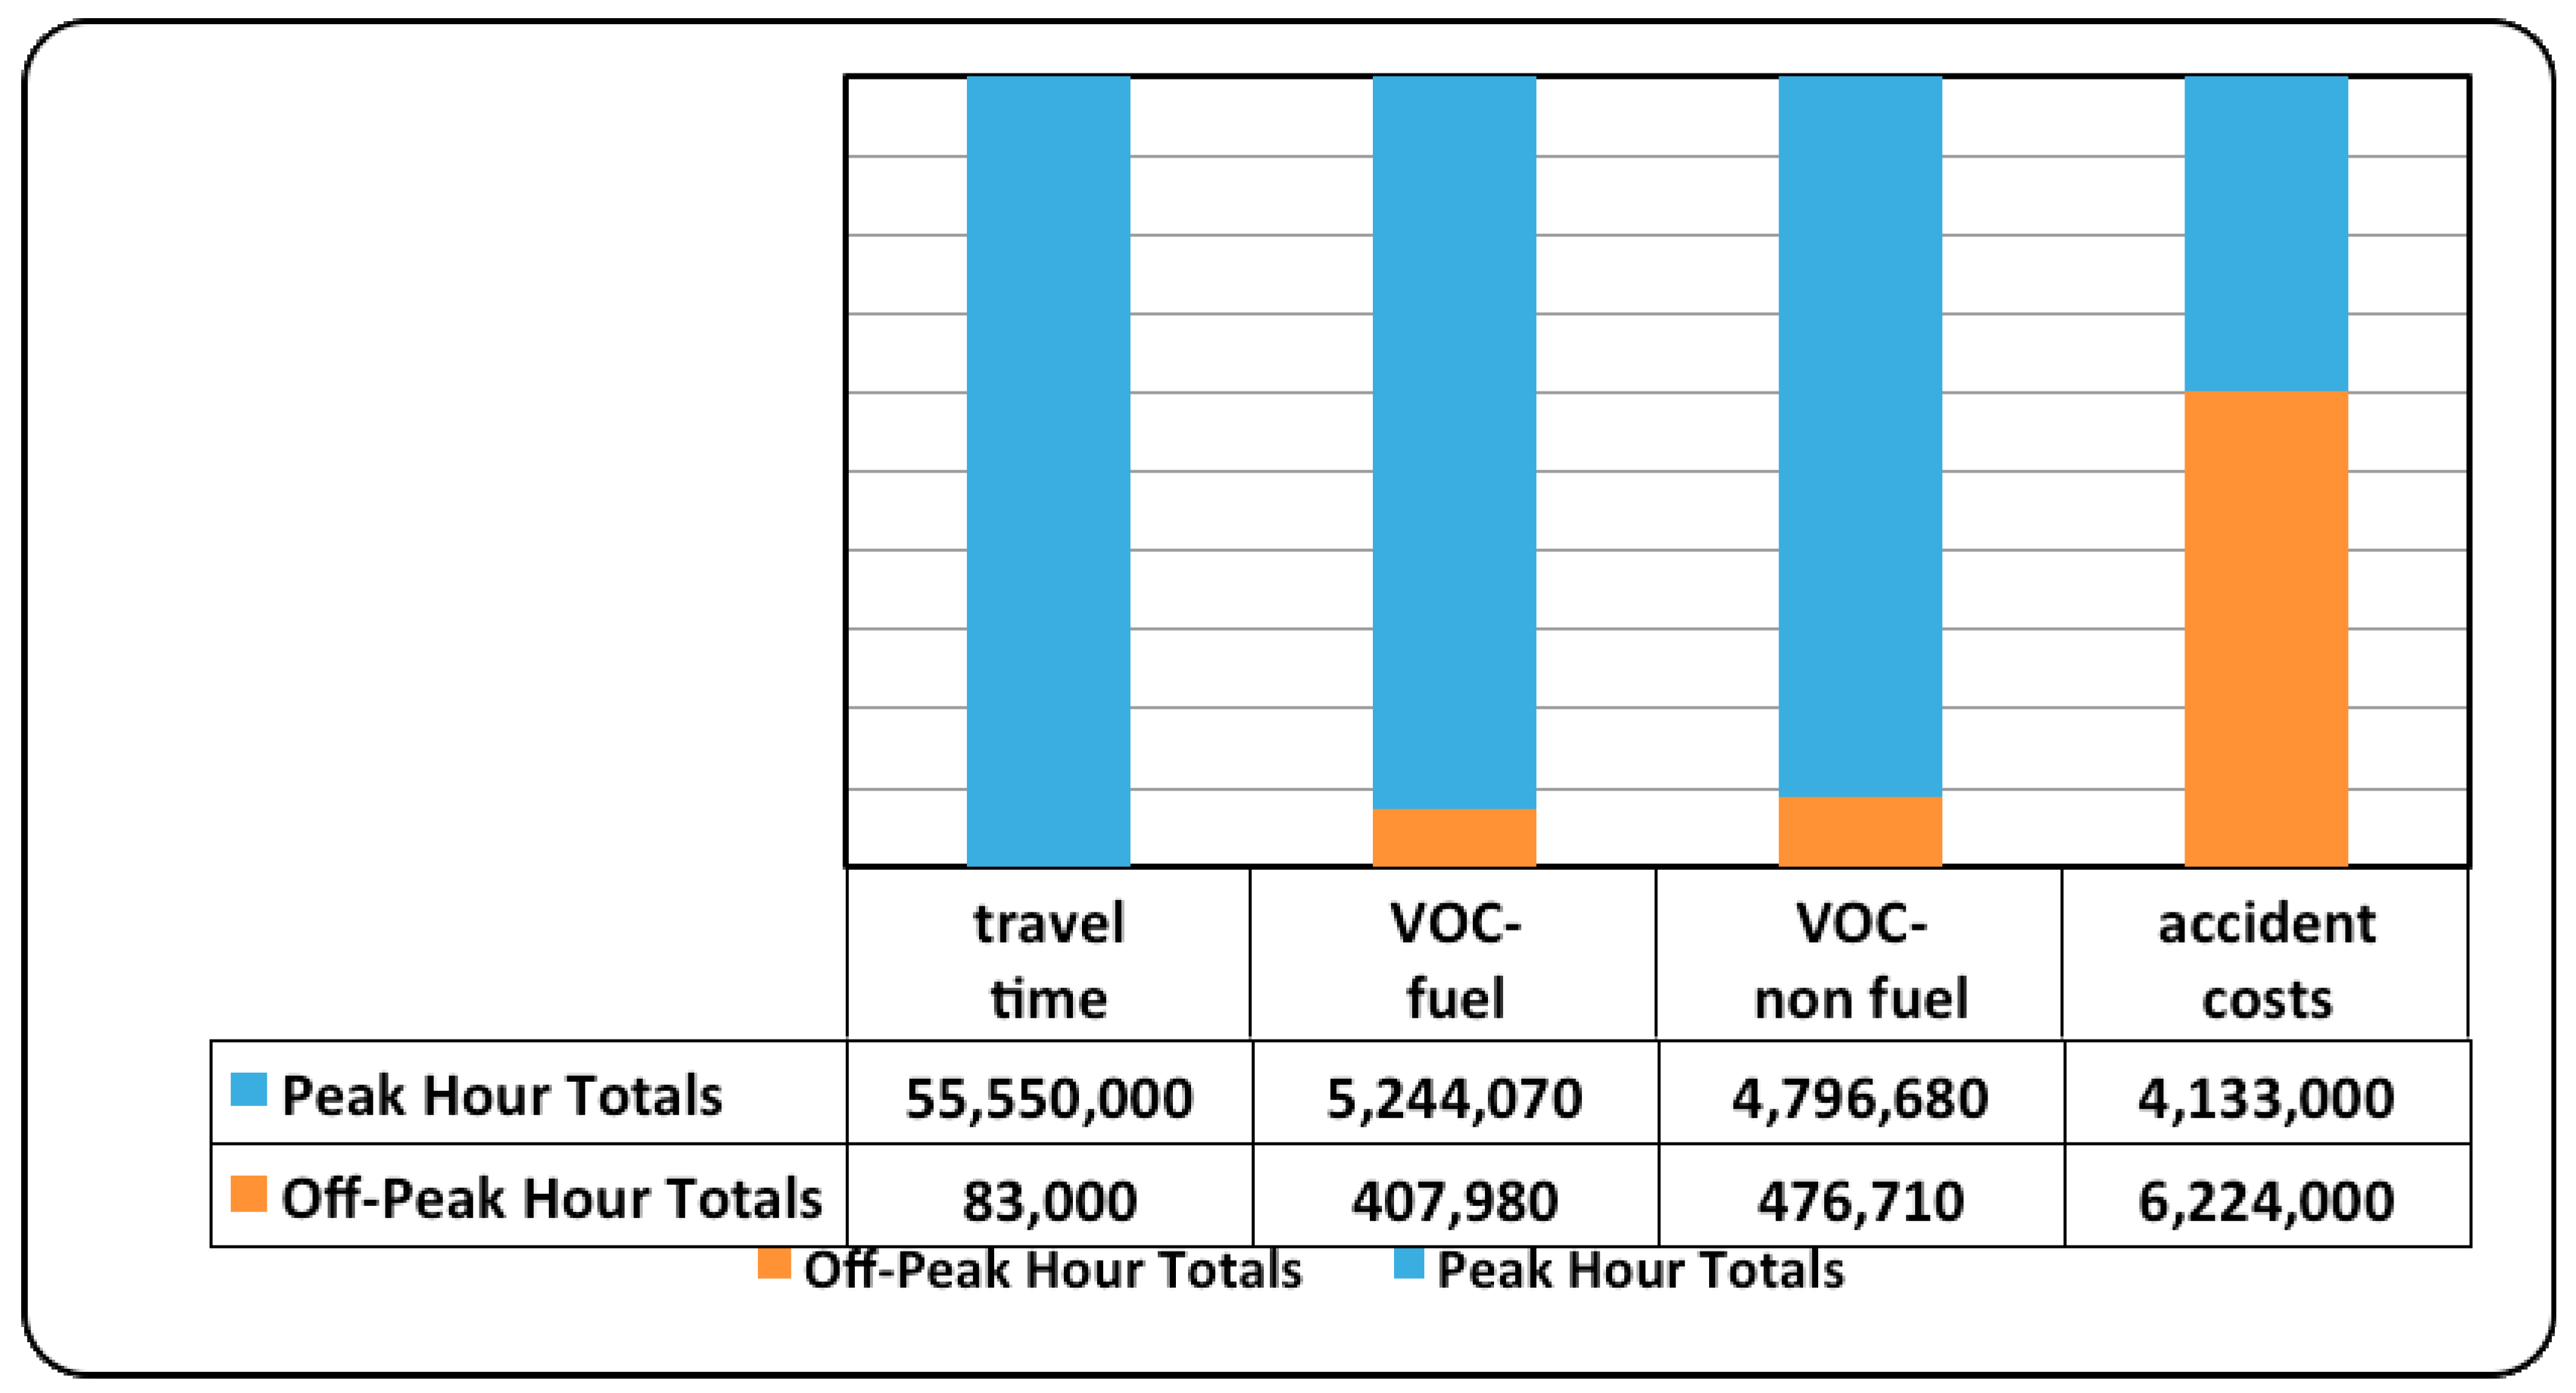
|
| 5. Change in road vehicle operation costs | For the calculation of the economic benefits (costs) associated with vehicle operating costs, three types of data were utilised:
|
| 6. Change in travel time | Estimates related to:
|
| 7. Rail operating costs and revenues |
|
| 8. Change in CO2 emissions |
|
| 9. Change in local area pollutants |
|
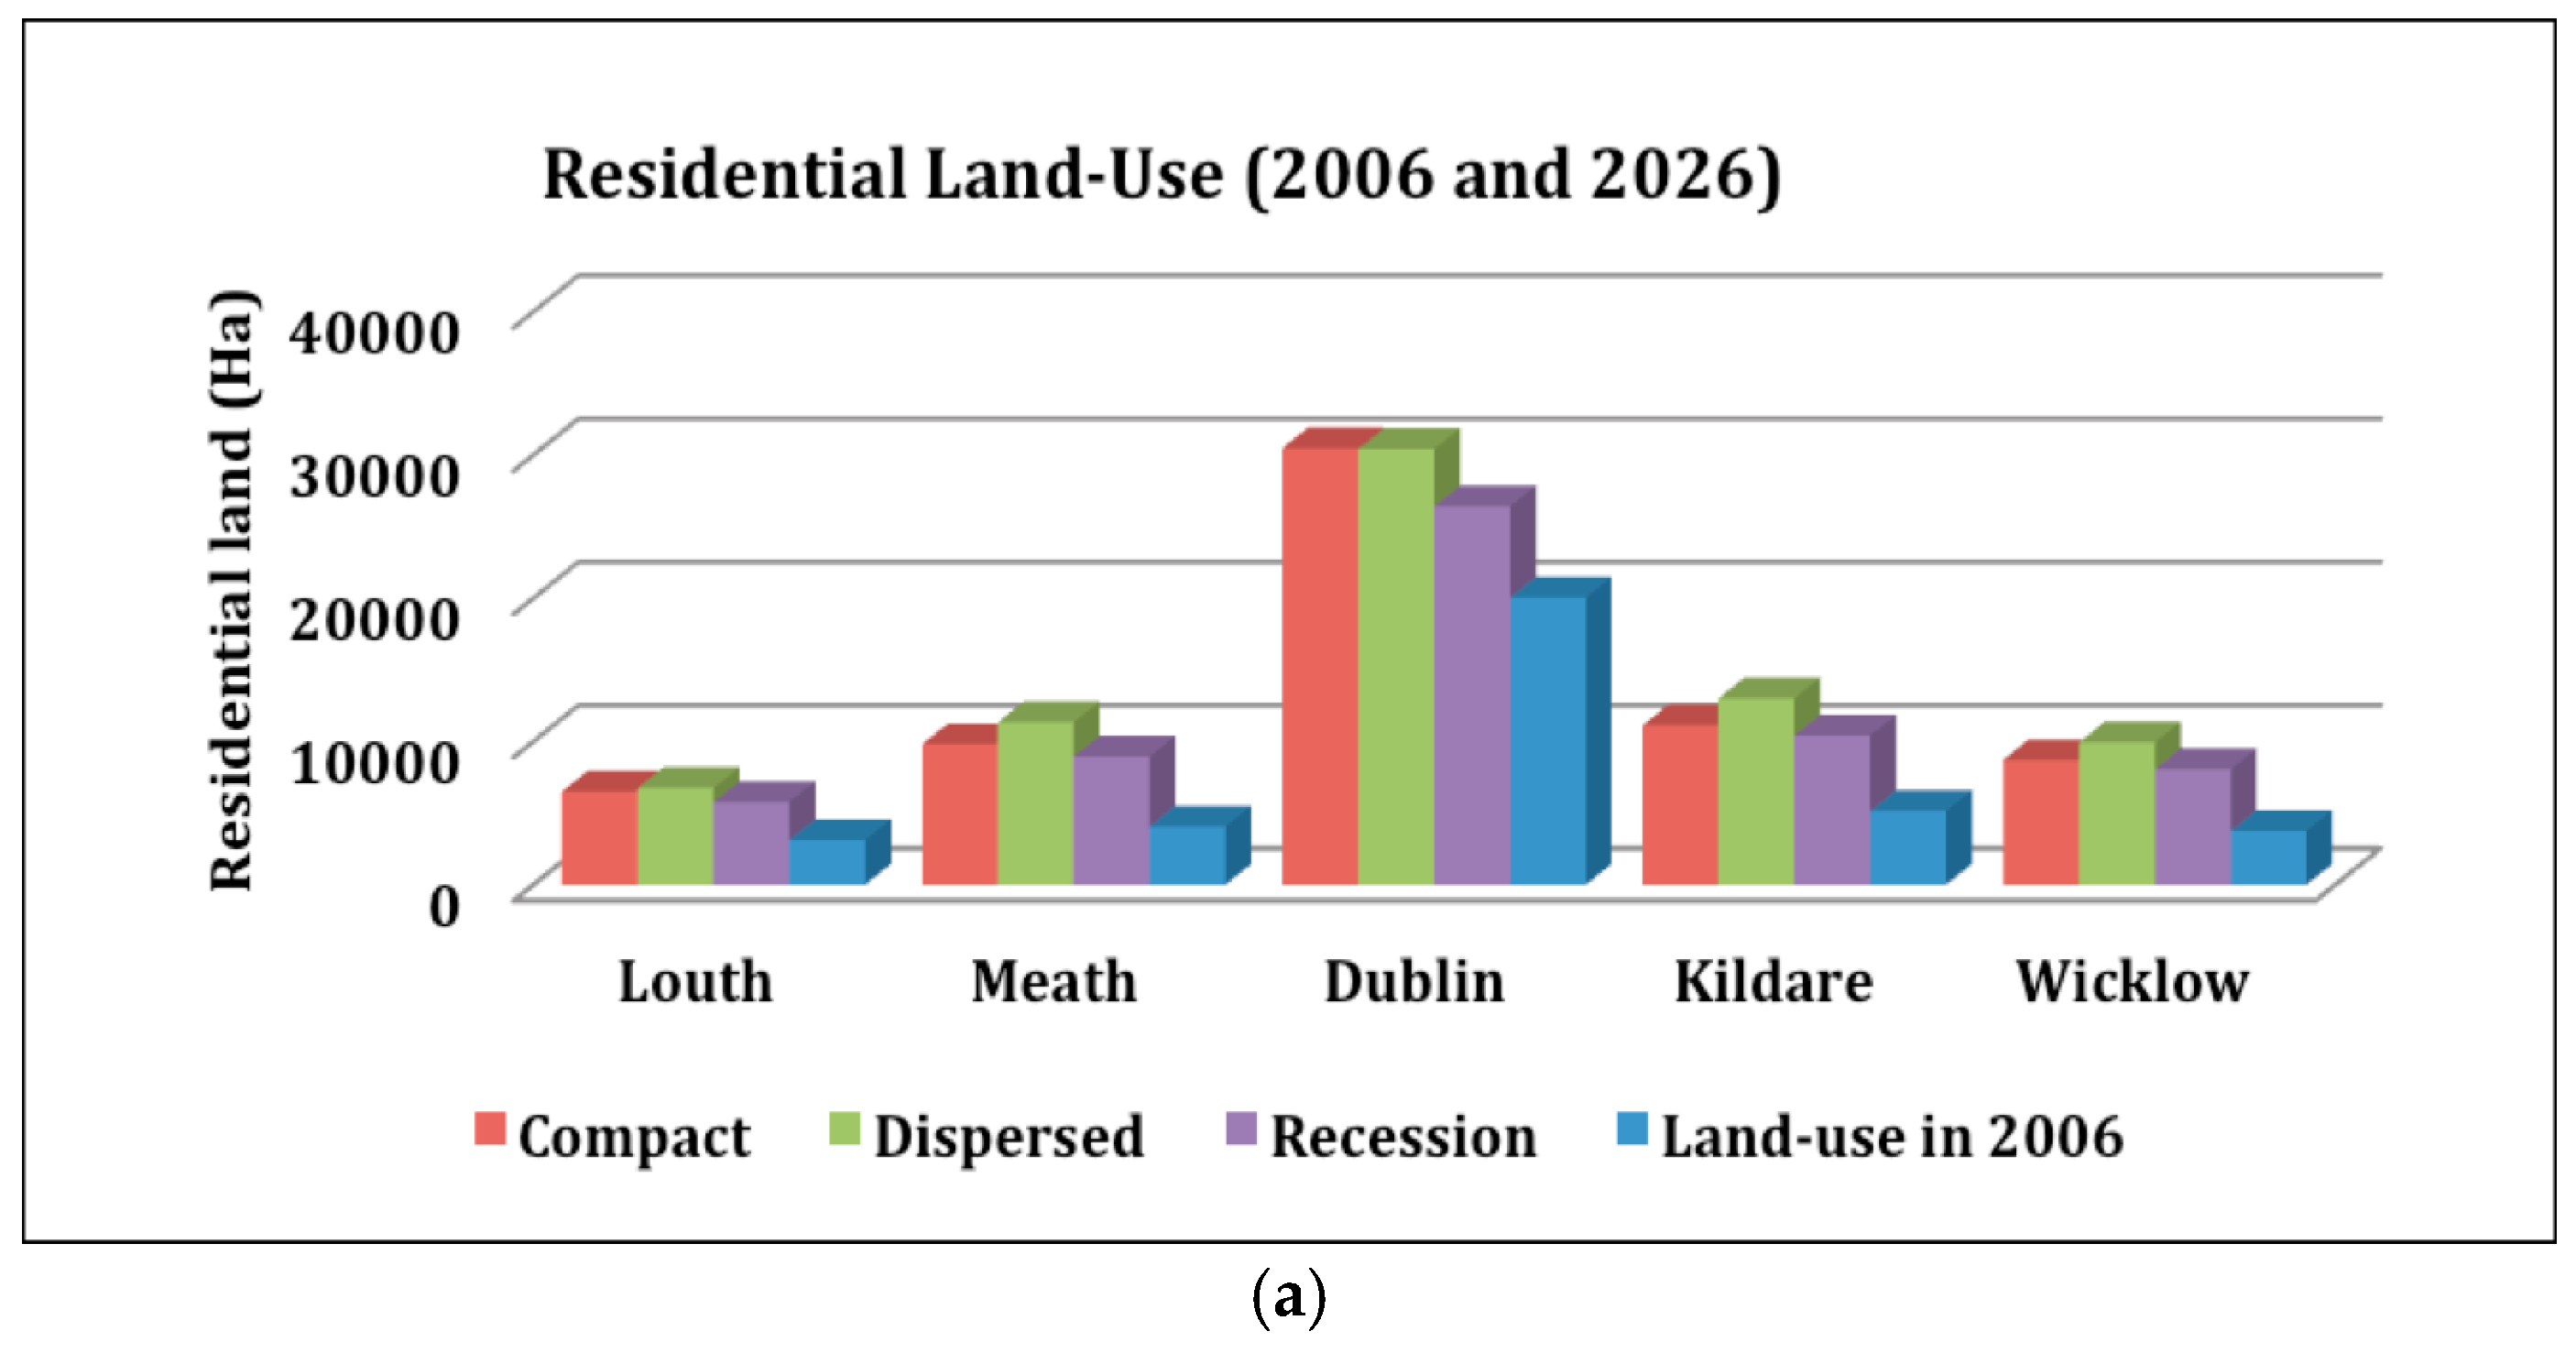
| Land Use Types | Land Area (in ha) | % Change in Land Area from Baseline to with Rail Scenario | |
|---|---|---|---|
| With Rail Scenario | Baseline Scenario | ||
| Residential continuous dense urban | 24 | 16 | +50% |
| Residential continuous medium dense | 104 | 156 | −33.3% |
| Residential discontinuous urban fabric | 484 | 444 | −9.1% |
| Residential discontinuous sparse urban | 68 | 60 | +13.3% |
| Industrial areas | 136 | 140 | −2.9% |
| Commercial areas | 244 | 240 | +1.6% |
| Public and private services | 164 | 144 | +13.8% |
| Arable land | 4 | 8 | −50% |
| Pastures | 76 | 68 | +11.8% |
| Heterogeneous agricultural areas | 28 | 56 | −50% |
| Discount Rate | ENPV | B/C Ratio | IRR | Evaluation Period |
|---|---|---|---|---|
| 45 YEARS OF APPRAISAL (5 years construction + 40 years operation) | ||||
| 3.0% | 553 million € | 1.28 | 0.04166(4%) | 2011–2055 |
| 3.5% | 289 million € | 1.15 | ||
| 4.0% | 64 million € | 1.03 | ||
| 4.5% | −126 million € | 0.93 | ||
| 5.0% | −289 million € | 0.85 | ||
| 40 YEARS OF APPRAISAL (5 years construction + 35 years operation) | ||||
| 3.0% | 242 million € | 1.12 | 0.03596 (4%) | 2011–2050 |
| 3.5% | 36 million € | 1.02 | ||
| 4.0% | −141 million € | 0.93 | ||
| 4.5% | −293 million € | 0.85 | ||
| 5.0% | −425 million € | 0.78 | ||
| 35 YEARS OF APPRAISAL (5 years construction + 30 years operation) | ||||
| 3.0% | −68 million € | 0.97 | 0.027960 (3%) | 2011–2045 |
| 3.5% | −222 million € | 0.89 | ||
| 4.0% | −356 million € | 0.82 | ||
| 4.5% | −473 million € | 0.75 | ||
| 5.0% | −575 million € | 0.70 | ||
| 30 YEARS OF APPRAISAL (5 years construction + 25 years operation) | ||||
| 3.0% | −380 million € | 0.81 | 0.01607 (2%) | 2011–2040 |
| 3.5% | −487 million € | 0.75 | ||
| 4.0% | −582 million € | 0.70 | ||
| 4.5% | −666 million € | 0.65 | ||
| 5.0% | −740 million € | 0.61 | ||
| Total Amount of Greenfield Land | Expected Change in Annual Value per hectare of Greenfield Land in Business-As-Usual vs. with Rail Scenarios * | Expected Change in Total Greenfield Land Values, in € |
|---|---|---|
| 254.1 ha | Price rises from 60,000 €/ha to 1,500,000 €/ha implying a net change of 1,440,000 €/ha. | 365,904,000 (=254.1 × 1,440,000) |
| Description | Findings from Current Study | Findings of NTA (2015) |
|---|---|---|
| Full Scheme 2045 (€ Thousand, 2010 Prices) | Full Scheme 2033 (€ Thousand, 2009 Prices) | |
| Total costs | 2,140,762 | 1,026,853 |
| Total benefits | 1,999,746 | 1,562,716 |
| Economic Net Present Value (ENPV) | −141,000 | 535,863 |
| Benefit-to-cost ratio (B/C) | 0.93 | 1.5 |
| Discount rate | 4% | NA |
| Health Benefits * | Rail Transit Impacts * | Impact Evaluation Criteria | Expected Impacts of Metro North |
|---|---|---|---|
| Traffic safety. Reduced traffic crash injuries, disabilities and death on the road network | Reductions in traffic injuries and deaths resulting from shifts from road transportation to rail transit system | Accident cost savings from death and injury traffic crashes | Reduction in traffic accidents and related costs along the Metro North catchment area as Metro North will provide a reduction in car-based trips |
| Pollution reduction. Reductions in air, water and noise pollution | Reductions in traffic induced emissions and noise following a shift from car-based transport to rail | Savings in Greenhouse Gas (GHG) emissions, savings from local air/water pollutants and savings from noise pollution | The introduction of Metro North to the network will introduce a new pollution source to the Metro catchment area. However, there will be an overall reduction in the pollution levels due to reduced traffic on the road networks |
| Improvement in physical fitness. Increased physical activity by walking and cycling | Rail transit oriented development improves alternative modes of transport (walking, cycling), which tend to increase physical fitness | Savings from medical expenditures resulting from increased physical activity, value of reductions in hearth diseases, hypertensive diseases, diabetes and others | Recent policies and plans introduced in anticipation of Metro North support mixed land-uses of medium to high-density developments within the Metro North catchment area. Metro North enhances transportation diversity in the GDR and supports walking, cycling and other transport modes. There will be overall reduction in health costs as a result of improvement in physical activity by walking and cycling |
| Mental health. Reduced emotional stress | High quality rail transit systems and transit oriented development provide comfort and reduces emotional stress and provide access to social, economic and recreational opportunities | Cost savings from medical expenditures related to emotional stress and depression | It is estimated by the RPA (2010) that a considerable proportion (around 12 million) of car trips per annum will be reduced from the highway network following a shift to the Metro system. Metro North provides a high-quality transportation option. It is expected that this will reduce emotional stress and associated health costs |
| Affordability. Reduced financial burdens, particularly for lower income residents | Rail transit and transit oriented development reduces cost of transportation, which leaves money to purchase housing, healthy food and medical care | Cost savings from transport-related expenditures | Metro North provides a cheaper transportation option compared to automobile-oriented transportation, particularly along the catchment of Metro North Line. This will reduce the costs of transportation and supports incomes of residents |
| Basic mobility. Improved accessibility to essential goods and services | Rail transit and transit oriented development improves mobility and locational accessibility | Changes in accessibility of land-uses following the provision of rail transport system | Metro North will provide the required transport options to the existing residents to reach to key employment, social, recreational and other services in the GDR. Hence it improves accessibility of various goods and services |
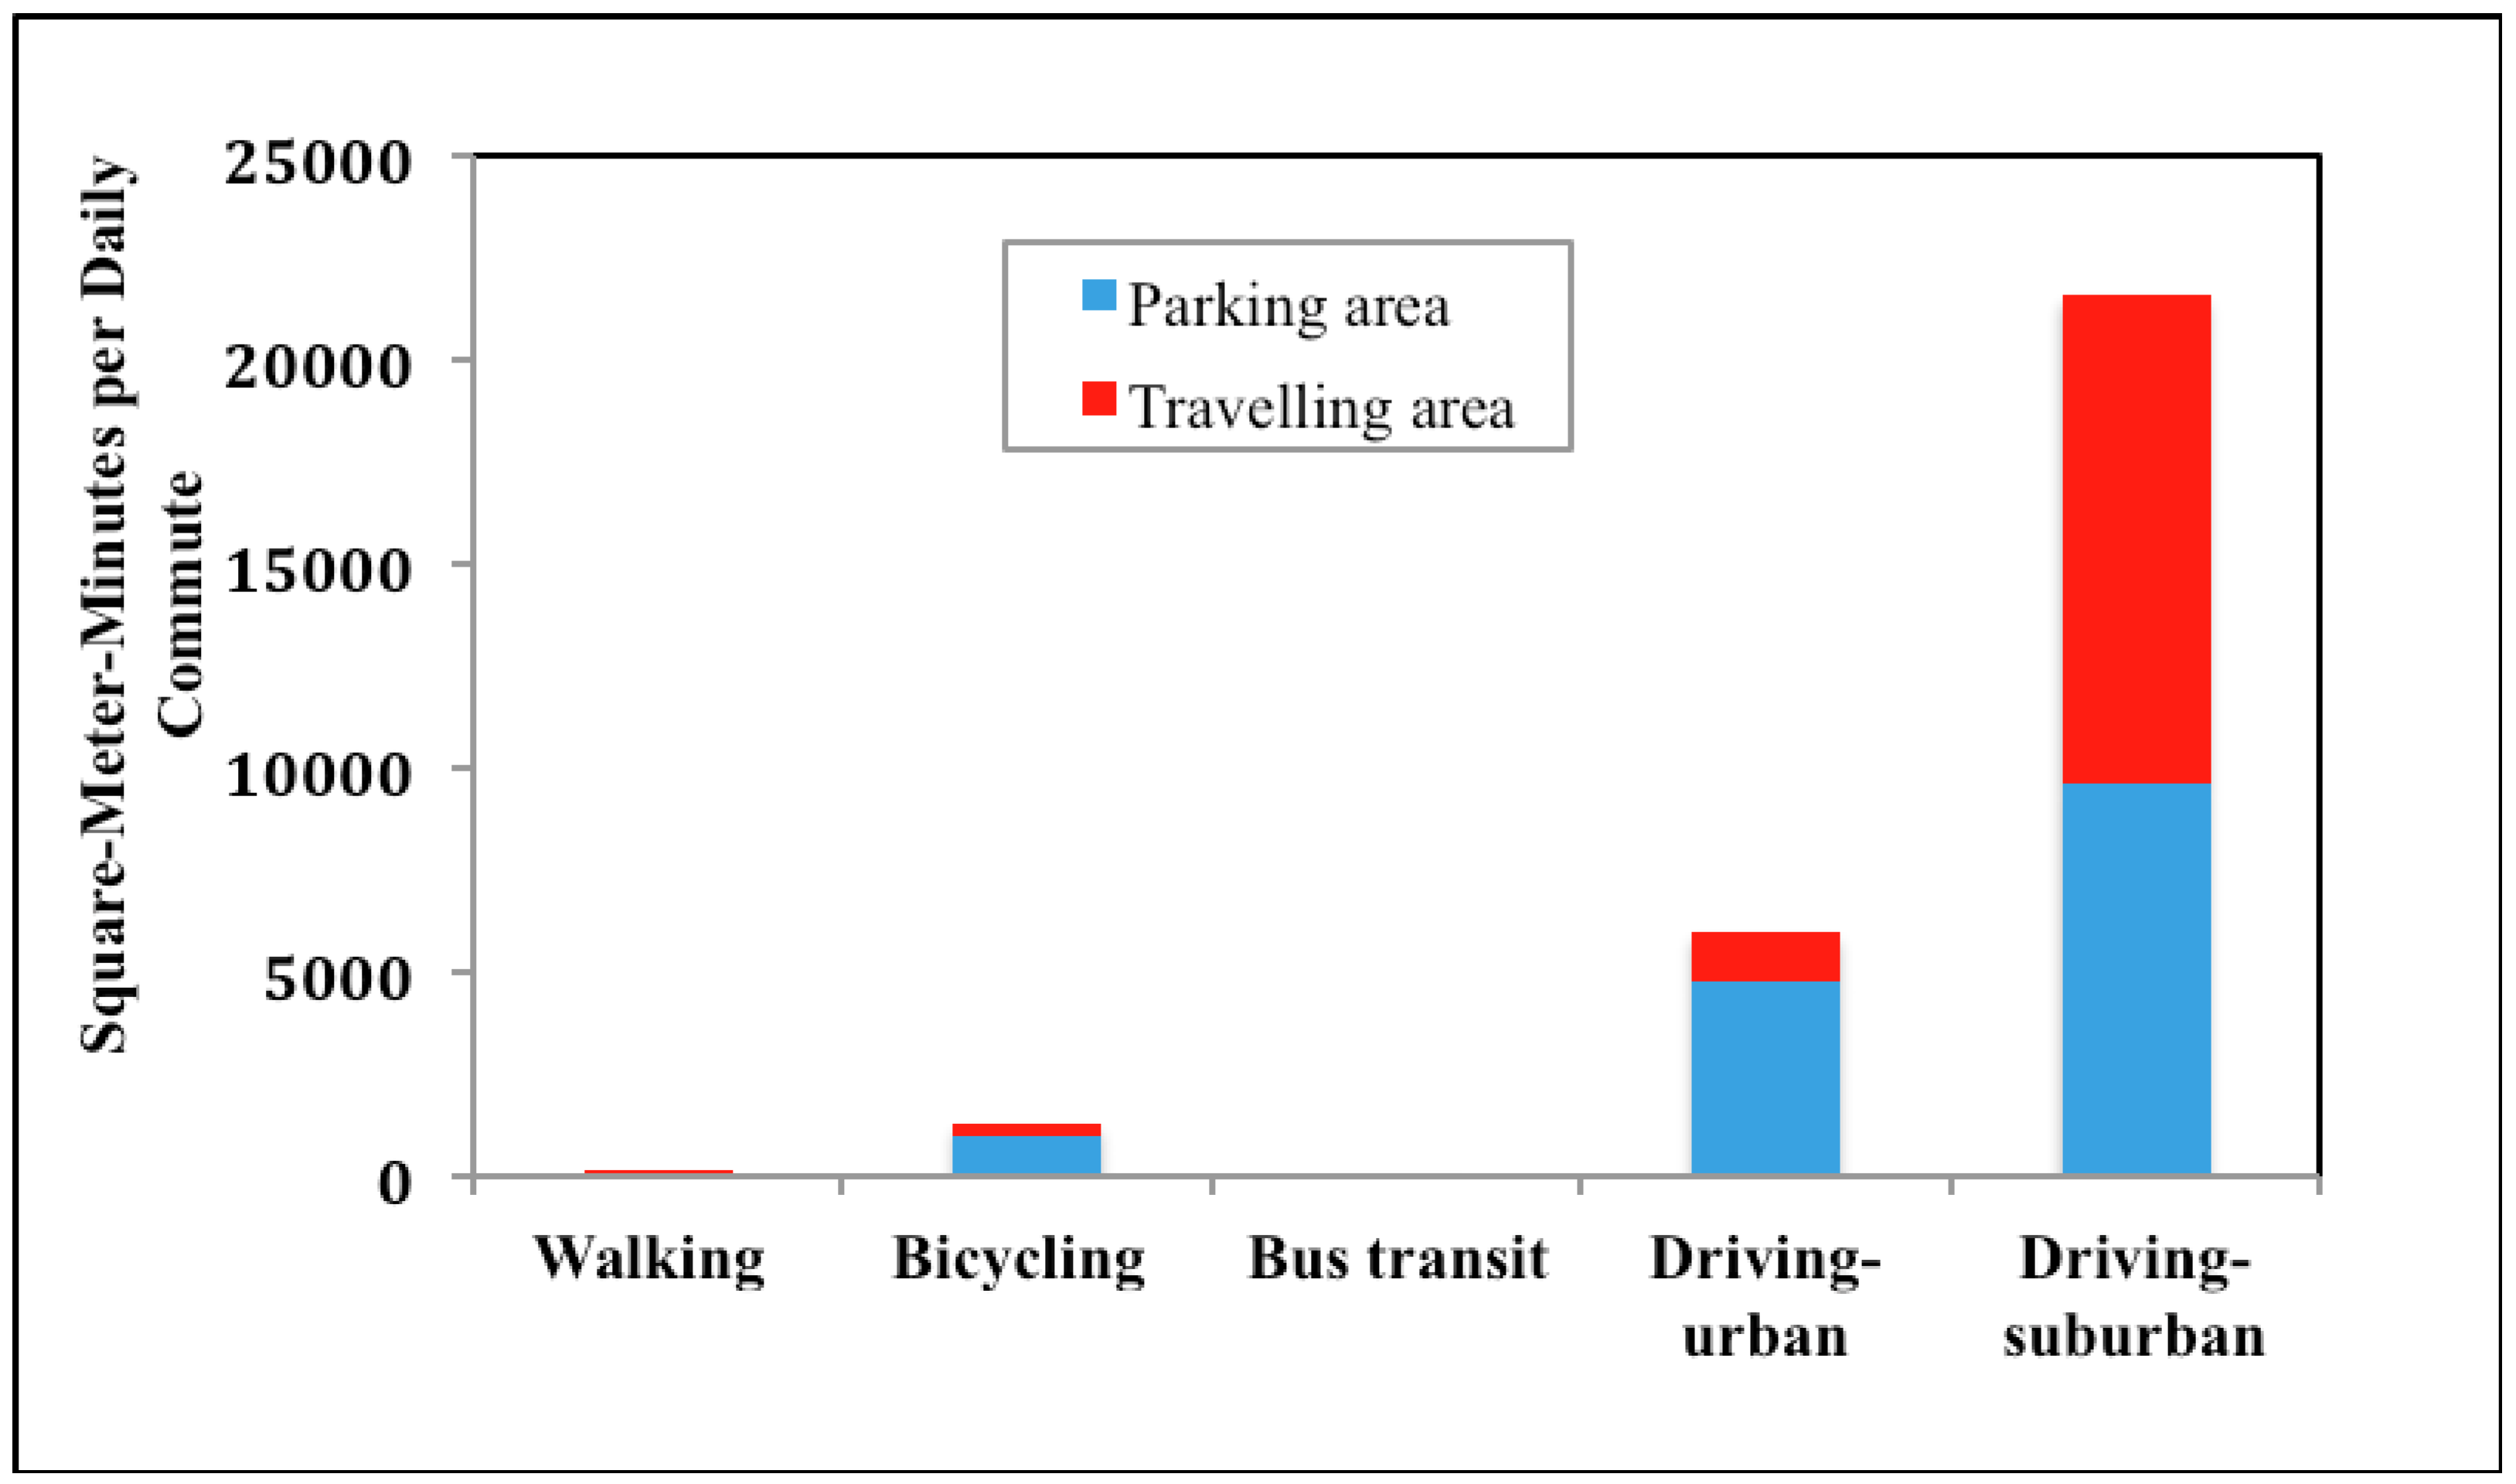
| Compact Development | Mixed Development | Sprawled Development | |
|---|---|---|---|
| Vehicles per capita | 0.5 | 0.65 | 0.8 |
| Road space per vehicle (sq-ft) | 235 | 453 | 670 |
| Off-street parking spaces per vehicle | 2 | 4 | 6 |
| Land area per parking space (sq-ft) | 275 | 300 | 325 |
| Housing footprint per capita (sq-ft) | 250 | 375 | 500 |
| Road and parking land area per capita (sq-ft) | 878 | 1344 | 1811 |
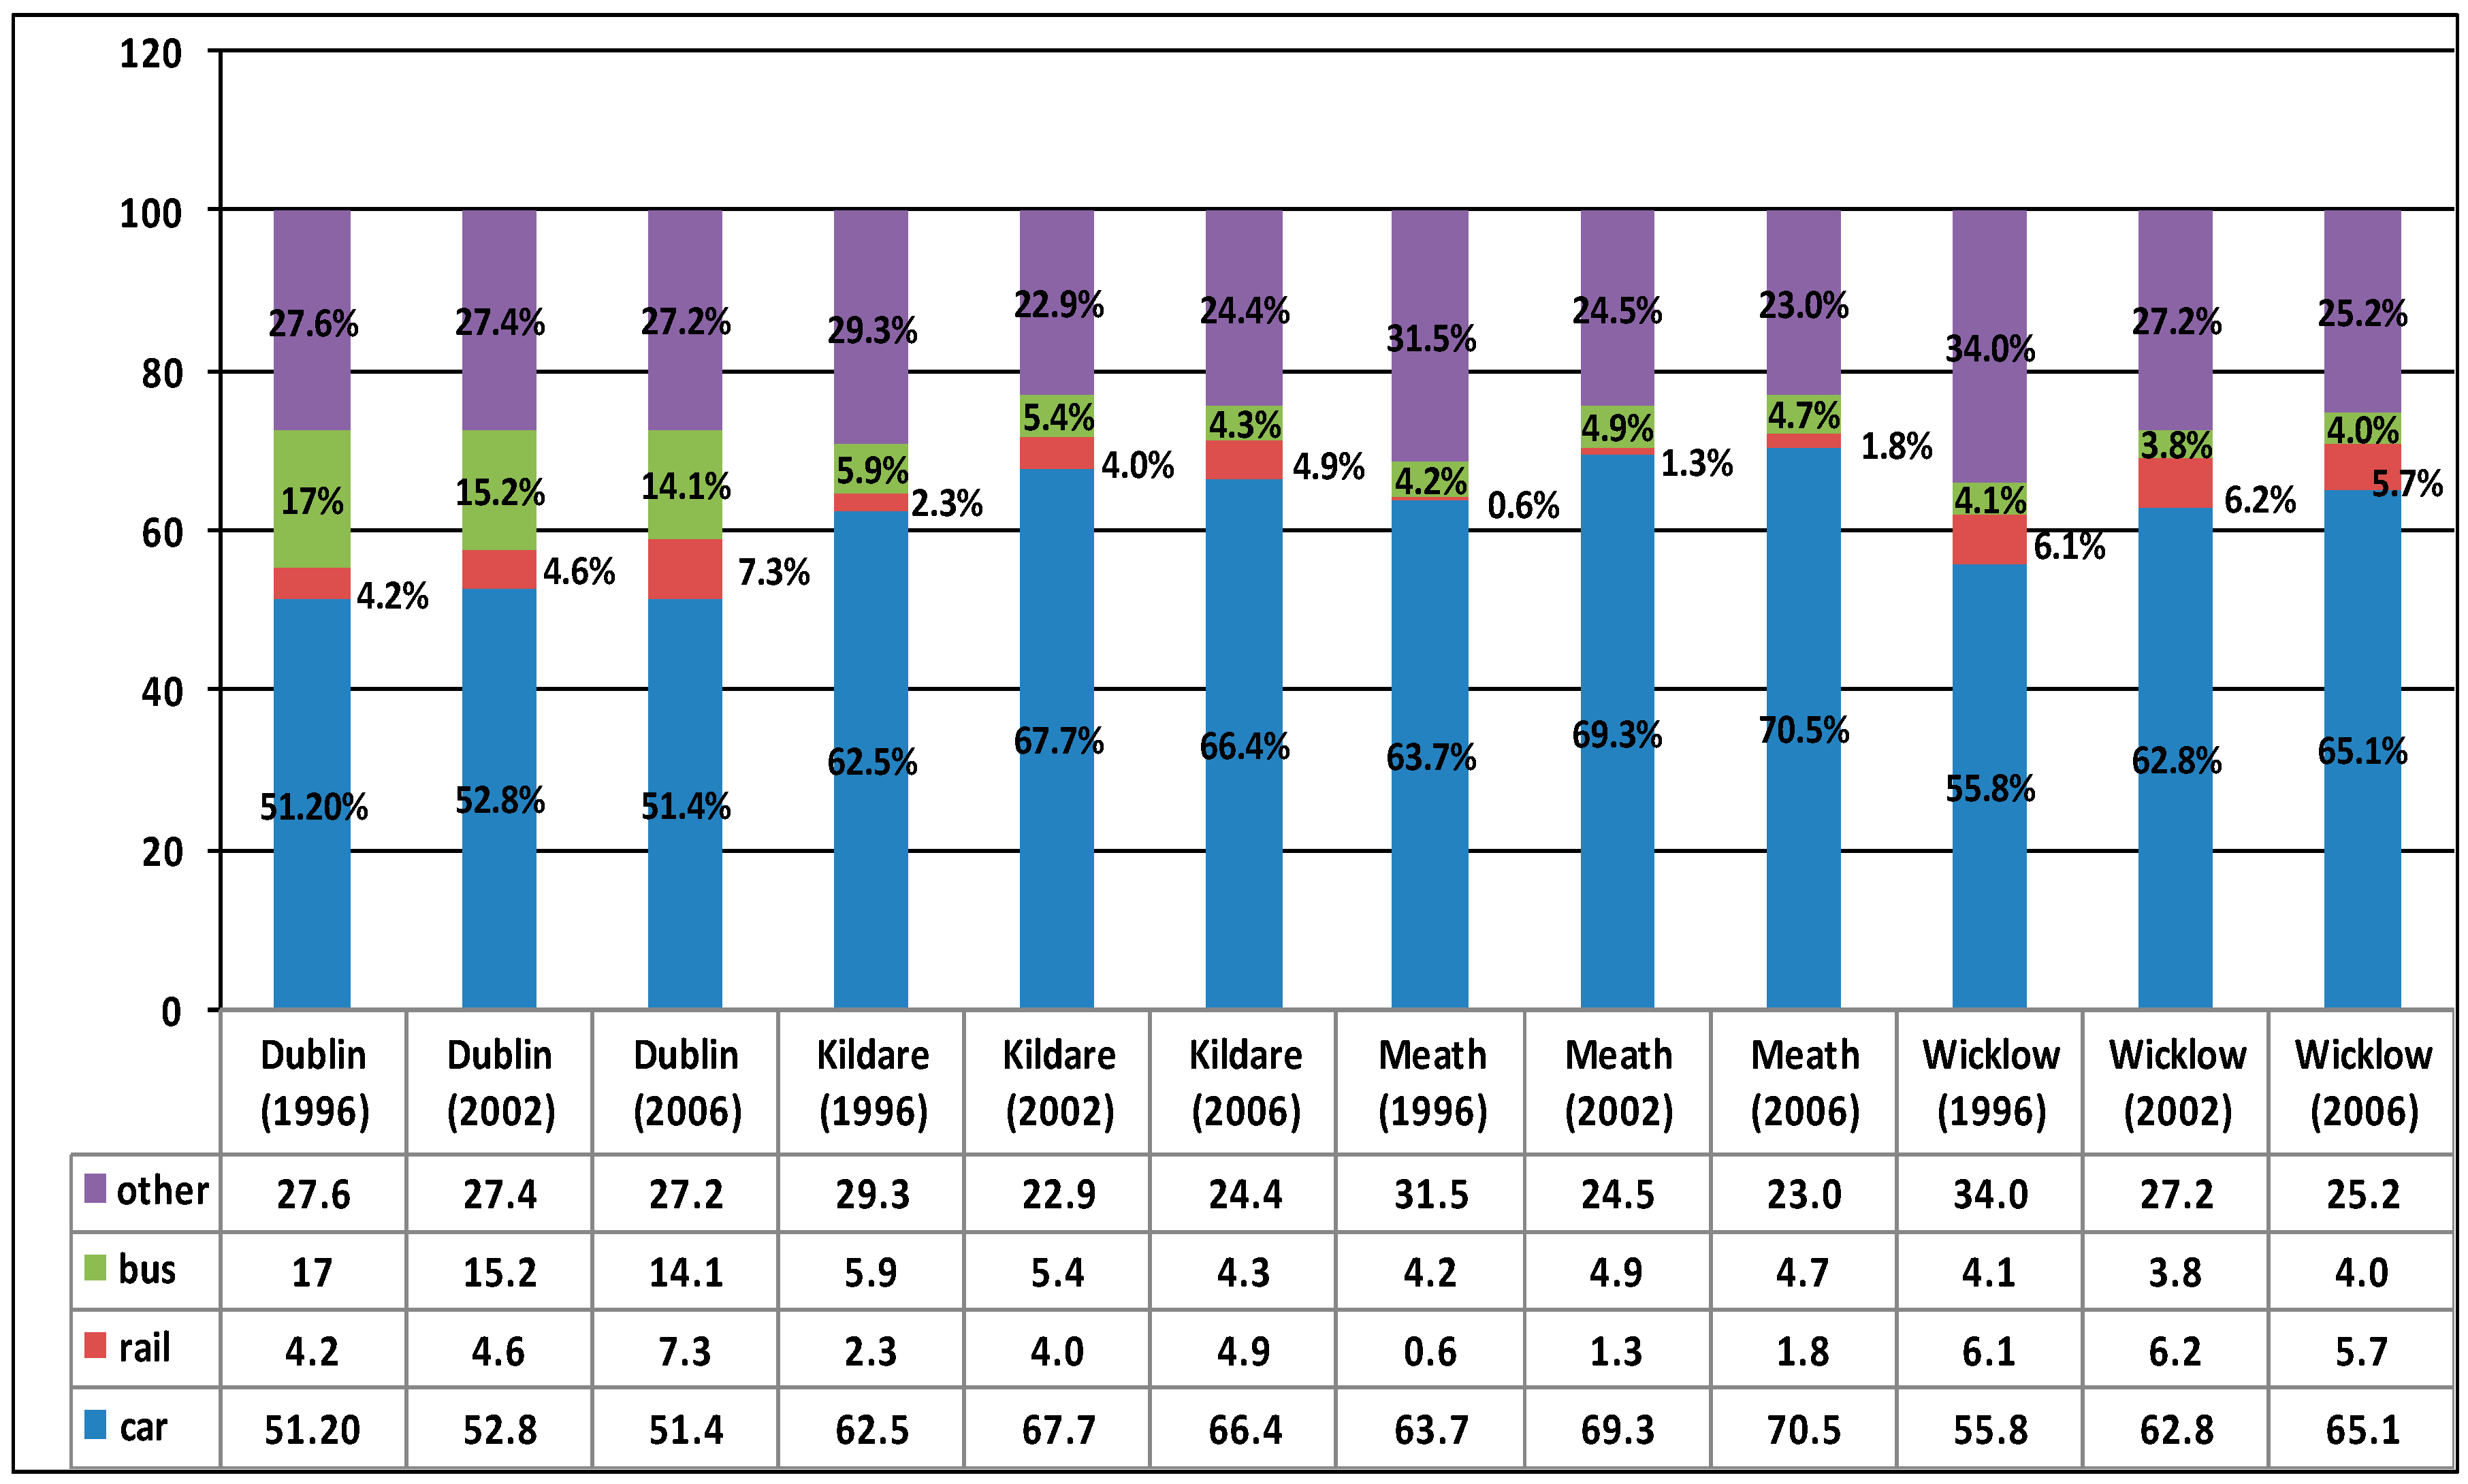
| Year: 2002 | |||||
| County of Residence | Means of Travel | ||||
| Bus | Train or DART | Car | Walking/Cycling | Others | |
| Dublin | 75,916 | 22,822 | 264,192 | 85,408 | 28,055 |
| Kildare | 3942 | 2962 | 49,861 | 7043 | 6226 |
| Meath | 2869 | 743 | 40,369 | 4521 | 5751 |
| Wicklow | 1807 | 2934 | 29,549 | 5229 | 4289 |
| GDR Total | 84,534 | 29,461 | 422,342 | 102,201 | 44,321 |
| Year: 2006 | |||||
| County of Residence | Means of Travel | ||||
| Bus | Train, DART, LUAS | Car | Walking/Cycling | Others | |
| Dublin | 79,219 | 40,810 | 288,115 | 93,985 | 27,624 |
| Kildare | 3889 | 4443 | 60,149 | 9114 | 7577 |
| Meath | 3636 | 1416 | 54,748 | 5706 | 7818 |
| Wicklow | 2258 | 3197 | 36,673 | 5476 | 4908 |
| GDR Total | 89,002 | 49,866 | 439,685 | 114,281 | 47,927 |
| % Change between 2002 and 2006 | +5.3% | +69.3% | +6.6% | +11.8% | +8.1% |
| Factors/Impacts subject to Sensitivity Testing | Parameters in Economic Growth (EG)-Links to Business-As-Usual and with Rail (Economic Growth Case) Scenarios | Parameters in Recessionary Development (RD)-Links to Business-As-Usual and with Rail (Prolonged Recession Case) Scenarios |
|---|---|---|
| Capital Expenditure Uplifts | EG-Case A: No capital estimation bias EG-Case B: −40% bias in capital estimation | RD-Case A: No capital estimation bias RD-Case B: −40% bias in capital estimation |
| Value of Time | World Recovery Scenario | Prolonged Recession Scenario |
| EInter-temporal = 1.0 | EInter-temporal = 0.7 | |
| EVTTS,Income = 1.0 | EVTTS,Income = 0.7 | |
| Accident Costs | World Recovery Scenario | Prolonged Recession Scenario |
| Road Vehicle Operation Costs | Moderate Price Scenario | High Price Scenario |
| Metro Operation Costs & Revenues | World Recovery Scenario | Prolonged Recession Scenario |
| School Transportation Costs | World Recovery Scenario | Prolonged Recession Scenario |
| High Growth Scenario | Low Growth Scenario | |
| Electricity Connection & Distribution Costs | World Recovery Scenario | Prolonged Recession Scenario |
| High Growth Scenario | Low Growth Scenario | |
| Climate Change | Higher CO2 Values compared to Central Values | Lower CO2 Values compared to Central Values |
| Local Air Pollution | World Recovery Scenario | Prolonged Recession Scenario |
| High Growth Scenario | Low Growth Scenario | |
| E LAP,Income = 1.0 | E LAP,Income = 0.7 | |
| Commencement Period of Metro Construction | 2013 | 2013 |
| Appraisal Period | 2011–2047 | 2011–2047 |
© 2017 by the authors. Licensee MDPI, Basel, Switzerland. This article is an open access article distributed under the terms and conditions of the Creative Commons Attribution (CC BY) license (http://creativecommons.org/licenses/by/4.0/).
Share and Cite
Ustaoglu, E.; Williams, B.; Petrov, L.O.; Shahumyan, H.; Van Delden, H. Developing and Assessing Alternative Land-Use Scenarios from the MOLAND Model: A Scenario-Based Impact Analysis Approach for the Evaluation of Rapid Rail Provisions and Urban Development in the Greater Dublin Region. Sustainability 2018, 10, 61. https://doi.org/10.3390/su10010061
Ustaoglu E, Williams B, Petrov LO, Shahumyan H, Van Delden H. Developing and Assessing Alternative Land-Use Scenarios from the MOLAND Model: A Scenario-Based Impact Analysis Approach for the Evaluation of Rapid Rail Provisions and Urban Development in the Greater Dublin Region. Sustainability. 2018; 10(1):61. https://doi.org/10.3390/su10010061
Chicago/Turabian StyleUstaoglu, Eda, Brendan Williams, Laura O. Petrov, Harutyun Shahumyan, and Hedwig Van Delden. 2018. "Developing and Assessing Alternative Land-Use Scenarios from the MOLAND Model: A Scenario-Based Impact Analysis Approach for the Evaluation of Rapid Rail Provisions and Urban Development in the Greater Dublin Region" Sustainability 10, no. 1: 61. https://doi.org/10.3390/su10010061