Cycling as a Smart and Green Mode of Transport in Small Touristic Cities
by
 , , and
Paraskevi Karanikola
1 ,
,
Thomas Panagopoulos
2,* ,
,
Stilianos Tampakis
1 and
and
Georgios Tsantopoulos
1 1
Department of Forestry and Management of the Environment and Natural Resources, Democritus University of Thrace, 193 Pantazidou Street, 68200 Orestiada, Greece
2
Research Center for Spatial and Organizational Dynamics (CIEO), Faculty of Science and Technology, University of Algarve, Gambelas Campus, 8000 Faro, Portugal
*
Author to whom correspondence should be addressed.
Sustainability 2018, 10(1), 268; https://doi.org/10.3390/su10010268
Submission received: 5 November 2017
/
Revised: 21 December 2017
/
Accepted: 16 January 2018
/
Published: 20 January 2018
(This article belongs to the Special Issue Travel Behaviour and Sustainable Transport of the Future)
Abstract
:Cycling as a mode of transport is a low-cost, health-improving way to travel and offers environmental benefits for the cities that promote it. It is only recently, though, with concerns over climate change, pollution, congestion, and obesity among others, that have cities throughout the world have begun to implement policies to promote cycling. In Greece, however, the use of the bicycle is limited. In Preveza, a small touristic city in Northwestern Greece where the use of the bicycle is prominent when compared to other Greek cities, there are efforts to promote cycling. Through the aid of a structured questionnaire, the residents evaluated the suitability of the city for cycling, the existing infrastructure, appropriate education, and behavior of cyclists and drivers. More than half of the residents use bicycles as their transportation and stated that bicycles are an inexpensive way of transport in the city and had the opinion that the state should encourage bicycle use by supporting subvention in bicycle acquisition. Two-thirds of the residents evaluated the cycling facilities of their city as adequate, but unsafe for young cyclists who do not follow the rules of transport. Adult cyclists, in contrast, were more loyal to the code, but stated that drivers did not respect their presence on the roads. This research provides important information on the perceived shortcomings of cycling as a transport mode in Preveza that may be of interest to towns/cities with similar characteristics.
1. Introduction
The transportation sector accounts for one-third of CO2 emissions [1]. In recent research, motor vehicles have proven to be the main contributor of atmospheric pollution in the world [2,3]. According to Unger [4] short trips with cars contribute disproportionately to transportation emissions. In Europe, about 30% of trips with cars cover distances less than three kilometers [5]. Major cities throughout the world have sought to reduce transportation emissions through the implementation of policies aimed to increase non-motorized transport use [6,7].
A good opportunity for curbing the use of cars is the shift from automobile trips to using other transportation forms called ‘active transportation’ [8]. The most common forms of active transportation are walking and cycling. Many cities of the world have given substantial emphasis to the promotion of active travel with a series of reports from government and other bodies making the case for people to walk or cycle for short journeys [9,10]. Bicycle sharing schemes have become increasingly popular in countries throughout Europe, Asia, and America to encourage cycling as an alternative means of transportation in urban areas [11].
In Greece, cycling was a common means of transport until the 1970s. More recently, though, the lack of safety standards has forced many people to use cars for their daily transportation needs. During recent years, we have witnessed an effort to reintroduce cycling in the life of people living in cities [12]. The first cycle networks in Greek cities have already been implemented, after a long period of delays, in comparison to other European countries [13]. Previous studies in Greece explored the intention of residents to cycle in three big cities [14,15,16], and only one recorded the attitudes of the residents on cycling in a small size city, but without a cycling net [17]. Research has also shown that the bicycle is quite popular mostly in medium or small size cities around the world [18,19].
This study recorded the views of residents in a touristic, small-sized Greek city, on transportation modes and the distance they covered for their daily needs. Additionally, this paper aimed to study the factors influencing the use of bicycles by residents and evaluate the existing infrastructure. It is organized in four sections: the literature review; information about the study area and methodology; description of the survey results; and finally, in the last section, it discusses the main conclusions and provides recommendations for decision-makers about how to promote cycling in cities with similar characteristics.
Literature Review
The concepts of smart mobility and the smart city have recently emerged to try limit the problems incurred by the growth of the urban population and to find innovative solutions to meet this challenge [20]. The bicycle as a mode of transportation has received increasing attention among academics, public and private companies, and urban planners, to improve the urban transport system [10]. However, the mobility cannot be considered smart if it is not also sustainable [21].
Moving smartly depends on an efficient public transport and a network of safe and continuous cycle lanes, and interchange parking that avoids the city congestion [22]. Recently the European Community has developed a strong interest in the topic. The green paper of the European Commission states that more money should be given to adequate bicycle infrastructure [23] The benefits of investments in cycle networks are estimated to be at least four to five times the costs. Therefore, such investments are more beneficial to society than other transport investments [24]. For short distances, the bicycle is an efficient mode of transport. Motivation for this type of investment also constitutes the additional benefits related to increased health and the reduction of environmental pollution and road congestion [24]. According to Börjesson and Eliasson [10], in Sweden, time savings constitute the major part of the benefits of transport investments although some cyclists seem to take health and environmental benefits largely into account when making their travel choices. In the Greek city of Orestiada [17], residents evaluated the most important benefits from cycling, which included the reduction of air and noise pollution, the convenience of transportation and parking, as well as the reduction of congestion. It was noted that most of the cycling benefits were external and closely related with social welfare. However, in spite of these clear and well-known benefits over other modes of transport, the mode of cycling remains rare in many settings [25].
Reitveld and Daniel [26] revealed the shares of transport modes in various European countries, where the Netherlands was the one of the few countries where cycling had the highest share (6.66% in traveler kilometers) when compared to other modes of transport. In contrast, bicycle use in Greece had very low share (0.63%), while the car and motorcycle use share reached 76.43%. Goodman et al. [27] stated that in London, 23% of trips could reasonably be made by bicycle from the current 2% of trips that were cycled. Generally, bicycle use varies between municipalities within the same country and such differences are related to factors such as activity patterns, age, gender, weather, income, vehicle ownership, adequacy of infrastructure, physical needs, pollution levels, and flatness of surface [26]. In the USA, cycling has leisure characteristics, depends on specific lifestyles, and it is not primarily necessary to carry out particular activities like shopping, go to school, to work, etc. [28].
According to Dekoster and Scollaert [29], 73% of Europeans think bicycles should benefit from preferential treatment when compared with cars. Interest in bicycle use is on the rise and many European towns and cities are pursuing policies to promote its usage [29,30]. Trip distance appears to play a key role as it is one of the variables that makes bicycle use prohibitive for long distance travel [31], and attractive for shorter routes [32,33], for example, in the Netherlands where 25% of the total trips realized per person per day are made by bicycle. This share went up to 33% when considering that the trips were no longer than 7.5 km, and even up to 44% when the trips were between 1 km and 2.5 km [26]. In the last two decades, the bicycle has become a symbol of sustainable urban transportation [34,35] with many advantages for cyclists, society, and especially the environment [36,37]. It is an inexpensive mode of transportation with low maintenance costs [38], is very flexible, and relatively fast. It helps reduce urban traffic congestion levels [39,40]. Thanks to all of these advantages, it comes as no surprise that the bicycle has become a lifestyle choice [41] that should be encouraged to reduce the number of negative marginal effects involved in the usage of private automobiles [39].
Although much interest in promoting bicycling has been observed, especially in Canada and the United States [42,43,44,45], bicycling is underused as a transportation means in these countries, only comprising approximately 1–3% of the trips taken [46]. In some European countries such as Denmark, Germany, Finland, Sweden, and Netherlands, this percentage is estimated to be 10–27% [2,12,17,44,47].
In addition, small cities with a high potential in tourism may benefit most from the slow tourism opportunities offered by cycling as a mode of transportation. Slow tourism offers a more meaningful and deliberate way of connecting with the visited city. The origin of the concept of slow tourism traces back to social movements such as slow food and slow cities (CittaSlow) that started in Italy in the 1990s. It often emphasized its close link to mobility, with a particular interest in transportations that could reduce environmental pollution and save depleting energy resources [48].
Countries with limited cycling use can take into account the potential demand of the users; in other words, their intention to use bicycles for their transportation or their leisure activities, if the conditions were more favorable. In Chile, Ortuzar et al. [25] highlighted the first attempt to estimate the potential demand of a cycle network in Santiago. According to the future scenario of their research, with a dense and properly cycling network, a Metro and suburban rail network, 86.6% of the current trips would not consider bicycle as valid option. In the same scenario, the number of trips by bike could increase three times and reach 10% in favorable conditions to cycling. Land use policy for residential and services location may be a key factor in generating better conditions for cycling. Short trips continue being the most important market for bicycles. For this reason, the bicycle is quite popular in medium sized [49] or smaller cities [17] worldwide.
A very good opportunity to increase the intention of people towards cycling and to be more careful when using the existent infrastructure is to include them in transport planning and decision-making. This decision will lead them to better understand the present situation and to be more cooperative with other stakeholders and the municipality [49,50]. Nevertheless, public participation in transport planning is often regarded as a formal compulsory phase of the decision-making process and lacks in its real purpose [50]. Involving stakeholders and citizens at the beginning and during the planning process is a necessary condition to have consensus, transparency, and pursue sustainability [51].
2. Materials and Methods
2.1. Study Area
Preveza is a small touristic town with low steepness and good weather during most days of the year. It is located at the mouth of the Ambracian Gulf in the region of Epirus, Northwestern Greece. The data used in this study were gathered at the municipality of Preveza. The city had 22,853 residents in 2011 and has experienced a rapid population increase of 13.7% in the last decade [52]. A map of Preveza with 4.060 m bike infrastructure was extracted from Google maps (Figure 1). Preveza does not have inner-city public transport, but has buses to connect peri-urban areas and nearby villages.
2.2. The Survey
Structured face-to-face interviews were conducted with Preveza residents. Simple random sampling was used [53,54]. The average duration of the interview was 17 min. Data were collected in 2013 between the months of January and March. The interviews took place in the entrance of the municipality building by two students, from 10–11 in the morning and 6–7 in the afternoon. The location was chosen as the most central place in Preveza, where people of all ages go walking or shopping every day. Participants had to be at least 18 years old due to legal constraints in Greece.
The survey was divided into five different sections:
- Modes of transportation in the city according to the distance.
- The bicycle use in the city and cyclists’ behavior.
- Identification of factors (positive and negative) that influence residents to cycle.
- Evaluation of the existing infrastructure.
- General respondent demographics
2.3. Research Methodology
The population proportion p as well as the estimation of the standard error of the population Sp was carried out through the use of the formulas of simple random sampling. To determine the sample size, pre-sampling was used, with a sample size of 50 individuals. The size of the sample was estimated according to the formulas of simple random sampling (where t = 1.96 and e = 5%) [55]. A total of 400 questionnaires were collected in the city of Preveza.
In the multi-theme variables concerning the total of the positive and negative impacts of bicycling, a reliability analysis was applied. In particular, to find out the internal reliability of a questionnaire [56], i.e., if our data had the tendency to measure the same thing, we used the α coefficient (or reliability coefficient Cronbach’s α). A coefficient α equal or higher to 0.70 is considered as satisfactory [57], while higher than 0.80 is considered as very satisfactory. In practice, reliability coefficients with values lower than 0.60 have also been accepted many times [58].
Any test must be reliable to be useful. However, reliability does not suffice; it should also be valid, and this is checked through factor analysis [58]. Factor analysis is a statistical method that aims to discover the existence of factors common within a group of variables [59]. More specifically, the principal component analysis was used here, which is based on the spectral analysis of the variance (correlation) matrix. The selection of the number of factors is a dynamic process and presupposes the evaluation of the model in a repeating fashion. In this paper, we used the solution of two factors. We also conducted the rotation of the matrix principal components by using the maximum variance rotation method by Kaiser [60,61].
Finally, we examined the components that could explain the correlations among the variables of the data and also attempted to provide an interpretation [60]. According to Frangos [56], the variables that “belong” to each factor are those whose loadings, on the table representing the loadings of the factors after rotation, are higher than 0.5 for that factor. The statistical package SPSS was used for the data analysis [62].
A statistical segmentation of the residents in three distinct groups (clusters) was undertaken according to the factors of evaluation of the infrastructure resulting from the factor analysis (continued variables) and the characteristics of using the bicycle (categorical variable). A two-step cluster analysis was chosen for this purpose. This method constitutes a research tool that helps to determine clusters with variables of the same characteristics in a large number of data (questionnaires). Considering that the variables were independent of one another, categorical and continued variables were handled at the same time following polynomial and the normal distribution, respectively [61]. Additionally, the correlation of the other variables (continued or categorical) in every cluster separately was identified with a check of Pearson’s X2 or a one-way ANOVA. In this way, the identity of every cluster was determined with more accuracy.
3. Results
3.1. Demographic Profile of the Respondents
During the interviews, the residents were initially asked about their demographic profile. As shown in Table 1, 46% of the respondents were male and 54% were female. Most of them (33.5%) were young (18–30 years), unmarried (47.2%), and without children (51.8%). Regarding their profession, they were mainly self-employed (22%) or public servants (20.8%). Their educational level was quite high, since more than 29.8% of the respondents had completed upper secondary school or technological education (22.2%).
3.2. Distance of the Trip and Modes of Transportation
A study on trips of short distances, financed by the European Union, highlighted the very high proportion of journeys made in cars that could be made using another mode of transport without any significant difference in the journey time door-to-door. For such journeys alone, bicycles could easily replace cars, thus satisfying a large proportion of the demand and contributing directly to cutting down traffic jams [11].
Preveza is an example of this effort. In the first part of the questionnaire, the residents were asked about the way they were moving in Preveza city. According to the results, residents preferred walking and cycling as the main modes of transportation covering a mean of distance 3.34 km and 5.08 km, respectively. Cars and motorcycles were less preferred modes (Table 2). Fewer residents preferred moving with public transportation for their needs; in large Greek cities, travel choices are still primarily oriented toward cars and motorcycles [14].
By contrast, in megacities like Sao Paolo, Brazil, the mean distance of the daily cycling trips was 3.8 km [63]. More than 30% of trips made by cars in Europe cover distances of less than three kilometers and 50% are less than five kilometers [12]. In Preveza, regarding the question about the distance residents indicated for trips made by car or motorcycle, 16.5% of the residents stated using these two modes even for less than 0.1 km. Meanwhile, the majority (50.2%) used cars or motorcycles for distances longer than four kilometers (Table 3).
3.3. The Use of the Bicycle and Cyclist Behavior
Bicyclists in various countries prefer moving in bicycle lanes and paths with moderate elevation in beautiful green landscapes without pollution and noise [64,65]. Accessibility to green areas by bicycle may contribute to quality of life in urban areas [66]. Preveza has a bicycle network near automobile roads (Figure 2) and is combining this kind of bicycle network with a network near the sea by the Amvrakikos Gulf, one of the most renowned biotopes in Greece. In this respect, 45.5% of residents had the opinion that the city of Preveza was absolutely suitable for bicycling for their transportation, and 19.2% considered it very suitable. The remaining respondents characterized Preveza’s suitability for bicycling as moderate (23%), little (10%), or not at all (2.2%).
According to the results, the vast majority (90.5%) of residents had a positive association of riding a bicycle, only 1% had a negative association, and 8.5% were indifferent. It was found that 28.2% always used a bicycle for their daily mobility needs, 26% used it often, 17.2% used it sometimes, 11.2% used it rarely and 17.2% never used it.
Comparing these results with a similar study in Orestiada, a comparable sized city without a bicycle network, the views were completely different [17]. The majority of residents (56.3%) never used a bicycle for their transportation and 22% rarely used it. Only 5% always used a bicycle. The above results provide evidence on the importance of cycle network construction to encourage cycling. We could discern the necessity of new additional cycle networks in the town because the vast majority of residents supported the use of bicycles, but recognized the creation of problems to pedestrians in parks (74.8%), in pedestrian zones (70%), and on sidewalks (27.5%).
Studies on large US cities found that each additional linear mile of bike lanes per square mile land area was associated with a roughly 1% increase in share of bike commuters [67,68]. However, it should be noted that those American cities were large, compact, and had mixed land uses. Furthermore, safety when using bicycles, especially for children, seemed to bother the residents of Preveza. Almost half (42.2%) found bicycling was a little safe, while 24.2% said that it was not safe at all. Twenty-three percent were indifferent and only 7% and 3.5%, respectively, had the opinion that the bicycle was very or absolutely safe. According to Pucher et al. [64], the lack of infrastructure was associated with the lack of safety, especially for children.
Residents of Preveza had the opinion that young cyclists rarely (43%), never (12%), or sometimes (32.8%) followed the transportation rules of the road. Fewer residents stated that young cyclists often (11.8%) and always (0.5%) followed the code in their transportation bicycling.
The residents’ attitude about auto drivers’ behavior regarding cyclists was discontented. Respondents stated that drivers respected bicyclists on the road rarely (40%), never (13.2%), sometimes (34.8%), and often (10%). Only 2% stated that drivers always respected bicyclists on the road. Similarly, residents said that bicyclists sometimes (39.8%), rarely (29.2%), or never (7.8%) followed the code. Only about one-third of them (20.5% often and 2.8% always) followed the code. According to Vlastos et al. [13], all cyclists (regular and occasional) in the city of Patras had the intention to drive without following the code.
Regarding the question on whether education and training tests for young bicyclists had to be instituted, six to ten residents (59.2%) replied positively and 40.8% replied negatively. In similar research in the city of Orestiada, half of respondents agreed with that attitude [17].
The use of the bicycle is related to the residents’ behavior in their natural and social environment regarding their daily transportation [2]. Regarding the question on how bicycle usage by other residents could affect their own decision to use it, 72.5% of the respondents said it was positive and 27.5% said it was negative.
The increase of the presence of cyclists in urban areas and the number of cycling accidents on the roads call for a deeper study of riding behavior to make the infrastructural investments effective and urban cycling safer [69].
3.4. Evaluation of the Existing Infrastructure
Many studies have shown that cycling infrastructure is a prerequisite for the expansion of bicycle use [68]. A recent survey in one Greek city (Volos) found that although Greeks express a high intention to use bicycles for their daily activities, it was also clear that due to the lack of infrastructure, residents were very reluctant to manifest this intention [39].
In this paper, the residents of Preveza were asked to evaluate the existing bicycling infrastructure and then, more specifically, the infrastructure facilities of the city, which included the cycle networks in the city, parking places, training places for children, and cycle networks out of the city. Respondents evaluated the infrastructure as bad (40.5%), very bad (18.8%), and mediocre (32%). Only 7% and 1.8% found the total infrastructure was good and very good, respectively. When they evaluated each one of the infrastructures separately, they all had low evaluations (Table 4).
In England, actions to promote cycling have focused on making this form of travel easy and attractive through the development of new infrastructure and the provision of cycling training, especially for children. Underlying all these activities is an assumption, often implicit, that if cycling is made sufficiently easy and attractive, people will automatically shift short journeys from the car to more active modes like cycling and that they can be nudged into travel behavior that is better for them and the environment [9].
In Greek cities, the lack of car-restriction policies and inadequate cycling infrastructure, resulted in a low proportion of cycling trips (0.9%) when compared to other European countries [70,71]. For that reason, residents were not satisfied with the local authority’s actions to support bicycle use in the city of Preveza, evaluating it as insufficient or absolutely insufficient. Residents evaluated the activity of bicycle clubs more positively (Table 5).
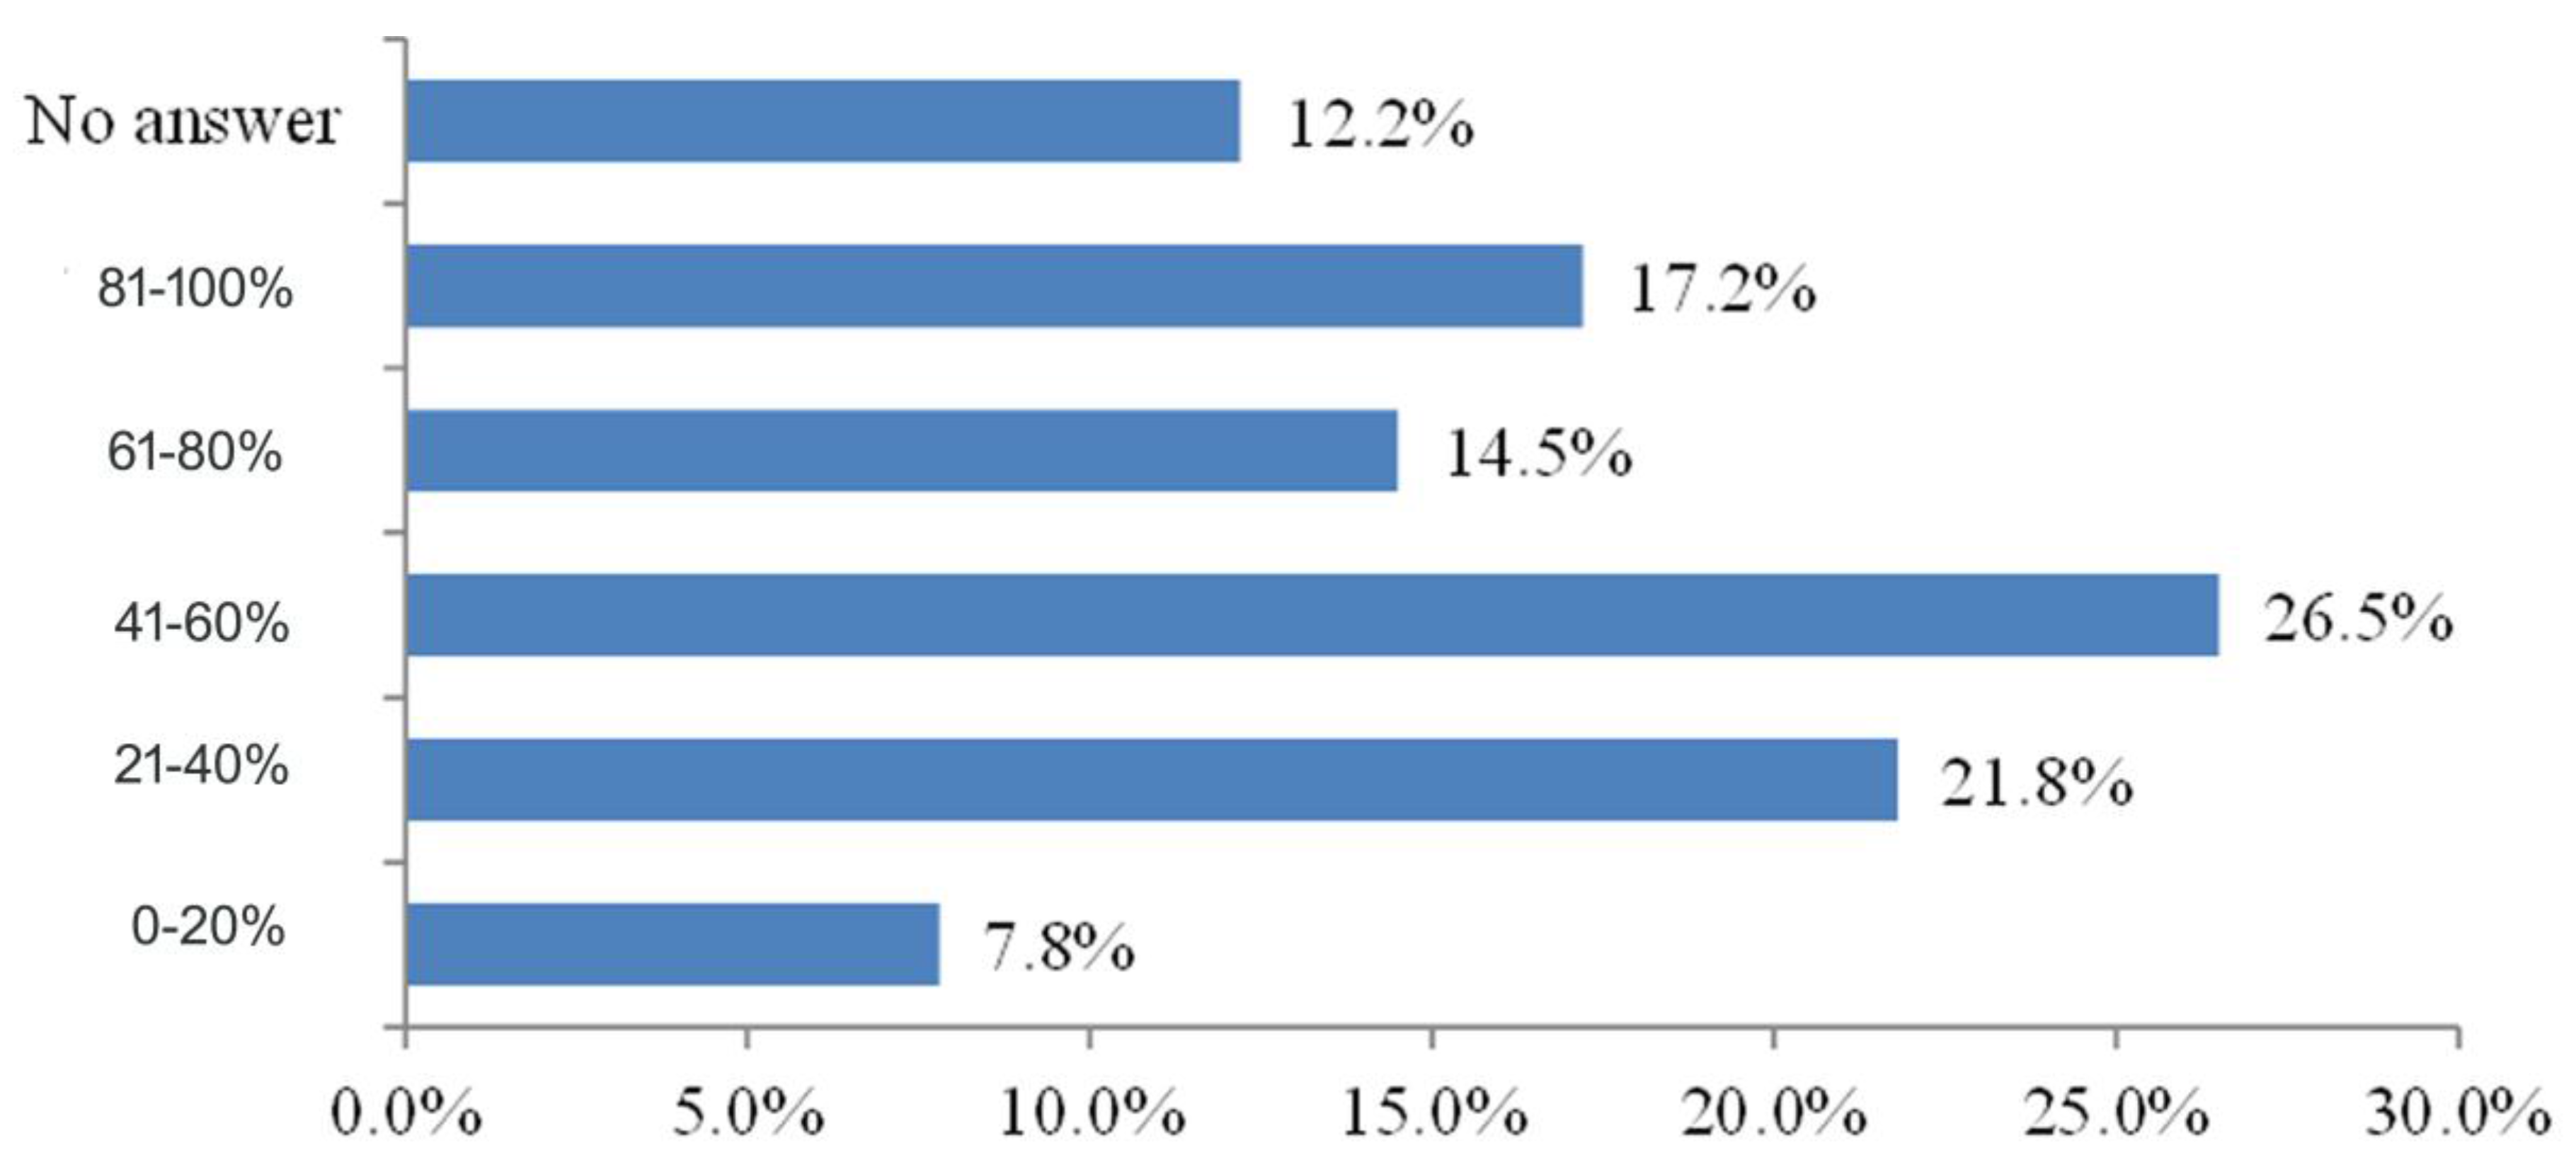
Cycling is an inexpensive mode of transportation with low maintenance costs. The benefits of investments in cycling infrastructure are estimated to be four to five times greater than the costs and are more beneficial to society than automobile-related transport investments [29]. The residents of Preveza had the same opinion. A great majority of them characterized bicycling as very cheap (40.8%) and cheap (36.2%). Fewer found it very expensive (1.8%) and expensive (4%), while 17.2% had the opinion that cycling was neither an expensive or inexpensive mode of transportation. When the residents were asked about the possibility of partial financial support from the state in buying bicycles, they stated that a subvention of about 40–60% of the cost was a good idea to support the use of cycling (Figure 3).
3.5. Factors Influencing Residents to Cycling
Most residents of Preveza recognize the potential health and local environmental benefits of bicycling for short trips in urban areas (Table 6). The improvement of general health, saving money, less contribution to atmospheric pollution, reduction of noise, ecofriendly lifestyle-example for children, and convenient transportation and parking were the most important positive factors that positively influenced residents to cycle. Similar evaluations were found in four cities of England, which cited benefits to heath, saving money, and decreasing air pollution as most important [9]. In contrast, Indian residents of small-sized cities evaluated physical fitness as the most important factor to influence cycling [18].
For the above factors, multi-theme variable reliability and factor analysis were applied after the performance of the necessary tests. The reliability coefficient α was 0.824 and this result constitutes strong evidence that the grades of the scale were logically consistent. Furthermore, this was also confirmed by the significantly high individual correlation coefficients α after the deletion of any advantage.
From the applied factor analysis two factors were excluded. The first factor included the variables “convenient transportation and parking”, “improvement of social communication”, “general health”, “eco-friendly lifestyle-example for children”, and “save money”, which were named as “benefits for the user”. The second factor included the variables “reduction of traffic jam”, “less contribution to atmospheric pollution”, and “reduction of noise pollution”, which were named as “benefits for the society”. Regarding the first factor, the variable improvement of social communication could also be included in the second factor, as its value was merely lower than 0.5 (Table 7). Therefore, the aforementioned variable can be considered as a bridge between the first and the second factor, namely between the individual and social welfare.
However, most respondents in different European cities also identified a range of factors that made it difficult to reduce car use, even for short journeys [9]. Guaranteeing the safety of cyclists in a town is a prerequisite for promoting cycling as a daily mode of transport [71]. Many potential cyclists were already thinking about cycling, but they needed safer infrastructure from the public authorities before they got back on their bicycles [12]. According to the residents of Preveza, the negative factors affecting cycling were insufficient infrastructure, exposure to extreme weather conditions, and safety risk (Table 8). However, in small-sized cities of India, the perceived negative factors were route visibility, presence of motorized vehicles, street parking, and physical exhaustion [18].
For the above multi-theme variable, reliability analysis was applied. The reliability coefficient α was 0.723, and after the application of factor analysis two factors were extracted. The first factor included the variables “low speed in moving”, “safety hazard”, “feeling of oddity”, “physical exhaustion”, “lonesome on the route”; this was named as “charge for the user”. The second factor included the variables “deficiencies to moving” and “exposure to extreme weather conditions”; this was named as “deficiency of infrastructures” (Table 9). The variable “low speed” had the value 0.493 in the second factor and was considered as a bridge between the first and the second factor.
The number of the clusters was determined from the specific program SPSS by applying the two-step cluster analysis. The observations were grouped into three clusters as the optimum solution. More specifically, of the 400 respondents, 28.4% were placed in the first cluster, 16.6% in the second cluster, and 55.0% in the third cluster.
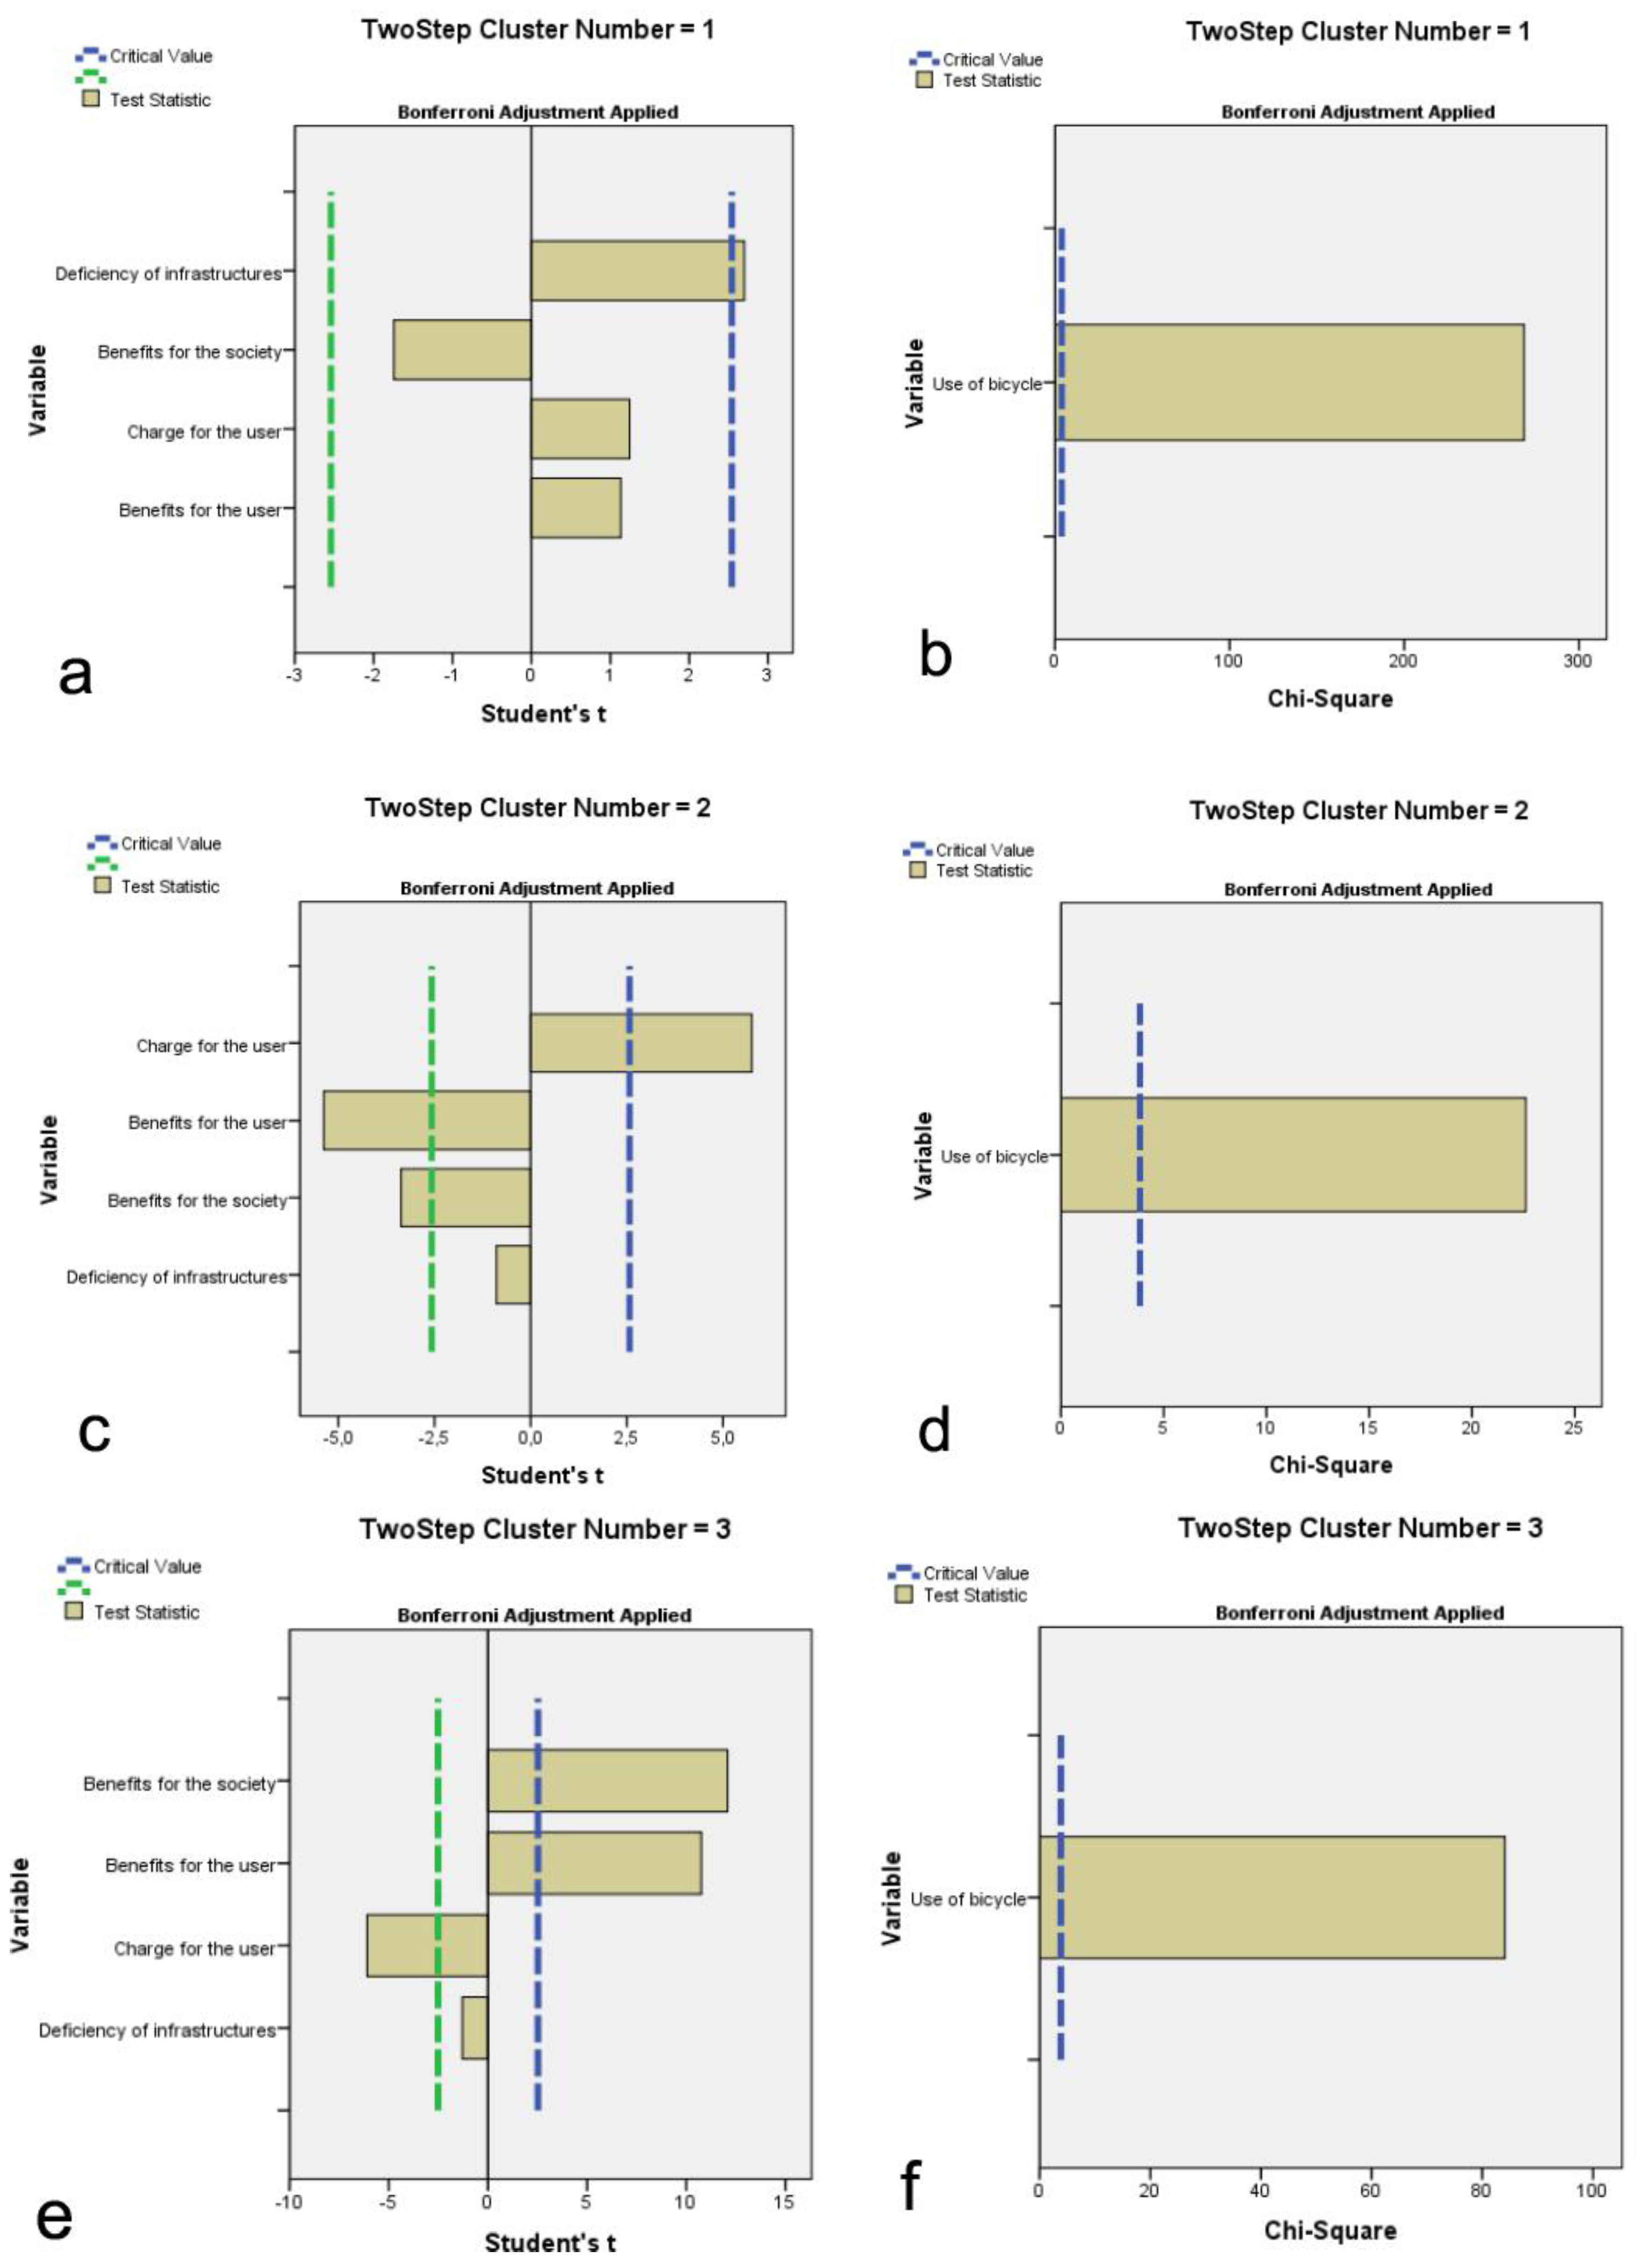
Regarding the relative significance of the variables (continuous and categorical) in the formation of the clusters, the diagrammatic representations of Figure 4 present the statistical significance tests. In the case of the continuous variables, it was observed that the variable “insufficient infrastructure” tended to play a significant role in the formation of the first cluster, while the variable “charge for the user” was the reason for the formation of the second cluster. The variables “benefit for the society” and “benefit for the user” were the reason for the formation of the third cluster (Figure 4a,c,e).
Furthermore, regarding the categorical variables, the value of the statistical Χ2 exceeded the limits of the critical value, which led to the conclusion that all the categorical variables used in the analysis were significant for the formation of the three clusters (Figure 4b,d,f).
Table 10 presents the characteristics of the three clusters. The Pearson’s X2 test for a statistical significance α < 0.04 presented the relation of the three clusters with other quality variables. Correspondingly, the analysis of variance (one-way ANOVA) for statistical significance α < 0.003 revealed the relation of the three clusters with the quantitative variables.
The first cluster included residents who rarely or never cycle and consider infrastructure deficiencies as the most important negative factor that influence cycling. They considered the city of Preveza not suitable for cycling, and did not accept the use of bicycles in sidewalks and pedestrian zones, nor did they accept state financial support in bicycle acquisition. The first cluster was made up of middle aged (31–50 years old) residents not familiar with cycling. They were not positively affected by seeing other residents cycling and they traveled mainly by car or walking.
The second cluster included residents who always or sometimes used bicycles for their transportation needs. They found their city not suitable for cycling. The second cluster was made up of young aged people (18–30 years old) who knew how to cycle and were positively affected by seeing other people cycling. They covered with bicycle the same distance as residents of the third cluster, but shorter distances by car and longer distances on foot. Although they accepted the use of bicycles on the road pavement and on the pedestrian zone, they did not accept the concept of financial support from the state. The main characteristic of this cluster was the perceived negative factors that influence cycling, which were physical exhaustion and feeling of oddity.
The third cluster included more than half of the residents. They owned bicycle and most of them were over 50 years old. Furthermore, they considered both the benefits for the residents and society as the most important positive factors influencing the use of the bicycle. They accepted the use of bicycles in the pedestrian zone and on sidewalks. They stated that Preveza was suitable or very suitable for cycling. This the cluster had the most positive cycling attitude and, more specifically, a positive attitude toward financial support from the state. They moved in the city mainly by cycling.
4. Discussion and Conclusions
The city of Preveza is a small-sized Greek city where the bicycle is a popular mode of transportation. The results of this study showed that the vast majority of the residents rode bicycles and had positive views on cycling as a mode of transportation. Meanwhile, the percentage of unhappy residents was significant. More than half of them used bicycle always or often for their daily transportation. In contrast to all other Greek cities where, according to [29], 7.5% of the residents were regular and only 1.8% occasional cyclists, in Preveza, the use of bicycles was comparative to Danish residents, of whom 50.1% were regular cyclists and 8% occasional cyclists.
Preveza is a city with low steepness, attractive climate and green landscapes suitable for cycling, according to the majority of residents. However, they evaluated the existing infrastructure as bad or very bad and were disappointed with the insufficient support from the state and other local bodies. The lack of infrastructure was associated with less safety, especially for children [72]. The residents found the use of cycling little or not at all safe, especially for children as young cyclists rarely follow the road code. Furthermore, most of the drivers did not respect cyclists on the road. Ortuzar [25] stated that car and bus drivers in Chile had the same scant behavior, especially in cycle lanes painted on the pavement that were not segregated from the traffic. It is suggested that the current situation should be improved by using training courses focusing mostly on young cyclists. Le Pira et al. [51] in Catania, a medium sized Italian city, represented alternatives of promoting cycling mobility, information, and education campaigns.
The economic crisis that Greece has experienced since 2008 and the increased ticket prices in public transportation services and high car maintenance costs, as well as increased environmental consciousness have turned people to use their car less, increasing their preference to use other modes (bicycles and walking) [73]. Bakogiannis et al. [74] in a recent research in Karditsa city found that when the number of bicycle users increased, the number of cars in the city center significantly dropped and the character of the city changed. The results of the present study revealed that the use of bicycles by an increased number of residents positively affected their own decision to use it. In their childhood, residents used bicycles for their mobility, but during their adolescence they gave up cycling and started using motorcycles instead as other teenagers teased them. Ortuzar [25] highlighted the cultural and idiosyncrasy bias against the use of bicycles as a mean of transportation mainly caused by years of funny and well-done car dealers’ propaganda television sketches ridiculing bicycle use on national TV channels. Middle-aged residents did not use bicycles because of their stressful schedule of work and family obligations. Meanwhile, in the elder ages, the residents had more free time and started using bicycles again for their mobility. Nevertheless, according to the results, distances further than two-kilometers proved a deterrent to the use of bicycles, mostly because of the variable of physical exhaustion, especially among the elderly population.
According to Sousa Silva et al. [75], sustainable urban development should be guided by a planning vision that promotes green infrastructure interconnected with the hinterland green areas, a multi-modal transportation system, and mixed-use multifunctional landscapes.
For Preveza city, which lacks public transport in the inner city, there has been a proposal to expand and improve bicycle and pedestrian infrastructure that will decrease the distance travelled by vehicles. In order to allow riding bicycles in a safe way in all areas, a bike path connecting all major city attractions should be implemented.
Residents’ supported state subvention as motivation to use bicycle. Meanwhile, there are many ways that bicycle usage can be encouraged [76]. Much cycling research overlooks the importance of “end of trip facilities”. Support facilities such as bicycle parking racks have supportive development to complement cycling and secure bike parking options at shops and places of employment and recreation [77].
For cities related to tourism, it is suggested that a shared-type smart cycling network is developed for young and unemployed entrepreneurs that will fulfill the mobility needs of the elderly and tourists and add it as option to the existing application for taxis. The state and local authorities should take measures for the insufficiencies found and promote slow city policies that connect the environment to social wellbeing and the local economy [78]. In Preveza, where the use of the bicycle is prominent when compared to other Greek cities, there are efforts to promote cycling by constructing an extensive network of bicycling facilities, implementing transit integration, and organizing exhibitions and weekly races for cyclists.
Based on this study, lessons were derived about how leaders can make their cities more safe and accessible for bicyclists and pedestrians. The analysis of the Preveza case study also leaves room for future work in exploring best practice policy in the financing of local bicycling improvements. The accessibility needs of particular social groups relevant to gender specific needs, unemployed persons, vulnerable-to exclusion-citizens such as migrants, the elderly, children and the disabled will be the object of future research.
Acknowledgments
This paper was financed by the FCT-Foundation for Science and Technology through project UID/SOC/04020/2013. The authors would like to thank Anatoli Kontou-Bouglali for collecting the questionnaires.
Author Contributions
All authors contributed equally to this work. Paraskevi Karanikola conceived and designed the experiments; Stilianos Tampakis and Georgios Tsantopoulos analyzed the data; and Paraskevi Karanikola and Thomas Panagopoulos wrote the paper.
Conflicts of Interest
The authors declare no conflict of interest.
References
- De Nazelle, A.; Rodriguez, D.A. Tradeoffs in incremental changes towards pedestrian-friendly environments: Physical activity and pollution exposure. Transp. Res. Part D 2009, 14, 255–263. [Google Scholar] [CrossRef]
- Aldred, R. On the outside: Constructing cycling citizenship. Soc. Cult. Geogr. 2010, 11, 35–52. [Google Scholar] [CrossRef]
- Lumb, P. Cycling, walking and biodiversity: Occupying urban landscapes. In Proceedings of the 4th Australian Cycling Conference, Adelaide, Australia, 16–17 January 2012; pp. 107–119. [Google Scholar]
- Unger, N.; Bond, C.; Wang, S.; Koch, M.; Menon, S.; Shindell, T.; Bauer, S. Attribution of climatic forcing to economic sectors. Proc. Natl. Acad. Sci. USA 2010, 107, 3382–3387. [Google Scholar] [CrossRef] [PubMed]
- Nazelle, A.; Morton, B.; Jerrett, M.; Crawford-Brown, D. Short trips: An opportunity for reducing mobile-source emissions? Transp. Res. Part D 2010, 15, 451–457. [Google Scholar] [CrossRef]
- Koning, M.; Conway, A. The good impacts of biking for goods: Lessons from Paris city. Case Stud. Transp. Policy 2016, 4, 259–268. [Google Scholar] [CrossRef]
- Buehler, R.; Dill, J. Bikeway networks: A review of effects on cycling. Transp. Rev. 2015, 36, 9–27. [Google Scholar] [CrossRef]
- Teschke, K.; Harris, A.; Reynolds, C.; Winters, M.; Babul, S.; Chipman, M.; Cusimano, M.; Brubacher, J.; Hunte, G.; Friedman, S.; et al. Route infrastructure and risk of injuries to bicyclists: A case-crossover study. Am. J. Public Health 2012, 102, 2336–2343. [Google Scholar] [CrossRef] [PubMed]
- Pooley, C.; Horton, D.; Schelderman, G.; Mullen, C.; Jones, T.; Tight, M.; Jopson, A.; Chisholm, A. Policies for promoting walking and cycling in England: A view from the street. Transp. Policy 2013, 27, 66–72. [Google Scholar] [CrossRef]
- Borjesson, M.; Eliasson, J. The value of time and external benefits in bicycle appraisal. Transp. Res. Part A 2012, 46, 673–683. [Google Scholar] [CrossRef]
- Rojas-Rueda, D.; de Nazelle, A.; Tainio, M. The health risks and benefits of cycling in urban environments compare with car use: Health impact assessment study. Br. Med. J. Int. Ed. 2011, 343. [Google Scholar] [CrossRef] [PubMed] [Green Version]
- Winters, M.; Davidson, G.; Pearce, C.; Teschke, K. Cycling in cities—Understanding people, neighborhoods and infrastructure to guide urban design for active transportation. In Proceedings of the 45th International Making Cities Livable Conference, Portland, OR, USA, 10–14 June 2007. [Google Scholar]
- Vlastos, T.; Milakis, D.; Athanasopoulos, A. The research for cycling in Greece. Methodology of planning, infrastructure standards and a typology of design solutions. In Proceedings of the 15th International Velo-City Conference, Dublin, Ireland, 31 May–3 June 2005. [Google Scholar]
- Milakis, D. Will Greeks cycle? Exploring intention and attitudes in the case of the new bicycle network of Patras. Int. J. Sustain. Transp. 2015, 9, 321–334. [Google Scholar] [CrossRef]
- Papavasileiou, C.; Milakis, D.; Vlastos, T. Car dependence or appetence? Examination of attitudes towards sustainable mobility in the Greek case. In Proceedings of the 12th World Conference on Transport Research, Lisbon, Portugal, 11–15 July 2010. [Google Scholar]
- Vlastos, T.; Milakis, D. Planning of a cycling network in a Greek city according to geometrical criteria. The case of Moschato. Tech. Chron. Sci. J. 2003, 23, 35–46. [Google Scholar]
- Tampakis, S.; Karanikola, P.; Tsantopoulos, G.; Andrea, V.; Antipa, N.M.; Paroni, D.V. Exploring the positive and negative impacts of bicycling in the city of Orestiada, Greece. In Proceedings of the Virtual International Conference on Advanced Research in Scientific Areas (ARSA-2013), Bratislava, Slovakia, 2–6 December 2013; pp. 346–350. [Google Scholar]
- Majumdar, B.B.; Mitra, S. Identification of factors influencing bicycling in small sized cities: A case study of Kharagpur, India. Case Stud. Transp. Policy 2015, 3, 331–336. [Google Scholar] [CrossRef]
- Milakis, D.; Athanasopoulos, K. What about people in cycle network planning? Applying participative multicriteria GIS analysis in the case of the Athens metropolitan cycle network. J. Transp. Geogr. 2014, 35, 120–129. [Google Scholar]
- Chun, B.; Lee, S. Review on ITS in smart city. Adv. Sci. Technol. Lett. 2015, 98, 52–54. [Google Scholar]
- Jeekel, J.F. Social sustainability and smart mobility: Exploring the relationship. Transp. Res. Procedia 2017, 25, 4296–4310. [Google Scholar] [CrossRef]
- Garau, C.; Masala, F.; Pinna, F. Cagliari and smart urban mobility: Analysis and comparison. Cities 2016, 56, 35–46. [Google Scholar] [CrossRef]
- European Commission. Towards a New Culture for Urban Mobility; European Commission, Directorate General for Energy and Transport: Brussels, Belgium, 2007. [Google Scholar]
- Saelensminde, K. Cost–benefit analysis of walking and cycling track networks taking onto account insecurity, health effects and external costs of motorized traffic. Transp. Res. Part A 2004, 38, 593–606. [Google Scholar]
- Ortuzar, D.J.; Iacobelli, A.; Valeze, C. Estimating demand for a cycle-way network. Transp. Res. Part A 2000, 34, 353–373. [Google Scholar] [CrossRef]
- Rietveld, P.; Daniel, V. Determinants of bicycle use: Do municipal policies matter? Transp. Res. Part A 2004, 38, 531–550. [Google Scholar] [CrossRef]
- Goodman, A.; Green, J.; Woodstock, J. The role of bicycle sharing systems in normalizing the image of cycling: An observation study of London cyclists. J. Transp. Health 2014, 1, 5–8. [Google Scholar] [CrossRef] [PubMed]
- Pucher, J.; Komanoff, C.; Schimek, P. Bicycle renaissance in North America? Recent trends and alternative policies to promote cycling. Transp. Res. Part A 1999, 33, 625–654. [Google Scholar]
- Dekoster, J.; Schollaert, U. Cycling: The Way Ahead for Towns and Cities; Office for Official Publications of the EU: Luxembourg, 1999. [Google Scholar]
- Martens, K. Promoting bike and ride: The Dutch experience. Transp. Res. A 2007, 41, 326–338. [Google Scholar] [CrossRef]
- Guinn, M.J.; Stangl, P. Pedestrian and bicyclist motivation: An assessment of influences on pedestrians’ and bicyclists’ mode choice in Mt. Pleasant, Vancouver. Urban Plan. Transp. Res. 2014, 2, 105–125. [Google Scholar] [CrossRef]
- Karanikola, P.; Panagopoulos, T.; Tampakis, S. Weekend visitors’ views and perceptions at an urban national forest park of Cyprus during summertime. J. Outdoor Recreat. Tour. 2017, 17, 112–121. [Google Scholar] [CrossRef]
- Milani Medeiros, R.; Duarte, F. Policy to promote bicycle use or bicycle to promote politicians? Bicycles in the imagery of urban mobility in Brazil. Urban Plan. Transp. Res. 2014, 1, 28–39. [Google Scholar] [CrossRef]
- Sick Nielsen, A.T.; Skov-Petersen, H.; Carstensen, T.A. Urban planning practices for bikeable cities—The case of Copenhagen. Urban Res. Pract. 2013, 6, 110–115. [Google Scholar] [CrossRef]
- Chapman, L. Transport and climate change: A review. J. Transp. Geogr. 2007, 15, 354–367. [Google Scholar] [CrossRef]
- Handy, S.; Van Wee, B.; Kroesen, M. Promoting cycling for transport: Research needs and challenges. Transp. Rev. 2014, 34, 4–24. [Google Scholar] [CrossRef]
- Horton, D. Environmentalism and the bicycle. Environ. Polit. 2006, 15, 41–58. [Google Scholar] [CrossRef]
- Castillo-Manzano, I.J.; Sanchez-Braza, A. Can anyone hate the bicycle? The hunt for an optimal local transportation policy to encourage bicycle usage transportation policy to encourage bicycle usage. Environ. Polit. 2013, 22, 1010–1028. [Google Scholar] [CrossRef]
- Hopkinson, P.; Wardman, M. Evaluating the demand for new cycle facilities. Transport. Policy 1996, 3, 241–249. [Google Scholar] [CrossRef]
- Jappinen, S.; Toivonen, T.; Salonen, M. Modelling the potential effect of shared bicycles on public transport travel times in Greater Helsinki: An open data approach. Appl. Geogr. 2013, 43, 13–24. [Google Scholar] [CrossRef]
- Tight, M.; Timms, P.; Banister, D.; Bowmaker, J.; Copas, J.; Day, A. Visions for a walking and cycling focused urban transport system. J. Transp. Geogr. 2011, 19, 1580–1589. [Google Scholar] [CrossRef]
- Horton, D. Fear of cycling. In Cycling and Society; Horton, D., Rosen, P., Cox, P., Eds.; Ashgate Publishing Ltd.: Aldershot, UK, 2007; pp. 133–152. [Google Scholar]
- Mercier, J.; Carrier, M.; Duarte, F.; Tremblay-Racicot, F. Policy tools for sustainable transport in three cities of the Americas: Seattle, Montreal and Curitiba. Transp. Policy 2016, 50, 95–105. [Google Scholar] [CrossRef]
- Pucher, J.; Buehler, R. Cycling trends and policies in Canadian cities. World Transp. Policy Pract. 2005, 11, 43–61. [Google Scholar]
- Su, J.; Winters, M.; Nunes, M.; Brauer, M. Designing a route planner to facilitate and promote cycling in Metro Vancouver, Canada. Transp. Res. Part A 2010, 44, 495–505. [Google Scholar] [CrossRef]
- Pritchard, J.; Moura, F.; deAbreu e Silva, J. Incorporating social network data in mobility studies: Benefits and take away from an applied survey methodology. Case Stud. Transp. Policy 2016, 4, 279–293. [Google Scholar] [CrossRef]
- Pucher, J.; Buehler, R. Making Cycling Irresistible: Lessons from The Netherlands, Denmark and Germany. Transp. Rev. 2008, 28, 495–528. [Google Scholar] [CrossRef]
- Oh, H.; Assaf, A.G.; Baloglu, S. Motivations and goals of slow tourism. J. Travel Res. 2016, 55, 205–219. [Google Scholar] [CrossRef]
- Milakis, D.; Athanasopoulos, K.; Vafeiadis, E.; Vafeiadis, K.; Vlastos, T. Planning of the Athens metropolitan network using participative multicriteria GIS analysis. Procedia Soc. Behav. Sci. 2012, 48, 816–826. [Google Scholar] [CrossRef]
- Le Pira, M.; Ignaccolo, M.; Inturri, G.; Pluchino, A.; Rapisarda, A. Modeling stakeholder participation in transport planning. Case Stud. Transp. Policy 2016, 4, 230–238. [Google Scholar] [CrossRef]
- Le Pira, M.; Inturri, G.; Ignaccolo, M.; Pluchino, A. Modeling consensus in Delphi practices for participated transport planning. Transp. Res. Procedia 2017, 25, 3725–3735. [Google Scholar] [CrossRef]
- Hellenic Statistical Authority 2011. Available online: http://www.statistics.gr/portal/page/portal/ESYE/BUCKET/General/resident_population_census2011rev.xls (accessed on 10 February 2016).
- Hoyos, D. The state of the art of environmental valuation with discrete choice experiments. Ecol. Econ. 2010, 69, 1595–1603. [Google Scholar] [CrossRef]
- Pagano, M.; Gauvreau, K. Elements of Biostatistics; Ellin Publications: Athens, Greece, 2000. [Google Scholar]
- Karlis, D. Multivariate Statistical Analysis; Ath. Stamoulis Publications: Athens, Greece, 2005. [Google Scholar]
- Frangos, C.K. Methodology of Market Research and Data Analysis with the Use of the Statistical Package SPSS for Windows; Interbooks Publications: Athens, Greece, 2004. [Google Scholar]
- Howitt, D.; Gramer, D. Statistics with the SPSS 11 for Windows; Kleidarithmos Publications: Athens, Greece, 2003. [Google Scholar]
- Siardos, G.Κ. Multivariate Statistical Analysis Methods. Part I: Exploring the Relations between Variables; Zitis Publications: Thessaloniki, Greece, 1999. [Google Scholar]
- Sharma, S. Applied Multivariate Techniques; John Wiley & Sons: New York, NY, USA, 1996. [Google Scholar]
- Djoufras, I.; Karlis, D. Elements of Multivariate Data Analysis; University of the Aegean: Chios, Greece, 1997. [Google Scholar]
- Harman, H.H. Modern Factor Analysis; The University of Chicago Press: Chicago, IL, USA, 1976. [Google Scholar]
- SPSS. SPSS Categories 16. A Software Package, Version 16.0; SPSS Inc.: Chicago, IL, USA, 2008. [Google Scholar]
- Sá, T.H.; Duran, A.C.; Tainio, M.; Monteiro, C.A.; Woodcock, J. Cycling in São Paulo, Brazil (1997–2012): Correlates, time trends and health consequences. Prev. Med. Rep. 2016, 4, 540–545. [Google Scholar] [CrossRef] [PubMed]
- Pucher, J.; Buehler, R.; Seinen, M. Bicycling renaissance in North America? An update and reappraisal of cycling trends and policies. Transport. Res. Part A 2011, 45, 451–475. [Google Scholar]
- Winters, M.; Brauer, M.; Setto, E.M.; Teschke, K. Mapping bikeability: A spatial tool to support sustainable travel. Environ. Plan. B 2013, 40, 865–883. [Google Scholar] [CrossRef]
- Panagopoulos, T.; Duque, J.A.G.; Bostenaru, D.M. Urban planning with respect to environmental quality and human well-being. Environ. Pollut. 2016, 208, 137–144. [Google Scholar] [CrossRef] [PubMed]
- Dill, J.; Carr, T. Bicycle commuting and facilities in major US cities: If you build them, commuters will use them. Transp. Res. Rec. 2001, 1828, 116–123. [Google Scholar] [CrossRef]
- Buehler, R.; Pucher, J. Cycling to work in 90 large American cities: New evidence on the role of bike paths and lanes. Transportation 2012, 39, 409–432. [Google Scholar] [CrossRef]
- Mantsuano, A.; Bernardi, S.; Rupi, F. Cyclist gaze behavior in urban space: An eye-tracking experiment on the bicycle network of Bologna. Case Stud. Transp. Policy 2017, 5, 408–416. [Google Scholar] [CrossRef]
- OASA (Athens Urban Transport Organization). Household Travel Survey (Technical Report TO3. 1[A]); OASA: Athens, Greek, 2007. [Google Scholar]
- Riggs, W.; McDade, E. Moving from planning to action: Exploring best practice policy in the finance of local bicycling and pedestrian improvements. Case Stud. Transp. Policy 2016, 4, 248–257. [Google Scholar] [CrossRef]
- Reynolds, C.; Winters, M.; Ries, F.; Gouge, B. Active Transportation in Urban Areas: Exploring Health Benefits and Risks. 2010. Available online: www.ncceh.ca/sites/default/files/Active_Transportation_in_Urban_Areas_June_2010.pdf (accessed on 15 August 2010).
- Efthymiou, D.; Antoniou, C. Understanding the effects of economic crisis on public transport users’ satisfaction and demand. Transp. Policy 2017, 53, 89–97. [Google Scholar] [CrossRef]
- Bakogiannis, E.; Kyriakidis, C.; Siti, M.; Eleftheriou, V. Four stories for sustainable mobility in Greece. Transp. Res. Proceedia 2017, 24, 345–353. [Google Scholar] [CrossRef]
- Sousa Silva, C.; Lackóová, L.; Panagopoulos, T. Applying sustainability techniques in eco-industrial parks. WIT Trans. Ecol. Environ. 2016, 210, 135–145. [Google Scholar] [CrossRef]
- Milakis, D.; Efthymiou, D.; Antoniou, C. Built environment, travel attitudes and travel behaviour: Quasi-longitudinal analysis of links in the case of Greeks relocating from US to Greece. Sustainability 2017, 9, 1774. [Google Scholar] [CrossRef]
- Wardman, M.; Tight, M.; Page, M. Factors influencing the propensity to cycle to work. Transp. Res. Part A 2007, 41, 339–350. [Google Scholar] [CrossRef]
- Semmens, J.; Freeman, C. The Value of Cittaslow as an approach to local sustainable development: A New Zealand perspective. Int. Plan. Stud. 2012, 17, 353–375. [Google Scholar] [CrossRef]
Figure 1.
Map of Preveza with bike infrastructure (in yellow) depicting the investigation area (source: Google maps).
Figure 1.
Map of Preveza with bike infrastructure (in yellow) depicting the investigation area (source: Google maps).
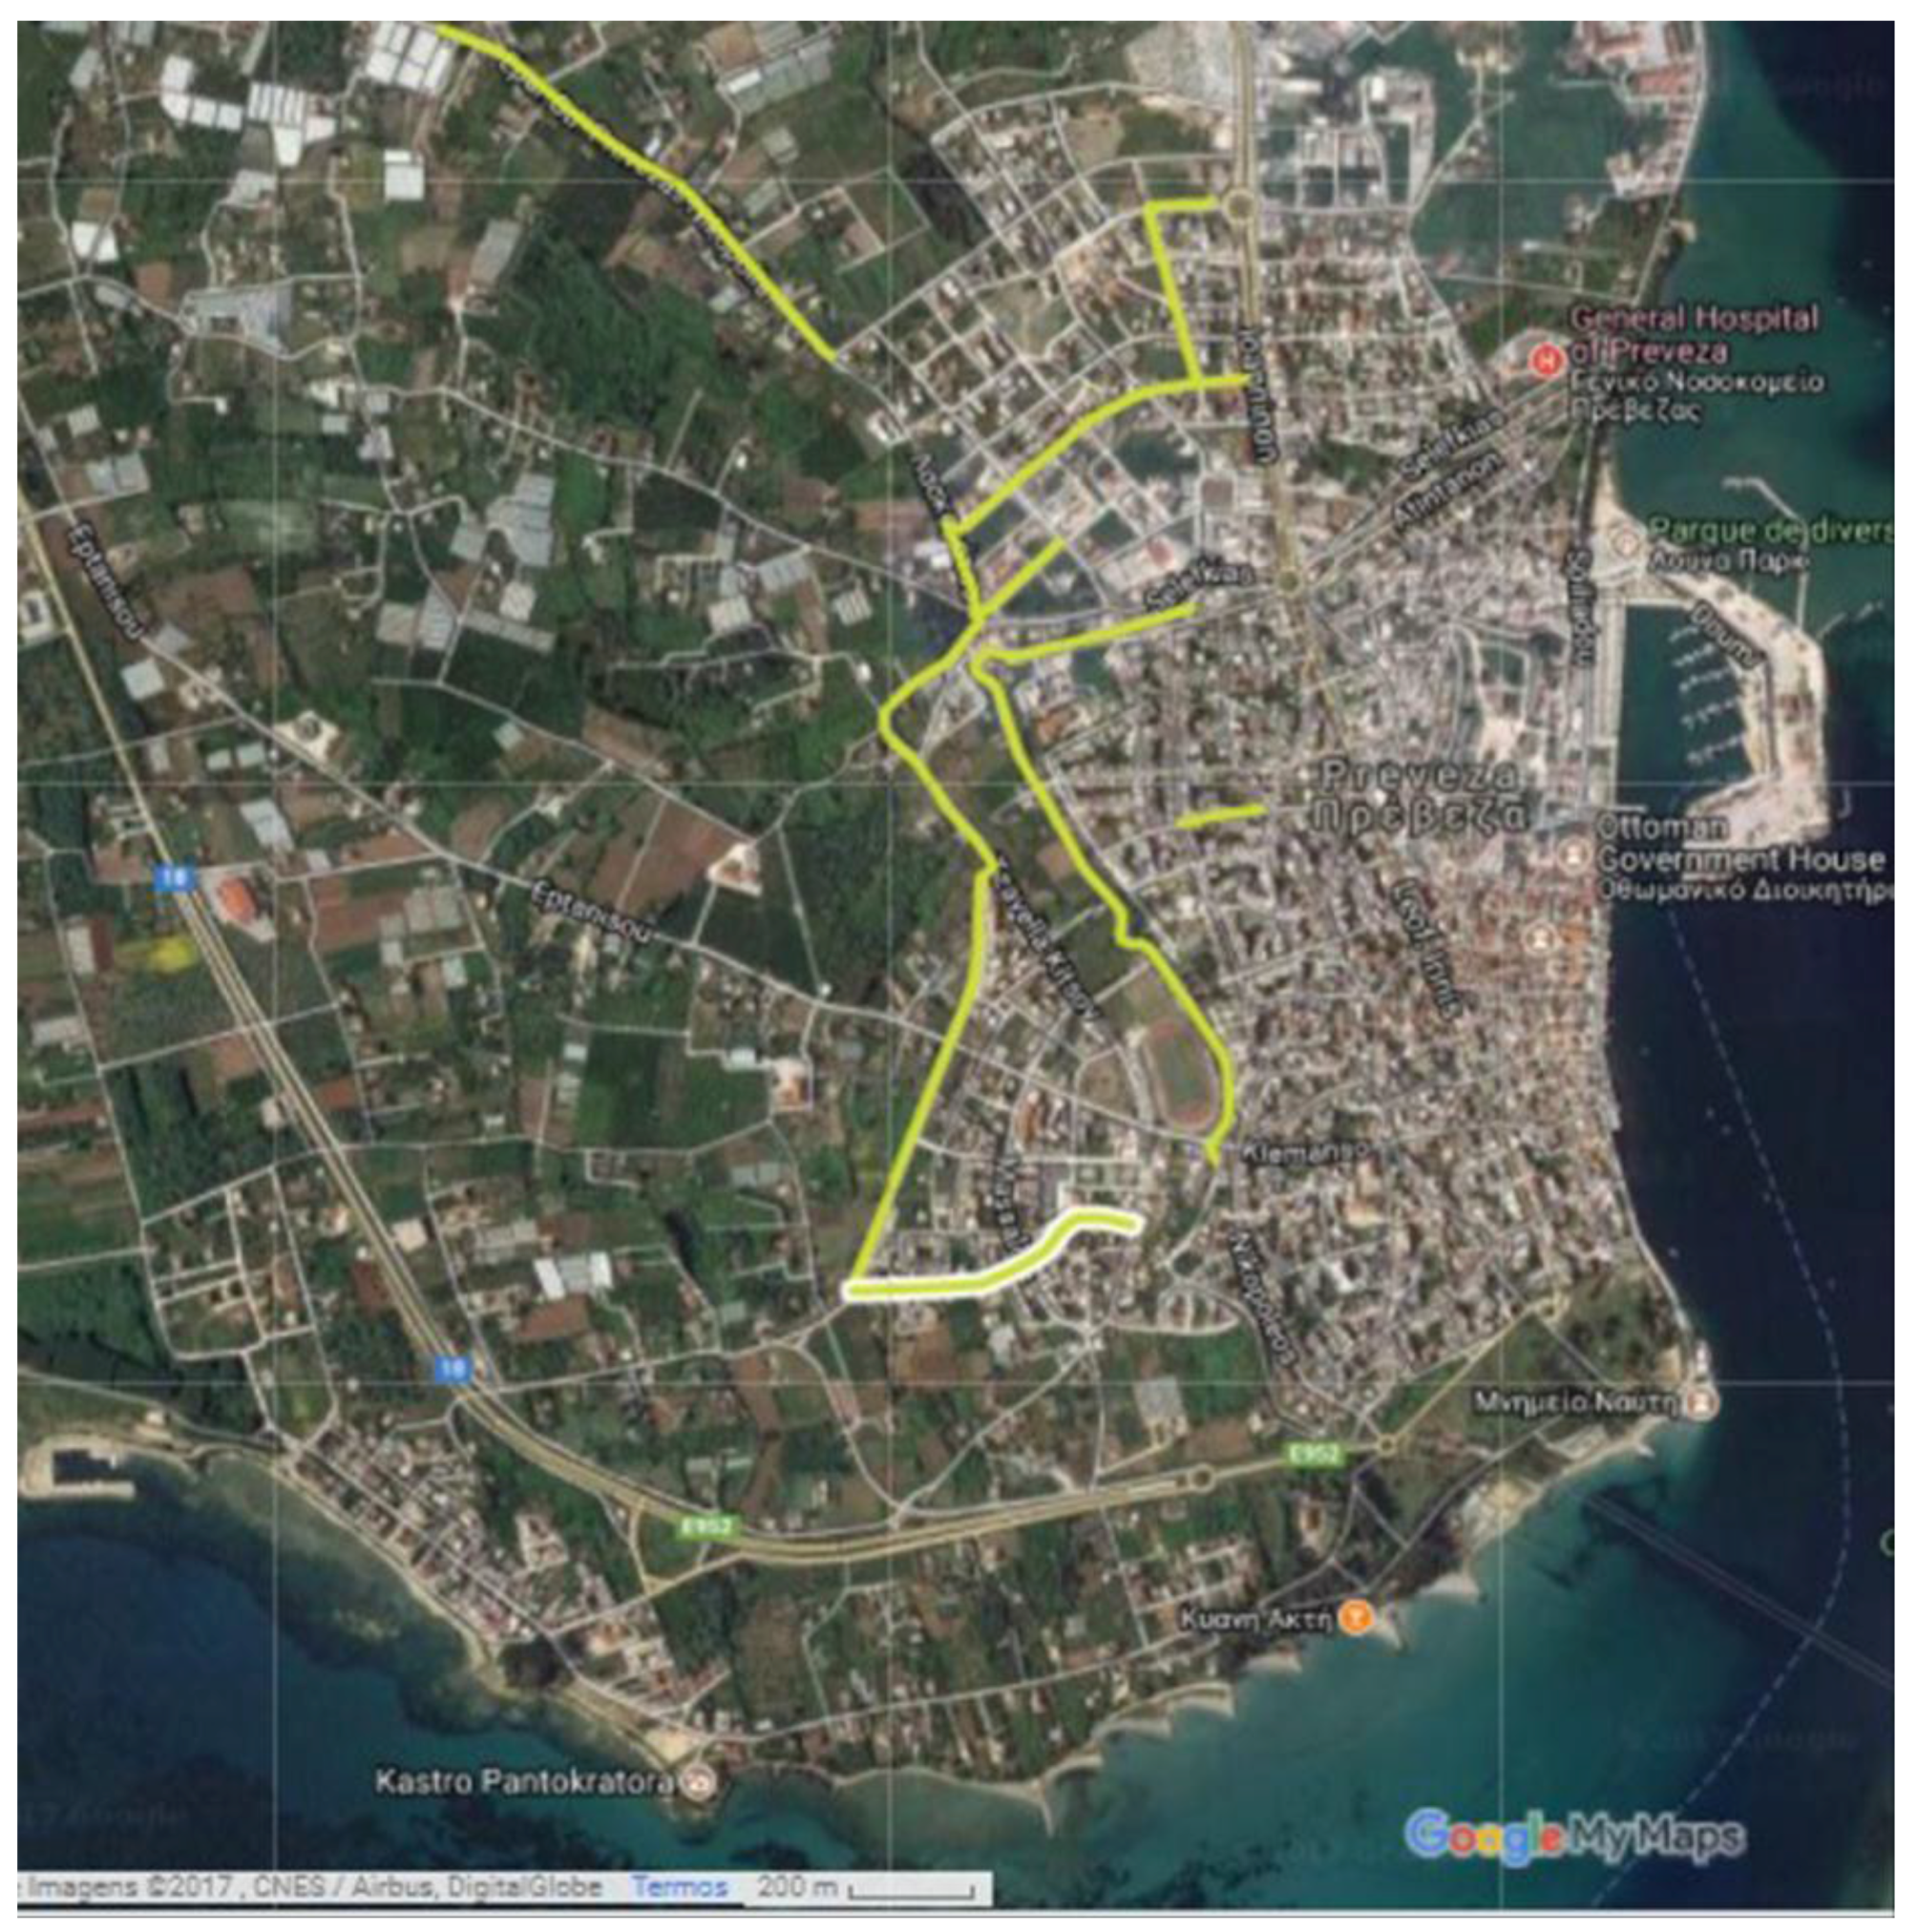
Figure 2.
A bicycle lane of Preveza city.
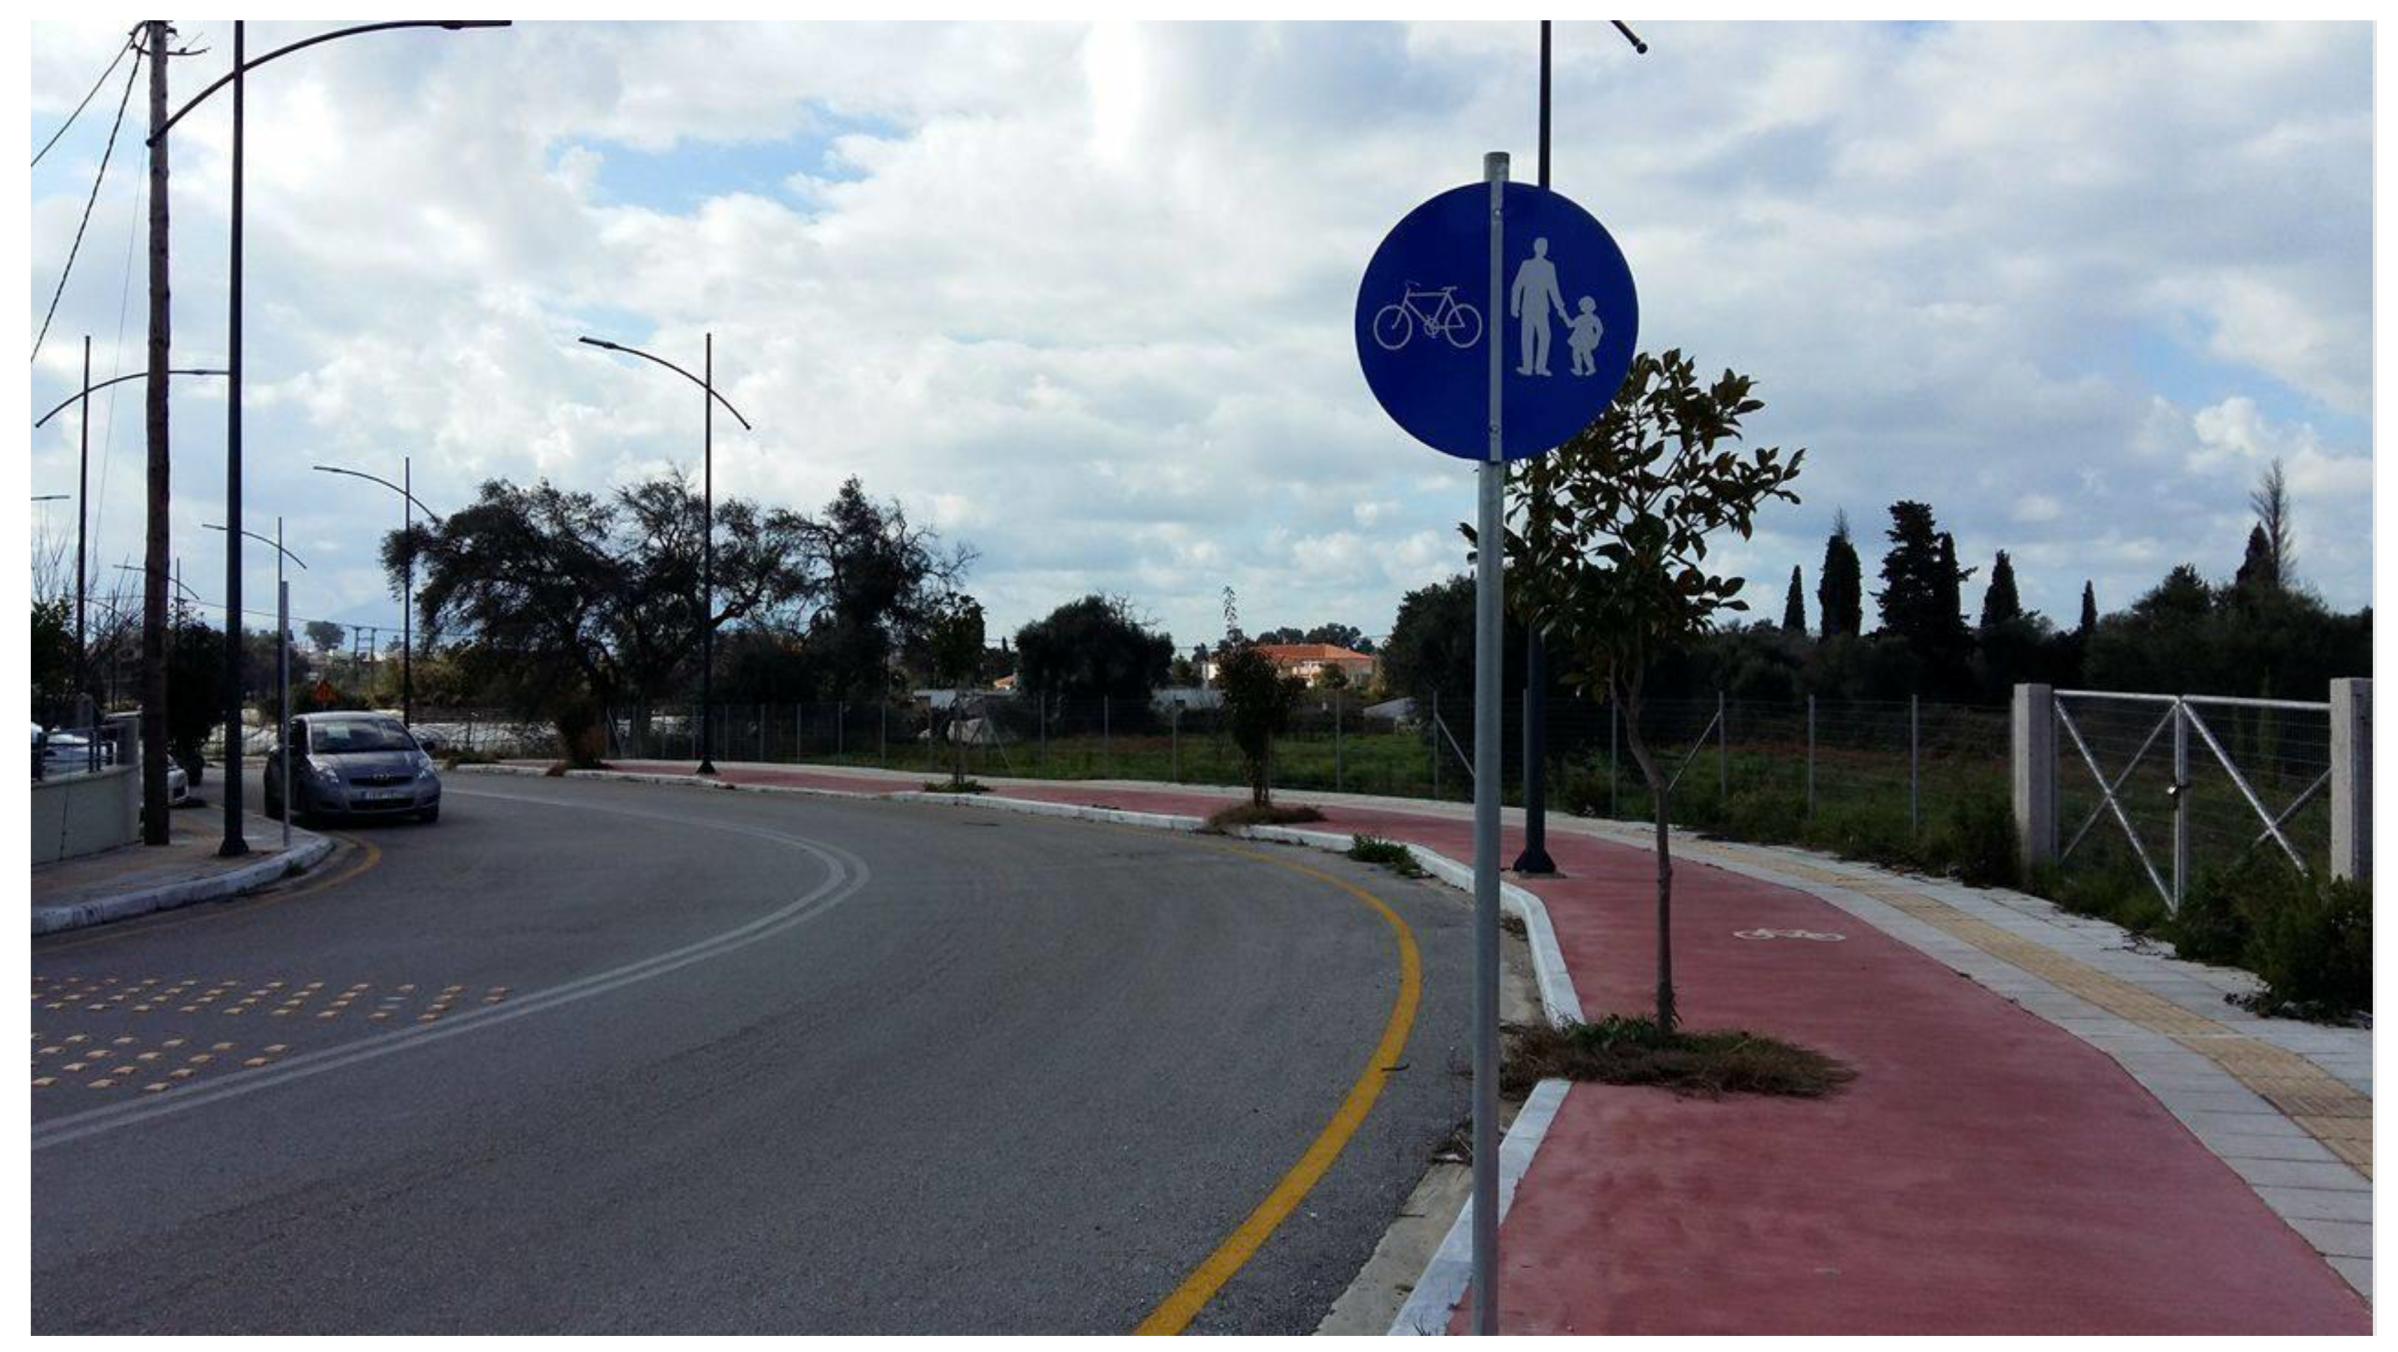
Figure 3.
Residents’ opinions on the height of a state subsidy as motivation to use bicycles (sample size 400).
Figure 3.
Residents’ opinions on the height of a state subsidy as motivation to use bicycles (sample size 400).

Figure 4.
Diagrammatic representations of statistical tests of variables per cluster (graphs a,c,e were continuous and b,d,f were categorical variables).
Figure 4.
Diagrammatic representations of statistical tests of variables per cluster (graphs a,c,e were continuous and b,d,f were categorical variables).


Table 1.
Socio-demographic profile of the residents in Preveza (sample size 400).
| Gender | Male | Female | |||
| 46% | 54% | ||||
| Age | 18–30 | 31–40 | 41–50 | >50 | |
| 33.5% | 23.5% | 23% | 20% | ||
| Marital Status | Unmarried | Married | Divorced/widowed | ||
| 47.2% | 42.2% | 10.5% | |||
| Children | no children | one child | two children | three children | >3 children |
| 51.8% | 13.5% | 24.5% | 7.5% | 2.7% | |
| Educational Level | Primary school | Secondary | Technical school | Technological education | University |
| 3.5% | 36.6% | 8.2% | 22.2% | 29.5% | |
| Occupation Status | Private sector employee | Public sector employee | Self-employed | Farmer/shepherd | |
| 18.5% | 20.8% | 22% | 2.2% | ||
| Pensioner | Student | Home keeper | Unemployed | ||
| 5.8% | 11.5% | 3% | 13.8% | ||
| Annual Income | ≤5000 € | 5001–10,000 € | 10,001–15,000 € | 15,001–20,000 € | >20,000 € |
| 14.2% | 14.2% | 15% | 7% | 6.8% | |
Table 2.
Modes of transportation and covered distance (km) in the city (sample size 400).
| N | Shorter Distance | Longer Distance | Mean Distance | Standard Error | |
|---|---|---|---|---|---|
| Walking | 316 | 0.5 | 20 | 3.34 | 3.064 |
| Public Transportation | 11 | 1 | 10 | 5.45 | 3.804 |
| Bicycle | 260 | 0.5 | 37 | 5.08 | 4.915 |
| Motorcycle | 117 | 1 | 50 | 8.41 | 8.375 |
| Car | 170 | 1 | 100 | 9.48 | 12.674 |
Table 3.
Distance for trips made by car or motorcycle (sample size 400).
| Distance (km) | Percent (%) | Cumulative (%) |
|---|---|---|
| <0.1 | 16.5 | 16.5 |
| 0.1 | 0.3 | 16.8 |
| 0.3 | 0.2 | 17.0 |
| 0.5 | 1.2 | 18.2 |
| 1 | 4.8 | 23.0 |
| 1.5 | 4.8 | 27.8 |
| 2 | 9.5 | 37.2 |
| 3 | 13.0 | 50.2 |
| 4 | 9.5 | 59.8 |
| 5 | 40.2 | 100.0 |
Table 4.
Evaluation of the existing cycle infrastructure (sample size 400).
| Infrastructure Facilities | Very Good | Good | Mediocre | Bad | Very Bad |
|---|---|---|---|---|---|
| Cycle network in the city | 7.5% | 4.5% | 29.2% | 32.5% | 26.2% |
| Place for parking | 5.8% | 5.0% | 22.8% | 38.8% | 27.8% |
| training places for children | 5.5% | 4.8% | 17.2% | 38.0% | 34.5% |
| Cycle network out of the city | 3.2% | 4.0% | 17.5% | 38.0% | 37.2% |
Table 5.
Residents’ evaluation of state and local bodies for supporting cycling (sample size 400).
| Absolutely Sufficient | Sufficient | Insufficient | Absolutely Insufficient | |
|---|---|---|---|---|
| Local authorities | 0.5% | 9.5% | 58.5% | 31.5% |
| State | 0.5% | 5.0% | 51.0% | 43.5% |
| Cycling clubs | 8.0% | 48.8% | 35.2% | 8.0% |
Table 6.
Positive factors influencing residents to cycle (sample size 400).
| Variables-Positive Factors of Cycling | Mean | Standard Error |
|---|---|---|
| Convenient transportation and parking | 9.09 | 1.870 |
| Reduction of traffic jam | 8.92 | 1.863 |
| Reduction of noise pollution | 9.22 | 1.660 |
| Less contribution to atmospheric pollution | 9.41 | 1.514 |
| Improvement of social communication | 7.53 | 2.719 |
| Improvement of general health | 9.44 | 1.225 |
| Ecofriendly lifestyle-example for children | 9.21 | 1.508 |
| Save money | 9.42 | 1.421 |
Table 7.
Factor analysis loadings after rotation (bold numbers show the factor that belong to each variable).
Table 7.
Factor analysis loadings after rotation (bold numbers show the factor that belong to each variable).
| Variables: Factor Loadings | ||
|---|---|---|
| 1 | 2 | |
| Convenient transportation and parking | 0.543 | 0.350 |
| Reduction of traffic jam | 0.377 | 0.681 |
| Reduction of noise pollution | 0.176 | 0.876 |
| Less contribution to atmospheric pollution | 0.161 | 0.864 |
| Improvement of the social communication | 0.460 | 0.426 |
| Improvement of the general health | 0.752 | 0.151 |
| An eco-friendly lifestyle-example for children | 0.811 | 0.161 |
| Save money | 0.773 | 0.227 |
Table 8.
Evaluation of negative factors influencing residents to cycle.
| Variables: Negative Factors of Cycling | Mean | Standard Error |
|---|---|---|
| Deficiencies to moving because of insufficient infrastructure | 7.52 | 2.611 |
| Exposure to extreme weather conditions | 6.88 | 2.864 |
| Low speed | 4.65 | 3.026 |
| Safety hazard | 6.29 | 2.987 |
| Feeling of oddity | 2.45 | 2.514 |
| Physical exhaustion | 3.83 | 2.798 |
| Lonesome on the route | 4.40 | 3.026 |
Table 9.
Factor analysis loadings after rotation (bold numbers show the factor that belong to each variable).
Table 9.
Factor analysis loadings after rotation (bold numbers show the factor that belong to each variable).
| Variables: Factor Loadings | ||
|---|---|---|
| 1 | 2 | |
| Deficiencies to moving because of insufficient infrastructure | −0.092 | 0.816 |
| Exposure to extreme weather conditions | 0.181 | 0.781 |
| Low speed | 0.530 | 0.493 |
| Safety hazard | 0.380 | 0.324 |
| Feeling of oddity | 0.801 | −0.047 |
| Physical exhaustion | 0.818 | 0.123 |
| Lonesome on the route | 0.772 | 0.109 |
Table 10.
Interpretation of the clusters’ observations (Sp: Standard error of proportion).
| Variables | Cluster 1 | Cluster 2 | Cluster 3 |
|---|---|---|---|
| Benefits for the user | Affected (marginally) | Not affected | Affected |
| Benefits for the society | Not affected (marginally) | Not affected | Affected |
| Charge for the user | Affected (marginally) | Affected | Not affected |
| Deficiency of infrastructures | Affected | Not affected | Not affected |
| Use of bicycle | Rarely-never | Always-sometimes | Always-sometimes |
| With the check of Pearson’s X2 | |||
| Suitability of the city for cycling | Enough–not at all | Enough–not at all | Very sufficiently-sufficiently |
| The use of the bicycle in the pedestrian zone | No | Yes | Yes |
| Financing from the state for buying bicycle | Not accept | Not accept | Accept |
| Influence by the others’ residents bicycling | No | No | Yes |
| Bicycle owner | No | Yes | Yes |
| Bicycle driver | No | Yes | Yes |
| Age | 31–50 years | 18–30 years | >50 years |
| With analysis of variance One-Way ANOVA | |||
| Transportations in the city by walking | mean 2.324 km sp 3.7155 | mean 3.857 km sp 3.9752 | mean 2.452 km sp 2.2096 |
| Transportations in the city by cycling | mean 0.241 km sp 1.9377 | mean 4.524 km sp 5.2482 | mean 4.514 km sp 4.7976 |
| Transportations in the city by car | mean 6.509 km sp 12.9705 | mean 2.222 km sp 4.0777 | mean 3.163 km sp 6.8712 |
© 2018 by the authors. Licensee MDPI, Basel, Switzerland. This article is an open access article distributed under the terms and conditions of the Creative Commons Attribution (CC BY) license (http://creativecommons.org/licenses/by/4.0/).
Share and Cite
MDPI and ACS Style
Karanikola, P.; Panagopoulos, T.; Tampakis, S.; Tsantopoulos, G. Cycling as a Smart and Green Mode of Transport in Small Touristic Cities. Sustainability 2018, 10, 268. https://doi.org/10.3390/su10010268
AMA Style
Karanikola P, Panagopoulos T, Tampakis S, Tsantopoulos G. Cycling as a Smart and Green Mode of Transport in Small Touristic Cities. Sustainability. 2018; 10(1):268. https://doi.org/10.3390/su10010268
Chicago/Turabian StyleKaranikola, Paraskevi, Thomas Panagopoulos, Stilianos Tampakis, and Georgios Tsantopoulos. 2018. "Cycling as a Smart and Green Mode of Transport in Small Touristic Cities" Sustainability 10, no. 1: 268. https://doi.org/10.3390/su10010268
Note that from the first issue of 2016, this journal uses article numbers instead of page numbers. See further details here.