Article

Carbon Dioxide Emissions of Spectators’ Transportation in Collegiate Sporting Events: Comparing On-Campus and Off-Campus Stadium Locations

by
Stavros Triantafyllidis
1,*,
Robert J. Ries
2 and
Kyriaki (Kiki) Kaplanidou
1
1
Department of Tourism, Recreation and Sport Management, University of Florida, 300 Florida Gym, P.O. Box 118208, Gainesville, FL 32611, USA
2
M.E. Rinker Sr. School of Construction Management, University of Florida, 332 Rinker Hall, P.O. Box 115703, Gainesville, FL 32611-5703, USA
*
Author to whom correspondence should be addressed.
Sustainability 2018, 10(1), 241; https://doi.org/10.3390/su10010241
Submission received: 9 November 2017 / Revised: 6 January 2018 / Accepted: 12 January 2018 / Published: 18 January 2018
(This article belongs to the Special Issue Leisure, Tourism, Sport and Community Development)

Abstract

:
Carbon dioxide (CO2) emissions related to spectator’s transportation to collegiate football events is a significant consideration in the overall carbon footprint of collegiate sporting events. Transportation mode affects CO2 emissions per spectator and stadium location, specifically on- and off-campus locations affect the transportation mode chosen by spectators. The quantity of CO2 emissions generated from spectators’ transportation to collegiate sporting events at an on-campus university stadium is compared to off-campus stadium. The transportation modes and miles traveled by spectators were modeled with GREET 2016 to estimate CO2 emissions. Significant differences were found between the two stadium locations regarding the spectators’ choice of transportation mode and distance traveled. Implications are presented for environmental sustainability and planning.

1. Introduction

The generation of greenhouse gas (GHG) emissions due to human activities is one of the leading causes of environmental degradation [1]. A significant portion of GHG emissions is created through transportation [1]. People’s choice of transportation mode impacts environmental sustainability, and ultimately environmental quality [2,3,4]. The generation of GHG emissions contributes to climate change and 82% of GHG emissions are carbon dioxide (CO2) [1,5]. Previous research corroborates that spectator’s choice of mode for traveling to sporting events has a significant negative impact on environmental sustainability [1,6,7]. Sports are a large part of society and a catalyst for human behaviors, which indirectly and negatively affect the environment [8]. The United Nations commented: “sporting events, sport facilities, sport activities and manufacture of sporting goods have an impact on natural environment” [9]. When individuals participate in sporting events, the natural environment is impacted [10]. The negative impact on environmental sustainability can be attributed to sport facilities’ operation, the consumption of products and services at sporting events and the transportation modes used by participants to travel to sporting events [4,11].
Previous studies have highlighted that sporting events have become a negative contributor towards environmental degradation [2,3,12,13,14,15,16,17]. Exploring specific domains of impact, such as transportation of spectators, is very important. Edwards and colleagues [17] identified spectator transportation as the major contributor to carbon emissions of a collegiate sporting event and a recent study investigated the CO2 emissions generated from spectator’s travel to football (soccer) games in England [18]. Research can provide significant insights into spectator’s travel behaviors and potentially result in reducing CO2 emissions.
Sporting event participants can be classified as passive (e.g., spectators) and active (e.g., athletes) participants [19,20]. Passive sporting event participants can be defined as those who travel to attend an event, but are not the athletes directly participating in the sport or activity at the event [20]. The current study excludes public officials, teams, medical, and support staff [15,17,18]. About 35 million spectators attended NCAA Division I Football Bowl Subdivision collegiate football events and 49 million attended all Division I football events in 2016 [21]. A large number of participants concentrated in a place for a short period of time has a significant impact on the environment, which can be estimated by the quantity of CO2 emissions generated by related activities [10,22,23]. One factor to consider is stadium location relative to spectator transportation, as some universities’ football stadiums are located on-campus, whereas other university’s stadiums are located off-campus [24].
Transportation modes used by spectators attending sporting events may generate CO2 emissions through the burning of fossil fuels [25] or may be CO2 emission free such as biking and walking [17]. Sometimes, spectators travel 100 miles or more to attend a sporting event, watch their favorite team compete, and then travel the same distance back to their homes [4,17,20,25]. In the leisure, tourism and sport literature, sporting event participants who travel over 100 miles are considered “sporting event tourists” [20,26]. It is necessary for sporting event tourists to choose transportation modes, e.g., airplane, car, bus, or train, to get to the sporting event [20,25].
To better understand the environmental impact of transportation modes used by spectators, this study investigated the transportation mode differences between an on-campus collegiate football event (on-CFE) and an off-campus collegiate football event (off-CFE). Analyzing these two different stadium locations provided clearer insight on how spectator’s transportation mode influenced CO2 emissions and if stadium location changes CO2 emissions per spectator and ultimately environmental sustainability.
The geolocation of collegiate football events can play a significant role in a spectators’ decision to attend the event or not [27]. Literature has yet to substantiate the environmental impact of spectators’ chosen form of transportation with regard to the location of a collegiate football event [27,28]. Based on urban planning theory, the on-CFE can be considered a high-density area and the off-CFE can be considered a low-density area [29]. This is important because campuses are considered to be small cities, where the infrastructure of buildings, roads, and public transportation simulate urban characteristics [29]. In contrast, off-campus stadiums are usually located in a suburban low-density area, where infrastructure, roads and public transportation are less dense [29]. Although there are collegiate stadiums located off-campus in high-density areas, the off-CFE that the study explored was in a low-density area. The following research questions guided the study:
RQ1: How do CO2 emissions differ in an on-campus collegiate football event (on-CFE) (high-density area) versus an off-campus collegiate football event (off-CFE) (low-density area)?
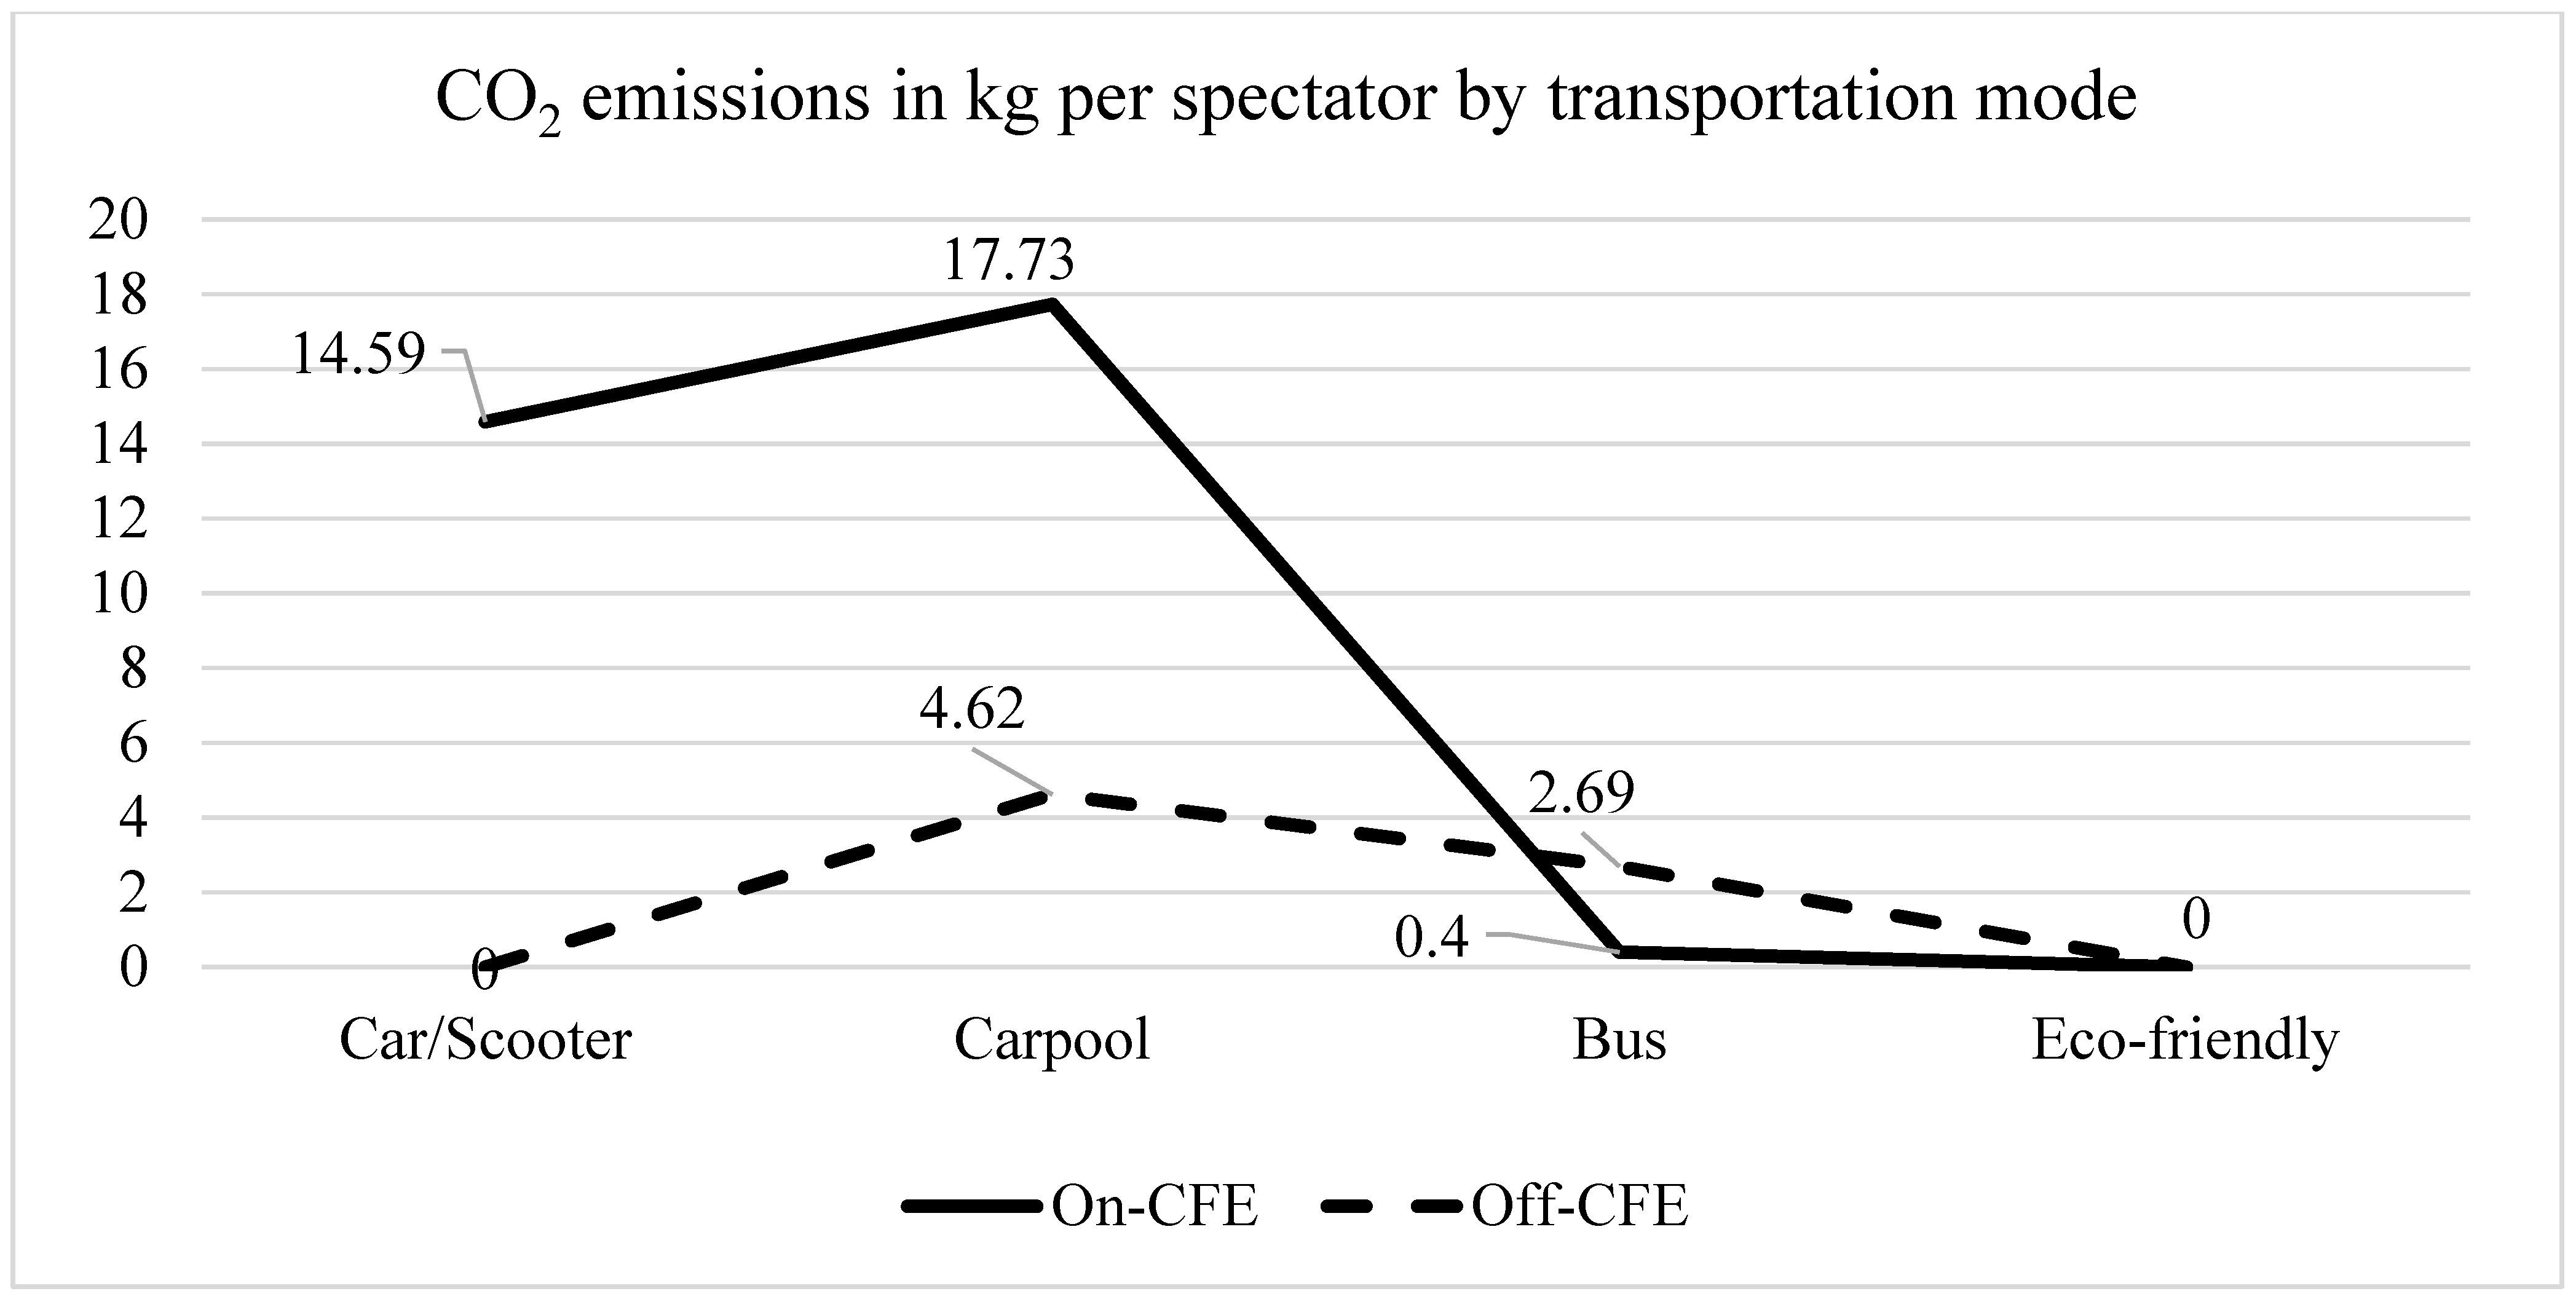
RQ2: How do CO2 emissions by transportation mode differ in an on-CFE versus an off-CFE?
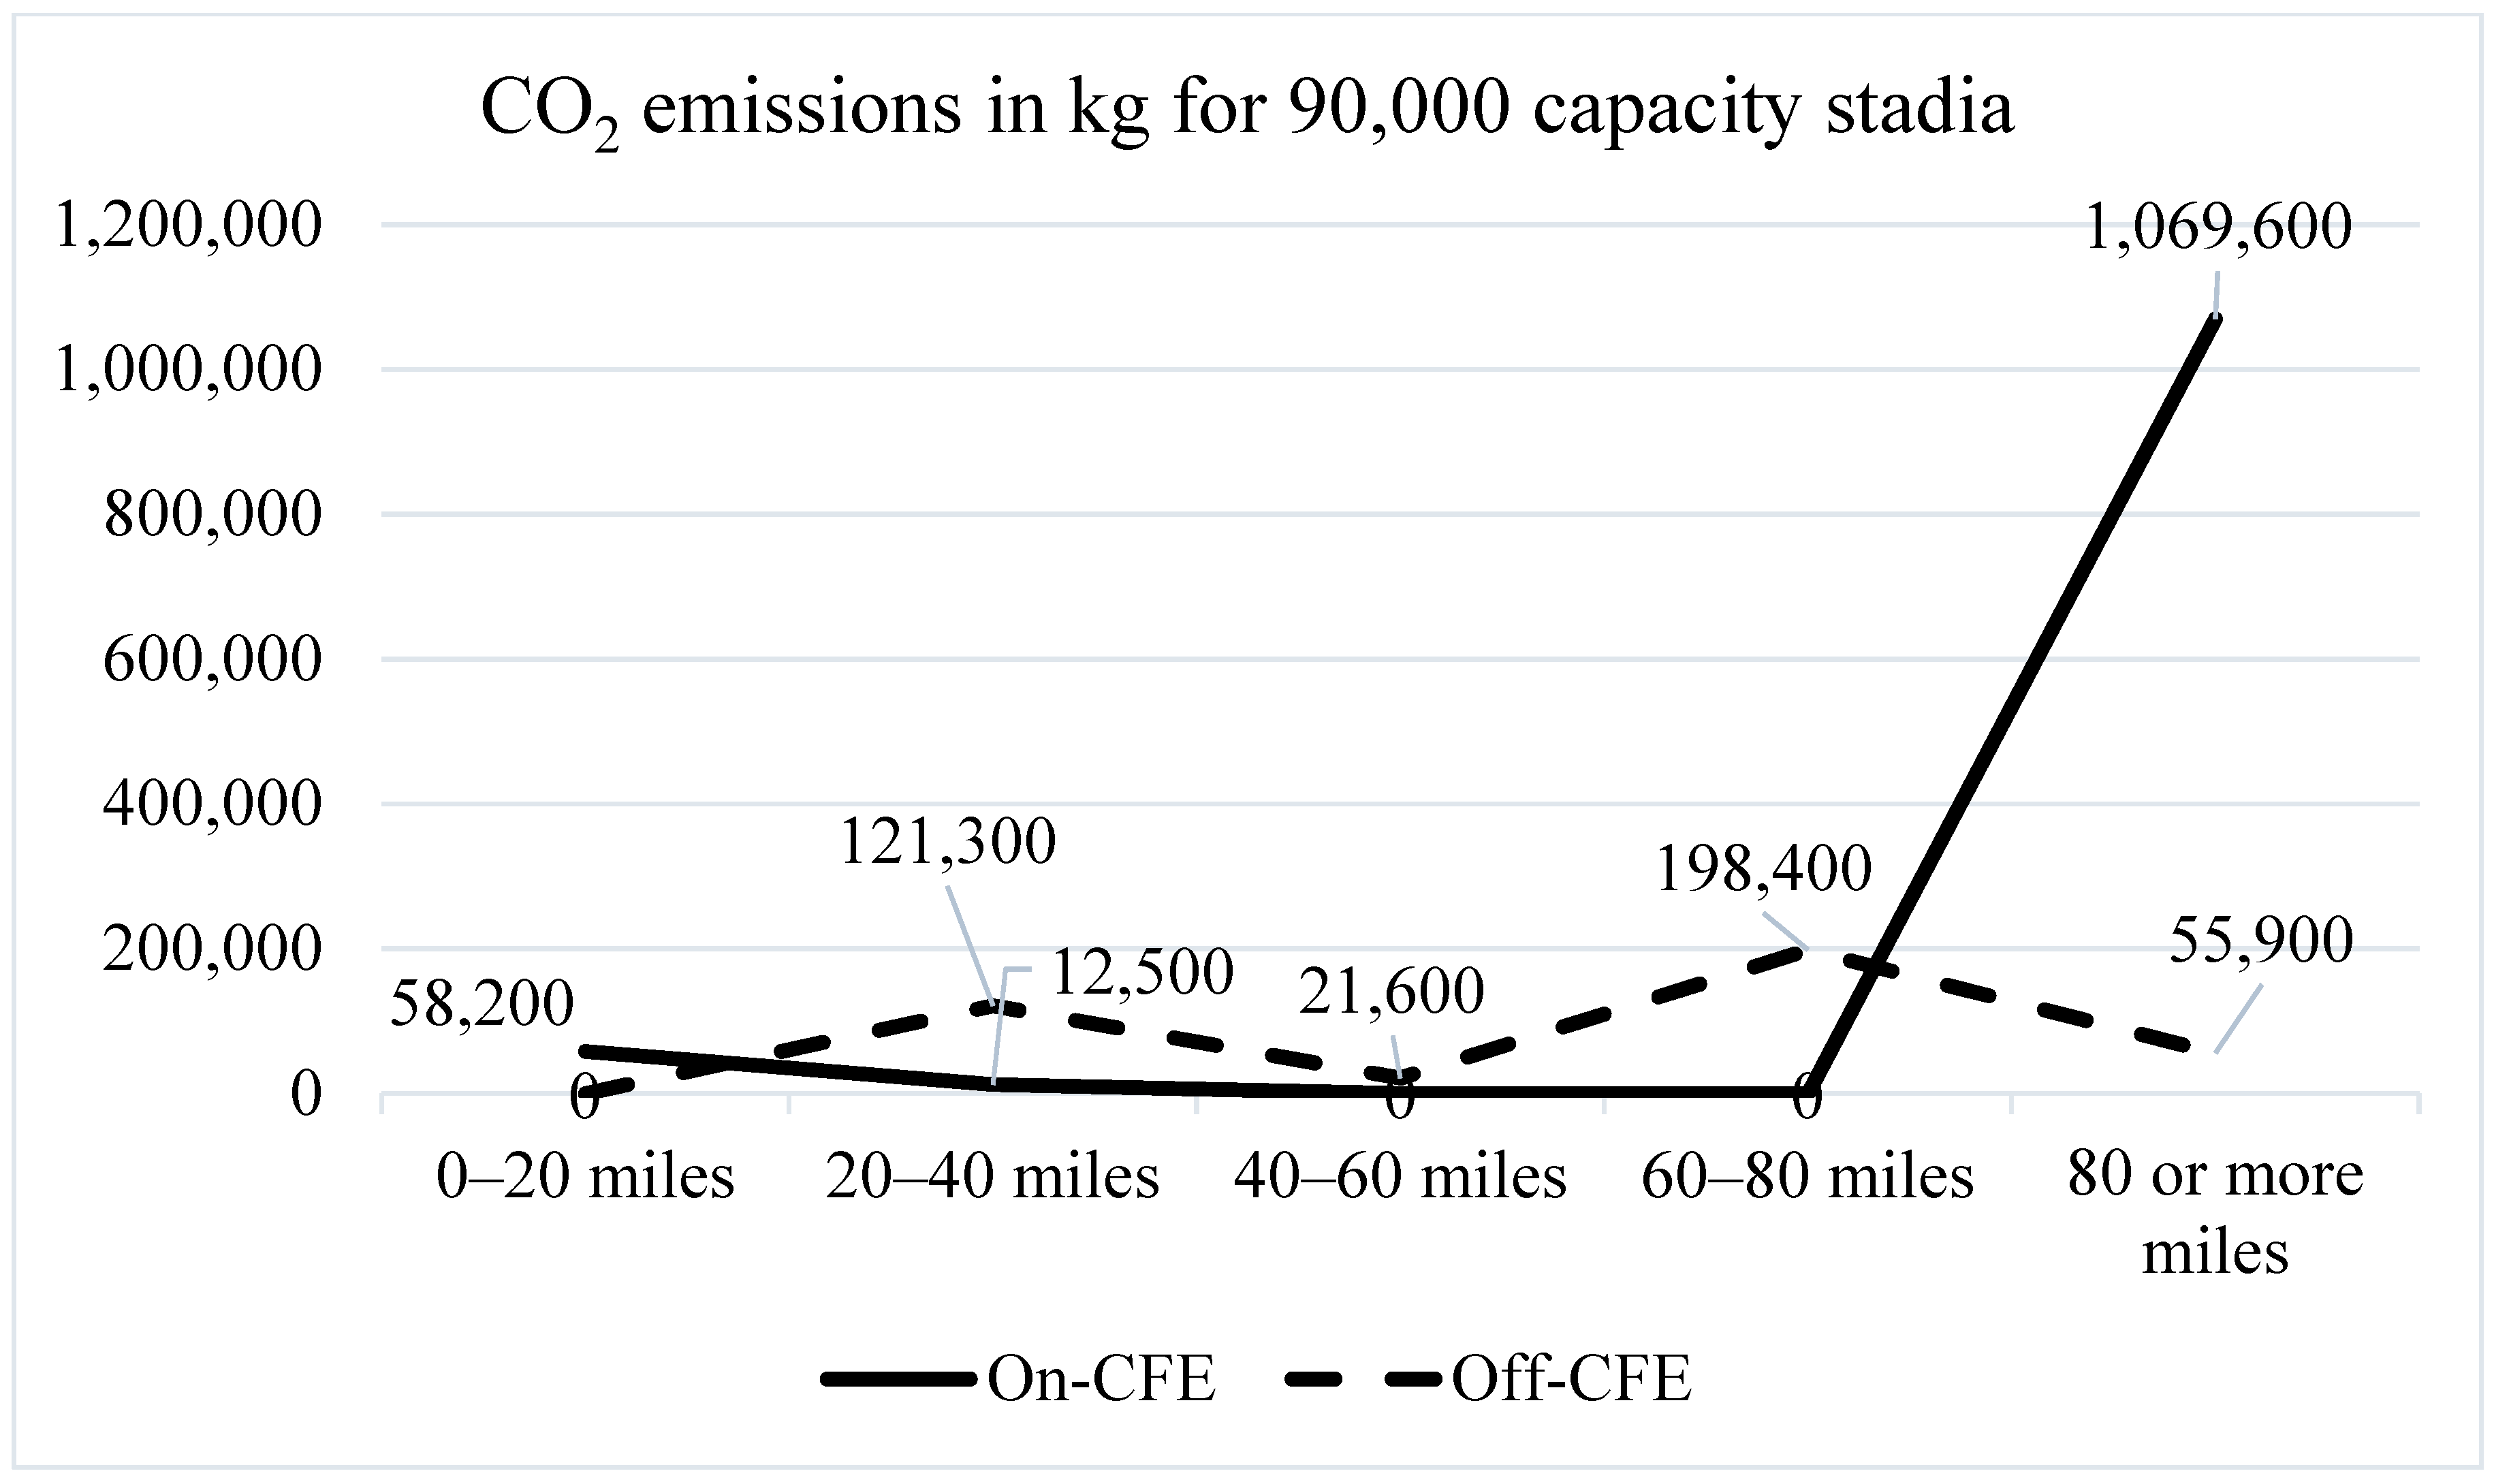
RQ3: How do CO2 emissions by miles traveled groups differ in an on-CFE versus an off-CFE? If we assume equal capacity (90,000 spectators) for both stadiums, were there differences in CO2 emissions for an on-CFE versus an off-CFE?

1.1. Environmental Impact and Sporting Events

1.1.1. Carbon Dioxide Emissions

The primary GHG emissions to the earth’s atmosphere are 82% CO2, 10% methane (CH4), 5% nitrous oxide (N2O) and 3% fluorinated gases [1]. A method for assessing GHG impact is estimating the quantity of CO2 emissions [1], and environmental impact generally is estimated by examining substances released to the environment because of human activities [30]. The carbon footprint is a term used to refer to the total amount of CO2 emissions that are generated by a product, activity, or population [31], and the greater the CO2 emissions released to the atmosphere, the greater the impact on the environment [30]. One of the contributing factors to the carbon footprint and a direct contributor to CO2 emissions generation [31] is vehicular transportation, such as cars and buses [32]. Studies support that spectators’ transportation to sporting events has a major environmental impact [3,5,17]. This can be seen first-hand during sporting events as spectators use a variety of transportation modes to attend a particular event at a particular stadium location, i.e., on-CFE and off-CFE [4].

1.1.2. Sporting Event Activities That Generate Carbon Dioxide Emissions

Sporting events are means of entertainment that have gained tremendous popularity in the US throughout the last century [33,34]. It is important to note that transportation to and from sporting events is not the only contributing factor to CO2 emissions for this scenario [12]. Construction and operation of sporting event facilities, as well as spectators’ food and beverage consumption are also factors that contribute to CO2 emissions [4,12,27]. American collegiate football events share the aforementioned sporting event characteristics [25]. In terms of facility use during sporting events, stadiums require energy in order to function effectively, with increased usage of air conditioning, water and electricity [12]. Spectators consume a variety of food and beverages during sporting events, resulting in the generation of waste that must be disposed of, which contribute to the release of CO2 emissions [25]. Lastly, the spectators’ transportation modes have been estimated to be responsible for the majority of CO2 emissions released as a result of a sporting event [4,17]. The current study compared the impact of transportation to collegiate football events at two stadium locations with different urban characteristics.
As noted earlier, literature has previously substantiated how sporting events generate a carbon footprint, but literature is limited on collegiate football events specifically [3,16,17]. For example, Collins and her colleagues (2007) [2] explored the total carbon footprint generated during the 2004 Football (soccer) Association Challenge (FA) cup final in the United Kingdom. The study found that the carbon footprint created by 70,000 spectators amounted to approximately 560 metric tons of CO2 emissions, with each spectator contributing about 7.67 kg of CO2 emissions [2]. Additionally, they found that the 2004 Wales Rally event generated approximately 1260 metric tons of CO2 emissions in total; approximately 20.2 kg per spectator [3] and estimated that the 2007 Tour de France generated 144,120 tons of CO2 emissions, approximately 50.5 kg per spectator [16]. For the last two events, the number of spectators and visitors was varied, as both events last multiple days [2]. Therefore, the estimation of the total number of spectators was based on calculations from both the opening ceremony and the prologue, which was about 50,000 spectators in both cases [2]. Dolf and Teehan found that spectators contributed 960 metric tons of CO2 emissions over one season, about 24 kg per spectator [4]. Finally, work by Edwards and colleagues found that travel related to a homecoming collegiate sporting event generated 1.97 and 1.48 metric tons of CO2 emissions in 2012 and 2013, respectively [17].

1.1.3. Spectators’ Transportation and Carbon Dioxide Emissions

Transportation mode is defined as means by which an individual accesses or travels from one place to the next [7,35]. Examples of transportation modes are airplanes, cars, trains, buses, bicycles, and walking [7,35]. Transportation is an important factor as spectators travel sometimes hundreds of miles just to attend a single sporting event [20]. For example, in 2010 Olympic Winter Games in Vancouver, 268,000 metric tons of CO2 emissions were generated with transportation modes to and from the event representing 70% or 187,000 metric tons of those emissions [4]. In the 2010 World Cup in South Africa, transportation contributed 2.8 million metric tons of CO2 emissions, accounting for 86% of the overall emissions [36,37,38]. Lastly, transportation was responsible for more than 90% of all the CO2 emissions that were generated by all sporting events in Germany in 2005 [7]. From the 25.6 million spectators that attended sporting events in 2005, around 210,000 metric tons of CO2 emissions were estimated to have been generated or about 8 kg of CO2 per person per event [7]. Both Collins and colleagues and Edwards and colleagues [2,3,17] noted that transportation modes used by spectators have the most significant impact on the environment due to the high quantity of CO2 emissions that are emitted during these events [2,3,17].

1.2. Theory and Hypotheses Development

1.2.1. Environmental Sustainability

Transportation is a major factor contributing to the depletion of resources and negative impact on environmental sustainability as non-renewable resources, e.g., fossil fuels, are used to support transportation [39,40]. For instance, automobiles burn fossil fuels which causes CO2 emissions to be released [1]. Hence, spectator’s use of transportation for attending collegiate football events is an action that impacts the environment [35,36,37,38,39,40,41].

1.2.2. Planning Theory and Urban Planning

Planning theory refers to the scientific concepts that define the body of knowledge of urban planning [42]. The origin of urban planning lies in the movement that arose as a reaction to the disorder of the industrial city in the 19th century [43]. Urban planning includes urban renewal, which is the implementation of planning strategies for cities that may suffer from industrial decline [43]. However, urban planning also includes the opposite end of the spectrum, challenges that arise with accelerated urban growth [42,43]. In the urban planning literature, research has been conducted across areas such as sustainability, geography and health [44,45]. The term “sustainable development” has been commonly used to represent the balance of planning goals and the environment creating a harmonious state [45]. When discussing urban planning, the term “urban density” is often referred to and can be defined as the number of people that inhabit a specified area [44]. Urban density is considered a critical factor in understanding how cities function [42,43,44,45,46,47].

1.2.3. High Density and Low-Density Areas and Transportation

High-density areas (e.g., cities) and low-density areas (e.g., rural areas) heavily influence decision making when determining choice of mode [48]. Chen, Gong and Paaswell (2008) [48] highlighted that density is a key component in developing a neighborhood’s infrastructure, and leads to considerations such as public transportation systems and bicycle lanes. Chen et al. (2008) [48] also discussed that the use of cars in a high-density area is lower than in a low-density area due to more traffic, inconvenience, and space limitations. Moreover, cost variables, job locations, and transit accessibility are additional factors that influence people’s behaviors regarding choice of transportation mode [47,48]. Specifically, people in high-density areas tend to use transportation modes with lower CO2 emissions per person and distance traveled than people in low-density areas [46,48]. In this study, the differences in environmental impact due to transportation will be tested in both a high-density area and a low-density area. For the purposes of this paper, on-CFE represents a high-density area (e.g., transit accessibility), whereas off-CFE represents a low-density area (e.g., lack of public transit infrastructure and accessibility) [45,46,47,48]. Based on previous literature concerning urban planning, it is expected that the environmental impact due to transportation in an on-CFE will be less than an off-CFE [45,46,47,48].
Research has shown that the environmental pollution generated from transportation modes in high-density areas is far less than the amount of pollution generated in low-density areas [48]. The reasoning behind this difference is that there are more alternative, low CO2 forms of transportation in a high-density area, so there is less impact due to CO2 emissions overall [46,48]. High-density and low-density areas have a large or small number of residents respectively, where their activities emit CO2 emissions to the atmosphere primarily because fossil fuels are used for industry, and for providing food, shelter, and transportation [40,41,44]. Overall, transportation contributes about 31% of CO2 emissions generated in the US annually [1]. The remainder is due to other industrial activities, building operation, agriculture, and trade [1]. Vehicles generate CO2 emissions, and the greater the miles traveled, the greater the CO2 emissions [1].
The expectation is that the location of sporting events impact CO2 emissions, i.e., CO2 emissions per spectator will be significantly different and higher in an off-CFE compared to an on-CFE, considering and comparing transportation modes used and miles traveled. Total CO2 emissions generated are compared using hypothetical stadiums with an equal capacity of 90,000 spectators.

2. Materials and Methods

2.1. Description of Study Sites

Data on the transportation mode choices of spectators at an on-CFE were collected from the campus of a southeastern university with a student population of approximately 52,300. This campus was classified as a high-density area due to its on-campus football stadium and developed infrastructure [44,46,48]. The campus provides easy access for transportation and parking lots that are available for use during the time of the sporting event [49]. There is also a bus system that provides easy access to the stadium, with routes that frequently pick up and drop off on campus [49]. The on-CFE also has well designed bike lanes with designated bike parking and paved sidewalks for pedestrian use [49]. Lastly, the campus includes living accommodations for students, a hospital, various restaurants, a hotel and other athletic facilities that also have characteristics of a high-density area [46,47,48,49].
Data on the off-CFE were collected from the area surrounding the stadium of a US southeastern university. The stadium is located off-campus in a suburban area, 22.1 miles away from the university campus [49]. The transportation system surrounding the campus and the stadium is limited [49]. There are reasonable accommodations for parking both cars and chartered buses [49], however there are no options for public transportation, leaving cars and chartered buses as the main form of transportation. Thus, due to the limited availability of transportation options and the lack of infrastructure, this off-CFE can be classified as a low-density area [48,49].

2.2. Data Collection

2.2.1. Participants and Procedures

On-site, face-to-face survey questionnaires were used to collect data from spectators at these two collegiate football events. Participants were over 18 years old, both males and females and residents of the US. Data were collected outside of the stadium, in areas where spectators tailgate and enter the stadium. Participants were given a brief explanation of the study’s purpose and they were assured that all responses would be completely anonymous and confidential. The researcher asked each participant equations on the following: (1) transportation modes used to attend the event; (2) the number of people that were in the vehicle when appropriate; and (3) where travel originated and/or miles traveled. Data pertaining to demographics were also collected, such as gender and affiliation, e.g., student, alumni, or unaffiliated (see Appendix A).

2.2.2. Spectators’ On-Site Survey

Participants were randomly selected from the designated areas. Sample population was the target population, and the researcher asked each potential participant if they were ticket holders or just tailgating. For both collegiate football events, the sample population included those spectators who were ticket holders. The sample population surveyed from both events was N = 488; on-CFE was n = 253 and the off-CFE was n = 235.

2.3. Measures

2.3.1. Independent Variables

The on-site survey questionnaire aimed to measure the independent variables which were the stadium location (e.g., Group 1: on-CFE; and Group 2: off-CFE), the transportation modes (e.g., Group 1: car/scooter; Group 2: carpool; Group 3: bus; and Group 4: eco-friendly) and miles traveled (e.g., Group 1: 0 to 20; Group 2: 20 to 40; Group 3: 40 to 60; Group 4: 60 to 80; and Group 5: 80 or more miles).

2.3.2. Dependent Variable

The dependent variable was the mass of CO2 emissions generated by the participants as they traveled to the collegiate football events. The CO2 emissions generated by mode were calculated using GREET 2016, a life cycle analysis tool developed by the Argonne National Laboratory (ANL) [50].

2.4. GREET Model 2016

In 1995, the US Argonne National Laboratory (ANL) developed the Greenhouse Gases Regulated Emissions and Energy use in Transportation (GREET) model [50,51,52,53,54,55,56]. The GREET model was originally developed to serve as an analytical tool [52,53,54,55,56]. and was used mainly by different researchers and practitioners that were aiming to estimate the fuel cycle energy use and the emissions related to ethanol fuels, alternative transportation fuels and new vehicle technologies (e.g., electric cars) [52,53,54,55,56]. In June 1996, ANL released the first version of GREET and the model has been further developed since then [52,53,54,55,56].
GREET provides an analysis of GHG emissions of fuel production and consumption stages, using default assumptions and has been used to estimate the GHG generated by transportation [48,49]. ANL [50] also developed the GREET Fleet Footprint Calculator to help stakeholders estimate the GHG generated by transportation [50,51] which was used to estimate the CO2 emissions generated from the vehicles in the current study.

2.5. Data Analysis

Data were screened, cleaned and the variables were defined and then analyzed using Statistical Package for Social Science (SPSS) software [57]. Descriptive statistics with cross tabulations were generated to examine the variable distributions for both the on-CFE and the off-CFE. Furthermore, the distribution of spectators’ transportation modes used and mileage traveled were calculated. Descriptive statistics were provided to examine the mean values and standard deviations (SD) of the independent variables and the dependent variable. Data were scanned for independence, possible outliers and normality; the homogeneity of variance of each of the groups was analyzed using Levene’s test.

2.5.1. Descriptive Statistics

Descriptive statistics are presented in Table 1, Table 2 and Table 3. Table 1 shows the demographic information, Table 2 illustrates the mean CO2 for the four different transportation modes used by spectators, and Table 3 depicts the mean CO2 of the five ranges of miles traveled in two stadium locations.

2.5.2. Independent t-Test and One-Way Analysis of Variance (ANOVA)

The differences in the quantity of CO2 emissions between the two stadium locations was examined. The results of the independent t-test are shown in Table 4. An independent t-test explored the differences in total CO2 emissions generated for both on-CFE and an off-CFE based only on the common transportation modes used by spectators (i.e., carpool and bus) in the two stadium locations; the results are illustrated in Table 5 and Figure 1. The differences in CO2 emissions generated by transportation mode choice in the on-CFE were explored through one-way ANOVA; in addition, the post-hoc comparison is presented (see Table 6 and Table 7). An independent t-test was conducted to investigate the differences between carpool and bus modes in the off-CFE (see Table 8). A t-test was used as only the “20 to 40 miles” group was common for both locations. Results of the t-test are presented in Table 9 and the distribution of all the miles traveled groups is shown in Figure 2. Lastly, mean CO2 by transportation mode and mileage groups was used to compare CO2 emissions when stadium attendance was scaled to 90,000 in each case (see Table 10 and Figure 3).

2.5.3. Carbon Dioxide Emissions per Person per Mileage Group and Stadium Location

The average CO2 emissions in kg per spectator per mileage group and stadium location is calculated using Equation (1).
CO2 emissions in kg per person per mileage group per stadium location.
CO 2 i k kg   = j = 1 4 N i j k   ×   CO 2 i j k N i k
where i is the mileage groups: 0 to 20 miles, 20 to 40 miles, 40 to 60 miles, 60 to 80 miles, and 80 miles or more; j is the transportation modes: car/scooter, carpool, and bus, eco-friendly; k is the event/location: on-CFE and off-CFE; N i k is the number of people in mileage group i, in location k; N i j k is the number of people in mileage group i, using transportation mode j, in location k; and CO 2 i j k is the mean CO2 emissions per person, of transportation mode j, in mileage group i, in location k.

2.5.4. Carbon Dioxide Emissions per Person per Stadium Location with 90,000 Spectators

Since the event attendance at the on-CFE and the off-CFE were different, the spectators’ distance traveled by transportation mode were linearly scaled such that both places had equal, i.e., 90,000, spectator populations as shown in Equation (2).
CO2 emissions per person per stadium location with 90,000 spectators.
CO 2 k kg = i = 1 5 [   N i k N k ×   90 , 000 ×   CO 2 i k   ]
where CO 2 i k is the carbon dioxide emissions from transportation in mileage group i, in location k; i is the mileage groups: 0 to 20 miles, 20 to 40 miles, 40 to 60 miles, 60 to 80 miles, and 80 miles or more; k is the event/location: on-CFE and off-CFE; N i k is the number of people in mileage group i in location k; and N k is the attendance at location k.

3. Results

3.1. Demographics

Gender demographics were similar in both on-CFE and off-CFE (see Table 1). However, the percentage of students at the on-CFE was 59%, whereas, at off-CFE, students represented only 19% of spectators. For the on-CFE, 20% of spectators were alumni, 18% were unaffiliated spectators and 3% were parents, whereas for the off-CFE 45% were alumni, 36% were unaffiliated spectators, and no parents of students were in the sample population (see Table 1).

3.2. Descriptive Statistics

Results of the cross-tabulations for the transportation modes indicated that for the on-CFE, 60% spectators carpooled and 23% used an eco-friendly mode of transportation, e.g., bike, longboard, or walk, with zero CO2 emissions. The results for the off-CFE indicated that 91% of spectators carpooled or used a car service to attend the event and 9% used buses (see Table 2). No spectators walked or biked to the off-CFE. For the miles traveled by spectators for the on-CFE, 66% traveled “0 to 20 miles”, 2% traveled “20 to 40 miles” and 32% traveled “80 miles or more”. For the off-CFE, 47% of the spectators traveled “20 to 40 miles”, and 43% traveled “60 to 80 miles” (see Table 3). Most on-CFE spectators were either very close or very far from the stadium location.
Overall, the mean CO2 emissions per spectator for the on-CFE was (M = 12.67 kg, SD = 20.21 kg, n = 253) and (M = 4.46 kg, SD = 4.45 kg, n = 235) for the off-CFE (see Table 4). The mean CO2 emissions per spectator by transportation mode and location are shown in Table 2. Two differences between locations are: (1) for the carpool mode, the mean CO2 emissions per spectator for on-CFE was (M = 17.73 kg, SD = 20.44 kg, n = 151), whereas, for off-CFE, carpool mode was (M = 4.62 kg, SD = 4.68 kg, n = 214); and (2) the bus mode mean for the on-CFE was (M = 0.40 kg, SD = 0.18 kg, n = 8) versus (M = 2.69 kg, SD = 0 kg, n = 21) for the off-CFE (see Table 2).
The mean CO2 emissions per spectator for the miles traveled groups was similar for the “80 miles or more” group at both locations. Only the “20 to 40 miles” traveled group was common in on- and off-CFE, which was used for comparison.

3.3. Independent t-Test for Stadium Location

The dependent variable was measured in terms of kg CO2 emissions per spectator, and the values varied from 0 to 97.68 kg CO2 per spectator. An independent t-test revealed a significant difference in the mean CO2 emissions per person in the two locations (t (278.23) = 6.30, p < 0.01, 95% CI for mean differences 5.65 to 10.78) The on-CFE had a larger mean CO2 emission in kg per person (M = 12.67 kg, SD = 20.21 kg, n = 253) than the off-CFE (M = 4.46 kg, SD = 4.45 kg, n = 235). Consequently, the hypothesis was not supported. The results of the independent t-test are presented in Table 4.

3.4. Independent t-Test and One-Way ANOVA for Transportation Modes

3.4.1. Two Independent t-Tests for Common Transportation Modes

Two independent t-tests were conducted for the common transportation modes, namely carpool and bus. The CO2 emissions generated by the carpool group at the on-CFE (M = 17.72, SD = 20.71, n = 151) was compared to the carpool group off-CFE (M = 4.63, SD = 4.63, n = 214) and the bus mode at the on-CFE (M = 0.40, SD = 0.18, n = 8) was compared to the bus mode at the off-CFE (M = 2.68, SD = 0, n = 21). The CO2 emissions generated by the bus and carpool modes were compared across stadium locations. Results revealed a significant difference in the mean kg of CO2 emissions per person using the carpool and bus modes at the two locations: carpool had higher CO2 emissions at the on-CFE (t (161) = 7.64, p < 0.001, with 95% CI for mean differences 9.71 to 16.49) and bus had lower CO2 emissions at the on-CFE (t (7) = −35.47, p < 0.001, with 95% CI for mean differences −2.44 to −2.13) The results of the t-tests are presented in Table 5 and Table 6 and the results of the distribution of CO2 emissions by transportation mode are presented in Figure 1.

3.4.2. On-CFE Transportation Modes

The one-way ANOVA showed that there was a significant effect of transportation mode on CO2 emissions in the on-CFE (F (3, 249) = 13.627, p < 0.001). Therefore, the hypothesis was supported. The post-hoc Tukey HSD test indicated that the mean CO2 emissions per spectator for the car/scooter mode was not significantly different from carpooling (p = 0.806) and bus (p = 0.219). However, the car/scooter mode was significantly different from the eco-friendly mode (p < 0.002). Furthermore, the carpooling mode was significantly different from the eco-friendly mode (p < 0.001). Lastly, the eco-friendly mode was significantly different from both the car/scooter (p < 0.002), and carpool (p < 0.001); but not with the bus (p > 0.05). Table 7 and Table 8 shows the results of the one-way ANOVA.

3.4.3. Off-CFE Transportation Modes

In the off-CFE, spectators either used the bus or carpooled. A t-test was performed to compare carpooling (M = 4.58, SD = 4.64, n = 214) and bus (M = 2.68, SD = 0, n = 21) modes in the off-CFE. There was a significant difference in CO2 emissions per spectator for the off-CFE transportation modes (t (213) = 5.972, p < 0.001) Therefore, the hypothesis was supported (see Table 9).

3.5. Carbon Dioxide Emissions of Each Miles Traveled Group

The CO2 emissions per spectator of each mile traveled group was estimated for both the on-CFE and the off-CFE (see Figure 2).
An independent t-test was conducted to test the differences between the “20 to 40 miles traveled group” in an on-CFE (M = 7 kg, SD = 2.05 kg, n = 5) versus an off-CFE (M = 2.88 kg, SD = 1.12 kg, n = 110). The independent t-test revealed a significant difference in the mean CO2 emissions in kg per person that traveled 20 to 40 miles to attend an on-CFE versus an off-CFE (t (113) = 7.71, p < 0.001, 95% CI for mean differences 3.06 to 5.17) The on-CFE “20 to 40 miles” had greater mean CO2 emissions per person than the off-CFE and, consequently, the hypothesis was not supported. The results of the independent t-test are presented in Table 10.

3.6. Carbon Dioxide Emissions by Miles Traveled Groups with 90,000 Spectators

For H3b, a hypothetical 90,000 seating capacity stadium scenario for both on-CFE and off-CFE was created and the CO2 emissions extrapolated by using the mean CO2 emissions per person and number of spectators in each mile traveled group by stadium location, as shown in Equation (2). Over 90% of the on-CFE 90,000 capacity stadium model emissions are from the spectators traveling the furthest, representing about one-third of on-CFE spectators. In total, off-CFE had approximately one-third of the CO2 emissions of the on-CFE. The CO2 emissions per miles traveled group are presented in Figure 3.

4. Discussion

The study examined how differing collegiate football event locations—an on-campus stadium with the characteristics of a high-density area and an off-campus characterized as a low-density area—impact CO2 emissions from different transportation modes and distances traveled by spectators. Previous studies have focused on one university [4], mega-sporting events [3,6,16,36,37,38], and aggregate annual emissions for professional sports [7,18]. The findings revealed both meaningful and insightful information regarding the effects of stadium location, spectator’s transportation choices and miles traveled on CO2 emissions. The results include: (a) the difference in CO2 emissions generated by spectators’ travel; (b) the spectators’ choices of transportation mode; and (c) the different distances spectators travel to attend a collegiate football event in on- and off-campus settings.

4.1. Implications

4.1.1. Environmental Sustainability

The resulting research added new knowledge to sporting event literature with regards to the environmental sustainability and urban planning [27,42,45,58,59]. Specifically, CO2 emissions of sporting event transportation may not be exclusively aligned with urban planning theory. There is little to no existing literature that explores the impact of spectators’ transportation modes and miles traveled on CO2 emissions in different locations in collegiate football events. on-CFE (high-density area) had significantly higher CO2 emissions than the off-CFE (low-density areas) [48]. This contrasts with current literature, which found that transportation in high-density areas had less of an impact on the environment compared to low-density areas [46,48]. The high-density structure of the on-CFE location was not the only factor influencing CO2 emissions from spectators’ transportation. Although sporting events are most often associated with positive experiences, beautiful memories and symbolic meanings, it is important to recognize that such events simultaneously contribute to the generation of pollutants and consequently sporting events have indirect negative outcomes on environmental sustainability [3,27].

4.1.2. Planning

As far as planning is concerned, the study found that local planning in terms of transportation and density may not be sufficient to address CO2 emissions of sporting events. Spectators traveled further to attend the on-CFE (high-density area) in comparison to the off-CFE (low-density areas) and generated a larger amount of CO2 emissions traveling to an on-CFE. The largest amount of CO2 emissions was generated from spectators who traveled more than 80 miles to attend the on-CFE. This finding is inconsistent with literature in planning. According to studies, high-density areas have less than 20 miles’ radius and therefore people typically travel no more than 20 miles. However, when a sporting event takes place, people travel greater distances to attend the event. In sport management literature, there is no study that associates this phenomenon in concert with planning theories.
Non-students traveled the furthest to attend the on-CFE, and the non-student spectators identified as alumni [60]. Therefore, the negative environmental impact may be an outcome of an emotional bonding of alumni with the campus and stadium of the on-CFE [27]. The sense of place concept is a useful theoretical framework in concert with environmental sustainability and urban planning [27]. Spectators that traveled greater than 80 miles to attend the on-CFE can be identified as “sporting event tourists” [20,27].
Descriptive statistics indicated that most of the spectators that attended the off-CFE traveled between 20 and 40 miles. It can be assumed that spectators of the on-CFE preferred the stadium location more than the spectators of the off-CFE, perhaps because the on-CFE is the preferred location for event-related activities (e.g., tailgating) [27]. It can also be assumed that spectators in an on-CFE may subconsciously believe there is a perceived positive behavioral outcome associated with being on-campus and engaging in multiple social activities [27].
Urban planning should include external concepts and developments when identifying areas as sustainable. Urban planning should consider that in a sport context, a high-density area may not be environmentally friendlier than a low-density area, as people that are involved with sports have different perspective for sporting event attendance due to their emotional bonding with their favorite team, stadium, and university. Sport spectators may travel and use non-eco-friendly means of transportation to watch their favorite team. On the other hand, this may be beneficial for theoretical concepts in planning, as they can incorporate factors that represent human emotions and involvement.

4.2. Practical Implications

This study provided practical information to urban planners, university decision makers, stakeholders and sporting event marketers. Athletic facilities should be carefully designed and located with special attention to environmental impact and fan attachment to place and team, as millions of people use these facilities, especially for collegiate football, over the life of the stadium. Stadium location effects spectators’ transportation mode choice and CO2 emissions. Transportation modes and distances traveled by spectators largely influenced CO2 emissions. Results showed that there are differences in environmental impact among the transportation modes chosen by spectators. Public transportation, e.g., bus or metro, is the favored mode in a high-density area, and has less impact on the environment [61]. However, spectators in the on-CFE did not utilize carpooling as much as spectators in the off-CFE, i.e., many drove alone or used public transportation. Spectators in the off-CFE chose to carpool or use a bus. Moreover, it was found that carpooling was significantly different from eco-friendly modes in terms of CO2 emissions per person. Many on-CFE spectators preferred to use vehicles, even for short distances. This may indicate that spectators in the on-CFE did not consider the environment when choosing their transportation mode or it may just be more convenient to take the car. Spectators use cars and carpool more often, perhaps because they tailgate prior the game and therefore need a vehicle to transport food, drinks, games, television, etc.
At the off-CFE, findings showed that both carpool and bus modes impact CO2 emissions significantly. Spectators who took the bus generated significantly less CO2 emissions compared to spectators who carpooled. The off-CFE should aim to promote alternative ways for spectators to attend the event that will generate little to no CO2 emissions. Busses were provided by the off-CFE university for student transportation from the campus to the stadium. Supporting additional bus usage for non-students in addition would reduce CO2 emissions at the off-CFE. On-CFE spectators traveling greater than 80 miles primarily used cars, and there are opportunities to introduce bus and carpooling modes for longer travel distances. The off-CFE has a relatively expensive parking fee for cars. If sporting events’ parking has a high cost, spectators may be more likely to use public transportation if available and carpool. In terms of recommendations, both event locations should promote transportation alternatives with low to no associated carbon emissions, e.g., bus and eco-friendly modes compared to car/scooter and carpool modes, parking policies should be reviewed, e.g., on-CFE provides free parking on campus, and lastly, recognizing that the location of the event in an area that is urban, dense, and served by public transportation will not necessarily reduce the aggregate impact of spectator’s travel to and from the event without other policies and incentives [62].

“Miles Traveled” Group Impacts for Equal 90,000 Stadium Capacities

Spectators that traveled “80 miles or more” were responsible for generating 1,069,600 kg of 1,140,300 kg CO2 generated to travel to the on-CFE. Spectators that traveled 60 to 80 miles contributed 198,400 kg of 397,200 kg CO2 generated to travel to the off-CFE. Scholars and practitioners promote the construction of on-CFE because it is believed to have a greater benefit [12,63]. In terms of transportation CO2 emissions, this study shows that off-CFE can have lower emissions. Ultimately, it is important to consider all factors, theoretical frameworks, and their limitations when considering construction of stadiums. The strength of the attachment that spectators have with a campus or team may be very important, and it is not clear how influential stadium location is on inducing sport tourism.

4.3. Limitations

This study was conducted at two different collegiate football events in the southeastern US, where the capacities of the two stadiums were not equal—the on-CFE capacity was approximately 90,000, whereas the off-CFE capacity was approximately 64,300. Data were collected randomly in areas where spectators were tailgating, and the sample populations resulted in different distributions of students and non-students at the two locations. The off-CFE sample was 81% non-students, whereas the on-CFE was 59% students. This unequal distribution of students and non-students may affect the results. For the off-CFE, students used buses that were provided by the university’s transportation system and any travel to a bus stop was not accounted for. It was assumed that all students that used the bus were living on campus. In addition, none of the off-CFE spectators that were surveyed utilized eco-friendly transportation or drove alone with a car/scooter. Therefore, this provided no data to compare to the on-CFE in these transportation modes. The off-CFE only included carpoolers and bus users, where the carpoolers comprised of 93.5% of the sample population and bus users 6.5%. The current study examined the differences between an on-CFE and off-CFE by considering the off-CFE as a low-density area. An investigation of an off-CFE in a high-density area may provide additional insights. Finally, the study did not include the transportation impacts of members of the media, athletes and coaches, medical, security, officials, and other support staff.

4.4. Future Research

The ongoing research only examined the impact of spectator’s transportation choices when traveling to a sports event. To better understand the total impact of collegiate sporting events taking place at on-CFE and off-CFE, further research should focus on CO2 emissions generated by the facilities’ operation considering factors such as energy usage, water usage, and activities of participants and spectators during the sporting event. Future studies should also focus on generation of waste and food and beverage consumption. This will generate a better estimate of the overall impact that collegiate football events have on CO2 emissions and the environment. The survey was limited, and a future survey should gather more information on, for example, why the specific transportation mode was chosen. A future study should be conducted to explore the environmental impacts of an off-CFE that is in a high-density area.
Finally, studies in the US and Canada found distances traveled are greater on average than in England [18]. The average travel distance of spectator’s roundtrip travel was 116 miles or 186.7 km, comparable to Edwards and colleagues, who found an average travel distance of 124 miles or 199.8 km and Dolf and colleagues, who found an average travel distance of 116 miles or 186 km [4,17]. Roundtrip travel to football (soccer) events in England was found to be 25.8 miles or 41.5 km [18]. It is not clear if the differences are primarily caused by location, i.e., North America versus United Kingdom, or the context, i.e., collegiate versus professional.

Acknowledgments

The authors would like to express appreciation to University of Florida Open Access Publishing Fund (UFOAPF), as the publication of this article was funded in part by the UFOAPF.

Author Contributions

Stavros Triantafyllidis and Robert J. Ries conceived and designed the research, developed the analysis, and wrote the paper; Kyriaki (Kiki) Kaplanidou reviewed the article.

Conflicts of Interest

The authors declare no conflict of interest.

Abbreviations

On-CFEOn-campus collegiate football event
Off-CFEOff-campus collegiate football event
GHGGreenhouse Gases
CO2Carbon Dioxide
ANLArgonne National Laboratory
NCAANational Collegiate Athletic Association
GREETGreenhouse Gases Regulated Emissions and Energy use in Transportation
SPSSStatistical Package for Social Science
SDStandard deviation
USUnited States of America

Appendix A. Supplemental Information

Table A1. Questionnaire.
CasesTransportation ModesNumber of People Inside the VehicleMiles TraveledTime of Arrival at the VenueWatch Collegiate Football Events In-Stadium (Ticket Holders) or Just TailgateStudent or Non-StudentGender
Case # (Number)Car/Scooter
Carpool
Bus
Eco-Friendly
# (Number) of people# (Number) of MilesTimeTicket Holders
Just Tailgate
Student
Alumni
Other (Parents-not affiliated with the university)
Male
Female
# is the numerical number.

References

  1. United States Environmental Protection Agency. Greenhouse Gas Emissions. Available online: https://www.epa.gov/ghgemissi.ons/overview-greenhouse-gases (accessed on 26 January 2017).
  2. Collins, A.; Flynn, A. Engaging with the ecological footprint as a decision-making tool: Process and responses. Local Environ. 2007, 12, 295–312. [Google Scholar] [CrossRef]
  3. Collins, A.; Jones, C.; Munday, M. Assessing the environmental impacts of mega sporting events: Two options? Tour. Manag. 2009, 30, 828–837. [Google Scholar] [CrossRef]
  4. Dolf, M.; Teehan, P. Reducing the carbon footprint of spectator and team travel at the University of British Columbia’s varsity sports events. Sport Manag. Rev. 2015, 18, 244–255. [Google Scholar] [CrossRef]
  5. Schmidt, C.W. Putting the earth in play: Environmental awareness and sports. Environ. Health Perspect. 2006, 114, A286. [Google Scholar] [CrossRef] [PubMed]
  6. Collins, A.; Cooper, C. Measuring and managing the environmental impact of festivals: The contribution of the Ecological Footprint. J. Sustain. Tour. 2017, 25, 148–162. [Google Scholar] [CrossRef] [Green Version]
  7. Schmied, M.; Hochfield, C.; Stahl, H.; Roth, R.; Armbruster, F.; Turk, S.; Fiedl, C. Green Champions in Sport and Environment: Guide to Environmentally-Sound Large Sporting Events; Nature Conservation and Nuclear Safety, Berlin and German Olympic Sports Confederation, Division Development of Sports: Frankfurt, German, 2007. [Google Scholar]
  8. Mann, M.E.; Kump, L.R. Dire Predictions: Understanding Global Warming; DK Publishing: New York, NY, USA, 2008. [Google Scholar]
  9. United Nations Environment Program. Sport and the Environment. Available online: http://www.unenvironment.org/ (accessed on 17 October 2017).
  10. Chernushenko, D. Greening Our Games: Running Sports Events and Facilities that Won’t Cost the Earth; Centurion Publishing & Marketing: Ottawa, ON, Canada, 1994. [Google Scholar]
  11. Du Preez, E.; Heath, E. Determining the influence of the social versus physical context on environmentally responsible behaviour among cycling spectators. J. Sport Tour. 2016, 20, 123–143. [Google Scholar] [CrossRef]
  12. Kellison, T.B.; Mondello, M.J. Organizational perception management in sport: The use of corporate pro-environmental behaviour for desired facility referenda outcomes. Sport Manag. Rev. 2012, 15, 500–512. [Google Scholar] [CrossRef]
  13. McCullough, B.P.; Cunningham, G.B. Recycling intentions among youth baseball spectators. Int. J. Sport Manag. Mark. 2011, 10, 104–120. [Google Scholar] [CrossRef]
  14. Casper, J.M.; Pfahl, M.E.; McCullough, B. Intercollegiate sport and the environment: Examining fan engagement based on athletics department sustainability efforts. J. Issues Intercoll. Athl. 2014, 7, 65–91. [Google Scholar]
  15. Collins, A.; Flynn, A. Measuring the environmental sustainability of a major sporting event: A case study of the FA Cup Final. Tour. Econ. 2008, 14, 751–768. [Google Scholar] [CrossRef]
  16. Collins, A.; Munday, M.; Roberts, A. Environmental consequences of tourism consumption at major events: An analysis of the UK stages of the 2007 Tour de France. J. Travel Res. 2012, 51, 577–590. [Google Scholar] [CrossRef]
  17. Edwards, L.; Knight, J.; Handler, R.; Abraham, J.; Blowers, P. The methodology and results of using life cycle assessment to measure and reduce the greenhouse gas emissions footprint of “Major Events” at the University of Arizona. In. J. Life Cycle Assess. 2016, 21, 536–554. [Google Scholar] [CrossRef]
  18. Dosumu, A.; Colbeck, I.; Bragg, R. Greenhouse gas emissions as a result of spectators travelling to football in England. Sci. Rep. 2017, 7, 6986. [Google Scholar] [CrossRef] [PubMed]
  19. Kaplanidou, K.; Kerwin, S.; Karadakis, K. Understanding sport event success: Exploring perceptions of sport event consumers and event providers. J. Sport Tour. 2013, 18, 137–159. [Google Scholar] [CrossRef]
  20. Gibson, H.J.; Willming, C.; Holdnak, A. Small-scale event sport tourism: Fans as tourists. Tour. Manag. 2003, 24, 181–190. [Google Scholar] [CrossRef]
  21. The National Collegiate Athletic Association. 2016 National College Football Attendance. Available online: http://fs.ncaa.org/Docs/stats/football_records/Attendance/2016.pdf (accessed on 30 November 2017).
  22. Crossman, M. When the party’s over. Sporting News, 2008; 232. [Google Scholar]
  23. Pfahl, M. The environmental awakening in sports. Solutions 2013, 4, 67–76. [Google Scholar]
  24. Toma, J.D. Football U.: Spectator Sports in the Life of the American University; University of Michigan Press: Ann Arbor, MI, USA, 2003. [Google Scholar]
  25. Casper, J.M.; Pfahl, M.E. Environmental sustainability practices in US NCAA Division III athletics departments. Int. J. Event Manag. Res. 2015, 10. Available online: http://www.ijemr.org/wp-content/uploads/2014/10/Casper-Pfahl1.pdf (accessed on 15 November 2017).
  26. Kaplanidou, K.; Vogt, C. The meaning and measurement of a sport event experience among active sport tourists. J. Sport Manag. 2010, 24, 544–566. [Google Scholar] [CrossRef]
  27. McCullough, B.; Kellison, T. Go green for the home team: Sense of place and environmental sustainability in sport. Sustain. Educ. 2016, 11. Available online: http://www.jsedimensions.org/wordpress/wp-content/uploads/2016/02/McCulloughKellison-Feb-16-11-Issue-PDF-Ready1.pdf (accessed on 3 October 2017).
  28. Kaplanidou, K.; Gibson, H.J. Predicting behavioral intentions of active event sport tourists: The case of a small-scale recurring sports event. J. Sport Tour. 2010, 15, 163–179. [Google Scholar] [CrossRef]
  29. Taylor, N. Urban Planning Theory Since 1945; Sage: Thousand Oaks, CA, USA, 1998. [Google Scholar]
  30. Horbach, J.; Rammer, C.; Rennings, K. Determinants of eco-innovations by type of environmental impact—The role of regulatory push/pull, technology push and market pull. Ecol. Econ. 2012, 78, 112–122. [Google Scholar] [CrossRef]
  31. Wiedmann, T.; Minx, J. A definition of ‘carbon footprint’. Ecol. Econ. Res. Trends 2008, 1, 1–11. [Google Scholar]
  32. Wicker, P. The carbon footprint of active sport tourists: An empirical analysis of skiers and boarders. J. Sport Tour. 2017, 1–21. [Google Scholar] [CrossRef]
  33. Funk, D.; Jordan, J.; Ridinger, L.; Kaplanidou, K. Capacity of mass participant sport events for the development of activity commitment and future exercise intention. Leisure Sci. 2011, 33, 250–268. [Google Scholar] [CrossRef]
  34. Kaplanidou, K.; Vogt, C. The Interrelationship between Sport Event and Destination Image and Sport Tourists’ Behaviours. J. Sport Tour. 2007, 12, 183–206. [Google Scholar] [CrossRef]
  35. Froehlich, J.; Dillahunt, T.; Klasnja, P.; Mankoff, J.; Consolvo, S.; Harrison, B.; Landay, J.A. UbiGreen: Investigating a Mobile Tool for Tracking and Supporting Green Transportation Habits, Proceedings of the SIGCHI Conference on Human Factors in Computing Systems; ACM: New York, NY, USA, 2009; pp. 1043–1052. [Google Scholar]
  36. Death, C. ‘Greening’ the 2010 FIFA World Cup: Environmental sustainability and the mega-event in South Africa. J. Environ. Policy Plan. 2011, 13, 99–117. [Google Scholar] [CrossRef]
  37. Ahmed, F.; Pretorius, L. Mega-events and environmental impacts: The 2010 FIFA World Cup in South Africa. Soc. Leg. Sport Mega-Events 2010, 17, 274–296. [Google Scholar]
  38. Hayes, G.; Horne, J. Sustainable development, shock and awe? London 2012 and civil society. Sociology 2011, 45, 749–764. [Google Scholar] [CrossRef]
  39. Hidrue, M.K.; Parsons, G.R.; Kempton, W.; Gardner, M.P. Willingness to pay for electric vehicles and their attributes. Resour. Energy Econ. 2011, 33, 686–705. [Google Scholar] [CrossRef]
  40. Parsons, G.R.; Hidrue, M.K.; Kempton, W.; Gardner, M.P. Can Vehicle-to-Grid Revenue Help Electric Vehicles on the Market? Work. Pap. 2011, 66, 33–51. [Google Scholar]
  41. Chard, C.; Mallen, C. Examining the linkages between automobile use and carbon impacts of community-based ice hockey. Sport Manag. Rev. 2012, 15, 476–484. [Google Scholar] [CrossRef]
  42. Friedmann, J. Why do planning theory? Plan. Theory 2003, 2, 7–10. [Google Scholar] [CrossRef]
  43. Wheeler, S.M.; Beatley, T. The Sustainable Urban Development Reader; Routledge: New York, NY, USA, 2014. [Google Scholar]
  44. Jones, C.; Kammen, D.M. Spatial distribution of US household carbon footprints reveals suburbanization undermines greenhouse gas benefits of urban population density. Environ. Sci. Technol. 2014, 48, 895–902. [Google Scholar] [CrossRef] [PubMed]
  45. Newman, P.; Kenworthy, J. Sustainability and Cities: Overcoming Automobile Dependence; Island Press: Washington, DC, USA, 1999. [Google Scholar]
  46. Norman, J.; MacLean, H.L.; Kennedy, C.A. Comparing high and low residential density: Life-cycle analysis of energy use and greenhouse gas emissions. J. Urban Plan. Dev. 2006, 132, 10–21. [Google Scholar] [CrossRef]
  47. Mastny, L. State of the World; Island Press: Washington, DC, USA, 2015. [Google Scholar]
  48. Chen, C.; Gong, H.; Paaswell, R. Role of the built environment on mode choice decisions: Additional evidence on the impact of density. Transportation 2008, 35, 285–299. [Google Scholar] [CrossRef]
  49. University Athletic Association. Available online: http://uaasports.info/landing/index (accessed on 5 October 2017).
  50. Argonne National Laboratory. GREET Model Development and Applications. Available online: https://greet.es.anl.gov/index.php?content=greetdotnet (accessed on 4 October 2017).
  51. Searchinger, T.; Heimlich, R.; Houghton, R.A.; Dong, F.; Elobeid, A.; Fabiosa, J.; Tokgoz, S.; Hayes, D.; Yu, T.-H. Use of US croplands for biofuels increases greenhouse gases through emissions from land-use change. Science 2008, 319, 1238–1240. [Google Scholar] [CrossRef] [PubMed]
  52. Burnham, A. User Guide for the GREET Fleet Footprint Calculator 1.1; Argonne Transportation Technology R&D Center: Forest, WI, USA, 2009. [Google Scholar]
  53. Wang, M.Q. Development and Use of GREET 1.6 Fuel-Cycle Model for Transportation Fuels and Vehicle Technologies; Argonne National Laboratory: Forest, WI, USA, 2001.
  54. Wang, M. GREET 1.5 a; Argonne National Laboratory: Forest, WI, USA, 2000.
  55. Wang, M.Q. GREET 1.5—Transportation Fuel-Cycle Model-Vol. 1: Methodology, Development, Use, and Results; Argonne National Laboratory: Forest, WI, USA, 1999.
  56. Wang, M. GREET 1.0—Transportation Fuel Cycles Model: Methodology and Use; Argonne National Laboratory: Forest, WI, USA, 1996.
  57. Hair, J.F.; Black, W.C.; Babin, B.J.; Anderson, R.E. Canonical correlation: A supplement to multivariate data analysis. In Multivariate Data Analysis: A Global Perspective, 7th ed.; Pearson Prentice Hall Publishing: Upper Saddle River, NJ, USA, 2010. [Google Scholar]
  58. Goodland, R. The concept of environmental sustainability. Annu. Rev. Ecol. Syst. 1995, 26, 1–24. [Google Scholar] [CrossRef]
  59. Robinson, N.A. Beyond sustainability: Environmental management for the Anthropocene epoch. J. Public Aff. 2012, 12, 181–194. [Google Scholar] [CrossRef]
  60. Filo, K.; Funk, D.; O’Brien, D. The antecedents and outcomes of attachment and sponsor image within charity sport events. J. Sport Manag. 2010, 24, 623–648. [Google Scholar] [CrossRef]
  61. U.S. Environmental Protection Agency. Greenhouse Gas Emissions; U.S. Environmental Protection Agency: Washington, DC, USA, 2017.
  62. Auchincloss, A.H.; Weinberger, R.; Aytur, S.; Namba, A.; Ricchezza, A. Public parking fees and fines: A survey of US cities. Public Works Manag. Policy 2015, 20, 49–59. [Google Scholar] [CrossRef]
  63. Trendafilova, S.; Kellison, T.B.; Spearman, L. Environmental sustainability in sport facilities in East Tennessee. J. Facil. Plan. Des. Manag. 2014, 2, 1–10. [Google Scholar]
Figure 1. Mean CO2 emissions per spectator by transportation mode for on- and off-campus stadium locations.
Sustainability 10 00241 g001
Figure 2. Mean CO2 emissions per spectator by mileage groups for on- and off-campus stadium locations.
Sustainability 10 00241 g002
Figure 3. CO2 emissions by mileage groups for 90,000 spectators for both on- and off-campus stadium locations.
Sustainability 10 00241 g003
Table 1. Sample demographic results by stadium location for spectators attending the collegiate football events.
FrequencyPercent (%)
On-CFE
Gender
Males16063
Females9337
Total253100
Affiliation
Students15059
Non-students10341
Total253100
Off-CFE
Gender
Males12854
Females10746
Total235100
Affiliation
Students4519
Non-students19081
Total217100
Non-students included alumnae, parents and unaffiliated spectators; On-CFE refers to On-Campus Collegiate Football Event; Off-CFE refers to Off-Campus Collegiate Football Event.
Table 2. Kilograms of CO2-eq with statistical data for emissions for transportation mode groups by stadium location.
On-CFEMSDFrequency% CO2
Car/Scooter14.5926.193616.4
Carpool17.7320.4415183.5
Bus0.400.1880.1
Eco-friendly00580.0
Total12.6720.21253100
Off-CFEMSDFrequency% CO2
Car/Scooter0000
Carpool4.584.6421491.1
Bus2.690218.9
Eco-friendly0000
Total4.414.46235100
Mean values (M), kg of CO2 per spectator; SD, standard deviation; eco-friendly refers to transportation modes that emit zero CO2 and includes bicycle and walk.
Table 3. Kilograms of CO2-eq with statistical data for emissions for miles traveled groups by stadium location.
On-CFEMSDFrequency% CO2
0 to 20 miles0.981.321675.1
20 to 40 miles7.002.0551.1
40 to 60 miles0000
60 to 80 miles0000
80 miles or more37.1221.228193.8
Total12.6720.21253100
Off-CFEMSDFrequency% CO2
0 to 20 miles0000
20 to 40 miles2.881.1211030.6
40 to 60 miles2.690215.4
60 to 80 miles5.180.51110049.9
80 miles or more36.470414.1
Total4.464.45235100
Mean values (M), kg of CO2 emissions per spectator; SD, standard deviation.
Table 4. Results of independent t-test and descriptive statistics for stadium locations.
Stadium Location95% CI for Mean Difference
On-CFEOff-CFELL UL
MSDnMSDn tdf
Carbon dioxide (CO2) emissions kg12.6720.212534.464.45235(5.65, 10.78)6.30 *278.232
p < 0.05 *, Mean values (M) = kg of CO2 emissions per spectator; SD, standard deviation; CI, confidence interval; LL, lower level; UL, upper level; df, degrees of freedom.
Table 5. Results of Independent t-test and descriptive statistics for carpool mode per stadium location.
Carpool Mode95% CI for Mean Difference
On-CFEOff-CFELL UL
MSDnMSDn tdf
Carbon dioxide (CO2) emissions kg17.7220.711514.634.63214(9.71, 16.49)7.64 ***160.63
p < 0.001 ***; Mean values (M), kg of CO2 emissions per spectator; SD, standard deviation; CI, confidence interval; LL, lower level; UL, upper level; df, degrees of freedom.
Table 6. Results of independent t-test and descriptive statistics for bus mode per stadium location.
Bus Mode95% CI for Mean Difference
On-CFEOff-CFELL UL
MSDnMSDn tdf
Carbon dioxide (CO2) emissions kg0.400.1882.68021(−2.43, −2.13)−35.47 ***7
p < 0.001 *; Mean values (M), kg of CO2 emissions per spectator; SD, standard deviation; CI, confidence interval; LL, lower level; UL, upper level; df, degrees of freedom.
Table 7. One-way analysis of variance of CO2 emissions per spectator by transportation mode groups in on-CFE.
SourcedfSSMSFp
Between groups314512.314837.4413.63 ***0.001
Within groups24988,389.92354.98--
Total252102,902.23---
p < 0.001 ***; df, degrees of freedom; SS, sum of squares; MS, mean square.
Table 8. ANOVA comparisons of transportation mode groups for on-CFE.
(I) On-CFE Transportation Modes(J) On-CFE Transportation ModesMean Difference (I-J)Std. Error95% Confidence Interval
Lower BoundUpper Bound
Car/scooterCarpool−3.133.49−12.175.90
Bus14.197.36−4.8533.24
Eco-friendly14.59 *4.004.2524.93
CarpoolCar/scooter3.133.49−5.9012.17
Bus17.32 (p = 0.057)6.84−0.3535.01
Eco-friendly17.73 *2.9110.2025.26
BusCar/scooter−14.197.36−33.243.43
Eco-friendlyCarpool−17.32 (p = 0.057)6.83−35.010.35
Eco-friendly0.407.10−17.9818.78
Car/scooter−14.59 *3.99−24.93−4.25
Carpool−17.72 *2.91−25.26−10.20
Bus−0.407.11−18.7817.98
Table 9. Results of independent t-test and descriptive statistics of carpool and bus mode groups for off-CFE.
Off-CFE95% CI for Mean Difference
CarpoolBusLL UL
MSDnMSDn tdf
Carbon dioxide (CO2) emissions kg4.584.632142.69021(1.27, 2.51)5.98 ***213
p < 0.001 ***, Mean values (M), kg of CO2 emissions per spectator; SD, standard deviation; CI, confidence interval; LL, lower level; UL, upper level; df, degrees of freedom.
Table 10. Results of independent t-test between 20 to 40 miles’ groups for both stadium locations.
20 to 40 Miles Group95% CI for Mean Difference
On-CFEOff-CFELL UL
MSDnMSDn tdf
Carbon dioxide (CO2) emissions kg72.0552.881.12110(3.06, 5.17)7.71 ***101
p < 0.001 ***; Mean values (M), kg of CO2 emissions per spectator; SD, standard deviation; CI, confidence interval; LL, lower level; UL, upper level; df, degrees of freedom.

