The Impact of Foreign Direct Investments and Remittances on Economic Growth: A Case Study in Central and Eastern Europe


1
Financial-Accounting Department, Faculty of Business and Law, Petru Maior University of Tîrgu-MureŞ, Tîrgu-MureŞ 540 088, MUREŞ County, Romania
2
Romanian Research Group for Corporate Finance, Aleea Nordului 1, Livezeni 547 365, MUREŞ County, Romania
3
Institute of National Economy, Romanian Academy, Casa Academiei, Calea 13 Septembrie 13, Sector 5, Bucharest 050 711, Romania
*
Author to whom correspondence should be addressed.
†
Current address: Nicolae Iorga 1, Tîrgu-MureŞ 540 088, MUREŞ County, Romania.
‡
These authors contributed equally to this work.
Sustainability 2018, 10(1), 238; https://doi.org/10.3390/su10010238
Submission received: 4 December 2017
/
Revised: 8 January 2018
/
Accepted: 9 January 2018
/
Published: 18 January 2018
(This article belongs to the Section Sustainable Urban and Rural Development)
Abstract
:This paper investigates the impact of Foreign Direct Investment (FDI) and remittances on Economic Growth (EG), using panel data of seven countries from Central and Eastern Europe with a Gross Domestic Product (GDP) per capita under 25,000 $. The empirical literature stressed the relationships between FDI and remittances and economic growth, and our purpose is to identify if there are significant relationships between FDI, remittances and economic growth in the seven analyzed countries. We find a positive impact of both FDI and remittances on GDP, but the influence of FDI is higher in all analyzed states, with accepting the assumption of ceteris paribus principles in limiting research caused by other possible determinants.
Keywords:
remittances; foreign direct investments; economic growth; panel data analysis; hierarchical cluster analysisJEL Classification:
C33; F21; F22; F24; O52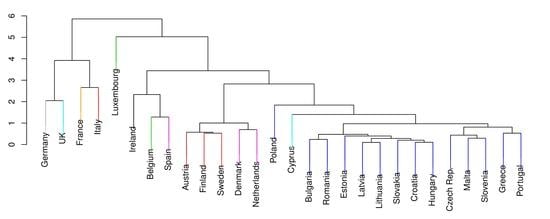
1. Introduction
In the process of economic development, the formation of capital is crucial, regardless of its origin. In view of finding a solution to this problem, developing states rely on foreign capital, constructing strategies to attract FDI in order to support development. It is considered that foreign capital facilitates the reduction of saving constraints, by increasing savings availability, and the reduction of commercial constraints, by extending the beneficiary country’s import capacity. In this way, the flow of foreign capital influences savings and national investment and promotes economic growth. Empirical evidence available regarding the impact of foreign capital flow on inner savings and economic development in general is divided into two categories. While a series of studies has shown that foreign capital flows lead to an accumulation of savings, others have noted that the former replace the savings and generate an increase in consumption, stimulating economic growth differently. More than that, some identified the channels through which the increase of foreign capital flows leads to a decrease in savings (Griffin [1]). Together with the FDI, developing economies are benefiting more and more from another substantial flow of financial resources, immigrant remittances, that came predominantly from developed economies to developing ones. Because immigrant remittances represent a substantial flow of financial resources, the role of this financial flow in economic development is an important issue both for researchers and policymakers. However, whether remittances are really flows of investment capital is still a debated issue, and because of that, it deserves cautious examination, because of its substantial implications for policymakers. We focused on a group of Central and Eastern European countries that traditionally had been an area of emigration before their accession to the EU, and this became more consistent after the accession to the EU. From initial panel data of the EU28, we chose a panel of data of EU7, with seven countries from Central and Eastern Europe: Romania, Bulgaria, Croatia, Czech Republic, Hungary, Slovakia and Slovenia, according to the hierarchical cluster analysis methodology and geographical area. In our study, we focus on foreign direct investment and remittances; among the most important external financial resources starting with the year 1980. For the selected countries, the question we intend to approach is if remittances behave in the same way as other capital flows, especially FDI. In particular, the assumption is that remittances would have a positive correlation with output growth if they are like other capital flows, such as FDI.
We study one specific aspect of migration: the role of remittances on the macroeconomic performance of selected Central and East European Countries (CEEC), and at the same time, we consider it important to analyze which of the two components of foreign capital flows, remittances or FDI, have the biggest impact on the GDP of the analyzed states. It should be emphasized that this is only one face of the analysis of the behavior of remittances and their impact on the source country economy, and therefore, our conclusions and any policy implications should be taken with caution and correlated with other results. We are using panel data design that allows for correlation between unobservable individual effects and observable determinants of behavior. In our approach, we choose heterogeneous data with the following fields: countries, foreign direct investment, remittances and economic growth, because no control of this implied obtaining biased results like in Baltagi and Levin [2].
Our findings underline that in EU27 countries, foreign direct investment capital and remittances have a positive impact on economic growth. Research limitations on EU7 countries in the period 2010–2016 with panel data analysis involve annual data covering a short span of time for each individual. The implication of remittances is the same as foreign direct investment and private capital inflows to support economic growth.
2. Literature Review
A state’s major purpose lies within the growth of the economic level and the welfare of the population. The changes in foreign direct investment, remittances and exports determine the evolution of the level of growth in a state. Foreign direct investment is the most important external financial resource that contributes to the economic development of beneficiary states.
According to official UNCTAD data (2017) (Figure 1), FDI entries for the year 2015 went over $1600 billion globally, with more than $600 billion directed towards poorly-developed states. Developing countries work on promotion strategies that will attract FDI te Velde and Loewendahl [3,4,5], as a consequence of the positive impact it has on the economic growth. Caves [6] demonstrated that FDI leads to an increase in the productivity of companies, with a technological transfer happening from foreign companies to local ones Glass and Saggi [7] and Saggi [8].
Technological transfer may take place either via a workforce that was active in foreign companies or the introduction of new products on the market of the beneficiary country Caves [9]. Therefore, FDI contributes to the growth of the level of technology implementation and modernization and, implicitly, to economic growth. There are, however, opinions, according to which the influence of FDI on economic growth of beneficiary states is conditioned by certain factors. Studies demonstrate that the impact of FDI on economic growth depends on the level of education and training the workforce possesses Borensztein [10]. The higher the qualification level of the workforce, the more FDI contributes to the growth of the economic level. On the other hand, Blomstrom [11] claims that FDI has a strong impact on economic growth if the beneficiary state is wealthy; vice versa, FDI has a larger impact on developed states than on less developed ones, and the level of qualification of its workforce is not at all relevant. Sustaining the idea that FDI impact on economic growth is higher in developed states, Balasubramanyam [12] and Nair-Reichert [13] observed that a state’s commercial openness is primordial in view of obtaining major impacts of FDI on economic growth.
Analyzing FDI coming from the USA to developing countries, Nunnenkamp [15] stressed that the impact of FDI on economic growth is dependent on the characteristics of the industrial sector and the beneficiary country. In states with lower GDP per capita levels, low education level, little infrastructure and low commercial openness, the impact of FDI on economic growth was small (Mottaleb [16]). Alfaro [17] demonstrated the positive impact of FDI in states with a developed financial market; as long as the financial market is underdeveloped, FDI exerts no influence over the level of economic growth Azman-Saini [18].
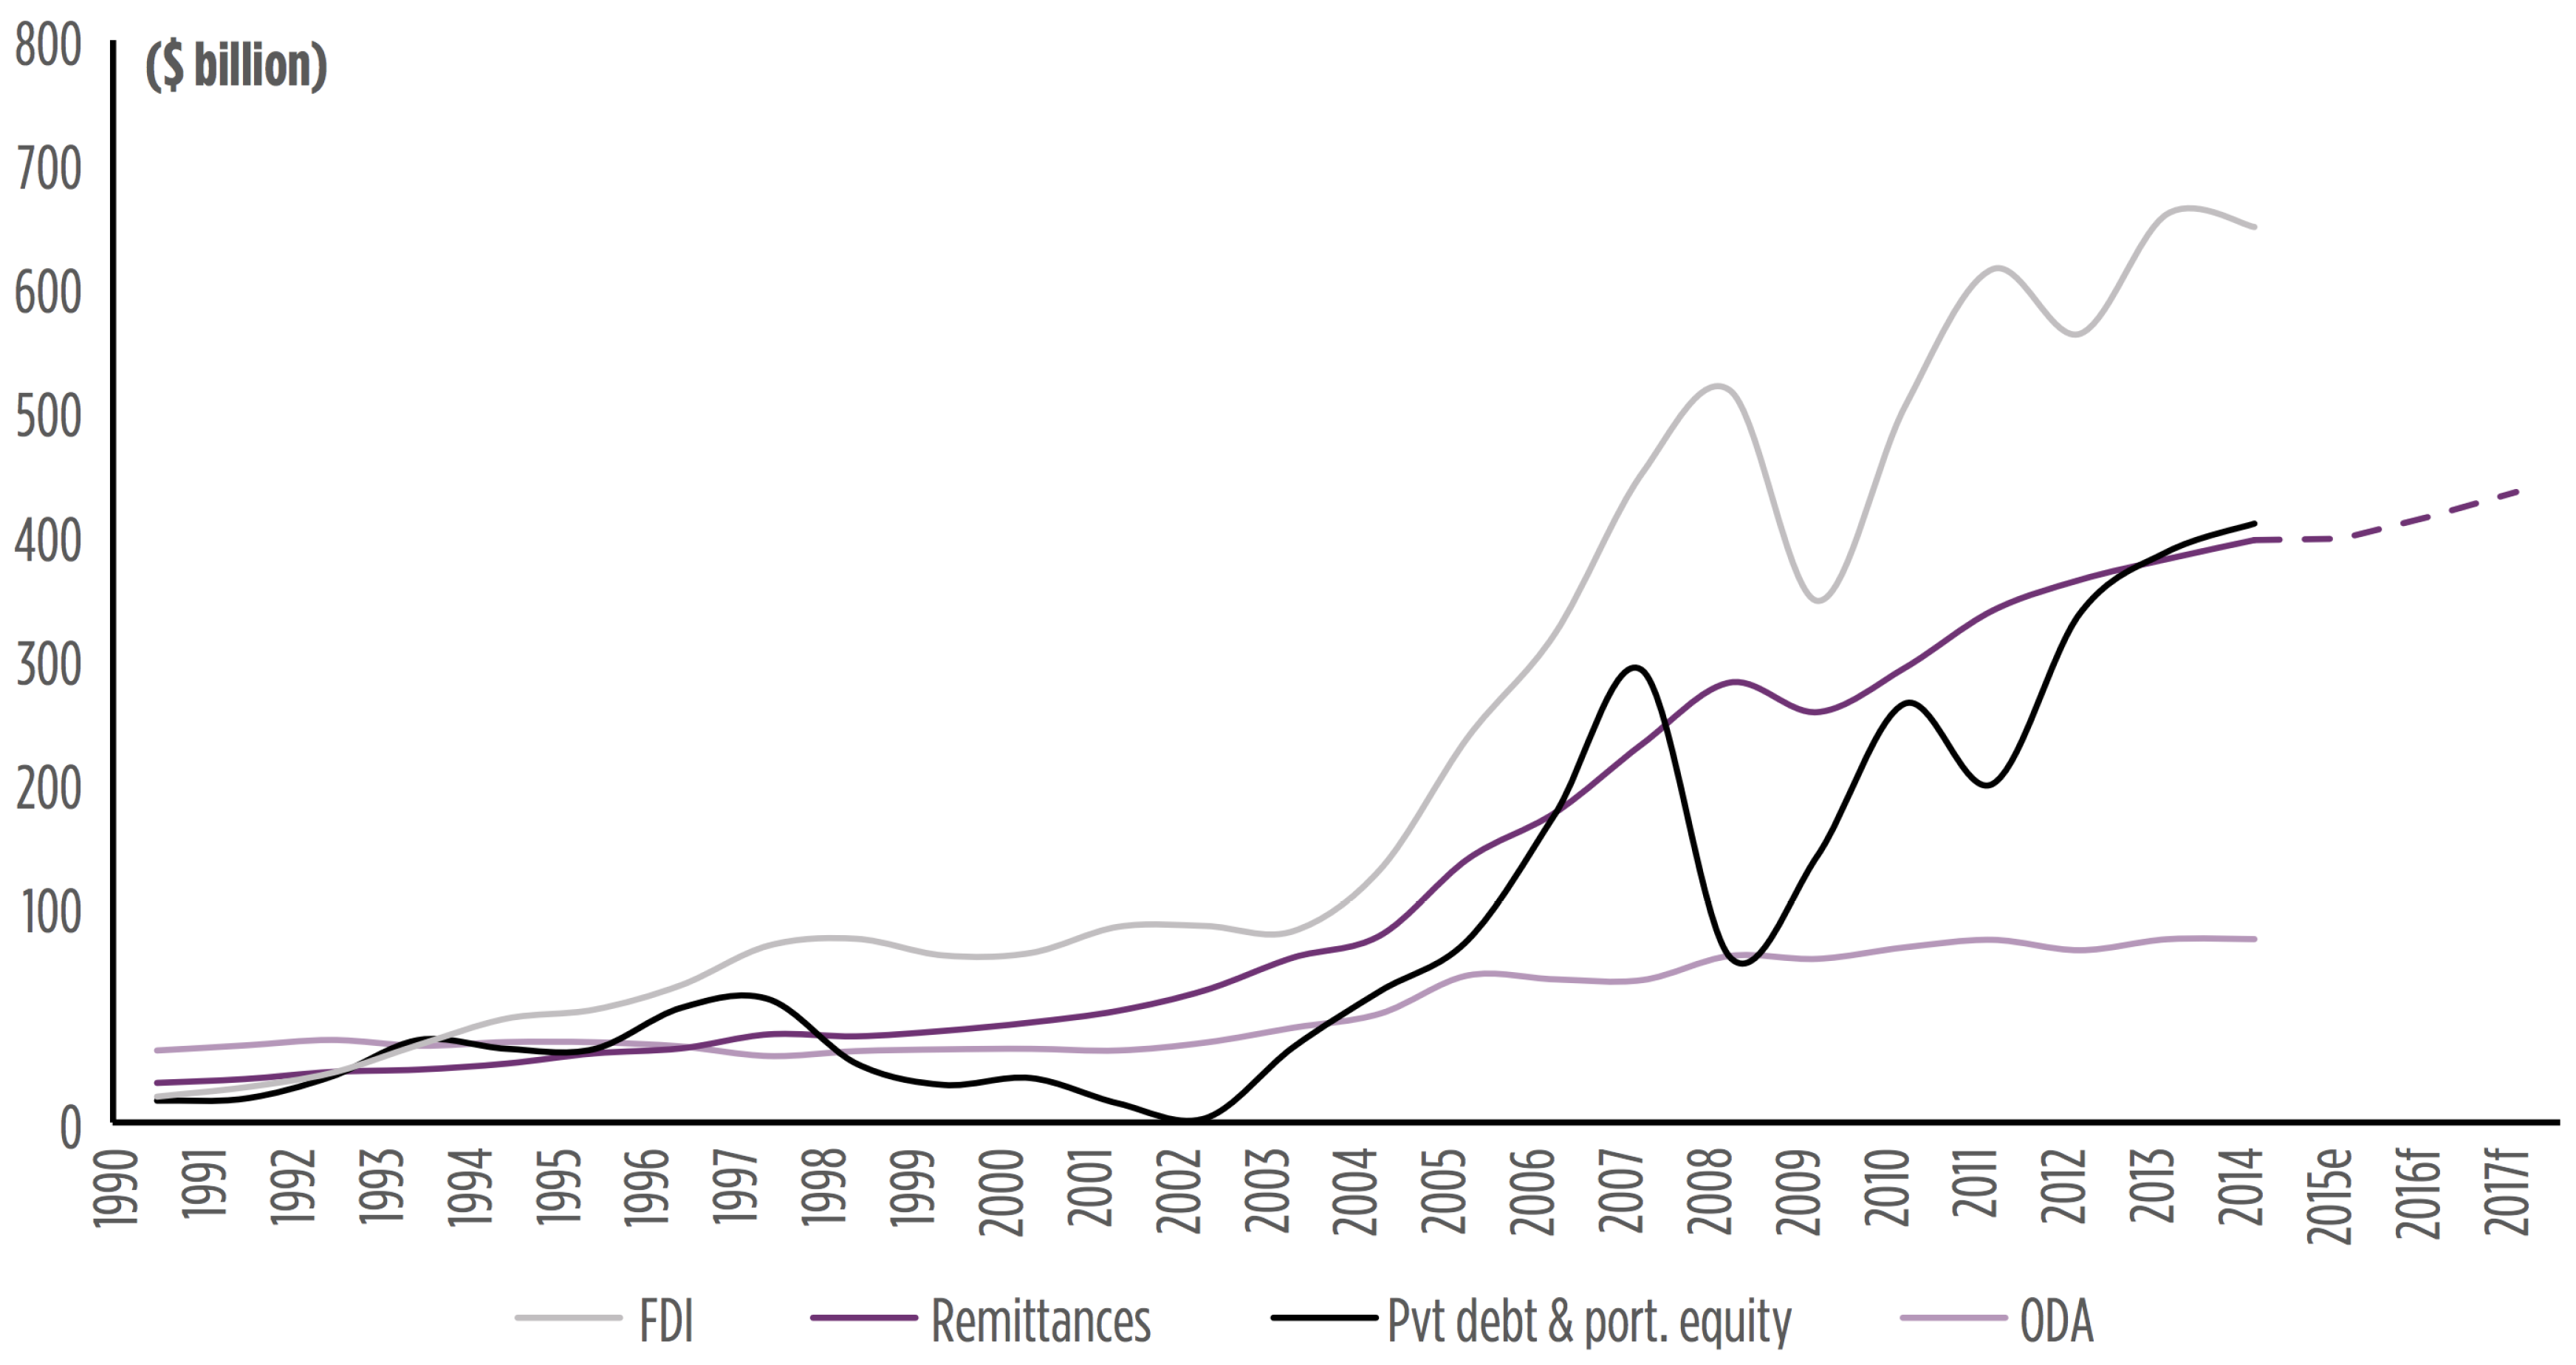
Carkovic [19] showed that FDI does not impact the level of economic growth of states, regardless of their level of development. Beugelsdjijk et al. [20] sustain that FDI influence on the economic growth of developing countries is ambiguous. Following foreign direct investment, remittances seem to represent the second most important financing source for the development of a state. In the past 15 years (Figure 2), the volume of remittances has increased substantially, as a result of the increase in the number of international migrants, according to data supplied by the UN, the number of international migrants went over 243 billion people in the year 2015, with over 70 million people more than compared to the year 2000, [21].
According to official World Bank data [22], the volume of remittances grew from more than $100 billion in the year 2000 to nearly $600 billion in the year 2015, although it is difficult to estimate the real value of remittances transferred to the countries of origin through unofficial channels. Thus, remittances have become an important source of financial flux, after foreign direct investment, surpassing the volume of official assistance for development, starting with the year 2000.
Within the European Union in the year 2015, according to data presented by Eurostat [23], the states with the greatest remittance share in the GDP were Latvia and Croatia, with 5% and 4.3% respectively. The high level of remittance share in the GDP is determined by the dependence of the population on these external financial income sources.
At present, there are contradictory opinions as regards the impact of remittances on the growth of the economic level a state has. Much of this disagreement centers on a discussion about whether remittances are in fact a form of capital transfer or only income. Some specialists claim there is no connection between the evolution of remittances and the economic growth of the country of origin, while others say that remittances have either a positive or a negative effect on the level of economic growth. Barajas et al. [25] analyzed the connection between remittances and the level of economic growth of 84 beneficiary states in the period 1970–2004 and observed that in the case of some states, remittances exerted no influence on the gross domestic product, while in other analyzed states, the impact was a negative one.
Posso [26] and Chami et al. [27] analyzed households that benefited from remittances and noted that these have a lower workforce participation rate as compared with non-migrant households. Besides, countries of origin are confronted with a reduction of the workforce offer Hanson [28], a phenomenon that halts economic growth. At the same time, remittances are frequent in consumption. Entzinger [29] observed that the biggest share of remittances goes towards expensive import goods Adams [30], thus discouraging small internal producers Zarate-Hoyos [31]. Directing remittances towards consumption attracts, in its turn, an increase in the monetary mass in the country of origin, thereby generating the appearance of inflationist processes Ratha [32]. Similarly, the increase of the volume of remittances in undeveloped states leads to an increase in the real exchange rate and the birth of the Dutch disease phenomenon Acosta [33], and Lopez [34]. In spite of all this, Adams et al. [35] demonstrated, following a study that focused on 71 developing countries, the positive impact of remittances on economic growth. Thus, an increase by 10% of remittance per capita contributes to the reduction of the level of poverty by 3.5%. Ratha [36] claims that remittances have a positive influence on the increase of population income, leading to the reduction of the unemployment rate.
A study performed by Giannetti et al. [37] in the Eastern states of the European Union (Slovenia, Poland, The Czech Republic and Hungary), demonstrated the existence of the link between remittances and economic growth of the countries of origin. Giuliano et al. [38] carried out a study that included 100 developing countries over the period 1975–2002, demonstrating the strong link between remittances and economic growth, the biggest impact being registered in the developing countries that have a lower level of financial sector development.
This finding is supported also by Pradhan et al. [39], who use random effects and fixed effects estimators and find that remittances have a positive impact on economic growth across a group of 39 developing countries. Standard growth models where FDI and migrant remittances are all introduced as components of investment (Burnside and Dollar [40], Catrinescu et al. [41]) are also available. In this type of model, it is considered that each financial flow finances the investment that determines economic growth. Catrinescu et al. conclude that the effect of remittances on economic growth depends on the way in which remittances are used and highlights the ability of policymakers and institutions to encourage or require remittances to be invested in order to generate significant economic benefit. In this perspective, our idea is not only to highlight the importance of FDI and remittances for growth, but to explore the relationships between these variables.
3. Materials and Methods
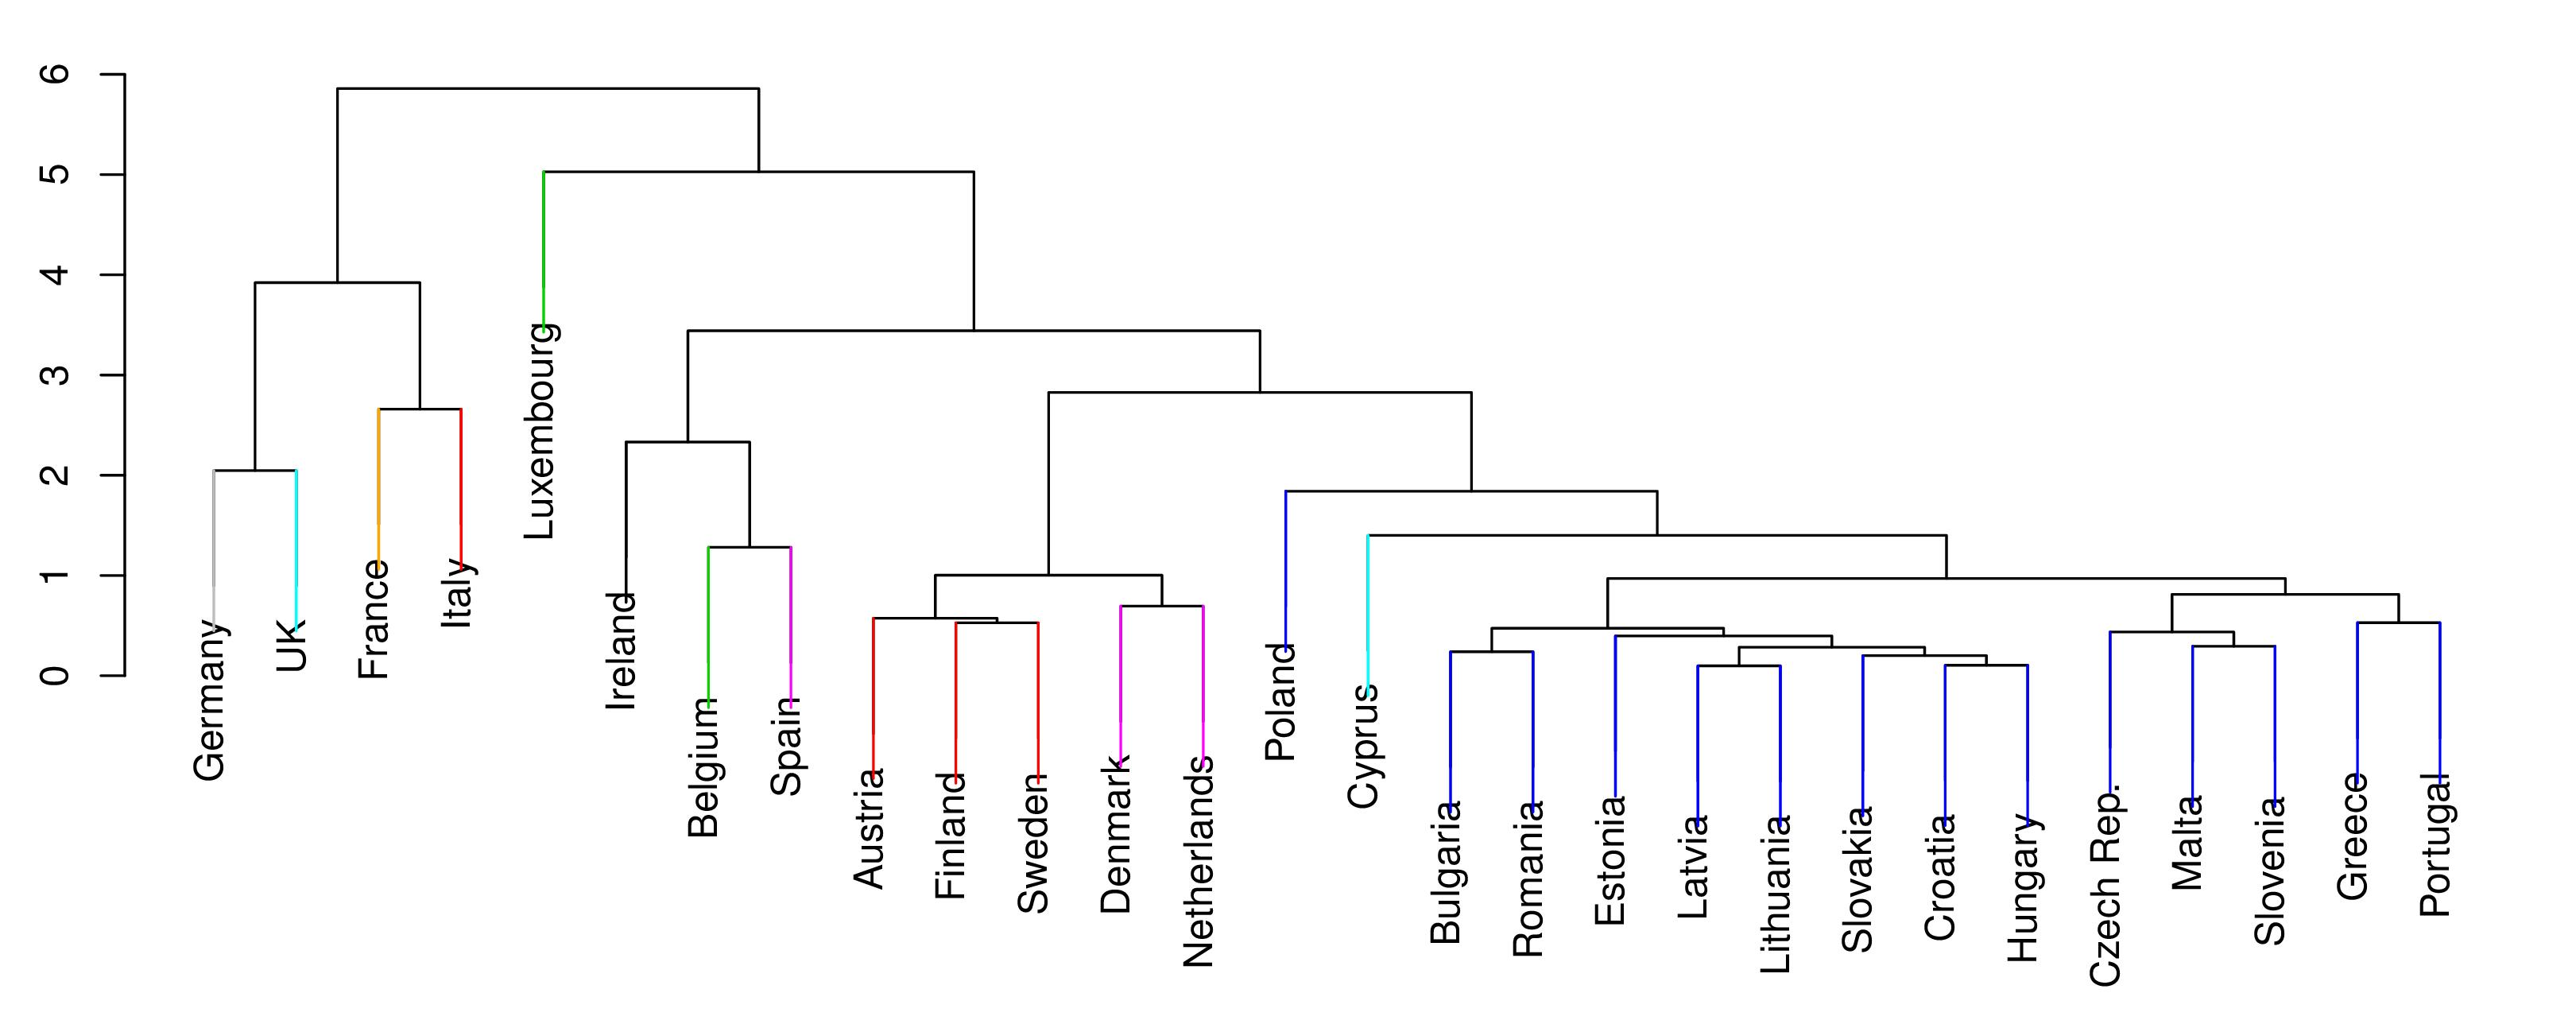
In this paper, we analyzed the impact of remittances and foreign direct investment on the level of economic development in seven European Union Member States, situated in Central and Eastern Europe, whose GDP does not go over $25,000, in the period 2010–2016. The states are: Romania, Bulgaria, Croatia, Czech Republic, Hungary, Slovakia and Slovenia. We use in our research these states based on Hierarchical Cluster Analysis (HCA) dendrogram analysis from Figure 3 with the Ward [42] hierarchical grouping method and the euclidean metric. We used for clustering the package hclust [43] and for color design the package sparcl with function ColorDendrogram [44] from R.
Data sources regarding the evolution of remittances are from databases of the World Bank, more specifically the data from bilateral remittances matrices; data regarding foreign direct investment come from the databases belonging to the United Nations Conference on Trade and Development (UNCTAD). The analyzed time period is 2010–2016, as a result of the availability of data concerning remittances. Our panel data include seven individual countries observed at seven regular times; see Table A1. To demonstrate our assumptions, we used the plm [45] package from R [46].
4. Results and Discussion
Starting from the remittance flows and investments received by the seven analyzed states, we checked, using empirical studies based on descriptive and inferential statistics, the existence of a correlation between the gross domestic product and the entries of remittances and foreign direct investments. For econometric calculations, the software R was applied, using gross domestic product, foreign direct investment flows and remittances for the period 2010–2016.
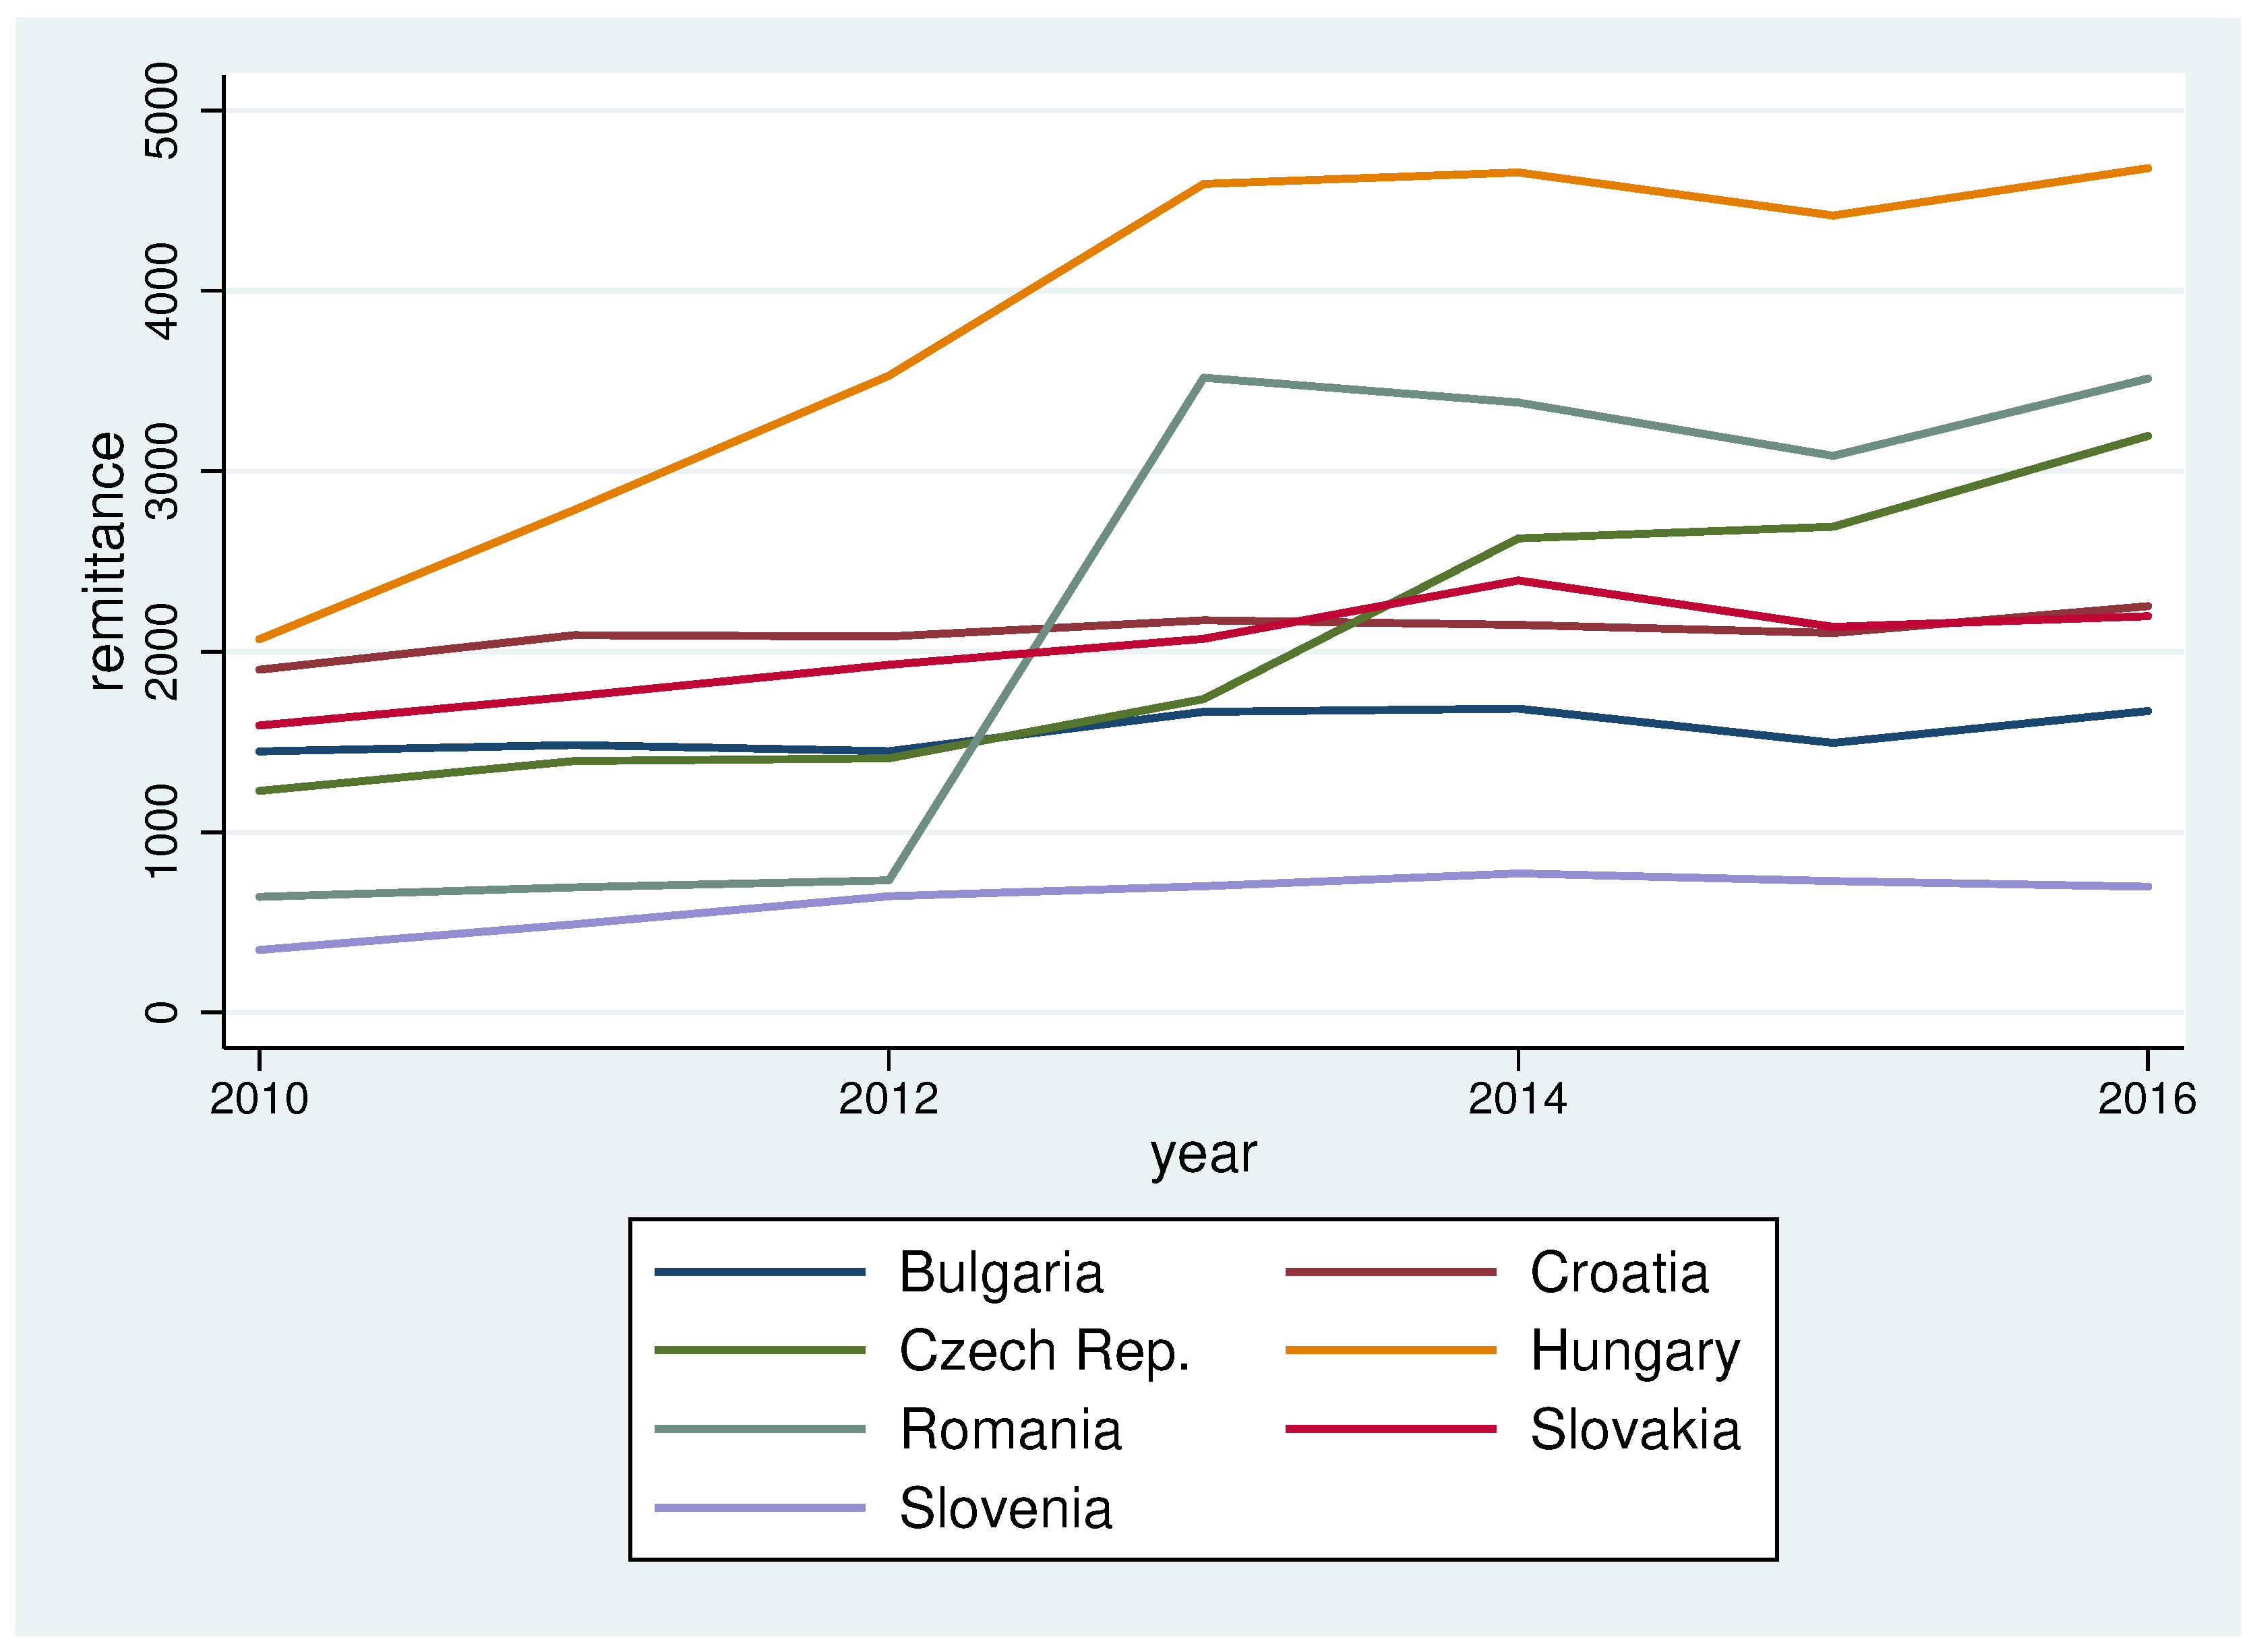
In Appendix Figure A1, we present the evolution of remittances for Bulgaria, Croatia, Czech Republic, Hungary, Romania, Slovakia and Slovenia, starting with the bottom row, left to right. Analyzing the evolution of this indicator, we observe that the state with the highest values in 2015 is Hungary with over $4 billion, whereas Slovenia is at the opposite pole with only $728 million. At the same time, Romania is the state that registers a significant decrease from nearly $4 billion in the year 2010 to under $3 billion in 2015. The other analyzed states have a relatively stable evolution.
We analyzed the heterogeneity per country and year for the seven states. The research is comprised of the global development product and remittances in Appendix Figure A1, Figure A2, Figure A3 and Figure A4; this allows us to continue with the inferential analysis. Following the empirical study, we applied the method of least squares, for panel data, in view of demonstrating the link between remittances and gross domestic product, as well as foreign direct investments and gross domestic product. In order to try to establish if there is a correlation between remittances and gross domestic product, we considered the following hypotheses:
- : null hypothesis, according to which the impact of remittances’ entries on gross domestic product is negative;
- : alternative hypothesis, which contradicts the null hypothesis; the impact of remittances’ entries on gross domestic product is positive.
To test the proposed hypotheses, we used the method of least squares, for panel data, in matrix form, which is represented as follows:
where i stands for the seven countries where the panel type model was applied, t stands for the time series, respectively the period 2010–2016, represents a scalar, represents a -dimensional vector, represents gross domestic product, represents the observations of the remittances explicative variable and is the discrepancy variable or deviation. To interpret the results obtained, following econometric calculations, a probability value higher than 0.05 will generate the acceptance of the formulated null hypothesis , according to which remittance entries have a negative impact on gross domestic product. When the value obtained is less than 0.05, the formulated alternative hypothesis is true, : the impact of remittances on gross domestic product is positive. In Table 1, we observe that there is a 3.03 × 10 probability, smaller than the significance threshold of 0.05, rejecting the null hypothesis , according to which the impact of remittance entries on GDP is negative. Under these circumstances, the alternative formulated hypothesis is accepted, , which states that the impact of remittance entries on gross domestic product is positive.
In accordance with the results obtained after applying the least squares method, the value obtained for the estimated coefficient of the remittance entries indicator is a positive one, amounting to 36.719. The estimated econometric model for the impact of remittances on gross domestic product, in panel type data for the CEEC analyzed states in the period 2010–2016, is:
The same analysis is made in the case of foreign direct investment in view of demonstrating its impact on the evolution of gross domestic product. The hypotheses used are identical to those in the relation remittances: gross domestic product. In order to test the proposed hypotheses, we used the method of least squares, for the panel type data model, in matrix form, with the following econometric representation:
where i stands for the CEEC where the panel type model was applied, t stands for the time series, respectively the period 2010–2016, represents a scalar, represents a -dimensional vector, represents gross domestic product, the represents the observations of the foreign direct investment explicative variable and is the discrepancy variable or deviation.
In order to interpret the results obtained, following econometric calculations, a value of probability higher than 0.05 leads to acceptance of the formulated null hypothesis, , according to which the impact of foreign direct investment entries on gross domestic product is negative. In case the value obtained is less than 0.05, the formulated alternative hypothesis is true, , that is the impact of foreign direct investment entries on gross domestic product is positive. As we can see in Table 2, the model is correctly defined and accepted, with a p-value equal to 2.5 × 10, less than 0.05. The probability value is 2.5 × 10, smaller than the 0.05 significance threshold, rejecting the null hypothesis, according to which the impact of foreign direct investment entries on gross domestic product is negative. Under these circumstances, the formulated alternative hypothesis is accepted, that is the impact of foreign direct investment entries on gross domestic product is positive.
According to the results obtained following the application of the method of least squares, the value obtained for the estimated coefficient of the indicator for foreign direct investment entries is positive, being 1.436. The econometric model estimated for the impact of foreign direct investment on gross domestic product, in panel type data for the CEEC states analyzed in the period 2010–2016, is Equation (4).
Following econometric calculations, we used the Hausman test in view of determining the best model, fixed or random. If we obtain a probability less than 0.05, it follows that the right model for the data in our use is the fixed effects model, otherwise the random effects model will be applied. Thus, in Table 3, we observe that the probability obtained was less, 0.0141, the reason for which we conclude that the fixed effects model is the most appropriate.
For the fixed effects model, the most used estimator is within. Through this estimator, the method of the least squares is applied to the obtained model, and the average individual values are eliminated, which leads to the elimination of fixed effects. Fixed effects are eliminated when the extraction of the corresponding model for individual averages is extracted from the initial model, as follows in Equation (5):
As a result of the fact that the fixed effects were eliminated, the regression of the method of the least squares offers consistent estimators for , even if the fixed effects are correlated with , as is the case with the models of fixed effects; this result is a significant advantage of data panels. According to Table 4, we observe that probability stays within the 0.05 limit, both in the case of remittances and in foreign direct investments, this being equal to 0.03374 for remittances and 0.00706 for foreign direct investment. This means that the null hypothesis is rejected and the alternative hypothesis is accepted, according to which remittance and foreign direct investments have a positive impact on economic growth.
In view of a better understanding of fixed effects, we will use the method of least squares with dummy variables. With the least squares method, the effect on the GDP is mediated by the differences among the countries studied. By adding a dummy variable for each country, the pure effect of GDP is estimated as a result of the fact that such fictitious variables absorb the specific and individual effects of each analyzed state. We highlighted the individual effects by decomposing the discrepancy variable or deviation into three components, as follows in Equation (6) in Baltagi [47]:
where:
- represents the estimation of the specific individual effect of the seven analyzed states, unnoticeable and independent of time;
- estimates the specific temporal effect that is time dependent, invariable in transversal structures, respectively dependent on the seven European states;
- depends on the values registered for remittance entries in the seven European states and the analyzed period, respectively the time interval 2010–2016.
As seen in Table 5, the value of the coefficient is 0.03374, less than the 0.05 significance threshold, thus rejecting the null hypothesis , according to which the impact of remittance entries on gross domestic product is negative. Under these circumstances, the alternative hypothesis is accepted, , which states the impact of remittance entries on gross domestic product in the analyzed states is positive.
According to the results obtained for the estimated coefficients in the case of the CEEC economies presented in Table 5, all values are positive, which indicates a positive impact of remittance entries on the country of destination. Analyzing the significance threshold for the seven economies, we note that Czech Republic, Romania and Hungary register high values for the significance threshold. According to the results obtained for the estimated coefficients, from the seven states analyzed, Romania ranks second with 191,543.727, as compared to the other states, in terms of the impact of remittances on economic growth.
In view of making a comparison between the connection of remittances-gross domestic product and foreign direct investment-gross domestic product, we also analyze the impact of foreign direct investment on gross domestic product. As we can see in Table 6, the value of the coefficient is 0.007069, less than the 0.05 significance threshold, thus the null hypothesis, , is rejected; this hypothesis states that the impact of foreign direct investment on gross domestic product is negative. As such, the formulated alternative hypothesis, , is true, stating that the impact of foreign direct investment on gross domestic product in the seven states is positive.
According to Table 6, we observe that the results obtained for the estimated coefficients for the CEEC in Europe are positive; thus, we may conclude that foreign direct investments have a positive impact on the economic growth of the analyzed states. Unlike the significance threshold for remittances, in the case of foreign direct investment in Romania we find the highest of values (1.466 × 10), followed by Czech Republic (1.464 × 10) and Hungary (8.565 × 10). Thus, of the seven states analyzed, the highest influence of foreign direct investment on the level of economic growth is registered in Romania, whereas in the case of remittances, Romania falls second.
According to Table 5 and Table 6, we observe that remittances have a lower influence on economic growth as compared to foreign direct investment in all analyzed states at the time of analysis through the uni-factorial model. In view of obtaining a comparison of the results obtained, we analyze the impact of remittances and foreign direct investments on gross domestic product, through a multi-factorial model. Applying the multi-factorial model regarding the determination of the impact of remittances and foreign direct investment on economic growth, we observe in Table 7 that the model is accepted, the probability being equal to 0.02981, less than the 0.05 threshold. After the application of the method of least squares to the multi-factorial model, we notice that both remittance and foreign direct investments have a positive influence on the level of economic growth.
The multi-factorial econometric models estimated for the impact of remittance and foreign direct investment on GDP, in panel type data for the seven analyzed states in the period 2010–2016, are Equations (7) and (8):
We may then conclude that the impact of foreign direct investment on the increase of GDP is more emphasized than in the case of remittances, both after using a uni-factorial model, as well as through the use of the multi-factorial model.
5. Conclusions
Economic growth is an important aim for each state. The analyzed economic growth determinants, remittance and foreign direct investment, are presented from two perspectives in the specialty literature. There are specialty studies that present the impact of remittance on economic growth as a positive one, underlining their importance in view of an increase in consumption, which, in turn, generates an enhanced demand, leading to an increase of GDP; directing remittances towards the educational sector; health; or even establishment of companies. On the other hand, there are opinions that states’ investments have a negative effect on GDP, as reflected in the Dutch disease phenomenon; inflationist processes; directing remittances to consumption of import products; and sometimes encouraging a lack of work. Some studies have demonstrated that there is no connection between remittances and GDP. As regards foreign direct investment, the situation is similar. Specialists are divided into three groups: those who notice a positive impact of foreign direct investment on economic growth; those who demonstrate the negative relationship between foreign direct investment and GDP; the third group does not correlate economic growth with the evolution of FDI. Although there are studies that analyze the influence of remittances and foreign direct investment as determinants of economic growth, they do not cover the states analyzed in this research, and there is no comparison made.
The economic analysis performed for the seven European states: Romania, Bulgaria, Croatia, Czech Republic, Hungary, Slovakia and Slovenia, was made using the software R, applying the fixed effects model. Following the application of the Hausman test, we note that the fixed effects model is the most appropriate one. The method of least squares and the method of least squares with dummy variables demonstrate the positive influence of remittances and foreign direct investments on economic growth, for all the analyzed states. The most significant influence of remittances on GDP was registered by Czech Republic, Romania and Hungary. In the case of foreign direct investment, out of the seven analyzed states, Romania shows the greatest degree of influence on GDP, followed by Czech Republic and Hungary.
Our empirical analysis points to the fact that remittances along with FDI play an important role in economic growth. Based on the result, we conclude that policy makers should actively attempt to encourage remittances and support to be invested in order to create significant economic benefit. Similar policy as those created for FDI could generate a higher positive impact of remittances at the economic level. This policy should encourage the use of remittances as investments to ensure that remittances contribute to positive economic growth. Even if there is empirical evidence that remittances contribute to economic growth through their positive impact on consumption, savings or investment, we keep some reservation regarding the effects of remittances. We have to admit that countries can face a situation like the "Dutch Disease” in which the influx of remittances creates a real appreciation, or postpones depreciation, of the exchange rate and can affect the findings of our research and further investigation on this issue and in other areas. We expect that further research in this direction cumulated with the result of the present study can improve the perspective on constructing accurate policies that can maximize the positive effect of remittances on economic growth.
Acknowledgments
This paper has been financially supported within the project entitled “Horizon 2020—Doctoral and Postdoctoral Studies: Promoting the National Interest through Excellence, Competitiveness and Responsibility in the Field of Romanian Fundamental and Applied Scientific Research”, Contract Number POSDRU/159/1.5/S/140106. This project is co-financed by the European Social Fund through the Sectoral Operational Programme for Human Resources Development 2007–2013. Investing in people.
Author Contributions
Both authors have equally contributed to this paper, being considered both as first authors.
Conflicts of interests
The authors declare that they have no conflict of interest in relation to this paper.
Abbreviations
The following abbreviations are used in this article:
| CEEC | Central and East European Countries |
| EG | Economic Growth |
| FDI | Foreign Direct Investments |
| GDP | Gross Domestic Product |
| HCA | Hierarchical Cluster Analysis |
| LM | Linear Model |
| OLS | Ordinary Least Square |
| PLM | Panel Linear Model |
| Rem | Remittances |
| UNCTAD | United Nations Conference on Trade and Development |
Appendix A. Gross Domestic Product and Remittances per Country and Year
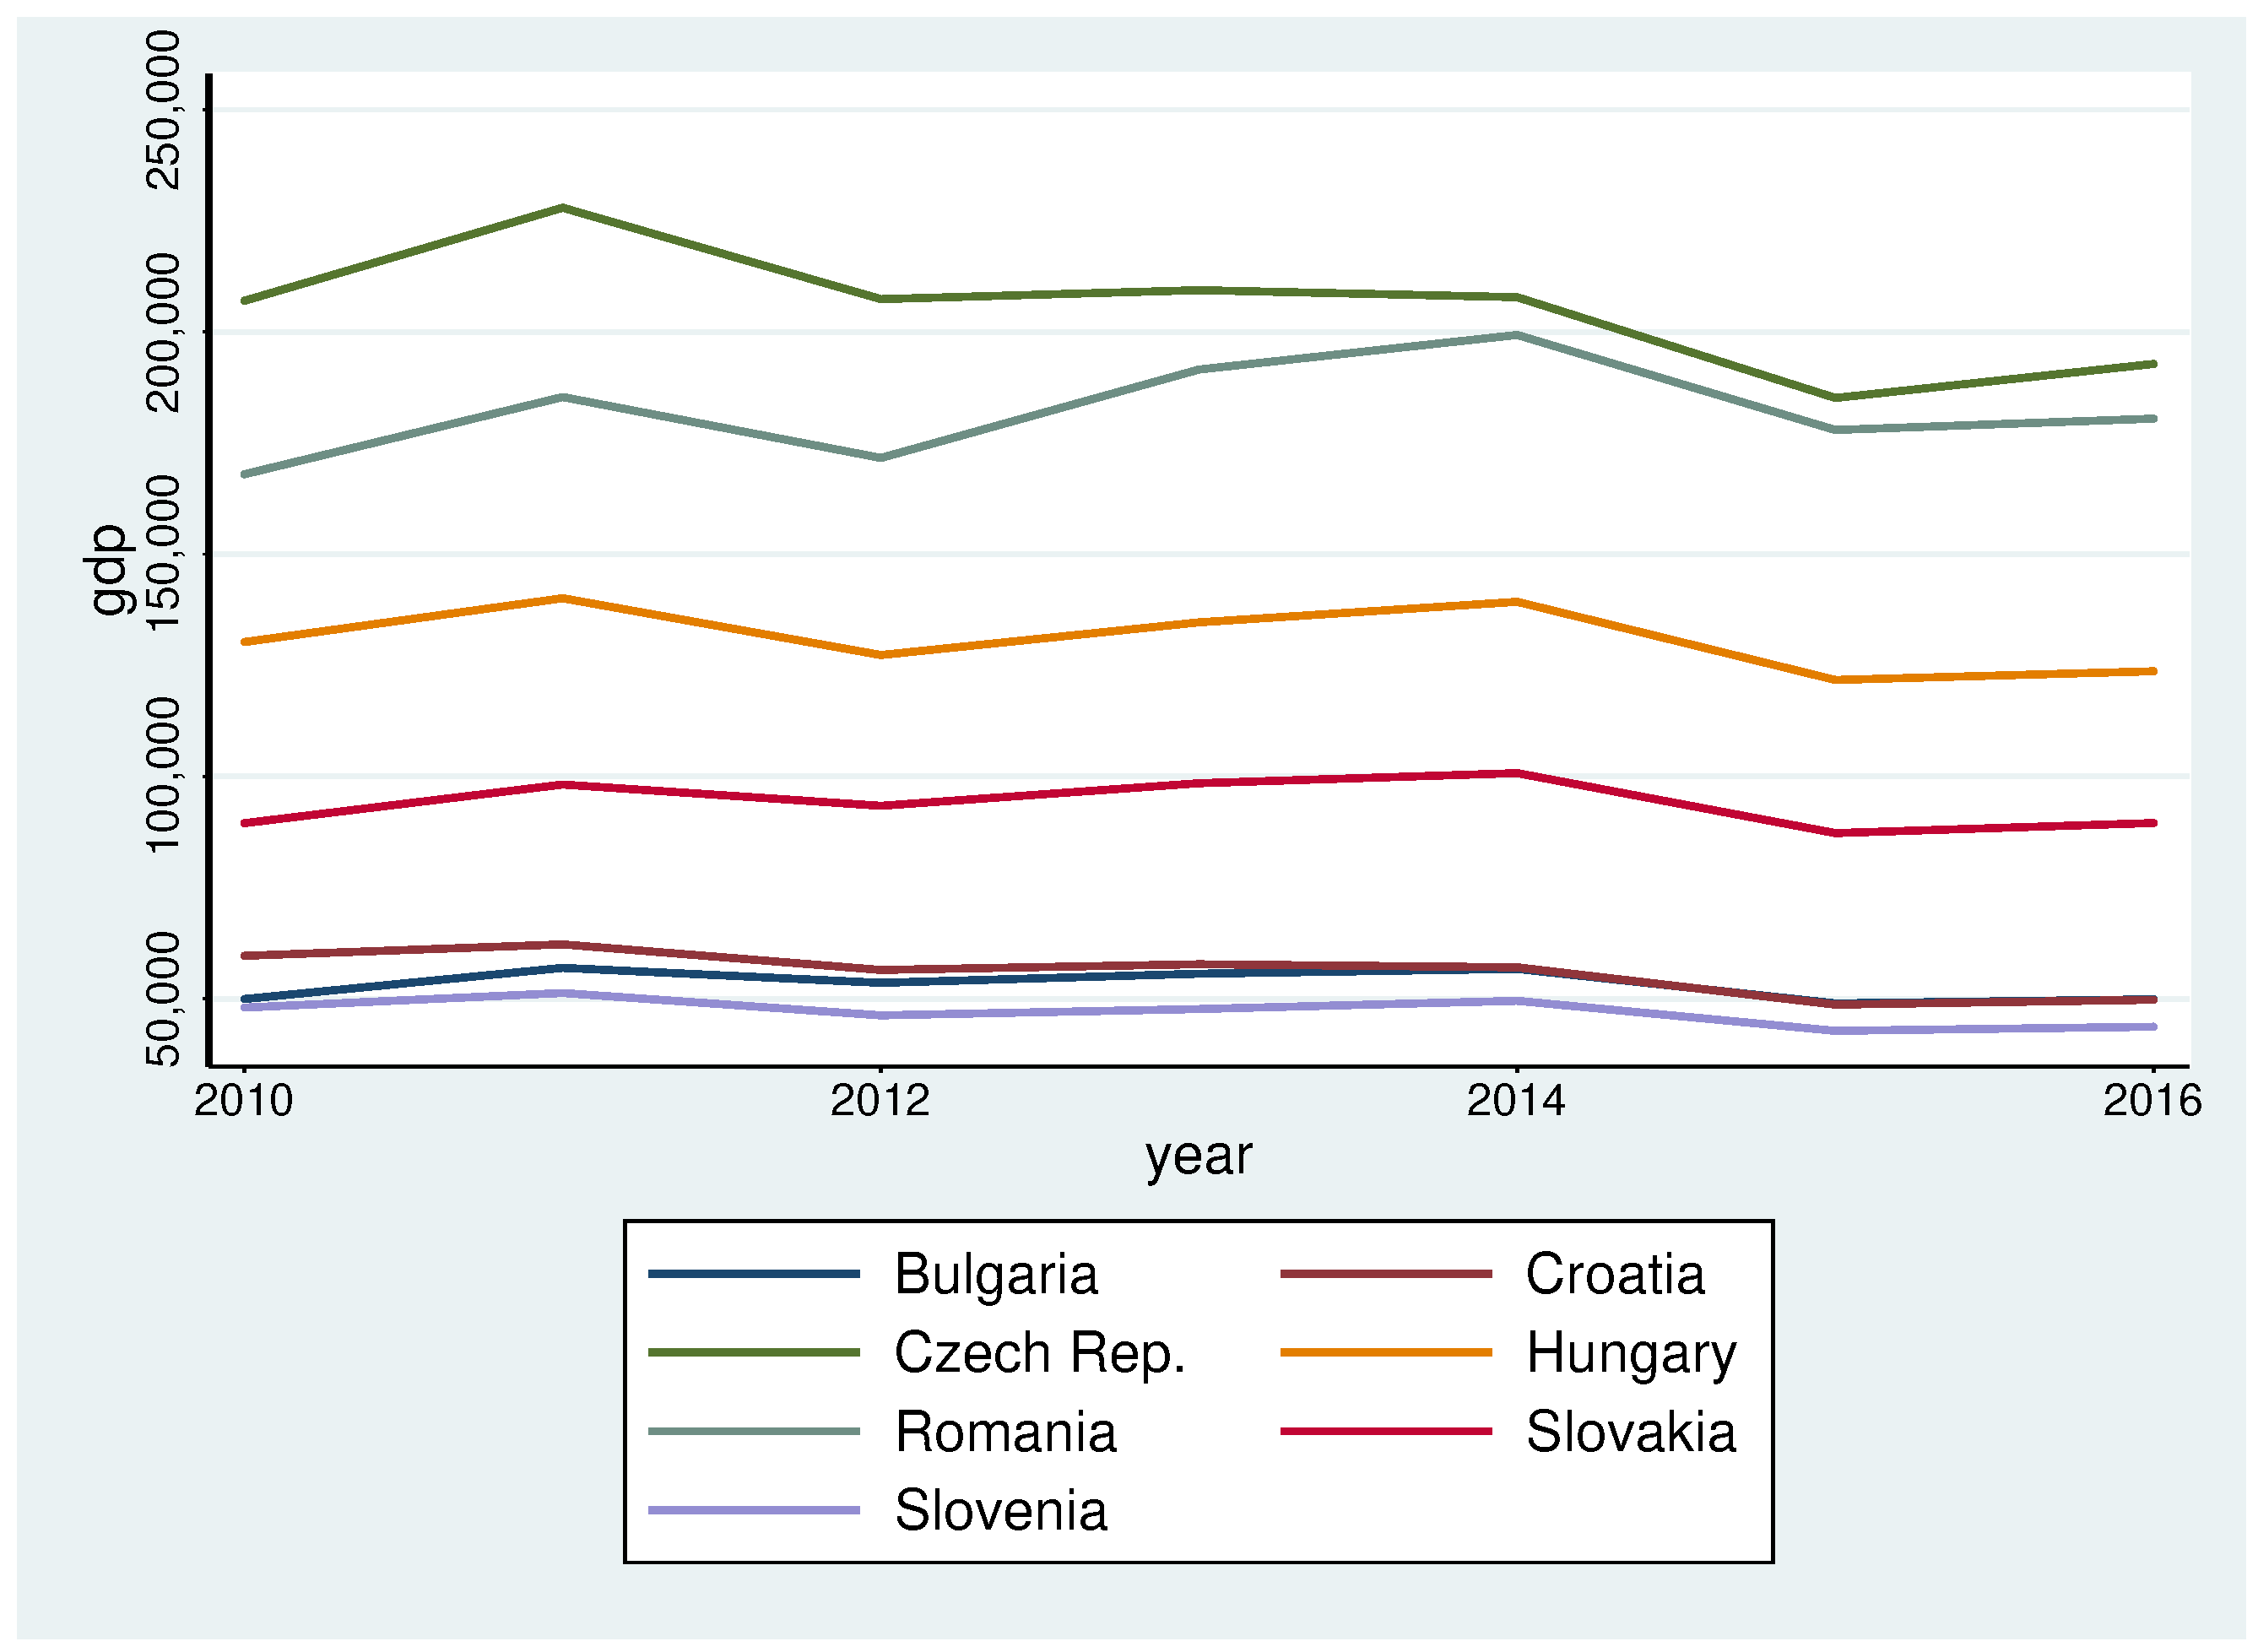
Figure A1.
GDP in CEEC 2010–2016 (billions of $).

Figure A2.
Remittances in CEEC 2010–2016 (billions of $).

Figure A3.
Fitted values of GDP with remittance determinants, 2010–2016 (billions of $).
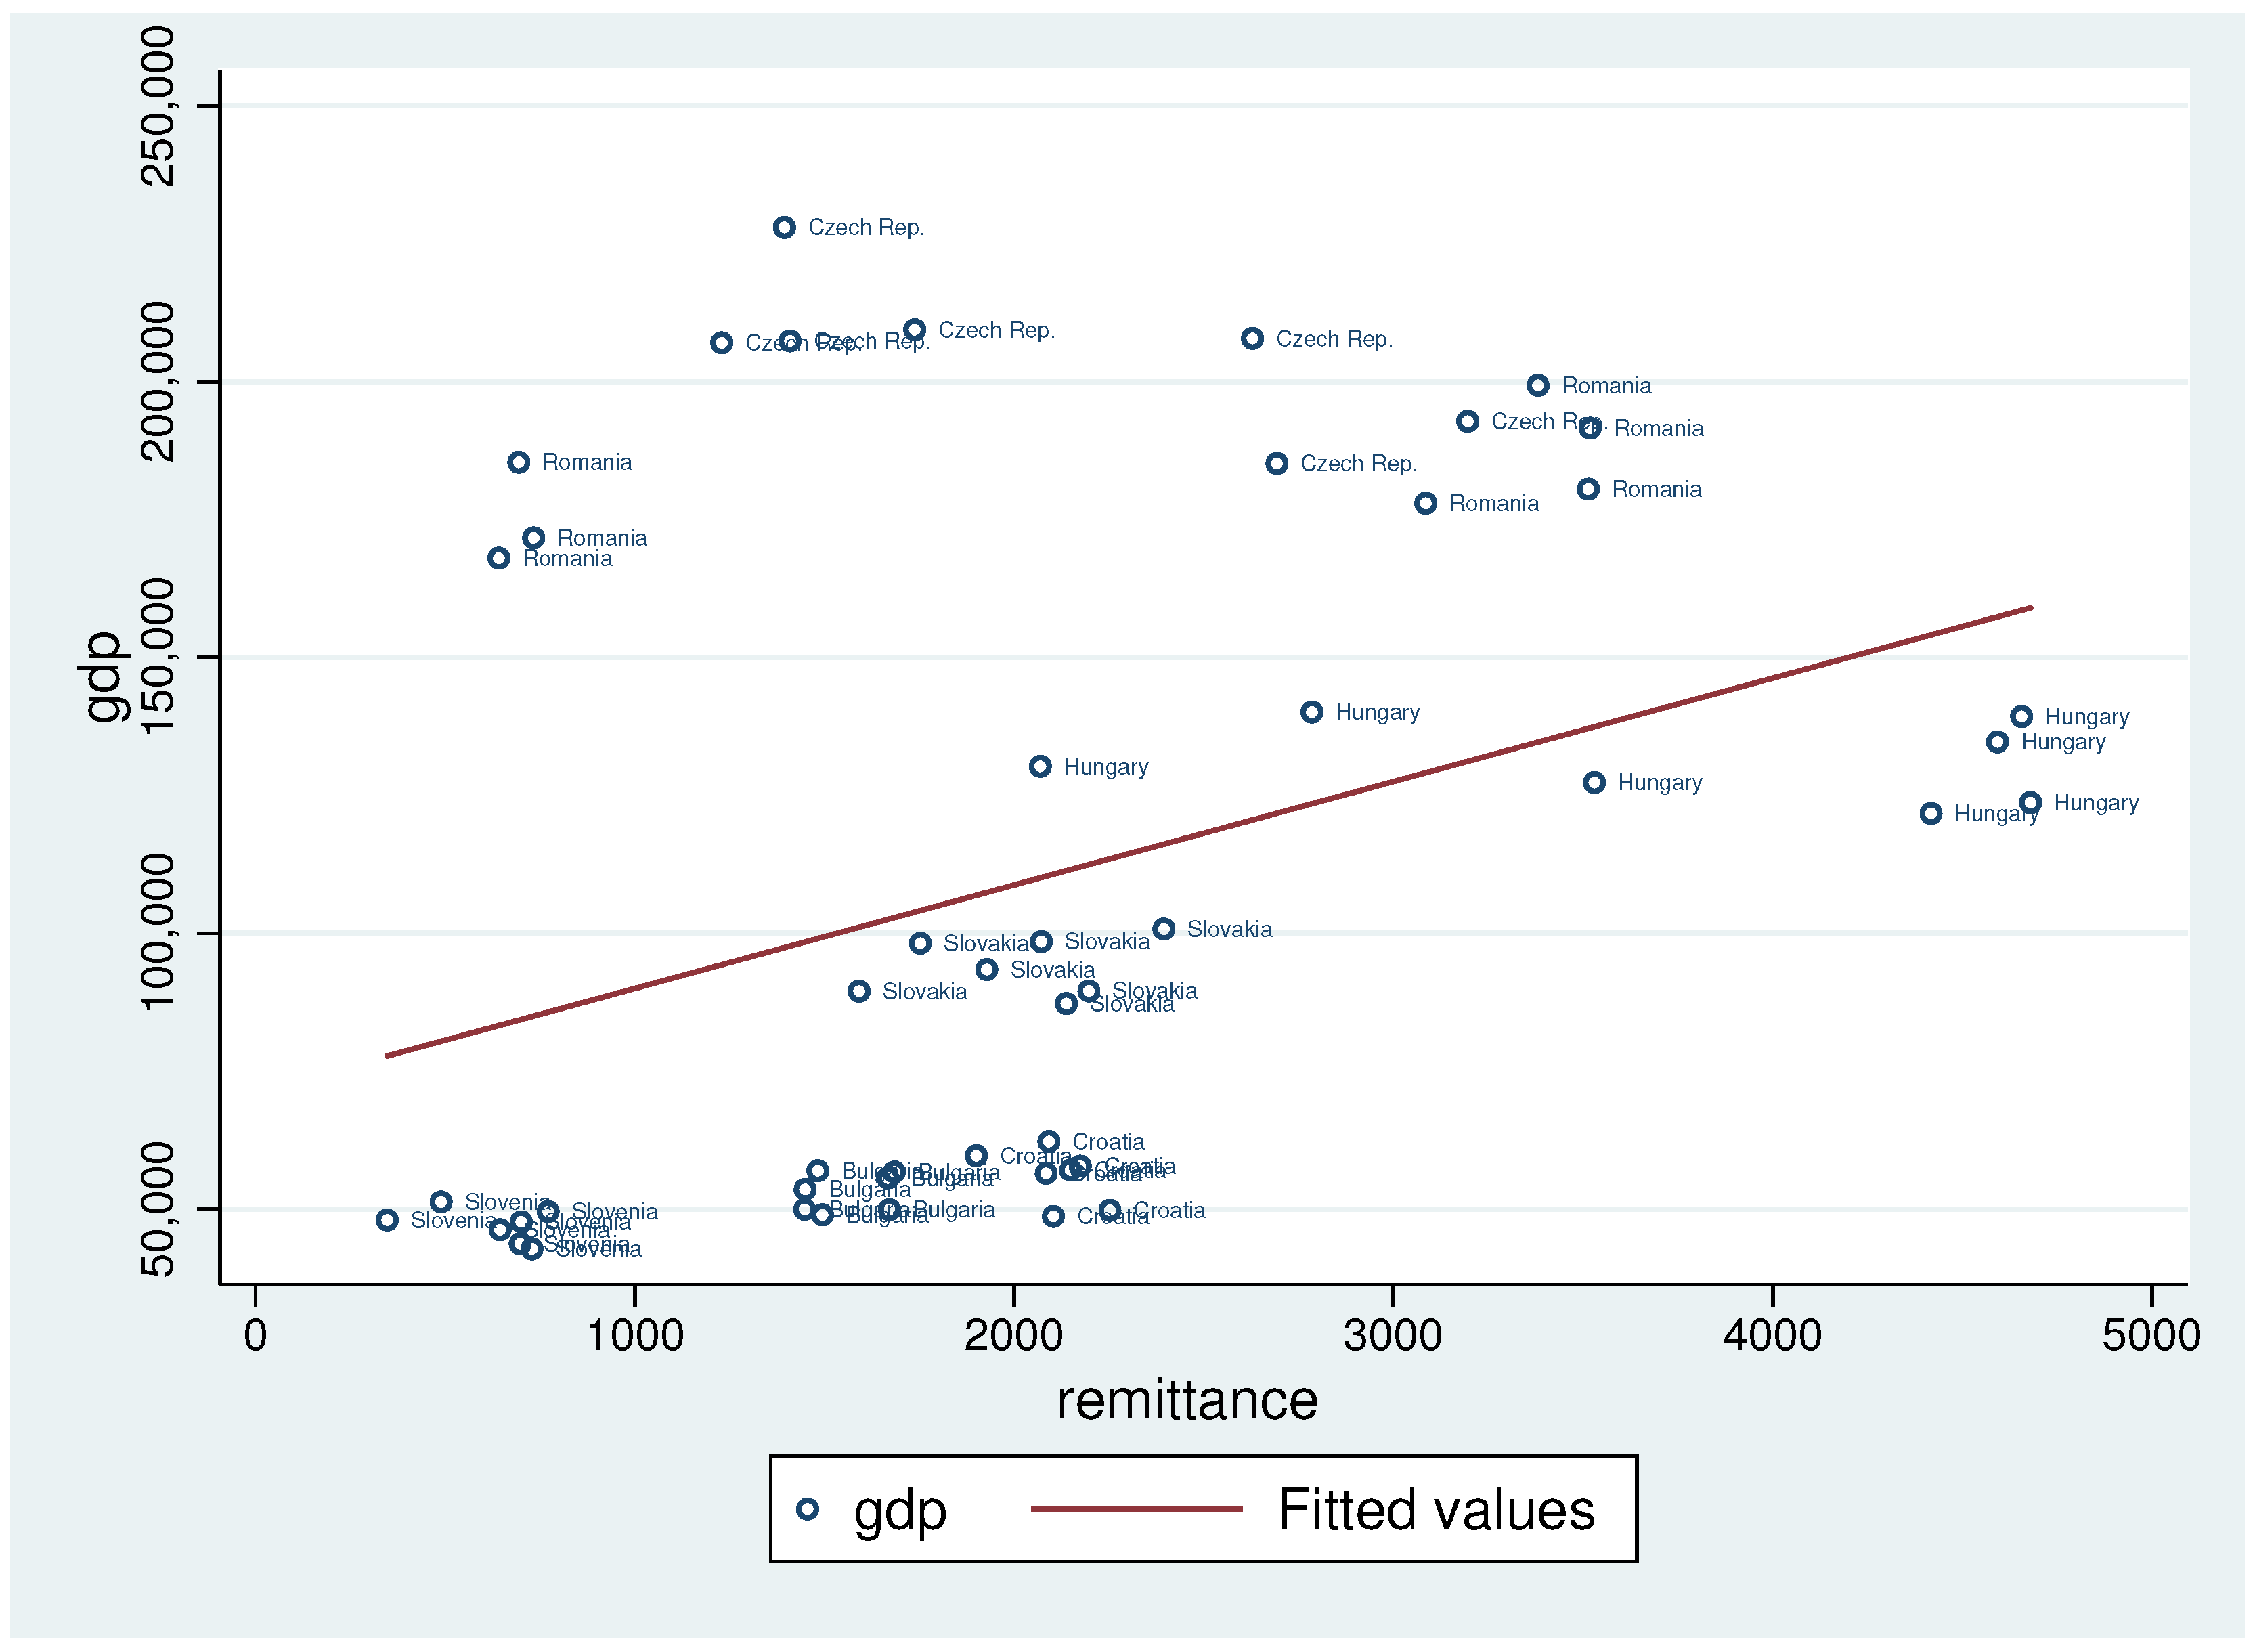
Figure A4.
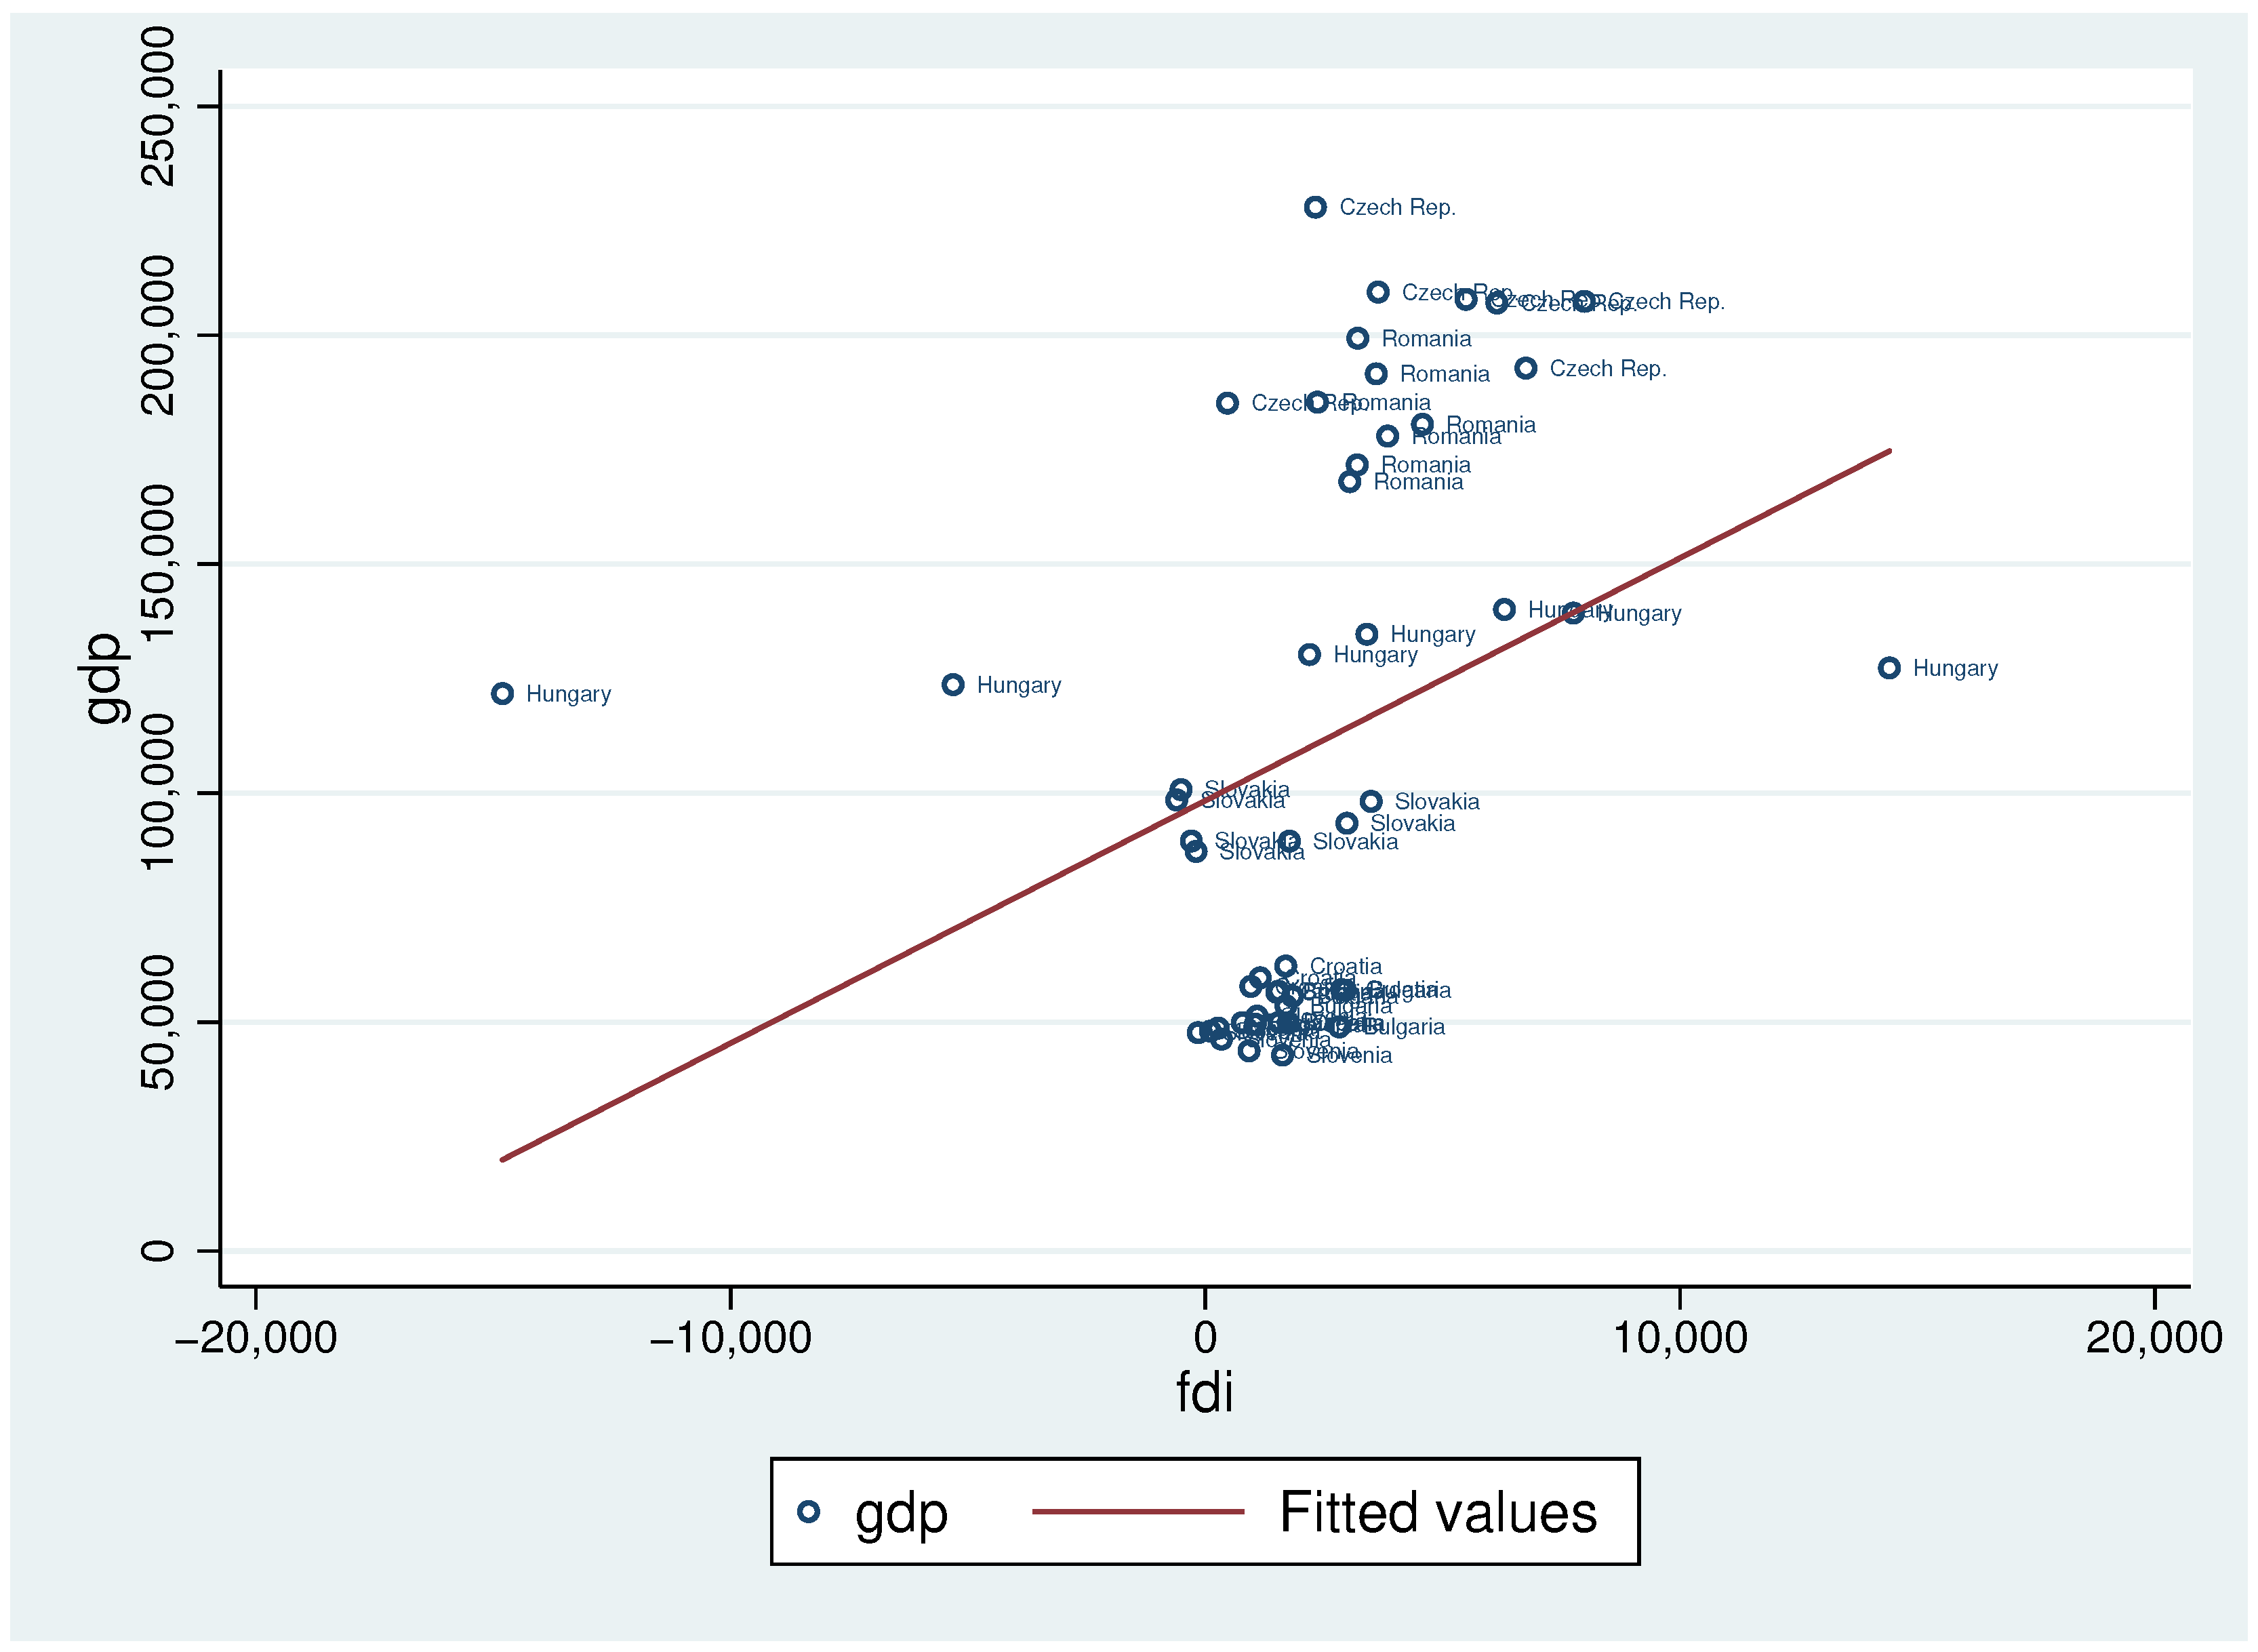
Fitted values of GDP with FDI determinants, 2010–2016 (billions of $).

Table A1.
The impact of Remittance and foreign direct investment entries on gross domestic product.
| Year | Country | Remittances | Remittances | FDI | FDI | GDP | GDP | Population |
|---|---|---|---|---|---|---|---|---|
| $ Million | $/Capita | $ | $/Capita | $ Million | $/Capita | Inhabitants | ||
| 2010 | Romania | 3952 | 194.68 | 68,093 | 3354.50 | 167,998 | 8276.17 | 20.29 |
| 2011 | Romania | 3890 | 193.41 | 69,512 | 3456.24 | 185,362 | 9216.48 | 20.11 |
| 2012 | Romania | 3668.58 | 183.93 | 76,329 | 3826.97 | 171,665 | 8606.91 | 19.94 |
| 2013 | Romania | 3518 | 177.73 | 82,688 | 4177.42 | 191,548 | 9677.07 | 19.79 |
| 2014 | Romania | 3430.7 | 174.57 | 73,086 | 3719.01 | 199,045 | 10,128.48 | 19.65 |
| 2015 | Romania | 2932.53 | 150.3 | 69,112 | 3542.2 | 171,639 | 8797.03 | 19.51 |
| 2016 | Romania | 3484.23 | 176.16 | 71,804 | 3630.5 | 186,690 | 9439.28 | 19.77 |
| 2010 | Croatia | 1287.44 | 298.29 | 31,510 | 7300.74 | 59,665 | 13,824.14 | 4.32 |
| 2011 | Croatia | 1378.44 | 320.41 | 28,179 | 6550.2 | 62,237 | 14,466.99 | 4.3 |
| 2012 | Croatia | 1389.07 | 324.01 | 29,633 | 6912.29 | 56,485 | 13,175.88 | 4.28 |
| 2013 | Croatia | 1496.55 | 350.39 | 29,855 | 6990.16 | 57,770 | 13,526.1 | 4.27 |
| 2014 | Croatia | 1427.47 | 335.4 | 29,660 | 6968.98 | 57,137 | 13,425.04 | 4.25 |
| 2015 | Croatia | 2103.62 | 496.13 | 26,375 | 6220.51 | 48,448 | 11,426.41 | 4.24 |
| 2016 | Croatia | 2189.5 | 520.07 | 27,645 | 6566.5 | 49,772 | 11,822.32 | 4.21 |
| 2010 | Hungary | 2162.46 | 215.92 | 90,845 | 9070.89 | 130,091 | 12,989.61 | 10.01 |
| 2011 | Hungary | 2440.79 | 244.34 | 85,331 | 8542.49 | 139,931 | 14,008.5 | 9.98 |
| 2012 | Hungary | 2187.59 | 219.68 | 104,017 | 10,445.57 | 127,176 | 12,771.23 | 9.95 |
| 2013 | Hungary | 4325.35 | 435.8 | 108,517 | 10,933.7 | 134,402 | 13,541.76 | 9.92 |
| 2014 | Hungary | 4331.41 | 437.95 | 98,885 | 9998.48 | 138,347 | 13,988.57 | 9.89 |
| 2015 | Hungary | 4021 | 408.01 | 92,132 | 9348.75 | 118,516 | 12,025.97 | 9.85 |
| 2016 | Hungary | 4609.25 | 472.59 | 77,721 | 7968.93 | 123,677 | 12,680.91 | 9.75 |
| 2010 | Slovenia | 308.91 | 150.54 | 10,667 | 5198.34 | 48,014 | 23,398.63 | 2.05 |
| 2011 | Slovenia | 433.06 | 210.32 | 11,490 | 5580.37 | 51,291 | 24,910.63 | 2.05 |
| 2012 | Slovenia | 535.55 | 259.6 | 12,203 | 5915.17 | 46,240 | 22,413.96 | 2.06 |
| 2013 | Slovenia | 592.88 | 287.1 | 12,269 | 5941.4 | 47,676 | 23,087.65 | 2.06 |
| 2014 | Slovenia | 715.76 | 346.44 | 12,299 | 5953.04 | 49,491 | 23,954.98 | 2.06 |
| 2015 | Slovenia | 728.82 | 352.42 | 11,847 | 5728.72 | 42,342 | 20,474.85 | 2.06 |
| 2016 | Slovenia | 364.3 | 175.31 | 12,731 | 6126.56 | 43,991 | 21,169.87 | 2.07 |
| 2010 | Slovakia | 1591.28 | 294.29 | 50,328 | 9307.93 | 89,249 | 16,506.19 | 5.4 |
| 2011 | Slovakia | 1752.74 | 323.92 | 51,980 | 9606.35 | 97,926 | 18,097.57 | 5.41 |
| 2012 | Slovakia | 1621.92 | 299.52 | 55,124 | 10,179.87 | 93,050 | 17,183.74 | 5.41 |
| 2013 | Slovakia | 2071.75 | 382.31 | 58,021 | 10,706.95 | 98,034 | 18,090.79 | 5.41 |
| 2014 | Slovakia | 2394.96 | 441.63 | 52,488 | 9678.77 | 100,249 | 18,485.89 | 5.42 |
| 2015 | Slovakia | 2137.57 | 393.94 | 48,163 | 8876.33 | 86,536 | 15,948.39 | 5.42 |
| 2016 | Slovakia | 2119 | 389.3 | 41,615 | 7644.19 | 89,529 | 16,445.44 | 5.44 |
| 2010 | Czech Rep. | 2065.69 | 196.6 | 128,504 | 12,230.32 | 207,016 | 19,702.67 | 10.5 |
| 2011 | Czech Rep. | 1849.2 | 175.54 | 120,569 | 11,445.69 | 227,313 | 21,578.98 | 10.53 |
| 2012 | Czech Rep. | 2003.24 | 189.97 | 136,493 | 12,943.85 | 206,442 | 19,577.24 | 10.54 |
| 2013 | Czech Rep. | 2270.01 | 215.26 | 134,085 | 12,715.5 | 208,328 | 19,756.09 | 10.54 |
| 2014 | Czech Rep. | 1892.88 | 179.53 | 121,512 | 11,525.37 | 205,270 | 19,469.79 | 10.54 |
| 2015 | Czech Rep. | 2692.96 | 255.42 | 113,057 | 10,723.41 | 181,089 | 17,176.23 | 10.54 |
| 2016 | Czech Rep. | 3126.39 | 294.64 | 115,204 | 10,857.04 | 192,925 | 18,181.6 | 10.61 |
| 2010 | Bulgaria | 1447.72 | 179.95 | 47,231 | 6376.53 | 49,939 | 6742.13 | 7.4 |
| 2011 | Bulgaria | 1483.18 | 201.65 | 56,952 | 6442.01 | 56,952 | 7743.3 | 7.35 |
| 2012 | Bulgaria | 1375.89 | 188.37 | 49,400 | 6763.41 | 53,575 | 7335.02 | 7.3 |
| 2013 | Bulgaria | 1666.96 | 229.83 | 51,195 | 7058.45 | 55,628 | 7669.65 | 7.25 |
| 2014 | Bulgaria | 1684.2 | 233.88 | 48,179 | 6690.59 | 56,718 | 7876.4 | 7.2 |
| 2015 | Bulgaria | 1443.1 | 201.83 | 42,106 | 5888.95 | 48,745 | 6817.48 | 7.15 |
| 2016 | Bulgaria | 1665.57 | 233.6 | 42,165 | 5913.74 | 49,868 | 6994.1 | 7.13 |
References
- Griffin, K. The Effect of Aid and Other Resource Transfers on Savings and Growth in Less Developed Countries: A Comment. Econ. J. 1973, 83, 863–866. [Google Scholar] [CrossRef]
- Baltagi, B.H.; Levin, D. Estimating Dynamic Demand for Cigarettes Using Panel Data: The Effects of Bootlegging, Taxation and Advertising Reconsidered. Rev. Econ. Stat. 1986, 68, 148–155. [Google Scholar] [CrossRef]
- Buthe, T.; Milner, H. The Politics of Foreign Direct Investment into Developing Countries: Increasing FDI through International Trade Agreements. Am. J. Political Sci. 2008, 52, 741–762. [Google Scholar] [CrossRef]
- Te Velde, D.W. Policies Towards Foreign Direct Investment in Developing Countries: Emerging Best-Practicies and Outstanding Issues. 2001. Available online: https://www.odi.org/sites/odi.org.uk/files/odi-assets/publications-opinion-files/5543.pdf (accessed on 3 December 2017).
- Loewendahl, H. A Framework for FDI Promotion. Transnational Corporations. 2001. Available online: http://www.investmentmap.org/docs/FDI-2547.pdf (accessed on 3 December 2017).
- Caves, R. Multinational Enterprise and Economic Analysis; Cambridge University Press: Cambridge, UK, 1996; p. 133. ISBN 0-521-47858-8. [Google Scholar]
- Glass, A.J.; Saggi, K. Multinational Firms and Technology Transfer. Scand. J. Econ. 2002, 104, 495–513. [Google Scholar] [CrossRef]
- Saggi, K. Trade, Foreign Direct Investment, and International Technology Transfer: A Survey. World Bank Res. Obs. 2002, 17, 191–235. [Google Scholar] [CrossRef]
- Caves, R. Multinational Enterprise and Economic Analysis; Cambridge University Press: Cambridge, UK, 1996; p. 165. ISBN 0-521-47858-8. [Google Scholar]
- Borensztein, E.; De Gregorio, J.; Lee, J.W. How does foreign investment affect growth? J. Int. Econ. 1998, 45, 115–135. [Google Scholar] [CrossRef]
- Blomstrom, M.; Lipsey, R.; Zejan, M. What Explains Developing Country Growth? The National Bureau of Economic Research Working Paper No. 4132. 1992. Available online: http://www.nber.org/papers/w4132.pdf (accessed on 15 Juanuary 2018). [CrossRef]
- Balasubramanyam, V.N.; Salisu, M.; Sapsford, D. Foreign Direct Investment and Growth in EP and IS Countries. Econ. J. 1996, 106, 92–105. [Google Scholar] [CrossRef]
- Nair-Reichert, U.; Weinhold, D. Causality Tests for Cross-Country Panels: A New Look at FDI and Economic Growth in Developing Countries. Oxf. Bull. Econ. Stat. 2001, 63, 153–171. [Google Scholar] [CrossRef]
- The United Nations Conference on Trade and Development (UNCTAD). Global Foreign Direct Investment (FDI) Flows Slip in 2016, modest recovery expected in 2017. Global Investment Trend Monitor, No. 25. 2017. Available online: http://unctad.org/en/PublicationsLibrary/webdiaeia2017d1_en.pdf (accessed on 15 January 2018).
- Nunnenkamp, P.; Spatz, J. Foreign Direct Investment and Economic Growth in Developing Countries: How Relevant Are Host-Country and Industry Characteristics? Kiel Working Paper No. 1176. 2003. Available online: https://www.econstor.eu/handle/10419/3028 (accessed on 3 December 2017).
- Mottaleb, K.A. Determinants of Foreign Direct Investment and Its Impact on Economic Growth in Developing Countries. Munich Personal RePEc Archive 945. 2007. Available online: https://mpra.ub.uni-muenchen.de/9457/1/MPRA_paper_9457.pdf (accessed on 3 December 2017).
- Alfaro, L.; Chanda, A.; Kalemli-Ozcan, S.; Sayek, S. FDI and economic growth: The role of local financial markets. J. Int. Econ. 2004, 64, 89–112. [Google Scholar] [CrossRef]
- Azman-Saini, W.N.W.; Law, S.H.; Ahmad, A.H. FDI and economic growth: New evidence on the role of financial markets. Econ. Lett. 2010, 107, 211–213. [Google Scholar] [CrossRef]
- Carkovic, M.V.; Levine, R. Does Foreign Direct Investment Accelerate Economic Growth? U of Minnesota Department of Finance Working Paper. 2002. Available online: http://siteresources.worldbank.org/INTFR/Resources/fdi.pdf (accessed on 3 December 2017).
- Beugelsdijk, S.; Smeets, R.; Zwinkels, R. The impact of horizontal and vertical FDI on host’s country economic growth. Int. Bus. Rev. 2008, 17, 452–472. [Google Scholar] [CrossRef]
- United Nations Population Division, Trends in Total Migrant Stock: 2017 Revision. Available online: http://www.un.org/en/development/desa/population/migration/data/estimates2/estimates17.shtml (accessed on 15 January 2018).
- World Bank. Migration and Remittances. Recent Developments and Outlook. Migration and Development Brief 26. 2016. Available online: http://pubdocs.worldbank.org/en/661301460400427908/MigrationandDevelopmentBrief26.pdf (accessed on 3 December 2017).
- Eurostat. Personal Remittances Statistics 2016. 2016. Available online: http://ec.europa.eu/eurostat/statistics-explained/index.php/Personal_remittances_statistics (accessed on 3 December 2017).
- World Bank Staff Calculations, World Development Indicators and World Bank Development Prospects Group. Available online: http://pubdocs.worldbank.org/en/661301460400427908/MigrationandDevelopmentBrief26.pdf (accessed on 15 January 2018).
- Barajas, A.; Chami, R.; Fullenkamp, C.; Gapen, M.; Montiel, P. Do Workers’ Remittances Promote Economic Growth? International Monetary Fund Working Paper No. 153. 2009. Available online: https://www.imf.org/en/Publications/WP/Issues/2016/12/31/Do-Workers-Remittances-Promote-Economic-Growth-23108 (accessed on 3 December 2017).
- Posso, A. Remittances and aggregate labor suply: Evidence from sixty-six developing nations. Dev. Econ. 2012, 50, 25–39. [Google Scholar] [CrossRef]
- Chami, R.; Fullenkamp, C.; Jahjah, S. Are Immigrant Remittance Flows a Source of Capital for Develpment? International Monetary Fund Working Paper No. 189. 2003. Available online: https://www.imf.org/external/pubs/ft/wp/2003/wp03189.pdf (accessed on 3 December 2017).
- Hanson, G.H. Emigration, Remittances, and Labor Force Participation in Mexico. Integr. Trade J. 2007, 27, 73–103. [Google Scholar]
- Entzinger, H. Return migration in Western Europe: Curent policy trends and their implications, in particular for the second generation. Int. Migr. 1985, 23, 263–290. [Google Scholar] [CrossRef] [PubMed]
- Adams, R.H. Remittances, Household Expenditure and Investment in Guatemala. World Bank Policy Research Working Paper 3532. 2005. Available online: https://elibrary.worldbank.org/doi/abs/10.1596/1813-9450-3532 (accessed on 3 December 2017).
- Zarate-Hoyos, G.A. Consumption and Remittances in Migrant Households: Toward a Productive Use of Remittance. Contemp. Econ. Policy 2004, 22, 555–565. [Google Scholar] [CrossRef]
- Ratha, D. Leveraging Remittances for Development. Migration, Trade and Development Proceedings of the 2006 Conference on Migration. Trade and Development. 2006. Available online: http://citeseerx.ist.psu.edu/viewdoc/download?doi=10.1.1.437.260&rep=rep1&type=pdf (accessed on 3 December 2017).
- Lartey, E.K.K.; Mandelman, F.S.; Acosta, P.A. Remittances, Exchange Rate Regimes, and the Dutch Disease: A Panel Data Analysis. Rev. Int. Econ. 2012, 20, 377–395. [Google Scholar] [CrossRef]
- Lopez, H.; Molina, L.; Bussolo, M. Remittances and the Real Exchange Rate. World Bank Policy Research Working Paper 4213. 2007. Available online: https://elibrary.worldbank.org/doi/abs/10.1596/1813-9450-3532 (accessed on 3 December 2017).
- Adams, H.R.; Page, J. Do international migration and remittances reduce poverty in developing countries. World Dev. 2005, 33, 1645–1669. [Google Scholar] [CrossRef]
- Ratha, D. The Impact of Remittances on Economic Growth and Poverty Reduction. Migration Policy Institute, Policy Brief. No. 8. 2013. Available online: https://www.migrationpolicy.org/research/impact-remittances-economic-growth-and-poverty-reductionl (accessed on 3 December 2017).
- Giannetti, S.; Federici, D.; Raitano, M. Migrant remittances and inequality in Central-Eastern Europe. Rev. Int. Econ. 2009, 23, 289–307. [Google Scholar] [CrossRef]
- Giuliano, P.; Ruiz-Arranz, M. Remittances, financial development and growth. J. Dev. Econ. 2009, 90, 144–152. [Google Scholar] [CrossRef]
- Pradhan, G.; Upadhyay, M.; Upadhyaya, K. Remittances and Economic Growth in Developing Countries. Eur. J. Dev. Res. 2008, 20, 497–506. [Google Scholar] [CrossRef]
- Burnside, C.; Dollar, D. Aid, policies, and growth. Am. Econ. Rev. 2000, 90, 847–868. [Google Scholar] [CrossRef]
- Catrinescu, N.; Leon-Ledesma, M.; Piracha, M.; Quillin, B. Remittances, institutions, and economic growth. World Dev. 2009, 37, 81–92. [Google Scholar] [CrossRef]
- Ward, J.H., Jr. Hierarchical Grouping to Optimize an Objective Function. J. Am. Stat. Assoc. 1963, 58, 236–244. [Google Scholar] [CrossRef]
- Müllner, D. Fastcluster: Fast Hierarchical, Agglomerative Clustering Routines for R and Python. J. Stat. Softw. 2013, 53, 1–18. [Google Scholar] [CrossRef]
- Witten, D. Sparcl: Implements the sparse clustering methods of Witten and Tibshirani, “A framework for feature selection in clustering”. J. Am. Stat. Assoc. 2010, 105, 713–726. [Google Scholar] [CrossRef] [PubMed]
- Croissant, Y.; Millo, G. Panel Data Econometrics in R: The plm Package. J. Stat. Softw. 2008, 27, 1–43. [Google Scholar] [CrossRef]
- R Core Team. R: A Language and Environment for Statistical Computing; R Foundation for Statistical Computing: Vienna, Austria, 2017; Available online: https://www.R-project.org/ (accessed on 3 December 2017).
- Baltagi, B.H. Econometric Analysis of Panel Data, 3rd ed.; John Wiley & Sons: Hoboken, NJ, USA, 2008; pp. 26–36. ISBN 978-0-470-01456-1. [Google Scholar]
Figure 1.
FDI inflows worldwide, 2005–2016 (billions of $) [14].
Figure 1.
FDI inflows worldwide, 2005–2016 (billions of $) [14].
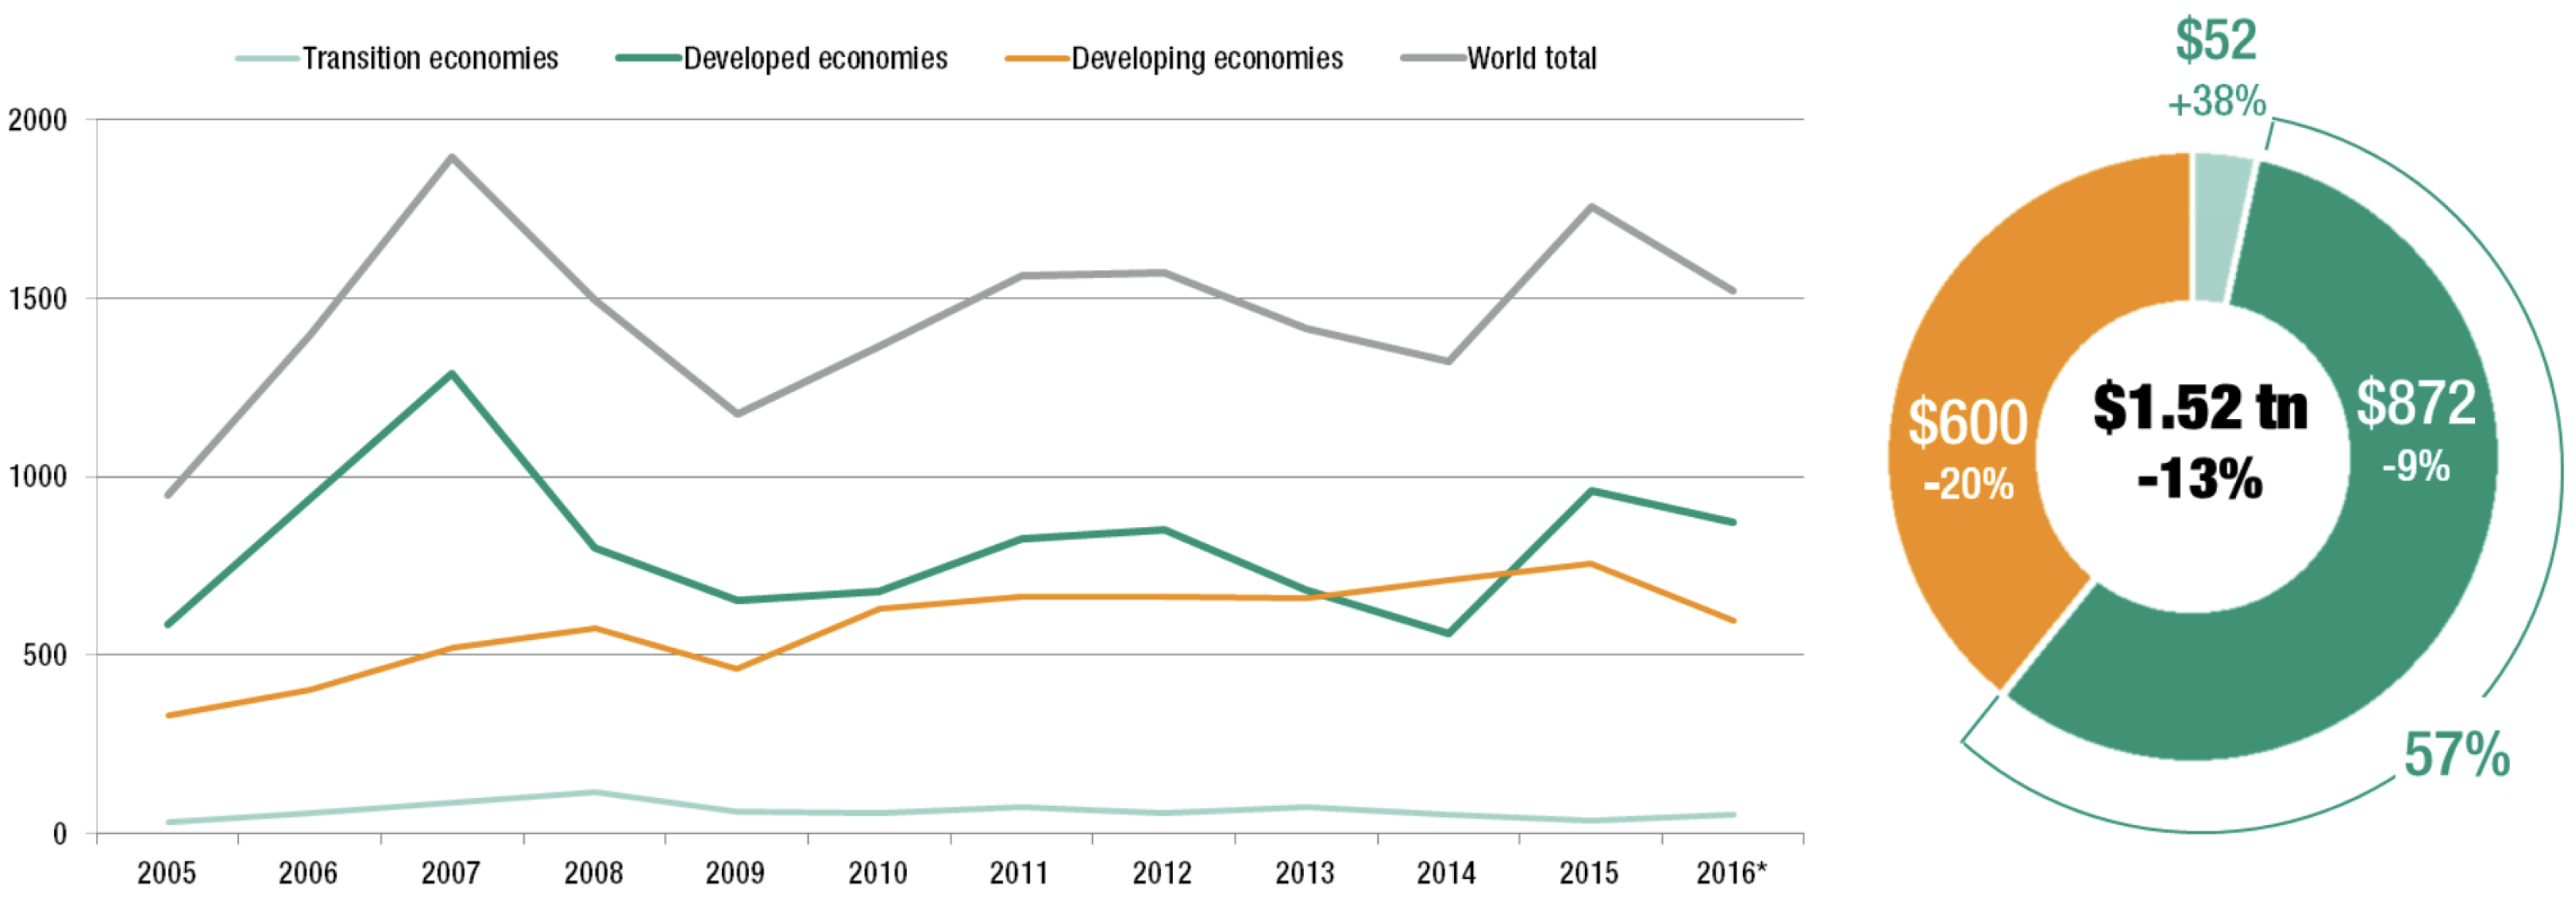
Figure 2.
Global flows of FDI, remittances, private debt and ODA1990–2017 (billions of $) [24].
Figure 2.
Global flows of FDI, remittances, private debt and ODA1990–2017 (billions of $) [24].

Figure 3.
Hierarchical cluster analysis dendrogram of UE28 by GDP: 2010–2016.
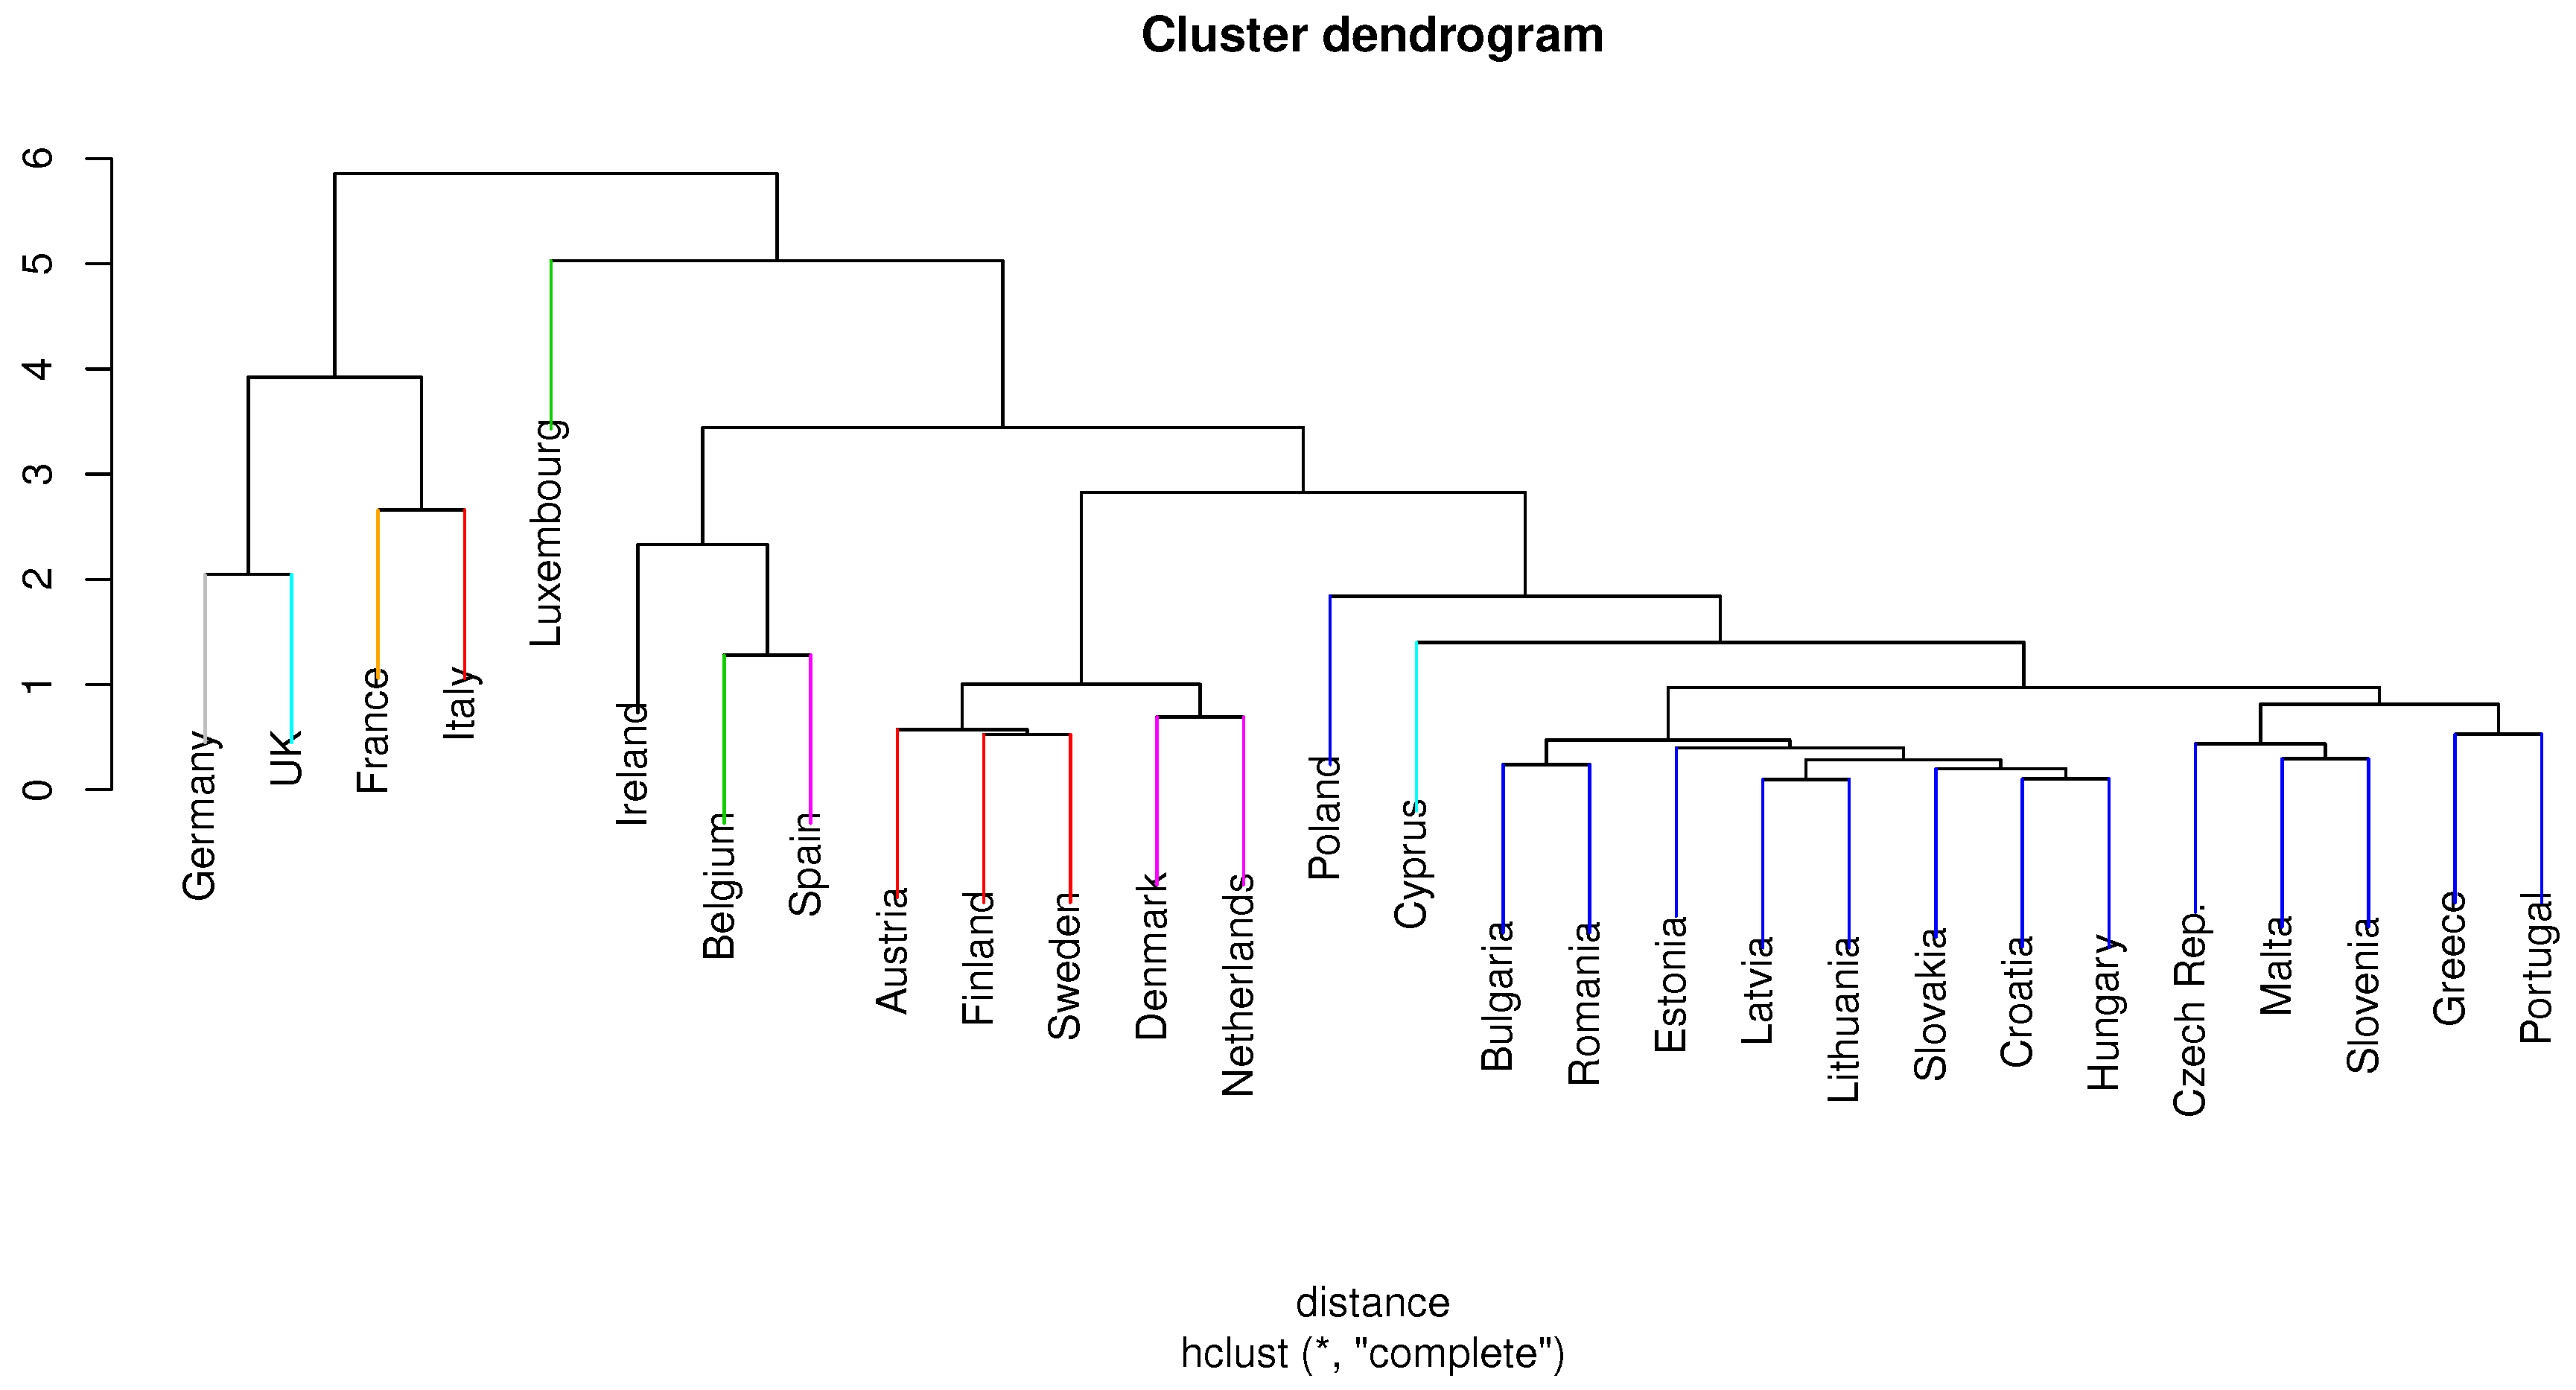
Table 1.
The impact of remittances on gross domestic product using the least squares method.
| Indicator | Estimated Coefficients | Standard Error | Test t | Pr(>) | Pr Sign |
|---|---|---|---|---|---|
| Gross Domestic Product | 34,408.575 | 15,708.339 | 2.190 | 0.0344 | ∗ |
| Remittance Entries | 36.719 | 6.768 | 5.425 | 3.03 × 10 |
Significance threshold: 0 ‘’ 0.001 ‘’ 0.01 ‘∗’ 0.05 ‘.’ 0.1 ‘ ’ 1.
Table 2.
The impact of foreign direct investment on gross domestic product with squares method.
| Indicator | Estimated Coefficients | Standard Error | Test t | Pr (>) | Pr Sign |
|---|---|---|---|---|---|
| GDP | 2.053 | 0.899 | 2.283 | 0.0278 | ∗ |
| FDI entries | 1.436 | 0.124 | 11.562 | 2.5 × 10 |
Significance threshold: 0 ‘’ 0.001 ‘’ 0.01 ‘∗’ 0.05 ‘.’ 0.1 ‘ ’ 1.
Table 3.
Hausman Test.
| Chisq | Degrees of Freedom | p-Value |
|---|---|---|
| 3.674 | 1 | 0.0141 |
Table 4.
The impact of remittance and FDI entries on GDP with the fixed effects method.
| Indicator | Estimated Coefficients | Standard Error | Test t | Pr (>) | Pr Sign |
|---|---|---|---|---|---|
| Remittance Entries | 2.8986 | 2.9791 | 0.973 | 0.03374 | ∗ |
| Foreign Direct Investment Entries | 3.4736 | 0.2538 | 1.866 | 0.00706 |
Significance threshold: 0 ‘’ 0.001 ‘’ 0.01 ‘∗’ 0.05 ‘.’ 0.1 ‘ ’ 1.
Table 5.
The impact of remittance entries on GDP using least squares with dummy variables: fixed effect.
Table 5.
The impact of remittance entries on GDP using least squares with dummy variables: fixed effect.
| Indicator | Estimated Coefficients | Standard Error | Test t | Pr (>) | Pr Sign |
|---|---|---|---|---|---|
| Remittance entries | 2.299 | 2.979 | 0.973 | 0.03374 | ∗ |
| Bulgaria | 257,934.039 | 5668.882 | 10.220 | 6.677 × 10 | |
| Croatia | 61,344.733 | 5706.595 | 10.750 | 1.77 × 10 | |
| Czech Republic | 212,080.688 | 7242.575 | 29.282 | <2 × 10 | |
| Hungary | 140,815.648 | 10,279.450 | 13.699 | 2.12 × 10 | |
| Romania | 191,543.727 | 11,182.098 | 17.129 | <2 × 10 | |
| Slovakia | 99,763.489 | 6725.372 | 14.834 | <2 × 10 | |
| Slovenia | 49,110.447 | 3864.958 | 21.707 | 1.82 × 10 |
Significance threshold: 0 ‘’ 0.001 ‘’ 0.01 ‘∗’ 0.05 ‘.’ 0.1 ‘ ’ 1.
Table 6.
The impact of FDI entries on GDP using OLS with dummy variables: fixed effect.
| Indicator | Estimated Coefficients | Standard Error | Test t | Pr (>) | Pr Sign |
|---|---|---|---|---|---|
| FDI entries | 3.736 | 0.253 | 1.866 | 0.007069 | |
| Bulgaria | 31,006 | 12,540 | 2.477 | ||
| Croatia | 43,130 | 8145 | 5.295 | 7.11 × 10 | |
| Czech Republic | 14,640 | 32,080 | 4562 | 6.30 × 10 | |
| Hungary | 85,650 | 24,760 | 3.460 | ||
| Romania | 146,643 | 18,870 | 7.768 | 4.88 × 10 | |
| Slovakia | 69,220 | 13,790 | 5.019 | 1.62 × 10 | |
| Slovenia | 41,920 | 4513 | 9.290 | 7.44 × 10 |
Significance threshold: 0 ‘’ 0.001 ‘’ 0.01 ‘∗’ 0.05 ‘.’ 0.1 ‘ ’ 1.
Table 7.
The impact of remittance and foreign direct investment entries on the gross domestic product using the method of least squares with the multi-factorial model.
Table 7.
The impact of remittance and foreign direct investment entries on the gross domestic product using the method of least squares with the multi-factorial model.
| Indicator | Estimated Coefficients | Standard Error | Test t | Pr (>) | Pr Sign |
|---|---|---|---|---|---|
| Intercept | 1.055 | 1 | 1.055 | 0.02981 | |
| Remittances Entries | 1.042 | 0.520 | 2.001 | 0.04924 | |
| FDI entries | 2.251 | 1.151 | 1.954 | 0.01776 |
Significance threshold: 0 ‘’ 0.001 ‘’ 0.01 ‘∗’ 0.05 ‘.’ 0.1 ‘ ’ 1.
© 2018 by the authors. Licensee MDPI, Basel, Switzerland. This article is an open access article distributed under the terms and conditions of the Creative Commons Attribution (CC BY) license (http://creativecommons.org/licenses/by/4.0/).
Share and Cite
MDPI and ACS Style
Comes, C.-A.; Bunduchi, E.; Vasile, V.; Stefan, D. The Impact of Foreign Direct Investments and Remittances on Economic Growth: A Case Study in Central and Eastern Europe. Sustainability 2018, 10, 238. https://doi.org/10.3390/su10010238
AMA Style
Comes C-A, Bunduchi E, Vasile V, Stefan D. The Impact of Foreign Direct Investments and Remittances on Economic Growth: A Case Study in Central and Eastern Europe. Sustainability. 2018; 10(1):238. https://doi.org/10.3390/su10010238
Chicago/Turabian StyleComes, Calin-Adrian, Elena Bunduchi, Valentina Vasile, and Daniel Stefan. 2018. "The Impact of Foreign Direct Investments and Remittances on Economic Growth: A Case Study in Central and Eastern Europe" Sustainability 10, no. 1: 238. https://doi.org/10.3390/su10010238
Note that from the first issue of 2016, this journal uses article numbers instead of page numbers. See further details here.