Analysis of Relationships among Organizational Barriers to Energy Efficiency Improvement: A Case Study in Indonesia’s Steel Industry

1
Department of Industrial Engineering, University of National Development “Veteran”, Yogyakarta 55584, Indonesia
2
Department of Management and Engineering, Division of Energy System, Linköping University, Linköping SE-581 83, Sweden
*
Author to whom correspondence should be addressed.
Sustainability 2018, 10(1), 216; https://doi.org/10.3390/su10010216
Submission received: 11 December 2017
/
Revised: 6 January 2018
/
Accepted: 11 January 2018
/
Published: 17 January 2018
(This article belongs to the Special Issue Sustainable Energy Policy and Policy Implications—Good Examples and Critical Reflections)
Abstract
:The aim of this paper is to analyze and rank the managerial-organizational barriers to energy efficiency improvement from an industry perspective. To that end, this study utilizes the Interpretive Structural Modeling (ISM) methodology to identify the contextual relationships among the barriers. In a focus group discussion forum, five practitioners from the steel industry were consulted to identify these mutual linkages. The results indicated that five of the eight barriers proposed are in the linkage category. These barriers include that the energy manager or people in charge of energy management lack influence, there are higher priorities to production activity, there is management resistance to change, there is inadequate management capacity, and there are conflicts of interest within the organization. The management should focus more attention on these barriers, because they have both high driving power and dependency. The findings are intended to help managers from manufacturing sectors identify key barriers and thus develop strategic plans to address these issues.
1. Introduction
Energy efficiency improvement (EEI), which refers to energy conservation, i.e., the reduction of specific energy consumption, leads to improved industrial sustainability and competitiveness in the long run [1]. Improving energy efficiency can provide economic benefits by reducing the amount of energy used and the environmental impacts of energy use. According to [2], related with integrating agile and sustainable concepts, there is a need to conduct studies that address innovative energy-efficiency agility, both in technologies and energy-saving measures or practices. Therefore, improving energy efficiency is a crucial means to significantly reduce global, industrial energy end-use and greenhouse gas emission.
Despite the need to improve industrial energy efficiency, it is sometimes downgraded in importance because the potential to implement cost-effective energy conservation measures are prevented by some factors. These critical limiting factors are referred to as barriers. Barriers are generally linked, and understanding the relations among them can help in identifying the most appropriate strategy for overcoming these barriers [3]. Furthermore, the existence of these barriers offers justification for company decision makers to detect the major barriers in order to promote the most effective methods and understand the difficulties when undertaking the adoption of energy-efficient technologies [4]. In fact, research into improved energy efficiency has mostly focused on technological and systems aspects, while managerial and organizational aspects often have been relatively ignored. An in-house energy management program is perhaps the most important tool or method by which an industrial company can tackle barriers to EEI [5]. The findings of [6] show that the managerial–organizational barriers are the most important factors for EEI in Indonesia’s steel industry and have the highest direct effect on it.
The survey on barriers for the iron and steel industry in Ghana and in Sweden has been carried out. The findings of [7] showed that lack of budget funding, access to capital, and other priorities are the crucial barriers. Whereas, the internal economic, behavioral barrier, and lack of time are the most important barriers to efficient energy management in the Swedish steel industry [8,9].
Identifying barriers that are at the root of some barriers and that are most influenced by the others [10] would be useful for the top management or organization that is enforcing in-house energy efficiency programs. However, the quantification and prioritization of relevant dominant barriers to energy efficiency are rarely revealed [11]. Hence, it is critical and necessary to understand the mutual relationship among the barriers to energy saving.
The industrial sector is one of the energy-intensive fields in which finding the optimal result in terms of EEI should be conducted [12]. Likewise, in Indonesia the highest final energy end-use during the period of 2000–2014 occurred in the industrial sector, followed by the household, transportation, commercial, and other sectors [13].
In most countries, the iron and steel industry is one of the fundamental industrial sectors and a key indicator of national economic development [14]. The Indonesian steel industry uses approximately 38% of the total energy end-use among all national industrial sectors. Hence, the steel industry is categorized as one of the most energy-intensive end-use sectors in Indonesia, along with the cement, petrochemical, and pulp and paper industries [10,15]. Related to energy conservation, though some national industries have focused on improving energy efficiency by implementing energy efficient technologies, the result of EEI seems to have had little effect on reducing the energy end-use rate [16]. According to [17], factors like new technologies are not adequate or compatible at the site, lack of know-how in integration of new and existing technology, and lack of skilled technical staff for new technology implementation have contributed to the low performance of the energy-efficient technologies in Indonesia’s steel industry.
Stemming from those considerations, this paper identifies and analyzes the interaction of the barriers to EEI in the Indonesian steel industry from a managerial-organizational perspective. As far as the authors know, no previous paper has been published related to the interaction between barriers in the steel industry in Indonesia. The remainder of this paper is structured as follows. Section 2 presents the barriers to adopt industrial EEI measures related to the managerial and organizational category. In the next section, the methodological approach used in the case study is introduced. This section is followed by the analysis and discussion of results. The final section concludes the study and discusses its limitations.
2. Managerial-Organizational Barriers to EEI
A barrier to energy efficiency can be defined as “a postulated mechanism that inhibits investments in technologies that are both energy-efficient and (at least apparently) economically efficient” [18]. Researchers have studied barriers to energy efficiency since the late 1980s. This field of study requires contributions from multiple theoretical backgrounds. Based on these theories, three main categories of energy efficiency barriers can be distinguished, namely: (i) economic, (ii) organizational, and (iii) behavioral.
The economic barrier is classified into two categories: namely, market failure, and nonmarket failure. Market failure barrier is a barrier that infringes the axioms of economic theory, and that may conform government interference if the relevant policy passes a cost-benefit test. Whereas, a nonmarket-failure barrier refers to a situation in which actors decide on a rational basis not to carry out energy efficiency investments. The barriers in the form of power and organizational culture have been classsified in organizational category. The behavioral barrier is significant in view of personal characteristics. It may arise mainly due to lack of sharing the objectives and interest in energy-efficiency interventions, imperfect evaluation criteria, inertia, and other priorities [5].
As shown in the literature, organizational factors have been promoted as one of the strategic barriers to EEI [19]. The statistical evidence of an empirical investigation on the efficient lighting program denotes that organizational and institutional barriers are found among US companies [20]. In the process of energy-efficient technology adoption, the structure of the organization plays an important role [21], whereas [22] classified managerial and organizational factors act as, primarily, internal barriers, which are generally dependent on the characteristics of companies and that control the firms.
2.1. Lack of Power of People in Charge
Responsibility for energy issues is assigned to maintenance divisions that normally have relatively low power within an organization. Thus, the scope for effective management promotion is restricted [18]. Related to organizational structure, having a full-time energy manager who is incorporated into the management structure and equipped with the obligatory authority for energy efficiency measures is a key success factor for energy management [23]. According to [24], the energy manager must have the authority to be part of the strategic planning. The people in charge must be involved in the planning process for successful energy-management implementation [9].
2.2. Higher Priorities to the Production Activity
The issue of improved energy efficiency is often neglected by management, thus most of the workforce on the shop floor only emphasize production-related issues [25]. According to the management, the primary value stream lies in production. The expansion of production capacity and market share is naturally more crucial than adoption of energy efficiency measures for most firms [17]. Several studies have addressed how firms give greater priority to issues unrelated to energy efficiency than to energy efficiency measures [26].
2.3. Lack of Management Awareness
Top management sometimes considers EEI as unimportant. Human behavioral aspects, such as the motivation and awareness of the employees and organizational culture, are potential factors that could be associated with organizational barriers [27]. Managers and staff are not always aware of energy efficiency and its economic and environmental benefits, and thus do not pay much attention to it [28].
2.4. Resistance of Management to Change
Some managers do not find it of interest to deepen the know-how on how to properly adopt an energy efficient technology or how to consider the benefits of energy cost savings [29]. This resistance from management, which is most often due to time constraints, is a common hindrance to EEI that many organizations experience [30]. Setting up an energy management program, and incorporating it into an organization’s culture, involves a certain risk level. For the production manager, changing production planning routines, or replacing the existing technology or process with a more energy-efficient technology or process, creates a risk related to among other things, decreased productivity [5].
2.5. Complex Decision Chain
A lack of prioritizing energy efficiency within management and long decision chains is the main obstacle encountered by the group-owned foundries related to organizational factors [3]. At the decision-making level, the hierarchical structure, or distance between energy managers and decision makers, generates a complex decision chain. The long decision-making process, among other things, leads to energy management issues being poorly communicated [31].
2.6. Insufficient Integration of Energy Objectives
There is evidence that managers worry about the risks of technological changes [22]. Consequently, organizational impediments can be reflected as difficulties in the integration of new and existing technology. As a result, there is insufficient integration of energy efficiency goals into current production processes and inter-functional organization, such as the maintenance and purchasing division. Coordinated management among departments influences the organizational performance [32]. According to [24], the energy manager must be supported by every other major department as an energy team so that the team can supplement the energy manager’s lack of skills.
2.7. Inadequate Management Capacity
The lack of a strategic planning by top-management has often contributed to the failure of any improvement program [33]. In this context, managerial resistance, in both short-term thinking and planning, to measures of EEI is also an important factor to hinder energy efficiency investments.
2.8. Conflicts of Interest within an Organization’s Subsection
In industrial organizations, there are several conflicting views depending on the individuals involved, their position in the company, and other factors. Finding the pareto-optimal solution in this complex setting is a desired outcome but is seldom achieved in reality. Conflicts can, for example, be that due to economic regression, there is a necessity to put all major investments related to maintenance or cleaner production on hold, or there are issues with critical time constraints, such as needed maintenance issues being prioritized higher than more long-term actions. Due to slim organizations, staff seldom get the time to prioritize these longer time actions.
3. Method
The focus of this study is to identify and rank managerial-organizational barriers to EEI and describe the relationship among these barriers using Interpretive Structural Modeling (ISM). The ISM is a well-established methodology used to identify and summarize relationships among specific variables, which define a problem or an issue [34]. In this research, the ISM-based methodology is deployed to help visualize the interrelationships among barriers and categorize them according to their driver and dependence power. This approach is an interactive learning process. ISM suggests using expert opinions, through techniques such as brainstorming or nominal group techniques, to build the contextual relationships among the issues [35]. In this way, the qualitative opinion of experts related to the contextual relationships among the barriers to energy efficiency is exploited in this research.
Initially, to develop a set of likely managerial-organizational barriers to energy efficiency, we reviewed the related literature. The eight sub-barriers, related to managerial-organizational barriers, were identified and are shown in Table 1.
In order to preserve the homogeneity of the studied firms, sorting of the firms was based on the industrial company directory that had an electric arc furnace (EAF) or blast furnace and had followed the energy audit program (EAP) conducted by The Ministry of Industry, Republic of Indonesia. The EAP was arranged to balance the total energy inputs with its use, and to identify all the energy flows in a facility.
Of the 18 selected steel firms, only five had participated in EAP. Three of the companies that participated in EAP had an energy manager working full time to address energy issues. The five company respondents had an average age of 37 years. All of the respondent companies had their own steel production and produce steel from scrap in EAF. The four plants produce crude steel in billet type, and only one plant produces crude steel in bloom type. The location of one steel plant is in Sumatera and the rest are in Java. The ownership pattern of investment is domestic (two companies) or foreign (two companies), and only one company is in joint venture with China. The number of employees at the plants ranged between 100 and 1000, with assets of more than 50 million dollars. The annual energy use ranged between 350,000 GJ and 2,000,000 GJ.
The approach applied in this study was explorative in nature. Therefore, a qualitative research method was appropriate. Due to the limited number of steel mills in Indonesia that correspond with aim of the study, a case study was considered the most suitable methodological approach to the study. The choice of approach was inspired by [8], who also studied a limited number of steel mills. To collect data about the relationships among barrier elements, a questionnaire was administered to each respondent. Their titles were three energy managers, a production manager, and a senior engineer who dealt with energy issues.
Initially, the researcher presented the study objective and clarified the meaning of each element in the focus group. The discussion was conducted in April 2016. This step provided the necessary support to ensure that the respondent concentrated on the direct relationships between each pair of barriers. Furthermore, the respondents identified the relationships among the directly and indirectly related elements. To avoid the practitioner’s answers from influencing those of the others, the practitioners’ opinions were taken separately. In a subsequent phase, the questionnaire results were combined and analyzed by three academics, who have experience in the field of multi-criteria decision making, to achieve an interaction matrix. Based on academics’ responses, the aggregate-interaction matrix was finalized. So, this matrix reflected the experts’ (practitioners and academics) consensus on their judgement.
3.1. Structural Self-Interaction Matrix (SSIM)
The SSIM is developed for variables and indicates pairwise relationships among the variables of the system under consideration. The existence of a relationship between any two variables (i and j) and the associated direction of the relation were the basis of the questions asked of the expert panel. This means that one barrier leads to another barrier. On the basis of contextual relationships among barrier issues, the SSIM is developed (see Table 2). Four symbols are used to denote the direction of the relationship between the barriers i and j [10]:
- V: Barrier i will influence/cause barrier j;
- A: Barrier j will be influenced/caused by barrier i;
- X: Barrier i and j will influence each other; and
- O: Barrier i and j are unrelated.
3.2. Reachability Matrix (RM)
Obtaining the initial RM is the next step. The SSIM format has been converted into a metric of binary digits. This transformation is achieved by appropriately assigning V, A, X, and O with 1 and 0. In this regard, the following rules for transformation are given.
- If the cell (i, j) entry in the SSIM is V, then the substitute in this cell (i, j) entry in the reachability metrics becomes 1 and the cell (j, i) entry is 0.
- If the cell (i, j) entry in the SSIM is A, then the substitute in this cell (i, j) entry in the reachability metrics becomes 0 and the cell (j, i) entry is 1.
- If the (i, j) entry in the SSIM is X then the substitute in this cell (i, j) entry in the reachability metrics becomes 1 and the cell (j, i) entry is 1.
- If the (i, j) entry in the SSIM is O then the substitute in this cell (i, j) entry in the reachability metrics becomes 0 and the cell (j, i) entry is 0.
Following these rules, the initial RM is developed (Table 3).
To obtain the final RM (Table 4), the transitivity concept is taken into account and establishes the relation between various barriers. The transitivity of the contextual relationships is a fundamental assumption made in ISM. If a variable i leads to j, and if the variable j leads to a third variable k, i leads to k, as per the rule of transitivity.
3.3. Level Partitions
After building the final RM, one obtains the reachability and an antecedent set for each issue or variable. The “reachability set” for a particular issue consists of the issue itself and the other issues it influences. The “antecedent set” consists of the variable itself and the other variables that may influence it. Subsequently, the issues that are common in the reachability set and antecedent set are allocated at the intersection set. The issue, for which the reachability and the intersection sets are the same, is assigned the top-level position in the ISM hierarchy (Table 5). Once the top-level issue is identified, it is discarded from the other remaining issues. The next level of positions is determined by the same process (Table 6 and Table 7).
3.4. Conical Matrix (CM)
By clustering issues in the same level across the rows and columns of the final RM, we build a CM (lower triangular matrix), as presented in Table 8. In this table, the driving power and dependence of each barrier is also presented. The driving power is the total number of the barriers in the row, which the barrier may help achieve. The dependence is the total number of the barriers in the column, which may help achieve a particular barrier. The driving power and dependence will be employed in the MICMAC (Matriced’ Impacts Croises-Multiplication Applique’ an Classment or Cross-Impact Matrix-Multiplication Applied to a Classification) analysis [45].
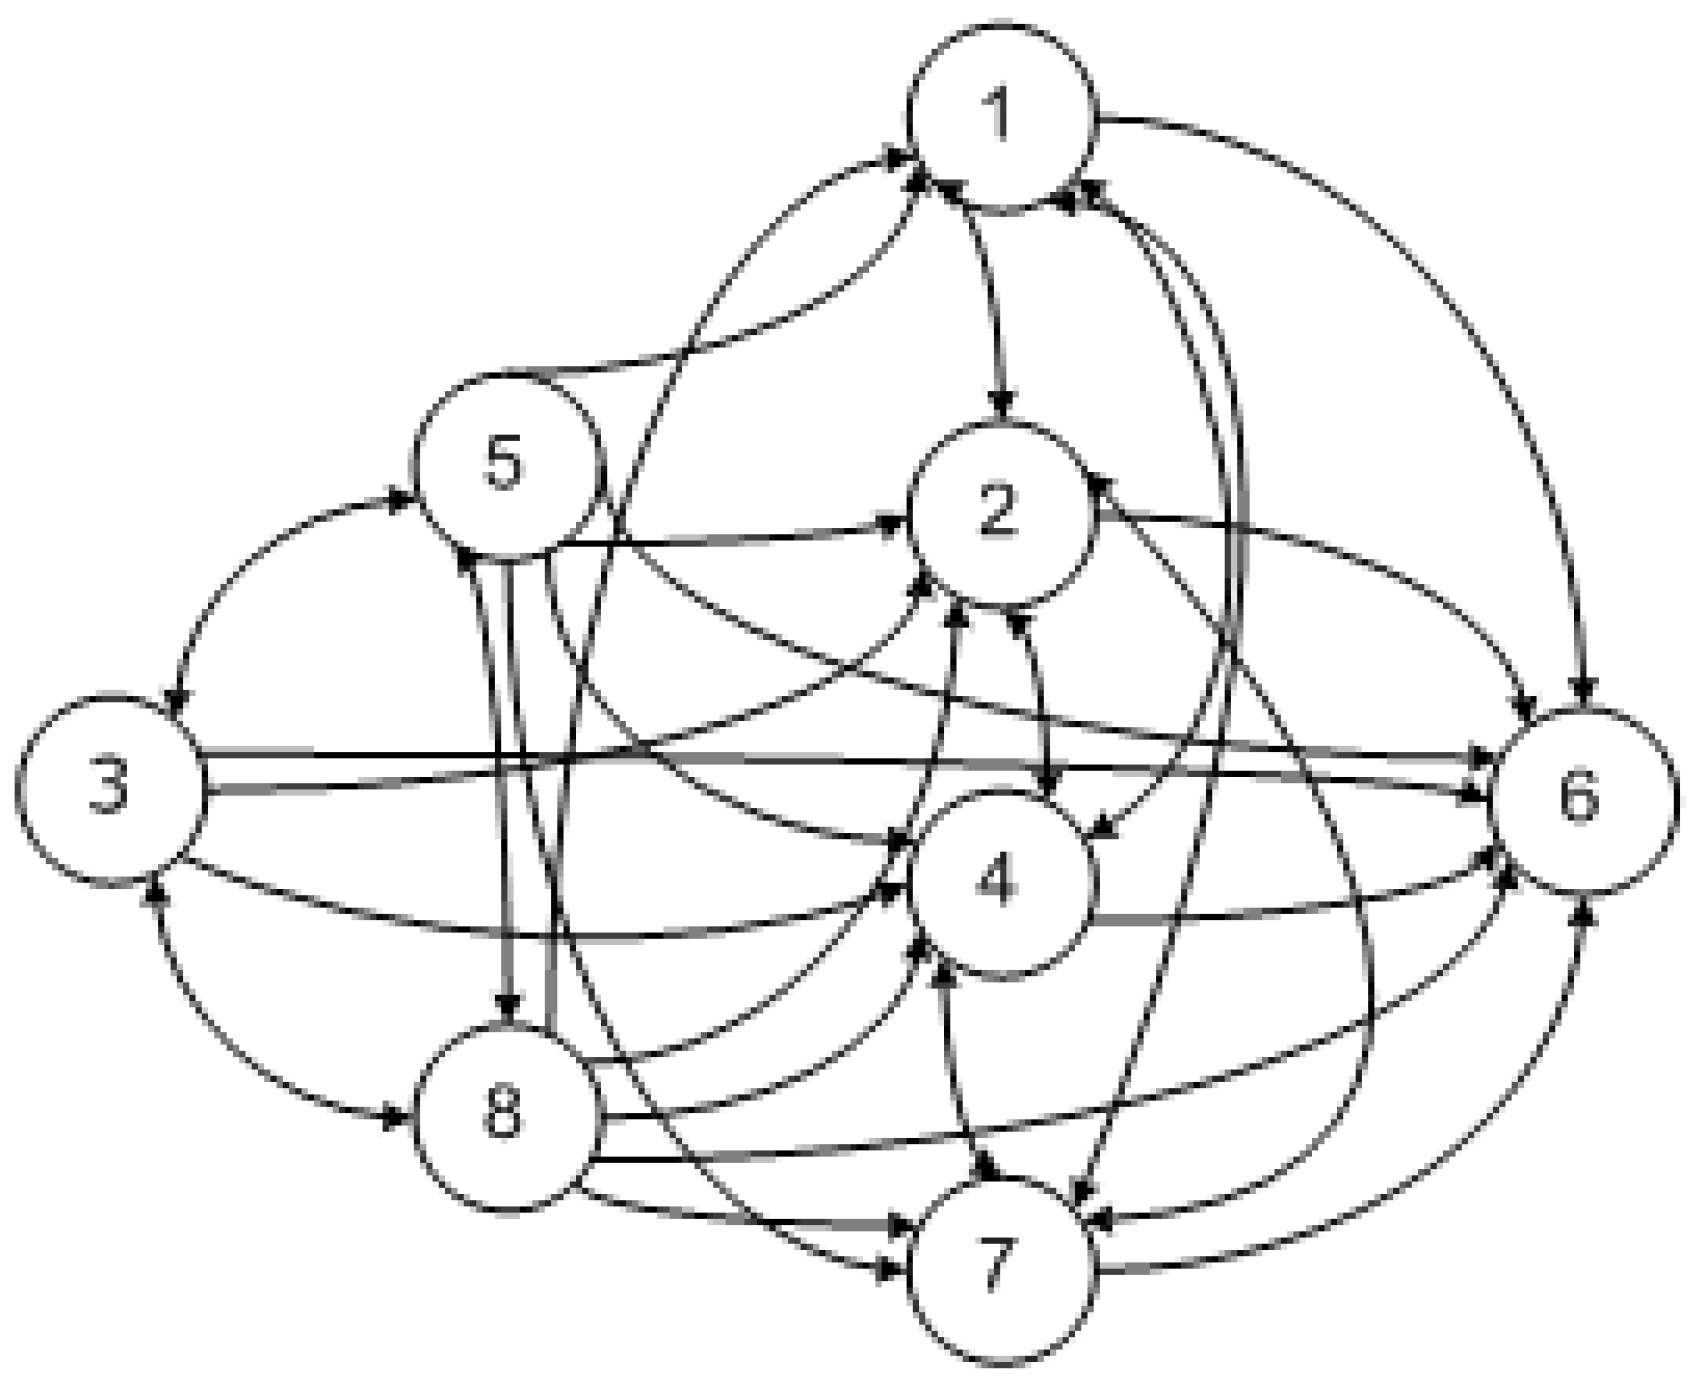
3.5. Formation of ISM-Based Model
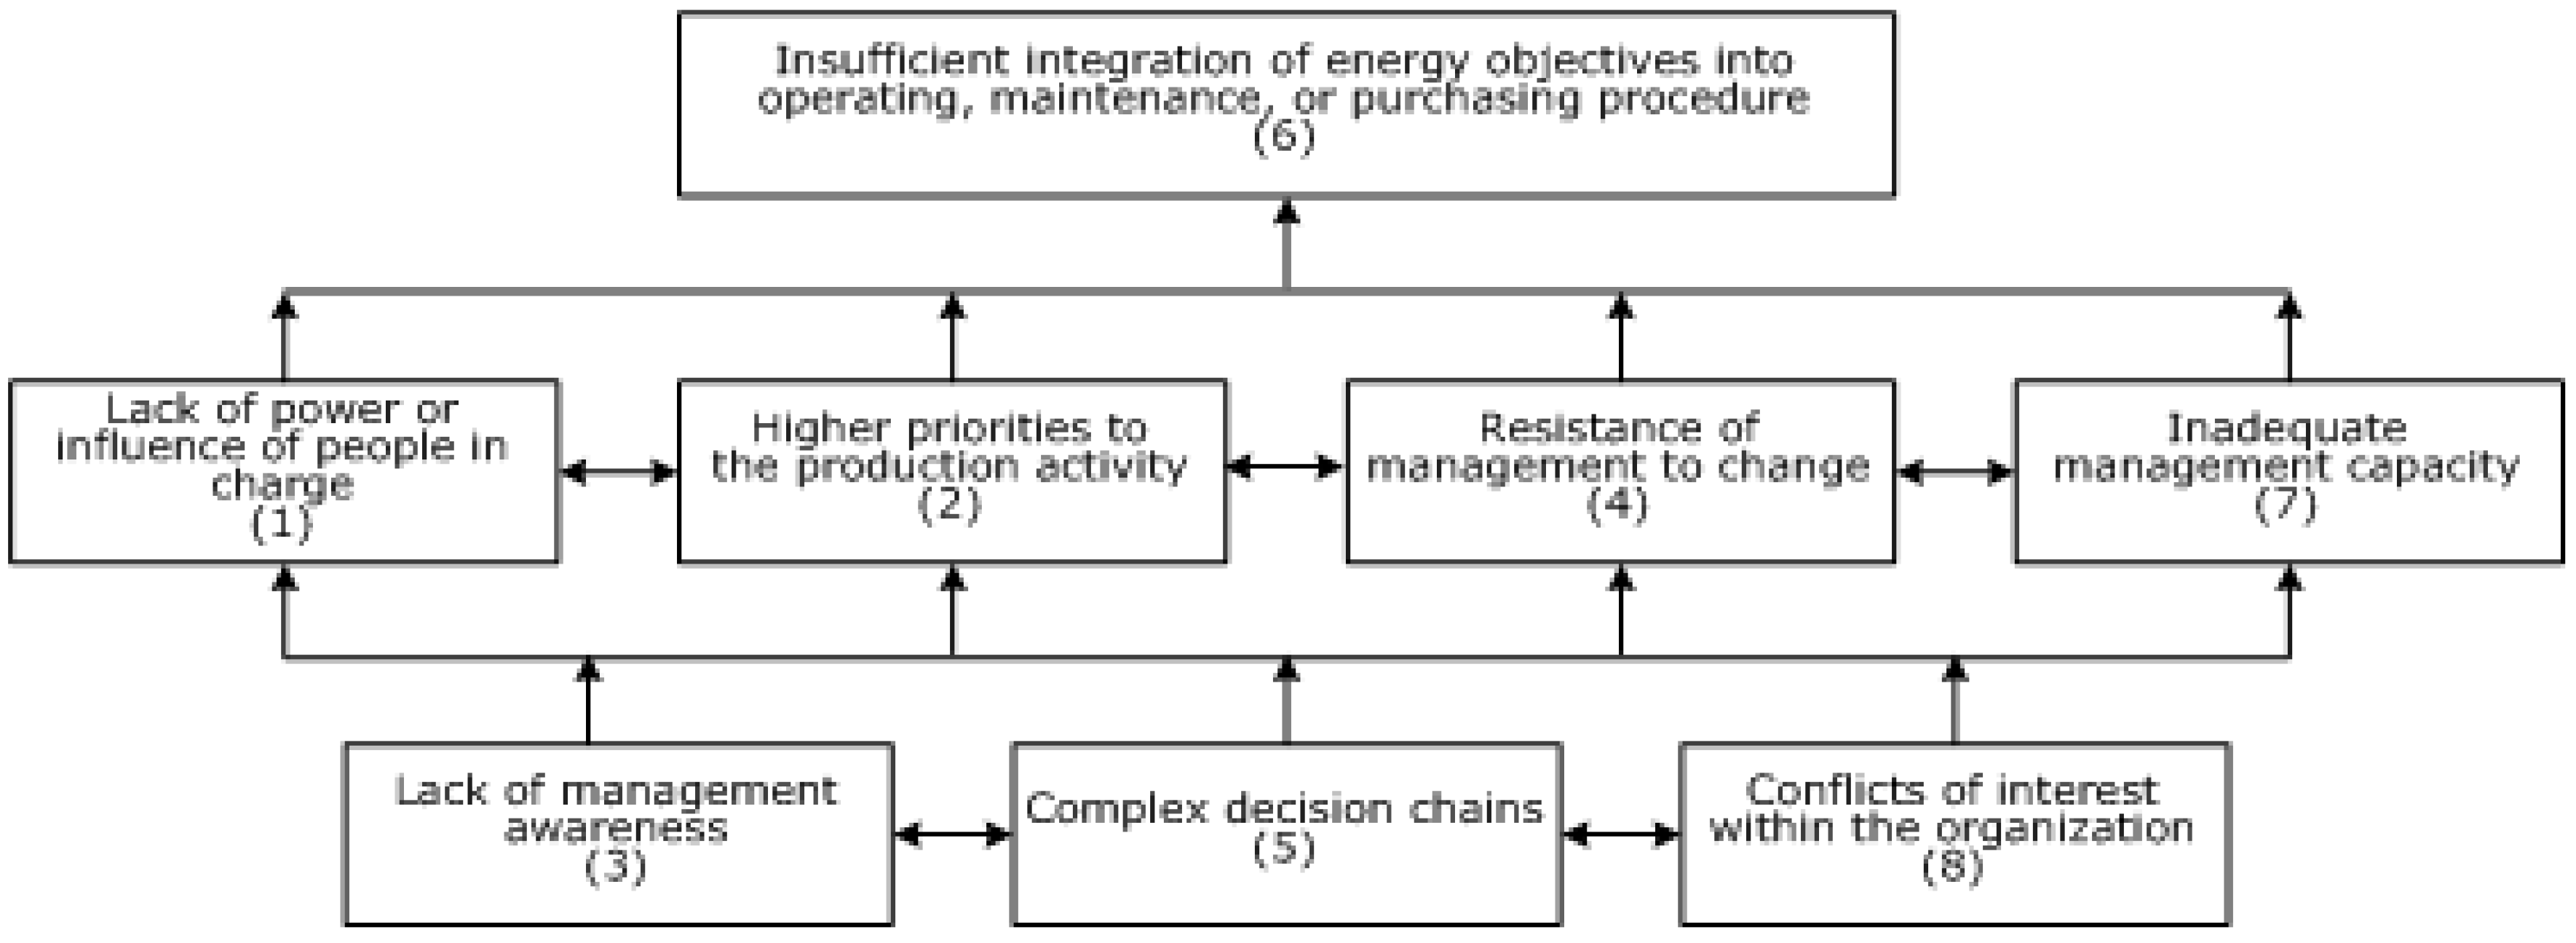
The preliminary digraph is obtained from the CM (Figure 1). The digraph is a diagram that shows the existence of the direct and indirect relationships between the barrier j and i. A digraph is used to represent the variables and their interdependencies using the nodes and lines of the edges. A final digraph is developed after removing the indirect links and replacing barriers’ nodes with statements, as shown in Figure 2. From the structure model, lack of management awareness (barrier 3), long decision chains (barrier 5), and conflicts of interest within the organization (barrier 8) are at the base of the ISM hierarchy, whereas insufficient integration of energy objectives (barrier 6) has been identified as the top-level variable in the model.
4. Results and Discussion
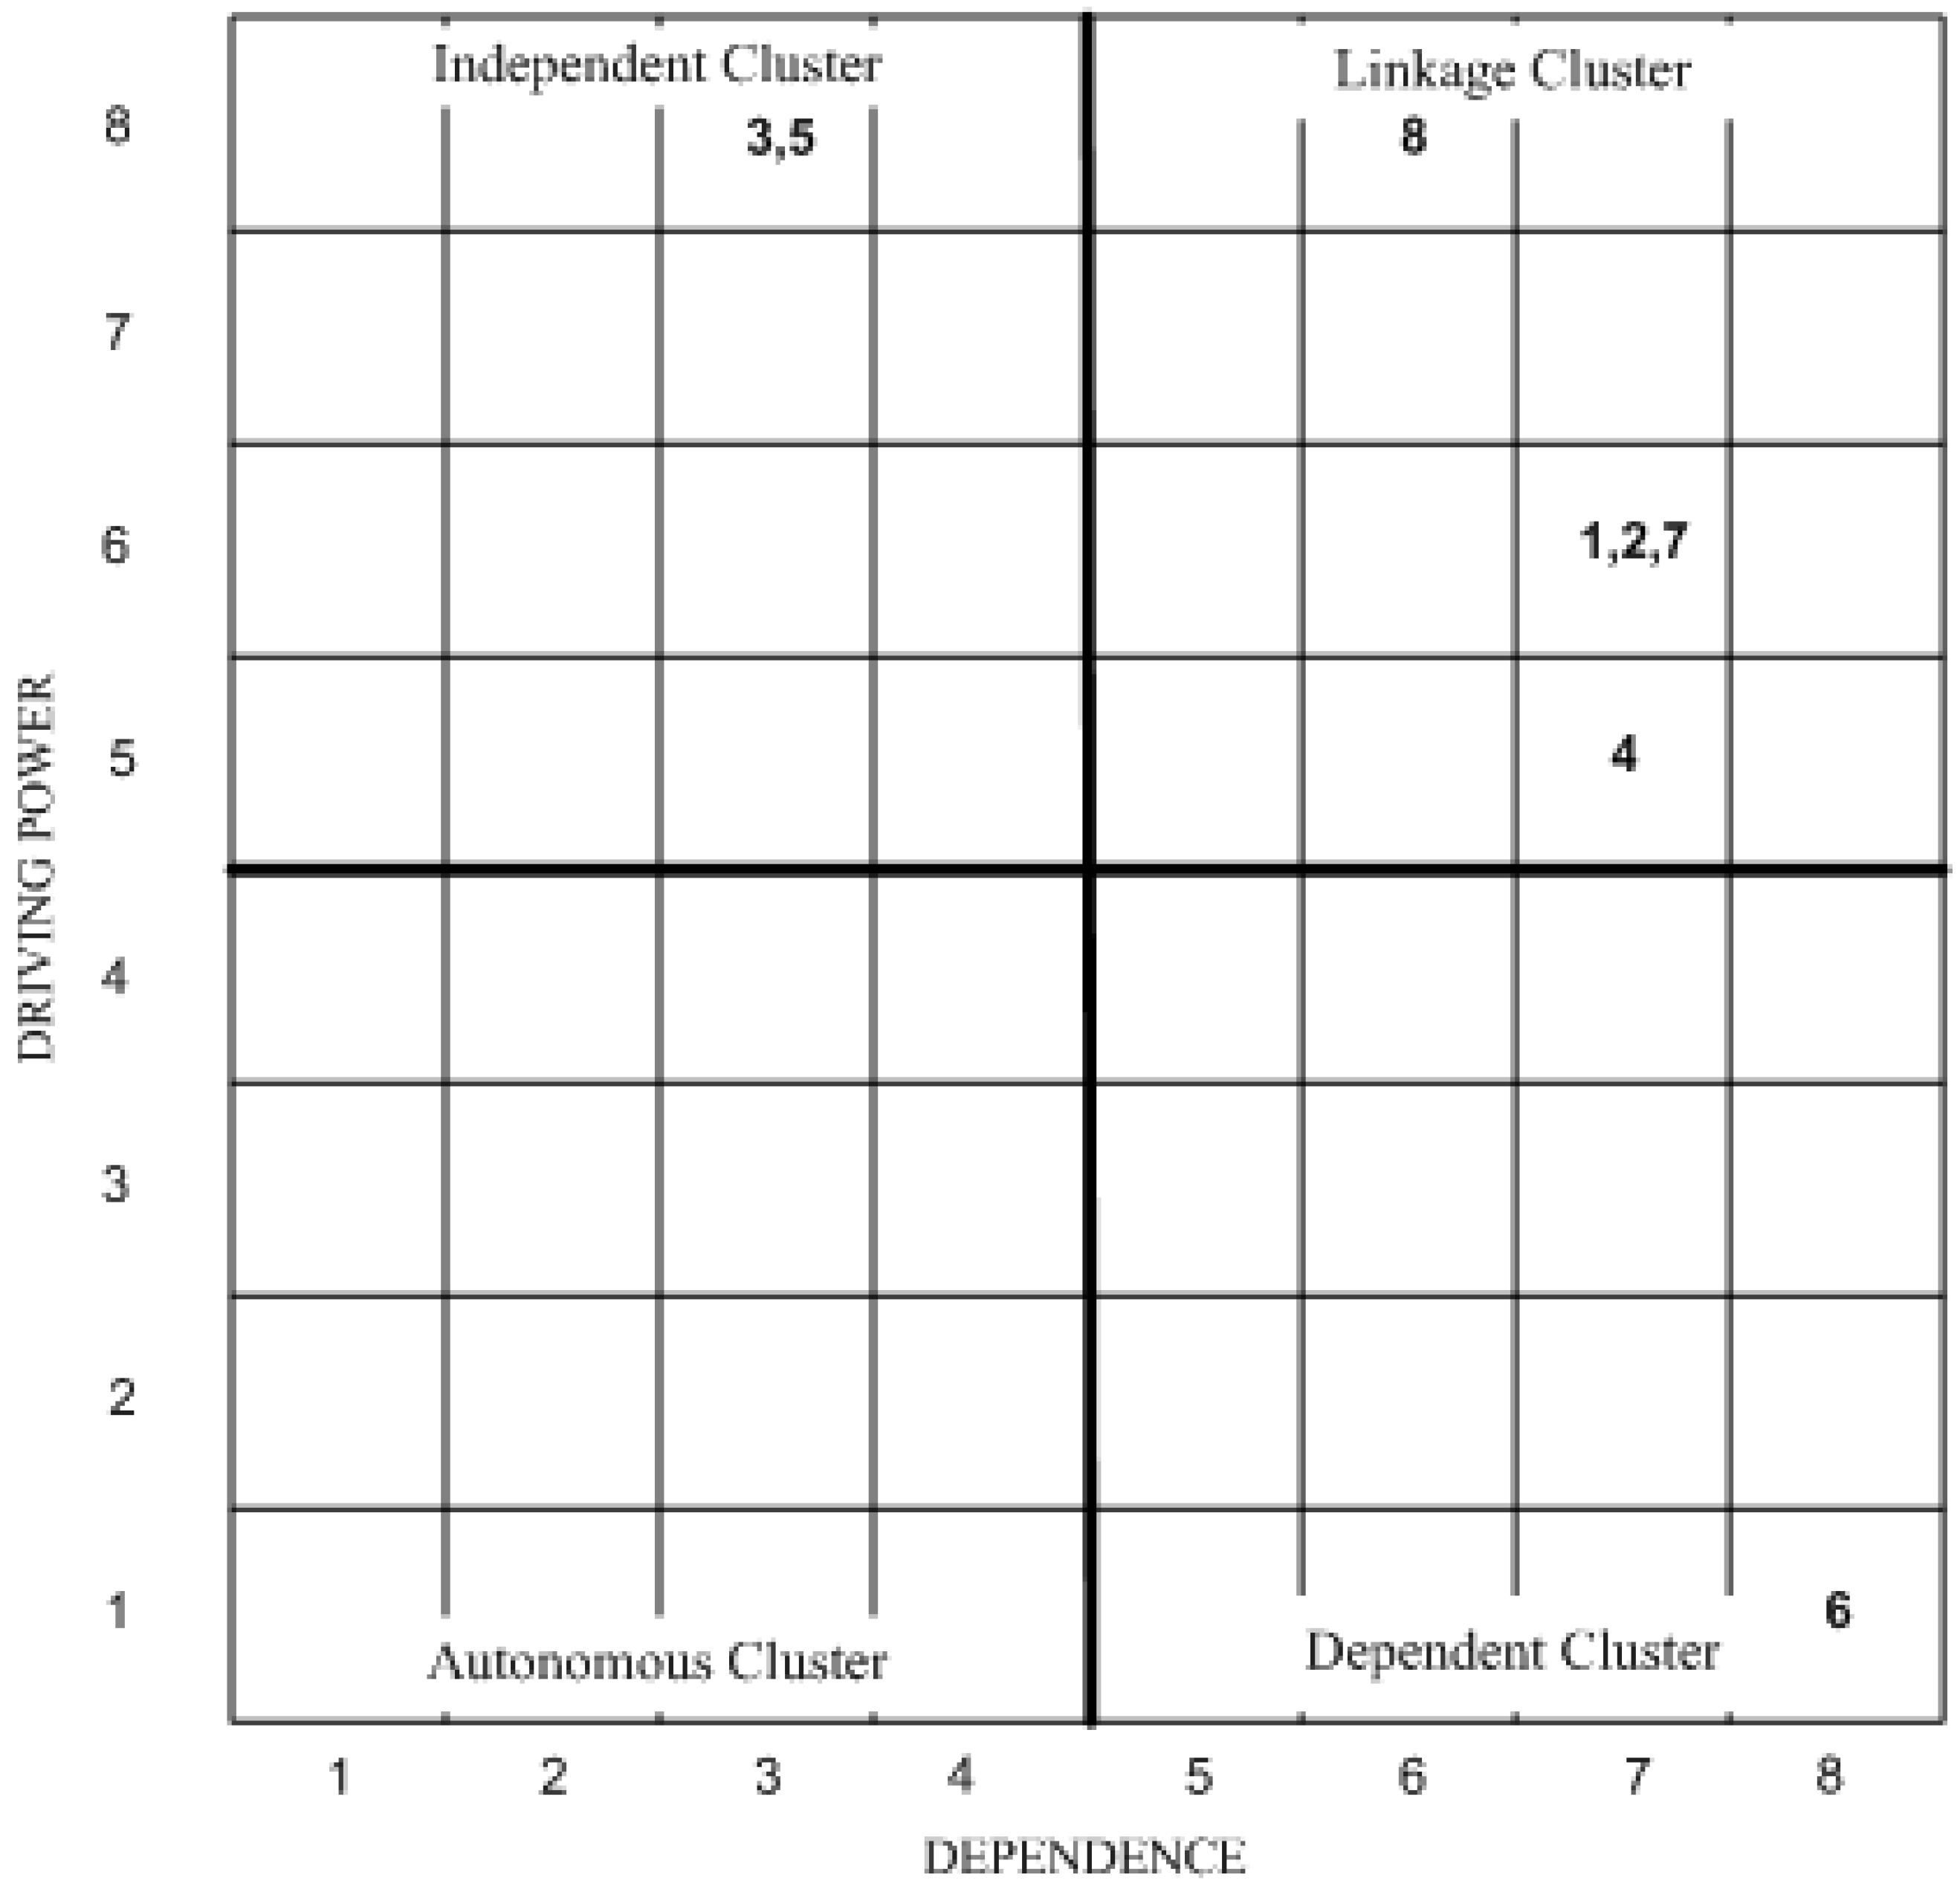
The aim of MICMAC analysis is to examine the driving power and dependence of variables, and is based on multiplication properties of matrices [46]. The driving power and dependence is the summation of binary digit “1s” in their respective row and column for each variable, respectively, that is imported from Table 8. The driving power is shown vertically and dependence is shown horizontally. In MICMAC analysis, the barriers are classified into four groups: namely, autonomous, dependent, linkage, and independent. As shown in Figure 3, the driver power-dependence diagram is constructed.
According to [14], organizational barriers are often faced by the energy intensive industries. The empirical results are in line with [47], as the organizational barrier is ranked second out of seven barriers. The industries included food, textiles, wood, pulp and paper, plastic, and metal. Forty percent were primary metal firms, and 20% of the sample is composed by energy-intensive industries. These results indicate that the organizational barriers have potential to hamper EEI.
Figure 3 demonstrates that there are no autonomous barriers. The absence of these barriers shows that all the considered barriers influence EEI. Hence, the management should pay attention to all the barriers for a successful adoption of EEI measures. Energy objectives that are not integrated into operating, maintenance, or purchasing procedures (barrier 6) are in the category of dependent obstacles. This means that this issue has little driving power but strong dependence (called driven barriers). The management of this barrier depends on overcoming other impediments. Of the 16 barriers examined, insufficient integration of energy into other procedures was among the bottom four barriers with the lowest importance among all barriers [39]. Based on the results of [8], this barrier only obtained a score 0.35. They used a scale of 0 (not important), 0.5 (often important), and 1 (very important).
The linkage cluster consists of five barriers, including that the energy manager or people in charge of energy management lack influence (barrier 1), there are higher priorities to the production activity (barrier 2), there is resistance of management to change (barrier 4), there is insufficient and inappropriate management capacity (barrier 7), and there are conflicts of interest within the organization (barrier 8). These obstacles have strong driving power, as well as strong dependence power, so they are categorized as key variables. These barriers are unstable, meaning that any action on these issues will have an effect on the other issues and also a feedback effect on themselves.
The lower priority of improved energy efficiency issues could be caused by the lack of energy management power within organizations. Moreover, if the compensation of energy management position is less than the rewards of other positions, people will not be attracted to this position [18]. Creating an energy manager position as an energy controller is one of the key factors for in-house energy management diffusion. This position must be filled by someone with operational responsibility [5]. Employing a full-time energy manager in place is much more important than employing a part-time energy manager [8]. The person in charge of the energy management program has certain influence in the company such that this individual can facilitate the establishment of new values in the organization [5]. If the one with delegated responsibility lacks sufficient informal power to boost the process, then delegated authority involves a risk.
Another barrier to improving energy efficiency is higher priorities to production than to efficiency. For the manufacturing sector, this barrier is among the top three ranked barriers to EEI in Sweden [41], Thailand [47], and Italy [48]. These findings indicated that the managers often are concerned about the effects of replacing the existing technologies. Previously, the studies of [40], as well as [36], revealed that technical risks such as risk of production disruptions are the main barrier to energy efficiency in Sweden’s foundry and pulp and paper industry, respectively. Regarding insufficient and inappropriate management, energy management is a continuous process that is part of the total management system. Thus, it requires a knowledge and skills base. This means that the management must improve its basic managerial and technical capacity to implement energy efficiency measures continuously.
The fourth cluster includes independent barriers that have a low dependence but strong driving power. In this study, lack of management awareness (barrier 3) and complex decision chains (barrier 5) are in this category. It can be inferred that these barriers may be treated as the key variables, as well as the root cause of barriers. Management must give the highest attention to these factors in order to comply with the desired objectives related to EEI. The barrier prioritization helps in focusing efforts on critical hindrances to find the best possible solutions due to limitation of resources. An appropriate and comprehensive strategic plan for energy efficiency program could be initiated to overcome these barriers.
The empirical findings of [36] showed that the complex decision chains obtain the relatively high-ranked barriers. This obstacle may indicate the existence of split incentives and a principal-agent relationship because the energy efficiency investments are not frequently receiving full top management support. The barriers to industrial EEI in a developing country, namely among 34 of Ghana’s industries [7]. Their study denoted that the conflicts of interest within the company are ranked in seventh position of 22 barrier items studied and are the most important barrier from the organizational barriers category. They also stated that this barrier may be related to split incentives. So, both studies indicated that conflicts of interest and long decision chains can theoretically be linked to split incentives.
Related to the management awareness factor, as pointed out by [49], in the beginning of the decision-making stages, the lack of management awareness and behavioral barriers have a greater effect than economic barriers. This is caused by the roles of these barriers in the evocation of consciousness. It is also observed that this barrier, together with long decision chains, and conflicts of interest within the organization, are the base factors of the ISM model. This finding is in line with [50] that the lack of awareness was at the bottom level of the ISM hierarchy related to the barriers to energy saving in China.
5. Conclusions
This paper aimed to analyze the relationships among different barriers to EEI from a managerial-organizational perspective. Our findings show that seven issues have been identified as key issues and one as the dependent variable. No issue is found in the autonomous category. Lack of management awareness, complex decision chains, and conflicts of interest within the organization have been identified as the most important level of the hierarchy. Management should assign a maximum priority in tackling the barriers that have high driving power and the capability of influencing other barriers.
The ISM model supported the aim to detect key factors related to the studied issue and to analyze the interaction among the barriers. The driving power–dependence diagram provides meaningful insights into the relative importance and the interdependencies among the barriers. This may help top management decision-makers manage the hindrances in EEI in their organizations. The paper shows that the ISM method is a tool for integrating the diverse perceptions of the expert team, even though the model was not statistically validated. Therefore, it is suggested that further research should be conducted to statistically validate the reliability of the model.
Acknowledgments
The first author would like to thank the Ministry of Research, Technology, and Higher Education, Republic of Indonesia for providing PKPI/Sandwich-Like Scholarship. The authors also thank the kind respondents for providing their time to be interviewed and answer our questions.
Author Contributions
The contribution is equally divided between authors.
Conflicts of Interest
The authors declare no conflict of interest.
References
- Worrell, E.; van Berkel, R.; Fengqi, Z.; Menke, C.; Schaeffer, R.; Williams, R.O. Technology transfer of energy efficient technologies in industry: A review of trends and policy issues. Energy Policy 2001, 29, 29–43. [Google Scholar] [CrossRef]
- Soepardi, A.; Pratikto, P.; Santosa, P.B.; Tama, I.P. An updated literature review of agile manufacturing: Classification and trends. Int. J. Ind. Syst. Eng. 2018, in press. [Google Scholar]
- Walsh, C.; Thornley, P. Barriers to improving energy efficiency within the process industries with a focus on low grade heat utilisation. J. Clean. Prod. 2012, 23, 138–146. [Google Scholar] [CrossRef]
- Fleiter, T.; Schleich, J.; Ravivanpong, P. Adoption of energy-efficiency measures in SMEs—An empirical analysis based on energy audit data from Germany. Energy Policy 2012, 51, 863–875. [Google Scholar] [CrossRef]
- Thollander, P.; Palm, J. Improving Energy Efficiency in Industrial Energy Systems: An Interdisciplinary Perspective on Barriers, Energy Audits, Energy Management, Policies, and Programs; Springer Science & Business Media: London, UK, 2012; pp. 85–104. ISBN 978-14-4-714161-7. [Google Scholar]
- Soepardi, A.; Pratikto, P.; Santosa, P.B.; Tama, I.P.; Thollander, P. Linking of barriers to energy efficiency improvement in Indonesia’s steel industry. Energies 2018. accepted. [Google Scholar]
- Apeaning, R.W.; Thollander, P. Barriers to and driving forces for industrial energy efficiency improvements in African industries—A case study of Ghana’s largest industrial area. J. Clean. Prod. 2013, 53, 204–213. [Google Scholar] [CrossRef]
- Brunke, J.C.; Johansson, M.; Thollander, P. Empirical investigation of barriers and drivers to the adoption of energy conservation measures, energy management practices and energy services in the Swedish iron and steel industry. J. Clean. Prod. 2014, 84, 509–525. [Google Scholar] [CrossRef]
- Johansson, M. Improved energy efficiency within the Swedish steel industry—The importance of energy management and networking. Energy Effic. 2015, 8, 713–744. [Google Scholar] [CrossRef]
- Ravi, V.; Shankar, R. Analysis of interactions among the barriers of reverse logistics. Technol. Forecast. Soc. Chang. 2005, 72, 1011–1029. [Google Scholar] [CrossRef]
- Nagesha, N.; Balachandra, P. Barriers to energy efficiency in small industry clusters: Multi-criteria-based prioritization using the analytic hierarchy process. Energy 2006, 31, 1969–1983. [Google Scholar] [CrossRef]
- International Energy Agency (IEA). Key World Energy Statistics; International Energy Agency: Paris, France, 2014. [Google Scholar]
- Ministry of Energy and Mineral Resources Republic of Indonesia (MEMRRI). Handbook of Energy and Economic Statistics of Indonesia; Ministry of Energy and Mineral Resources Republic of Indonesia: Jakarta, Indonesia, 2016.
- Zhiping, L.; Jingru, L.; Yanjia, W. Energy consumption in the iron and steel industry in PR China. Energy Sustain. Dev. 1996, 3, 18–24. [Google Scholar] [CrossRef]
- Indonesia Iron Steel Industry Association (IISIA). Role and Prospect of National Steel Industry; Indonesia Iron Steel Industry Association: Jakarta, Indonesia, 2015. [Google Scholar]
- Agency for The Assessment and Application of Technology (AAAT). Planning of Energy Efficiency and Elasticity; Agency for The Assessment and Application of Technology: Jakarta, Indonesia, 2013. [Google Scholar]
- Soepardi, A.; Pratikto, P.; Santosa, P.B.; Tama, I.P. Interpretive structural Modeling for technology-related barriers to energy efficiency improvement in Indonesian Steel Industry. In Proceedings of the 2nd International Conference on Engineering and Technology for Sustainable Development, Yogyakarta, Indonesia, 13–14 September 2017; Materials Science, Engineering and Chemistry (MATEC) Web of Conference: Les Ulis, France, 2018. [Google Scholar]
- Sorrell, S.; Schleich, J.; Scott, S.; O’Malley, E.; Trace, F.; Boede, E.; Ostertag, K.; Radgen, P. Reducing Barriers to Energy Efficiency in Public and Private Organizations; Science and Technology Police Research (SPRU): Brighton, UK, 2000. [Google Scholar]
- Sardianou, E. Barriers to industrial energy efficiency investments in Greece. J. Clean. Prod. 2008, 16, 1416–1423. [Google Scholar] [CrossRef]
- DeCanio, S.J. The efficiency paradox: Bureaucratic and organizational barriers to profitable energy-saving investments. Energy Policy 1998, 26, 441–454. [Google Scholar] [CrossRef]
- Trianni, A.; Cagno, E.; Worrell, E. Innovation and adoption of energy efficient technologies: An exploratory analysis of Italian primary metal manufacturing SMEs. Energy Policy 2013, 61, 430–440. [Google Scholar] [CrossRef]
- Shi, H.; Peng, S.Z.; Liu, Y.; Zhong, P. Barriers to the implementation of cleaner production in Chinese SMEs: Government, industry and expert stakeholders’ perspectives. J. Clean. Prod. 2008, 16, 842–852. [Google Scholar] [CrossRef]
- Sandberg, P.; Söderström, M. Industrial energy efficiency: The need for investment decision support from a manager perspective. Energy Policy 2003, 31, 1623–1634. [Google Scholar] [CrossRef]
- Mashburn, W.H. Effective energy management. In Energy Management Handbook, 6th ed.; Turner, W.C., Steve, D., Eds.; The Fairmont Press Inc.: Lilburn, GA, USA, 2007; pp. 9–22. ISBN 978-08-8-173542-6. [Google Scholar]
- Cooray, N. Cleaner production assessment in small and medium industries of Sri Lanka. In Global Competitiveness through Cleaner Production; Proceedings of the Second Asia Pacific Cleaner Production Roundtable, Brisbane, Australia, 21–23 April 1999; Australian Cleaner Production Association Inc.: Brisbane, Australia, 1999. [Google Scholar]
- Johansson, M.T.; Thollander, P. A review of barriers to and driving forces for improved energy efficiency in Swedish industry–recommendations for successful in-house energy management. Renew. Sustain. Energy Rev. 2008, 82, 618–628. [Google Scholar] [CrossRef]
- Zilahy, G. Organisational factors determining the implementation of cleaner production measures in the corporate sector. J. Clean. Prod. 2004, 12, 311–319. [Google Scholar] [CrossRef]
- Rohdin, P.; Thollander, P. Barriers to and driving forces for energy efficiency in the non-energy intensive manufacturing industry in Sweden. Energy 2006, 31, 1836–1844. [Google Scholar] [CrossRef]
- Tonn, B.; Martin, M. Industrial energy efficiency decision making. Energy Policy 2000, 28, 831–843. [Google Scholar] [CrossRef]
- Talib, F.; Rahman, Z.; Qureshi, M.N. Analysis of interaction among the barriers to total quality management implementation using interpretive structural modeling approach. Benchmarking Int. J. 2011, 18, 563–587. [Google Scholar] [CrossRef]
- Chan, Y.; Kantamaneni, R. Study on Energy Efficiency and Energy Saving Potential in Industry and on Possible Mechanisms; The Inner City Fund (ICF) Consulting Limited: London, UK, 2015. [Google Scholar]
- Sureshchandar, G.S.; Rajendran, C.; Anantharaman, R.N. A holistic model for total quality service. Int. J. Serv. Ind. Manag. 2001, 12, 378–412. [Google Scholar] [CrossRef]
- Whalen, M.; Rahim, M. Common barriers to implementation and development of TQM program. Ind. Manag. 1994, 36, 19–21. [Google Scholar]
- Sage, A.P. Interpretive Structural Modeling: Methodology for Large-Scale Systems; McGraw-Hill: New York, NY, USA, 1997; ISBN 10-0070544387. [Google Scholar]
- Kannan, G.; Haq, A.N.; Sasikumar, P.; Arunachalam, S. Analysis and selection of green suppliers using interpretative structural modelling and analytic hierarchy process. Int. J. Manag. Decis. Mak. 2008, 9, 163–182. [Google Scholar] [CrossRef]
- Thollander, P.; Ottosson, M. An energy efficient Swedish pulp and paper industry–exploring barriers to and driving forces for cost-effective energy efficiency investments. Energy Effic. 2008, 1, 21–34. [Google Scholar] [CrossRef]
- Cagno, E.; Worrell, E.; Trianni, A.; Pugliese, G. A novel approach for barriers to industrial energy efficiency. Renew. Sustain. Energy Rev. 2013, 19, 290–308. [Google Scholar] [CrossRef]
- Trianni, A.; Cagno, E.; Thollander, P.; Backlund, S. Barriers to industrial energy efficiency in foundries: A European comparison. J. Clean. Prod. 2013, 40, 161–176. [Google Scholar] [CrossRef]
- Venmans, F. Triggers and barriers to energy efficiency measures in the ceramic, cement and lime sectors. J. Clean. Prod. 2014, 69, 1–142. [Google Scholar] [CrossRef]
- Rohdin, P.; Thollander, P.; Solding, P. Barriers to and drivers for energy efficiency in the Swedish foundry industry. Energy Policy 2007, 35, 672–677. [Google Scholar] [CrossRef]
- Thollander, P.; Karlsson, M.; Söderström, M.; Creutz, D. Reducing industrial energy costs through energy-efficiency measures in a liberalized European electricity market: Case study of a Swedish iron foundry. Appl. Energy 2005, 81, 115–126. [Google Scholar] [CrossRef]
- Trianni, A.; Cagno, E. Dealing with barriers to energy efficiency and SMEs: Some empirical evidences. Energy 2012, 37, 494–504. [Google Scholar] [CrossRef]
- De Groot, H.L.; Verhoef, E.T.; Nijkamp, P. Energy saving by firms: Decision-making, barriers and policies. Energy Econ. 2001, 23, 717–740. [Google Scholar] [CrossRef]
- Meath, C.; Linnenluecke, M.; Griffiths, A. Barriers and motivators to the adoption of energy savings measures for small-and medium-sized enterprises (SMEs): The case of the Climate Smart Business Cluster program. J. Clean. Prod. 2016, 112, 3597–3604. [Google Scholar] [CrossRef]
- Duperrin, J.C.; Godet, M. Methode de hierarchisation des elements d’un systeme. Rapport Economique CEA 1973, 1, 49–51. [Google Scholar]
- Mandal, A.; Deshmukh, S.G. Vendor selection using interpretive structural modelling (ISM). Int. J. Oper. Prod. Manag. 1994, 14, 52–59. [Google Scholar] [CrossRef]
- Hasanbeigi, A.; Menke, C.; Du Pont, P. Barriers to energy efficiency improvement and decision-making behavior in Thai industry. Energy Effic. 2010, 3, 33–52. [Google Scholar] [CrossRef]
- Trianni, A.; Cagno, E. Diffusion of Motor Systems Energy Efficiency Measures: An Empirical Study within Italian Manufacturing SMEs. Energy Procedia 2015, 75, 2569–2574. [Google Scholar] [CrossRef]
- Trianni, A.; Cagno, E.; Farné, S. Barriers, drivers and decision-making process for industrial energy efficiency: A broad study among manufacturing small and medium-sized enterprises. Appl. Energy 2016, 162, 1537–1551. [Google Scholar] [CrossRef]
- Wang, G.; Wang, Y.; Zhao, T. Analysis of interactions among the barriers to energy saving in China. Energy Policy 2008, 36, 1879–1889. [Google Scholar] [CrossRef]
Figure 1.
Initial Digraph of the Relationships among Managerial-Organizational Barriers.

Figure 2.
Final Digraph of the Relationships among Managerial-Organizational.

Figure 3.
Driving Power and Dependence Diagram.


Table 1.
Description of managerial-organizational barriers.
| Barriers | Description of the Similar Barriers | References |
|---|---|---|
| Limited authority of energy manager; low status of energy management; energy manager lacks influence | [18,36,37,38,39] |
| Over emphasis on production; personnel pay attention to daily production problem; lack of time or other priorities | [19,22,25,40,41,42] |
| Lack of management commitment or motivation; low priority given to energy management; | [18,22,35,40,41,42,43,44] |
| Change in management | [22,44] |
| Concentration of decision making; long decision chain | [25,36,37,38] |
| Difficulty to cooperate inter-divisional; energy objectives not integrated into operating, maintenance, or purchasing procedures | [37,38,39] |
| Insufficient and inappropriate management; lack in sub-metering or internal control | [19,22,25,37] |
| Divergent interests, difficult to implement due to internal organization | [7,37,38,43] |
Table 2.
Initial SSIM.
| Barriers | 8 | 7 | 6 | 5 | 4 | 3 | 2 | 1 |
|---|---|---|---|---|---|---|---|---|
| 1. Lack of power or influence of people in charge | A | A | V | A | O | A | V | |
| 2. Higher priorities to the production activity | X | X | O | O | V | A | ||
| 3. Lack of management awareness | V | V | V | X | O | |||
| 4. Resistance of management to change | O | V | V | A | ||||
| 5. Complex decision chains | A | V | V | |||||
| 6. Insufficient integration of energy objectives | A | A | ||||||
| 7. Inadequate management capacity | A | |||||||
| 8. Conflicts of interest within the organization |
Table 3.
Initial RM.
| Barriers | 8 | 7 | 6 | 5 | 4 | 3 | 2 | 1 |
|---|---|---|---|---|---|---|---|---|
| 1. Lack of power or influence of people in charge | 0 | 0 | 1 | 0 | 0 | 0 | 1 | 1 |
| 2. Higher priorities to the production activity | 1 | 1 | 0 | 0 | 1 | 0 | 1 | 0 |
| 3. Lack of management awareness | 1 | 1 | 1 | 1 | 0 | 1 | 1 | 1 |
| 4. Resistance of management to change | 0 | 1 | 1 | 0 | 1 | 0 | 0 | 0 |
| 5. Complex decision chains | 0 | 1 | 1 | 1 | 1 | 1 | 0 | 1 |
| 6. Insufficient integration of energy objectives | 0 | 0 | 1 | 0 | 0 | 0 | 0 | 0 |
| 7. Inadequate management capacity | 0 | 1 | 1 | 0 | 0 | 0 | 1 | 1 |
| 8. Conflicts of interest within the organization | 1 | 0 | 1 | 1 | 0 | 0 | 1 | 1 |
Table 4.
Final RM.
| Barriers | 8 | 7 | 6 | 5 | 4 | 3 | 2 | 1 |
|---|---|---|---|---|---|---|---|---|
| 1. Lack of power or influence of people in charge | 1 1 | 1 1 | 1 | 0 | 1 1 | 0 | 1 | 1 |
| 2. Higher priorities to the production activity | 1 | 1 | 1 1 | 0 | 1 | 0 | 1 | 1 1 |
| 3. Lack of management awareness | 1 | 1 | 1 | 1 | 1 1 | 1 | 1 | 1 |
| 4. Resistance of management to change | 0 | 1 | 1 | 0 | 1 | 0 | 1 1 | 1 1 |
| 5. Complex decision chains | 1 1 | 1 | 1 | 1 | 1 | 1 | 1 1 | 1 |
| 6. Insufficient integration of energy objectives | 0 | 0 | 1 | 0 | 0 | 0 | 0 | 0 |
| 7. Inadequate management capacity | 1 1 | 1 | 1 | 0 | 1 1 | 0 | 1 | 1 |
| 8. Conflicts of interest within the organization | 1 | 1 1 | 1 | 1 | 1 1 | 1 1 | 1 | 1 |
1 Transitivity.
Table 5.
Partition of RM interaction—Iteration 1.
| Barriers Number | Reachability Set | Antecedent Set | Intersection Set | Level |
|---|---|---|---|---|
| 1 | 1,2,4,6,7,8 | 1,2,3,4,5,7,8 | 1,2,4,7,8 | |
| 2 | 1,2,4,6,7,8 | 1,2,3,4,5,7,8 | 1,2,4,7,8 | |
| 3 | 1,2,3,4,5,6,7,8 | 3,5,8 | 3,5,8 | |
| 4 | 1,2,4,6,7 | 1,2,3,4,5,7,8 | 1,2,4,7 | |
| 5 | 1,2,3,4,5,6,7,8 | 3,5,8 | 3,5,8 | |
| 6 | 6 | 1,2,3,4,5,6,7,8 | 6 | I |
| 7 | 1,2,4,6,7,8 | 1,2,3,4,5,7,8 | 1,2,4,7,8 | |
| 8 | 1,2,3,4,5,6,7,8 | 1,2,3,5,7,8 | 1,2,3,5,7,8 |
Table 6.
Partition of RM interaction—Iteration 2.
| Barriers Number | Reachability Set | Antecedent Set | Intersection Set | Level |
|---|---|---|---|---|
| 1 | 1,2,4,7,8 | 1,2,3,4,5,7,8 | 1,2,4,7,8 | II |
| 2 | 1,2,4,7,8 | 1,2,3,4,5,7,8 | 1,2,4,7,8 | II |
| 3 | 1,2,3,4,5,7,8 | 3,5,8 | 3,5,8 | |
| 4 | 1,2,4,7 | 1,2,3,4,5,7,8 | 1,2,4,7 | II |
| 5 | 1,2,3,4,5,7,8 | 3,5,8 | 3,5,8 | |
| 7 | 1,2,4,7,8 | 1,2,3,4,5,7,8 | 1,2,4,7,8 | II |
| 8 | 1,2,3,4,5,7,8 | 1,2,3,5,7,8 | 1,2,3,5,7,8 |
Table 7.
Partition of reachability matrix interaction—Iteration 3.
| Barriers Number | Reachability Set | Antecedent Set | Intersection Set | Level |
|---|---|---|---|---|
| 3 | 3,5,8 | 3,5,8 | 3,5,8 | III |
| 5 | 3,5,8 | 3,5,8 | 3,5,8 | III |
| 8 | 3,5,8 | 3,5,8 | 3,5,8 | III |
Table 8.
Conical matrix.
| Barrier Number | 6 | 4 | 1 | 2 | 7 | 8 | 5 | 3 | Driving Power | Ranking |
|---|---|---|---|---|---|---|---|---|---|---|
| 3 | 1 | 1 | 1 | 1 | 1 | 1 | 1 | 1 | 8 | 1 |
| 5 | 1 | 1 | 1 | 1 | 1 | 1 | 1 | 1 | 8 | 1 |
| 8 | 1 | 1 | 1 | 1 | 1 | 1 | 1 | 1 | 8 | 1 |
| 7 | 1 | 1 | 1 | 1 | 1 | 1 | 0 | 0 | 6 | 2 |
| 2 | 1 | 1 | 1 | 1 | 1 | 1 | 0 | 0 | 6 | 2 |
| 1 | 1 | 1 | 1 | 1 | 1 | 1 | 0 | 0 | 6 | 2 |
| 4 | 1 | 1 | 1 | 1 | 1 | 0 | 0 | 0 | 5 | 3 |
| 6 | 1 | 0 | 0 | 0 | 0 | 0 | 0 | 0 | 1 | 4 |
| Dependence | 8 | 7 | 7 | 7 | 7 | 6 | 3 | 3 | ||
| Ranking | 1 | 2 | 2 | 2 | 2 | 3 | 4 | 4 |
© 2018 by the authors. Licensee MDPI, Basel, Switzerland. This article is an open access article distributed under the terms and conditions of the Creative Commons Attribution (CC BY) license (http://creativecommons.org/licenses/by/4.0/).
Share and Cite
MDPI and ACS Style
Soepardi, A.; Thollander, P. Analysis of Relationships among Organizational Barriers to Energy Efficiency Improvement: A Case Study in Indonesia’s Steel Industry. Sustainability 2018, 10, 216. https://doi.org/10.3390/su10010216
AMA Style
Soepardi A, Thollander P. Analysis of Relationships among Organizational Barriers to Energy Efficiency Improvement: A Case Study in Indonesia’s Steel Industry. Sustainability. 2018; 10(1):216. https://doi.org/10.3390/su10010216
Chicago/Turabian StyleSoepardi, Apriani, and Patrik Thollander. 2018. "Analysis of Relationships among Organizational Barriers to Energy Efficiency Improvement: A Case Study in Indonesia’s Steel Industry" Sustainability 10, no. 1: 216. https://doi.org/10.3390/su10010216
Note that from the first issue of 2016, this journal uses article numbers instead of page numbers. See further details here.