Relationship between Convenience, Perceived Value, and Repurchase Intention in Online Shopping in Vietnam

 , , and
Abstract
:1. Introduction
2. Literature Review and Research Model
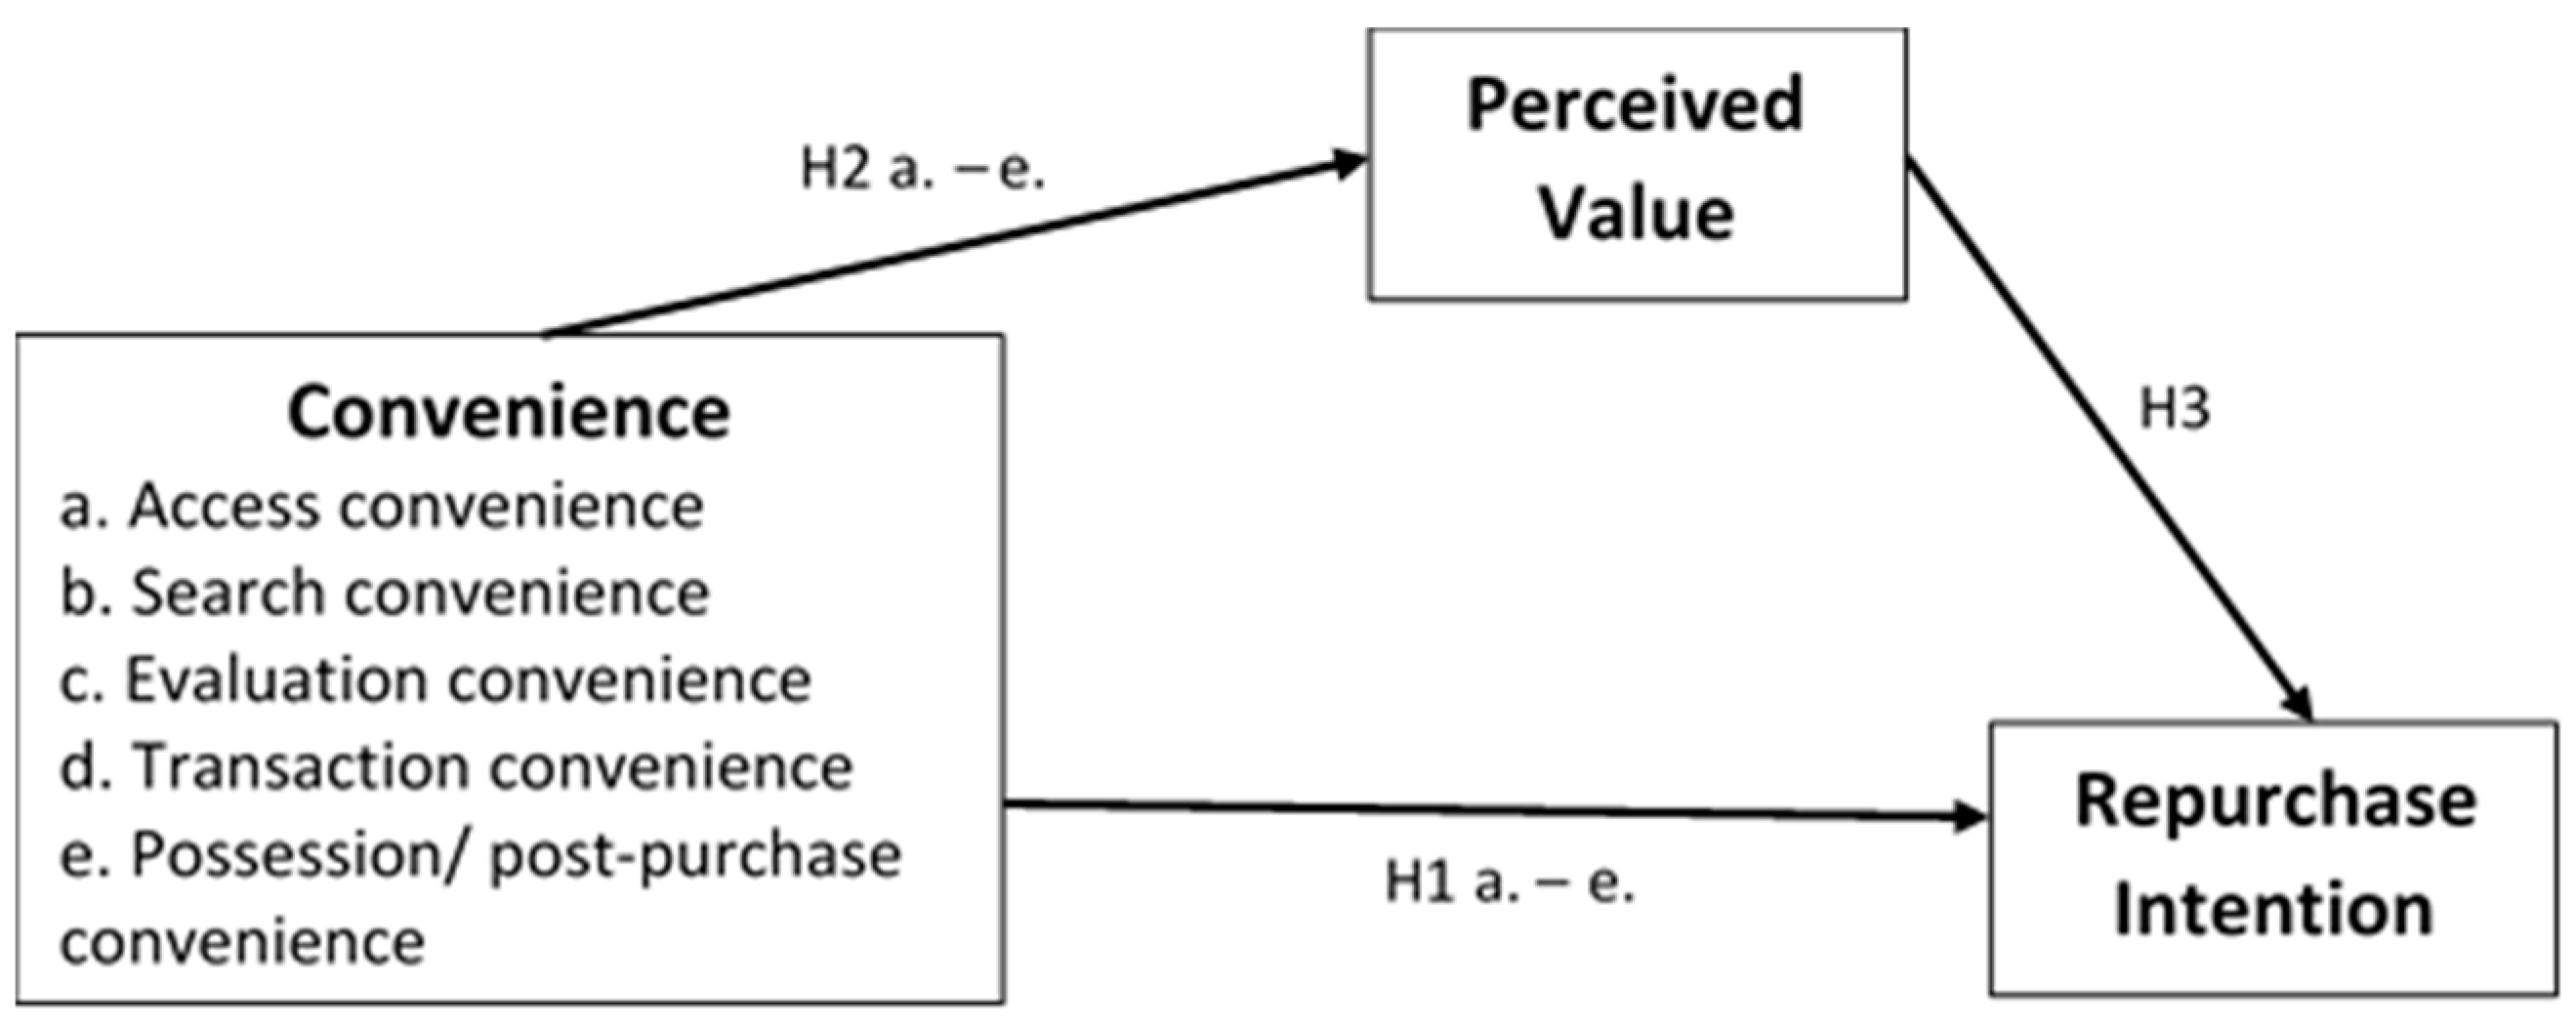
2.1. Convenience
- Access convenience is a consumer’s perceived time and effort expenditures to accessing online shopping.
- Search convenience is a consumer’s perceived time and effort expenditures to search for a product.
- Evaluation convenience is a consumer’s perceived time and effort expenditures to evaluate a product.
- Transaction convenience is a consumer’s perceived time and effort to effectively complete the trade or purchased.
- Possession/post-purchase convenience: (a) Possession convenience is consumers’ perceived time and effort to own what they want and experience those benefits. (b) Post-purchase convenience is consumers’ perceived time and effort expenditures to contact the supplier after using the service.
2.2. Repurchase Intention
2.3. Perceived Value
2.4. Research Model
3. Research Method
3.1. Measurement
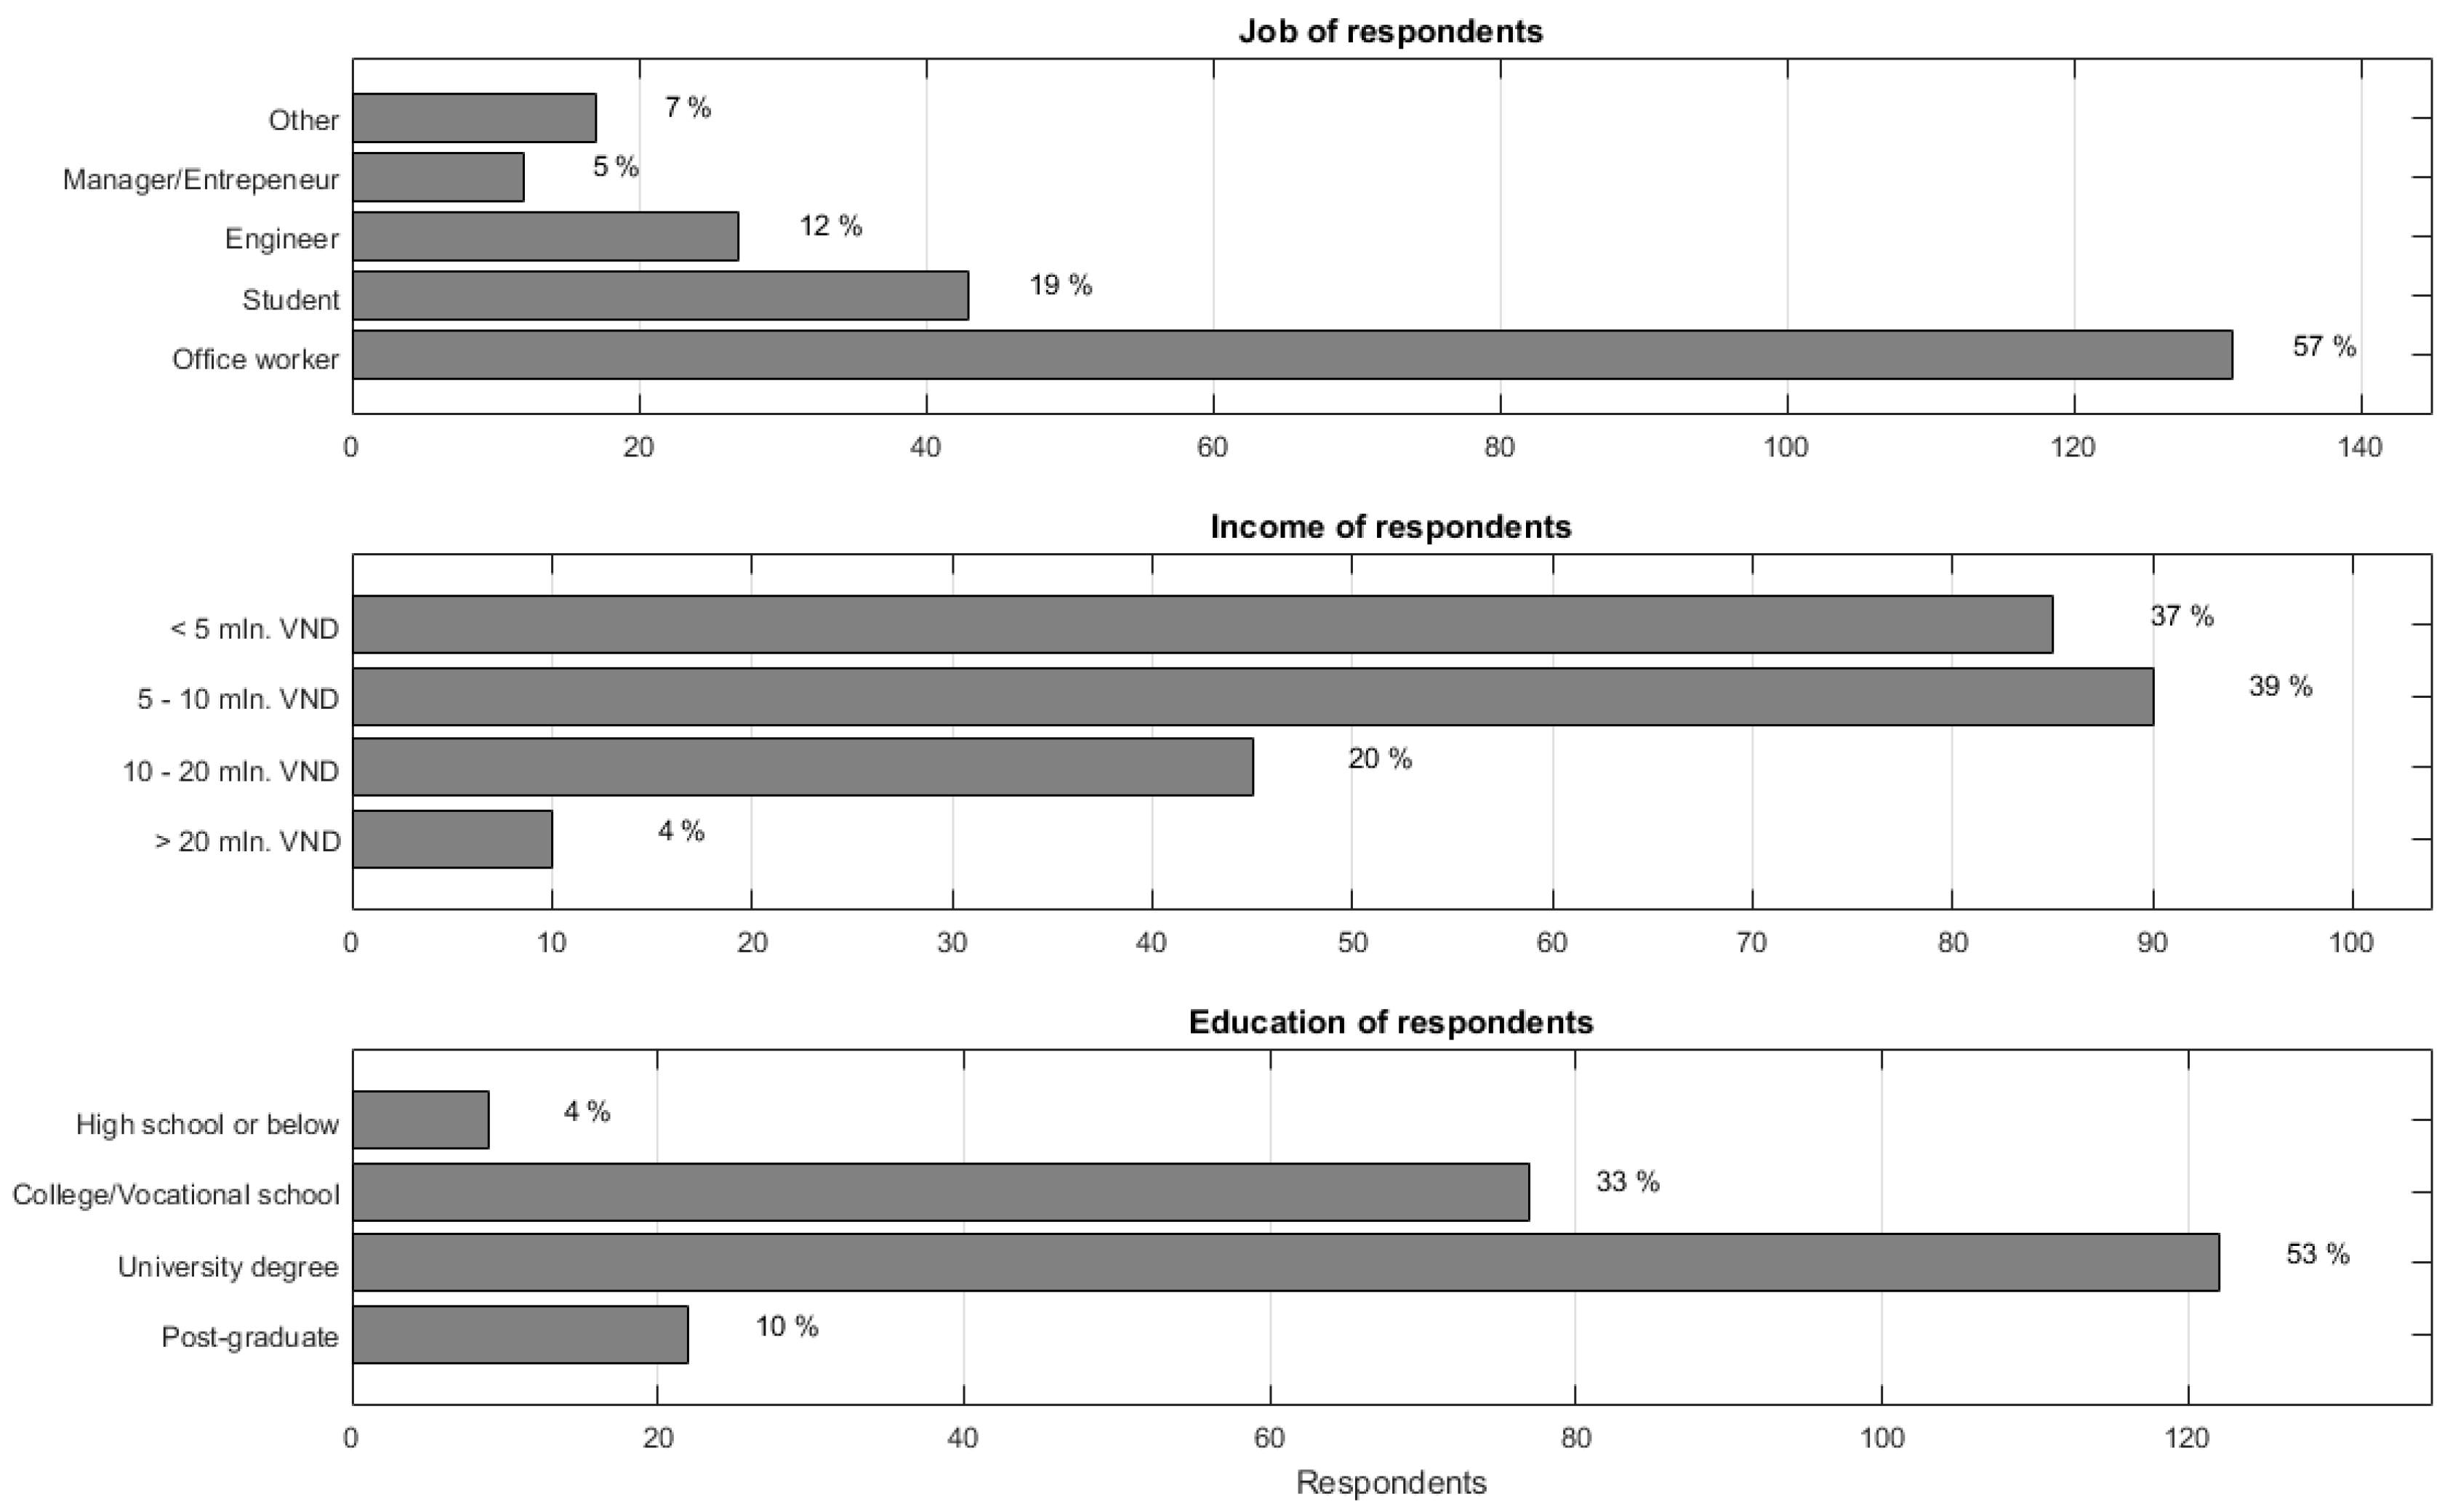
3.2. Sampling and Data Collection
3.3. Descriptive Statistics
4. Results
4.1. Descriptive Statistics and Testing Normal Distribution
4.2. Verification of Scale
4.3. SEM Results
5. Conclusions and Management Implications
5.1. Conclusions
5.2. Management Implications
5.3. Limitations and Future Researches
Acknowledgments
Author Contributions
Conflicts of Interest
References
- Ozen, H.; Engizek, N. Shopping online without thinking: Being emotional or rational? Asia Pac. J. Mark. Logist. 2014, 26, 78–93. [Google Scholar] [CrossRef]
- Kim, J.B. Consumer value: An application to mall and Internet shopping: Integrating initial trust and TAM. Electr. Commer. Res. 2002, 12, 125–150. [Google Scholar] [CrossRef]
- Wang, Y.; Wang, Y.; Lee, S.H. The Effect of Cross-Border E-Commerce on China’s International Trade: An Empirical Study Based on Transaction Cost Analysis. Sustainability 2017, 9, 2028. [Google Scholar] [CrossRef]
- Chen, Q.; Zhang, N. Does E-Commerce Provide a Sustained Competitive Advantage? An Investigation of Survival and Sustainability in Growth-Oriented Enterprises. Sustainability 2015, 7, 1411–1428. [Google Scholar] [CrossRef]
- Śmigielska, G.; Oczkowska, R. Retailers’ Responsibility towards Consumers and Key Drivers of Their Development in Poland. Adm. Sci. 2017, 7, 3. [Google Scholar] [CrossRef]
- Lohse, G.L.; Bellman, S.; Johnson, E.J. Consumer buying behavior on the Internet: Findings from panel data. J. Interac. Mark. 2000, 14, 15–29. [Google Scholar] [CrossRef]
- Valincius, K.; Stuikys, V.; Damasevicius, R. Understanding of e-commerce is through feature models and their metrics. In Proceedings of the IADIS International Conference Information Systems, IS 2013, Prague, Czech Republic, 22–24 July 2013; pp. 55–62. [Google Scholar]
- Colwell, S.R.; Aung, M.; Kanetkar, V.; Holden, A.L. Toward a measure of service convenience: Multiple-item scale development and empirical test. J. Serv. Mark. 2008, 22, 160–169. [Google Scholar] [CrossRef]
- Beauchamp, M.B.; Ponder, N. Perceptions of retail convenience for in-store and online shoppers. Mark. Manag. J. 2010, 20, 49–65. [Google Scholar]
- Farquhar, J.D.; Rowley, J. Convenience: A services perspective. Mark. Theory 2009, 9, 425–438. [Google Scholar] [CrossRef]
- Zeithaml, V.A.; Bitner, M.J. Services Marketing: Integrating Customer Focus across the Firm, 2nd ed.; Irwin/McGraw-Hill: Boston, MA, USA, 2000. [Google Scholar]
- Berry, L.L.; Seiders, K.; Grewal, D. Understanding service convenience. J. Mark. 2002, 66, 1–17. [Google Scholar] [CrossRef]
- Kim, Y.K.; Lee, M.Y.; Park, S.H. Shopping value orientation: Conceptualization and measurement. J. Bus. Res. 2014, 67, 2884–2890. [Google Scholar] [CrossRef]
- Zeithaml, V.A. Consumer perceptions of price, quality, and value: A means-end model and synthesis of evidence. J. Mark. 1988, 52, 2–22. [Google Scholar] [CrossRef]
- Jiang, L.; Yang, Z.; Jun, M. Measuring consumer perceptions of online shopping convenience. J. Serv. Manag. 2012, 24, 191–214. [Google Scholar] [CrossRef]
- Mpinganjira, M. Online Store Service Convenience, Customer Satisfaction and Behavioural Intentions: A Focus on Utilitarian Oriented Shoppers. J. Econ. Behav. Stud. 2015, 7, 36–49. [Google Scholar]
- Yale, L.; Venkatesh, A. Toward the construct of convenience in consumer research. NA-Adv. Consum. Res. 1986, 13, 403–408. [Google Scholar]
- Seiders, K.; Voss, G.B.; Godfrey, A.L.; Grewal, D. SERVCON: Development and validation of a multidimensional service convenience scale. J. Acad. Mark. Sci. 2007, 35, 144–156. [Google Scholar] [CrossRef]
- Moeller, S.; Fassnacht, M.; Ettinger, A. Retaining Customers with Shopping Convenience. J. Relatsh. Mark. 2009, 8, 313–329. [Google Scholar] [CrossRef]
- Seiders, K.; Voss, G.B.; Grewal, D.; Godfrey, A.L. Do satisfied customers buy more? Examining moderating influences in a retailing context. J. Mark. 2005, 69, 26–43. [Google Scholar] [CrossRef]
- Roy, S.K.; Lassar, W.M.; Shekhar, V. Convenience and satisfaction: Mediation of fairness and quality. Serv. Ind. J. 2016, 36, 239–260. [Google Scholar] [CrossRef]
- Yu, C.; Zhang, Z.; Lin, C.; Wu, Y.J. Knowledge Creation Process and Sustainable Competitive Advantage: The Role of Technological Innovation Capabilities. Sustainability 2017, 9, 2280. [Google Scholar] [CrossRef]
- Wu, T.; Wu, Y.J.; Tsai, H.; Li, Y. Top Management Teams’ Characteristics and Strategic Decision-Making: A Mediation of Risk Perceptions and Mental Models. Sustainability 2017, 9, 2265. [Google Scholar] [CrossRef]
- Ahn, S.-Y.; Kim, S.-H. What Makes Firms Innovative? The Role of Social Capital in Corporate Innovation. Sustainability 2017, 9, 1564. [Google Scholar] [CrossRef]
- Blackwell, R.D.; Miniard, P.W.; Engel, J.F. Consumer Behavior, 9th ed.; South-Western Thomas Learning: Mason, OH, USA, 2001. [Google Scholar]
- Pham, Q.T.; Tran, T.L. Customer engagement in a Facebook brand community: An empirical study on travel industry in Vietnam. In Proceedings of the 2014 IEEE 6th International Conference on Adaptive Science and Technology (ICAST), Ota, Nigeria, 29–31 October 2014; pp. 1–9. [Google Scholar]
- Chiu, C.M.; Chang, C.C.; Cheng, H.L.; Fang, Y.H. Determinants of customer repurchase intention in online shopping. Online Inf. Rev. 2009, 33, 761–784. [Google Scholar] [CrossRef]
- Aagja, J.P.; Mammen, T.; Saraswat, A. Validating service convenience scale and profiling customers: A study in the Indian retail context. Vikalpa 2011, 36, 25–49. [Google Scholar]
- Chang, Y.W.; Polonsky, M.J. The influence of multiple types of service convenience on behavioral intentions: The mediating role of consumer satisfaction in a Taiwanese leisure setting. Int. J. Hosp. Manag. 2012, 31, 107–118. [Google Scholar] [CrossRef]
- Thuy, P.N. Using service convenience to reduce perceived cost. Mark. Intell. Plan. 2011, 29, 473–487. [Google Scholar] [CrossRef]
- Cronin, J.J.; Brady, M.K.; Hult, G.T. Assessing the Effects of Quality, Value, and Customer Satisfaction on Consumer Behavioral Intentions in Service Environments. J. Retail. 2000, 76, 193–218. [Google Scholar] [CrossRef]
- Sweeney, J.C.; Soutar, G.N. Consumer perceived value: The development of a multiple item scale. J. Retail. 2001, 77, 203–220. [Google Scholar] [CrossRef]
- Chang, H.H.; Wang, H.-W. The moderating effect of customer perceived value on online shopping behaviour. Online Inf. Rev. 2011, 35, 333–359. [Google Scholar] [CrossRef]
- Lee, C.H.; Eze, U.C.; Ndubisi, N.O. Analyzing key determinants of online repurchase intentions. Asia Pac. J. Mark. Logist. 2011, 23, 200–221. [Google Scholar]
- Lien, C.H.; Wen, M.J.; Wu, C.C. Investigating the relationships among e-service quality, perceived value, satisfaction, and behavioural intentions in Taiwanese online shopping. Asia Pac. Manag. Rev. 2011, 16, 211–223. [Google Scholar]
- Hu, Y. Linking Perceived Value, Customer Satisfaction, and Purchase Intention in E-Commerce Settings. In Advances in Intelligent and Soft Computing; Springer: New York, NY, USA, 2011; Volume 106, pp. 623–628. [Google Scholar]
- Chen, H.-S.; Tsai, B.-K.; Hsieh, C.M. Determinants of Consumers’ Purchasing Intentions for the Hydrogen-Electric Motorcycle. Sustainability 2017, 9, 1447. [Google Scholar] [CrossRef]
- Parasuraman, A.; Zeithaml, V.A.; Malhotra, A. ES-QUAL a multiple-item scale for assessing electronic service quality. J. Serv. Res. 2005, 7, 213–233. [Google Scholar] [CrossRef]
- Statista. Number of Internet Users in Vietnam from 2015 to 2022 (in Millions). 2017. Available online: https://www.statista.com/statistics/369732/internet-users-vietnam/ (accessed on 4 January 2018).
- Tho, N.D.; Trang, N.T.M. Brand value in consumer goods market. Mark. Res. Appl. Struct. Equ. Model. SEM 2011, 2, 3–85. [Google Scholar]
- Hu, L.; Bentler, P. Cutoff criteria for fit indices in covariance structure analysis: Conventional criteria versus new alternatives. Struct. Equ. Model. 1999, 6, 1–55. [Google Scholar] [CrossRef]
- Steenkamp, J.B.E.; Van Trijp, H.C. The use of LISREL in validating marketing constructs. Int. J. of Res. Mark. 1991, 8, 283–299. [Google Scholar] [CrossRef]
- Anderson, J.C.; Gerbing, D.W. Structural Equation Modeling in Practice: A Review and Recommended Two-Step Approach. Psychol. Bull. 1988, 103, 411–423. [Google Scholar] [CrossRef]
- Fornell, C.; Larcker, D. Evaluating structural equation models with unobserved variables and measurement error. J. Mark. Res. 1981, 28, 39–50. [Google Scholar] [CrossRef]


| No. | Min | Max | Mean | Standard Deviation | Skew | Kurtosis | |||
|---|---|---|---|---|---|---|---|---|---|
| Statistic | Standard Error | Statistic | Standard Error | ||||||
| TTTC01 | 230 | 1 | 5 | 3.99 | 0.825 | −0.783 | 0.160 | 0.868 | 0.320 |
| TTTC02 | 230 | 1 | 5 | 3.97 | 0.848 | −0.938 | 0.160 | 1.464 | 0.320 |
| TTTC03 | 230 | 1 | 5 | 3.92 | 0.858 | −0.644 | 0.160 | 0.359 | 0.320 |
| TTTK04 | 230 | 1 | 5 | 3.85 | 0.910 | −0.711 | 0.160 | 0.479 | 0.320 |
| TTTK05 | 230 | 1 | 5 | 3.83 | 0.881 | −0.637 | 0.160 | 0.394 | 0.320 |
| TTTK06 | 230 | 1 | 5 | 3.71 | 0.929 | −0.609 | 0.160 | 0.419 | 0.320 |
| TTTK07 | 230 | 1 | 5 | 3.69 | 0.932 | −0.521 | 0.160 | −0.129 | 0.320 |
| TTĐG08 | 230 | 1 | 5 | 3.80 | 0.893 | −0.707 | 0.160 | 0.395 | 0.320 |
| TTĐG09 | 230 | 1 | 5 | 3.75 | 0.879 | −0.701 | 0.160 | 0.431 | 0.320 |
| TTĐG10 | 230 | 1 | 5 | 3.80 | 0.913 | −0.740 | 0.160 | 0.471 | 0.320 |
| TTGD11 | 230 | 1 | 5 | 3.85 | 0.881 | −0.432 | 0.160 | −0.289 | 0.320 |
| TTGD12 | 230 | 1 | 5 | 3.84 | 0.912 | −0.522 | 0.160 | −0.135 | 0.320 |
| TTGD13 | 230 | 1 | 5 | 3.74 | 0.966 | −0.520 | 0.160 | −0.150 | 0.320 |
| TTSH14 | 230 | 1 | 5 | 3.64 | 0.941 | −0.596 | 0.160 | 0.236 | 0.320 |
| TTSH15 | 230 | 1 | 5 | 3.68 | 0.929 | −0.742 | 0.160 | 0.632 | 0.320 |
| TTSH16 | 230 | 1 | 5 | 3.62 | 0.887 | −0.165 | 0.160 | −0.154 | 0.320 |
| TTSH17 | 230 | 1 | 5 | 3.73 | 0.938 | −0.560 | 0.160 | 0.048 | 0.320 |
| TTSH18 | 230 | 1 | 5 | 3.75 | 0.941 | −0.627 | 0.160 | 0.249 | 0.320 |
| GTCN19 | 230 | 1 | 5 | 3.69 | 0.819 | −0.569 | 0.160 | 0.383 | 0.320 |
| GTCN20 | 230 | 1 | 5 | 3.68 | 0.871 | −0.654 | 0.160 | 0.702 | 0.320 |
| GTCN21 | 230 | 1 | 5 | 3.86 | 0.866 | −0.664 | 0.160 | 0.552 | 0.320 |
| GTCN22 | 230 | 1 | 5 | 3.64 | 0.913 | −0.470 | 0.160 | 0.041 | 0.320 |
| YDML23 | 230 | 1 | 5 | 3.79 | 0.787 | −0.533 | 0.160 | 0.659 | 0.320 |
| YDML24 | 230 | 1 | 5 | 3.61 | 0.879 | −0.238 | 0.160 | −0.070 | 0.320 |
| YDML25 | 230 | 1 | 5 | 3.59 | 0.855 | −0.456 | 0.160 | 0.155 | 0.320 |
| Factor | |||||||
|---|---|---|---|---|---|---|---|
| 1 | 2 | 3 | 4 | 5 | 6 | 7 | |
| Search Convenience | |||||||
| Find desired products quickly | 0.854 | ||||||
| Easy to understand and navigate web site | 0.838 | ||||||
| Product classification is easy to follow | 0.759 | ||||||
| Possession/Post-Purchase Convenience | |||||||
| Receive all the items I ordered | 0.882 | ||||||
| Prices are identical to those on the order form | 0.783 | ||||||
| Undamaged delivered goods | 0.774 | ||||||
| Evaluation Convenience | |||||||
| Provides product specifics | 0.877 | ||||||
| Sufficient information to identify different products | 0.764 | ||||||
| Uses both text and graphics of product information | 0.710 | ||||||
| Access Convenience | |||||||
| Could shop anytime I wanted | 0.843 | ||||||
| Could order products wherever I am | 0.796 | ||||||
| The web site is always accessible | 0.732 | ||||||
| Transaction Convenience | |||||||
| Without difficulty to complete my purchases | 0.824 | ||||||
| Flexible payment methods | 0.817 | ||||||
| Simple and convenient online payment | 0.754 | ||||||
| Repurchase Intention | |||||||
| I will use this retailer web site more often for online purchases | 0.898 | ||||||
| I encourage others to shop online at this retailer | 0.766 | ||||||
| I will continue to shop online at this retailer | 0.523 | ||||||
| Perceived Value | |||||||
| The prices of the products and services available at this site (how economical the site is) | 0.898 | ||||||
| The overall value you get from this site for your money and effort | 0.720 | ||||||
| The overall convenience of using this site | 0.689 | ||||||
| Factor and Item | λ | p |
|---|---|---|
| Access Convenience: ρc = 0.828; ρvc = 0.616 | ||
| Could shop anytime I wanted The web site is always accessible Could order products wherever I am | 0.787 0.741 0.825 | *** *** *** |
| Search Convenience: ρc = 0.858; ρvc = 0.669 | ||
| Easy to understand and navigate web site Find desired products quickly Product classification is easy to follow | 0.79 0.88 0.78 | *** *** *** |
| Evaluation Convenience: ρc = 0.833; ρvc = 0.624 | ||
| Provides product specifics Sufficient information to identify different products Uses both text and graphics of product information | 0.807 0.764 0.798 | *** *** *** |
| Transaction Convenience: ρc = 0.846; ρvc = 0.647 | ||
| Simple and convenient online payment Flexible payment methods Without difficulty to complete my purchases | 0.786 0.822 0.804 | *** *** *** |
| Possession/Post-Purchase Convenience: ρc = 0.856; ρvc = 0.666 | ||
| Undamaged delivered goods Receive all the items I ordered Prices are identical to those on the order form | 0.725 0.884 0.832 | *** *** *** |
| Perceived Value: ρc = 0.849; ρvc = 0.652 | ||
| The prices of the products and services available at this site (how economical the site is) The overall convenience of using this site The overall value you get from this site for your money and effort | 0.788 0.827 0.806 | *** *** *** |
| Repurchase Intention: ρc = 0.857; ρvc = 0.667 | ||
| I will continue to shop online at this retailer I encourage others to shop online at this retailer I will use this retailer web site more often for online purchases | 0.811 0.826 0.813 | *** *** *** |
| Correlation | r (SE) | CR | p |
|---|---|---|---|
| Search convenience ↔ Possession/post-purchase convenience | 0.395 (0.071) | 8.485 | 0.000 |
| Search convenience ↔ Evaluation convenience | 0.367 (0.072) | 8.767 | 0.000 |
| Search convenience ↔ Access convenience | 0.358 (0.072) | 8.859 | 0.000 |
| Search convenience ↔ Transaction convenience | 0.463 (0.069) | 7.806 | 0.000 |
| Search convenience ↔ Repurchase intention | 0.501 (0.067) | 7.429 | 0.000 |
| Search convenience ↔ Perceived value | 0.496 (0.067) | 7.478 | 0.000 |
| Possession/post-purchase convenience ↔ Evaluation convenience | 0.503 (0.067) | 7.409 | 0.000 |
| Possession/post-purchase convenience ↔ Access convenience | 0.455 (0.069) | 7.885 | 0.000 |
| Possession/post-purchase convenience ↔ Transaction convenience | 0.577 (0.063) | 6.673 | 0.000 |
| Possession/post-purchase convenience ↔ Repurchase intention | 0.592 (0.063) | 6.522 | 0.000 |
| Possession/post-purchase convenience ↔ Perceived value | 0.591 (0.063) | 6.533 | 0.000 |
| Evaluation convenience ↔ Access convenience | 0.399 (0.071) | 8.445 | 0.000 |
| Evaluation convenience ↔ Transaction convenience | 0.619 (0.061) | 6.250 | 0.000 |
| Evaluation convenience ↔ Repurchase intention | 0.594 (0.062) | 6.502 | 0.000 |
| Evaluation convenience ↔ Perceived value | 0.599 (0.062) | 6.452 | 0.000 |
| Access convenience ↔ Transaction convenience | 0.529 (0.066) | 7.151 | 0.000 |
| Access convenience ↔ Repurchase intention | 0.550 (0.065) | 6.942 | 0.000 |
| Access convenience ↔ Perceived value | 0.553 (0.065) | 6.912 | 0.000 |
| Transaction convenience ↔ Repurchase intention | 0.662 (0.058) | 5.810 | 0.000 |
| Transaction convenience ↔ Perceived value | 0.662 (0.058) | 5.810 | 0.000 |
| Repurchase intention ↔ Perceived value | 0.672 (0.057) | 5.707 | 0.000 |
| Relationship | Estimate | p | Result |
|---|---|---|---|
| Access convenience → Repurchase intention | 0.150 | 0.046 | Supported H1(a) |
| Search convenience → Repurchase intention | 0.134 | 0.047 | Supported H1(b) |
| Evaluation convenience → Repurchase intention | 0.166 | 0.047 | Supported H1(c) |
| Transaction convenience → Repurchase intention | 0.195 | 0.044 | Supported H1(d) |
| Possession/post-purchase convenience → Repurchase intention | 0.156 | 0.045 | Supported H1(e) |
| Access convenience → Perceived value | 0.196 | 0.009 | Supported H2(a) |
| Search convenience → Perceived value | 0.159 | 0.019 | Supported H2(b) |
| Evaluation convenience → Perceived value | 0.218 | 0.009 | Supported H2(c) |
| Transaction convenience → Perceived value | 0.239 | 0.013 | Supported H2(d) |
| Possession/post-purchase convenience → Perceived value | 0.192 | 0.014 | Supported H2(e) |
| Perceived value → Repurchase intention | 0.201 | 0.042 | Supported H3 |
| Relationship | Estimate | p | Result |
|---|---|---|---|
| Access convenience → Repurchase intention | 0.189 | 0.011 | Supported |
| Search convenience → Repurchase intention | 0.166 | 0.014 | Supported |
| Evaluation convenience → Repurchase intention | 0.208 | 0.011 | Supported |
| Transaction convenience → Repurchase intention | 0.245 | 0.011 | Supported |
| Possession/post-purchase convenience → Repurchase intention | 0.193 | 0.012 | Supported |
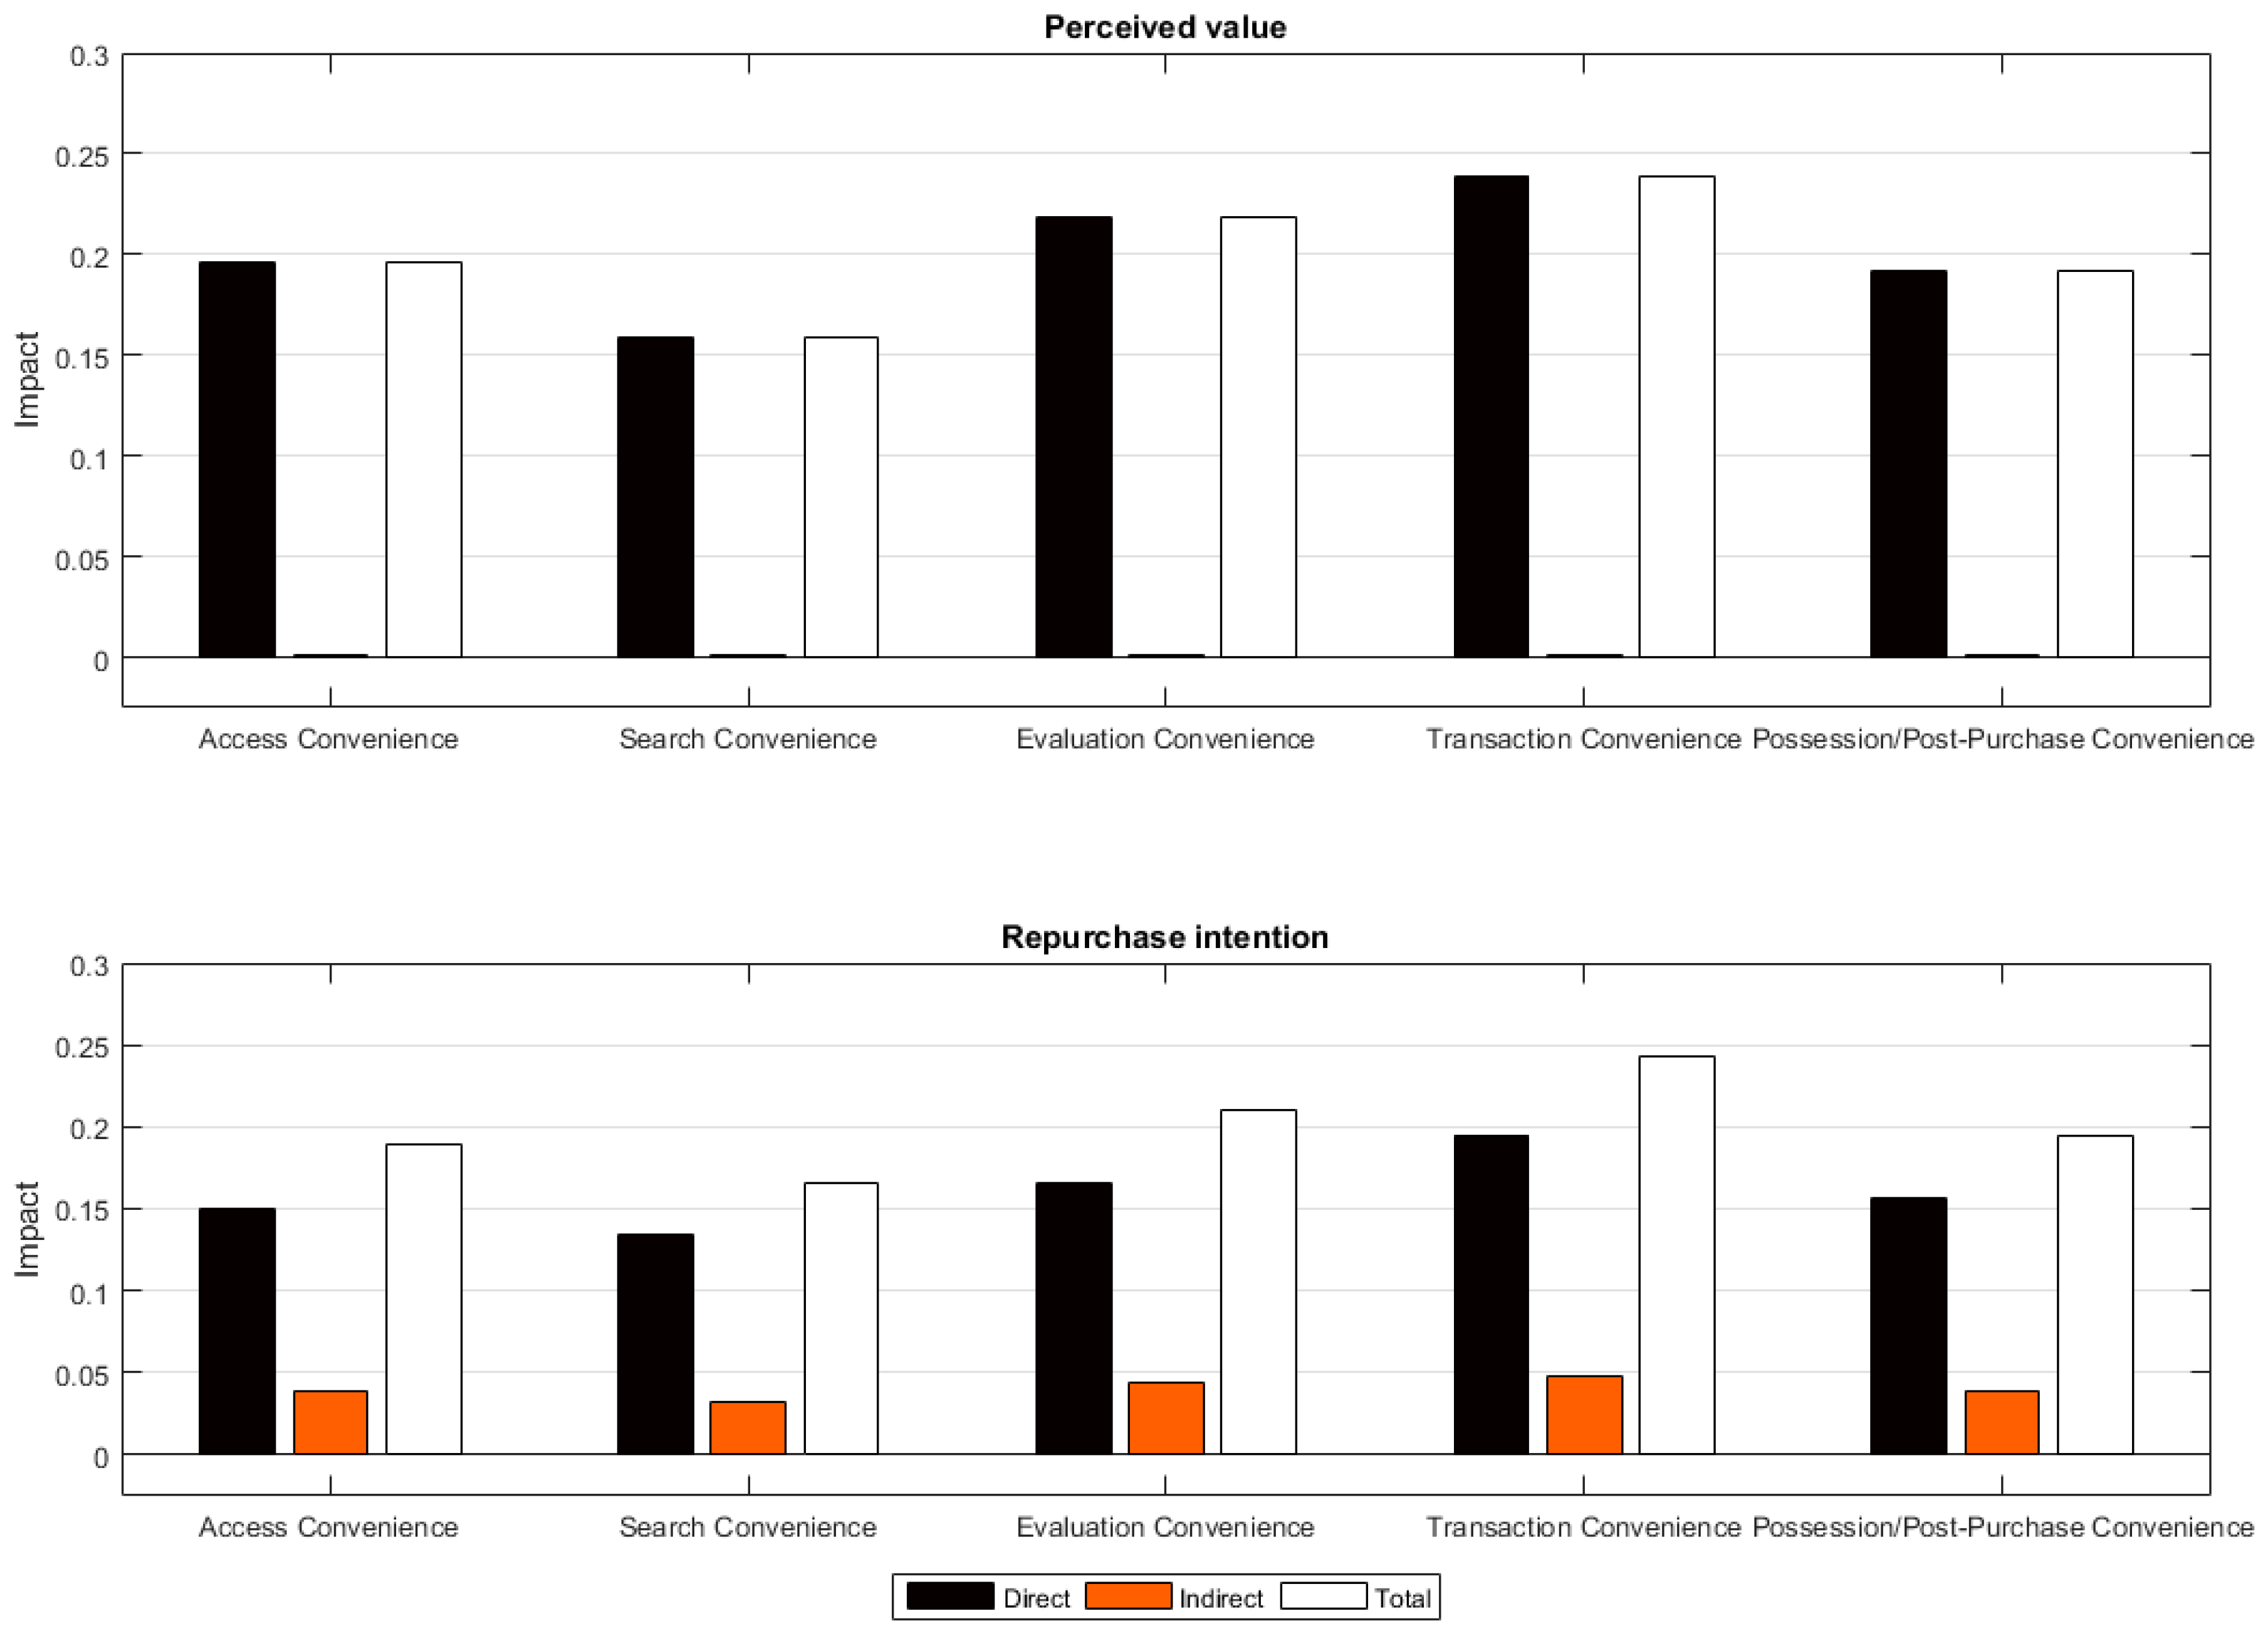
| Access Convenience | Search Convenience | Evaluation Convenience | Transaction Convenience | Possession/Post-Purchase Convenience | ||
|---|---|---|---|---|---|---|
| Perceived Value | Direct | 0.196 | 0.159 | 0.218 | 0.239 | 0.192 |
| Indirect | 0.000 | 0.000 | 0.000 | 0.000 | 0.000 | |
| Total | 0.196 | 0.159 | 0.218 | 0.239 | 0.192 | |
| Repurchase Intention | Direct | 0.150 | 0.134 | 0.166 | 0.195 | 0.156 |
| Indirect | 0.039 | 0.032 | 0.044 | 0.048 | 0.039 | |
| Total | 0.189 | 0.166 | 0.210 | 0.243 | 0.195 |
© 2018 by the authors. Licensee MDPI, Basel, Switzerland. This article is an open access article distributed under the terms and conditions of the Creative Commons Attribution (CC BY) license (http://creativecommons.org/licenses/by/4.0/).
Share and Cite
Pham, Q.T.; Tran, X.P.; Misra, S.; Maskeliūnas, R.; Damaševičius, R. Relationship between Convenience, Perceived Value, and Repurchase Intention in Online Shopping in Vietnam. Sustainability 2018, 10, 156. https://doi.org/10.3390/su10010156
Pham QT, Tran XP, Misra S, Maskeliūnas R, Damaševičius R. Relationship between Convenience, Perceived Value, and Repurchase Intention in Online Shopping in Vietnam. Sustainability. 2018; 10(1):156. https://doi.org/10.3390/su10010156
Chicago/Turabian StylePham, Quoc Trung, Xuan Phuc Tran, Sanjay Misra, Rytis Maskeliūnas, and Robertas Damaševičius. 2018. "Relationship between Convenience, Perceived Value, and Repurchase Intention in Online Shopping in Vietnam" Sustainability 10, no. 1: 156. https://doi.org/10.3390/su10010156