Sustainable Technology Analysis of Artificial Intelligence Using Bayesian and Social Network Models


1
Graduate School of Management of Technology, Korea University, Seoul 02841, Korea
2
Department of Statistics, Cheongju University, Chungbuk 28503, Korea
3
Department of Industrial Management Engineering, Korea University, Seoul 02841, Korea
*
Author to whom correspondence should be addressed.
Sustainability 2018, 10(1), 115; https://doi.org/10.3390/su10010115
Submission received: 8 December 2017
/
Revised: 3 January 2018
/
Accepted: 4 January 2018
/
Published: 5 January 2018
(This article belongs to the Section Economic and Business Aspects of Sustainability)
Abstract
:Recent developments in artificial intelligence (AI) have led to a significant increase in the use of AI technologies. Many experts are researching and developing AI technologies in their respective fields, often submitting papers and patent applications as a result. In particular, owing to the characteristics of the patent system that is used to protect the exclusive rights to registered technology, patent documents contain detailed information on the developed technology. Therefore, in this study, we propose a statistical method for analyzing patent data on AI technology to improve our understanding of sustainable technology in the field of AI. We collect patent documents that are related to AI technology, and then analyze the patent data to identify sustainable AI technology. In our analysis, we develop a statistical method that combines social network analysis and Bayesian modeling. Based on the results of the proposed method, we provide a technological structure that can be applied to understand the sustainability of AI technology. To show how the proposed method can be applied to a practical problem, we apply the technological structure to a case study in order to analyze sustainable AI technology.
1. Introduction
Companies face a constant battle to survive in a competitive market environment. An important aspect of remaining competitive is the technology possessed by the company. As a result, companies conduct research to develop innovative technologies to enhance their market competitiveness. As such, research and development (R&D) planning is one of the main issues in business management. In addition, sustainability in technology is a key point in the management of technology [1]. As a result, studies that are related to sustainable technology have been published in diverse domains [2,3,4]. Sustainable technology is essential for the continuous development of a technology in a given field [2]. Park et al. (2015) studied a network analysis model that can be used to select sustainable technology in a given technological field [4]. In addition, Kim et al. (2015) proposed a forecasting methodology for sustainable technology management in the area of defense [3]. Choi et al. (2016) used patent document data for sustainable technology analyses [2]. They consider patents that are related to a given technology domain for a technology analysis because a patent contains diverse and complete results about the developed technology. Statistical analyses of patent data have been used as an effective method for technology analyses in various fields [5,6,7]. In this study, we propose a statistical patent analysis method for sustainable technology analyses. Here, we consider two approaches. First, we apply a Social Network Analysis (SNA) to construct our methodology. Second, we perform Bayesian regression modeling to identify technological relationships for sustainable technology analyses. Then, we demonstrate our methodology by conducting a case study on Artificial Intelligence (AI) technology. The remainder of the paper is structured as follows. Section 2 introduces Bayesian inferences. Then, we propose a sustainable technology analysis method using a Bayesian regression model in Section 3. To illustrate the practical application of our method, we conduct a case study in Section 4. Finally, in Section 5, we present our conclusions and suggestions for future research.
2. Bayesian Inference
A Bayesian inference is based on Bayes’ theorem, representing the conditional relations between random variables [8]. In frequentist statistics, the model parameters are fixed using a maximum likelihood estimator (MLE) [9]. However, the MLE is computed from the observed data, which means a frequentist deals with the uncertainty in the current data. On the other hand, in Bayesian statistics, a Bayesian inference considers the probability distributions for the model parameters, as well as the MLE of the given data. Thus, the Bayesian inference adds the beliefs of the model parameters to the evidence of the MLE. In real-world problems, the beliefs are derived from the knowledge of domain experts. Therefore, using the Bayesian inference, we can select the best model based on the observed data and the knowledge of domain experts. The following structure of conditional probabilities defines the Bayes’ rule [10]:
Here, X and Y are random variables, and represent technological keywords in a technology analysis. Then, f(X) represents the beliefs of the random variable X that are not dependent on the data. That is, the function represents the domain knowledge of experts in a given technology field. In addition, f(Y|X) denotes the evidence that is provided by the data and given expert knowledge. The product of f(Y|X) and f(X) gives f(X|Y), which is the updated beliefs of the domain experts. Therefore, the Bayesian inference updates the beliefs about a given technology continuously using observed technology data and the prior beliefs of domain experts.
3. Sustainable Technology Analysis Model in Artificial Intelligence
The existing methodologies to technology analysis relied on two approaches, such as qualitative and quantitative methods. The qualitative method is based on the subjective knowledge of domain experts via Delphi survey, and the quantitative method is to analyze the patent data by statistical models. The latter is relatively objective when compared to the former, but the technological analysis results of the expert group are not reflected. To carry out the sustainable technology analysis efficiently and effectively, we need to combine two approaches to technology analysis. So, in order to improve the performance of sustainable technology analysis, we try to combine the evidence that is provided by the observed data and the domain knowledge of experts. Here, we consider patent documents as the observed data, and the prior and posterior distributions as the domain knowledge of experts. To carry out the sustainable technology analysis, we first consider Bayesian inference modeling based on the prior and posterior distributions. From the collected patent documents, we extracted the International Patent Classification (IPC), and construct patent-IPC code matrix. This matrix is composed of row of patent and column of IPC codes. We set the IPC code vector as . Where represents the pth IPC codes. Then, the joint probability distribution of p random variables (IPC codes) is defined as follows:
where the parameters () are distributed on the model M. This represents the observed data, called the likelihood. In addition, we consider the prior distribution of experts’ domain knowledge. This is defined as , and represents the beliefs of domain experts without the evidence from the observed data, . Using Bayes’ theorem, we show the posterior distribution as follows:
In this study, this represents the updated beliefs of domain experts using the observed data, . Thus, we obtain the final updated beliefs of the domain knowledge using the following procedure:
where are the technological IPC codes extracted from patent documents (observed data), is the updated belief at time step n − 1, and is the updated belief after learning and considering at time step n. Through such iterative learning, we calculate the final belief based on a Bayesian inference. We extract meaningful relationships between p IPC codes using Bayesian inference and learning. Let Ci and Co be two IPC codes, such that we learn the technological relationship between the two codes from the observed data and the prior beliefs. When Ci and Co are input and output variables, respectively, in the prediction model, we seek to determine the model , which minimizes the loss function, as follows [11]:
where Ci and Co denote the frequency with which the IPC codes appear in the patent documents. This loss function is used for the regression problem. To infer the response IPC code Co, we use Ci1, Ci2, …, Cik as input IPC codes. The Bayesian regression model is as follows:
where follows a normal distribution with mean 0 and variance , . The likelihood function for the observed data is defined as follows:
That is, the probability distribution of input IPC codes is represented by the Gaussian formula of response IPC code and linear combination of input IPC codes and their regression parameters. To get the final predictive model, we need a prior distribution. The prior beliefs of domain experts are represented as follows [12]:
Using the likelihood and prior functions, we obtain the posterior distribution, and then find the predictive distribution as follows:
where and . In addition, we use the probability value (p-value) to check the statistical significance of the input IPC code Ci to the output IPC code Co, as follows [9]:
The null hypothesis (H0) is that the input IPC code cannot affect the output IPC code. When the p-value from the hypothesis testing is less than 0.05 (95% confidence level), we decide that the input code does influence the output code significantly. In our research, we consider visualization based on a social network analysis (SNA) as sustainable technology analysis method. A SNA is based on graph theory, consisting of nodes and edges: G (Node, Edge) [13,14]. G( ) represents a graph data structure that expresses the relationship between connected objects. Each object is a node in the graph structure, and the connections between the objects are represented by edge. In this study, the nodes and edges are the IPC codes and the connections between IPC codes, respectively. In particular, we create an adjacency matrix, which we use to build the SNA visualization. Therefore, we construct the correlation matrix for an adjacency matrix in Table 1.
Using this matrix, we perform the SNA visualization of the IPC code data. Combining the results of Bayesian inference and the SNA visualization, we carry out the sustainable technology analysis, as follows:
- Step 1:
- Collect patent documents related to target technology
- (1-1)
- Search for patents in world patent databases using target technology as a keyword
- (1-2)
- Filter valid patents that represent target technology
- Step 2:
- Preprocessing patent document data
- (2-1)
- Transform patent documents into structured data using text mining
- (2-2)
- Extract IPC codes from the structured patent data
- Step 3:
- Perform SNA visualization
- (3-1)
- Select top-ranked IPC codes for SNA
- (3-2)
- Visualize top-ranked IPC codes by centrality of SNA
- Step 4:
- Analyze IPC codes using Bayesian inference
- (4-1)
- Use IPC codes with the largest centrality for the response variable in the Bayesian regression
- (4-2)
- Find technological relationships between IPC codes using the Bayesian regression results
- Step 5:
- Build a hierarchical structure for the sustainable technology
- (5-1)
- Choose statistically significant IPC codes using the p-value in the Bayesian regression models
- (5-2)
- Construct the technological structure for sustainable technology related to target technology
Through these five steps, we provide a hierarchical structure for sustainable technology in the AI domain. This research result will contribute to the R&D planning of companies or nations in order to improve their sustainability. For example, a company of AI can research and develop the necessary technologies for AI from basic technology to applied technology related to AI by the results of the sustainable technology analysis proposed in this paper. Through this process, the company can develop their own sustainable technologies, and improve the competitiveness in the market.
4. Case Study of Artificial Intelligence
We conduct a case study using the patent data related to AI technology to illustrate how the proposed method can be applied to find sustainable AI technology. In this paper, we used the R data language to analyze the retrieved patent documents [15]. In addition, the text mining functions provided in the ‘tm’ package are used to extract the IPC code from the patent document [16]. We also used the Bayesian analysis functions from the ‘arm’ package to carry out Bayesian data analysis of patent data [17]. To get the SNA visualization, we used the SNA graphic functions from the ‘sna’ package [18]. First, we retrieve the relevant patent documents from the patent databases of the United States Patent and Trademark Office and the WIPS Corporation [19,20]. We search for patent documents on AI using the 10 keyword searching formulae, as shown in Appendix A. Through the valid patent extraction process, a total of 13,858 patents were selected for the period 1995 to 2016. In addition, we extracted a total of 366 IPC codes from the valid patent documents. All IPC codes that are related to AI technology are shown in Appendix B. Of the 366 IPC codes, we perform a sustainable technology analysis using the top 20 codes. Table 2 shows top 20 IPC codes of patents related to AI technology.
The top-ranked IPC code is G06F, with a frequency value of 7529. This means that 7529 patents related to AI technology depend on the technology of G06F. Table 3 provides the top 20 IPC codes and their representative technologies from the World Intellectual Property Organization (WIPO) [21,22].
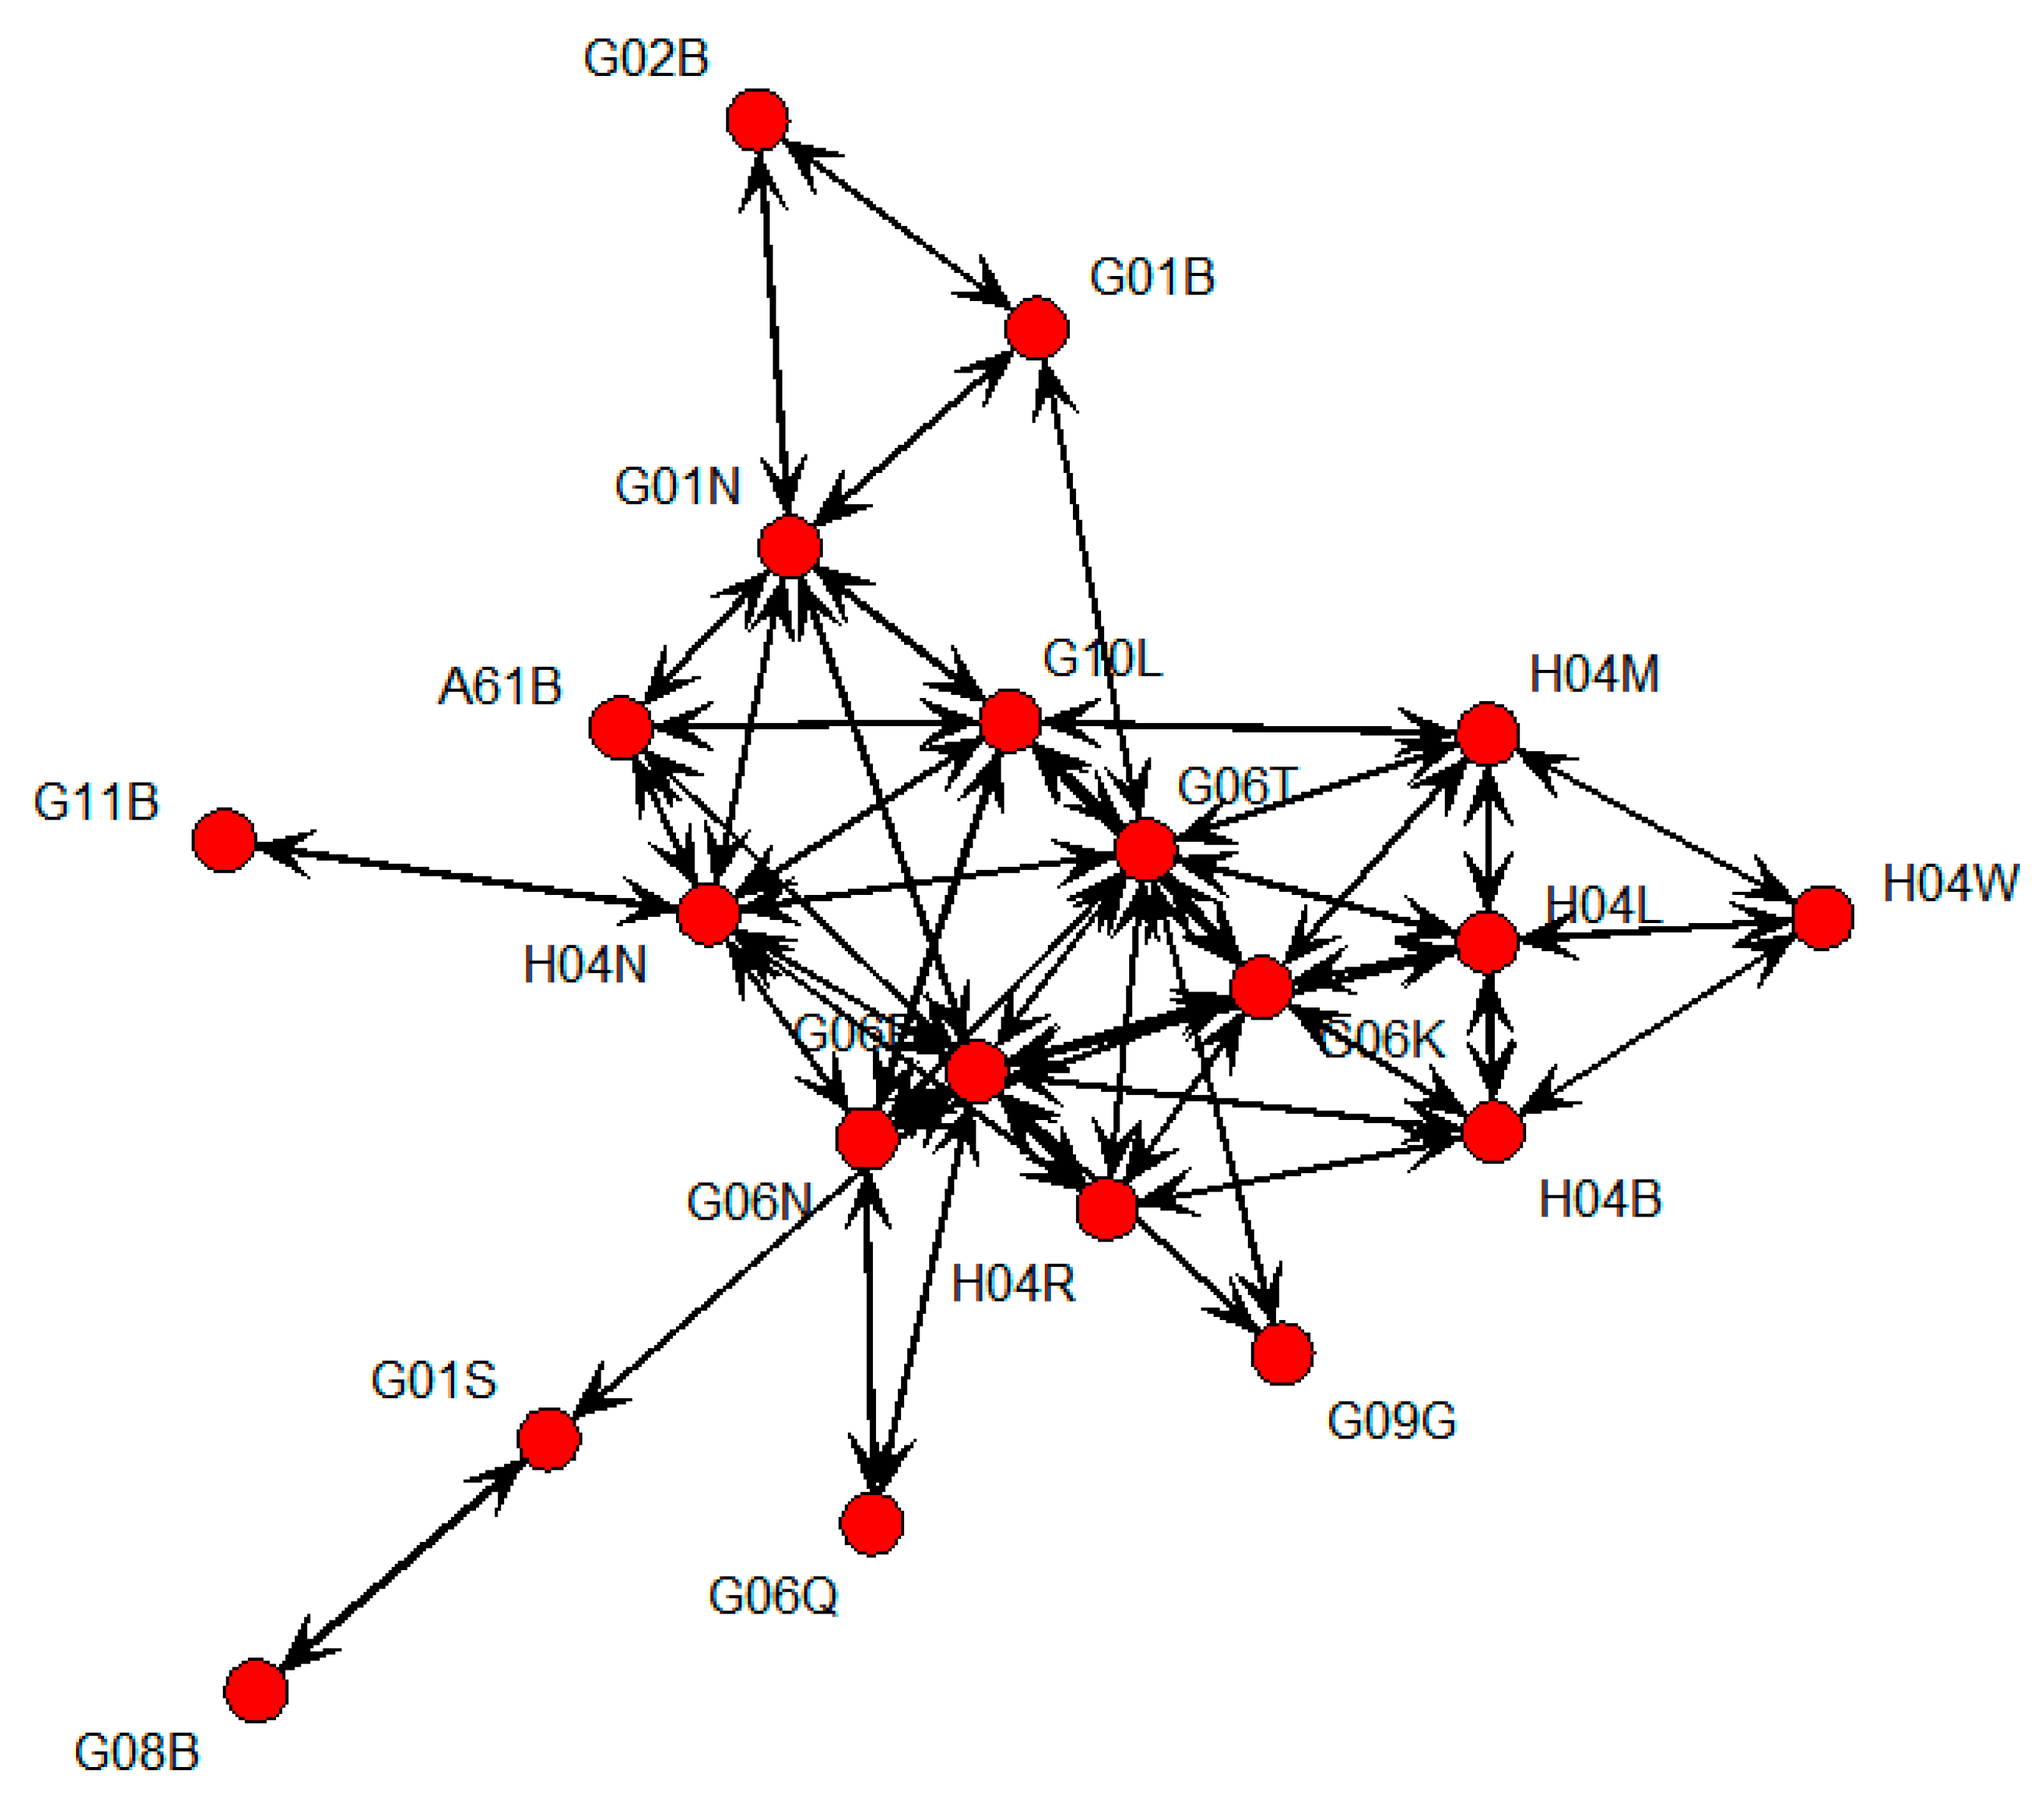
We found that the technologies defined by the top 20 IPC codes are very diverse in the technological descriptions in the WIPO. In the remainder of our case study, we use these IPC codes for our sustainable technology analysis in the AI field. Therefore, we first perform an SNA and build the SNA graph shown in Figure 1. This figure shows the relationship between the top 20 IPC codes using a centrality measure of SNA.
In Figure 1, we find that the IPC codes G06F and G06T are located at the center. This means that the technologies based on G06F and G06T are very popular and important for developing AI technology. That is, we decided that these technologies lead the sustainability in AI technology development. Therefore, the rest of this paper finds other IPC codes that affect these two IPC codes and finds statistical relationship between them. Next, the IPC codes G06K, H04N, and G10L are found to play a central role. On the other hand, the IPC codes G11B and G08B are relatively isolated from the other IPC codes. Therefore, we perform a Bayesian inference using G06F and G06T as response (output) variables, and the remaining IPC codes as explanatory (input) variables. The first model of Bayesian regression is determined as follows:
G06F = f(G06K, H04N, G10L, G06T, A61B, H04M, G01N, H04R, G06N, G01S, H04L, G06Q, H04B, H04W, G09G, G02B, G11B, G08B, G01B) + μ
Using Gaussian prior and likelihood functions, we fitted the Bayesian regression model on the response variable G06F in Table 4.
The statistically significant IPC codes at the 95% confidence level are G06K, H04N, G10L, G06T, A61B, G01N, H04R, G06N, G01S, H04L, G06Q, H04B, H04W, G09G, G02B, G08B, and G01B. In addition, we find that the IPC codes H04M and G11B are not related to the G06F, because their p-values are less than 0.05. The second Bayesian regression model is built on the response IPC code G06T, as follows:
G06T = f(G06F, G06K, H04N, G10L, A61B, H04M, G01N, H04R, G06N, G01S, H04L, G06Q, H04B, H04W, G09G, G02B, G11B, G08B, G01B) + μ.
As in the G06F case, we fit the Bayesian regression model on the response variable G06T using the Gaussian prior and likelihood functions in Table 5.
The p-values of the IPC codes G06F, G06K, H04N, G10L, A61B, H04M, H04R, G06N, H04L, G09G, G02B, G11B, and G01B are less than 0.05. Thus, we know that these IPC codes have a technological impact on the IPC code G06T. From the Bayesian regression results for G06F and G06T, we find that the IPC codes G06K, H04N, G10L, A61B, H04R, G06N, H04L, G09G, G02B, and G01B affect G06F and G06T. Therefore, when considering both G06F and G06T at the same time, we build the Bayesian regression model, as follows:
(G06F + G06T) = f(G06K, H04N, G10L, A61B, H04R, G06N, H04L, G09G, G02B, G01B) + μ.
As in the case of G06F and G06T, the final Bayesian regression analysis is performed using the Gaussian prior and likelihood functions in Table 6.
We find that the IPC codes H04N, G10L, A61B, H04R, G06N, H04L, G09G, and G02B have a simultaneous technological influence on the IPC codes G06F and G06T. In this case study, we carry out a Bayesian regression analysis from the result of SNA visualization. Then, when combining the analysis results, we create a hierarchy of technologies for sustainable AI technologies, as follows.
In Figure 2, the technologies based on the eight IPC codes H04N, G10L, A61B, H04R, G06N, H04L, G09G, and G02B affect the technologies based on the two IPC codes G06F and G06T. The eight IPC codes based on technologies represent the technologies of “image or speech analysis and processing”, “computational models for computer systems”, “communication of digital information”, and “diverse devices”. These become the underlying technologies for AI in terms of sustainability, and influence the technologies of “data processing” based on G06F and G06T. Therefore, we know that the most important technology for sustainable AI technology is data processing. That is, we find that data is the core factor for sustainable AI technology.
5. Discussion
In general, finding a technology area with sustainable is a difficult task. But, we should know the sustainable areas in target technology field. The sustainability in technology contains many issues to improve and continue the technology in the society. It is because society needs new technology and technology changes society. In this paper, we studied on new method to find a sustainable technology from the results of Bayesian modeling and SNA visualization using patent data. For the sustainable technology management, the final decision and technological behavior from the hierarchical structure of sustainable technology, as in Figure 2, is the role of domain experts, AI experts in our case study. So, the decision and behavior may not be stable, because they are dependent on the subjective knowledge of domain experts. In the future, it will be necessary to study the objective analysis and process of the entire steps from patent analysis to final decision for the stable decision and behavior in the sustainable technology management.
6. Conclusions
We proposed a methodology for finding sustainable AI technology using a hierarchical technology structure. We combined SNA visualization and Bayesian modeling to carry out the sustainable technology analysis. In addition, we used patent documents that were related to AI technology to build the technological structure for AI sustainability. The IPC codes that were extracted from the searched patent documents were used for our methodology. Through the SNA visualization, we selected the IPC codes with large centrality. These were used as response variables in the Bayesian regression model in our case study. Using the result of the Bayesian regression modeling, we built the sustainable technology structure for AI technology. This study examined a sustainable technology analysis. We found the hierarchical structure of AI technology for AI sustainability. In addition, we performed a case study to illustrate how the proposed method can be applied to a real-world problem. Our study contributes to the R&D planning of companies or nations needing to improve their technological sustainability.
Our research focuses on finding sustainable technology areas in specific technology areas. In this paper, the technological field is AI technology. We extracted the sustainable technologies related to AI in Figure 2. But, we only used the patent documents of AI as an analysis target for sustainable technology analysis. In future studies, we plan to conduct sustainable technology analysis using more diverse data sources as well as patent data. Also, we will conduct further research on more advanced modeling, such as deep learning, for the methodology of the sustainable technology analysis.
Acknowledgments
This research was supported by the Basic Science Research Program through the National Research Foundation of Korea (NRF), funded by the Ministry of Science, ICT & Future Planning (NRF-2015R1D1A1A01059742). This research was supported by Academic Research Fund Support Program through the Korea Sanhak Foundation. This research was supported by Basic Science Research Program through the National Research Foundation of Korea (NRF) funded by the Ministry of Education (NRF-2017R1D1A3B03031152).
Author Contributions
Juhwan Kim designed this study and collected the data for the experiment. Sangsung Park and Dongsik Jang preprocessed the data and selected valid patents. Sunghae Jun analyzed the data to show the validity of the study and wrote the paper and performed all the research steps. In addition, all authors have cooperated with each other to revise the paper.
Conflicts of Interest
The authors declare no conflict of interest.
Appendix A. Keyword Formulas for Searching Patents Related to AI
Searching formula 1 = ((((machine* OR unsupervised* OR supervised* OR Reinforcement) OR learning) and (KNN* OR k-nearest) OR (data OR mining) OR (big OR data) OR (neural OR network) OR ((Linear OR Logistic) AND Regression) OR (Support AND Vector) OR (Naive AND Bayesian) OR (Hidden AND Markov) OR (Conditional AND Random*) OR (Decision AND Tree) OR Cluster* OR ((Dimension OR feature) AND Reduction) OR (nearest AND neighbor))))
Searching formula 2 = ((((big OR data) OR mining) OR ((DB OR big) AND data)) OR knowledge OR (find OR detect OR discovery)))) OR ((((ontology OR OWL OR (DAML AND OIL) OR SWRL OR (Semantic AND Web AND Rule AND Language) OR SEMANTIC) OR (represent* OR expres* OR design OR induct* OR deduct* OR reason* OR inferenc*))))
Searching formula 3 = ((((Boltzma* A/1 Machin*) OR ((deep* OR Convolution* OR Recurre* OR unsupervised* OR supervised* OR Reinforcement*) OR learning)) AND (KNN* OR k-nearest* OR (data OR mining) OR (big AND data*) OR neural OR network OR ((Linear OR Logistic) AND Regression) OR (Support AND Vector*) OR (Naive AND Bayesian*) OR (Hidden AND Markov*) OR (Conditional AND Random*) OR (Decision AND Tree) OR Cluster* OR ((Dimension OR feature) AND Reduction) OR (nearest AND neighbor*))))
Searching formula 4 = pattern* OR (aware* OR realiz* OR cognit* OR recogn* OR percept* OR understand* OR comprehens* OR estimat* OR assumpt* OR presump* OR anal*) OR (cognit* OR percept*) AND (computing OR process* OR application OR program) OR (humanlife OR “human life” OR living* OR livelihood OR lifelog OR “life log”) OR (aware* OR realiz* OR cognit* OR recogn* OR percept* OR understand* OR comprehens* OR estimat* OR assumpt* OR presump* OR anal*) (emotion* OR sentiment* OR feel*) OR (aware* OR realiz* OR cognit* OR recogn* OR percept* OR understand* OR comprehens* or estimat* or assumpt* or presump* or anal*) OR space* OR (aware* OR realiz* OR cognit* OR recogn* or percept* or understand* or comprehens* or estimat* or assumpt* or presump* or anal*)
Searching formula 5 = (collabor* or collect*) OR intel* OR ((((image* OR video* OR movie OR picture) OR (object* OR target* OR non-rigid* OR nonrigid*) OR (extract* OR awareness* OR realizat* OR cognit*OR capture*)))) OR (damag* OR noise* or degradat* or disto*) OR (video* OR image* OR picture* OR film* OR media*) OR (inpaint* OR restor* OR reconstruct* OR reintegration OR repair* or cancel* or remov*) OR (image* OR video* OR movie* OR picture* OR CCTV OR camera*) AND (situat* OR context*) OR (cogni* or aware* or recogni* or perce*)
Searching formula 6 = (((image* OR video* OR movie OR picture) AND ((object* OR target* OR color* OR background* OR back-ground* OR surrounding* OR environment* OR character*) OR (divid* OR split OR seperat* OR segregate* OR subtract*)))) OR (((image* OR video* OR movie OR picture) and mining* and (detect* OR recognit* OR recogniz* OR tracking* OR awareness OR cognition OR classify OR group OR sort* OR categorize))) OR ((((user* OR speaker* OR narrator) OR (individualizat* OR distinguish* OR discriminat* OR cognit* OR recognit* OR recogniz* OR awareness)) and ((voice* OR speech* OR acoustic* OR sound* OR audio* OR phonetic*) OR (ingredient OR component* OR constituent OR organizat* OR formation* OR construct* OR architecture))))
Searching formula 7 = (((languag* OR linguist* OR sentenc*) AND ((sentenc* OR lexic*) OR (analy* OR semantic*)))) OR (((languag* OR linguist* OR sentenc*) AND ((dialog* OR talk OR conversation) OR (model* OR manage* OR recoding* OR history* OR DB OR (Data and base)))) OR (((voice* OR speech* OR acoustic* OR sound* OR audio* OR phonetic*) and (((natural* AND language*)) OR (inference* OR detect* OR recogni* OR cogniti* OR interface OR capture*)))) OR (((voice* OR speech* OR dialogu* OR conversat* OR speaking* OR language*) OR (combine OR unite OR join OR synthe*)) AND corpus*))) OR (((languag* OR linguist* OR sentenc*) and (morpheme* OR morpholog*) AND (process* OR analy* OR parsing* OR analy* OR assay)))
Searching formula 8 = (((dialog* OR conversat* OR voice* OR speech* OR conversat* OR speaking*) OR (UI OR interface*))) OR (((voice* OR speech* OR dialogu* OR conversat* OR speaking* OR language*) AND ((user* OR speaker* OR narrator) AND (independen* OR recognit* OR extract* OR analysis* OR awareness* OR realizat* OR cognit*)) AND (model* OR sampl* OR template OR comparison OR contrast))) OR neuromorphic OR “neuro morphic”
Searching formula 9 = (neurofeedback OR “neuro feedback”) OR “brain feedback” OR ((brainwave OR “brain wave” OR EEG OR Electroencephalogram) AND (anal* OR train*)) OR “artificial neural network”
Searching formula 10 = “brain computer interface” OR ((brainwave or “brain wave” or thought* or EEG or Electroencephalogram) OR (recog* or congit* or aware* or realiz* or percept* or understand* or comprehens* or estimat* or assumpt* or anal*))
Appendix B. All IPC Codes Extracted from the Patent Documents Related to AI
A01B, A01C, A01D, A01F, A01G, A01H, A01K, A01M, A01N, A22B, A22C, A23D, A23F, A23G, A41D, A42B, A45C, A45D, A45F, A46B, A47B, A47C, A47D, A47F, A47G, A47J, A47K, A47L, A61B, A61C, A61F, A61G, A61H, A61K, A61L, A61M, A61N, A61P, A61Q, A62B, A62C, A62D, A63B, A63D, A63F, A63G, A63H, A63J, B01D, B01F, B01J, B01L, B02C, B03C, B05B, B05C, B05D, B06B, B07C, B08B, B09B, B21C, B21D, B22D, B22F, B23C, B23K, B23P, B23Q, B24B, B24D, B25B, B25F, B25J, B26D, B27B, B27M, B28B, B29B, B29C, B29K, B29L, B32B, B41B, B41C, B41F, B41J, B41L, B41M, B41N, B42D, B42F, B43K, B43L, B44B, B44C, B44D, B44F, B60B, B60C, B60G, B60H, B60J, B60K, B60L, B60M, B60N, B60P, B60Q, B60R, B60S, B60T, B60W, B61C, B61K, B61L, B62D, B62J, B62K, B62M, B63B, B63C, B63H, B64C, B64D, B64F, B64G, B65B, B65C, B65D, B65G, B65H, B66B, B66C, B66F, B67D, B81B, B81C, B82B, B82Y, C01B, C03B, C03C, C04B, C06B, C07B, C07C, C07D, C07F, C07H, C07K, C08F, C08G, C08J, C08K, C08L, C09D, C09J, C09K, C10L, C11B, C12M, C12N, C12P, C12Q, C12R, C13K, C23C, C40B, D01G, D03D, D03J, D04H, D05B, D05C, D06C, D06F, D06N, D06P, D06Q, D21C, D21F, D21G, D21H, E01C, E01F, E02D, E02F, E03C, E03D, E04B, E04F, E04H, E05B, E05C, E05F, E06B, E21B, E21C, E21D, F01C, F01D, F01K, F01N, F01P, F02B, F02C, F02D, F02K, F02M, F02P, F03B, F03C, F03D, F03G, F04B, F04C, F04D, F04F, F15B, F15C, F15D, F16B, F16D, F16F, F16H, F16J, F16K, F16L, F16M, F16P, F17D, F21K, F21S, F21V, F21Y, F23N, F23Q, F24C, F24F, F25B, F25C, F26B, F28C, F41A, F41G, F41H, F41J, F42B, F42D, G01B, G01C, G01D, G01F, G01G, G01H, G01J, G01K, G01L, G01M, G01N, G01P, G01Q, G01R, G01S, G01T, G01V, G01W, G02B, G02C, G02F, G03B, G03C, G03D, G03F, G03G, G03H, G04B, G04C, G04F, G04G, G05B, G05D, G05F, G05G, G06C, G06D, G06E, G06F, G06G, G06J, G06K, G06M, G06N, G06Q, G06T, G07B, G07C, G07D, G07F, G07G, G08B, G08C, G08G, G09B, G09C, G09F, G09G, G10C, G10D, G10G, G10H, G10K, G10L, G11B, G11C, G12B, G21C, G21F, G21G, G21H, G21K, H01B, H01F, H01G, H01H, H01J, H01L, H01M, H01P, H01Q, H01R, H01S, H01T, H02B, H02G, H02H, H02J, H02K, H02M, H02N, H02P, H03B, H03D, H03F, H03G, H03H, H03J, H03K, H03L, H03M, H04B, H04H, H04J, H04K, H04L, H04M, H04N, H04Q, H04R, H04S, H04W, H05B, H05G, H05H, H05K
References
- Roper, A.T.; Cunningham, S.W.; Porter, A.L.; Mason, T.W.; Rossini, F.A.; Banks, J. Forecasting and Management of Technology, 2nd ed.; John Wiley & Sons: Hoboken, NJ, USA, 2011. [Google Scholar]
- Choi, J.; Jun, S.; Park, S. A patent analysis for sustainable technology management. Sustainability 2016, 8, 688. [Google Scholar] [CrossRef]
- Kim, S.; Jang, D.; Jun, S.; Park, S. A novel forecasting methodology for sustainable management of defense technology. Sustainability 2015, 7, 16720–16736. [Google Scholar] [CrossRef]
- Park, S.; Lee, S.; Jun, S. A network analysis model for selecting sustainable technology. Sustainability 2015, 7, 13126–13141. [Google Scholar] [CrossRef]
- Jun, S.; Park, S. Examining technological innovation of Apple using patent analysis. Ind. Manag. Data Syst. 2013, 113, 890–907. [Google Scholar] [CrossRef]
- Kim, J.; Jun, S. Graphical causal inference and copula regression model for Apple keywords by text mining. Adv. Eng. Inform. 2015, 29, 918–929. [Google Scholar] [CrossRef]
- Jun, S.; Park, S. Examining technological competition between BMW and Hyundai in the Korean car market. Technol. Anal. Strateg. Manag. 2016, 28, 156–175. [Google Scholar] [CrossRef]
- Koduvely, H.M. Learning Bayesian Models with R; PACKT: Birmingham, UK, 2015. [Google Scholar]
- Ross, S.M. Introduction to Probability and Statistics for Engineers and Scientists, 4th ed.; Elsevier: Seoul, Korea, 2012. [Google Scholar]
- Gelman, A.; Carlin, J.B.; Stern, H.S.; Dunson, D.B.; Vehtari, A.; Rubin, D.B. Bayesian Data Analysis, 3rd ed.; Chapman & Hall/CRC Press: Boca Raton, FL, USA, 2013. [Google Scholar]
- Vapnik, V. Statistical Learning Theory; Wiley: New York, NY, USA, 1998. [Google Scholar]
- Press, S.J. Subjective and Objective Bayesian Statistics, 2nd ed.; John Wiley & Sons: Hoboken, NJ, USA, 2003. [Google Scholar]
- Scott, J.G. Social Network Analysis, 3rd ed.; SAGE: London, UK, 2012. [Google Scholar]
- Butts, C.T. Social Network Analysis with SNA. J. Stat. Softw. 2008, 24, 1–51. [Google Scholar] [CrossRef]
- R Development Core Team. R: A Language and Environment for Statistical Computing; R Foundation for Statistical Computing: Vienna, Austria, 2017. [Google Scholar]
- Feinerer, I.; Hornik, K. Package ‘tm’ Ver. 0.6, Text Mining Package; CRAN of R Project: Vienna, Austria, 2017. [Google Scholar]
- Gelman, A.; Yajima, M.; Hill, J.; Pittau, M.G.; Kerman, J.; Zheng, T.; Dorie, V. Package ‘arm’ Ver. 1.9-3, Data Analysis Using Regression and Multilevel/Hierarchical Models; CRAN of R Project: Vienna, Austria, 2017. [Google Scholar]
- Butt, C.T. Package ‘sna’ Ver. 2.4, Tools for Social Network Analysis; CRAN of R Project: Vienna, Austria, 2017. [Google Scholar]
- The United States Patent and Trademark Office. Available online: http://www.uspto.gov (accessed on 1 September 2017).
- WIPSON. WIPS Corporation. Available online: http://www.wipson.com; http://global.wipscorp.com (accessed on 1 September 2017).
- World Intellectual Property Organization (WIPO). Available online: www.wipo.org (accessed on 1 September 2017).
- International Patent Classification (IPC), World Intellectual Property Organization. Available online: http://www.wipo.int/classifications/ipc/en (accessed on 30 September 2017).
Figure 1.
Social Network Analysis (SNA) visualization of top 20 IPC codes related to AI technology.

Figure 2.
Hierarchical structure for sustainable AI technology.


Table 1.
Correlation matrix between International Patent Classification (IPC) codes for adjacency matrix.
Table 1.
Correlation matrix between International Patent Classification (IPC) codes for adjacency matrix.
| Ci1 | Ci2 | Cik | Co | ||
|---|---|---|---|---|---|
| Ci1 | 1 | ||||
| Ci2 | Corr(Ci2, Ci1) | 1 | |||
| Cik | Corr(Cik, Ci1) | Corr(Cik, Ci2) | 1 | ||
| Co | Corr(Co, Ci1) | Corr(Co, Ci2) | Corr(Co, Cik) | 1 |
(note) : Omission of intermediate items.
Table 2.
Top 20 IPC codes of patents related to Artificial Intelligence (AI) technology.
| Rank | IPC Code | Frequency | Rank | IPC Code | Frequency |
|---|---|---|---|---|---|
| 1 | G06F | 7529 | 11 | G01S | 999 |
| 2 | G06K | 6707 | 12 | H04L | 850 |
| 3 | H04N | 6444 | 13 | G06Q | 780 |
| 4 | G10L | 4763 | 14 | H04B | 733 |
| 5 | G06T | 3297 | 15 | H04W | 520 |
| 6 | A61B | 1687 | 16 | G09G | 482 |
| 7 | H04M | 1576 | 17 | G02B | 453 |
| 8 | G01N | 1410 | 18 | G11B | 445 |
| 9 | H04R | 1207 | 19 | G08B | 438 |
| 10 | G06N | 1129 | 20 | G01B | 430 |
Table 3.
Top 20 IPC codes and their representing technologies.
| IPC Code | Representative Technology |
|---|---|
| G06F | Electric digital data processing |
| G06K | Recognition of data, presentation of data; record carriers; handling record carriers |
| H04N | Pictorial communication; television |
| G10L | Speech analysis of synthesis; speech or voice processing; speech or audio coding or decoding |
| G06T | Image data processing or generation |
| A61B | Diagnosis; surgery; identification |
| H04M | Telephonic communication |
| G01N | Investigating or analyzing materials by determining their chemical or physical properties |
| H04R | Loudspeakers; microphones; gramophone pick-ups or like acoustic electromechanical transducers; deaf-aid sets; public address systems |
| G06N | Computer systems based on specific computational models |
| G01S | Radio direction-finding; radio navigation; determining distance or velocity by use of radio waves; locating or presence-detecting by use of the reflection or re-radiation of radio waves; analogous arrangements using other waves |
| H04L | Transmission of digital information, e.g., telegraphic communication |
| G06Q | Data processing systems or methods, specially adapted for administrative, commercial, financial, managerial, supervisory or forecasting purposes; systems or methods specially adapted for administrative, commercial, financial, managerial, supervisory or forecasting purposes, not otherwise provided for |
| H04B | Transmission |
| H04W | Wireless communication networks |
| G09G | Arrangements or circuits for control of indicating devices using static means to present variable information |
| G02B | Optical elements, systems, or apparatus |
| G11B | Information storage based on relative movement between record carrier and transducer |
| G08B | Signaling or calling systems; order telegraphs; alarm systems |
| G01B | Measuring length, thickness or similar linear dimensions; measuring angles; measuring areas; measuring irregularities of surfaces or contours |
Table 4.
Bayesian regression result for G06F.
| IPC Code | Estimated Parameter Value | p-Value |
|---|---|---|
| G06K | −0.180512 | 0.0001 |
| H04N | −0.073424 | 0.0001 |
| G10L | −0.089246 | 0.0001 |
| G06T | −0.107902 | 0.0001 |
| A61B | −0.117997 | 0.0001 |
| H04M | −0.025814 | 0.0797 |
| G01N | −0.15267 | 0.0001 |
| H04R | −0.217081 | 0.0001 |
| G06N | 0.220562 | 0.0001 |
| G01S | −0.111536 | 0.0001 |
| H04L | 0.256446 | 0.0001 |
| G06Q | 0.239712 | 0.0001 |
| H04B | −0.26624 | 0.0001 |
| H04W | −0.079926 | 0.0001 |
| G09G | 0.333979 | 0.0001 |
| G02B | −0.140892 | 0.0001 |
| G11B | 0.024652 | 0.3465 |
| G08B | −0.082199 | 0.0216 |
| G01B | −0.152344 | 0.0001 |
Table 5.
Bayesian regression result for G06T.
| IPC Code | Estimated Parameter Value | p-Value |
|---|---|---|
| G06F | −0.042116 | 0.0001 |
| G06K | 0.172213 | 0.0001 |
| H04N | 0.041754 | 0.0001 |
| G10L | −0.042467 | 0.0001 |
| A61B | 0.034299 | 0.0001 |
| H04M | −0.031965 | 0.0001 |
| G01N | −0.008823 | 0.3619 |
| H04R | −0.059149 | 0.0001 |
| G06N | −0.046414 | 0.0001 |
| G01S | −0.008168 | 0.4195 |
| H04L | −0.038968 | 0.0073 |
| G06Q | −0.010201 | 0.5087 |
| H04B | −0.008745 | 0.6471 |
| H04W | −0.022595 | 0.1223 |
| G09G | 0.159786 | 0.0001 |
| G02B | −0.047717 | 0.0110 |
| G11B | −0.034143 | 0.0369 |
| G08B | 0.034321 | 0.1248 |
| G01B | 0.212876 | 0.0001 |
Table 6.
Bayesian regression result of G06F and G06T.
| IPC Code | Estimated Parameter Value | p-Value |
|---|---|---|
| G06K | −0.005144 | 0.6350 |
| H04N | −0.029849 | 0.0001 |
| G10L | −0.116714 | 0.0001 |
| A61B | −0.083203 | 0.0001 |
| H04R | −0.277659 | 0.0001 |
| G06N | 0.20772 | 0.0001 |
| H04L | 0.186317 | 0.0001 |
| G09G | 0.482099 | 0.0001 |
| G02B | −0.215889 | 0.0001 |
| G01B | 0.026501 | 0.5040 |
© 2018 by the authors. Licensee MDPI, Basel, Switzerland. This article is an open access article distributed under the terms and conditions of the Creative Commons Attribution (CC BY) license (http://creativecommons.org/licenses/by/4.0/).
Share and Cite
MDPI and ACS Style
Kim, J.; Jun, S.; Jang, D.; Park, S. Sustainable Technology Analysis of Artificial Intelligence Using Bayesian and Social Network Models. Sustainability 2018, 10, 115. https://doi.org/10.3390/su10010115
AMA Style
Kim J, Jun S, Jang D, Park S. Sustainable Technology Analysis of Artificial Intelligence Using Bayesian and Social Network Models. Sustainability. 2018; 10(1):115. https://doi.org/10.3390/su10010115
Chicago/Turabian StyleKim, Juhwan, Sunghae Jun, Dongsik Jang, and Sangsung Park. 2018. "Sustainable Technology Analysis of Artificial Intelligence Using Bayesian and Social Network Models" Sustainability 10, no. 1: 115. https://doi.org/10.3390/su10010115
Note that from the first issue of 2016, this journal uses article numbers instead of page numbers. See further details here.