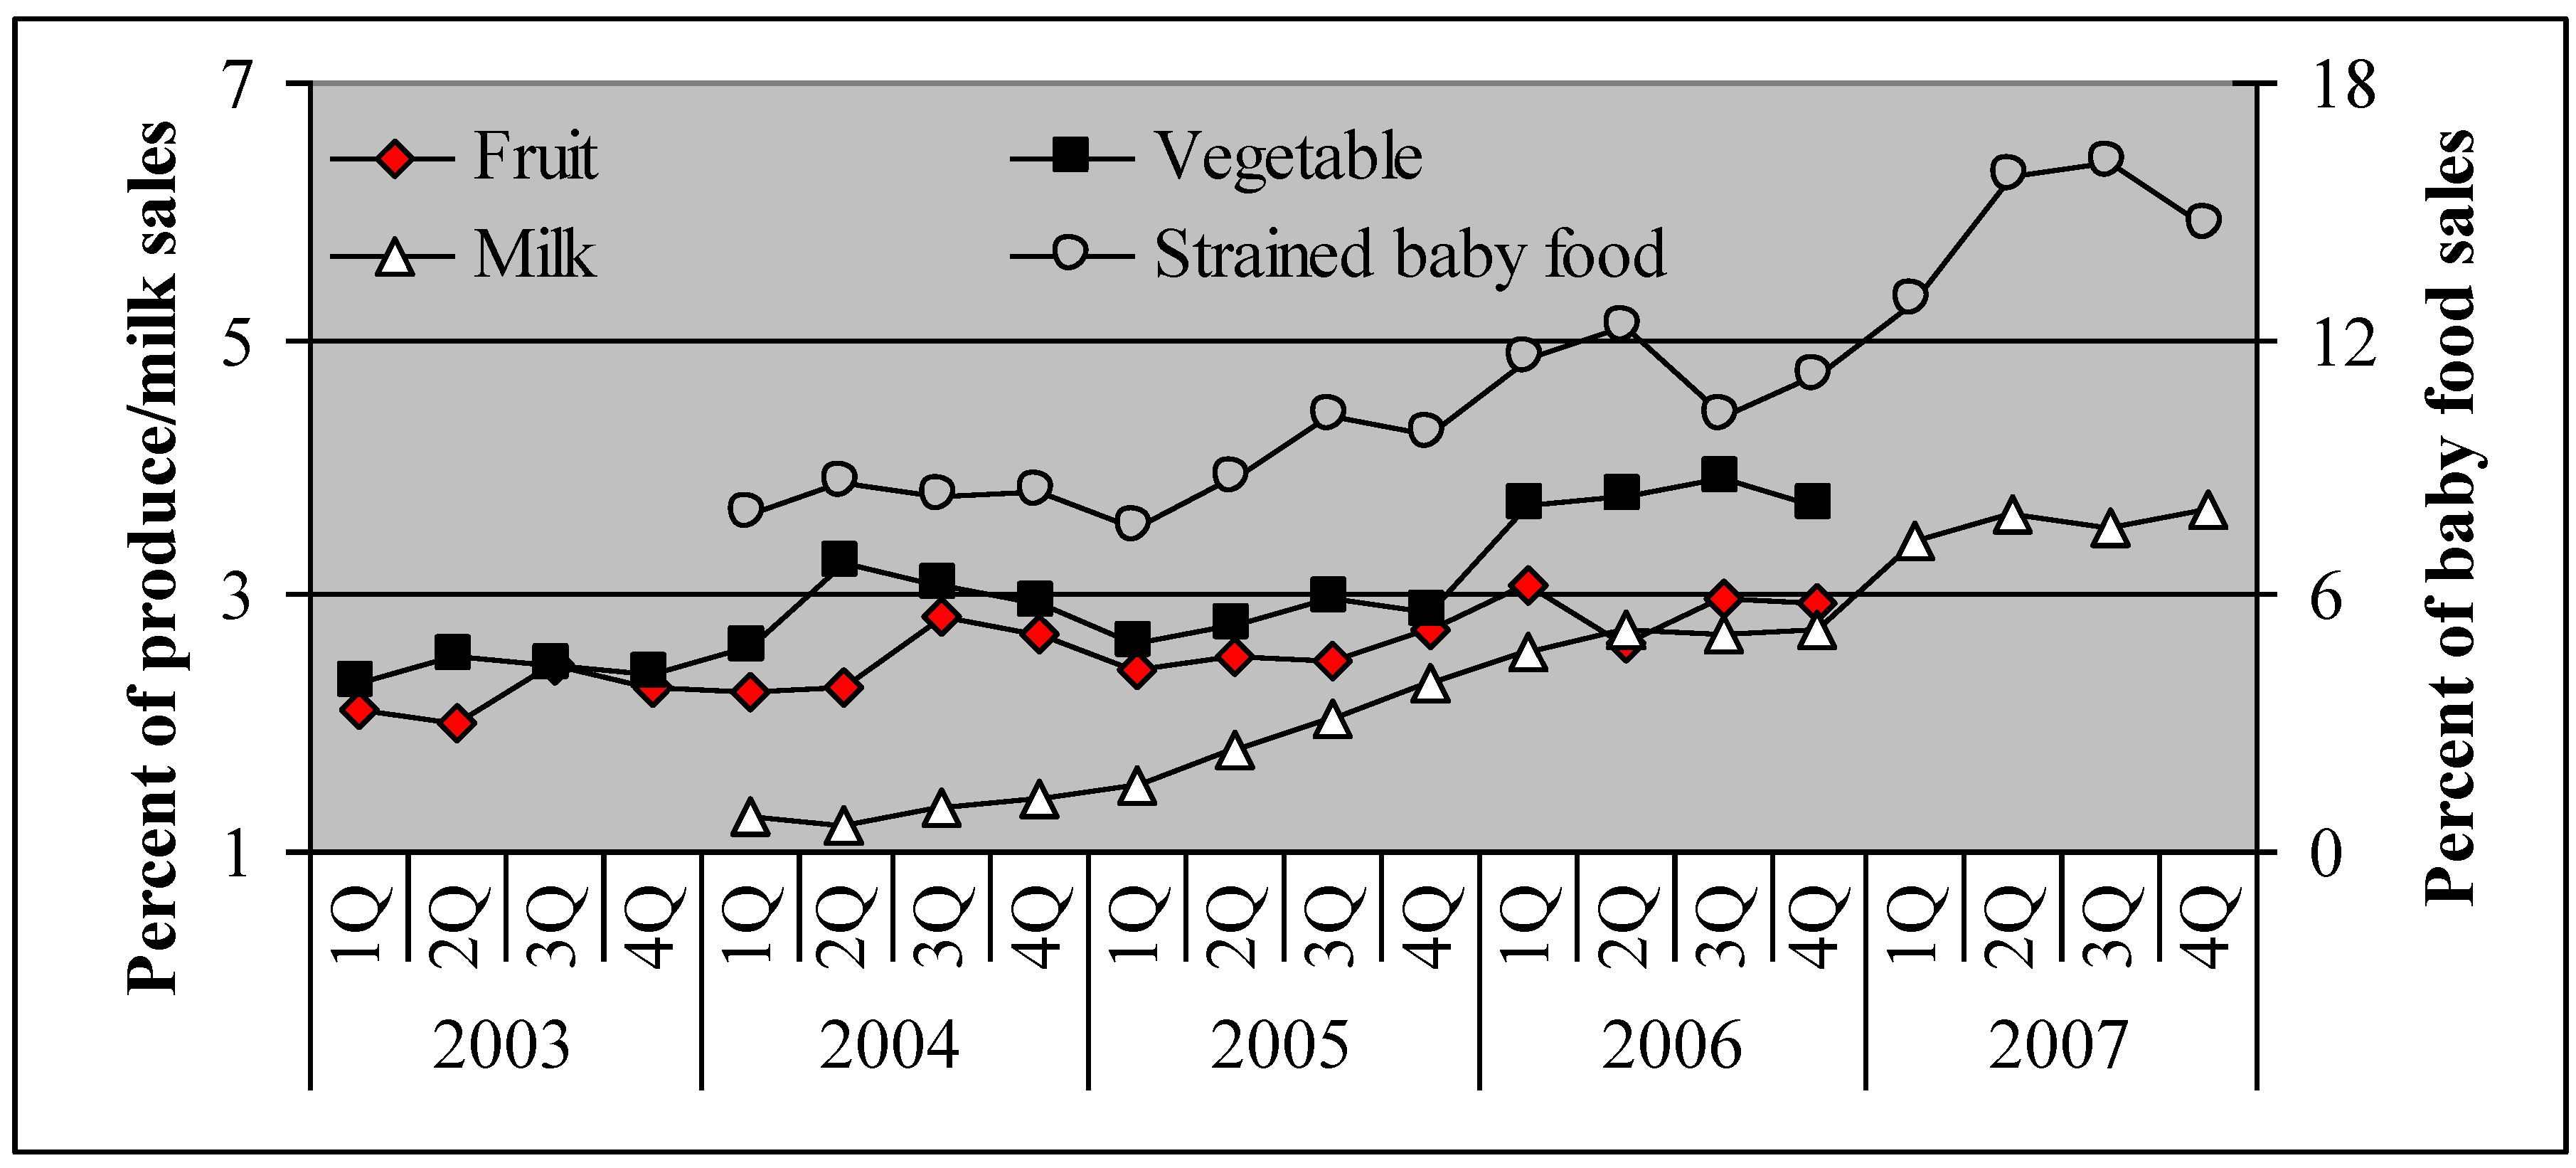
Sales of organic food in 2008 have grown to approximately 3.5 percent of food products sold in the U.S. However, it is interesting to note that there are disparities in growth patterns between each type of food. To illustrate the increasing amount of dollars being spent on organic within each sector, quarterly organic sales dollars as a percent of total sales within each sector are presented in
Figure 1. As shown in
Figure 1, the organic sector accounted for 2.18 and 2.41 percent of fresh fruit and vegetable sales in 2003, respectively, and the shares grew to 2.79 and 3.67 percent in 2006. Fruits and vegetables have followed a similar path due to their closely related production and marketing techniques. On the other hand, milk has shown a much more noticeable increase in sales over the four year time period. Sales of organic milk have grown steadily from 1.31 percent of annual milk sales in 2004 and reaching 3.57 percent in 2007. Although organic produce and milk have traditionally made up the majority of organic retail sales, organic baby food has shown a strong stake within its own sector. Notably, the strained baby food sector (excludes formulas, teething biscuits, juices, and cereals) has shown strong organic sales figures amounting to 8.29 percent of the sector in 2004 and a staggering 14.78 percent in 2007.
Figure 1.
Quarterly organic market shares computed as a percent of sales.
Source: Compiled from Nielsen’s Homescan Panel (Fresh Foods, 2003-2006 and UPC, 2004–2007).
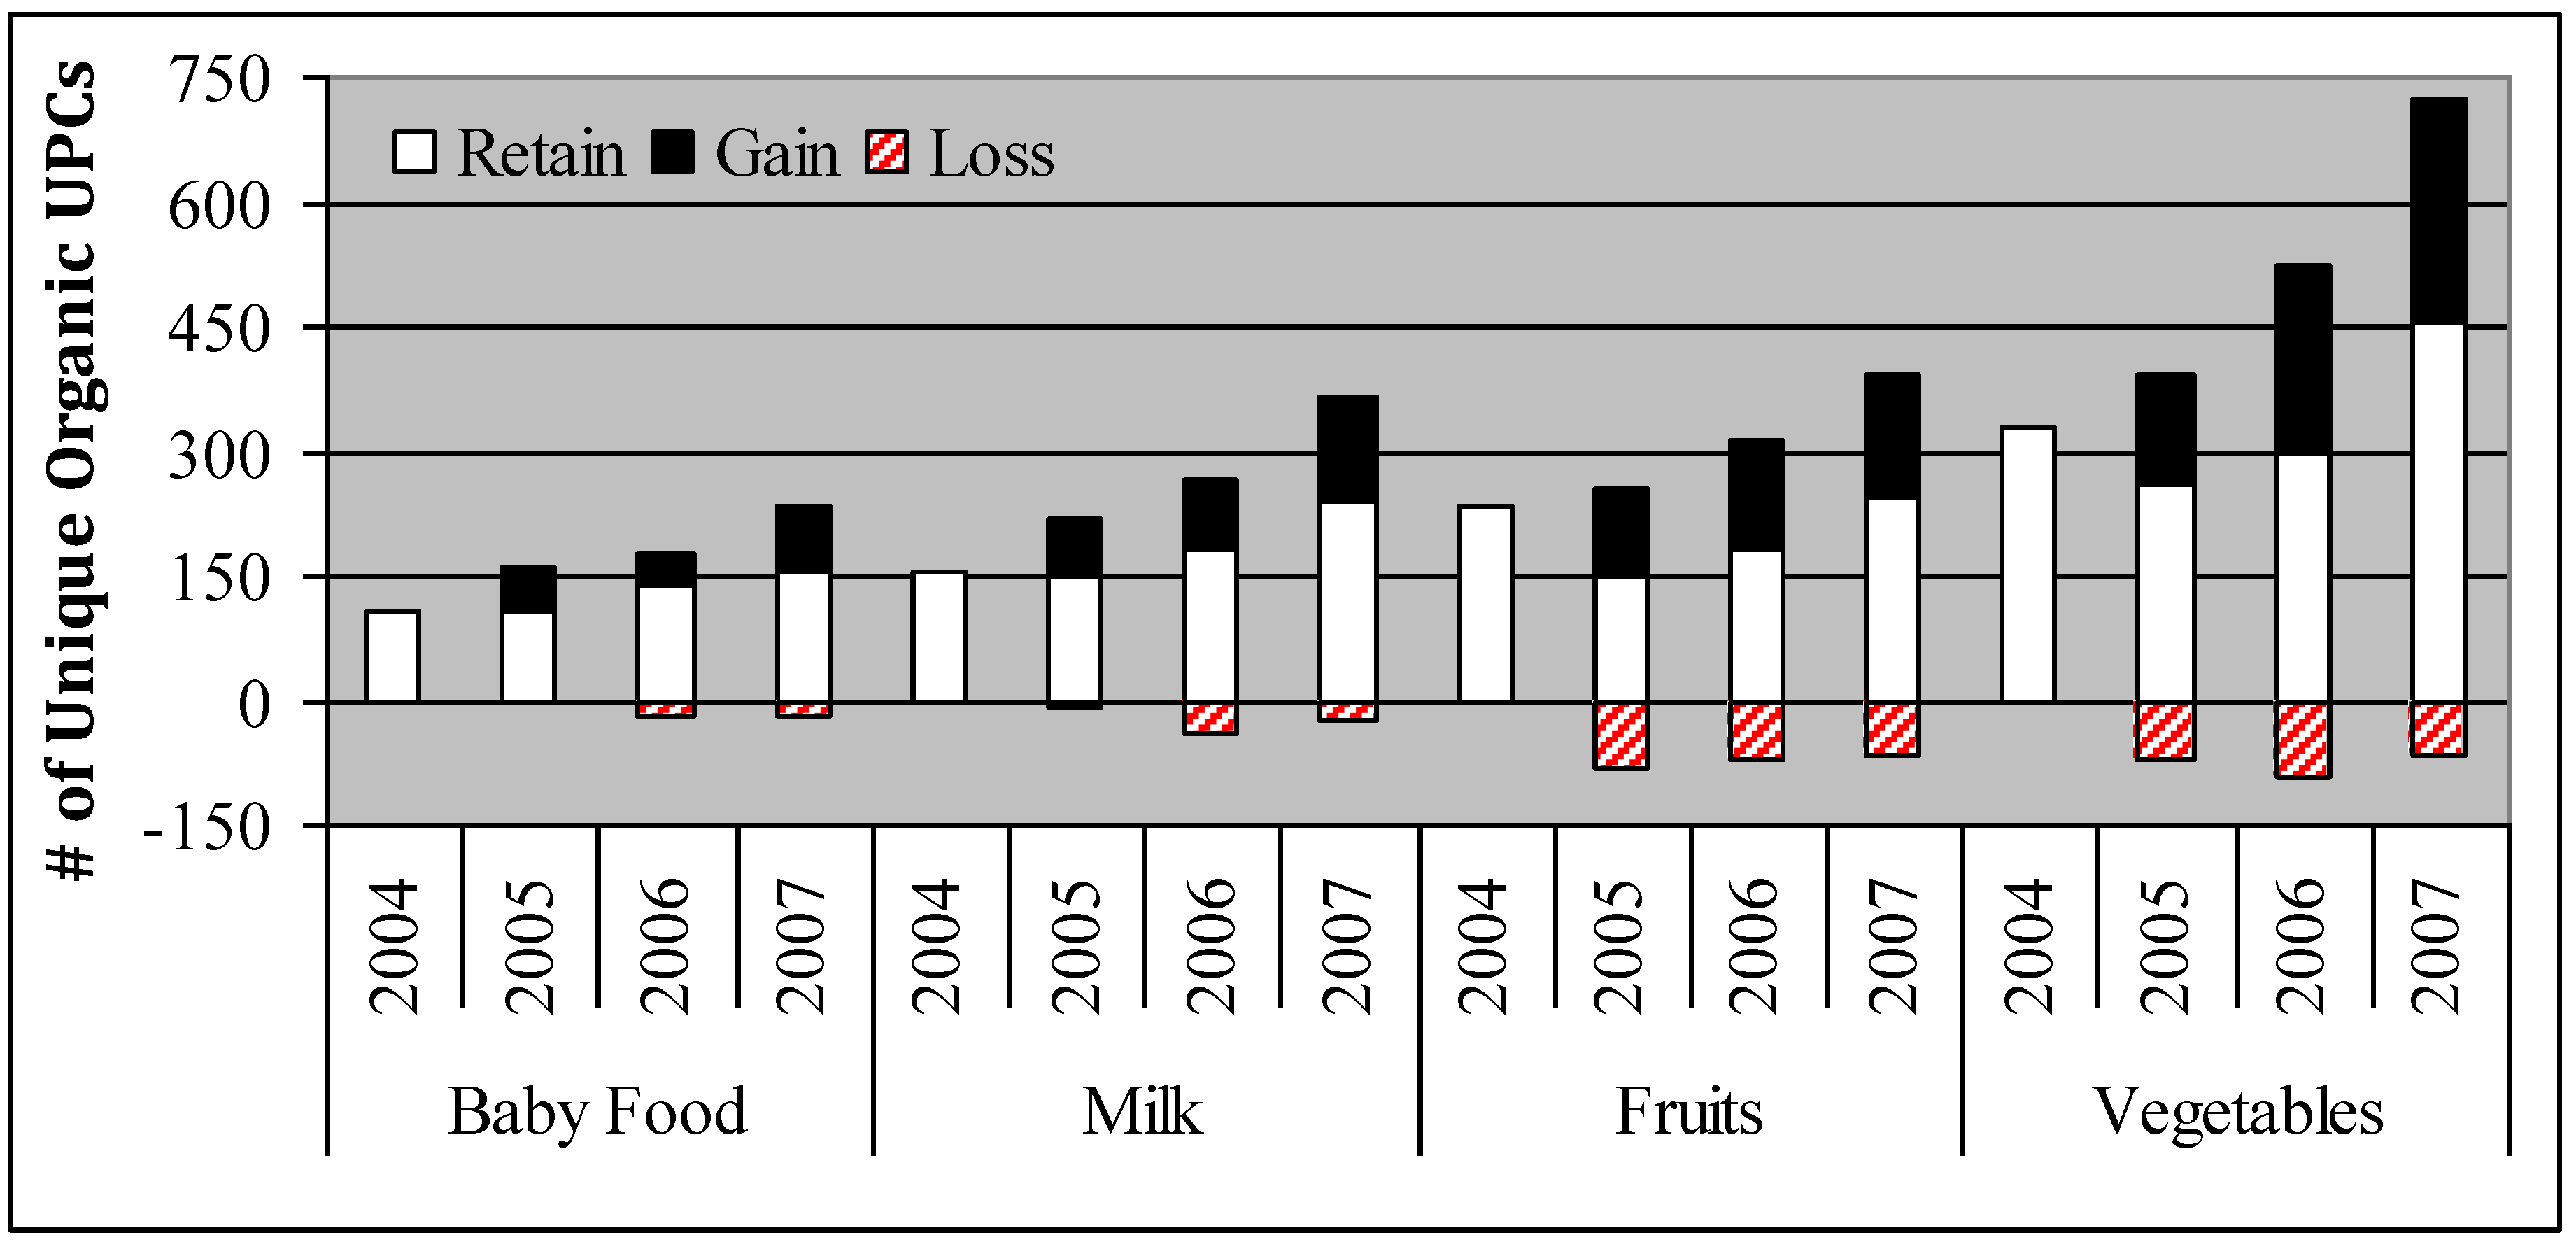
In addition to sales dollars coming from consumers’ pockets, it is of interest to examine how suppliers have reacted to the increased demand. One way of tracking suppliers’ interest in the organic market is through their packaged product offering in each of the four sectors. Each packaged organic product can be uniquely distinguished by its Universal Product Code (UPC) in the UPC panel for the years 2004–2007. Information related to changes in the packaged organic products purchased in the marketplace for the four food sectors is present in
Figure 2. A product is considered retained in the market (white bars) when it has an observed purchase record in the current year and in the previous year. Note that 2004 is used as the base year which shows only the total number of unique UPCs purchased. A gain in product offering in the marketplace (black bars) is distinguished by a purchase in the current year in which no corresponding purchase record was observed in the previous year. Thus white plus black bars represent the total number of unique UPCs purchased in each year. We identify a loss in product offering (red striped bars) by a purchase record in the previous year, but no subsequent observation in the present year.
As shown in
Figure 2, the number of organic products retained in the market, as well as the total number of new organic products (black bars) introduced, has been increasing except for baby foods’ gains in 2006. It is no surprise that fruits and vegetables have registered the largest shares of organic UPCs each year given that it represents for 37 percent of the organic foods market. The growth pattern depicted in
Figure 2 signifies the healthy development of food products within the organic market’s major sectors as suppliers react to an increasing demand for organic foods. In the following subsections, we investigate each food sector in more detail.
Figure 2.
Number of UPC-coded organic foods introduced and retained in the market.
Source: Compiled from Nielsen’s Homescan Panel (UPC), 2004–2007 (random-weight organic fresh fruits and vegetables excluded).
3.1. Organic Fresh Fruit Sector
The popular press and trade literature clearly indicate fresh produce as the dominant sector within the organic market over the past decade [
4,
11]. However, as to which fruit or vegetable holds the greatest weight within their respective sectors is not clearly defined. The distribution of organic sales by individual fresh fruits in
Table 1 clearly shows apples as the market leader over the four year period, extending its prominence to almost 27 percent of organic fruit sales in 2006, followed by bananas, strawberries, grapes, and oranges. All other organic fruits each represent less than 5 percent of the share of organic fruit sales. During 2003–2006, apples and strawberries grew in their shares, while grapes saw the biggest drop, followed by oranges. However, it is important to note that a gain or loss in share among each fruit doesn’t necessarily represent an increase or decrease in total retail sales, but rather a shift in distribution of sales within the sector. An individual fruit’s intra-market penetration, measured by the ratio of organic to conventional quantity purchased, can be used as a measure of growth within its own market. For example, bananas hovered around 14.5 to 16.5 percent of organic fruit sales yet have shown a steady increase in their intra-market penetration from just over 2 percent of the banana market in 2003 and 2004 to around 2.25 percent in 2005 and 2006.
Table 1.
Distribution of organic fresh fruit sales.
Table 1.
Distribution of organic fresh fruit sales.
| | Share of organic fresh fruit sales (%) |
|---|
| Fruits | 2003 | 2004 | 2005 | 2006 |
|---|
| Apples | 17.80 | 15.27 | 17.85 | 26.82 |
| Bananas | 16.60 | 14.49 | 16.53 | 15.24 |
| Strawberries | 5.47 | 6.19 | 6.96 | 6.98 |
| Grapes | 11.94 | 10.27 | 8.34 | 6.50 |
| Oranges | 8.11 | 7.82 | 7.31 | 5.41 |
| Pears | 4.10 | 3.98 | 4.85 | 4.68 |
| Blueberries | 0.79 | 1.27 | 2.47 | 4.00 |
| Watermelons | 3.30 | 4.46 | 2.83 | 3.47 |
| Avocados | 2.33 | 4.12 | 3.38 | 3.29 |
| Kiwis | 0.92 | 1.21 | 1.83 | 2.81 |
| Other fruits | 28.64 | 30.92 | 27.65 | 20.80 |
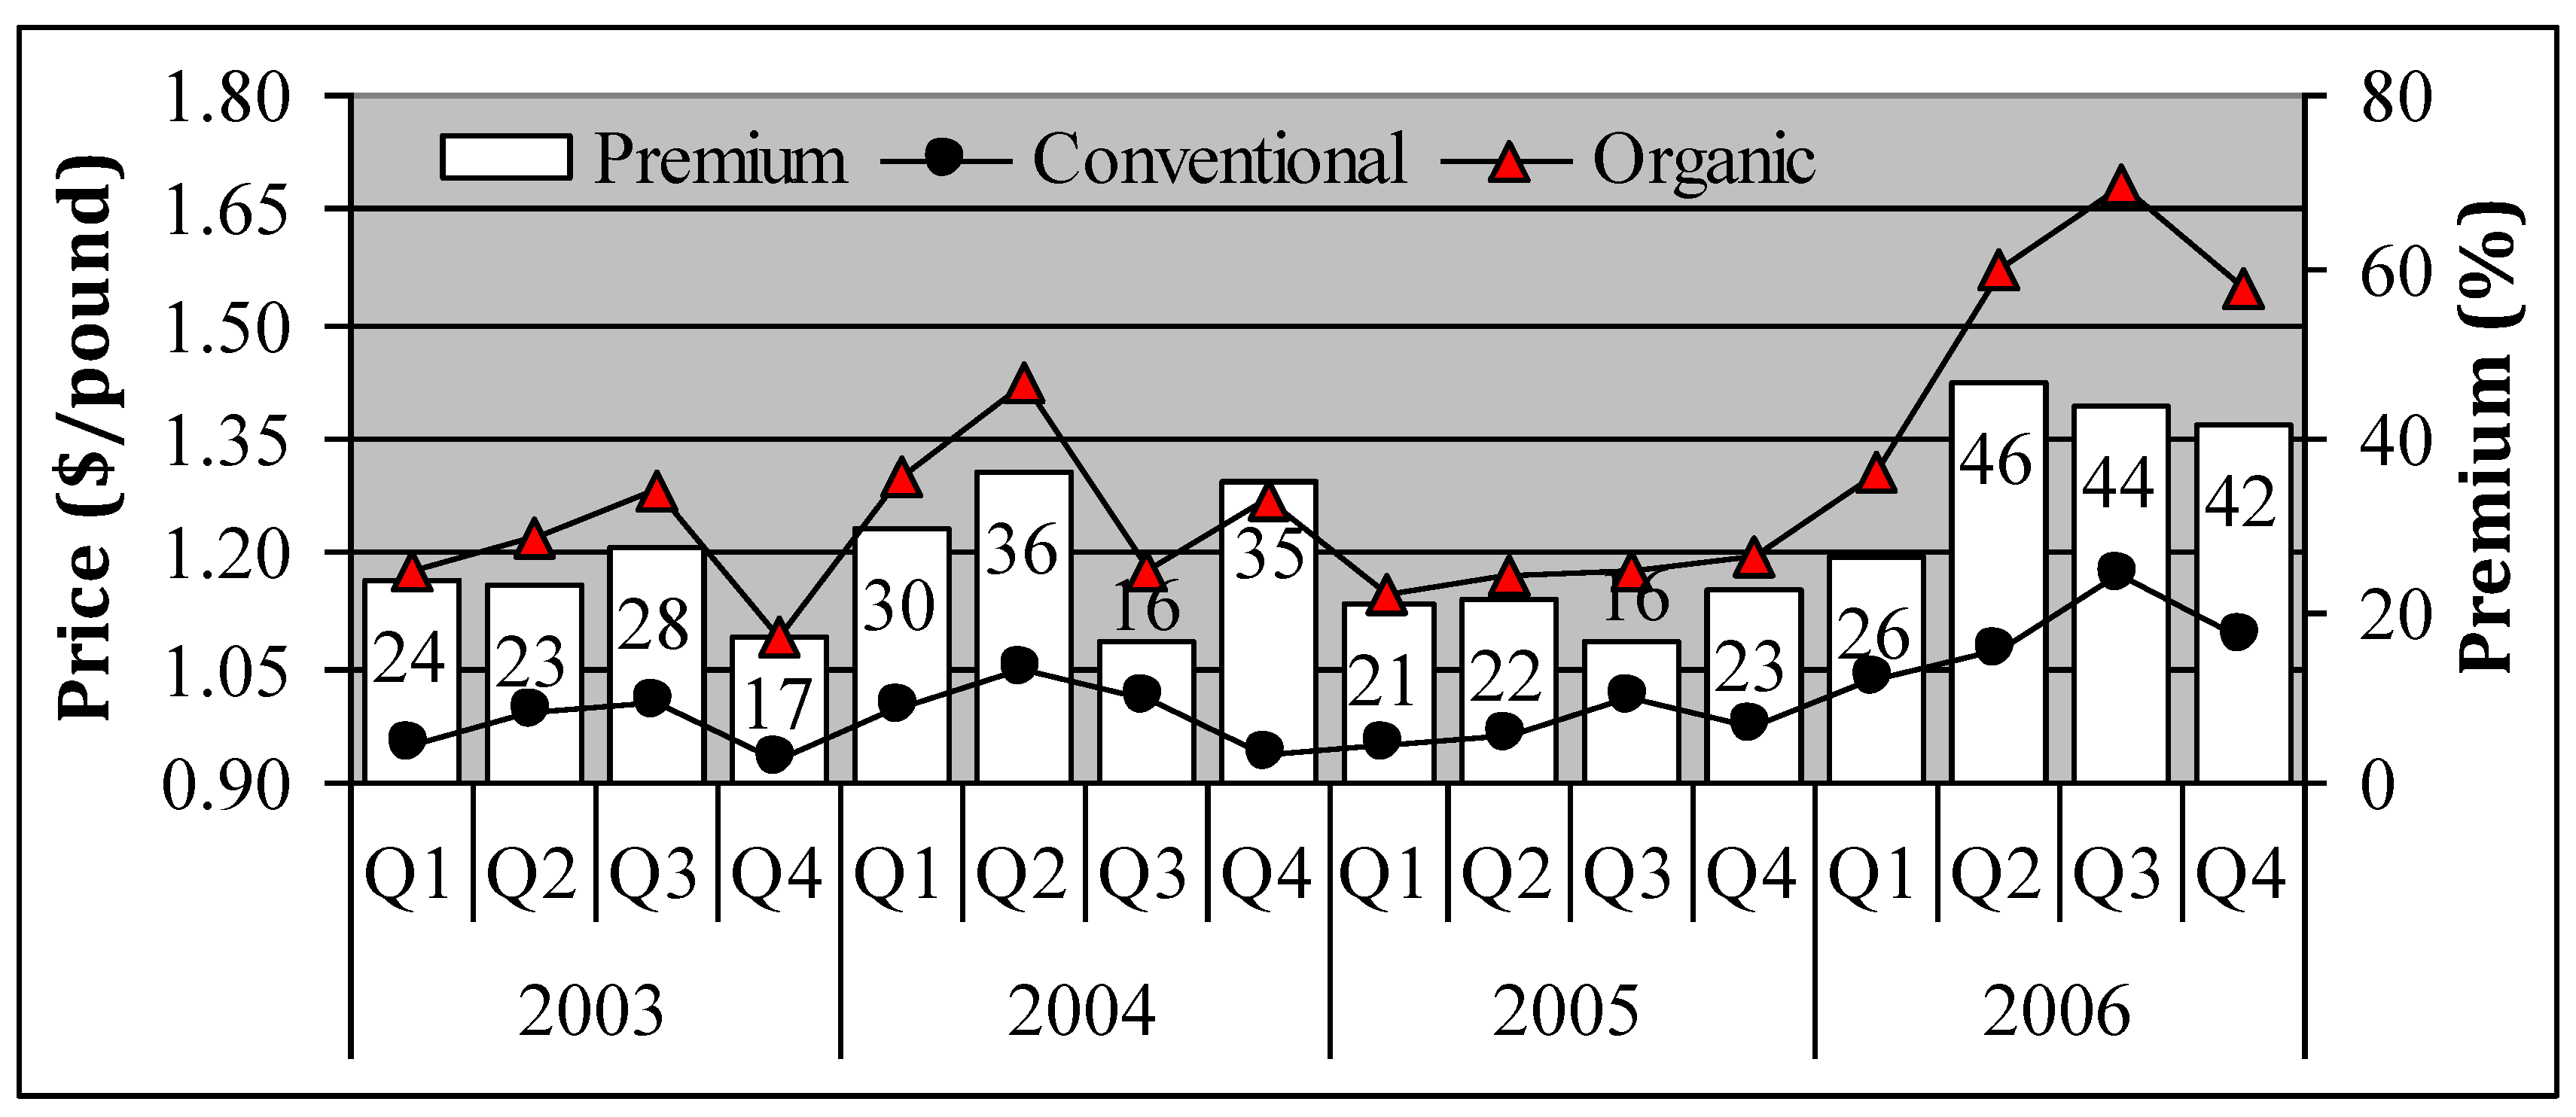
One factor that may contribute to the development of each fruit’s market share is the organic premium consumers must pay. As an example, we present the average seasonal price paid for conventional and organic fresh apples in
Figure 3 over 2003–2006. One can see that the organic premium in 2005 ranged from 16 to 23 percent, whereas in 2006 the range increased to 26 to 46 percent. Prior to 2006, the price spread between organic and conventional apples appears fairly constant. However, the organic premium began to widen increasingly after 2005. The notable increasing in organic premium in 2006 may reflect a market condition that demand for organic apples has outpaced the supply. In addition, we calculate that the organic intra-market penetration was 2.15 percent in 2005 within the apple market and rose to 3.25 percent in 2006, implying that an increase in organic intra-market penetration coupled with a higher premium could be what drove apples to account for over a quarter of total organic fruit sales in 2006.
Figure 3.
Average seasonal price of fresh organic and conventional apples, 2003-2006.
Figure 3.
Average seasonal price of fresh organic and conventional apples, 2003-2006.
Source: Compiled from Nielsen’s Homescan Panel (Fresh Foods), 2003–2006.
Aside from looking at organic market shares and price premiums, we also examine the share of organic fresh fruit spending by specific consumer segments. Specifically, we analyze the proportion of dollars spent on organic by race/ethnicity, income, and education. As shown in
Table 2, the average American spent 2.2 percent of their at-home fresh fruit dollars on organic in 2003, and that number increased to 2.8 percent by 2006. Compared to the rest of the population, non-Caucasians spent relatively more on organic fresh fruits since the implementation of the National Organic Standards, with the exception of Asian-Americans in 2006. Hispanic-Americans represent a small, but fast-growing demographic in the United States and have spent proportionally more on organic fruits than any other race/ethnicity during the time period investigated. However, much of the growth in the at-home organic fresh fruit sector in the U.S. could be attributed to the white population, as they represent by far the largest ethnic group and have shown a steady increase in spending from 1.7 to 2.4 percent during 2003–2006.
Table 2.
Share of fresh fruit expenditures spent on organic.
Table 2.
Share of fresh fruit expenditures spent on organic.
| | Organic share of spending (%) |
|---|
| Demographic | 2003 | 2004 | 2005 | 2006 |
|---|
| Total U.S. population | 2.18 | 2.41 | 2.48 | 2.79 |
| Race/ethnicity | | | | |
| White | 1.67 | 2.03 | 1.92 | 2.39 |
| Black | 3.52 | 3.46 | 3.17 | 4.18 |
| Hispanic | 4.26 | 4.13 | 5.42 | 4.57 |
| Asian | 3.55 | 2.59 | 2.54 | 1.50 |
| Other | 2.62 | 1.78 | 1.97 | 2.13 |
| Income ($1,000) | | | | |
| < 25 | 3.06 | 3.13 | 3.35 | 3.02 |
| 25–34.9 | 2.53 | 1.80 | 2.13 | 2.89 |
| 35–44.9 | 1.25 | 2.36 | 2.62 | 2.05 |
| 45–59.9 | 1.78 | 2.66 | 1.62 | 2.68 |
| 60–99.9 | 2.05 | 1.98 | 1.95 | 2.66 |
| 100 + | 1.97 | 2.25 | 3.36 | 3.28 |
| Education | | | | |
| High school or less | 2.13 | 2.67 | 2.70 | 2.22 |
| Some college | 1.81 | 1.78 | 1.69 | 2.55 |
| College and beyond | 2.54 | 2.78 | 3.04 | 3.36 |
With regards to income, it is interesting to see that the lowest income group (under $25,000/year) expends the highest percentage of their fresh fruit dollar on organic than the remainder of the population, with the exception of the highest earners ($100,000 plus) in 2005 and 2006. A popular perception in the organic trade circle is that income doesn’t necessarily track organic sales [
11,
12]. However, some empirical studies have found that higher income households are more likely to purchase organic produce [
13,
14] and become ‘loyal’ organic consumers [
10], while others have found no correlation with organic purchase behavior and income [
15,
16]. Unlike the previous three years, in 2006 there appears to be a clear association between educational attainment and spending on organic fresh fruits. Households with at least some college education increased their relative spending on organic during 2005–2006, while those with a high school diploma or less showed a decrease. Overall, the Homescan purchase records show a consistent steadily increase in organic fresh fruit spending among households with the highest level of educational attainment.
3.2. Organic Fresh Vegetable Sector
Contrary to organic fruits, the organic vegetable sector has seen its traditional market leader tomatoes retreat to the number two spot in 2006, replaced by carrots. Carrots doubled its share of organic vegetable sales between 2003 and 2006 from 12 to almost 25 percent (
Table 3). Tomatoes had a share of almost 22 percent of the organic vegetable market in 2003, but saw its share steadily decline to 16 percent in 2006. The decline in market share for organic tomatoes is due to its relatively stable intra-market penetration into the fresh tomato market over 2003-2006 (just over 3 percent) coupled with proportionally larger growth of other vegetables, most notably carrots and spinach. Spinach has seen its share of fresh organic vegetable sales more than double from 2.2 percent in 2003 to 5.9 percent in 2006; both carrots and spinach can attribute most of their growth to comparatively large sales volumes in 2006 over previous years. The organic intra-market penetration for carrots and spinach, measured by the ratio of organic to conventional quantity purchased, was calculated at 4.72 and 5.83 percent in 2005, respectively, and rose substantially to 11.09 and 8.39 percent in 2006. Lettuce and potatoes have also been emerging as strong organic players in the vegetable arena. All other vegetables had less than 5 percent of the sector in 2006.
Table 3.
Distribution of organic fresh vegetable sales.
Table 3.
Distribution of organic fresh vegetable sales.
| | Share of organic fresh vegetable sales (%) |
|---|
| Vegetables | 2003 | 2004 | 2005 | 2006 |
|---|
| Carrots | 12.12 | 10.64 | 14.92 | 24.89 |
| Tomatoes | 21.94 | 21.70 | 19.90 | 16.05 |
| Lettuce | 9.17 | 9.34 | 10.29 | 10.05 |
| Spinach | 2.20 | 2.71 | 4.08 | 5.91 |
| Potatoes | 4.27 | 6.02 | 5.28 | 5.43 |
| Onions | 5.81 | 5.44 | 6.44 | 4.94 |
| Yams | 3.11 | 2.46 | 3.40 | 3.89 |
| Peppers | 3.60 | 4.16 | 3.91 | 3.54 |
| Celery | 2.28 | 2.30 | 3.07 | 2.65 |
| Mushrooms | 2.33 | 3.06 | 1.96 | 2.54 |
| Other vegetables | 33.18 | 32.18 | 26.73 | 20.13 |
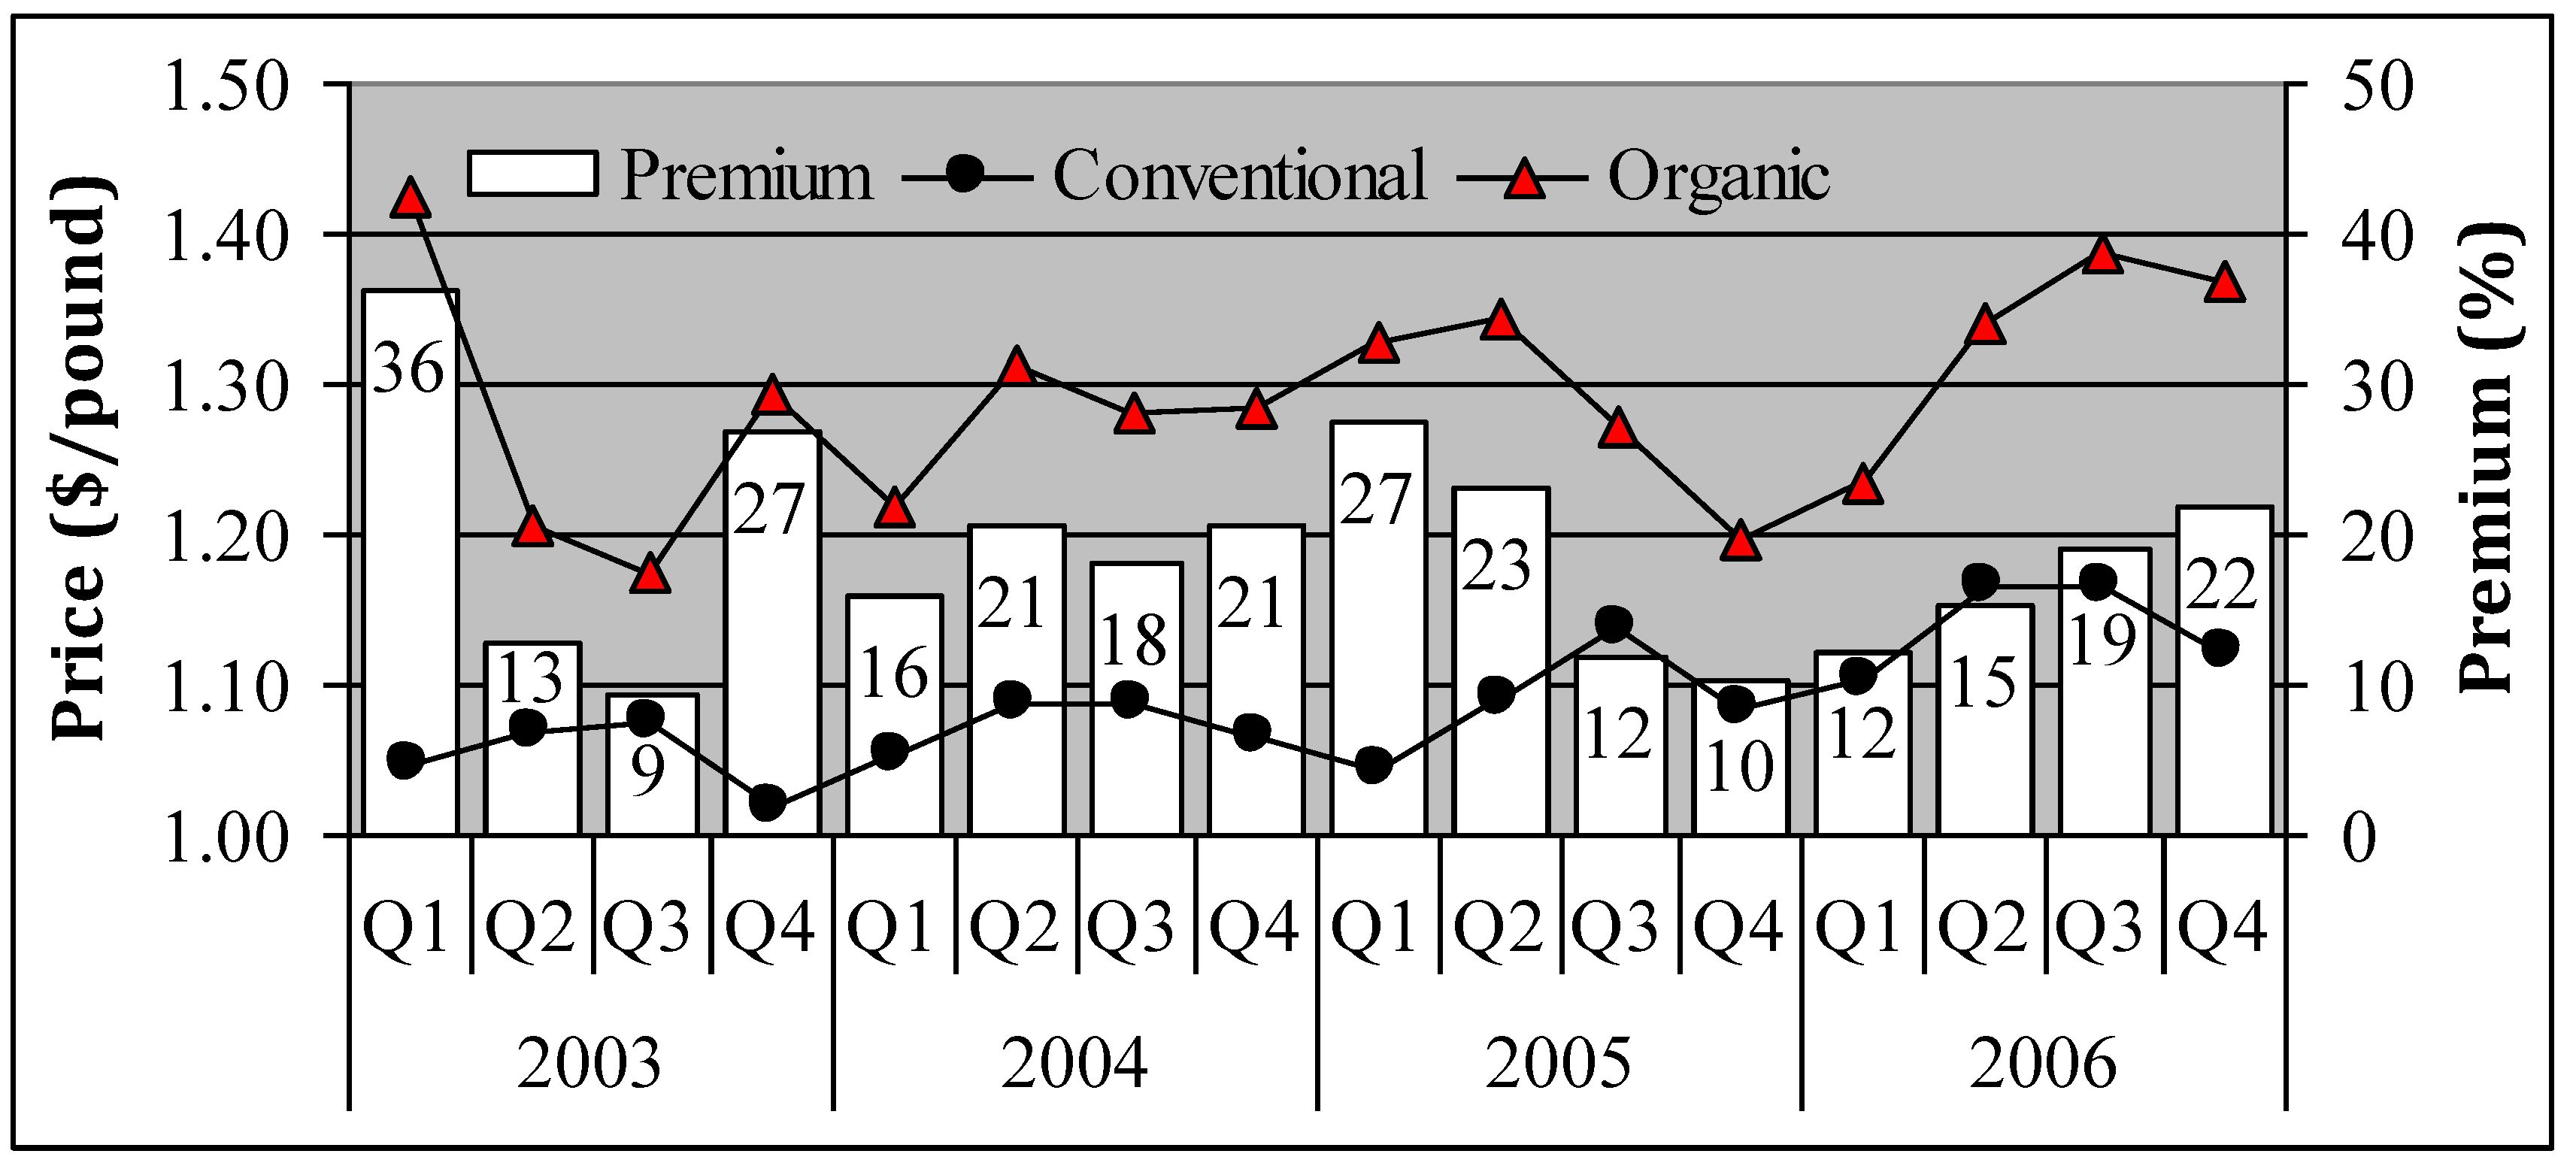
The price of conventional carrots followed a seasonal path similar to apples—increasing through the first three quarters of each year and then declining in the fourth. Like organic apples, organic carrots followed a similar trend of their conventional counterparts and have shown an increase in price, as well as premium, through most of 2006. Organic price premiums for carrots in 2003–2004 varied widely from 9 to 36 percent, while we calculate organic tomato premiums during the same time period at 6 to 20 percent. However, carrot premiums since the third quarter of 2005 have remained under 23 percent, although increasing, whereas tomato premiums jumped to the 24 to 26 percent range throughout 2006. It appears the relatively low premium for organic carrots in 2006 was a driving factor in its ability to capture just over 11 percent of the carrot market, and ultimately almost 25 percent of the sector.
Figure 4.
Average seasonal price of fresh organic and conventional carrots, 2003–2006.
Figure 4.
Average seasonal price of fresh organic and conventional carrots, 2003–2006.
Source: Compiled from Nielsen’s Homescan Panel (Fresh Foods), 2003-2006.
With respect to organic spending across the three demographic characteristics,
Table 4 shows that the average American increased their share of spending on organic from 2.4 to 3.7 percent of each at-home fresh vegetable dollar over 2003–2006. As with fresh fruits, non-Caucasian races/ethnicities tend to spend a proportionally higher percentage of their fresh vegetable dollar on organic. It is interesting to note that Black households’ spending on organic fresh fruits and vegetables has fluctuated over the years; their organic shares for fruits and vegetables remain about the same in 2006. The Asian-American population has considerably decreased their relative spending on organic fresh vegetables from 6.1 to 2.9 percent over 2003–2006, while Hispanics have doubled their share from 2.9 to 6.1 percent. The observation that the non-Caucasian population, except for Asian-American, has a propensity to spend more of their fresh produce dollar on organic is similar to findings in the literature [
5,
10,
13,
14]. It is a puzzling trend and a surprise to find out that Asian-American households have consistently reduced more than 50 percent of their spending on organic fresh produce from 2003 to 2006.
Similar to fruits, there appears to be a bimodal relationship between income and the share of spending on organic vegetables. At both the lowest (less than $25,000/year) and highest ($100,000/year or more) levels of income, the ratio of organic to conventional spending is generally at its highest, and these income groups expend a higher share of their vegetable dollar on organic than the average American (
Table 4). Economic studies investigating consumption of and propensity to spend on organic produce in relation to income have found mixed results [
10,
13,
14] possibly due to such findings presented here. Increased educational attainment is once more associated with a higher share of fresh vegetables dollars spent on organic.
Table 4.
Share of fresh vegetable expenditures spent on organic.
Table 4.
Share of fresh vegetable expenditures spent on organic.
| | Organic share of spending (%) |
|---|
| Demographic | 2003 | 2004 | 2005 | 2006 |
|---|
| Total U.S. population | 2.41 | 2.82 | 2.70 | 3.67 |
| Race/ethnicity | | | | |
| White | 1.98 | 2.57 | 2.29 | 3.33 |
| Black | 4.41 | 4.06 | 3.41 | 4.18 |
| Hispanic | 2.91 | 3.26 | 4.51 | 6.09 |
| Asian | 6.13 | 3.73 | 3.70 | 2.91 |
| Other | 3.51 | 3.79 | 3.11 | 2.71 |
| Income ($1,000) | | | | |
| < 25 | 2.57 | 3.13 | 2.79 | 3.72 |
| 25–34.9 | 2.82 | 2.10 | 2.77 | 4.28 |
| 35–44.9 | 2.06 | 2.52 | 3.04 | 2.29 |
| 45–59.9 | 2.17 | 3.14 | 1.87 | 2.44 |
| 60–99.9 | 2.28 | 2.74 | 2.61 | 3.98 |
| 100 + | 2.66 | 3.24 | 3.32 | 4.67 |
| Education | | | | |
| High school or less | 1.80 | 2.36 | 2.22 | 2.27 |
| Some college | 2.22 | 2.40 | 2.11 | 3.62 |
| College and beyond | 3.09 | 3.52 | 3.53 | 4.82 |
3.3. Organic Fluid Milk Sector
According to the
NBJ [
4], fifty-two percent of organic dairy sales are attributed to milk and cream constituting just over 8 percent ($1.6 billion) of the U.S. organic food and beverage market in 2007. In addition, sales of private label organic products increased 79 percent over the year ending July 14, 2007, as compared to just 18.5 percent for branded items [
4]. Branding has played an important role in retail milk sales for the past few decades, and organic milk is becoming no exception. As shown in
Table 5, the percent of purchases attributed to private label milk has been increasing at much faster rate for organic over conventional in all four U.S. census regions. For example, organic private label sales in the Northeast were just below 2 percent of all organic milk purchases in 2004, but reached almost 30 percent by 2007. On the other hand, the Western states appear to be early adopters of purchasing organic private label milk. However, as the market evolved over the four year period, all four regions have converged to the 28 to 38 percent range. Our results show that the share of private label in conventional milk sales has been relatively stable, increasing about 6 percent nationwide from 2004 to 2007, while the share of organic milk sales has increased almost 160 percent. In 2007, 32 percent of all U.S. organic milk purchases came from a private label as compared to 69 percent of conventional milk purchases. The increasing popularity of private label among organic milk consumers could possibly be attributed to the fact that consumers may have become less inclined to view private labels as inferior products to their branded counterparts.
Table 5.
Percent of organic fluid milk purchases contrast conventional purchases with respect to container size, fat content, and branding.
Table 5.
Percent of organic fluid milk purchases contrast conventional purchases with respect to container size, fat content, and branding.
| | Organic purchases (%) | | Conventional purchases (%) |
|---|
| Characteristic | 2004 | 2005 | 2006 | 2007 | | 2004 | 2005 | 2006 | 2007 |
|---|
| Private label | | | | | | | | | |
| Northeast | 1.70 | 14.66 | 20.04 | 29.33 | | 50.32 | 51.99 | 54.46 | 56.88 |
| Central | 6.85 | 22.25 | 21.12 | 28.04 | | 57.29 | 58.52 | 59.46 | 62.69 |
| South | 9.79 | 15.48 | 27.79 | 30.98 | | 73.77 | 72.81 | 73.43 | 74.19 |
| West | 25.25 | 32.01 | 32.61 | 38.18 | | 73.85 | 76.13 | 75.73 | 78.39 |
| National | 12.45 | 21.78 | 26.62 | 32.32 | | 65.54 | 66.33 | 67.10 | 69.28 |
| Container size | | | | | | | | | |
| Pint | 0.12 | 0.31 | 0.11 | 0.08 | | 1.12 | 1.18 | 1.15 | 1.15 |
| Quart | 2.12 | 1.89 | 1.78 | 1.13 | | 6.52 | 5.97 | 5.85 | 5.59 |
| Half gallon | 91.26 | 90.78 | 87.78 | 86.32 | | 31.44 | 31.59 | 31.26 | 29.71 |
| Gallon | 6.51 | 7.02 | 10.34 | 12.47 | | 60.93 | 61.26 | 61.73 | 63.55 |
| Fat content | | | | | | | | | |
| Non-fat/skim | 30.42 | 30.15 | 29.98 | 27.03 | | 22.89 | 23.43 | 23.83 | 22.32 |
| Low-fat | 45.20 | 45.54 | 48.13 | 46.68 | | 53.04 | 53.12 | 53.84 | 52.62 |
| Whole | 24.37 | 24.31 | 21.89 | 25.56 | | 23.95 | 23.34 | 22.28 | 23.93 |
Other than branding, there are other notable differences that characterize consumers’ purchases of organic and conventional milk. The distribution of organic and conventional milk purchases also vary by container size and fat content (
Table 5). Milk purchased in half gallon containers dominates the organic market, whereas gallon containers are the preferred choice for conventional milk consumers. In 2004, over 91 percent of organic milk was bought in half gallons, which decreased to just over 86 percent by 2007 (
Table 5). The decline in the percent of organic half gallon purchases is most likely due to an increase of organic gallon purchases—almost doubling its organic share of purchases from 6.5 to 12.5 percent over 2004–2007. Organic pints are negligible, not even reaching one-half percent of organic purchases, while conventional pints made up just over one percent of purchases in all four years. Organic milk purchases by brand and container size appear to be trending towards the distribution of the conventional purchases, possibly signaling an evolving organic milk market into the ‘mainstream’ as producers cater to a broader consumer base incorporating organic milk into their food basket.
Differences in fat content are not as apparent as container size. However, there exist a noticeably higher proportion of purchases for the non-fat product among organic (
Table 5). Skim milk represented 27 to 30 percent of organic purchases over 2004–2007, while only constituting 22 to 24 percent of conventional purchases. The disparities in purchases by fat content can in part be attributed to organic consumers’ affinity for healthier foods [
17,
18]—non-fat milk over higher fat content milk (i.e., low-fat and whole). It is interesting to note that while the relative shares of fat content in conventional milk purchases have remained relatively stable over time, the shares of non-fat/skim organic milk purchases have steadily decreased from 30 percent in 2004 to 27 percent in 2007. Our conjecture suggests that consumers may be unconsciously or consciously compensating higher fat content with the organic feature, which remains to be seen.
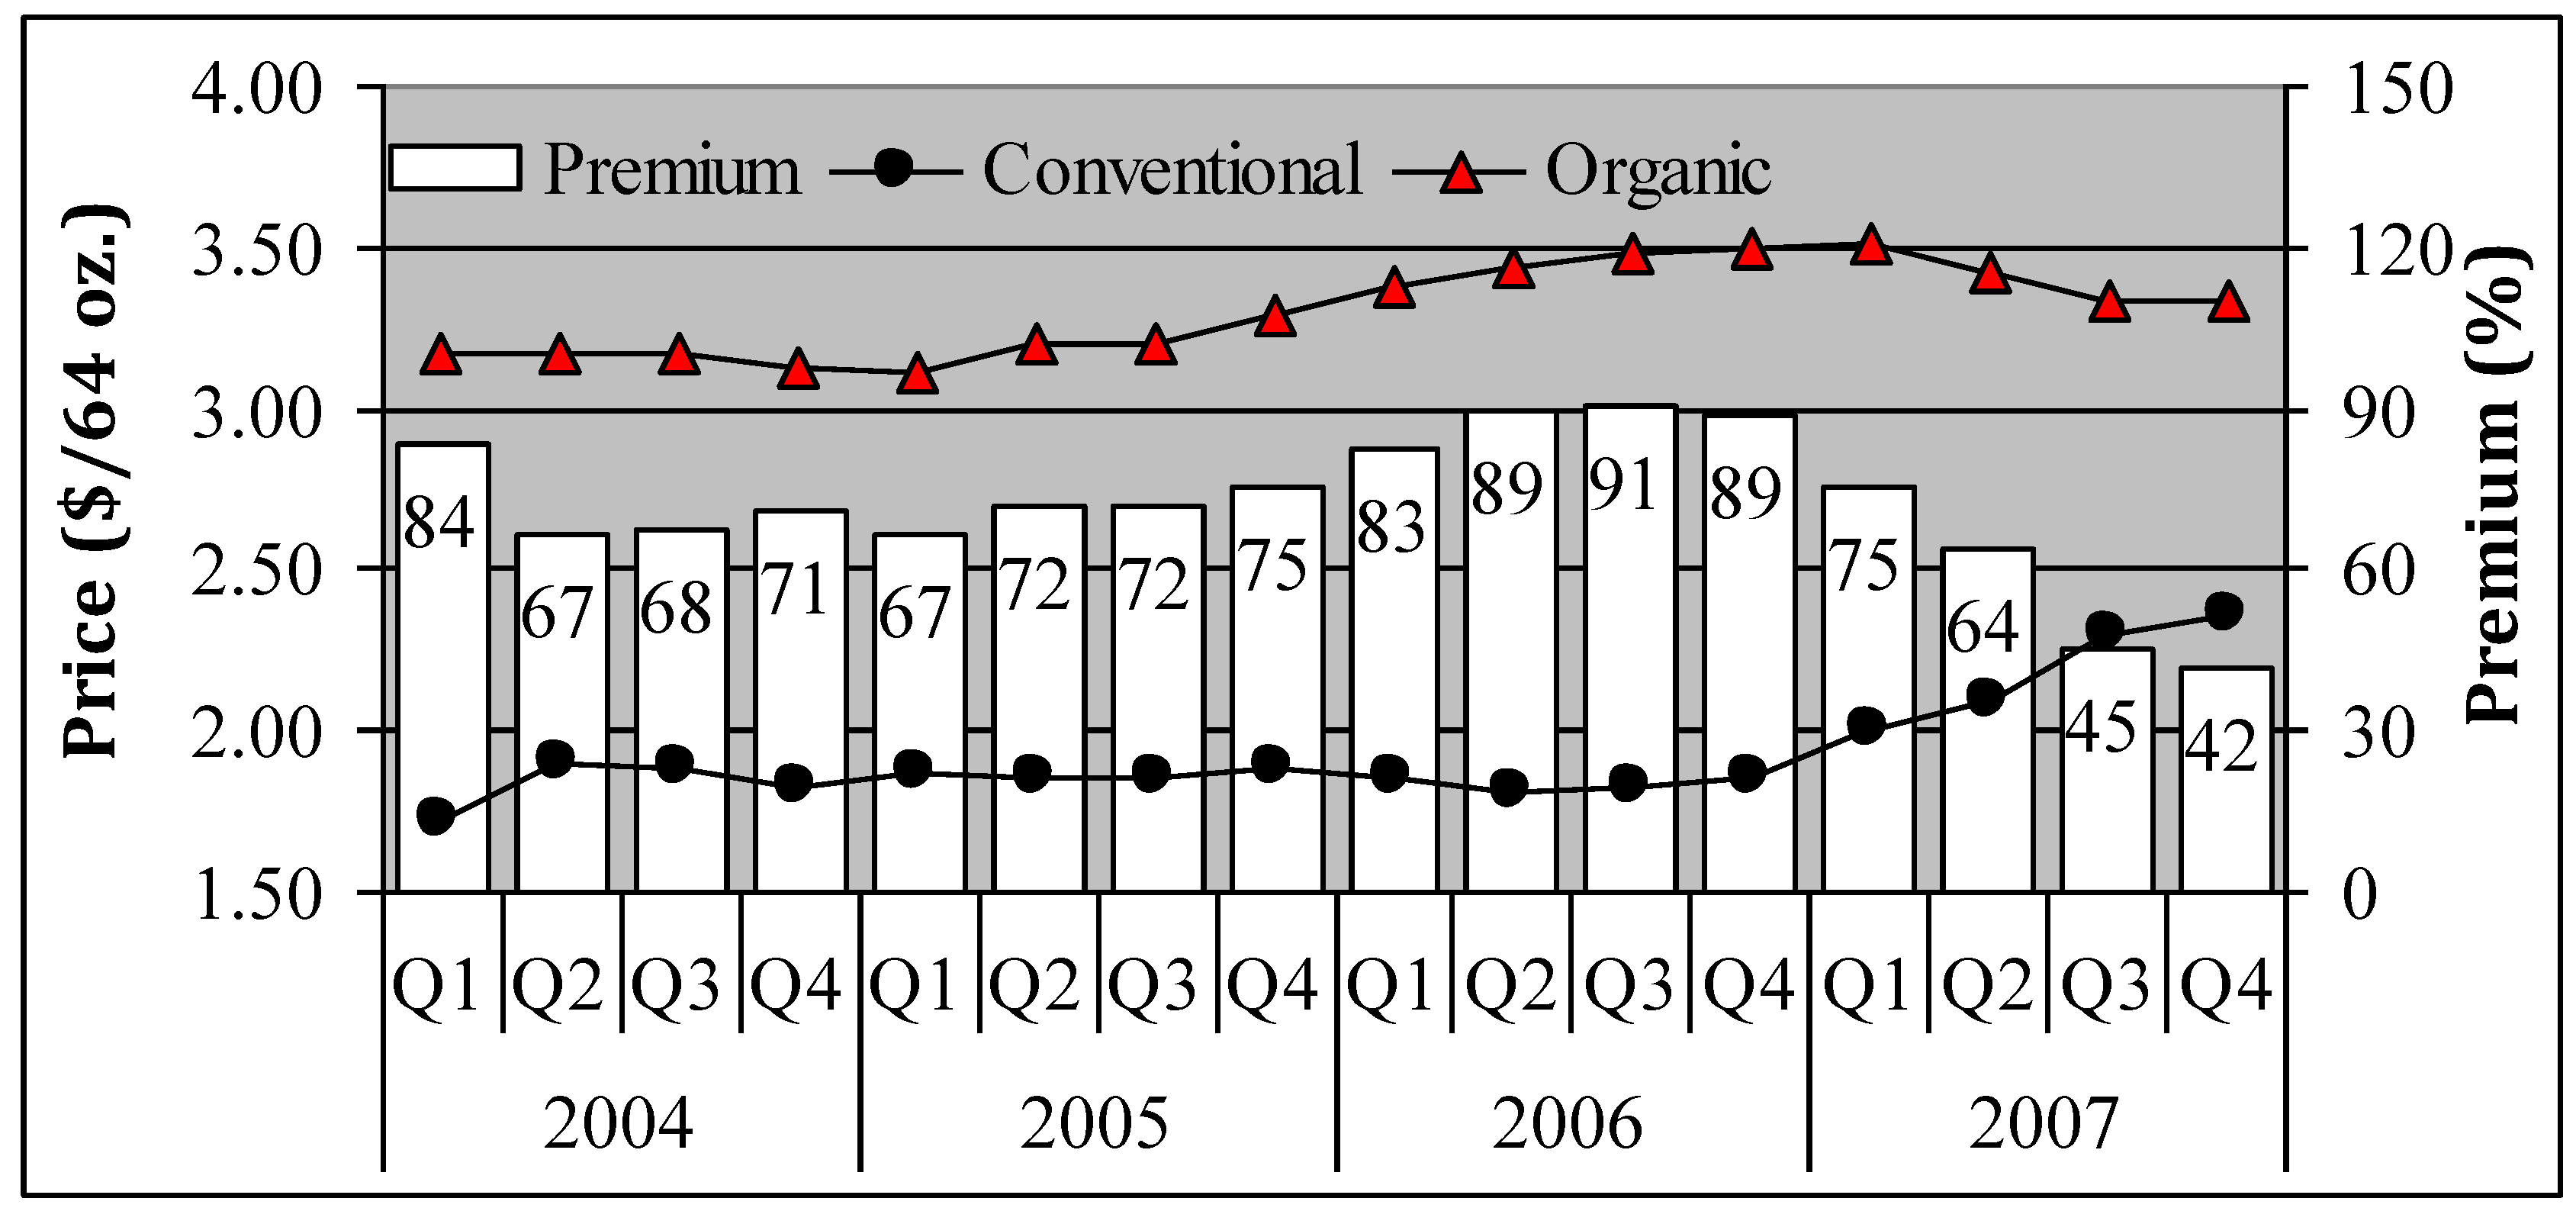
As noted previously, half gallons are the preferred container size for organic consumers. Therefore, in
Figure 5, we present the average quarterly price of half gallons. The organic premium gradually increased from the second quarter of 2004 (67 percent) through the third quarter of 2006 (91 percent). However, as conventional milk prices began to steadily rise in 2007, organic prices started to show a slight decrease (possibly due to the private label invasion), causing premiums for half gallons to plunge below 50 percent in the second half of 2007. The shrinking relative price for organic milk could be a key factor in the sector’s large growth throughout 2007 displayed in
Figure 1.
Figure 5.
Average quarterly price of organic and conventional milk in half gallons, 2004–2007.
Figure 5.
Average quarterly price of organic and conventional milk in half gallons, 2004–2007.
Source: Compiled from Nielsen’s Homescan Panel (UPC), 2004–2007.
As shown in
Table 6, the share of the American milk dollar spent on organic was 3.6 percent in 2007, up from 1.3 percent in 2004. We observed that spending among milk consumers is different from fresh produce in many regards. For example, like fresh produce, the non-Caucasian populations spend a relatively larger amount on organic milk than the white population. Yet in contrast to fresh produce, the Asian population not only holds proportionally the largest amount of dollars spent on organic milk in 2007 (10.3 percent), but has also been increasing their share. Similarly, households of Other ethnicity also spent an increasing larger proportion of their milk budget on organic milk, reaching 7.29 percent in 2007. This observation suggests that among the non-Caucasian populations Asian and Other would prefer to spend their budget on organic milk, while Black and Hispanic would choose to spend more on organic fresh produce.
With regards to income, households earning over $60,000 per year consistently spent a higher share of their milk dollar on organic than the average American. In 2007, households making over $100,000 spent 6.9 percent of milk dollars on organic versus 1.6 percent for those with incomes under $25,000. The differences between organic spending on milk and produce with regards to income may be expected due to the relatively higher organic milk premium. Lin
et al. [
7] found organic prices for selected fresh produce to range from 20 to 60 percent above conventional prices, while Smith
et al. [
8] estimated premiums for organic milk in 2006 to fall in the range of 60 to 109 percent. Once more, higher educational attainment is correlated with higher spending on organic milk, and this association is well documented in the literature for most organic foods [
10,
16]. Unlike fresh produce, the share of spending on organic milk has increased steadily from 2004 to 2007 regardless of the level of educational attainment. In 2007, households with the highest educational attainment spent 6.5 percent of their milk budget on organic fluid milk, which is much greater than the combined shares of organic milk spending by those households with lower educational attainment.
Table 6.
Share of U.S. fluid milk expenditures spent on organic.
Table 6.
Share of U.S. fluid milk expenditures spent on organic.
| | Organic share of spending (%) |
|---|
| Demographic | 2004 | 2005 | 2006 | 2007 |
|---|
| Total U.S. population | 1.31 | 1.91 | 2.68 | 3.57 |
| Race/ethnicity | | | | |
| White | 1.26 | 1.78 | 2.47 | 3.11 |
| Black | 0.82 | 1.14 | 3.10 | 3.71 |
| Hispanic | 1.66 | 2.62 | 2.83 | 4.57 |
| Asian | 3.03 | 4.97 | 4.77 | 10.32 |
| Other | 1.48 | 2.44 | 6.30 | 7.29 |
| Income ($1,000) | | | | |
| < 25 | 0.92 | 1.52 | 1.75 | 1.60 |
| 25 – 34.9 | 0.77 | 0.99 | 2.40 | 1.92 |
| 35 – 44.9 | 0.97 | 1.60 | 1.88 | 1.99 |
| 45 – 59.9 | 0.99 | 1.62 | 2.07 | 3.14 |
| 60 – 99.9 | 1.68 | 2.29 | 3.09 | 4.19 |
| 100 + | 4.14 | 5.19 | 4.96 | 6.93 |
| Education | | | | |
| High school or less | 0.32 | 0.49 | 0.79 | 1.22 |
| Some college | 1.05 | 1.62 | 2.47 | 2.77 |
| College and beyond | 2.43 | 3.40 | 4.62 | 6.50 |
3.4. Organic Strained Baby Food Sector
There are approximately 17 million children in the U.S. under the age of four, requiring unique foods necessary for growth and development. This age group of consumers represents a profitable market segment of the food industry that sold almost $4 billion in baby food annually.
NBJ [
4] estimates that U.S. organic baby food sales grew to $268 million in 2007, up 16 percent over the previous year. Organic baby food is often considered as a “gateway food” into the organic market, Maguire
et al. [
20] suggested that the rising sales of organic baby food could be attributed primarily to parents’ desire to reduce food safety and health risks of their babies’ exposure to pesticide residues. The baby food sector not only includes formulas, teething biscuits, juices, and cereals, but strained baby foods as well. For our analysis, we concentrate on the later, as it is a dominant portion of the baby food sector and is easily identifiable from the Homescan panel. Strained baby food comes in many flavors: fruits, vegetables, and multiple ingredient dinners consisting of a combination of fruits, vegetables, and/or meat. Strained baby food is also sold in three stages (corresponding to container size) and is becoming more frequently offered in bulk packaging (two or more containers packaged together). Stage 1 baby food is finely puréed, generally offered in 2.5 ounce containers and is one of the first solid foods babies eat. Babies then move to stage 2 foods that generally come in 3.5 to 4 ounce sizes. Finally, babies eat stage 3 baby foods (6 ounces) that have more texture and small chunks of food to promote chewing.
Table 7.
The percent of organic and conventional strained baby food purchases with respect to stage, food content, and packaging.
Table 7.
The percent of organic and conventional strained baby food purchases with respect to stage, food content, and packaging.
| | Organic purchases (%) | | Conventional purchases (%) |
|---|
| Characteristic | 2004 | 2005 | 2006 | 2007 | | 2004 | 2005 | 2006 | 2007 |
|---|
| Stage | |
| 1 (<3.5 oz.) | 19.99 | 19.03 | 19.19 | 20.82 | | 21.73 | 21.79 | 19.17 | 18.62 |
| 2 (3.5–5 oz.) | 79.42 | 79.64 | 77.80 | 69.91 | | 56.60 | 56.18 | 58.87 | 55.37 |
| 3 (>5 oz.) | 0.59 | 1.32 | 3.01 | 9.26 | | 21.67 | 22.03 | 21.96 | 26.01 |
| Food content | | | | | | | | | |
| Fruit | 41.94 | 43.68 | 44.50 | 42.17 | | 36.93 | 33.97 | 36.27 | 36.03 |
| Vegetable | 28.06 | 30.77 | 29.65 | 33.60 | | 24.67 | 26.15 | 26.75 | 26.50 |
| Dinners (no meat) | 13.08 | 13.04 | 12.37 | 9.87 | | 6.05 | 6.28 | 6.60 | 8.05 |
| Dinners (w/ meat) | 16.92 | 12.28 | 12.16 | 9.08 | | 31.54 | 31.48 | 29.30 | 28.90 |
| Assorted varieties | 0.00 | 0.23 | 1.32 | 5.27 | | 0.80 | 2.12 | 1.08 | 0.52 |
| Multipack | 2.06 | 2.51 | 27.42 | 56.39 | | 24.26 | 25.52 | 34.38 | 38.96 |
Table 7 presents the distribution of strained baby food purchases by stage, food content, and bulk packaging. Previous studies [
19,
20,
21] observed that organic strained baby food was predominantly available in stage 2 containers. Using nationally representative supermarket scanner data, Thompson and Glaser [
19] found that from 1989 to 1993, 100 percent of organic strained baby food was purchased in stage 2 containers. That number stayed above 90 percent for the remainder of the study years (1994–1999), while the percentage of conventional baby food purchased in stage 2 containers was in the 52 to 57 percent range for 1989–1999. One possible explanation is that stages 1 and 3 have closely related and easily attainable substitutes—formula, cereals, and breast milk for stage 1, and table food for stage 3—whereas the most likely substitute for stage 2 baby food is homemade, which can be time consuming to make for the parent. As the organic sector continues to grow, we find that the percentage of stage 2 purchases is still on the decline from about 80 to 70 percent in 2004–2007.
Strained baby food containing predominantly fruits and vegetables, but with no meat, is purchased at a higher frequency for organic than for conventional. In fact, 85.6 percent of organic purchases (fruits, vegetables, and dinners without meat) contained no meat in 2007, while 9.1 percent contained meat and 5.3 percent came in undistinguishable assorted varieties, as compared to 70.6 (no meat), 28.9 (meat) and 0.5 (assorted) for conventional purchases.
Parents generally buy more than one jar of baby food per shopping trip. The evolution of bulk package purchases found in both the organic and conventional markets is quite striking. In 2004, 2.1 and 24.3 percent of organic and conventional strained baby food jars were purchased in bulk, respectively. By 2007, over 56 percent of organic strained baby food purchases constituted a bundled package of at least two jars (or plastic tubs) as compared to nearly 40 percent of conventional purchases. Buying food in bulk, or pre-bundled packages, generally comes with a price discount. However, two studies investigating the price of strained baby food in two selected U.S. cites in 2001 [
20] and at the national level in 2006 [
9] found this not to be true. It appears the bundled packages offer more convenience rather than a price discount, and consumers pay for that convenience through negating a price discount.
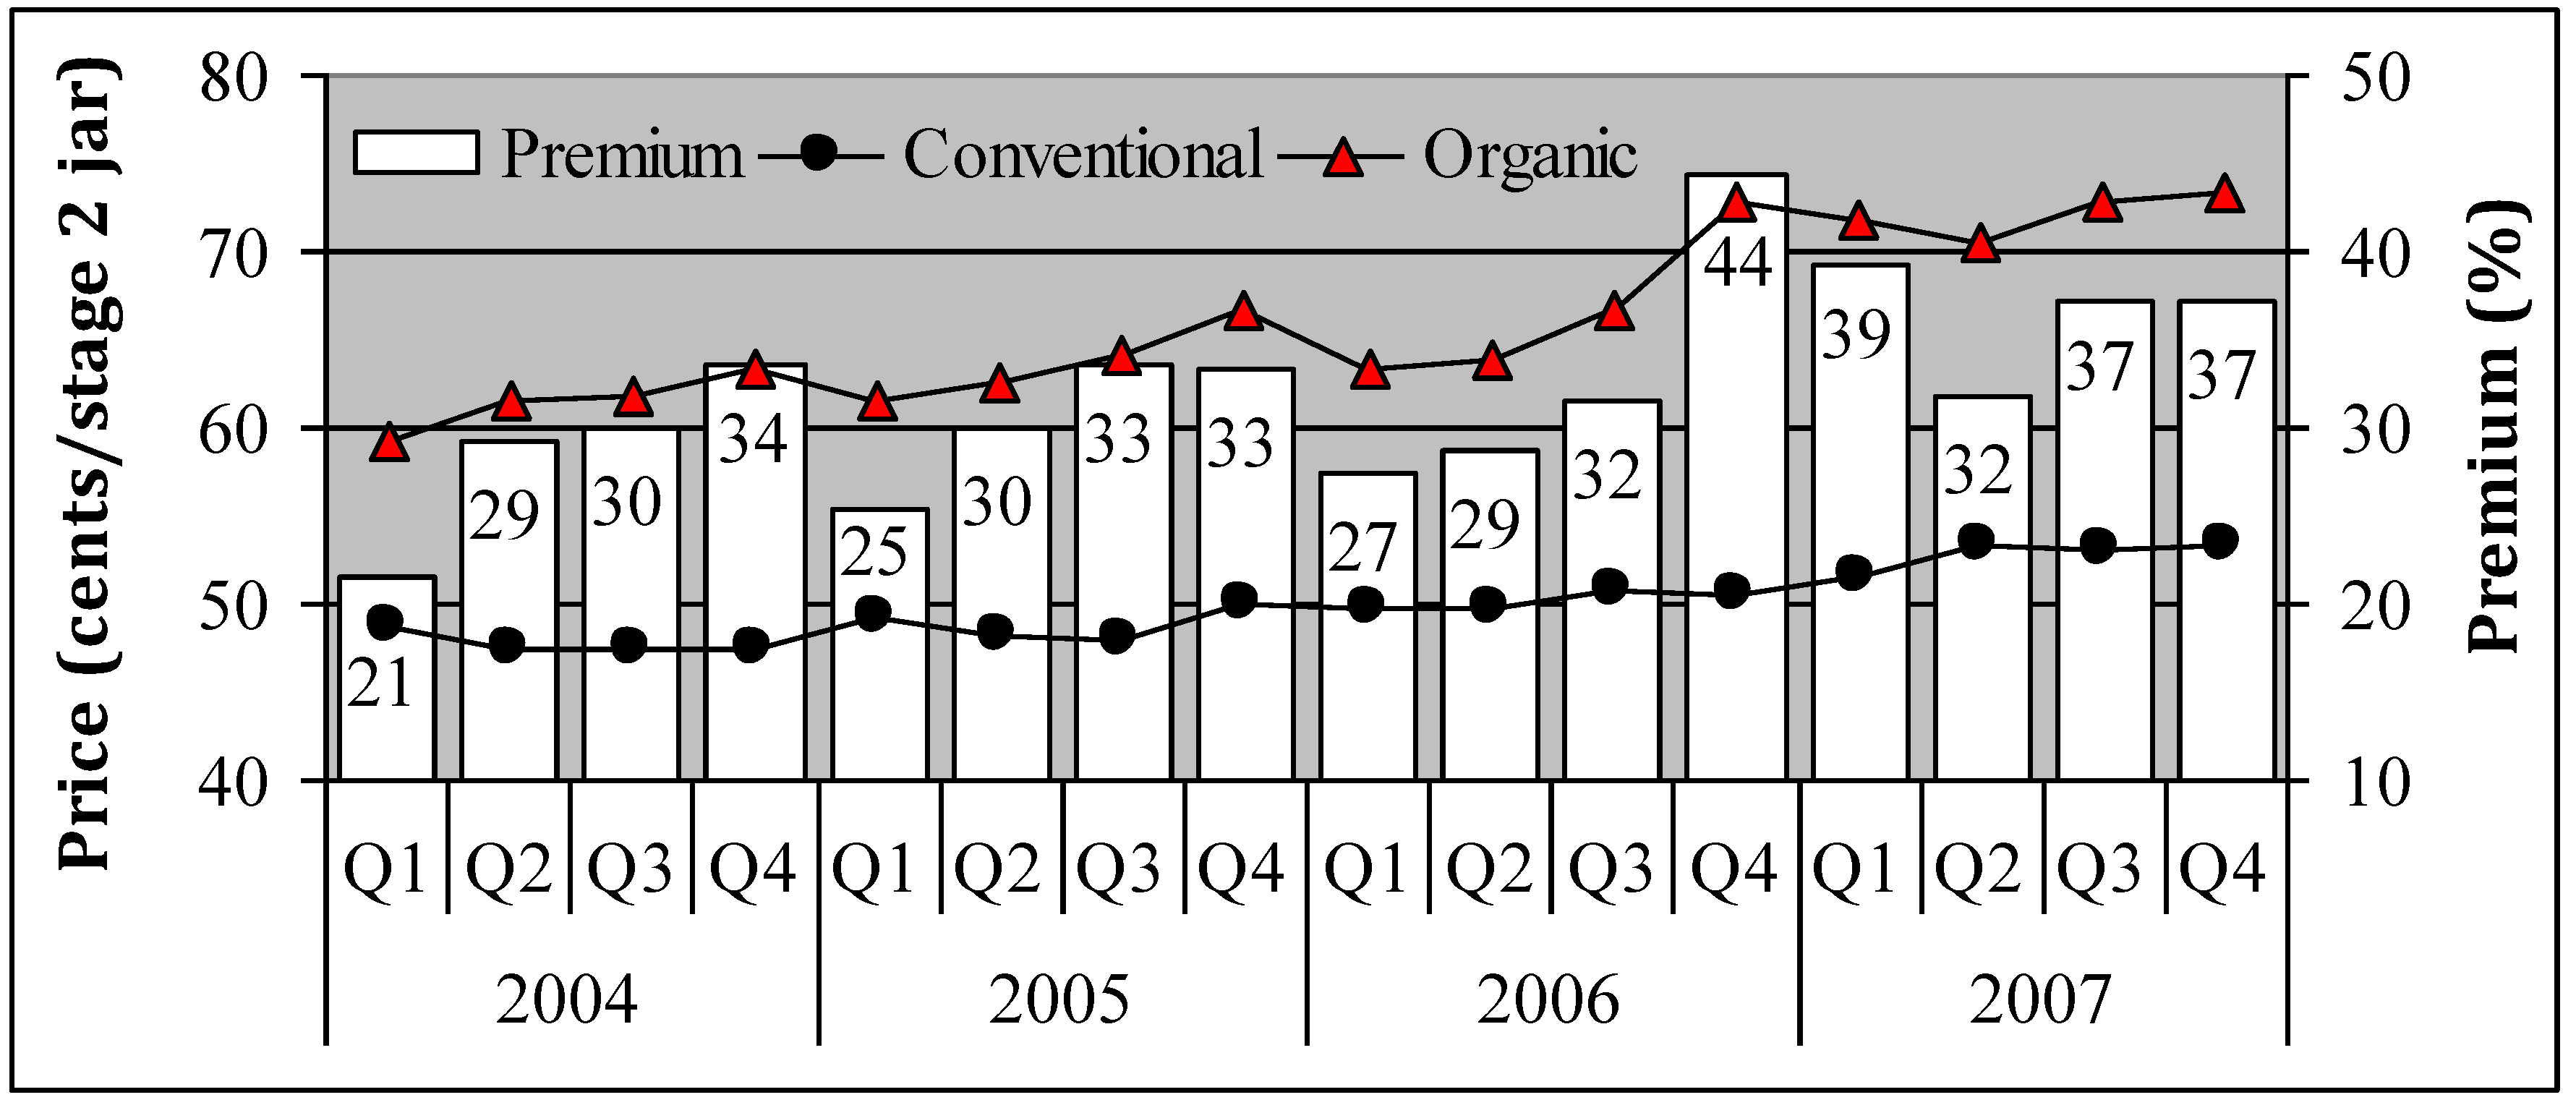
Figure 6.
Average quarterly price of organic and conventional strained fruit flavored baby food in stage 2 containers, 2004–2007.
Figure 6.
Average quarterly price of organic and conventional strained fruit flavored baby food in stage 2 containers, 2004–2007.
Source: Compiled from Nielsen’s Homescan Panel (UPC), 2004-2007.
For comparison of prices, we concentrate on fruit flavored stage 2 strained baby food, as this is the most frequently purchased organic and conventional baby food and offers a heterogeneous product. However, we note that preliminary comparisons of other stage/food content combinations resulted in similar price trends. Given that baby food is a relatively shelf-stable product (as compared to fresh produce and milk) it is not surprising to see a non-cyclical and reasonably smooth trend. However, as seen in
Figure 6, the price for organic appears to be increasing faster than conventional. Through most of 2004–2006 premiums remained around 30 percent, but were wholly above 30 percent throughout 2007. Again, the upward trending of organic premium on baby food represents a market condition of increasing demand for organic baby food relative to its conventional counterparts.
As shown in
Table 8, spending on organic relative to conventional strained baby food is noticeably larger than the previous three foods investigated. Previous studies have found that parents of young children and infants are more likely to purchase organic foods [
10,
22]. Given baby food’s target market, it may be of no surprise to see such a stark difference in spending. Our analysis of the Homescan data shows that the average American spent almost 8 percent of their strained baby food dollars on organic in 2004, and that number increased to just over 14 percent in 2007.
Table 8.
Share of strained baby food expenditures spent on organic.
Table 8.
Share of strained baby food expenditures spent on organic.
| | Organic share of spending (%) |
|---|
| Demographic | 2004 | 2005 | 2006 | 2007 |
|---|
| Total U.S. population | 8.29 | 9.03 | 11.31 | 14.78 |
| Race/ethnicity | | | | |
| White | 8.78 | 9.37 | 10.10 | 14.10 |
| Black | 3.02 | 5.74 | 5.91 | 10.64 |
| Hispanic | 7.32 | 9.15 | 13.75 | 17.83 |
| Asian | 18.24 | 17.16 | 25.69 | 24.08 |
| Other | 10.74 | 4.83 | 30.42 | 17.80 |
| Income ($1,000) | | | | |
| <25 | 4.79 | 3.51 | 4.71 | 9.29 |
| 25–34.9 | 3.85 | 4.35 | 8.02 | 11.01 |
| 35–44.9 | 4.36 | 10.80 | 4.87 | 10.68 |
| 45–59.9 | 11.08 | 7.31 | 9.37 | 11.47 |
| 60–99.9 | 8.50 | 10.03 | 13.18 | 13.42 |
| 100+ | 16.90 | 21.56 | 20.25 | 23.13 |
| Education | | | | |
| High school or less | 4.13 | 2.93 | 4.61 | 6.45 |
| Some college | 6.49 | 8.36 | 8.50 | 10.99 |
| College and beyond | 11.65 | 12.10 | 15.65 | 19.62 |
Like fluid milk and in contrast to fresh produce, the Asian population spent proportionally more on organic than other races/ethnicities over 2004-2007. However, like produce and milk, Hispanic-Americans also showed a relatively high propensity to spend on organic, especially in 2007 when 17.8 percent of their spending went to organic (
Table 8). In general (and similar to milk), income is positively correlated to the organic share of dollars spent on baby food. As the organic baby food sector evolved over the four year period, the relationship between income and organic spending has become more clearly defined. Like the previous three food sectors, there appears to be a clear association between educational attainment and organic spending. Overall, we found that organic spending has been strongly and consistently associated with educational attainment across all four food sectors investigated.


