Policy Considerations for Zero-Emission Vehicle Infrastructure Incentives: Case Study in Canada


Department of Chemical Engineering, University of Waterloo, 200 University Avenue West, Waterloo, ON N2L 3G1, Canada
*
Author to whom correspondence should be addressed.
World Electr. Veh. J. 2018, 9(3), 38; https://doi.org/10.3390/wevj9030038
Submission received: 20 June 2018
/
Revised: 13 August 2018
/
Accepted: 17 August 2018
/
Published: 23 August 2018
(This article belongs to the Special Issue Selected Papers from The 30th International Electric Vehicles Symposium and Exhibition (Stuttgart, Germany))
Abstract
:Transportation accounts for more than 20% of the total Greenouse Gas (GHG) emissions in Canada. Switching from fossil fuels to more environmentally friendly energy sources and to Zero-Emission Vehicles (ZEVs) is a promising option for future transportation but well to wheel emission and charging/refuelling patterns must also be considered. This paper investigates the barriers to and opportunities for electric charging and hydrogen refueling infrastructure incentives in Ontario, Canada and estimates the number of Internal Combustion Engine Vehicles (ICEVs) that would be offset by infrastructure incentives. The paper also assesses the potential of electric and hybrid-electric powertrains to enable GHG reductions, explores the impact of the electricity supply mix for supporting zero-emission vehicles in different scenarios and studies the effect of the utility factor for PHEVs in Ontario. The authors compare the use of electric vehicle charging infrastructures and hydrogen refueling stations regarding overall GHG emission reductions for an infrastructure incentive funded by a 20-million-dollar government grant. The results suggest that this incentive can provide infrastructure that can offset around 9000 ICEVs vehicles using electricity charging infrastructure and 4000–8700 when using hydrogen refuelling stations. Having appropriate limitations and policy considerations for the potential 1.7 million electric-based vehicles that may be in use by 2024 in Ontario would result in 5–7 million tonne GHG avoidances in different scenarios, equivalent to the removal of 1–1.5 million ICEVs from the road.
1. Introduction
Climate change is one of the most significant environmental challenges the global community faces. Anthropogenic Greenhouse Gases (GHG) are the major contributing factor in climate change, which causes erratic weather conditions such as increased drought, flooding and changing temperature pattern change [1]. To achieve the decarbonisation necessary to reduce GHG in future energy systems, the different energy sectors, including electricity and transportation systems must be integrated. The transportation sector could reduce GHG emissions by deploying Zero-Emission Vehicles (ZEVs), such as Electric Vehicles (EVs), Fuel Cell Vehicles (FCVs) and Plug-in Hybrid Vehicles (PHEVs). As such, this work discusses and compares the infrastructure incentives used to encourage early adoption of zero-emission light-duty vehicles. This adoption requires two transitions. First, the vehicle technology itself must be developed but development of EVs involves global technology development by multinational vehicle companies, even though the incentives from small markets will have only limited impact on the technology development itself. There is a recognition that incentives for the purchase of ZEVs in a region can significantly influence the adoption of the technology in that region. However, for this work such vehicle incentives are assumed to be equal for all ZEVs but are beyond the scope of this specific analysis; they will, however, will be included in future studies. Second, infrastructure to support the recharging and refueling of the technology will be required. Public charging stations will be required for Battery Electric Vehicles (BEVs) and similarly, for FCVs hydrogen refuelling stations. It is within the ability of policy makers and governments to encourage one technology over another through supporting the development of refueling infrastructure. This work examines early infrastructure incentive programs in Ontario designed to support the adoption of ZEVs.
1.1. Importance of This Research
The reduction of today’s increasing carbon dioxide levels is possible but will require significant changes in technology and behaviour [2]. Many countries, including Canada, in December 2015, signed the Paris Agreement created to strengthen efforts to limit the global average temperature rise to below 2 °C [3], the threshold the Intergovernmental Panel on Climate Change has indicated that irreversible climate harm will have occurred. As countries begin to assess their GHG emissions and identify opportunities for decarbonisation, they will look across a variety of sectors. It is anticipated that each country will meet its Climate Commitments differently, with no two efforts being identical [4].
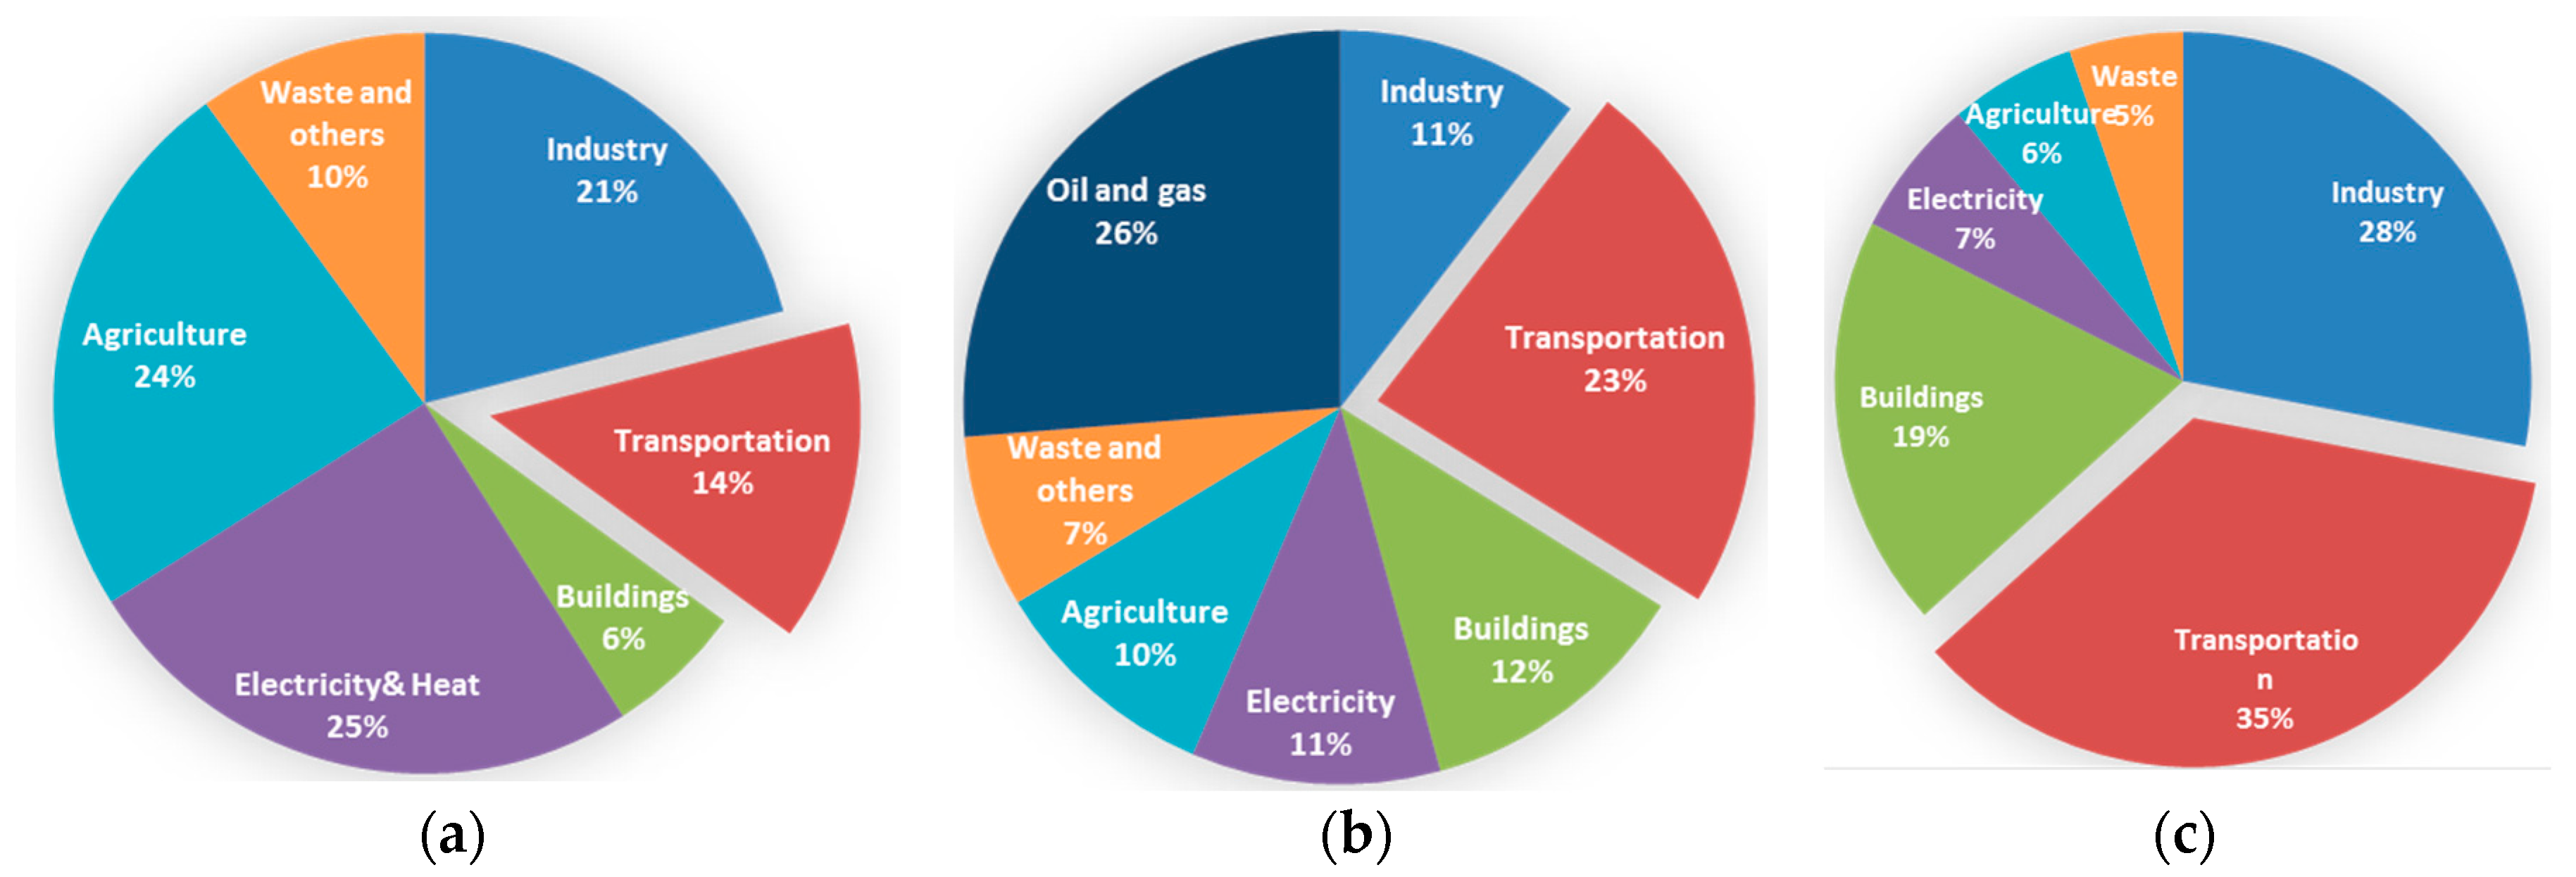
Globally, the transportation sector accounts for 14 percent of the world’s GHG emissions (Figure 1a) [1]. In Canada (Figure 1b), the decarbonisation of this sector will be necessary, as of 2013, its emissions account for 23% of the country’s GHGs [5]. In 2016, Canada formally committed to reducing its GHGs by 30% below 2005 levels by 2030; to achieve this, emissions need to decrease between the 200–300 million tonnes (Mt) from projected levels, depending on economic growth and the intensity of emissions [6]. The 30% target means removing more than the equivalent of all emissions from today’s cars and trucks (including off-road vehicles). Currently, the transportation sector is Ontario’s highest contributor of GHG emissions in Ontario, with output equal to 170 Mt GHG emissions for 2014 (Figure 1c) [7,8]. According to the Environmental Commissioner of Ontario, the transportation sector has been the biggest hurdle to achieving the 2020 GHG reduction target of the agreement [9]. Ontario has succeeded in achieving a modest 2014 target, largely through emission reductions in the electricity sector: by the closure of coal plants, the refurbishment of nuclear reactors, reduction in manufacturing activity and the addition of renewables to the electricity supply mix. Coal plant closure alone put Ontario on track to eliminate 30 Mt of GHG emissions in 2020, compared to a business-as-usual scenario [10].
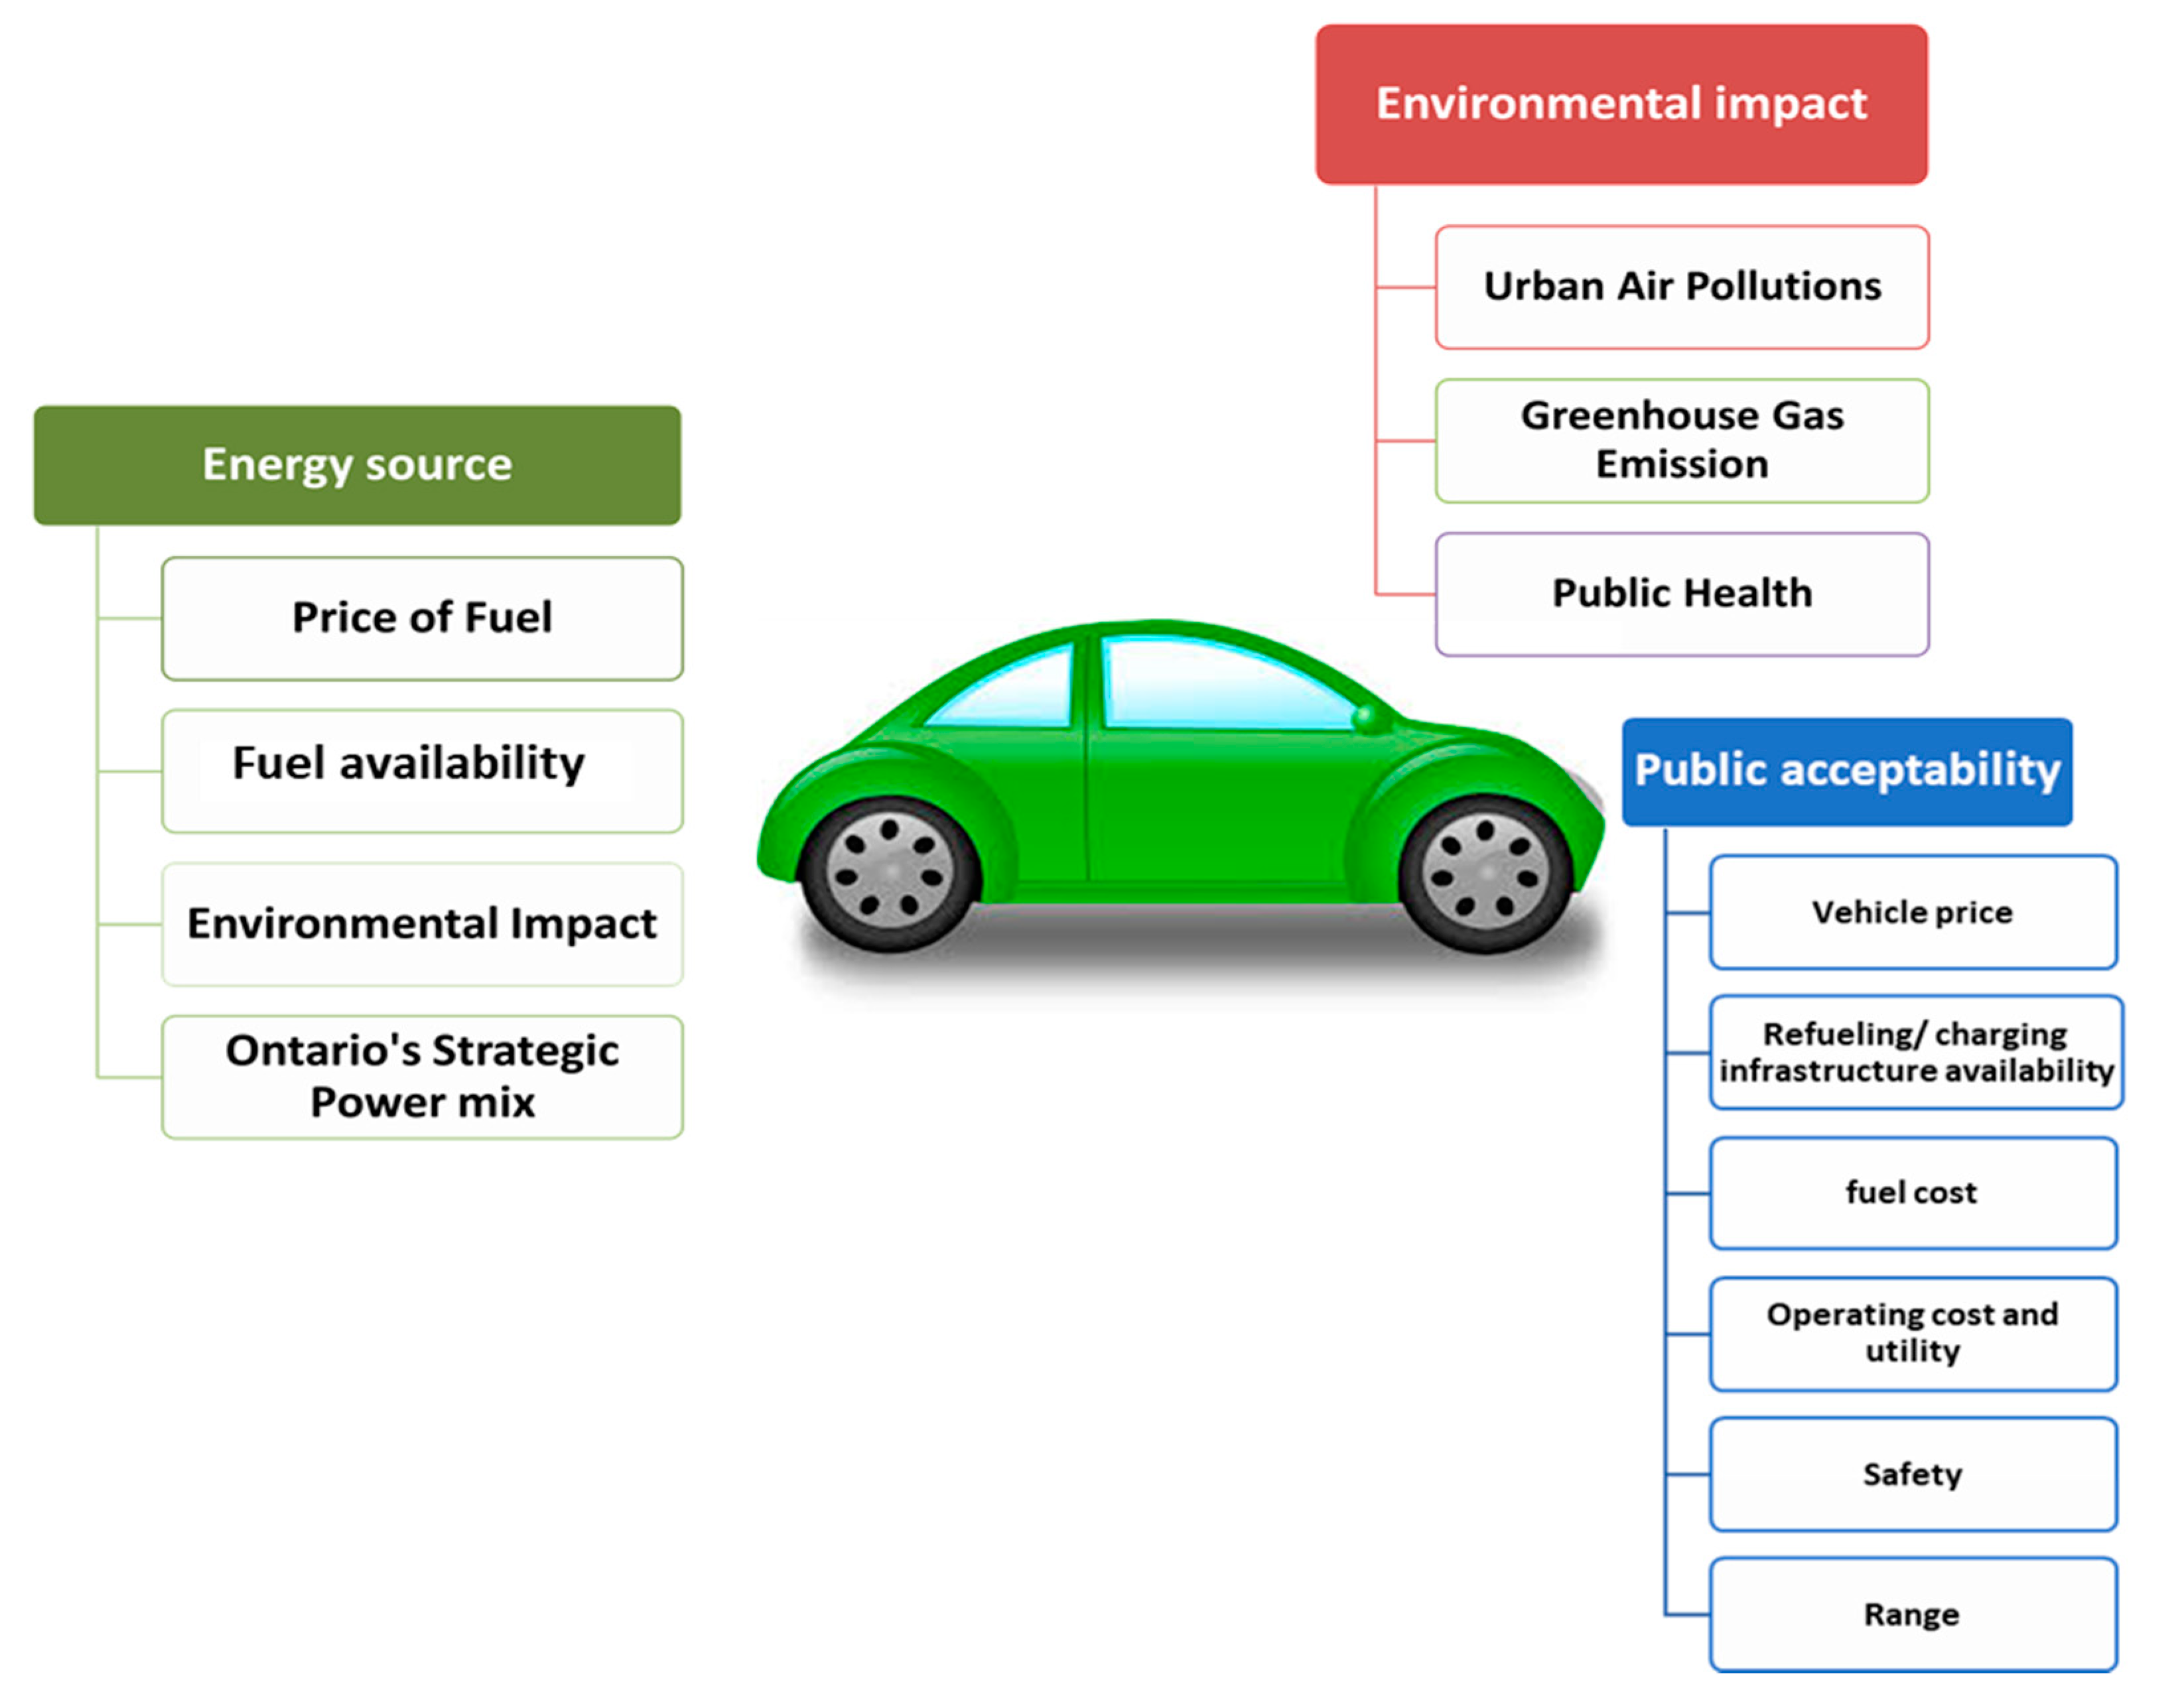
The key issues to consider when assessing new vehicle technologies in Ontario are the environmental impact of vehicle technologies, well to wheel sources of energy, as well as public acceptance of the utility of the vehicle (Figure 2) [11,12]. BEVs/FCVs can reduce urban air pollution but only if their sources of energy are low-carbon, such as nuclear or renewable energies, including hydro, solar and wind sources [13,14]. Gasoline, diesel, hydrogen and electricity are energy vectors for different types of light-duty vehicles. To illustrate, gasoline and diesel can be produced from oil resources or, to a limited extent, with some renewable content, while hydrogen is currently mostly produced from natural gas steam methane reforming but in the future, can be produced from the electrolysis of water. The electricity for electric vehicles can come from the power grid, where the electricity may be produced from fossil fuel, nuclear, or renewable energy sources. The main points influencing the public acceptance of these vehicles are operating and fuel cost, safety, refueling time, performance and overall fuel economy. The fuel economy and emissions of Internal Combustion Engine Vehicles (ICEVs) are improving but such improvements are limited by the petroleum source of energy. Vehicle design options that significantly affect the emissions from ICEVs include vehicle class and weight, driving cycle, fuel composition and engine exhaust after treatment, vehicle age and maintenance standards. Another important factor affecting fuel economy and which impacts all types of vehicles is driving behavior, such as vehicle speed and driver aggressiveness [15]. A key point related to public acceptance is refueling/recharging infrastructure as well as charging time and fuel availability.
Strictly defined, a ZEV emits no harmful or GHGs from the onboard source of power; however, for the purposes of this paper, a PHEV that operates within its charge-depletion range is considered to operate as a ZEV in that range. Moreover, a FCV is a zero-emission vehicle since there is no harmful emission from on-board fuel. In this work, the well-to-wheel perspective is considered in that the electricity used to recharge the battery pack or produce the hydrogen must be generated from renewable or clean sources such as wind, solar, hydroelectric, or nuclear power. If ZEVs are recharged from electricity generated at a fossil fuel power generation plant, these emissions must be considered. For hydrogen generated from a plant operating in “power-to-gas” mode where the hydrogen is generated only when the grid emission factor is near zero this goal is very achievable [16]. However, for a BEV without controlled charging, especially in a jurisdiction like Ontario, this work will show that these vehicles are not really ZEVs when a well-to-wheel perspective is considered. Thus, the incentives for public charging and refueling stations should consider when this infrastructure will be used and what the likely source of the incremental electricity will be used to power vehicles at this time. The power-to-gas concept allows the times of generation and of refuelling to be decoupled.
1.2. Contribution of the Research
This work focuses on infrastructure policy considerations in the transition to zero-emission light-duty vehicles. There is a clear recognition that the transition of heavy-duty vehicles, such as Class 8 trucks with a gross vehicle weight exceeding 14,969 kg, from diesel to natural gas, electricity, or hydrogen can significantly reduce GHG emissions in the short term [17,18,19]; however, this work focuses on incentives for the infrastructure for light-duty vehicles. Morrison et al. estimated the cost of BEVs and FCVs for short-term and long-term to find the future market for each technology [20]. Kontou et al. [21] investigated the societal cost of replacing ICEVs with BEVs. Miceli and Viola [22] investigated the feasibility of the green recharged area for the electric vehicles and Hardman et al. [23] conducted a comprehensive review of consumer preferences and interactions with electric vehicle charging stations. Although there are many studies analyzing driving behaviour of electricity-based vehicles along with real world data on energy usage, in this work, we study the impact of the utility factor of plug-in hybrid vehicles on the vehicle’s GHG emissions reduction. Furthermore, the utility factor can be adjusted by the vehicle owner based on usage of the electric or gasoline engine. This is a rough estimation. Our future work will involve a detailed analysis based on real data.
Note that challenges in expanding the use of Zero-Emission Vehicles (ZEVs) vary from location to location, the number of considerations is unique to each jurisdiction. Many include the mixture of power generation capacity and the availability of each technology; energy supply mix, electricity distribution infrastructure and grid stability; public and private vehicle charging or refuelling infrastructure; government incentives for vehicles and infrastructure; as well as public awareness. These points must be evaluated by the development of strategies to realize the barriers and opportunities, in order to get the maximum benefits of zero-emission vehicles. Canada and specifically Ontario, have made some progress compared to previous years in the deployment of zero-emission vehicles and transitioning to a low-carbon transportation sector. This paper investigates infrastructure policy considerations arising from the deployment of zero-emission vehicles in Ontario. The impact of the electricity supply mix in supporting zero-emission vehicles is investigated in terms of energy consumption and the potential for the reduction of GHG emissions with a transition to ZEVs. Then the effect of driver “utility factors” on GHG emission is studied. The barriers to and opportunities related to Ontario’s C$20 million-incentive for electric charging infrastructure are assessed and the effective numbers of Internal Combustion Engine Vehicle (ICEV) reductions that could result are calculated. The results are compared to those with FCV-refueling infrastructure. Also estimated is the reduction in ICEV numbers that would result from the government spending this amount on hydrogen refueling stations. The limitations and policy considerations related to Ontario having 1.7 million electric or plug-in hybrid vehicles by 2024 are investigated, as is the influence of driving behaviour on vehicle selection and issues related to public charging stations.
A number of studies have focused on about the well-to-wheel analysis of future automotive fuels [24]. Woo et al. analyzed the differences in GHG emissions associated with BEVs in multiple countries according to their electricity generation mix [25] and Ke et al. conducted a well-to-wheel emission analysis and pollution control study of BEVs for Beijing comparing the with GHG emissions of ICEVs [26]. In addition to analyzing of the effect of electricity supply mix on the GHG emissions of different types of vehicles in Ontario, this paper discusses the infrastructure policy options for the deployment of zero-emission vehicles in Ontario. Unique to this work is the comparison between electric-vehicle charging infrastructure and hydrogen refueling stations in terms of effective GHG emission reduction.
The paper achieves the following milestones:
- Different scenarios are defined to study the impact of electricity supply mix on the GHG emissions of different types of vehicles, including, BEVs, PHEVs and FCVs in Ontario;
- Assuming that about 1.7 million electric or plug-in hybrid vehicles may be on the road by 2024, the annual GHG emission avoidance for these BEVs/PHEVs is derived;
- The effect of utility factor for PHEVs in Ontario and the impact of driver behavior on BEVs/PHEVs charging are studied;
- Hydrogen refueling stations versus electric vehicle charging infrastructure are compared and the resulting reduction in numbers of Internal Combustion Engine Vehicles is calculated.
1.3. Ontario’s Policies to Enable Zero-Emission Vehicles
Ontario has been providing incentives for potential emission reduction in the transportation sector since 2010 [27]. In December 2015, the province released a Climate Strategy, which specified that the government will promote the uptake of plug-in hybrid vehicles by ensuring access to affordable and fast public charging, updating vehicle price incentives, making the green plate program permanent and reducing emissions through the use of automated vehicles [10]. It is not the objective of this paper to examine incentives for the power train, that is, vehicles themselves, or to do detailed comparison of fuel cell vehicle versus electrical vehicle power trains but to focus on incentives for the related supporting infrastructure for the two types of vehicle power train options. The province announced C$20 million for fast charging Level 3 stations and Level 2 stations to be built by March 2017. In March 2016, the government of Canada announced C$62.5 million over two years to support infrastructure for charging stations and also tax incentives for electric car charging stations. Moreover, Ontario released its Climate Action Plan, which aim to achieve at least 1.7 million electric and hybrid cars in use by 2024, take seven million gas-burning vehicles off the road by 2030 and ensure that, by 2050, 80% of residents use public transit, walk or cycle to work [27,28,29]. In April 2017, the Canadian government announced C$1.6 million in support for two hydrogen refuelling stations in the Greater Toronto Area, establishing a new Canadian market for fuel-cell vehicles. In 2017, Ontario had a surplus of off peak nuclear and wind power, which led to it exporting electrical power at loss and curtailing power generation from wind and nuclear assets. There is thus a capacity for hydrogen generation or electric vehicle charging in off-peak periods [30].
2. Zero-Emission Vehicles
Practically, a BEV is the simplest form of automotive design, with a power train consisting of a battery, ‘power electronics and electric motor. A PHEV can operate in a battery pack charge-depletion mode and thus might have a certain emission-free range based on its model in addition to an ICE that provides range extension [11].
FCVs use hydrogen to power a fuel cell and are thus also zero-emission vehicles that make no contribution to urban air pollution. Similar to BEVs, if the hydrogen is produced using electricity from nuclear, hydro, wind or solar sources, FCVs contribute minimal GHGs over the life cycle of the energy use.
There were 7.7 million light-duty vehicles registered in Ontario in 2014, which is about a third of the vehicles in Canada and they consumed 16 billion liters of gasoline (40% of Canada’s share) [31,32]. As of 31 March 2016, 6505 battery and plug in hybrid electric vehicles are on the road in Ontario [7]. The Ontario electric-vehicle or PHEV fleet is dominated by the Chevrolet Volt (27%), various Tesla models (28%) and Nissan leaf (14%) [33]. Table 1 compares the basic different features of these vehicles.
Although BEVs have the potential to help reduce GHGs by removing tail pipe emissions, factors such as range anxiety continue to pose hurdles for existing and future BEV users [35]. The lack of available ‘refueling’ options leaves them concerned about being stranded [36] and therefore, the availability of public charging infrastructure plays a critical role in addressing range anxiety and attracting new BEV drivers. Enhanced infrastructure may further reduce emissions from existing BEVs as well and allow PHEV drivers to increase their total all-electric range. Based on current vehicle range, a secondary gasoline-powered vehicle in needed to achieve greater emission free range. Thus, BEVs are typically used for short distances, in urban, sub-urban locations, where infrastructure is more readily available [37]. With enhanced infrastructure, existing owners can use their BEVs for longer trips and realize further emission reductions as they can avoid using their petroleum powered vehicles [38,39,40]. The source of electricity to charge their batteries is a function of the time of day and the overall generation profile that provide electricity to the grid. In Ontario, during off-peak period electricity generally comes from nuclear, wind and hydro, while during periods of peak demand, natural gas turbines are used as supplement any source.
FCVs can truly have zero-emissions on a well-to-wheels basis when fuelled with hydrogen produced by nuclear, hydro, wind or solar sources. Notably in the context of Ontario’s electricity supply, if hydrogen is produced using clean sources of energy, it can be used as a vehicle fuel at any time of day. This decoupling of hydrogen generation from fuelling from time of use and location is an attractive feature for maximizing Ontario’s clean electricity fleet. Currently, three fuel cell vehicles are commercially available, namely Toyota Mirai, Honda Clarity and Hyundai Tucson [41].
Hydrogen as a flexible and near- zero-emission energy vector has various applications for all the energy sectors [42]. It can be produced from different resources, including, renewable energies as well as fossil fuels [43,44,45]. Note in Ontario, the electricity utility infrastructure may not support transportation by electric vehicles without costing upgrades to the transmission and distribution systems, so both FCVs and BEVs will be needed in the long term [16].
Energy storage concepts such as ‘Power-to-gas’ with hydrogen energy storage could significantly contribute to the country’s energy management needs, make use of current natural gas infrastructure, improve emissions and provide a transition to a hydrogen economy [16,17,18,19,20,21,22,23,24,25,26,27,28,29,30,31,32,33,34,35,36,37,38,39,40,41,42,43,44,45,46]. Low cost off-peak surplus electricity can be converted to hydrogen, which can be used by various applications such as industry or transportation (Figure 3). If the hydrogen is not required immediately, it can be stored for later use. Moreover, hydrogen can be injected into the natural gas network, at a maximum volume concentration of up to 5% [47,48]. Power-to-gas systems have been proven in a number of demonstrations, primarily in Europe [48].
Using power-to-gas in transitioning concept to a hydrogen economy represents a grid-level demand management paradigm shift that will significantly improve efficiencies, making the transition to a fossil-free economy more manageable based on Ontario’s significant nuclear, hydro and wind assets [29]. The energy storage capability of Power-to-gas producing hydrogen via electrolysis can be leveraged to achieve many benefits: offsetting seasonal generation and demand differences; allowing for the efficient use of generation as well as transmission and distribution assets now and in the future; eliminating the need for peak hour generation by providing distributed generation with clean hydrogen and providing auxiliary services to the grid. Most importantly, the development of electrolysis-generation capacity allows for the phase in of hydrogen transportation options in light-duty vehicles and rail [49].
3. Ensuring That Electricity Supply Mix Can Support Zero-Emission Vehicles (ZEVs)
Clean transportation systems result in opportunities for GHG emission reduction by a wide range of stakeholders across different sectors. Although zero-emission vehicles such as BEVs and FCVs have no tail pipe emissions, their sources of electricity may generate emissions. To illustrate, if BEVs are charged with an electricity supply mix from a source that has relatively low-carbon emissions or FCVs are fuelled with the low carbon sources of electrolytic hydrogen produced from nuclear, wind or solar sources, the benefits of further emission can be recognized in decarbonisation [50,51]. However, if they are charged or refuelled with a high carbon electricity supply mix, the environmental benefits of these vehicles are significantly reduced. Not only is a clean electricity supply mix significant in the national reduction of GHG emissions, it is critical in promoting the adoption of a clean transportation sector.
The electricity supply mix can be thought of as the “fuel” for electric vehicles. Consequently, it is critical to consider the “life cycle” emissions of a vehicle. However, this fact does not mean that more-carbon-intensive supply mixes should not be considered for BEVs. To fully recognize the decarbonisation potential of BEVs, more-detailed emissions analysis should be done. More specifically, because the electricity supply mix changes over different hours as a result of on-peak electricity demand and renewable energies, analysing the time for BEV charging is of great importance to overall emission reductions [52]. Note that the focus of this paper is mainly on the energy requirements for vehicle operation and not those for vehicle manufacture.
As described in Ontario’s 2013 Long Term Energy Plan, the province intends to refurbish eight nuclear units and increase renewables as well and will continue to use natural gas and hydro. Hence, it is transitioning to a low-carbon electricity sector, making its optimum scenario to urge BEV and FCV strategies and consequently, to gain the overall green electrification of its transportation sector. In the short and medium term, Ontario is forecasted to continue to curtail power and sell significant quantities of clean power (principally off-peak nuclear and wind power at certain times of the year) that is a loss to other jurisdictions.
Impact of Electric Vehicles on Future Electricity Grid
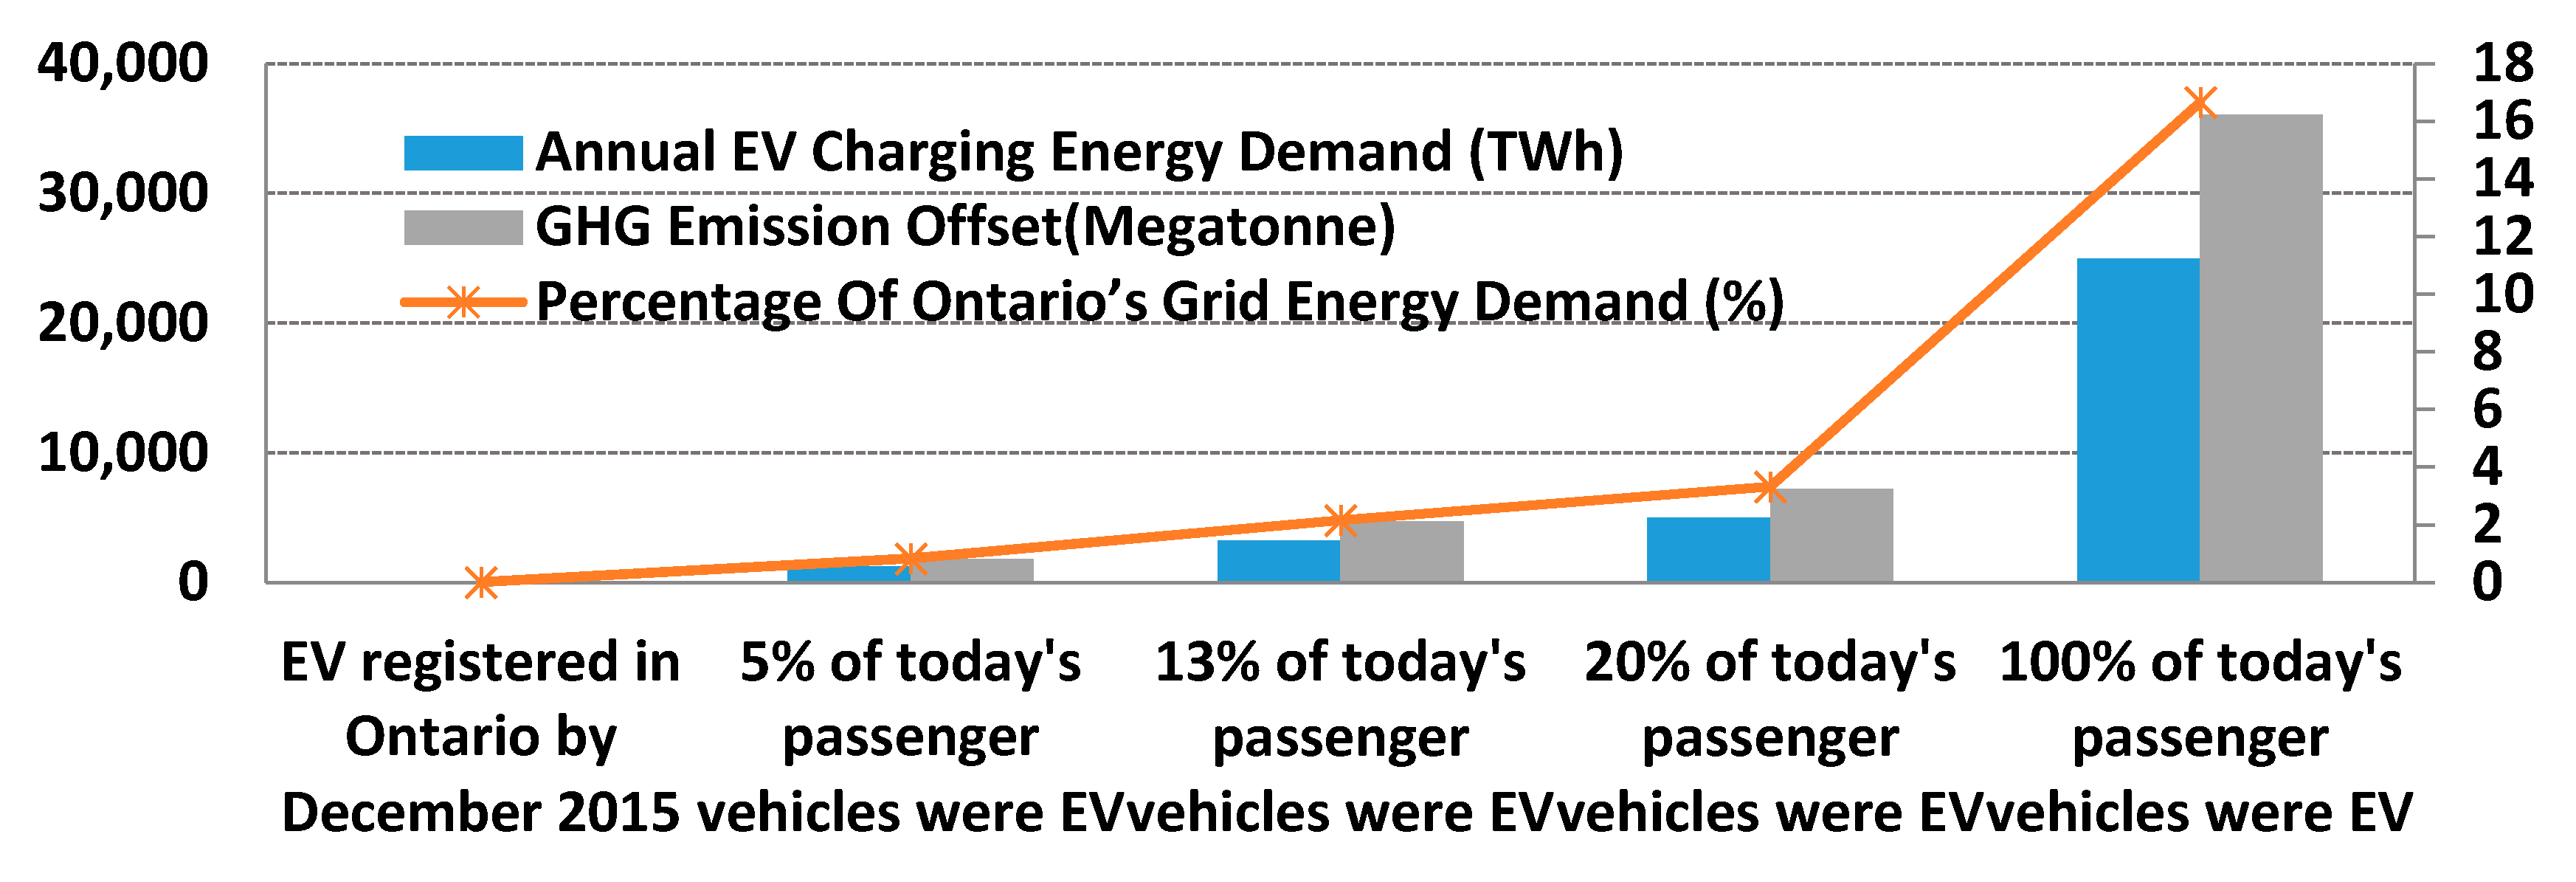
The impacts of future EV penetration on Ontario’s electricity demand forecast are shown in Figure 3. According to the Independent Electricity System Operator (IESO)’s sample scenario, one million BEVs would require about 3 TWh electricity each year, representing 2% of Ontario’s grid demand. The bigger impact will be on peak demand, an issue which may be largely handled by time of charging and control of charging by local distribution companies (LDCs).
4. GHG Mitigation by Near-Zero-Emission Vehicles
The GHG emissions of different vehicles per 100 km driving are estimated based on the following equations. Equation (1) is the GHG emission estimation for ICEVs, while Equations (2) and (3) are those for BEVs and PHEVs. The GHG emission for FCVs is presented in Equation (4).
where, Efe and are the CO2 emission factors associated with each unit of electricity and gasoline consumed, respectively. Fuel economy is a distance traveled based on the unit amount of fuel consumed and UF is the utility factor related to the ratio of vehicle distance travelled by the battery to that distance travelled by the internal combustion engine [54]; UF is assumed to be a variable to find the optimal performance of PHEVs compared to ICEVs. is the charging rate of batteries and it is assumed that 80% of battery capacity will be charged during each event [55]. is the amount of electricity consumed to generate one kg of hydrogen. Table 2 presents parameters and variables in the mentioned equations.
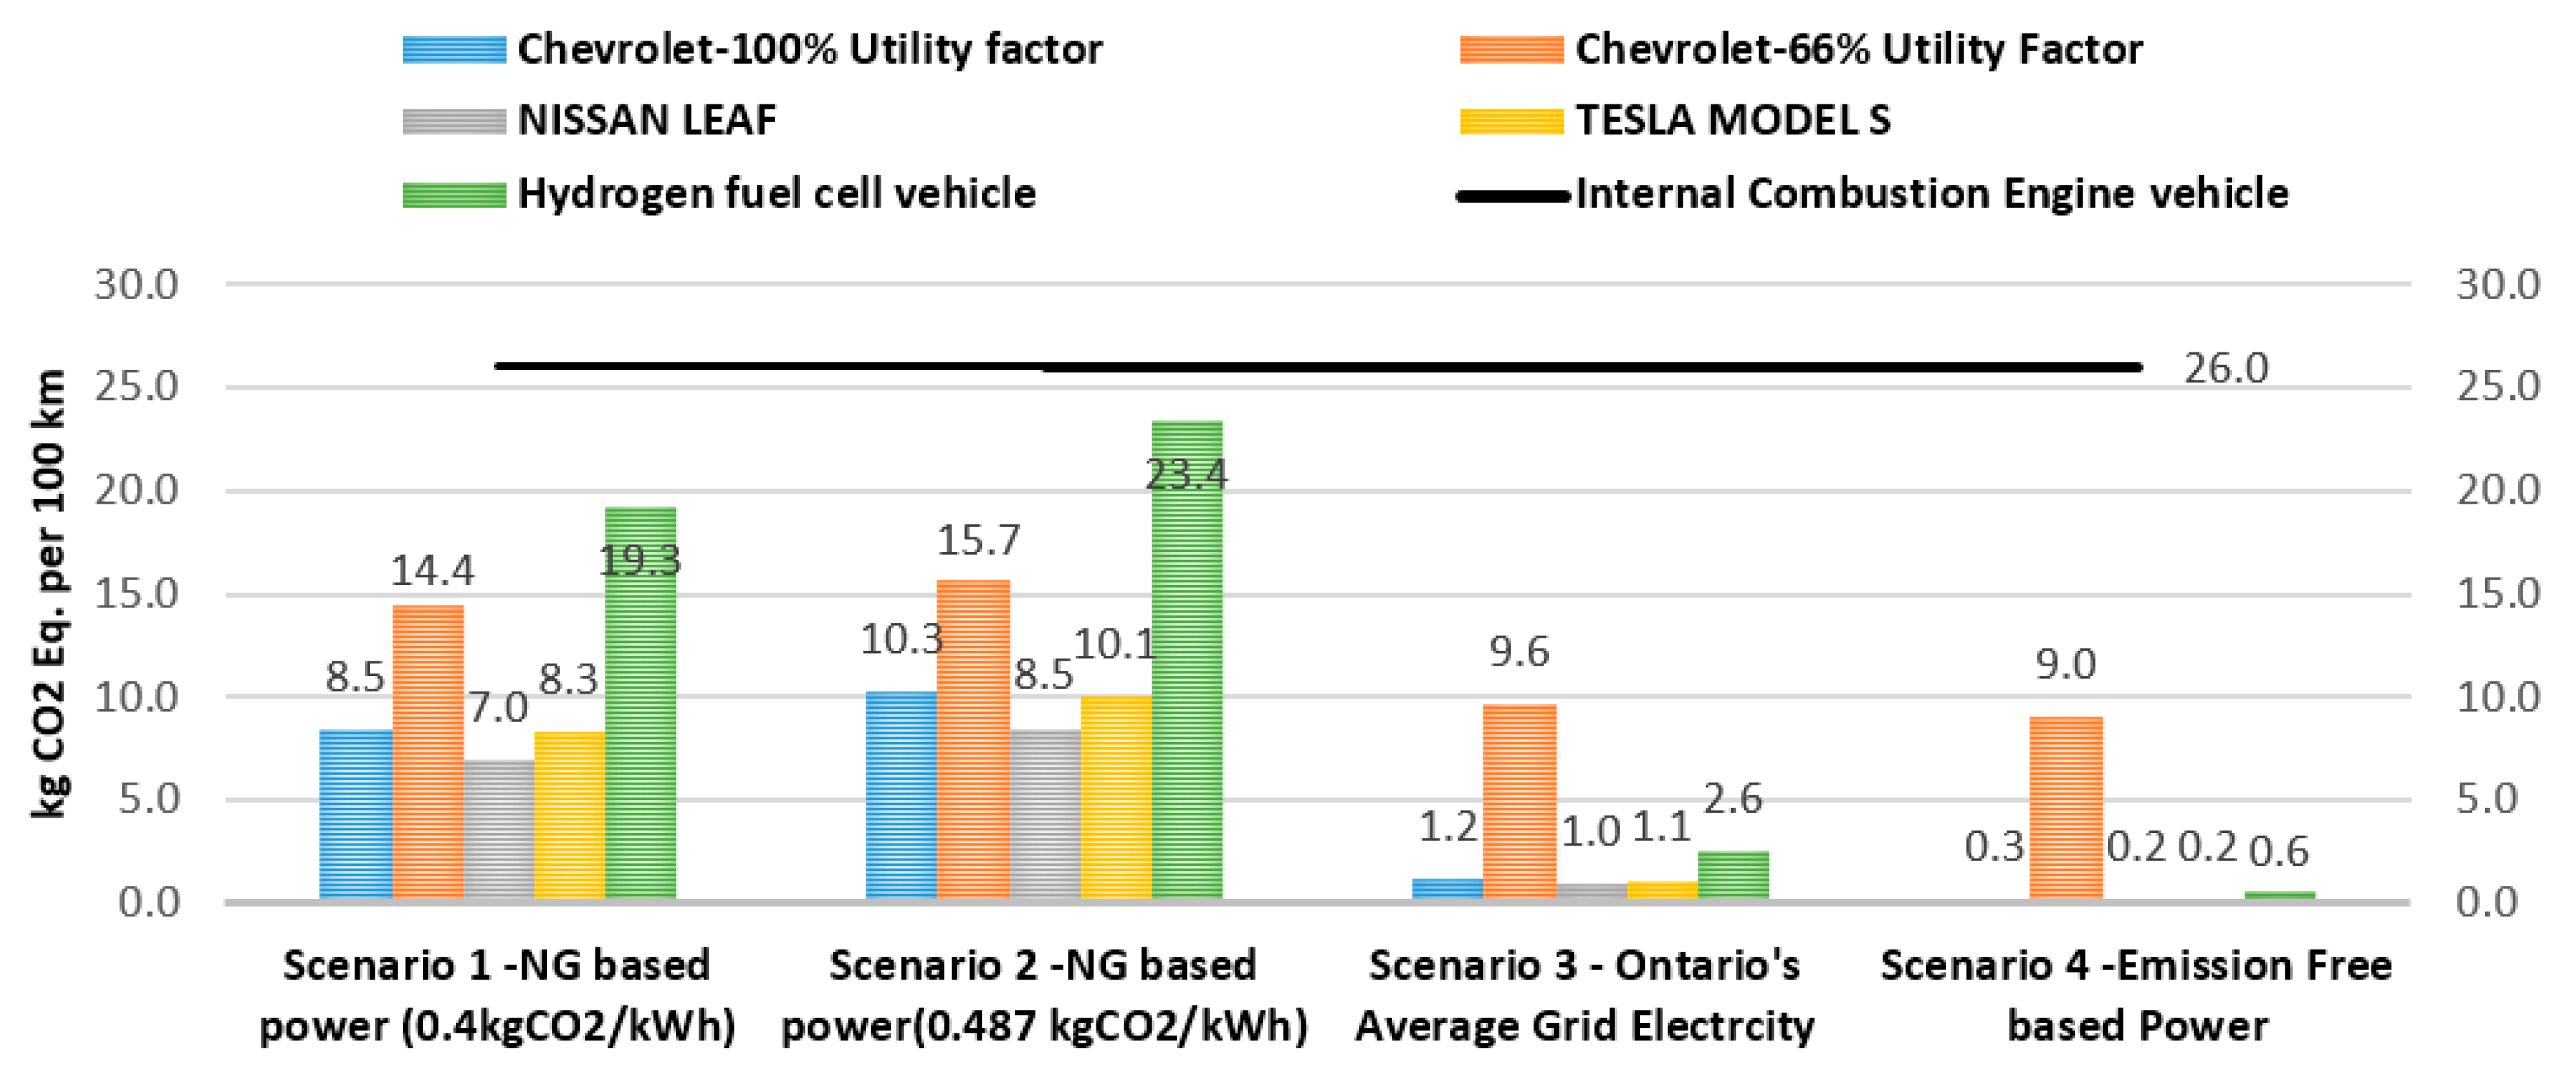
In order to find the CO2 emission avoidance and electricity consumption by electric vehicles, four scenarios are defined next. In Scenarios 1 and 2 all electricity comes from natural gas power generation systems, which are working mostly during on peak hours. So, it is assumed that if a vehicle is to charge during peak periods, a natural gas power plant would have to be ramped up to accommodate the additional load. In Scenario 3, the average mix of Ontario’s electricity grid is considered and in Scenario 4, it is assumed the electricity comes from a CO2-free nuclear or wind power plant, which prove the bulk of off-peak power generation in Ontario (Emission-free based power). The life cycle Greenhouse Gas emission factor of the natural gas fired electricity generation in Ontario is assumed to be in the range of 400 to 487 kg CO2 eq. per MWh [56,58], while that of Ontario‘s net electricity is considered to be 56 kg per MWh [51] for 2015. The net electricity is the mixed of generated power from nuclear (~60%), hydroelectric (~24%), natural gas (~10%), plus solar and wind (6%) in Ontario. The low-emission factor is principally due to the high availability of nuclear and hydro power.
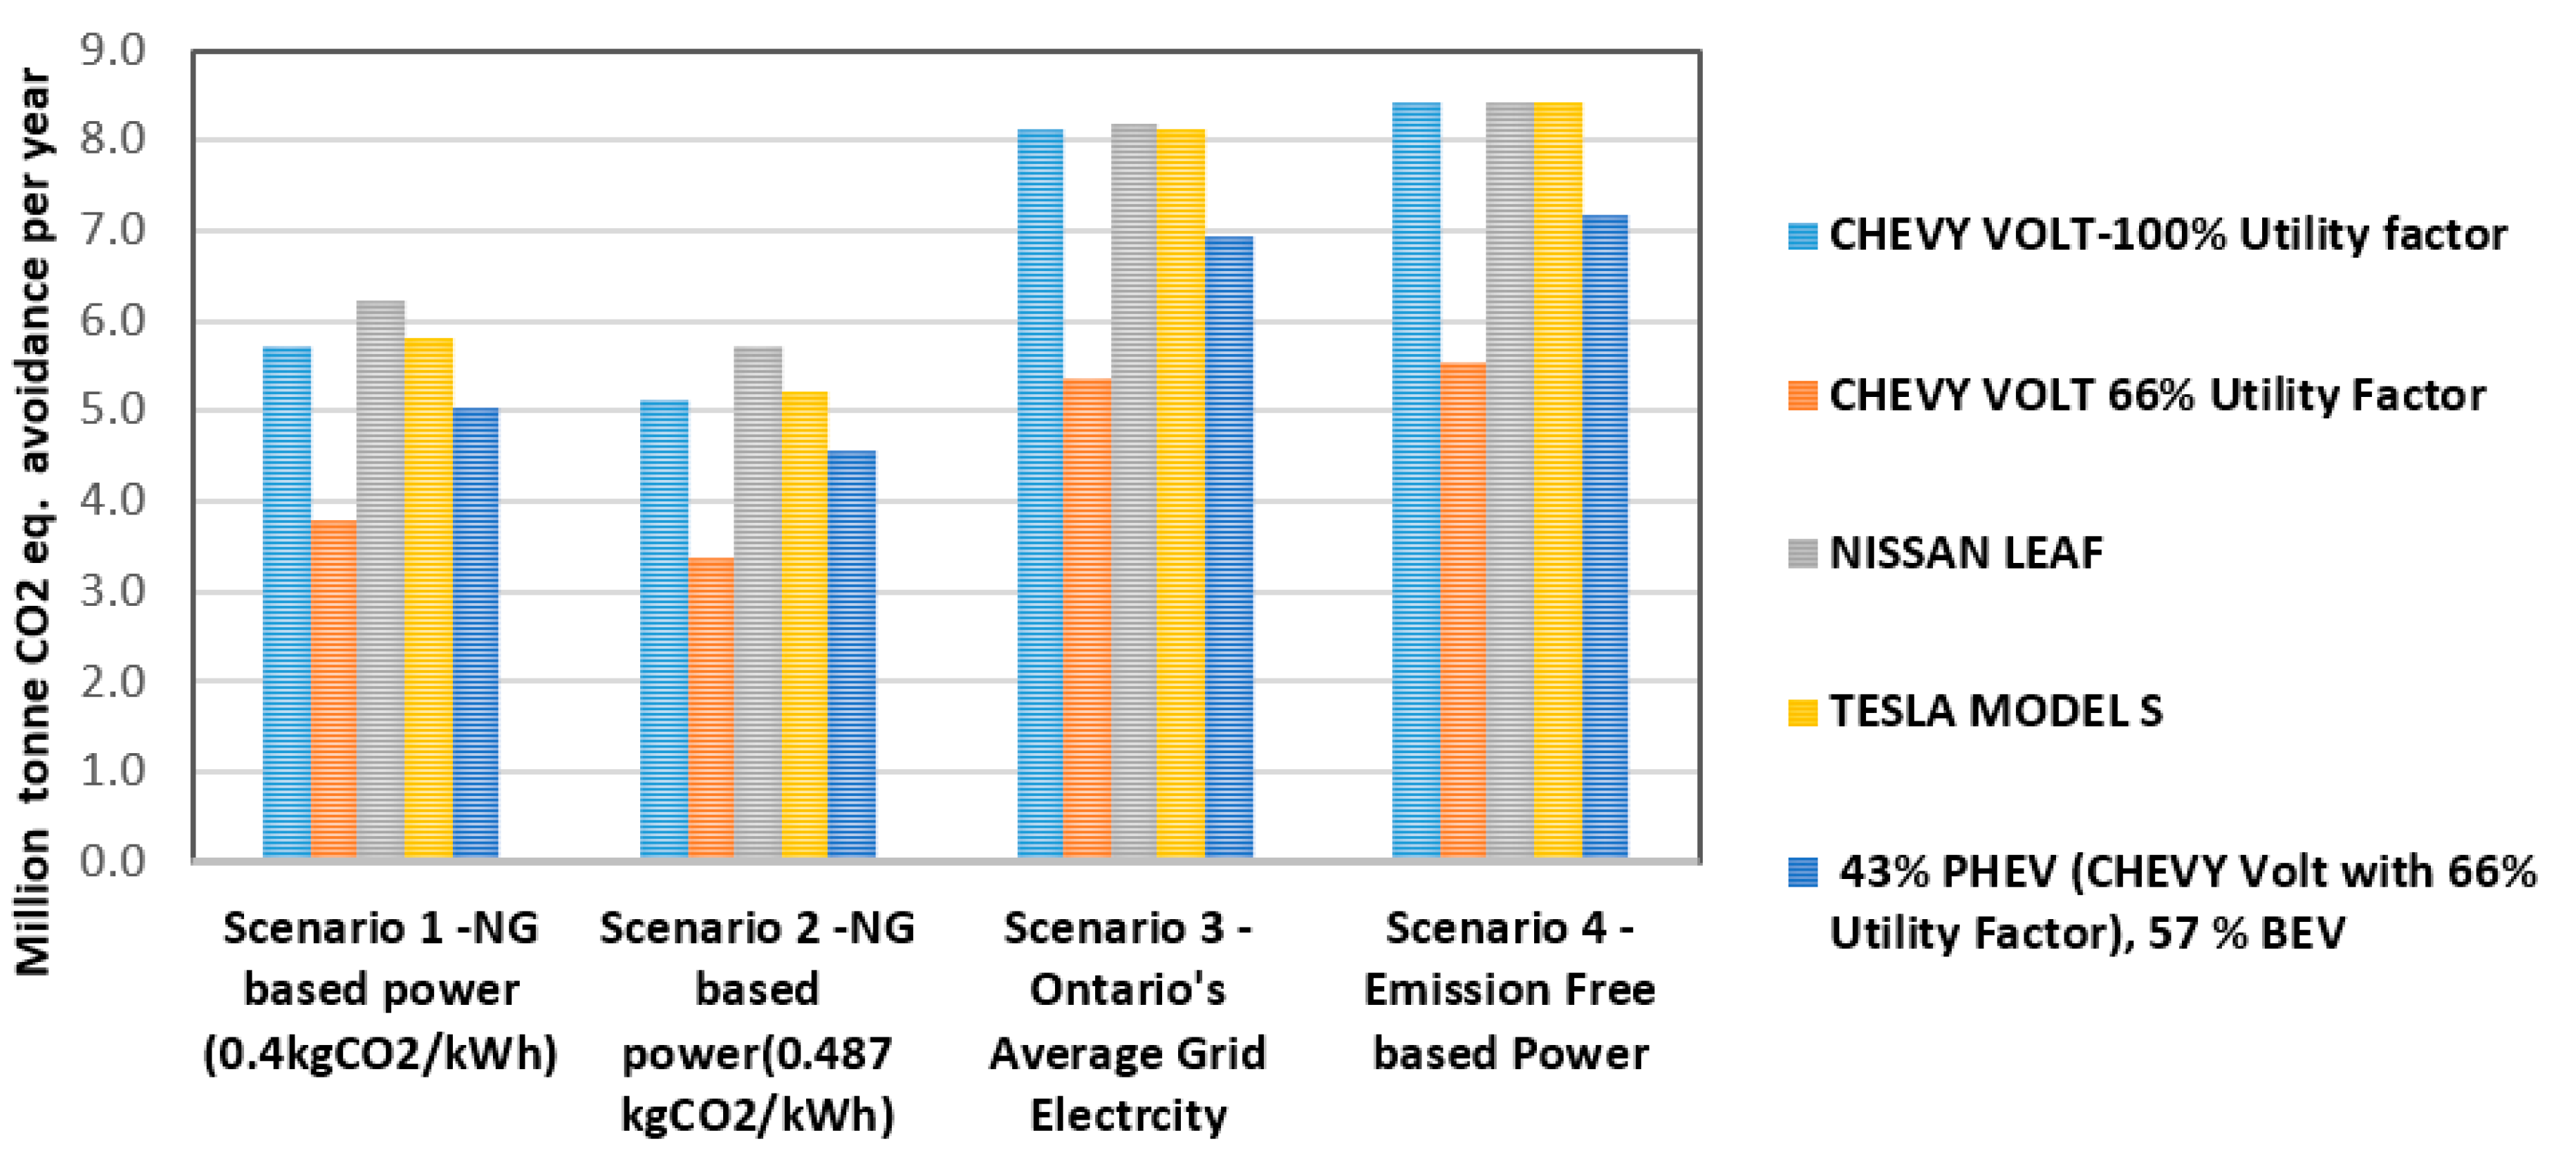
Figure 4 shows the GHG emission of different electric-based vehicles according to the defined scenarios. The utility factor of the Chevrolet Volt is considered to be 66% [59].
Figure 4 shows that the lower the GHG emission of electricity sources, the less difference between vehicle emissions, indicating that using natural gas for electricity generation results in more GHG emissions compared to the other energy supply mixes. Therefore, the time of charging has a direct correlation with the CO2 emissions of electric vehicles in Ontario, because natural gas power plants ramp up in on-peak hours to supply on-peak demand; however, using electricity in off-peak hours for BEVs curtails the GHG emissions.
As can be seen in Figure 4, FCVs produces more emissions than electric vehicles in the various scenarios. However, their time of charging is very short (less than three minutes) [60] compared to BEVs (at least 1–6 h). If one uses off-peak electricity, the emissions will be lower than those for BEVs, unlike when charging EVs in on-peak hours. In scenario 1 and 2, the well to wheel emissions for hydrogen FCVs are based on using natural gas power plants to run an electrolyser. If hydrogen were generated by the steam methane reforming of natural gas, it would be more efficient and much less expensive and the GHGs emitted would be lower. Hydrogen generated via a power-to-gas scenario would all be generated from emission-free sources, as the electrolysers would not be operated unless the grid is emission free and hydrogen could be stored, daily and weekly or even seasonally to ensure CO2-free sources of electricity. This type of emission-free generation of hydrogen in Ontario via power-to-gas has been demonstrated in a number of studies [16,42,47].
The environmental benefit related to BEVs corresponds to the gasoline consumption of Internal Combustion Vehicles (ICEVs) which is displaced. The gasoline consumption of a conventional vehicle fleet is calculated by considering the fuel consumption of one single vehicle that is assumed to be typical each member of the fleet. A typical ICEV has a fuel economy of 22 miles per gallon [61], which is equal to 9.3 kg of GHG emissions. Assuming a typical light-duty vehicle travels 12,000 miles annually, the CO2 emission of an ICEV is around 5 tonnes per year, while those of the PHEV/EVs are estimated in the following figure based on different scenarios. Using PHEV/EV can reduce the GHG emission by more than 50% compared to ICEVs.
Considering the total of about 1.7 million electric or plug-in hybrid vehicles by 2024 [62], which is equal to 22% of today’s passenger vehicles, the total CO2 emission avoidances for different scenarios are derived based on Equation (5).
Equation (6) presents the number of ICEVs which is displaced from the road in terms of GHG emission reduction. Considering the electricity powered by natural gas, the CO2 emission avoidance is around 5.7 Mt for BEVs, which is equal to the removal of 1.1–1.3 million ICEVs and 3.6 Mt CO2 eq. for PHEVs, which corresponds to the removal of 0.7–1.2 million ICEVs. Note that higher utility factor of PHEVs is a key indicator to use lower gasoline and therefore to achieve lower emissions. Based on scenario 4 (Emission free based power), the annual GHG emission avoidance is around 8.4 million tonnes (Mt) CO2 eq. for BEVs, which is equal to 1.7 million Internal combustion engine vehicles (ICEVs) removal and 5.6 Mt CO2 eq. for PHEVs, which corresponds to 1.1–1.7 million ICEVs removal. Assuming the distribution of 43% PHEVs and 57% BEVs for the vehicles in Ontario [33], the GHG avoidances are 5 Mt for the first and second scenarios (based on natural gas), which is equal to the removal of one million ICEVs and around 7 Mt for the third and fourth scenarios, which corresponds to the removal of 1.5 million ICEVs (Figure 5).
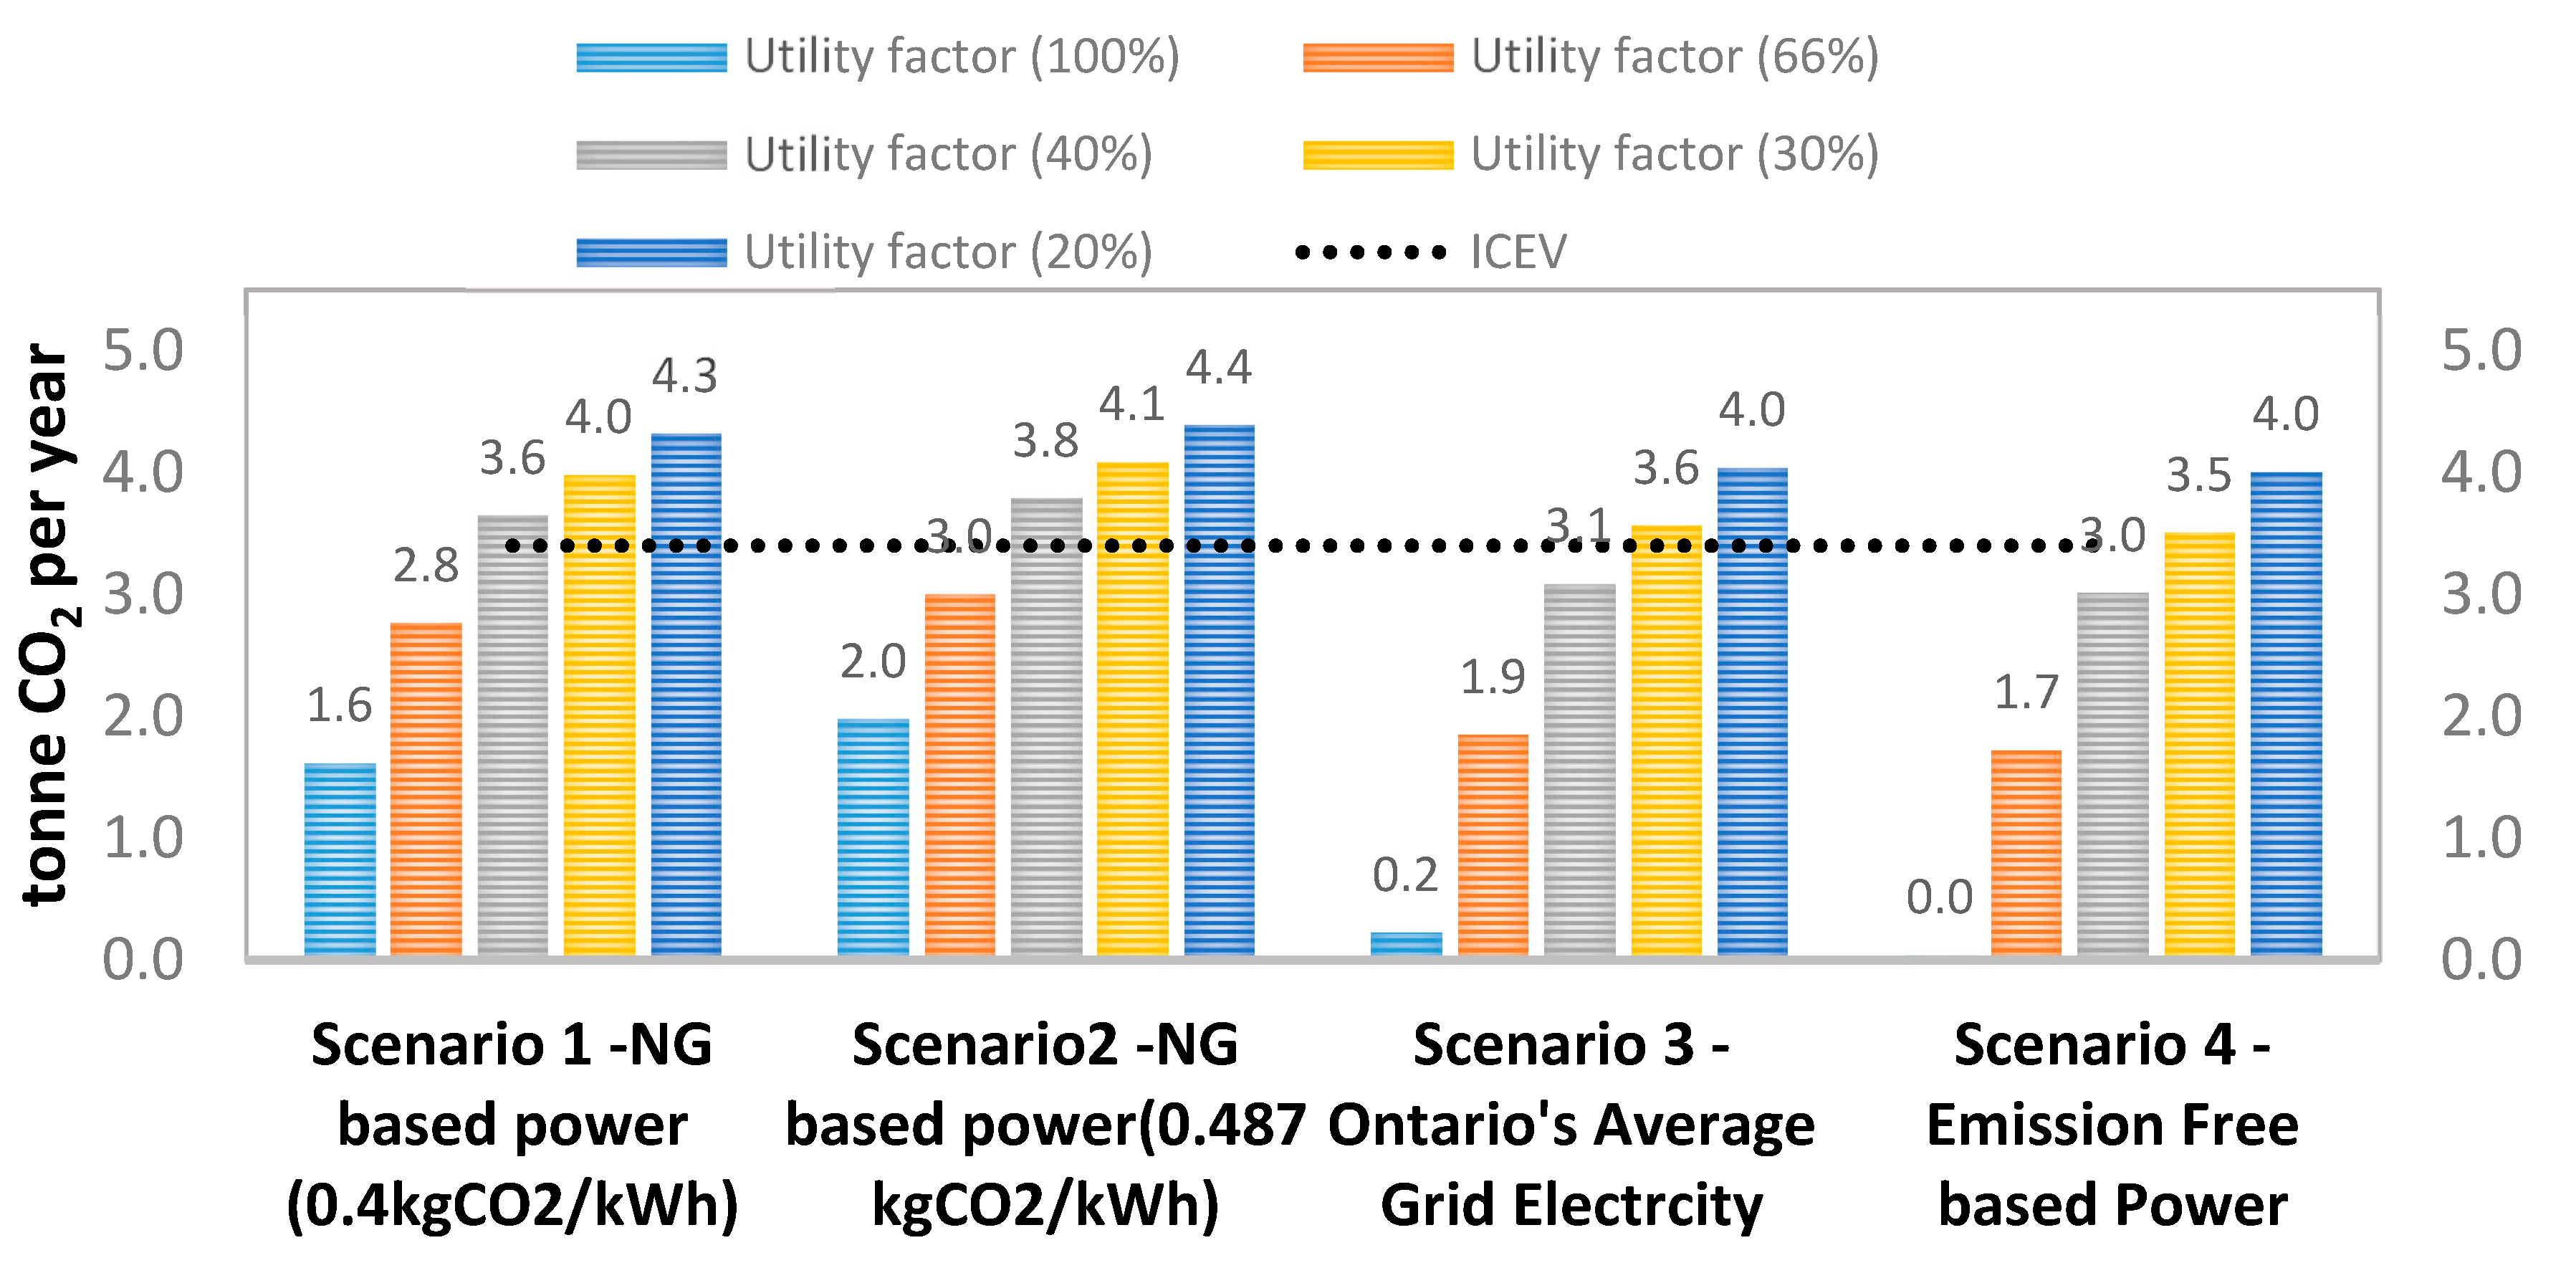
4.1. The effect of Driver’s “Utility Factor” for PHEVs in Ontario
The utility factor is important for CO2 avoidance in PHEVs, as shown in Figure 6. A comparison between a gasoline Chevy Cruse and PHEV Chevy Volt shows that to reduce GHG emission, the utility factor should be more than 40%, assuming that the CO2 emission from the gasoline Chevy Cruse is around 3.2–3.6 tonnes CO2 per year [63], because the PHEV Chevy Volt is a much heavier vehicle. However, the GHG emission of a PHEV Chevy Volt depends on the power sources and utility factor; using the electricity grid or clean power based nuclear energy can generate 1.7–3 tonne CO2 per year within the range of 40–66% utility factor. Using power based on natural gas power plants can generate 3–4.5 tonne CO2 per year for a range of 66–40% utility factor, which is in the range of ICEVs. Using PHEVs, the utility factor should be more than 40%. Figure 6 presents the GHG emissions of Chevy Volt vehicles based on different utility factors. The black dotted line presents the GHG emission of the Chevy Cruse. This result assessment of driver behaviour via vehicle telemetrics is very important to electric vehicle selection [33].
4.2. Policy Consideration
Each PHEV will save between 2 (power based on natural gas) and 3.5 (grid power mostly based on nuclear) tonnes CO2 per year, considering an average of 66% utility factor. Each BEV will save between 3 (power based on natural gas) and 5 (grid power mostly based on nuclear) tonnes CO2 per year. Moreover, each FCV will save between 0.3 (power based on natural gas) to 4.7 (grid power mostly based on nuclear) tonnes CO2 per year.
CO2 emission saving is highly dependent on the use of the vehicle, source of electricity, when emission factors change throughout the day and the time of day for charging. Note, the greatest emission reductions will be achieved with the use of off-peak nuclear and/or wind power and there is generally clean energy available from base-load off-peak power in Ontario. There is currently enough excess baseload capacity off-peak to refuel early penetration of electric vehicles but it is critical that the vehicles charge during off-peak periods; otherwise, the benefits of CO2 reduction are reduced. Thus, the promotion and development of public charging stations that will be used during the day should not be encouraged if CO2 reduction is critical. Mainly, if there is a need to ramp up natural gas power plants (i.e., on-peak periods) to accommodate the increased load to charge BEVs, then there is much less benefit. In the very long term (beyond 1 million vehicles), there may be a need to add additional clean generation capacity and nuclear power is the only CO2 free technology that can provide the power capacity required, especially during key charging periods (e.g., nights in the summer when wind and solar offer little contribution to the grid).
Furthermore, this analysis also leads to the following observations.
If Ontario has an understanding of emission reduction, some type of vehicle-use assessment is required and it should be done prior to the customer actually selecting a vehicle for purchase. Simply, the customer must purchase the right vehicle for their specific driving habits, or their “utility factor.” It is recommended that the purchased subsidies to be offered by the government should be linked to such an assessment and the results should be shared with the government, for example, expected emission reductions.
In addition, charging of vehicles must be well-managed; if vehicles charge at peak periods when natural gas power plants may be ramped up to meet this demand, there is much less emission reduction benefit. Thus, allowing electricity distribution utilities to control or track charging is critical, even though it will require some further technological development. Also, in order to ensure that “clusters” of electric vehicles do not overly disrupt local distribution infrastructure, these utilities should at least be informed of potential increased local load.
5. The Effect of Electricity Consumption for Different Types of Vehicles in Ontario
The annual power required by BEVs/PHEVs is calculated based on Equation (7).
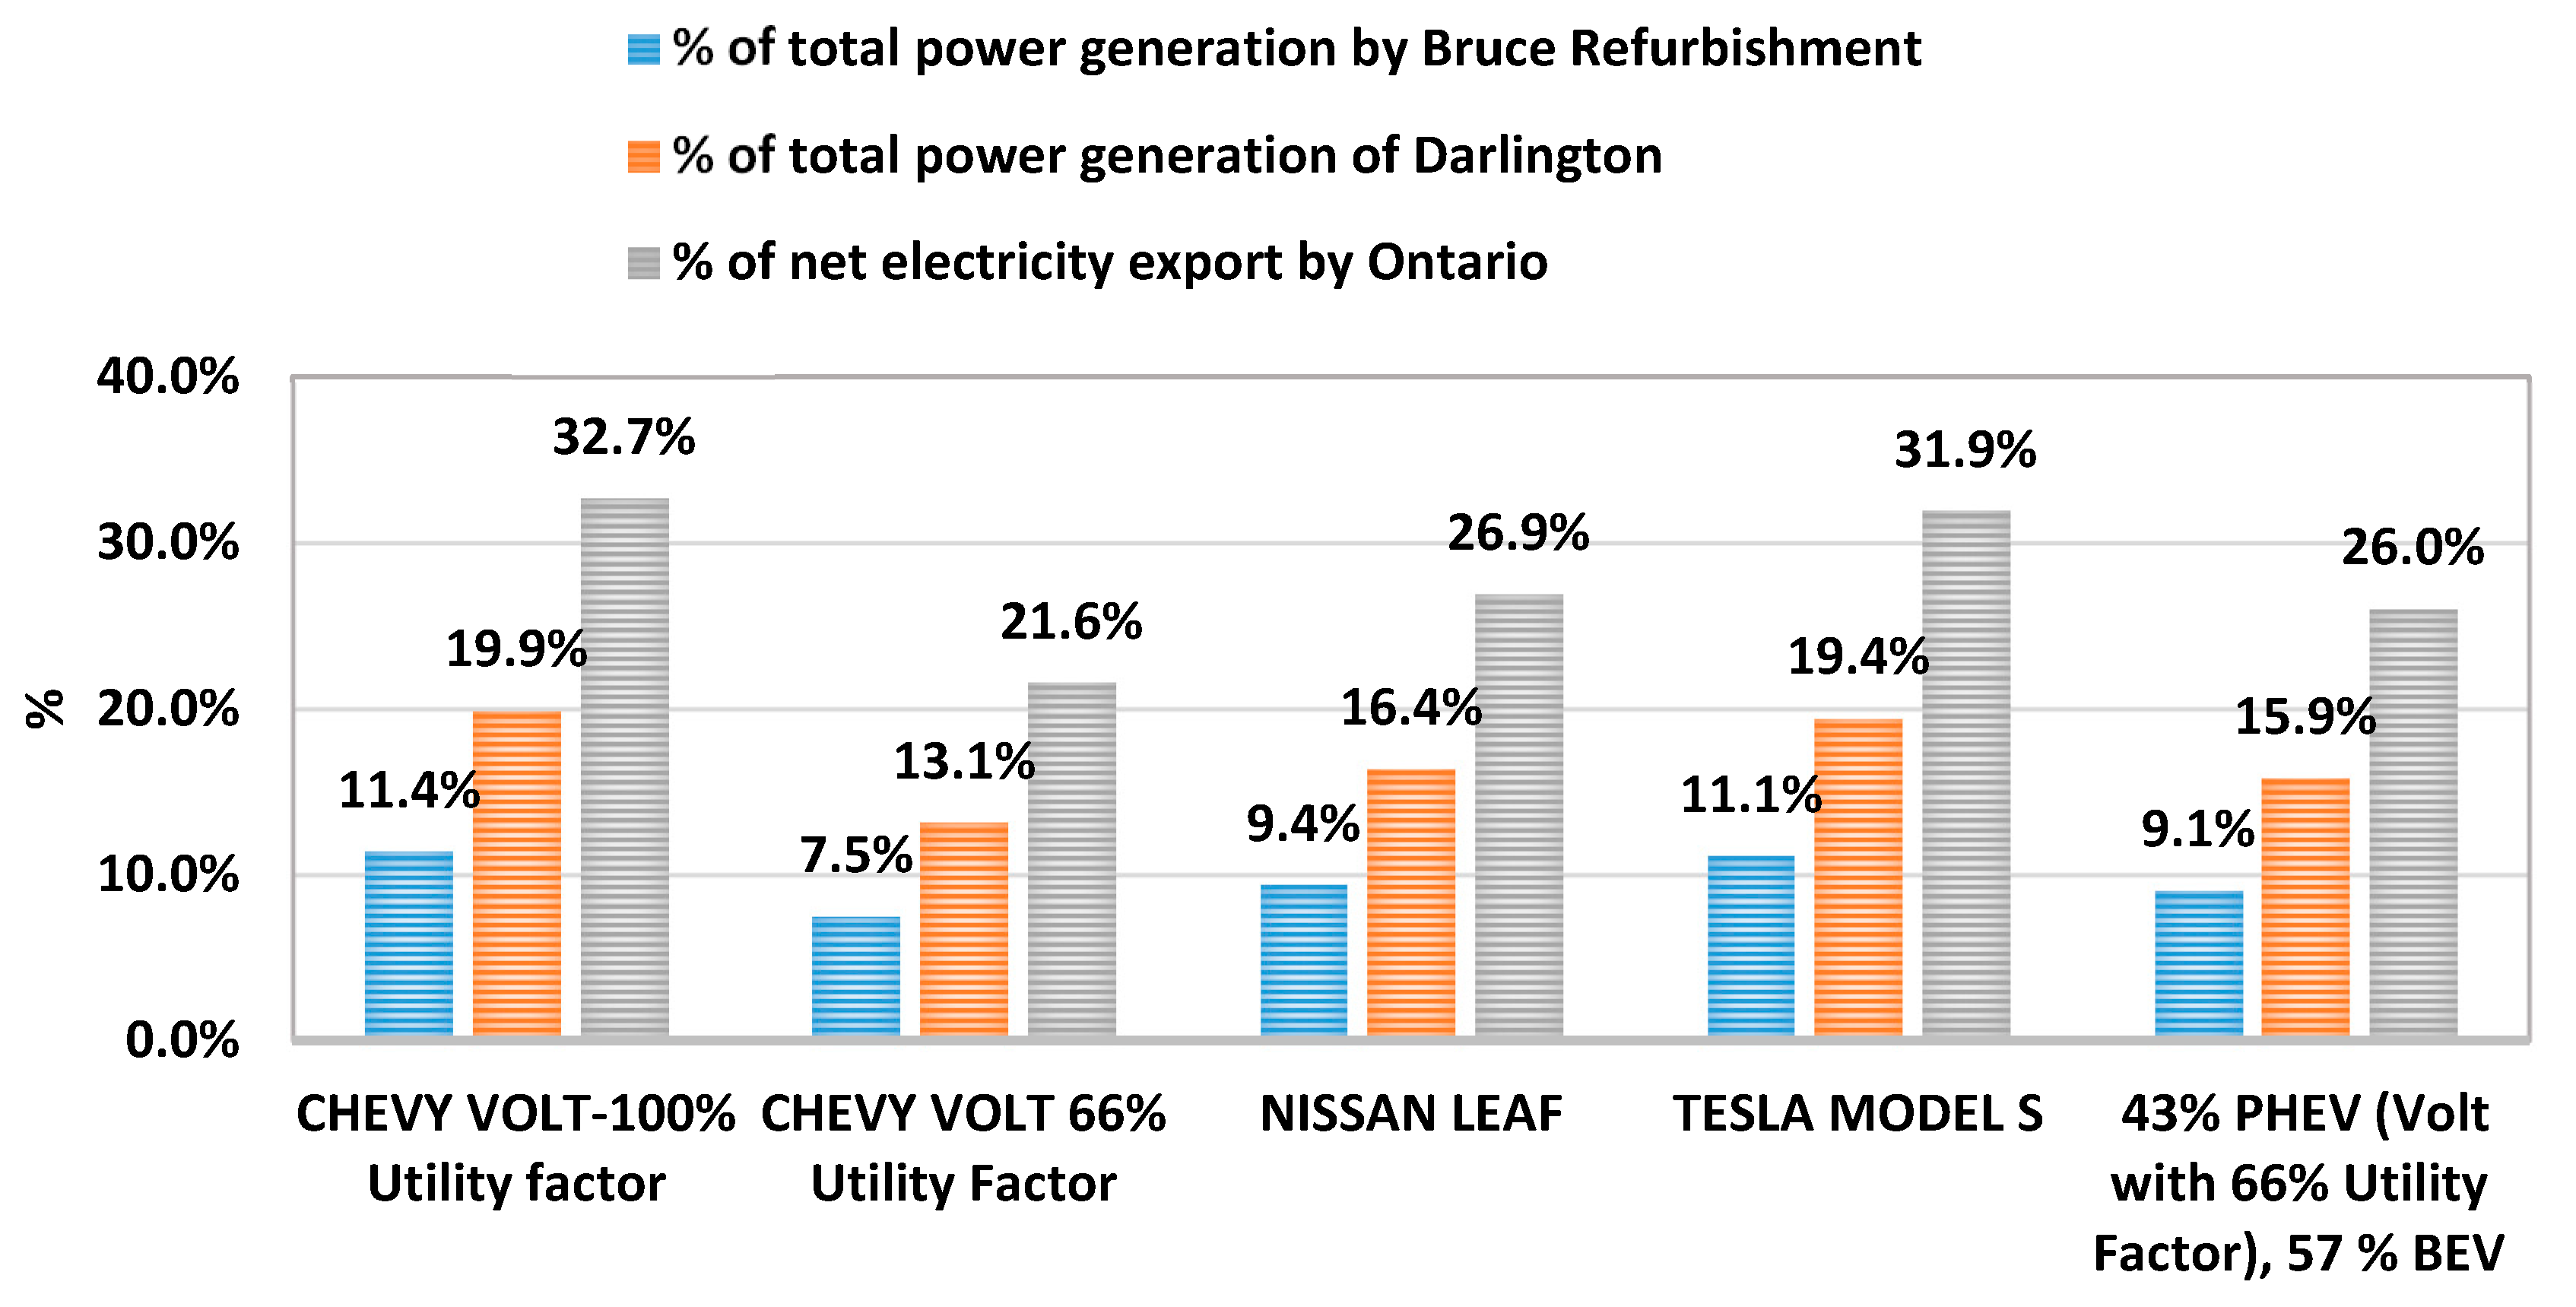
As described by the 2013 Long Term Energy Plan and implemented in December 2015, the province is refurbishing six nuclear units on the Bruce peninsula and plans to refurbish four more at the Darlington site [53]. Note that the predicted output of Darlington, considering its four 881 MW units and a capacity factor of 90%, is 27,783 GWh power generation, annually. Moreover, 48,565 GWh electricity generation will result from 6300 MW of power from the Bruce refurbishment, assuming the capacity factor of 88%. Ontario’s net export was around 17 TWh in 2015 [53]. Thus, Ontario has sufficient clean electricity available for ZEVs at this time.
The results derived from Equation (7) show that the electricity requirement of BEVs/PHEVs should be in the range of 4500–5500 GWh, which is equal to 9–11% of the Bruce refurbishment or 13–19% of Darlington’s power generation capacity, or 21–32% of the net electricity exported from Ontario (Figure 7).
For PHEVs and BEVs to contribute to reducing Ontario’s GHGs there must be zero-emission power generation capacity available; nuclear power and wind power, both refurbishment and new nuclear, are critical to move Ontario towards a clean transportation sector.
Currently, 17 TWh of electivity net are exported from Ontario. This electricity could service around 5–8 million PHEV and BEV each year. However, this would require increased research and development on communications and control with respect to charging times. Using cheap export electricity in Ontario for EVs could not only reduce the GHG emissions but also, decrease the cost of constructing future power plants to supply the increasing demand of BEVs. However, this energy must be stored for on-peak hours. This low-cost surplus exported electricity could not converted to hydrogen as a storage medium which can be useable in FCVs when and where they need it, or could be converted to electricity for BEV/PHEVs but only if a BEV is under a control charging mode.
6. Hydrogen-Refuelling versus Electric-Vehicle-Charging Infrastructure
In 2016, Ontario’s government set up a program to invest C$20 million of public funding to build 280-Level 2 and 213-Level 3 (DCFC) public charging stations over many locations in Ontario. The C$20 million Electric Vehicle Chargers Ontario (EVCO) grant program [64] has an effective reduction of ICEVs in terms of emission. Note that this cost does not include any investment that may be required of the LDC to support charging stations, which could be very significant. Assuming each Level 2 charging station can fuel two BEVs and every Level-3 can charge 10 BEVs per day, then this incentive program can totally charge 2690 EVs every day. If Ontario’s electric vehicle mix is 43% of PHEVs (Chevy Volt with 66% Utility Factor) and 57% of BEVs and assuming that BEVs must charge every 3 to 7 days, the province electric vehicle infrastructure will be able to support 11,000 PHEV/BEVs.
Assuming that there were to be an equal C$20 million investment incentive support program for hydrogen refueling stations, the capacity of refueling station are calculated based on the following equations. (Equation (8)). The capital cost of H2 refueling station with an onsite electrolyser is estimated based on two scenarios including refueling station high-cost and low-cost estimation [65]. The onsite electrolyser station capital costs with the different capacities of 100–1000 kg hydrogen per day are assumed to be in the range of 3–9 million dollars for high-cost and 2.6–5.6 million dollars for low-cost [64]. The capacity of the hydrogen refueling station is extrapolated for C$20 million investment. The reason for considering a high-cost scenario is that the hydrogen refueling stations are very few in kind project and they are not in mass production. The number of FCVs are estimated to be 4800 for the high-cost scenario and 9800 for the estimated low-cost scenario.
The GHG emissions of FCV/BEVs are converted to the number of equivalent ICEs and the number of effective reduction in number of vehicles is presented in Equation (9).
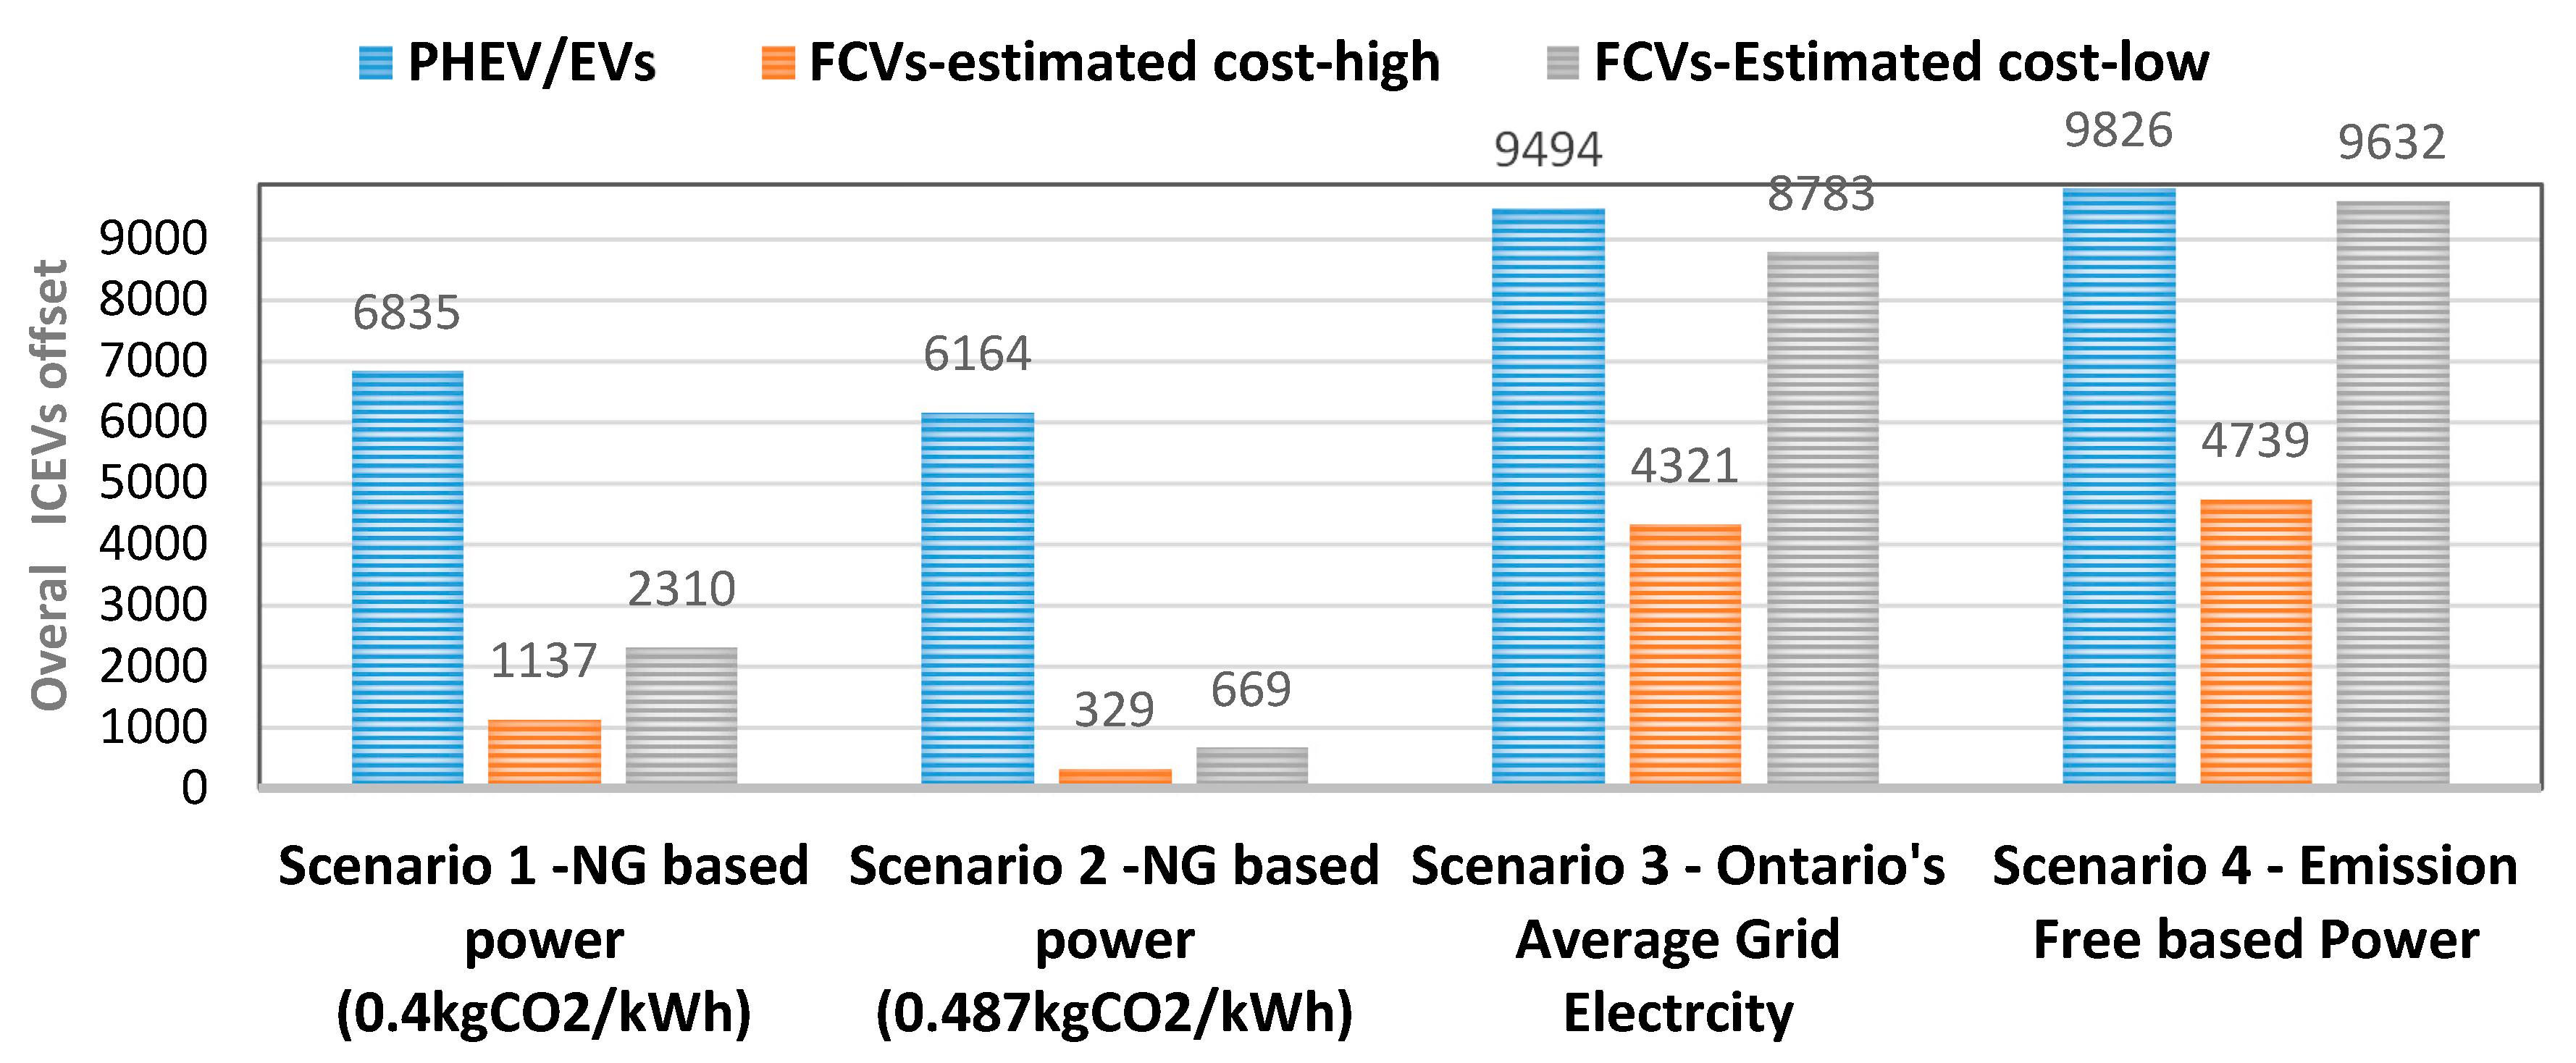
The overall reduction in number of ICEVs (Figure 8) shows that the lower the GHG emission from the electricity sources in each scenario, the greater the effective number of reduction in ICEVs. Since 57% of electric based vehicles are PHEVs, part of the emission is related to gasoline consumption in PHEVs. This number for FCVs is shown based on low-cost and high-cost investment scenarios for refueling infrastructure.
The charging station can service about 2690 PHEVs/BEVs per day. Assuming charging every 3–7 days, 11,000 cars can be charged, which is equal to a reduction in ICEVs by 6100–6800 (Electricity based on Natural gas) or 9400 (Electricity based on Ontario electricity grid) or 9800 (based on emission-free based power) Internal Combustion Engine Vehicles.
Considering the C$20 million incentives for hydrogen refueling stations, 4800–9800 FCVs can refuel, which is equal to the effective reduction of 300–2000 ICEVs (electricity based on natural gas) or 4300–8700 (Power based on Ontario electricity grid) or 4700–9700 (based on emission-free based power). Not to mention, if hydrogen were generated by the steam methane reforming of natural gas, it would be more efficient and less expensive and therefore, the effective offsets of ICEVs would be higher than when hydrogen is generated based on the electricity powered by natural gas. The reduction is greater when the power comes from renewable sources such as nuclear or wind.
At this time, the debate between BEVs and FCVs can be summarized as follows:
- BEVs have better well to wheel efficiency;
- Refuelling Infrastructure for BEVs with Level 1 and 2 charging is easy to implement, while little hydrogen refuelling infrastructure for FCVs exists in Ontario; however, long-term electricity grid upgrades would be required for the significant BEV penetrations, and/or a large number of DCFC charging stations;
- Refueling time is shorter for FCVs (3–5 min, whereas BEVs are still in the hour range);
- Currently FCVs have an advantage in durability and the life cycle of batteries but both technologies are improving rapidly;
- No vehicle manufacturer currently makes a profit on either BEVs or FCVs and the mass-produced cost of either is still unknown;
- FCVs are better for integration and support of the grid (i.e., energy where and when you need it, in the form you need it). Hydrogen production has been proven to support auxiliary electrical services. Hydrogen can provide daily, weekly and seasonal energy storage, thus supporting the penetration of intermittent renewable power generation such as wind and solar. Also, via a power-to-gas scenario all the hydrogen could be produced from CO2 free sources, whereas BEV charging during the day would result in upstream GHG emissions.
7. Discussion
In this section, some general comments about the deploying electric vehicle charging stations in Ontario are mentioned.
Requiring consumers to track their vehicle use and to complete an assessment prior to purchase of a low emission vehicle would achieve a number of other benefits:
- Consumers will then select the most appropriate vehicle for their specific use and utility factor. This may lead to higher sales of PHEVs and BEVs as customers understand their specific driver behaviour, or more FCVs for consumers who require longer ranges and faster refuelling. It would certainly promote greater customer satisfaction as the vehicle in use will meet their operational expectations and thus greater satisfaction with the vehicle and the program overall;
- The government will have a better understanding of the actual emission reduction that can be achieved with increased vehicle market penetration and can tailor vehicle incentives for specific target emission reductions (which is the actual objective). This insight may result in different incentives for PHEVs versus BEVs versus FCVs in order to achieve well to wheel GHG reductions;
- Post-purchase tracking will give policy makers a better understanding of actual emission reduction achieved and progress towards climate change goals after the vehicles come into use;
- Electricity distribution utilities will be able to track, plan and manage the development of infrastructure to support vehicle charging, thereby avoiding critical infrastructure overloading and potential damage.
Ontario urgently needs to better understand the consequences of its EVCO grant program on the distribution of energy storage infrastructure and to address the potential impact of Level 2 or 3 public charging stations on the electrical distribution system. The C$20 million program failed to consider the impact on the electrical distribution system, which may result in system disruption and the need for costly (unbudgeted) system upgrades. In fact, there may be very significant added costs to upgrade the distribution system infrastructure to support these public charging stations, or the use of public charging may result in system failures. Specifically, the impact on transformers and other electrical distribution infrastructure is inevitable with the siting of Charging Stations (Public or Private charging stations).
The duty cycle of the distribution system also fails to consider the system operating at full capacity 24 h a day. Thus, although it may appear that the distribution system has some underused capacity at nights, the overuse of this capacity will result in potential system failures. Distributed solar power generation assets may be effectively placed to both reduce daytime emissions and the load on the electrical distribution system. However, in many cases, distributed solar power generation is not of the scale to support a Level 2 or DCFC charging station and could only do so for a very limited period of time.
The emissions from public charging must be considered. Certainly, there is a significant net offset with the use of a PHEV or BEV over ICEV. However, with a PHEV, modification of the charging behaviour of the vehicle owner could significantly alter the overall user utility factor. In some cases, the use of public charging stations will significantly increase the utility factor, reducing overall emissions from a PHEV. However, in other cases, the use of public charging stations during the day will result in unnecessary emissions as natural gas power plans are ramped up to service this demand. Note that in electrical grid jurisdictions where the baseload and dispatchable power is based on coal, there is likely to be no benefit from the use of electric vehicle.
Likewise, there is a need to study driver behaviour and driver motivation for the use of public charging stations versus home-based charging. Note that, home-based charging is likely to be off-peak, or easily controlled to be off peak and more likely clean nuclear, wind, or hydro. In contrast, during the day, Public Charging will likely require ramping up of natural gas power plants and thus come with an associated emission factor. Some research into the net life cycle emission from charging behaviour is needed and then this research can be translated into public education to modify driving behaviour so as to improve future emission reductions.
Additionally, support for Level 2 and DCFC public and workplace charging stations can be considered as a support for natural gas based “transportation” power in Ontario. Thus, the electric vehicles are essentially natural gas emission vehicles (Better than gasoline but not as good as controlled off-peak power, Level 2 and DCFC does help, if there is a low electric range for PHEVs (like the Chevrolet Volt) and the driver has a long commute to work. Clean power benefits when people charge at home, that is, in off-peak hours. Therefore, governments should not overly support one technology over another at this time, until the implications of long-term technology development are better understood.
Note, the long-term market for BEVs, PHEVs and FCVs is far from settled and will likely include a blended market [22,61,66]. For example, the future market could comprise short-range light-duty autonomous BEVs and FCV light-duty sedans, buses and light trucks. Heavy-duty fleets (e.g., transport trucks, garbage trucks) could be natural gas, or hydrogen/natural gas blends [17,19].
8. Conclusions
This paper has investigated policy considerations related to the barriers and opportunities for the deployment of zero-emission vehicles in Ontario. The potential of electric and hybrid-electric power trains to enable these reductions was investigated—specifically, Plug-in Hybrid Electric Vehicles (PHEVs), Plug-in Battery Electric Vehicles (BEVs), as well as Fuel-Cell Vehicles (FCVs). The impact of the electricity supply mix on supporting zero-emission vehicles was studied based on different scenarios and the effects of driver behaviour on GHG emissions of PHEVs have been estimated.
The results suggest that using natural gas for electricity generation to charge or fuel vehicles results in more GHG emissions compared to the other mixes of energy supply. Therefore, the time of day of charging has a direct correlation with the CO2 emissions from electric vehicles in Ontario, because natural gas power plants ramp up in on-peak hours to meet the on-peak demand; however, using electricity in off-peak hours for BEVs curtails the GHG emissions. Also, the lower the GHG emission of electricity, the less the difference between BEV and FCV net emissions. FCVs produce more emissions than electric vehicles in the different scenarios. Based on Ontario’s average grid electricity emission, the GHG emissions of PHEVs are around 9.6 kg per 100 km drive, whereas those of BEVs and FCVs are around 1.1 and 2.6, respectively. The results suggest that a utility factor of more than 40% is needed to benefit from PHEVs having lower emission than ICEVs.
As calculated, the EVCO program will reduce the number of ICEVs, based on emission reduction. BEV charging stations can cover 11,000 cars, which will offset 6800 (power based on NG) to 9800 (emission free based power) Internal Combustion Engine Vehicles. Considering the C$20 million incentive for hydrogen refueling stations, 4800–9800 FCVs can thus refuel, which corresponds to an ICEV reduction of 300–2000 (power based on NG) to 5000–9700 (emission free based power) and this reduction will be greater if the power comes from renewable sources such as nuclear or wind.
The limitation and policy considerations related to using 1.7 million electric or plug-in hybrid vehicles by 2024 in Ontario have been investigated. It is critical that the infrastructure be well-planned, sustainable for the long term and realizes the intended environmental benefits. In order to address the energy-environmental challenges of future energy systems, the integration of different energy sectors including electricity and transportation systems, is required. The deployment of BEVs/PHEVs is a good option for the short term; however, FCVs are environmentally benign options for decarbonizing the transportation sectors in the long-term though Power-to-gas deployment in Ontario.
Driver behaviour in vehicle selection and issues related to public charging stations has also been discussed. BEV/PHEV charging intelligently must be managed for significant emission reductions to be achieved. If vehicles charge at peak periods when natural gas plants may be ramped up to meet this demand, there is much less of an emission reduction benefit. Thus, requiring users to allow electricity distribution utilities to control or track charging is critical but will need further technological development. To ensure that ‘clusters’ of electric vehicles do not overly disrupt local distribution infrastructure, utilities should be informed of potential increased local load.
Unique to this work is the comparison between electric vehicle charging infrastructure and hydrogen refueling stations in term of overall GHG emission reduction. Specifically, this paper has discussed the policy considerations behind the deployment of zero-emission vehicles in Ontario and provides the following contributions:
- Defines scenarios to study the impact of electrify supply mix on the GHG emission by different types of vehicles including, BEVs, PHEVS, an FCVs in Ontario;
- Derives the possible GHG emission avoidance based on the total of about 1.7 million electric or plug-in hybrid vehicles that may be on road by 2024;
- Estimate the effect of utility factor for PHEVs in Ontario;
- Compares hydrogen stations versus electric vehicle charging infrastructure and calculates the reduction in number of Internal Combustion Engine Vehicles offset.
Author Contributions
A.M. wrote the paper and carried out the entire literature review presented in this work. M.F. provided key insights throughout the course of this work especially for the discussion part.
Funding
National Science and Engineering Research Council (NSERC CRDPJ 451746-3), Ontario Center of Excellence (OCE MIS 20737).
Acknowledgments
The authors would like to thank the financial support of National Science and Engineering Research Council (NSERC CRDPJ 451746-3), Ontario Center of Excellence (OCE MIS 20737), as well as our research partners Enbridge, Hydrogenics, Union Gas, GE and Energy Technology & Innovation Canada (ETIC).
Conflicts of Interest
The authors declare no conflict of interest.
Abbreviations
| GHG | Greenhouse Gas |
| FCV | Hydrogen Fuel Cell Vehicle |
| PHEV | Plug in Hybrid Vehicle |
| BEV | Battery Electric Vehicle |
| ZEV | Zero-Emission Vehicle |
| LDC | Local Distribution Company |
| ICEV | Internal Combustion Engine Vehicle |
| EVCO | Electric Vehicle Chargers Ontario |
References
- Team, C.W.; Pachauri, R.K.; Meyer, L.A. Climate Change 2014: Synthesis Report; Contribution of Working Groups I, II and III to the Fifth Assessment Report of the Intergovernmental Panel on Climate Change; IPCC: Geneva, Switzerland, 2014. [Google Scholar]
- Moustafa, K. A clean environmental week: Let the nature breathe. Sci. Total Environ. 2017, 598, 639–646. [Google Scholar] [CrossRef] [PubMed] [Green Version]
- Intergovernmental Panel on Climate Change. Climate Change 2014: Mitigation of Climate Change; Cambridge University Press: Cambridge, UK, 2015. [Google Scholar]
- Intergovernmental Panel on Climate Change. Climate Change 2014—Impacts, Adaptation and Vulnerability: Regional Aspects; Cambridge University Press: Cambridge, UK, 2014. [Google Scholar]
- Government of Canada. Greenhouse Gas Emissions by Canadian Economic Sector. 2017. Available online: https://www.ec.gc.ca/indicateurs-indicators/default.asp?lang=en&n=F60DB708-1 (accessed on 21 January 2017).
- Office of the Parliamentary Budget Officer. Canada’s Greenhouse Gas Emissions: Developments, Prospects and Reductions. Available online: http://www.pbo-dpb.gc.ca/web/default/files/Documents/Reports/2016/ClimateChange/PBO_Climate_Change_EN.pdf (accessed on 21 April 2017).
- Environment and Climate Change, Greenhouse Gas Emissions by Sector. 2017. Available online: https://www.ontario.ca/data/greenhouse-gas-emissions-sector (accessed on 21 January 2017).
- United Nations Framework Convention on Climate Change. National Inventory Submissions 2016. Canada National Inventory Report (NIR). Annex 11—Provincial Territorial Greenhouse Gas Emission Tables—IPCC Sectors 1990–2014, Table A11-12 1990–2014 GHG Emissions Summary for Ontario. Available online: http://unfccc.int/national_reports/annex_i_ghg_inventories/national_inventories_submissions/items/9492.php (accessed on 23 May 2016).
- Environmental Commissioner of Ontario. Feeling the Heat Greenhouse Gas Progress Report 2015. Available online: http://eco.on.ca/reports/2015-climate-change-report-feeling-the-heat/ (accessed on 10 July 2015).
- Ontario Ministry of Environment and Climate Change. Ontario’s Climate Strategy. Available online: https://www.ontario.ca/page/climate-change-strategy (accessed on 29 October 2016).
- Onat, N.C.; Kucukvar, M.; Tatari, O. Conventional, hybrid, plug-in hybrid or electric vehicles? State-based comparative carbon and energy footprint analysis in the United States. Appl. Energy 2015, 150, 36–49. [Google Scholar] [CrossRef]
- Koch, A.K.; Fowler, M.W.; Fraser, R.A. Implementation of a fuel cell plug-in hybrid electric vehicle and factors affecting transportation policy. Int. J. Energy Res. 2011, 35, 1371–1388. [Google Scholar] [CrossRef]
- Maroufmashat, A.; Fowler, M. Low-carbon transportation pathways through power-to-gas. In Proceedings of the 2017 IEEE International Conference on Smart Energy Grid Engineering (SEGE), Oshawa, ON, Canada, 14–17 August 2017; pp. 353–356. [Google Scholar]
- Hawkins, T.R.; Singh, B.; Majeau-Bettez, G.; Strømman, A.H. Comparative environmental life cycle assessment of conventional and electric vehicles. J. Ind. Ecol. 2013, 17, 53–64. [Google Scholar] [CrossRef]
- Shiau, C.S.N.; Samaras, C.; Hauffe, R.; Michalek, J.J. Impact of battery weight and charging patterns on the economic and environmental benefits of plug-in hybrid vehicles. Energy Policy 2009, 37, 2653–2663. [Google Scholar] [CrossRef]
- Maroufmashat, A.; Fowler, M. Transition of Future Energy System Infrastructure; through Power-to-Gas Pathways. Energies 2017, 10, 1089. [Google Scholar] [CrossRef]
- Americas Commercial Transportation Research Co. The Future of Natural Gas Engines in Heavy Duty Trucks: The Diesel of Tomorrow? Americas Commercial Transportation Research Co.: Columbus, IN, USA, 2012. [Google Scholar]
- Paltsev, S.; Jacoby, H.D.; Reilly, J.M.; Ejaz, Q.J.; Morris, J.; O’Sullivan, F.; Rausch, S.; Winchester, N.; Kragha, O. The future of US natural gas production, use and trade. Energy Policy 2011, 39, 5309–5321. [Google Scholar] [CrossRef]
- Moultak, M.; Lutsey, N.; Hall, D. Transitioning to Zero-Emission Heavy-Duty freight Vehicles; International Council on Clean Transportation: Washington, DC, USA, 2017. [Google Scholar]
- Morrison, G.; Stevens, J.; Joseck, F. Relative economic competitiveness of light-duty battery electric and fuel cell electric vehicles. Transp. Res. Part C 2018, 87, 183–196. [Google Scholar] [CrossRef]
- Kontou, E.; Yin, Y.; Lin, Z.; He, F. Socially optimal replacement of conventional with electric vehicles for the US household fleet. Int. J. Sustain. Transp. 2017, 11, 749–763. [Google Scholar] [CrossRef]
- Miceli, R.; Viola, F. Designing a sustainable university recharge area for electric vehicles: Technical and economic analysis. Energies 2017, 10, 1604. [Google Scholar] [CrossRef]
- Hardman, S.; Jenn, A.; Tal, G.; Axsen, J.; Beard, G.; Daina, N.; Figenbaum, E.; Jakobsson, N.; Jochem, P.; Kinnear, N.; et al. A review of consumer preferences of and interactions with electric vehicle charging infrastructure. Transp. Res. Part D 2018, 62, 508–523. [Google Scholar] [CrossRef]
- Well-to-Wheels Analysis of Future Automotive Fuels and Powertrains in the European Context; WELL-TO-TANK (WTT) Report Version 4a; Institute for Energy and Transport; Available online: http://iet.jrc.ec.europa.eu/about-jec (accessed on 16 May 2016).
- Woo, J.; Choi, H.; Ahn, J. Well-to-wheel analysis of greenhouse gas emissions for electric vehicles based on electricity generation mix: A global perspective. Transp. Res. Part D 2017, 51, 340–350. [Google Scholar] [CrossRef]
- Ke, W.; Zhang, S.; He, X.; Wu, Y.; Hao, J. Well-to-wheels energy consumption and emissions of electric vehicles: Mid-term implications from real-world features and air pollution control progress. Appl. Energy 2017, 188, 367–377. [Google Scholar] [CrossRef]
- Accelerating the Deployment of Plug-In Electric Vehicles in Canada and Ontario. Pollution Probe and University of Waterloo. Available online: http://www.brucepower.com/electric-vehicle-report/ (accessed on 10 October 2016).
- Global EV Outlook 2017. International Energy Agency. Available online: https://www.iea.org/publications/freepublications/publication/GlobalEVOutlook2017.pdf (accessed on 15 June 2014).
- Brouillette, M. Ontario’s Emissions and the Long-Term Energy Plan, Phase 2-Meeting the Challenge. Available online: https://strapolec.ca/uploads/Ontarios_Emissions_and_the_LTEP_-_Ph_2_Report_Final_December_2016.pdf (accessed on 10 December 2016).
- Hydrogenics News. Available online: http://www.hydrogenics.com/2017/04/06/hydrogenics-awarded-funding-to-build-two-hydrogen-fueling-stations-for-the-greater-toronto-area-gta/ (accessed on 15 May 2017).
- Statistics Canada. Motor Vehicle Registrations; Province and Territory: Quebec, ON, Canada, 2014. Available online: http://www.statcan.gc.ca/tables-tableaux/sum-som/l01/cst01/trade14b-eng.htm (accessed on 15 May 2016).
- Statistics Canada. Sales of Fuel Used for Road Motor Vehicles; Province and Territory: Quebec, ON, Canada, 2014. Available online: http://www.statcan.gc.ca/tables-tableaux/sum-som/l01/cst01/trade37b-eng.htm (accessed on 15 May 2016).
- Fleetcarma. Electric Vehicles Sales in Canada: March 2016 Update. Available online: http://www.fleetcarma.com/ev-sales-canada-2016-q1/ (accessed on 15 May 2016).
- Plug’n Drive. Electric Cars Available in Canada. Available online: https://www.plugndrive.ca/electric-cars-available-in-canada?page=1 (accessed on 20 May 2016).
- Van Vliet, O.; Brouwer, A.S.; Kuramochi, T.; van Den Broek, M.; Faaij, A. Energy use, cost and CO2 emissions of electric cars. J. Power Sources 2011, 196, 2298–2310. [Google Scholar] [CrossRef]
- Lemoine, D.M.; Kammen, D.M.; Farrell, A.E. An innovation and policy agenda for commercially competitive plug-in hybrid electric vehicles. Environ. Res. Lett. 2008, 3, 014003. [Google Scholar] [CrossRef]
- Moriarty, P.; Wang, S.J. Can Electric Vehicles Deliver Energy and Carbon Reductions? Energy Procedia 2017, 105, 2983–2988. [Google Scholar] [CrossRef]
- Pollution Probe. Electric Mobility Adoption and Prediction—Developing a Strategic Approach to Enabling Electric Vehicle Technology in the Cities of Markham, Richmond Hill and Vaughan (PowerStream Service Area). Available online: http://www.pollutionprobe.org/publications/electric-mobility-adoption-and-prediction-emap-markham-richmond-hill-vaughan-2/ (accessed on 30 June 2015).
- Elwood, M. Electric vehicle technology roadmap for Canada. Industry Steering Committee, Tech. Rep. Available online: https://emc-mec.ca/wp-content/uploads/E-design-09_0581_electric_vehicle_e.pdf (accessed on 5 February 2018).
- Heymans, C.; Walker, S.B.; Young, S.B.; Fowler, M. Economic analysis of second use electric vehicle batteries for residential energy storage and load-levelling. Energy Policy 2014, 71, 22–30. [Google Scholar] [CrossRef]
- Corbo, P.; Migliardini, F.; Veneri, O. Hydrogen Fuel Cells for Road Vehicles; Springer Science & Business Media: Berlin, Germany, 2011. [Google Scholar]
- Maroufmashat, A.; Fowler, M.; Khavas, S.S.; Elkamel, A.; Roshandel, R.; Hajimiragha, A. Mixed integer linear programing based approach for optimal planning and operation of a smart urban energy network to support the hydrogen economy. Int. J. Hydrog. Energy 2016, 41, 7700–7716. [Google Scholar] [CrossRef]
- Waterloo Institute for Sustainable Energy, University of Waterloo. Towards an Ontario Action Plan for Plug-In-Electric Vehicles (PEVs); University of Waterloo: Waterloo, ON, Canada, 2010. [Google Scholar]
- Winter, C.J. Hydrogen energy—Abundant, efficient, clean: A debate over the energy-system-of-change. Int. J. Hydrog. Energy 2009, 34, S1–S52. [Google Scholar] [CrossRef]
- Körner, A.; Tam, C.; Bennett, S.; Gagné, J.F. Technology Roadmap-Hydrogen and Fuel Cells; International Energy Agency (IEA): Paris, France, 2015. [Google Scholar]
- Al-Subaie, A.; Maroufmashat, A.; Elkamel, A.; Fowler, M. Presenting the implementation of power-to-gas to an oil refinery as a way to reduce carbon intensity of petroleum fuels. Int. J. Hydrog. Energy 2017, 42, 19376–19388. [Google Scholar] [CrossRef]
- Mukherjee, U.; Elsholkami, M.; Walker, S.; Fowler, M.; Elkamel, A.; Hajimiragha, A. Optimal sizing of an electrolytic hydrogen production system using an existing natural gas infrastructure. Int. J. Hydrog. Energy 2015, 40, 9760–9772. [Google Scholar] [CrossRef]
- Maroufmashat, A.; Mukherjee, U.; Fowler, M.; Elkamel, A. Power-to-Gas: A New Energy Storage Concept for Integration of Future Energy Systems. In Operation, Planning, and Analysis of Energy Storage Systems in Smart Energy Hubs; Springer: Cham, Switzerland, 2018; pp. 411–423. [Google Scholar]
- Mukherjee, U.; Walker, S.; Maroufmashat, A.; Fowler, M.; Elkamel, A. Development of a pricing mechanism for valuing ancillary, transportation and environmental services offered by a power-to-gas energy system. Energy 2017, 128, 447–462. [Google Scholar] [CrossRef]
- Maroufmashat, A.; Fowler, M. Low-Carbon Transportation Pathways through Power-to-Gas. In Proceedings of the 2017 the 5th IEEE International Conference on Smart Energy Grid Engineering Low-Carbon Transportation Pathways through Power-to-Gas, Oshawa, ON, Canada, 14–17 August 2017. [Google Scholar]
- Shafiei, E.; Davidsdottir, B.; Leaver, J.; Stefansson, H.; Asgeirsson, E.I. Energy, economic and mitigation cost implications of transition toward a carbon-neutral transport sector: A simulation-based comparison between hydrogen and electricity. J. Clean. Prod. 2017, 141, 237–247. [Google Scholar] [CrossRef]
- Shade of Green, Electric Cars Carbon Emission around the Globe, Shrink That Footprint, Lindsay Wilson. Available online: http://shrinkthatfootprint.com/wp-content/uploads/2013/02/Shades-of-Green-Full-Report.pdf (accessed on 16 May 2016).
- Independent Electricity System Operator (IESO). Preliminary Outlook and Discussion: Ontario Supply/Demand Balance to 2035. Available online: http://www.ieso.ca/Pages/Pa”ticipate/Stakeholder-Engagement/Stakeholder-Advisory-Committee.aspx (accessed on 27 April 2016).
- Bradley, T.H.; Quinn, C.W. Analysis of plug-in hybrid electric vehicle utility factors. J. Power Sources 2010, 195, 5399–5408. [Google Scholar] [CrossRef]
- Maroufmashat, A.; Sattari, S.; Roshandel, R.; Fowler, M.; Elkamel, A. Multi-objective optimization for design and operation of distributed energy systems through the multi-energy hub network approach. Ind. Eng. Chem. Res. 2016, 55, 8950–8966. [Google Scholar] [CrossRef]
- Argonne National Laboratory. GREET Emissions Factor Database. 2015. Available online: https://greet.es.anl.gov/ (accessed on 10 October 2015).
- United States Environmental Protection Agency; U.S. Department of Energy. Compare Fuel Cell Vehicles. Available online: https://fueleconomy.gov/ (accessed on 14 December 2015).
- Zhang, Y.; McKechnie, J.; Cormier, D.; Lyng, R.; Mabee, W.; Ogino, A.; Maclean, H.L. Life cycle emissions and cost of producing electricity from coal, natural gas and wood pellets in Ontario, Canada. Environ. Sci. Technol. 2009, 44, 538–544. [Google Scholar] [CrossRef] [PubMed]
- Hula, A.; Bunker, A.; Alson, J. Light-Duty Automotive Technology, Carbon Dioxide Emissions and Fuel Economy Trends: 1975 through 2015; No. EPA-420-R-15-016; Office of Transportation and Air Quality: Washington, DC, USA, 2015.
- Thomas, C.E. Fuel cell and battery electric vehicles compared. Int. J. Hydrog. Energy 2009, 34, 6005–6020. [Google Scholar] [CrossRef] [Green Version]
- Elgowainy, A.; Mintz, M.; Gardiner, M. Distribution Networking, Handbook of Hydrogen Energy; CRC Press: Boca Raton, FL, USA, 2014; pp. 935–956. [Google Scholar]
- Brouillette, M. Ontario’s Emissions and the Long-Term Energy Plan, Phase 1-Understanding the Challenge. Available online: https://strapolec.ca/uploads/Ontario_s_Emissions_and_the_LTEP_-_Phase_1_Final_Report_November_2016.pdf (accessed on 21 November 2016).
- Chevrolet Cruze; US department of Energy. Energy Efficiency and Renewable Energy. Available online: https://www.fueleconomy.gov/feg/bymodel/2016_Chevrolet_Cruze.shtml (accessed on 15 May 2017).
- Funding for Electric Vehicle Charging Stations. Available online: https://news.ontario.ca/mto/en/2016/04/funding-for-electric-vehicle-charging-stations.html (accessed on 10 August 2016).
- Ogden, J.; Nicholas, M. Analysis of a “cluster” strategy for introducing hydrogen vehicles in Southern California. Energy Policy 2011, 39, 1923–1938. [Google Scholar] [CrossRef]
- Reducing GHG Emissions in Canada’s Transportation Sector, Clean Energy Canada, the David Suzuki Foundation. 2016. Available online: https://equiterre.org/sites/fichiers/fmm_transportation_recs.pdf (accessed on 3 July 2017).
Figure 1.
Greenhouse gas emission by economic sector (2014). (a) Global (World) [1]; (b) Canada [5]; (c) Ontario [7].

Figure 2.
Key issues of zero-emission vehicles in Ontario [11].
Figure 2.
Key issues of zero-emission vehicles in Ontario [11].

Figure 3.
The impact of electricity consumption of electric based vehicles on Ontario’s power grid demand [53].
Figure 3.
The impact of electricity consumption of electric based vehicles on Ontario’s power grid demand [53].

Figure 4.
Life cycle Greenhouse Gas emission of the fuel of different types of vehicles per 100 km drive.
Figure 4.
Life cycle Greenhouse Gas emission of the fuel of different types of vehicles per 100 km drive.

Figure 5.
Annual GHG emission avoidance for 1.7 million BEVs/PHEVs (million tonne CO2 eq. per year).
Figure 5.
Annual GHG emission avoidance for 1.7 million BEVs/PHEVs (million tonne CO2 eq. per year).

Figure 6.
GHG emission of Chevy Volt vehicles based on different utility factors.

Figure 7.
Electricity requirement of 1.7 million BEVs/PHEVs of Bruce, Darlington nuclear power plant refurbishment and based on net electricity export.
Figure 7.
Electricity requirement of 1.7 million BEVs/PHEVs of Bruce, Darlington nuclear power plant refurbishment and based on net electricity export.

Figure 8.
Overall reduction in number of Internal Combustion Engine Vehicles offset based on emission production of PHEV/BEVs or FCVs that a C$20 million-dollar incentive program would support.
Figure 8.
Overall reduction in number of Internal Combustion Engine Vehicles offset based on emission production of PHEV/BEVs or FCVs that a C$20 million-dollar incentive program would support.


Table 1.
Common types of PHEVs and BEVs in Ontario [34].
Table 1.
Common types of PHEVs and BEVs in Ontario [34].
| Features | PHEV | BEV | |
|---|---|---|---|
| Chevy Volt | Nissan Leaf | Tesla Models | |
| Battery Capacity | 18 kWh | 30 kWh | 90 kWh |
| Distance travelled on one charge (Electric Range) | 85 km | 172 km | 435 km |
| Distance travelled on electricity and gasoline (Full Range) | 675 km | n/a | n/a |
| Charge Time on a Level 2 charger for a full charge | 4.5 h | 5 h | 12 h |
| Battery Warranty | 8 Years/160,000 km | 8 Years/160,000 km | 8 Years/Unlimited km |
| Variables/Parameters | Unit | Value |
|---|---|---|
| kg·kWh−1 | Can be different based on the different electricity generation sources | |
| kg·L−1 | 2.43 [55] | |
| Battery capacity | kWh | Can be different for different types of hybrid/electric vehicles |
| Distance traveled on one charge | km | Can be different for different types of hybrid/electric vehicles |
| - | 80% [55] | |
| km·L−1 | 9.4 [56] | |
| km·kg−1 | 106 [57] | |
| . | kWh·kg−1 | 51.5 [42] |
© 2018 by the authors. Licensee MDPI, Basel, Switzerland. This article is an open access article distributed under the terms and conditions of the Creative Commons Attribution (CC BY) license (http://creativecommons.org/licenses/by/4.0/).
Share and Cite
MDPI and ACS Style
Maroufmashat, A.; Fowler, M. Policy Considerations for Zero-Emission Vehicle Infrastructure Incentives: Case Study in Canada. World Electr. Veh. J. 2018, 9, 38. https://doi.org/10.3390/wevj9030038
AMA Style
Maroufmashat A, Fowler M. Policy Considerations for Zero-Emission Vehicle Infrastructure Incentives: Case Study in Canada. World Electric Vehicle Journal. 2018; 9(3):38. https://doi.org/10.3390/wevj9030038
Chicago/Turabian StyleMaroufmashat, Azadeh, and Michael Fowler. 2018. "Policy Considerations for Zero-Emission Vehicle Infrastructure Incentives: Case Study in Canada" World Electric Vehicle Journal 9, no. 3: 38. https://doi.org/10.3390/wevj9030038