1. Introduction
The demand for electric power for industrial purposes is growing rapidly. Many transportation vehicles and uninterruptible power supply (UPS) systems that are used in heavy industries require electric power for their smooth operation. These vehicles and UPS systems are equipped with lead–acid batteries as an alternate source of electric power. In addition, fuel saving strategies that actively utilize the power from these batteries [
1] are being considered. Therefore, a reliable battery system is indispensable for effective operation in industry. However, it is to be noted that these batteries are considerably costlier and excessive use could result in their malfunction. Also, the damaged lead–acid batteries can have a negative impact on the environment during the recycling process. It is therefore very important to continuously monitor the development and management of these batteries to preclude undue damage and prolong the lifetime of the battery.
In technical terms, the effect of the overuse of these batteries could reduce the lifetime operation and in the worst case can lead to system failure, a highly undesirable situation in heavy industries. There are several ongoing studies underway to find a solution by effective remote monitoring based on Internet of things (IoT). IoT is a multitude integration of several fields such as sensor networks, embedded systems, data processing and fusion, intelligent control, task scheduling and allocation, etc.
Atzori et al. briefly analyzed the IoT phenomenon from an evolutionary point of view [
2], by emphasizing that the IoT has undergone several transformations in its characterizing technologies and principles and provided a conceptual framework. A low-cost embedded system approach for energy monitoring in industrial environments is proposed in [
3]. The authors demonstrated a complete system for monitoring and analysis of electrical parameters, serving as a tool to aid the energy management in industrial processes. Velandia et al. proposed a system to make crankshaft smarter by using radio frequency identification (RFID) tags [
4]. The authors showed that by using a RFID bolt, crankshafts could be tracked throughout their machining and assembly processes. A novel closed-loop design evolution of the engineering system using condition monitoring through IoT and a cloud computing platform is proposed in [
5]. The authors employed condition monitoring in the design improvement process by evaluating the system performance, detecting system failure and estimating system heath status. Qiu et al. designed a task-efficient sink node (TESN) based on embedded multi-core system-on-chip (SoC) for IoT [
6]. The authors also proposed master–slave architecture and a weighted-least connection (WLC) task schedule strategy to allocate the tasks for slave cores in order to achieve lower congestion and better load balance for the parallel computing. Lopez et al. developed a prototype based on IoT that enables the joint evaluation and optimization of multidisciplinary aspects of IoT systems, including aspects related to hardware design, communications and data processing [
7].
A wireless remote monitoring system based on a general packet radio service (GPRS) is presented in [
8]. The authors demonstrated that their proposed system could be used to monitor the operating states of the lead–acid battery groups in telecommunication base stations. Moreover, the authors conducted the field testing of their proposed system over a GPRS network and the Internet, proving the stability and performance of the remote battery group monitoring system. Rosolem et al. developed a remote monitoring system to obtain a premature failure diagnoses in stationary lead–acid batteries through the measurement of their internal resistance and voltage [
9]. Further, the authors included all the management and analysis of these measurements in battery management software. An online monitoring terminal for electric vehicles based on GPRS wireless communication is proposed in [
10,
11]. It consists of an online monitoring panel for battery parameter measurements with a GPRS data transmitter unit and a computer equipped with battery online monitoring software, to monitor the various operating parameters of the battery in real-time. The authors further showed that through their system it is possible to judge the status of the battery, execute the fault diagnosis, and establish a database to facilitate data storage. Nonetheless, it should be noted that in most of the previous works, the systems designed were suitable for fixed batteries and the subsequent monitoring and connection with multiple batteries was not considered. Further, GPRS technology was used for battery data transmission and it may not be suitable for the industrial environment considering the low data rates.
In this paper, a real-time monitoring system for multiple lead–acid batteries based on IoT, suitable for the industrial environment, is proposed and evaluated. Our proposed monitoring system procures and stores the important parameters of the battery in real time. We have developed a data acquisition system based on dedicated software and hardware. The wireless local area network (WLAN) is used as a backbone network considering the industrial environment. The information collected from multiple batteries is analyzed in an asynchronous transmission control protocol/user datagram protocol (TCP/UDP)-based [
12] C♯ server socket program running on a personal computer, to analyze the important parameters of the lead–acid battery; if required, appropriate decisions as to whether the batteries need to be recharged or not can be taken in advance to prevent excessive impairment to the batteries. Inter-integrated circuit, analog to digital converter (ADC), serial communication, TCP/UDP, and universal asynchronous receiver/transmitter (UART) are the protocols used for communication in our proposed system. The main objective of our scheme is to provide credible and valuable lead–acid battery data. From the utility point of view, our proposed system is designed to prevent battery damage caused by overuse, regardless of the low battery capacity; the cost can be further minimized and maintenance of the battery is relatively easier in our proposed system. Further, the data from multiple batteries are also displayed on an android device and are stored in a MySQL server database. We have developed a real prototype to devise an end product for our proposed system. In summary, the main contribution of this paper can be outlined as follows:
The real-time monitoring of multiple lead–acid batteries is proposed and evaluated through dedicated software and hardware.
Our monitoring system is based on WLAN for data transmission from multiple lead–acid batteries considering the industrial environment.
We have developed an asynchronous TCP/UDP-based C♯ server program for our proposed system.
Further, we have developed an android program to display data from the connected battery client and this data is stored in an MySQL server database for mobile and robust monitoring.
We developed the blue print and schematic of our proposed system’s circuit layout through ORCAD software [
13].
Finally, we have developed a real prototype to devise an end product for our proposed system.
The rest of the paper is organized as follows. In
Section 2 , the system model is presented. The test bed implementation and the experimental results of our proposed system are shown in
Section 3 . Finally, conclusions are drawn in
Section 4.
2. System Model
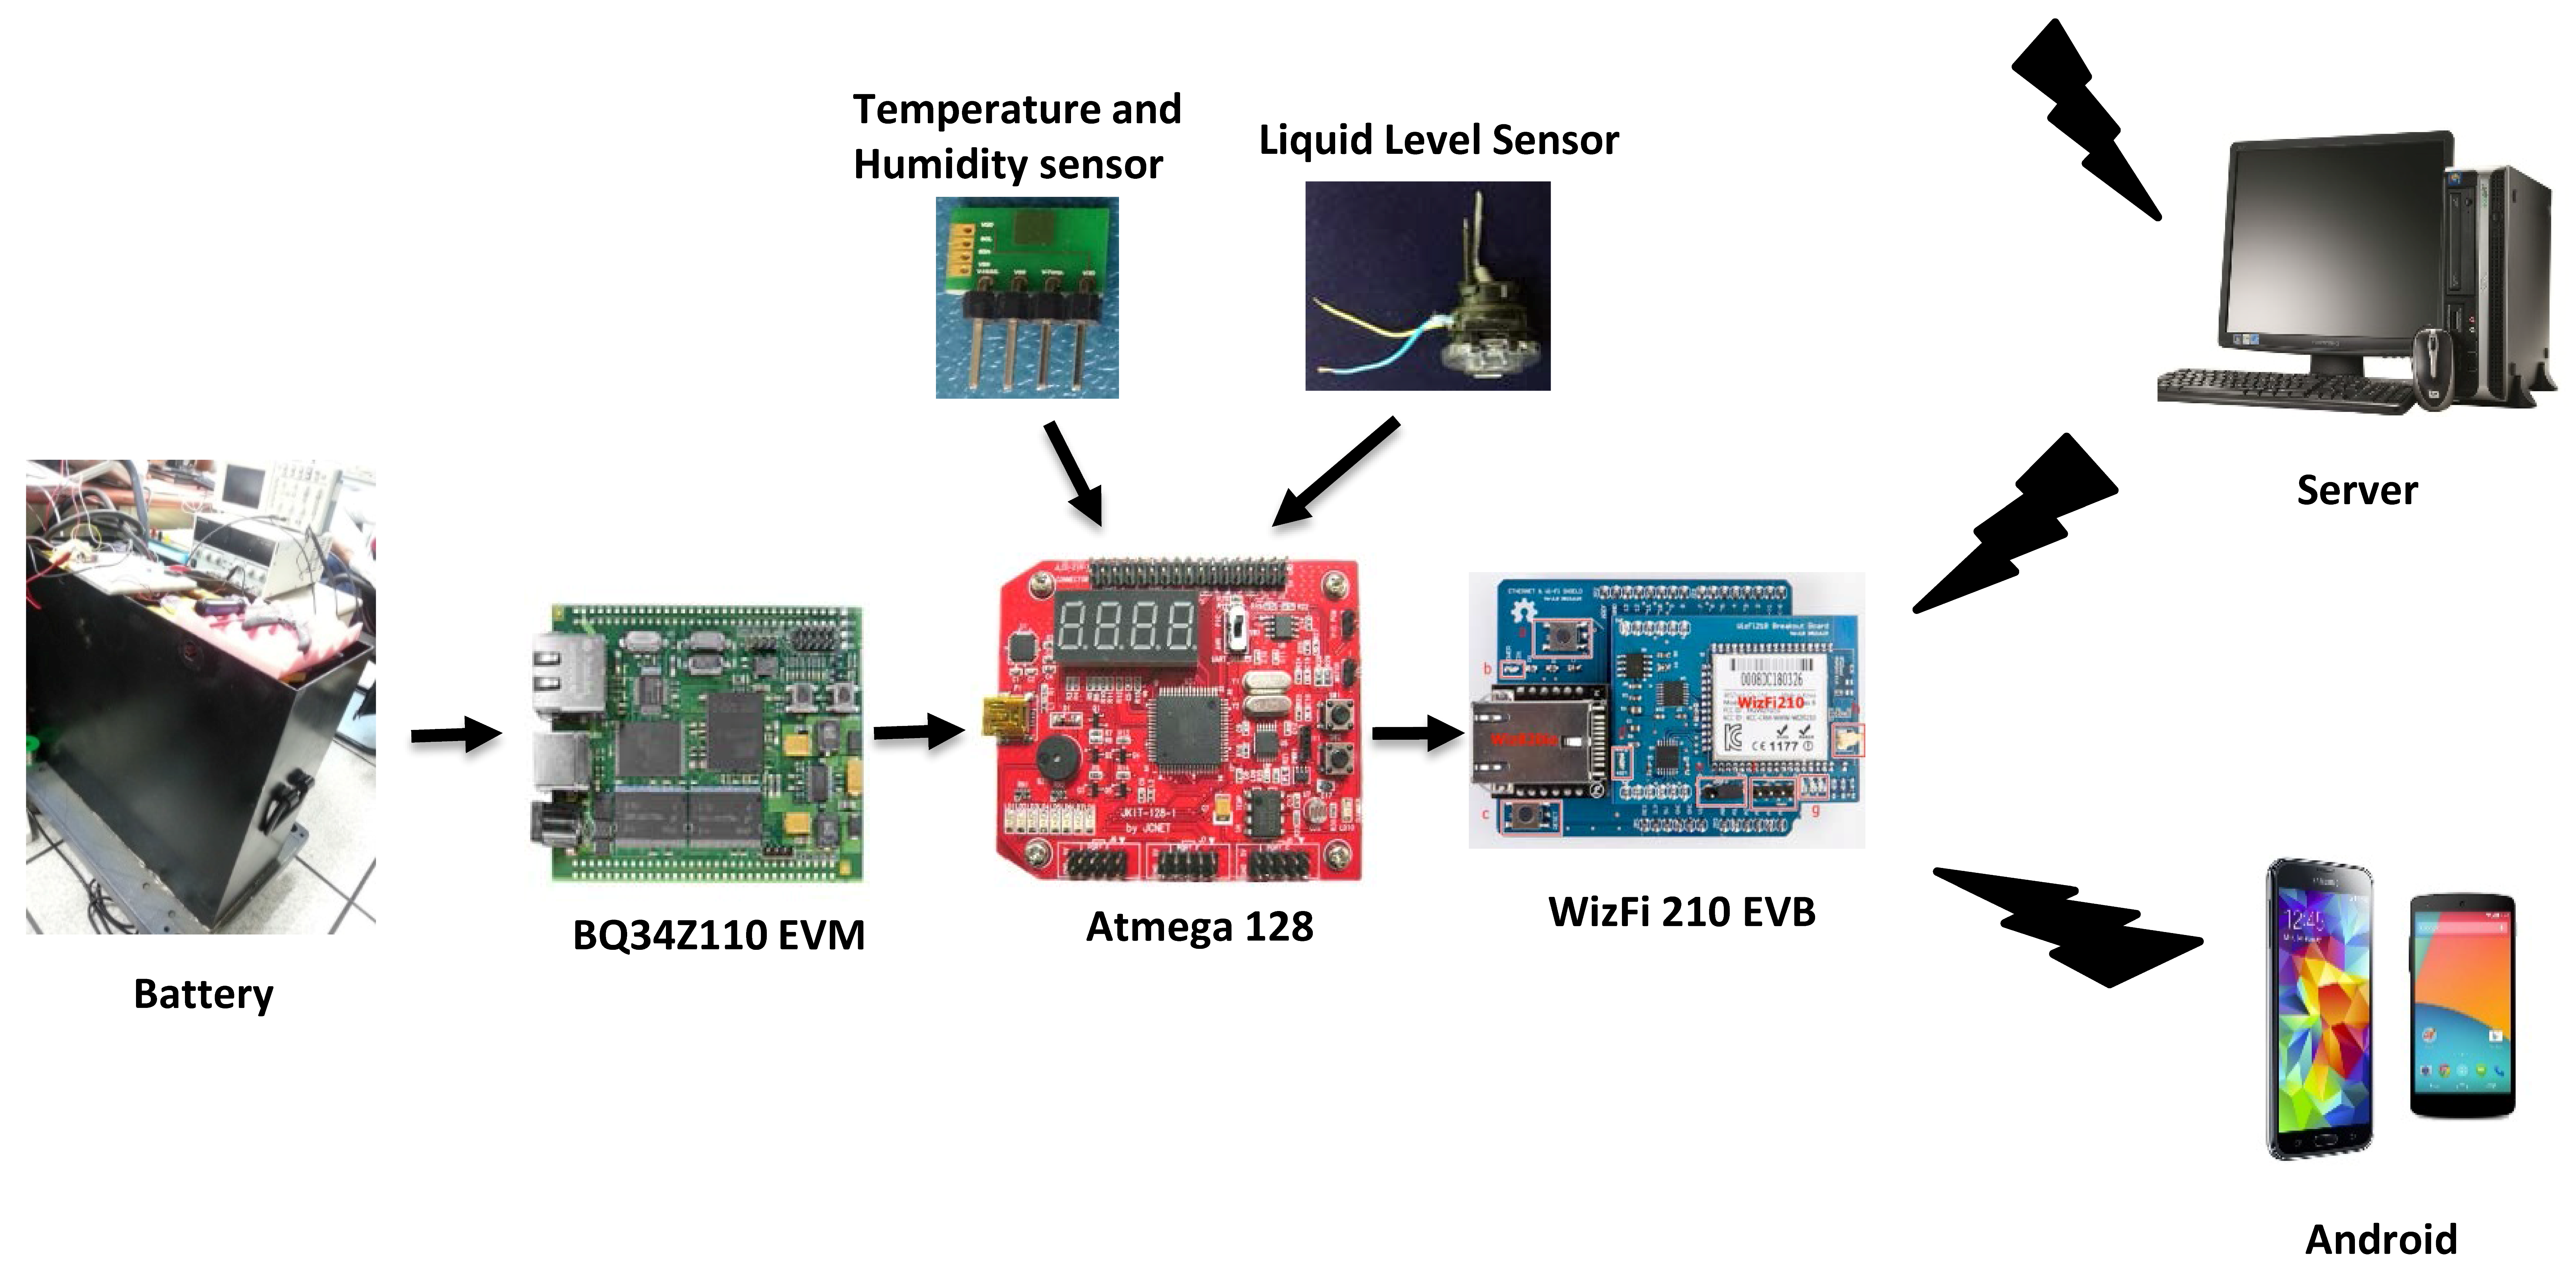
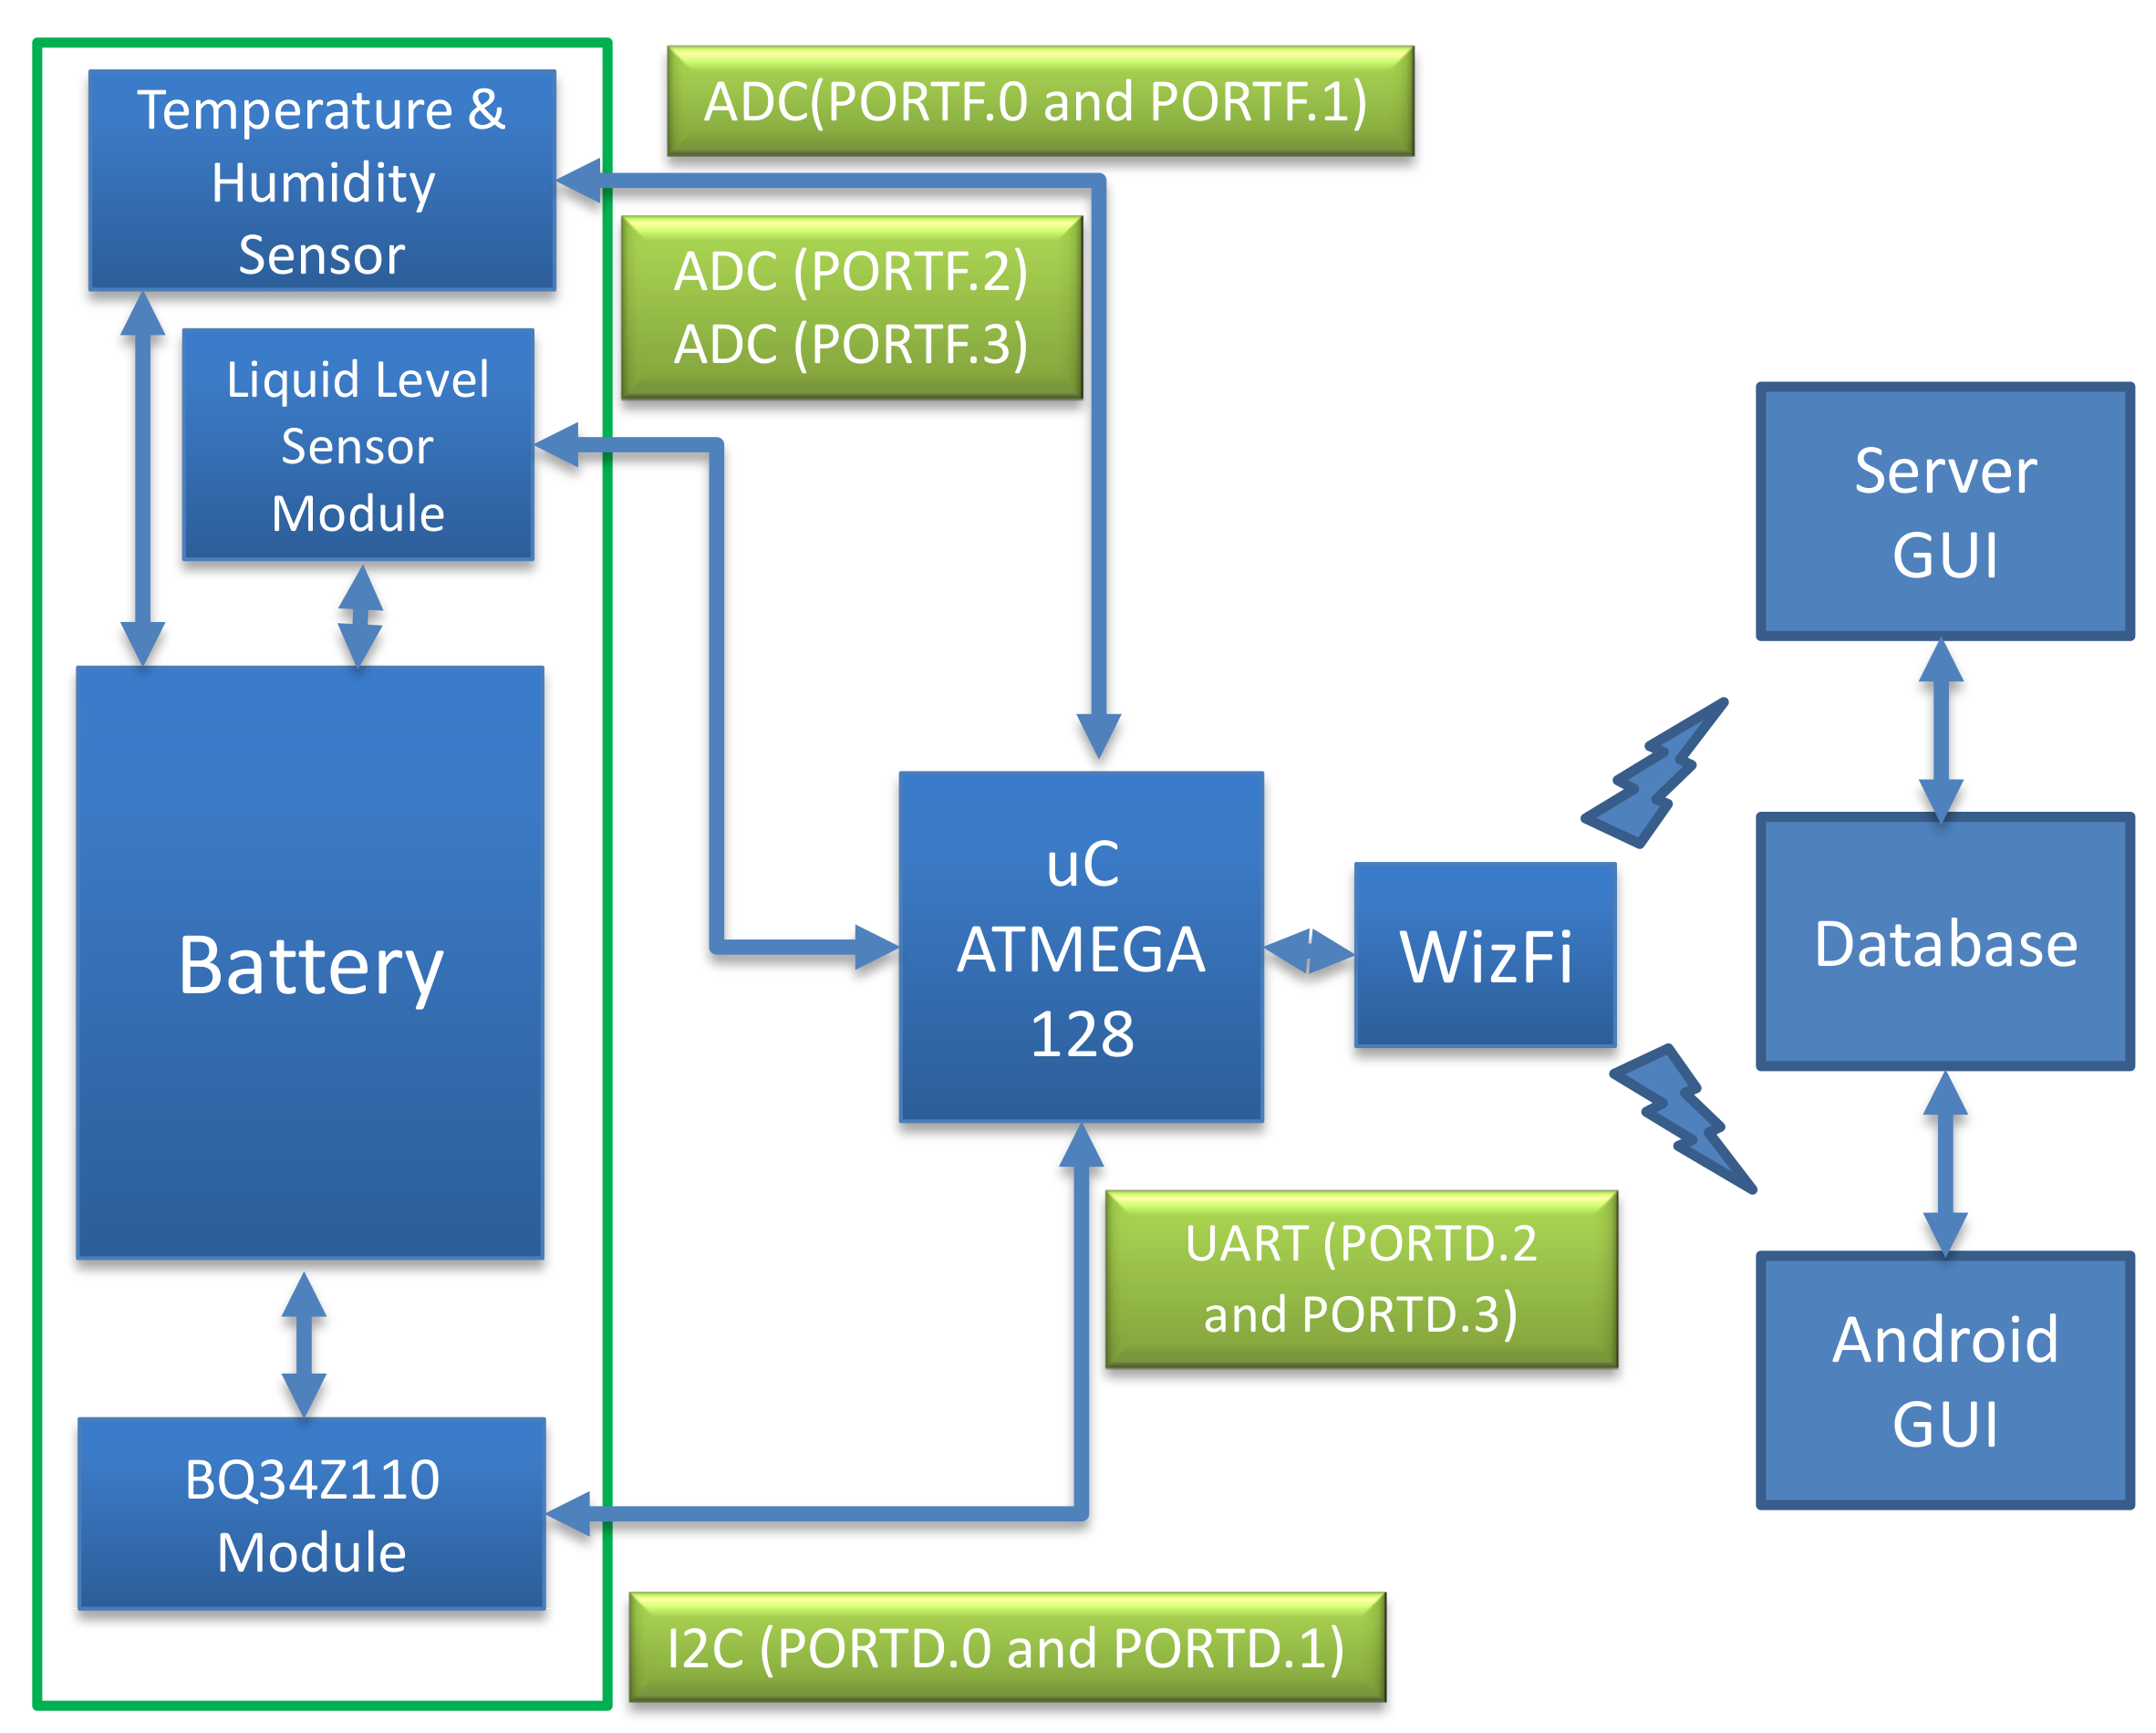
The block diagram of our proposed system is presented in
Figure 1; it includes a temperature and humidity sensor module, a liquid level sensor module and a BQ34Z110 module [
14]. The temperature and humidity data is estimated around the battery with the use of a chipcap-D sensor [
15]. The battery’s acid level, one of the most important parameters to be determined, is evaluated through an electrolyte level sensor module explained in detail in the next subsection. The battery’s important parameters, namely, the full charge capacity, the remaining charge capacity, the state of charge, voltage, and average current are assessed through the BQ34Z110 module. For data transmission between the device and the microcontroller, the i2c protocol is used. We have used Philip i2c protocol [
16] that is provided in the Cvavr library [
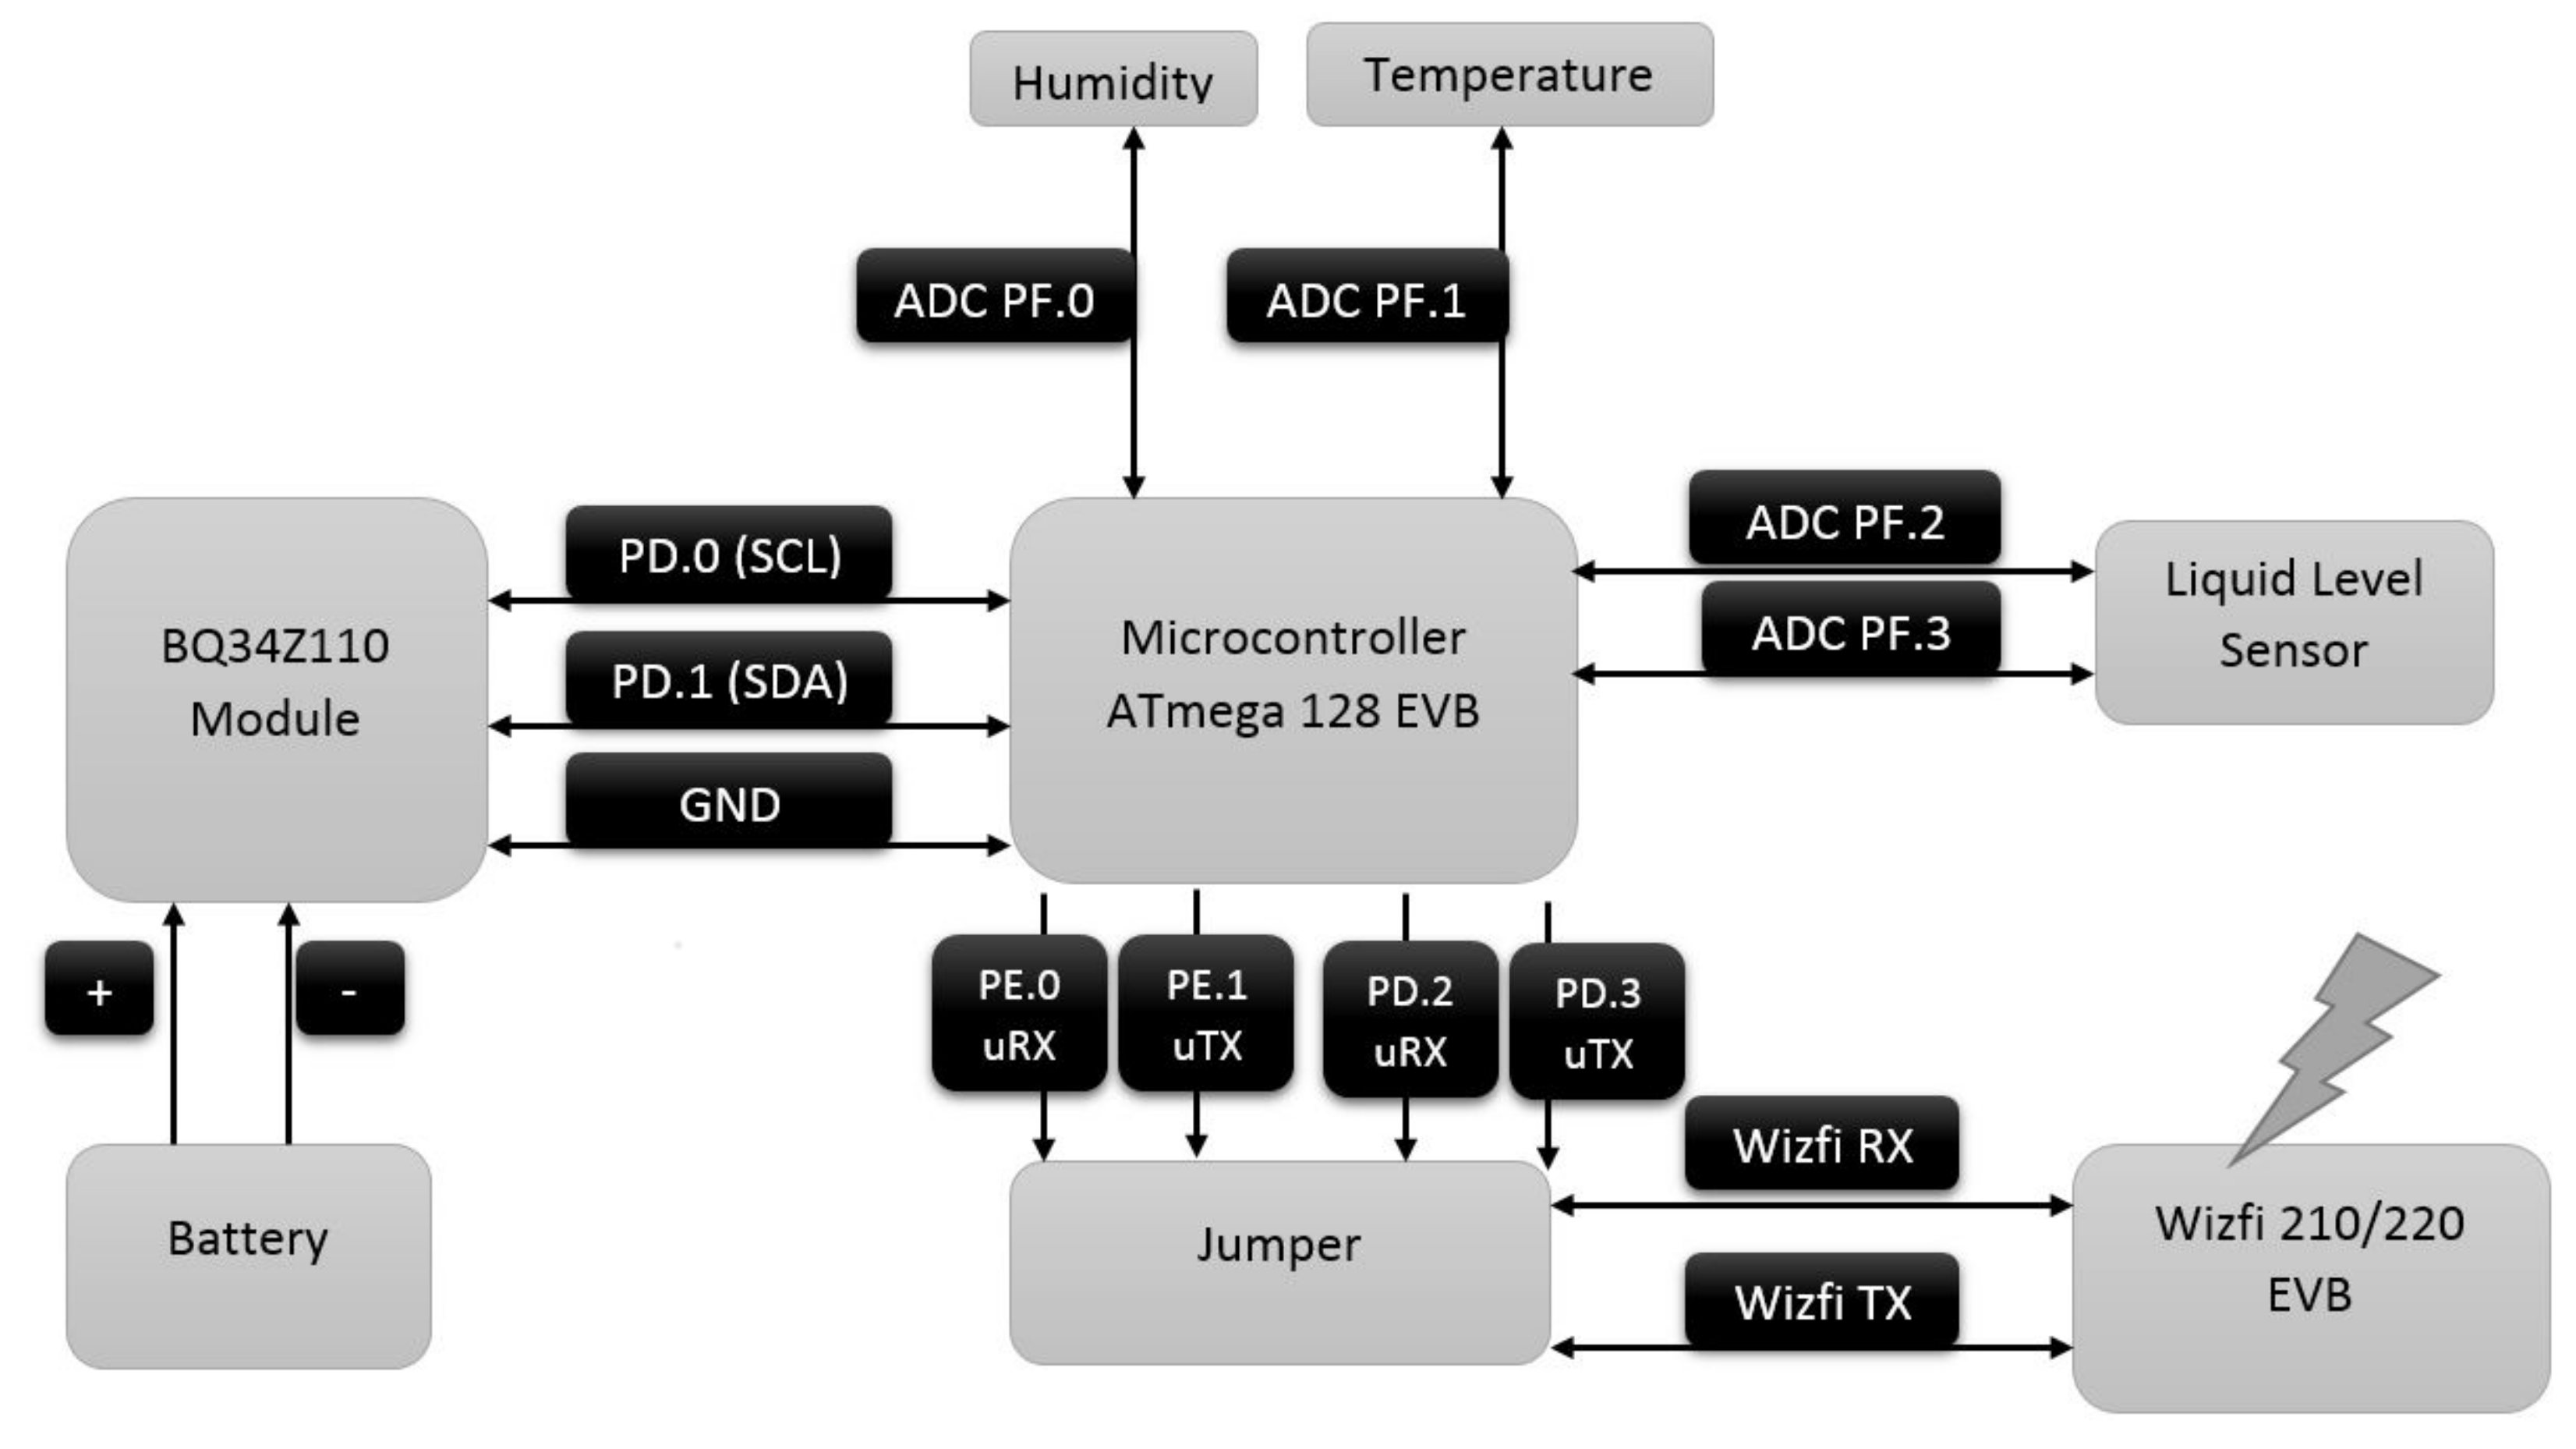
17]. The ADC is also used for communication between the device and the microcontroller. The battery data from the sensors are received and the calculation and the analysis part is implemented in the microcontroller. Further, for our proposed system, the data is transferred to a Wi-Fi card (WizFi) using a UART protocol. For a clear representation and working procedure, the pin map detailed diagram of our proposed system, with the corresponding inputs and ports, is shown in
Figure 2. It should be observed that in our proposed system the communication between the various parts of the system is done using WLAN technology, considering the mobility of the vehicles and the batteries in an industrial environment. The vehicles are self-governing and can connect to any of the gateways installed in the premises of the industry.
2.1. Electrolyte Level Sensing
Evaporation of the electrolyte from the cells of lead–acid batteries is a well-known and serious problem. It leads to performance degradation in terms of the power output and can damage the cells. These batteries require continuous monitoring to reduce operational charges, as explained earlier. Different techniques including capacitive liquid level sensors [
18,
19,
20], resistive liquid level sensors [
21], and ultrasonic level detectors [
22] have been proposed already to overcome this problem. The capacitive sensors measure the change in capacitance between the two plates, produced by the changes in the liquid level. Two kinds of capacitive sensors are available; they are characterized by the type of the fluid, i.e., a fluid with a high dielectric constant and a fluid with a low dielectric constant. A very small difference in the liquid level causes a small difference in capacitance that becomes difficult to measure; hence, accuracy is a major concern in liquid level sensors. Ultrasonic level sensors use the speed of sound to calculate the acid level. An ultrasonic signal is transmitted and is reflected back from the liquid level and received at the sensor. The sensor then measures the distance based on the speed of sound and the time difference between the transmission and reception. The problem with ultrasonic sensors is the transmitted beam pattern. The beam spreads as the signal travels along. The transmit pattern limits the use of ultrasonic sensors in narrow cells, as the signal can strike the wall of the container/cell resulting in a wrong calculation of the liquid level.
The simplest and most cost-effective way of sensing the electrolyte level in a lead–acid battery is by using an electrode [
23]. A metal rod/electrode is placed vertically in the electrolyte solution according to a target level. When the electrode touches the electrolyte, a current flows through the electrode. As the electrolyte evaporates or the liquid level drops below the target level, the contact between the rod and the electrolyte is lost and so is the current flow across the electrode.
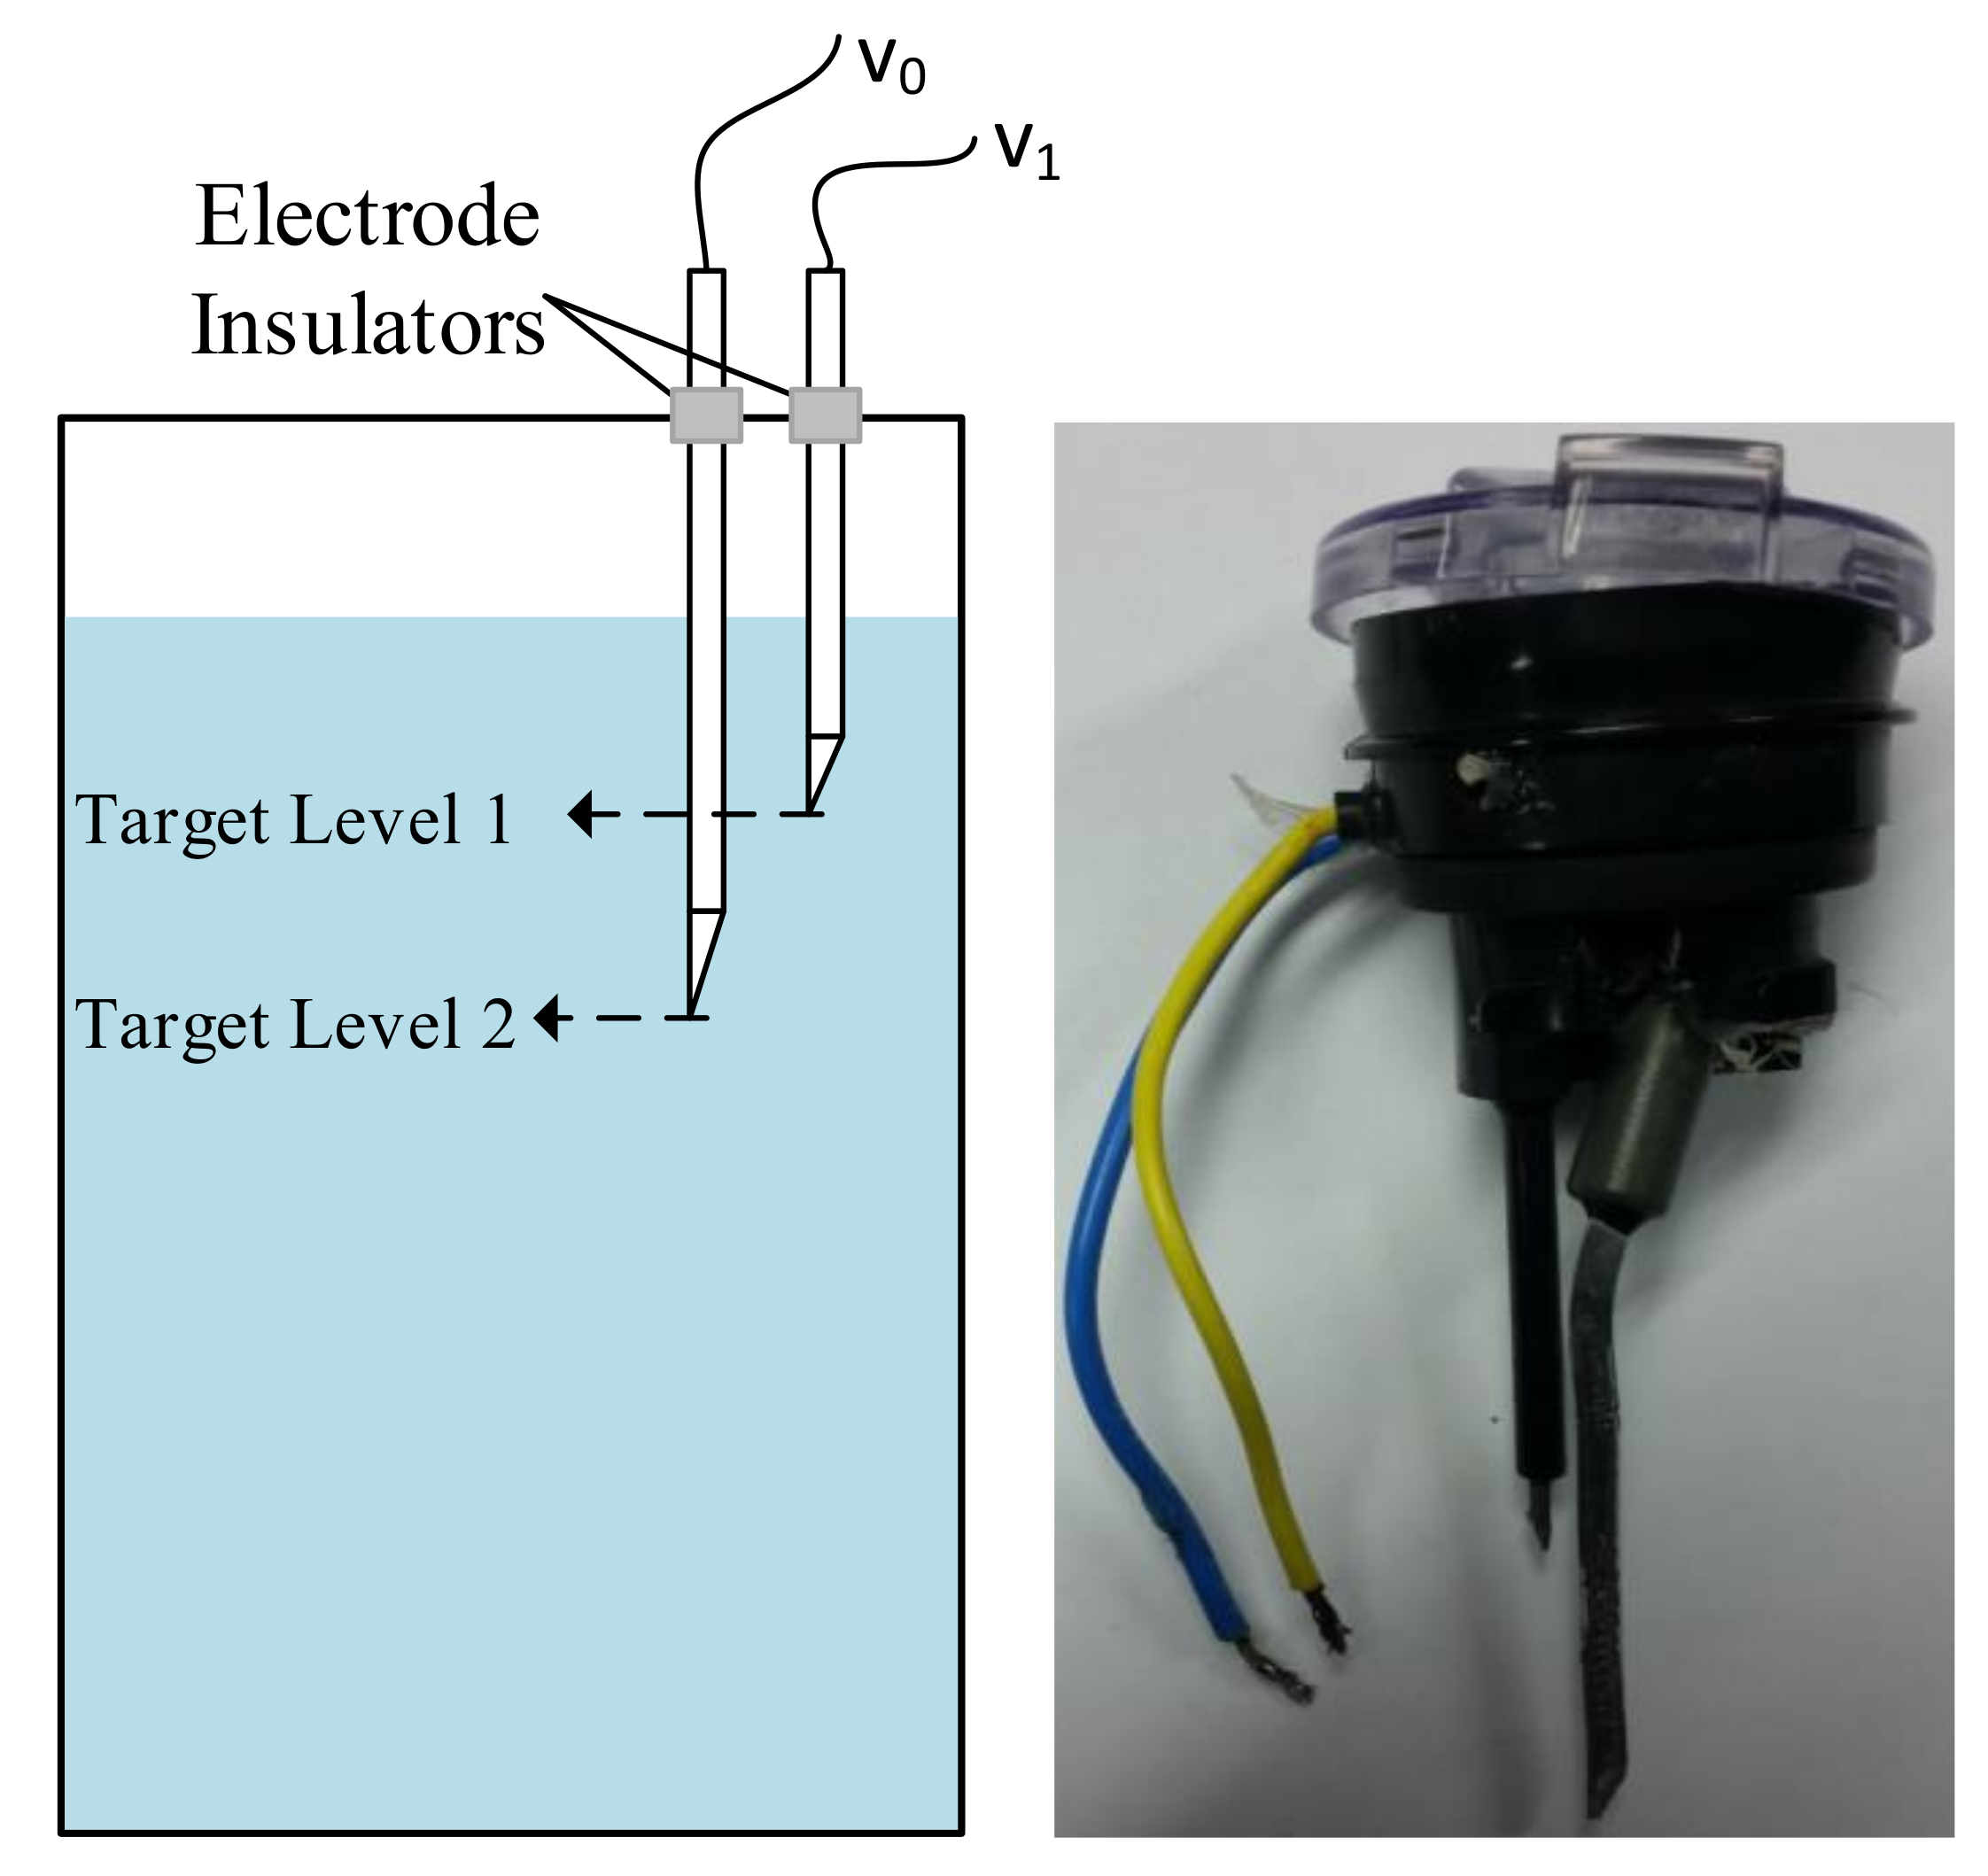
Based on this, we have developed a simple and yet cost-effective two-electrode-based electrolyte/liquid level sensor for our proposed method. The sensor can measure two different levels with a very high accuracy. The sensor is shown in
Figure 3. Two electrodes are dipped inside the battery according to predefined targets. A thin film of electrolyte is always present on the inside walls of the cells, therefore, the electrodes are positioned so that they do not touch the walls. When the electrode touches the electrolyte, a current flows through the corresponding electrode connected across the negative terminal of the battery. The potential difference across the output of the electrodes and the battery negative terminal is stepped down using a LM7805 regulator, as high power can damage the microcontroller. The output is then fed to the microcontroller at ports PF2 and PF3. The microcontroller then senses the liquid level in the cell of the battery and sends the data to the server through the WizFi.
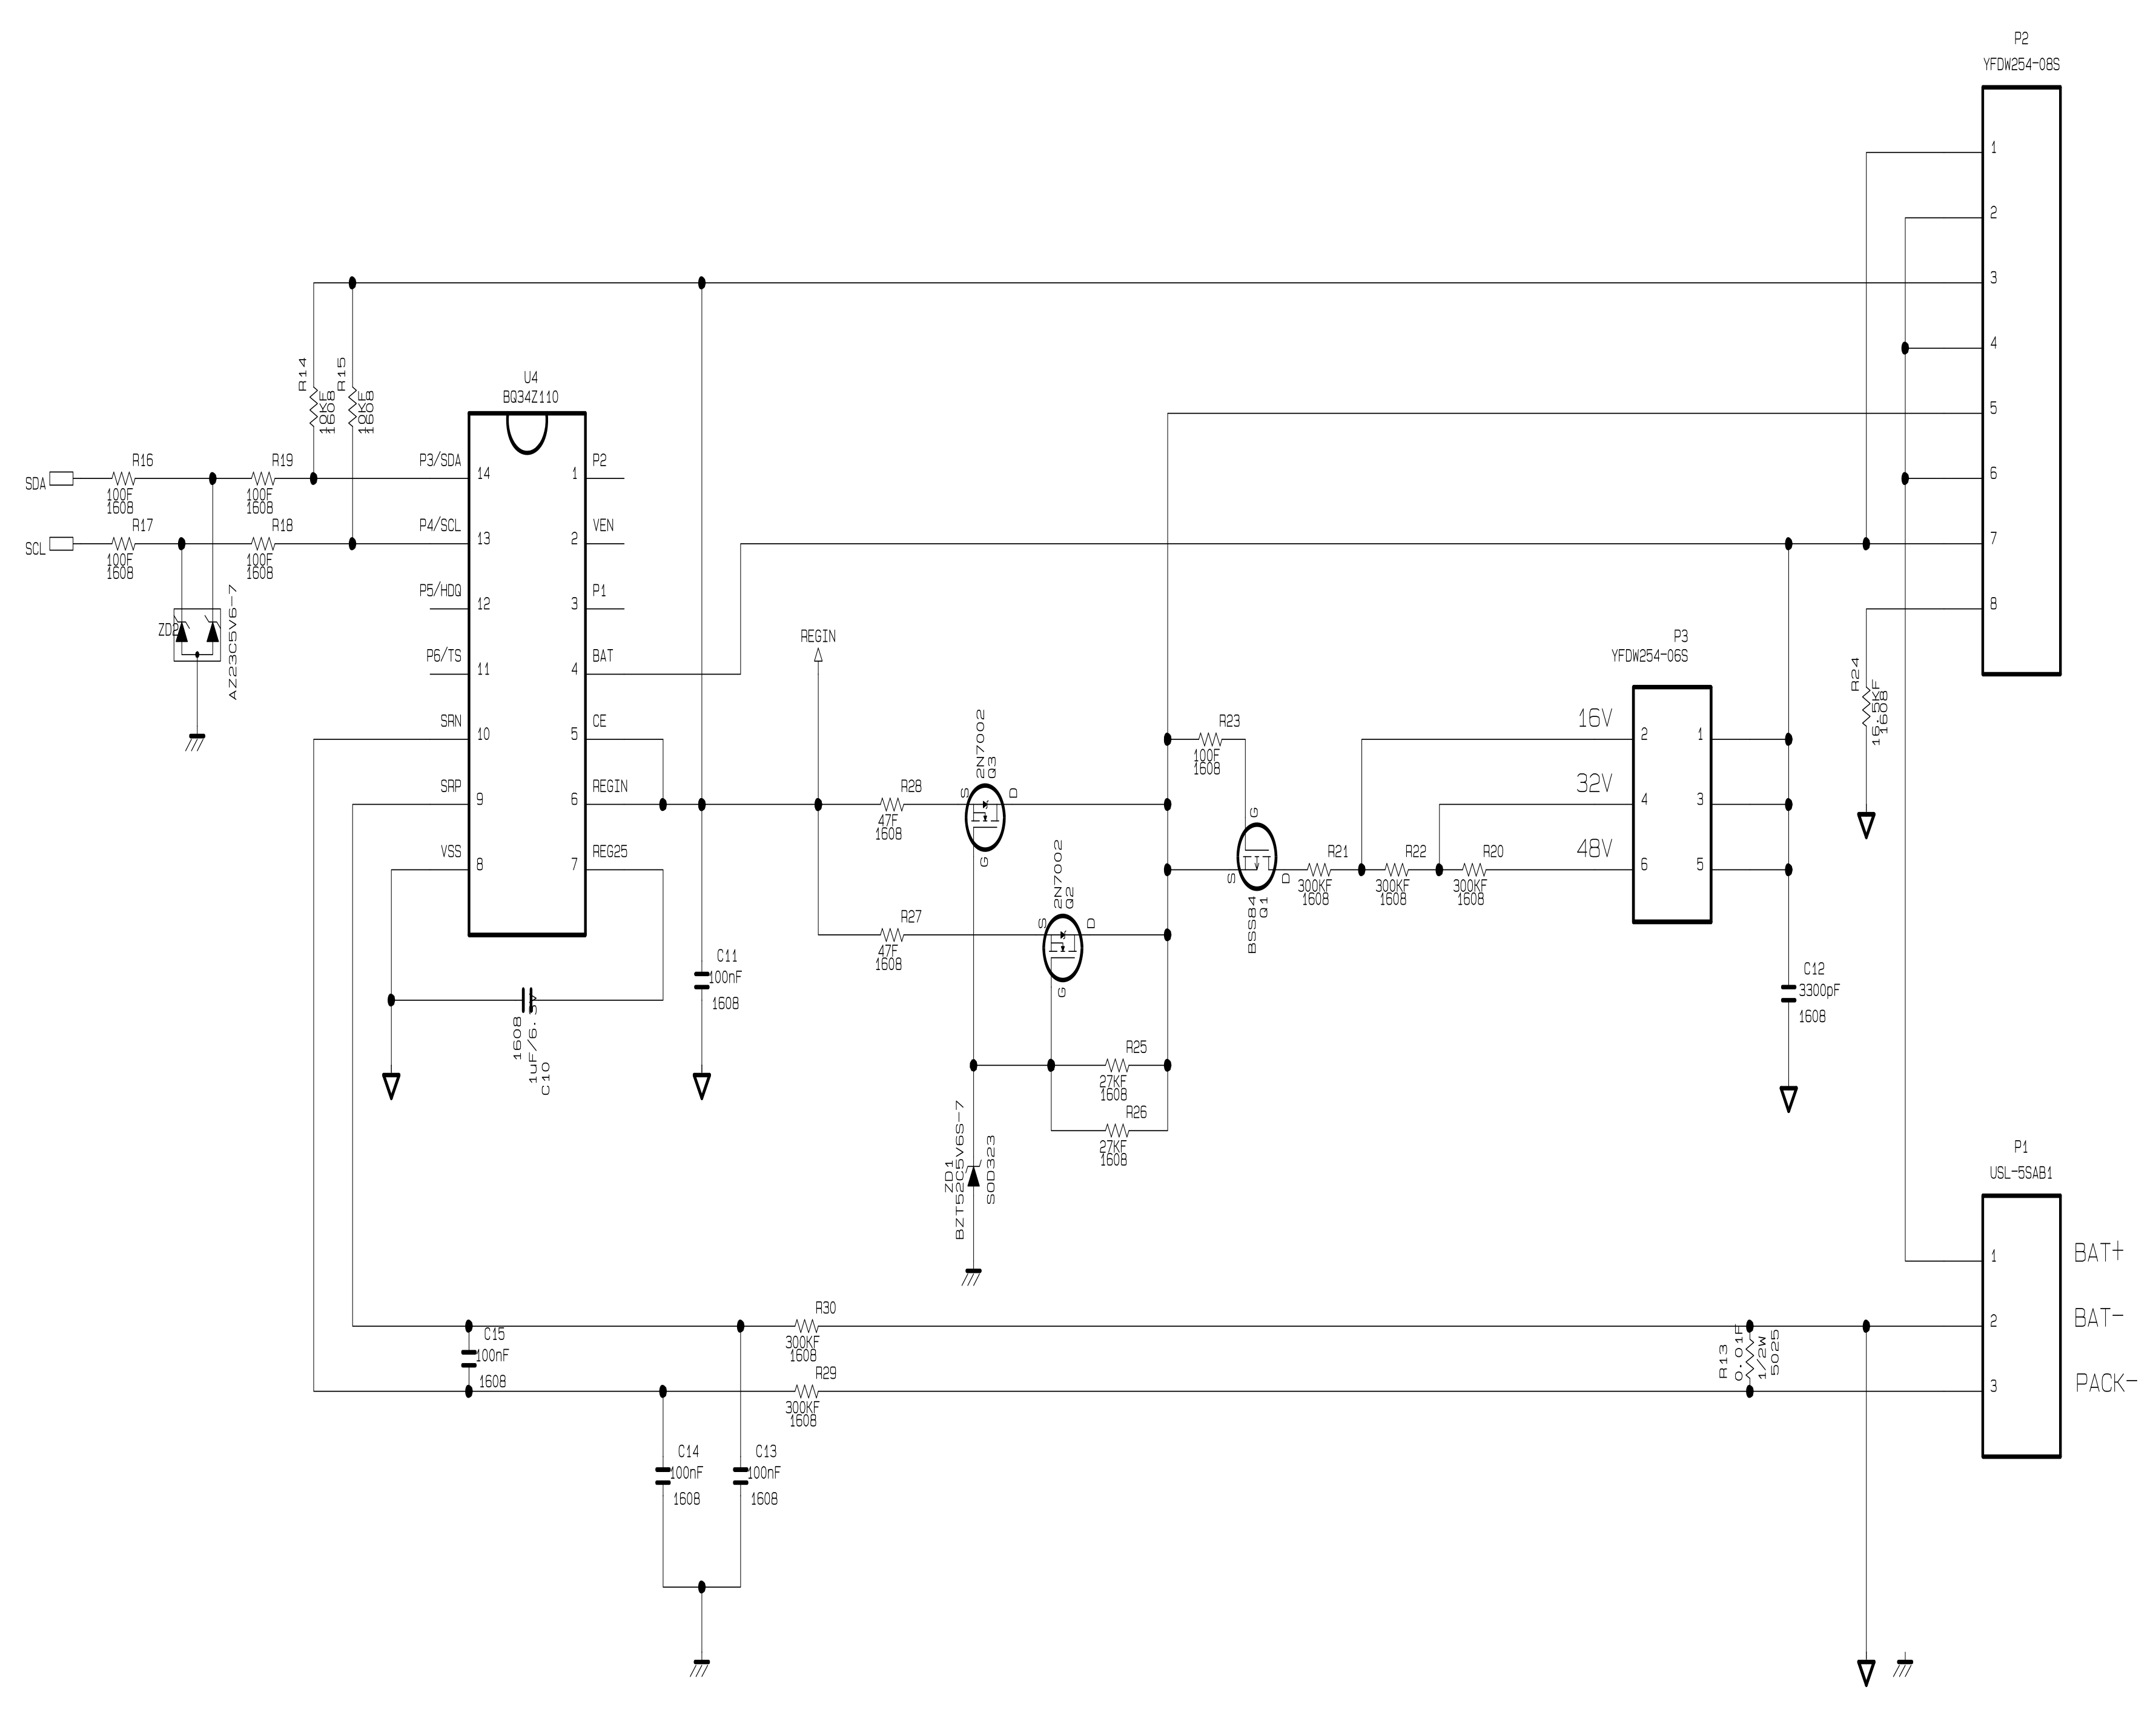
2.2. The Integrated Circuit (IC) BQ34Z110-Based Battery Evaluation Circuit
The Integrated Circuit (IC) BQ34Z110 [
14]-based circuit module is a complete and compact solution for a lead–acid battery evaluation. The circuit module consists of various options and jumpers necessary for evaluation of the various battery types. This IC supports lead–acid batteries from 4–64 V. The IC also supports batteries with capacities above 65 Ah. The BQ34Z110 uses a series of 2-byte standard commands to enable host reading and writing of battery information. The BQ34Z110 IC-based evaluation circuit schematic is shown in
Figure 4. All the schematics, blue prints, and the circuit layout of the proposed method are done through ORCAD software.
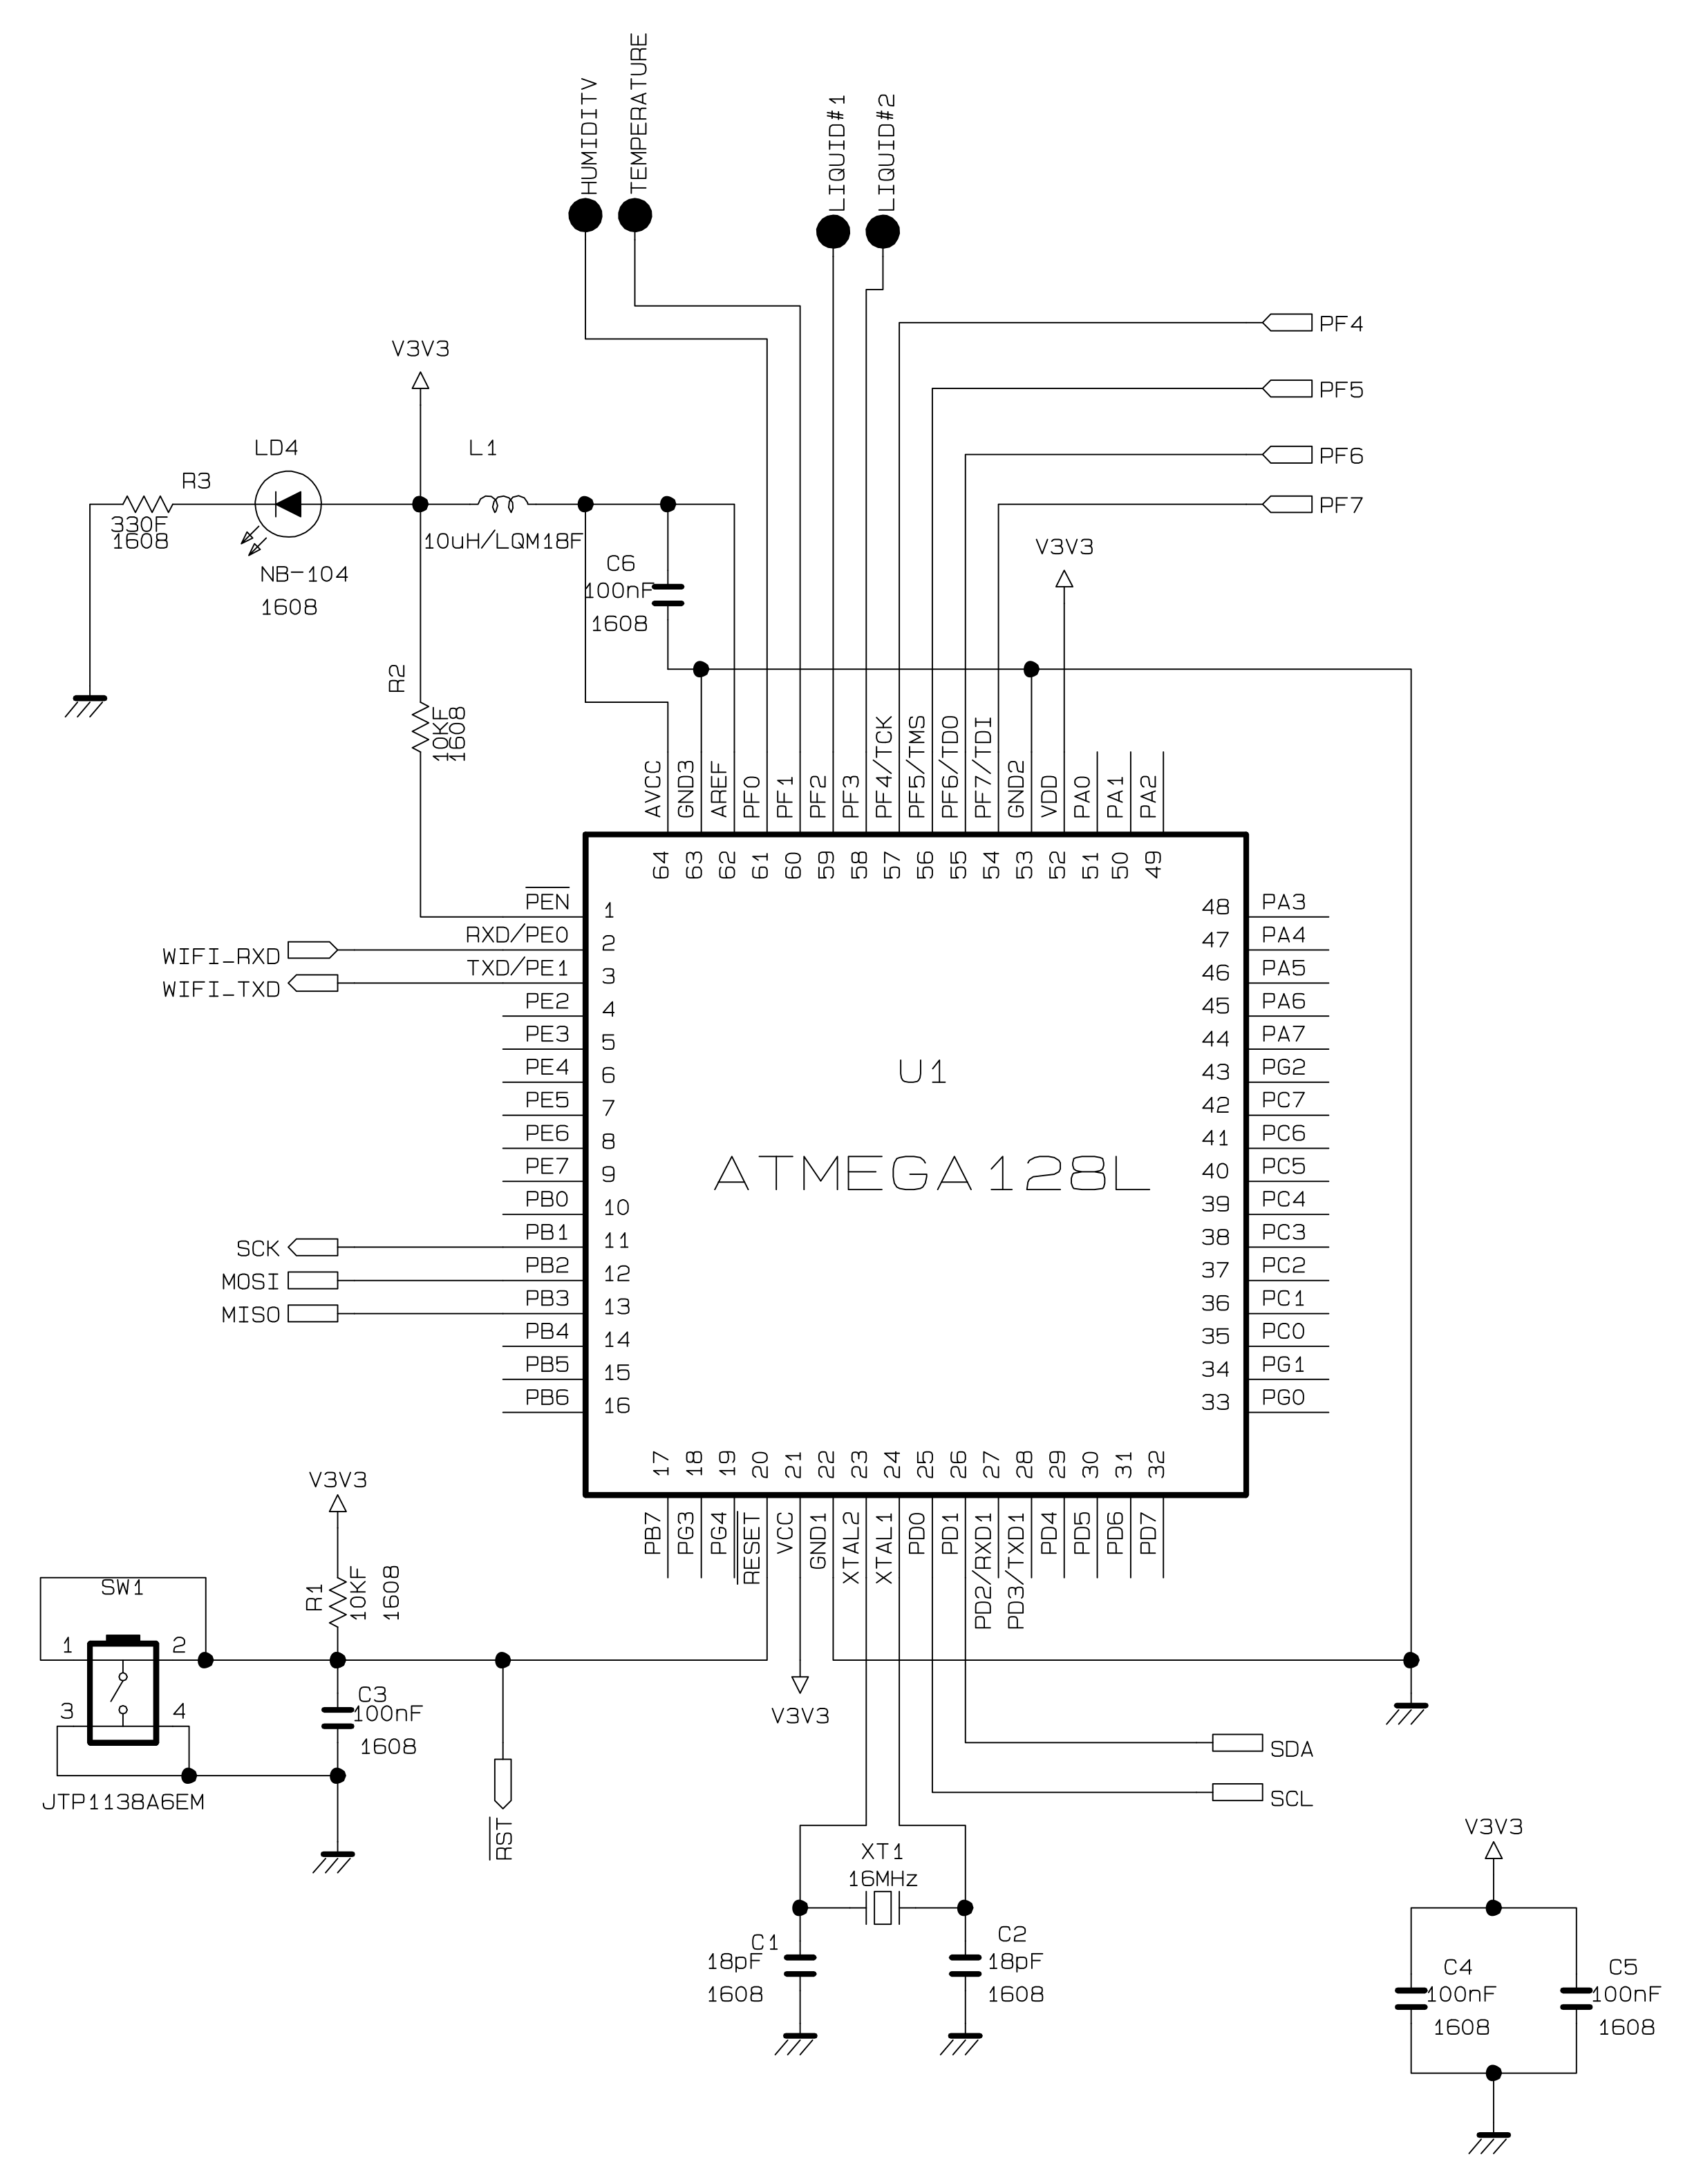
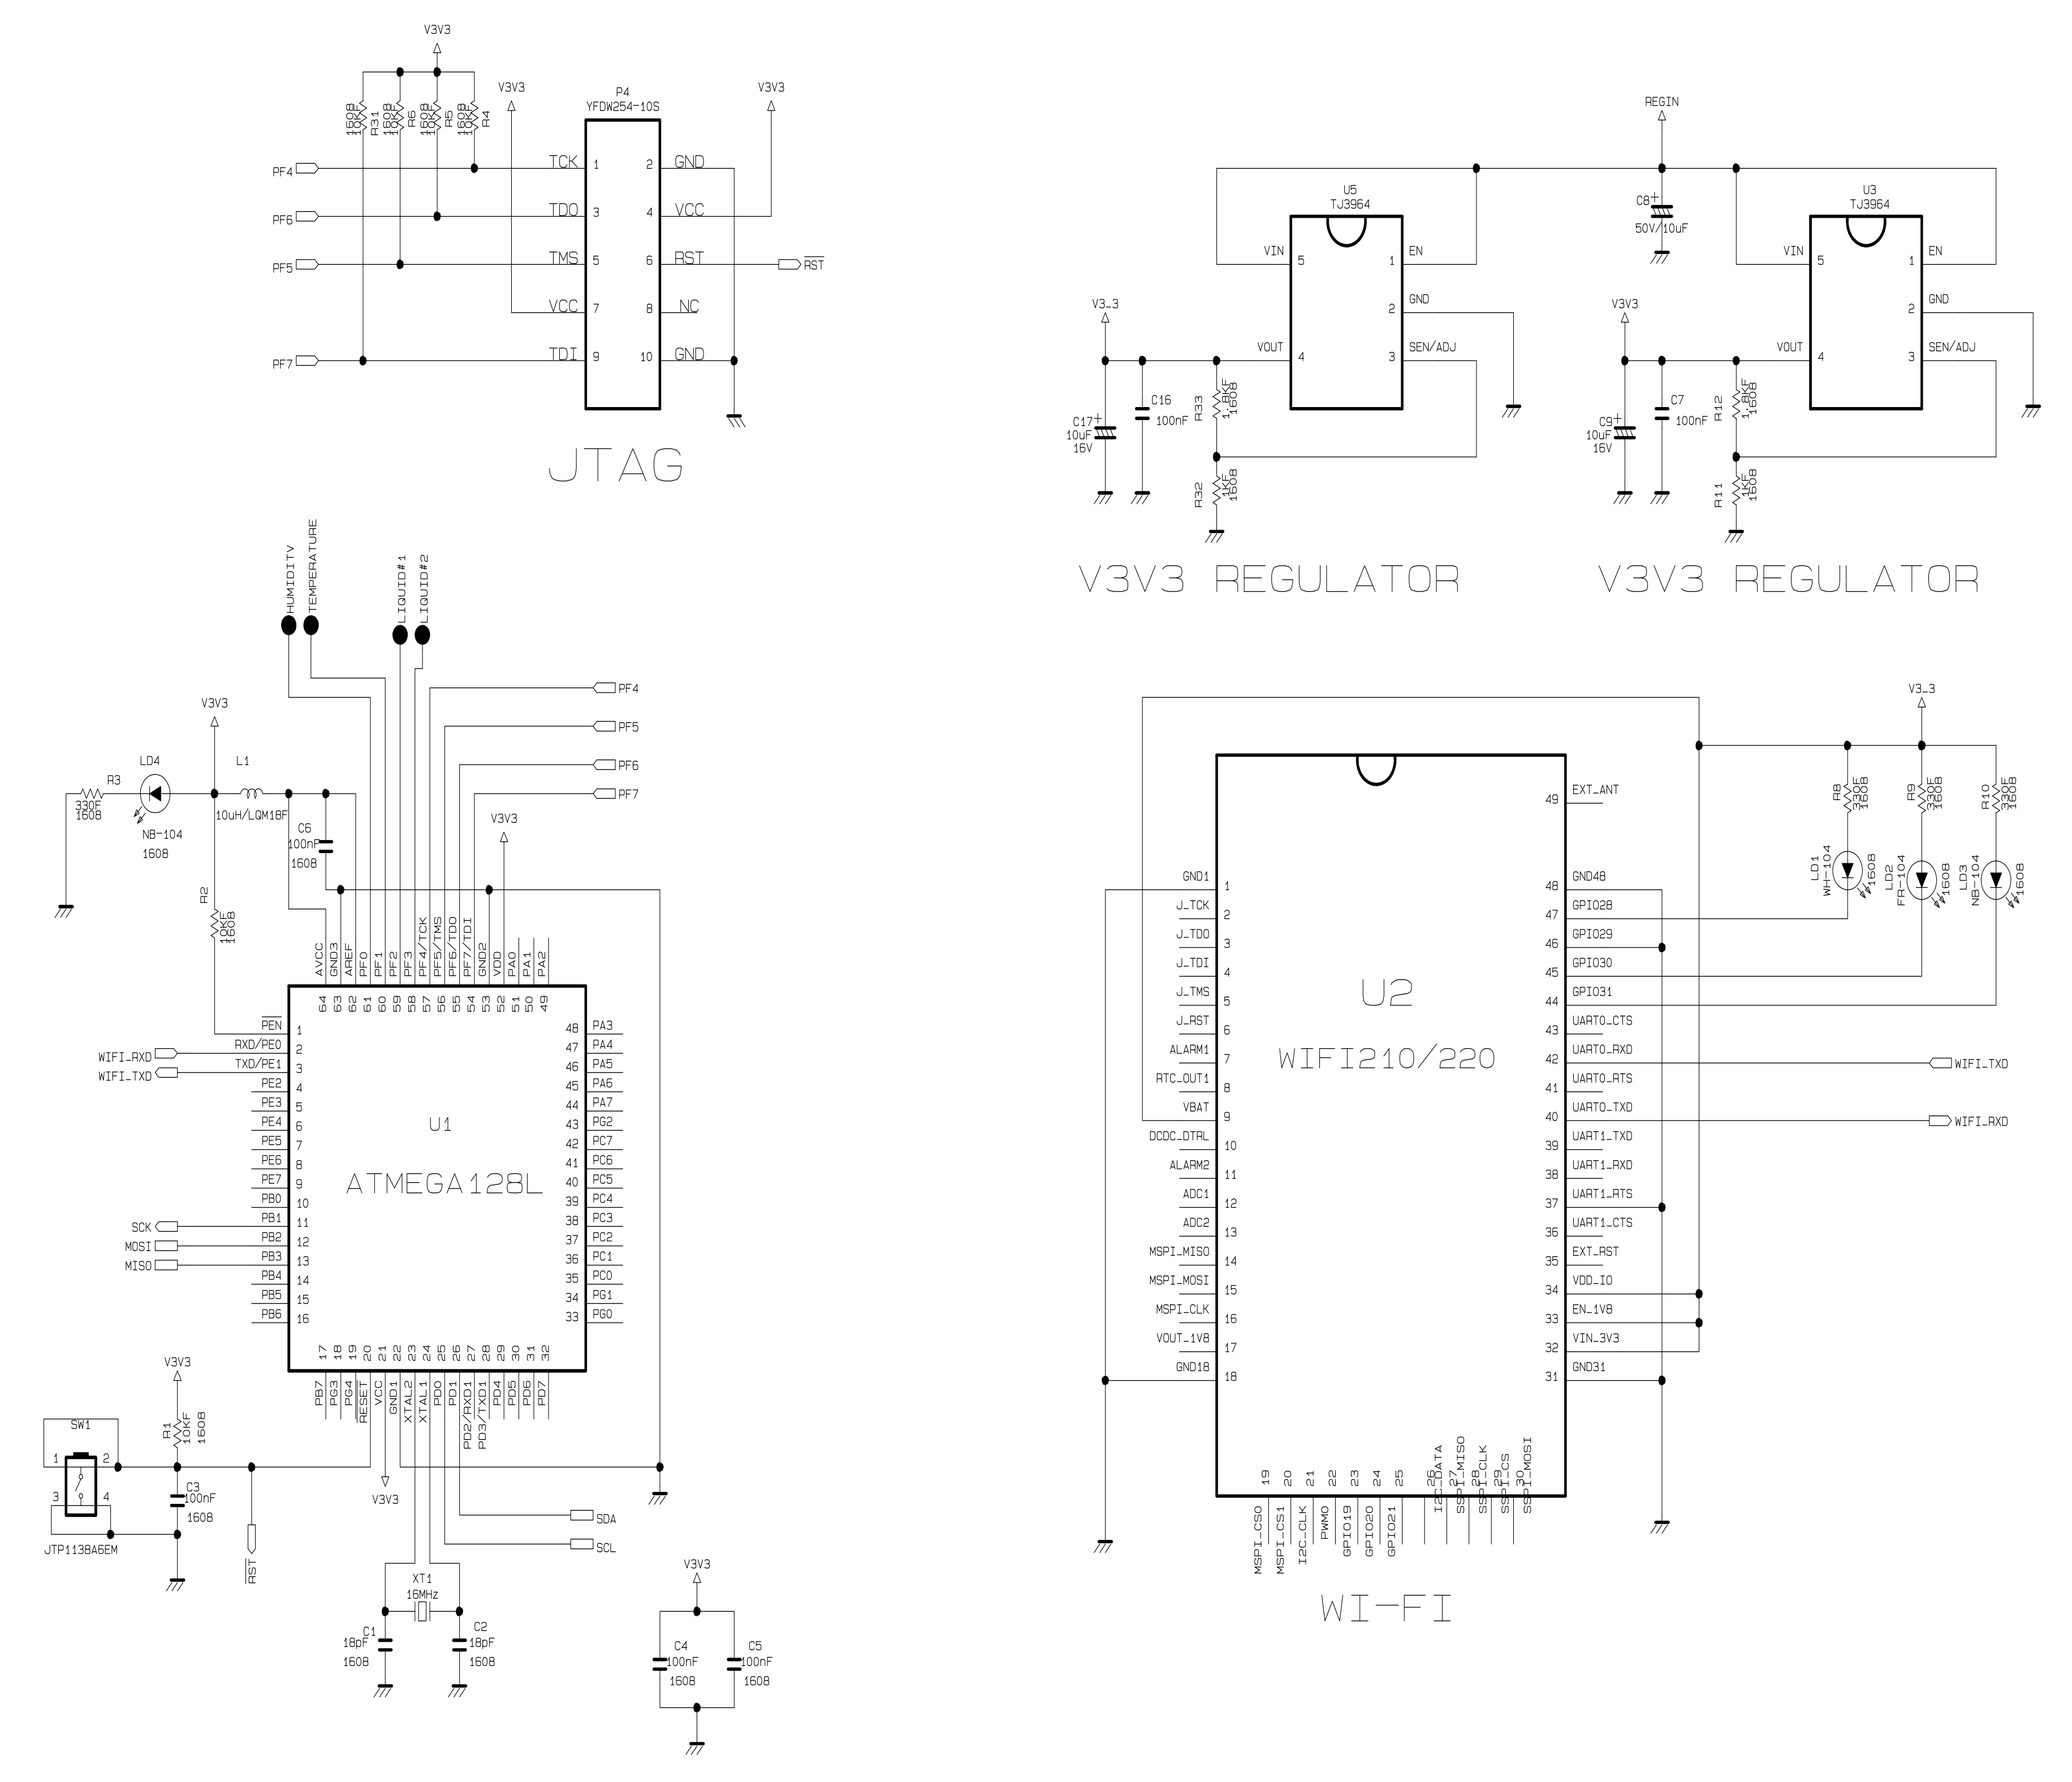
2.3. ATmega128a Microcontroller
We have used an ATmega128a microcontroller to integrate the BQ34Z110-based module with the temperature, humidity, liquid level sensors, and the WizFi210. The ATmega128a microcontroller is an 8-bit microcontroller with a 128-kB system programmable flash [
24]. It has a throughput up to 16 MHz at 16 million instructions per second (MIPS). Also, it has 53 programmable input/output lines and a 2.7–5.5 V operating voltage range. The schematic diagram of the ATmega128a microcontroller for our proposed method with the corresponding inputs is shown in
Figure 5. In our proposed method, the Jtag circuit communicates with the microcontroller. The program is burnt into the microcontroller using the JTag circuit.
2.4. WizFi
For transmitting the battery data over WLAN, we have used a WizFi210 [
25,
26]. The WizFi210 provides a quick and easy way to add WI-FI capabilities to the devices. The module supports a serial UART interface that enables connections to embedded designs using a 8/16/32-bit microcontroller. The module also supports a data rate up to 11 Mbps and is compliant with 802.11b. In the WizFi210 module, its Serial2WiFi interface can instruct the Wi-Fi radio to scan for access points and ad hoc networks with a specified service set identification (SSID), and basic service set identifier (BSSID) and/or channel for a specified scan time for access point scanning. The WizFi210 also supports both TCP and UDP operations. A total of 16 connections are allowed that can be specified during the compile time.
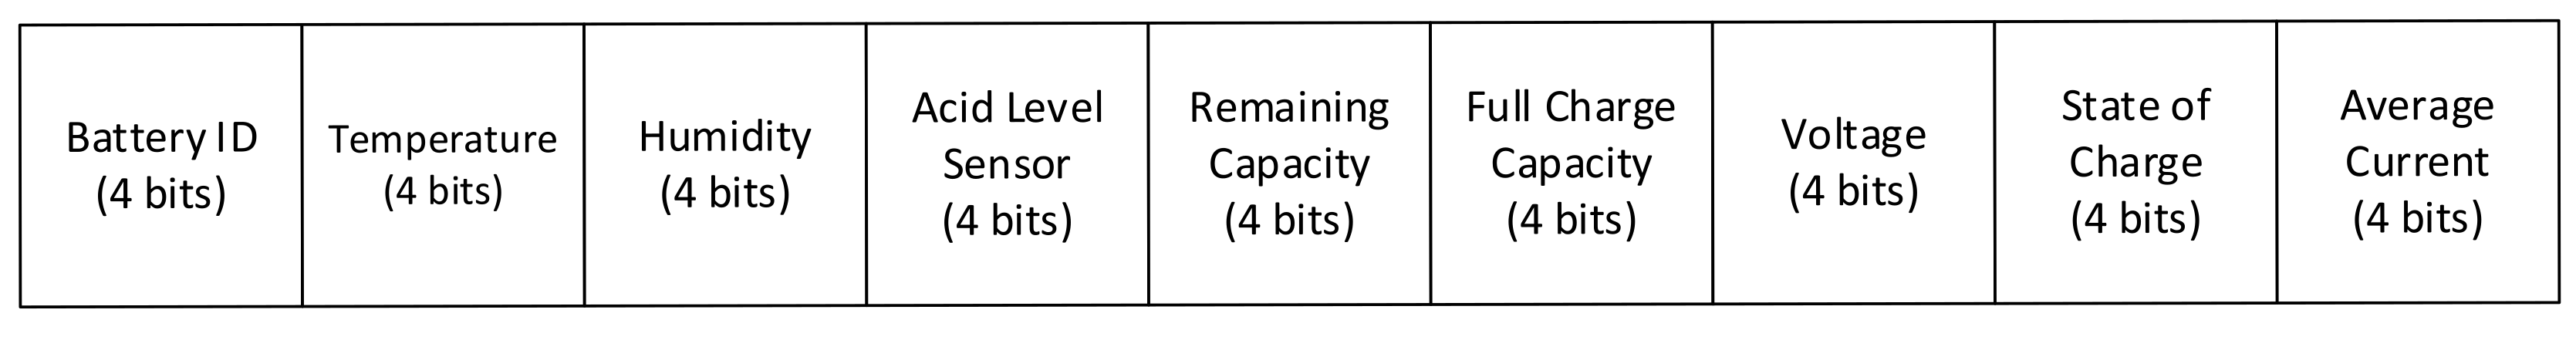
2.5. Data Frame of the Proposed System
A data frame is used for storing the data tables of our proposed system. It is a list of vectors of equal length. For our proposed system, the data from each battery is collected into respective data frames. The main objective in using the data frame is to ensure that only a receiver with a known data frame can decode the data from the battery. In beginning of the frame, the ID of the lead–acid battery is uniquely defined to differentiate the data from multiple batteries, as our proposed system can support multiple n-number of batteries connected to the network. The data frame for monitoring our proposed system is shown in
Figure 6 and the details of the data frame functions and units are summarized in
Table 1.
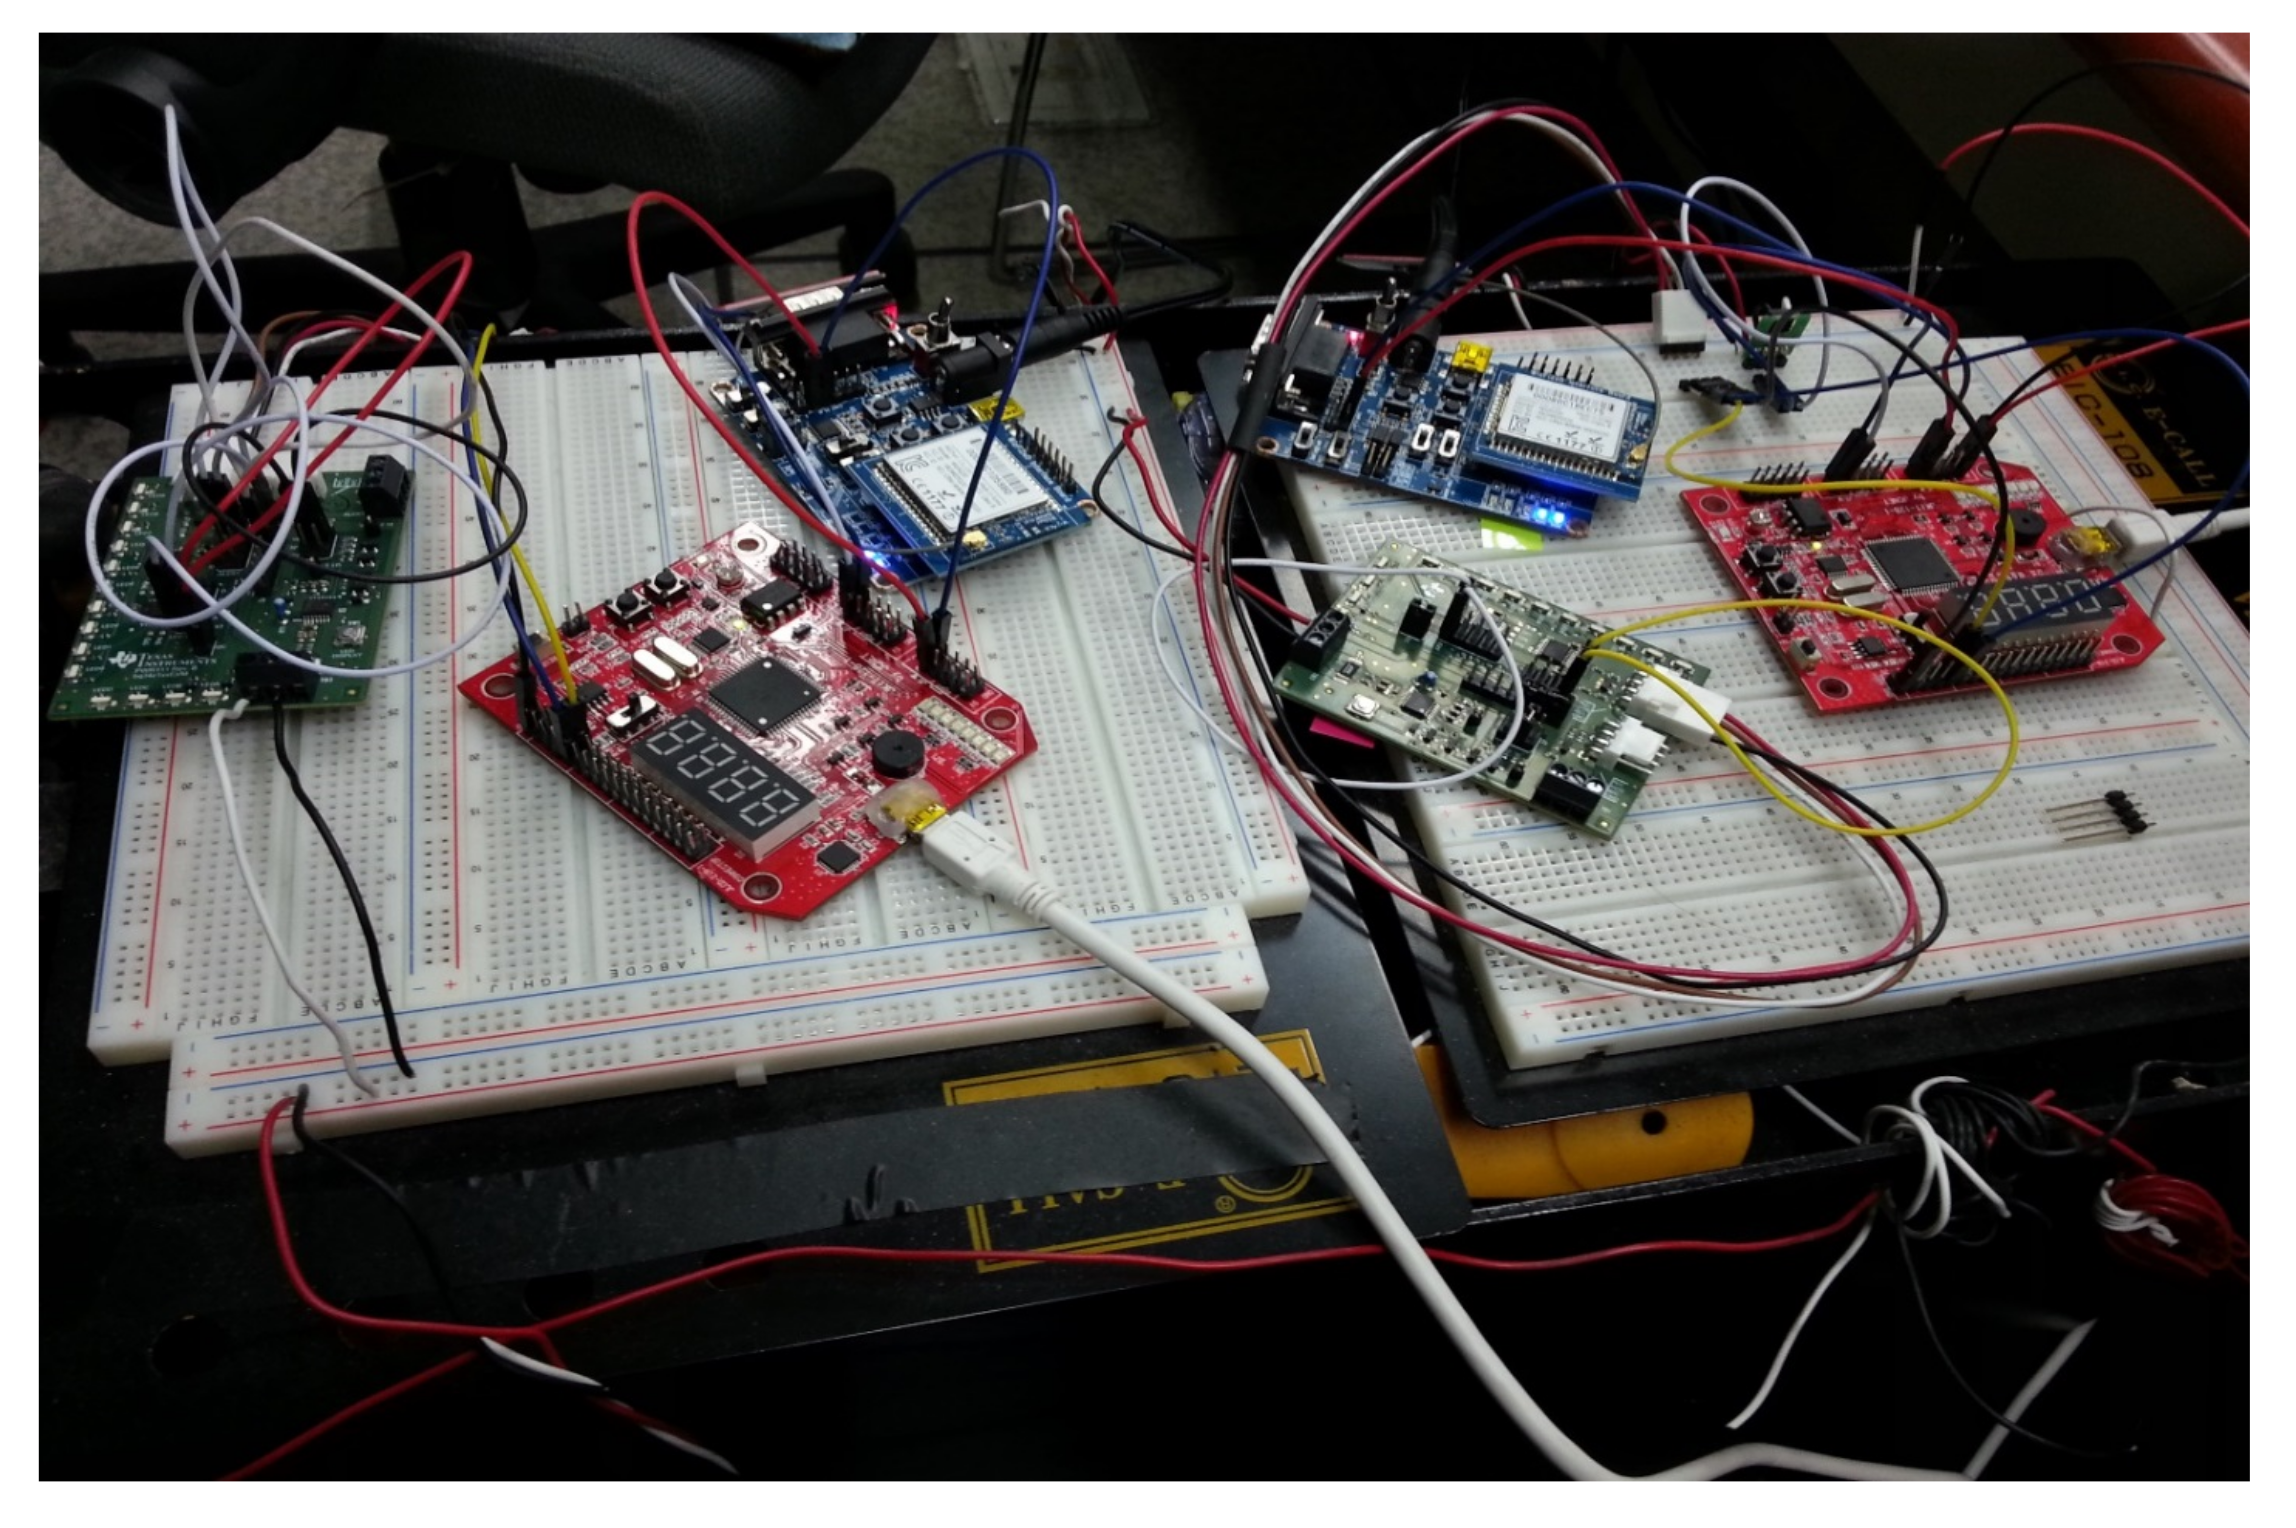
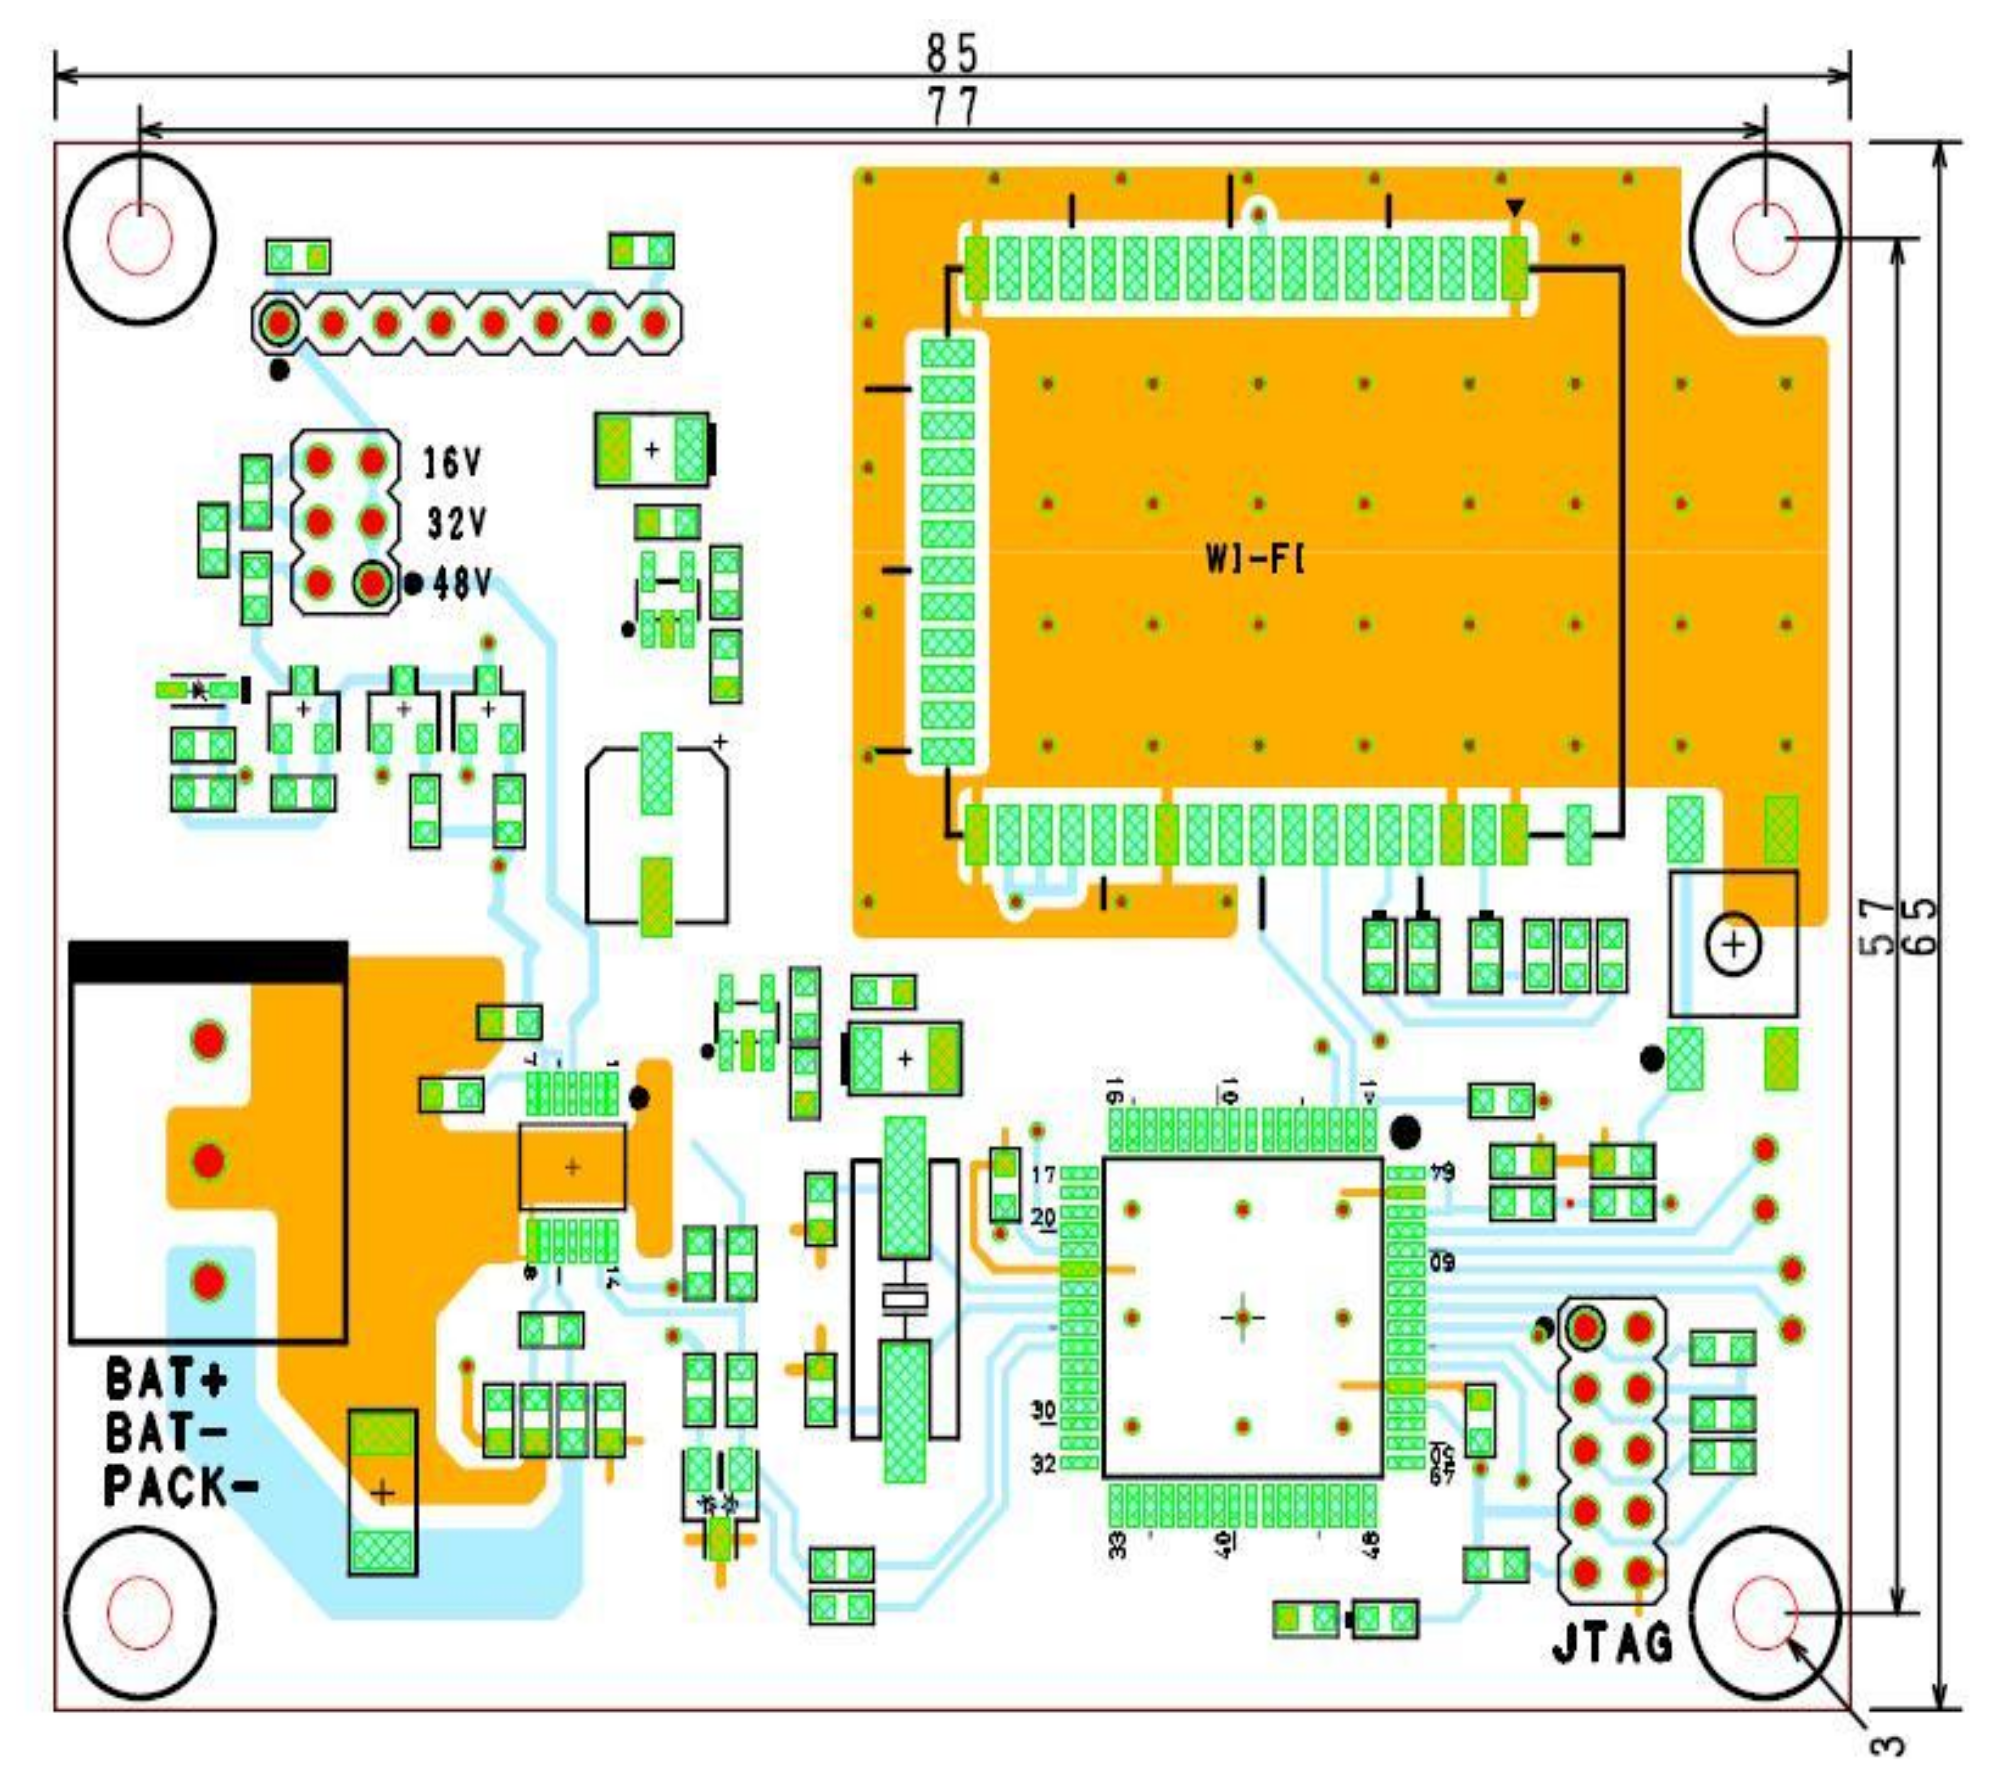
3. Testbed Implementation, Prototype, and Software Development
The testbed implementation, prototype, and software development for our proposed method is presented in this section. The basic setup and testbed is shown in
Figure 7 and
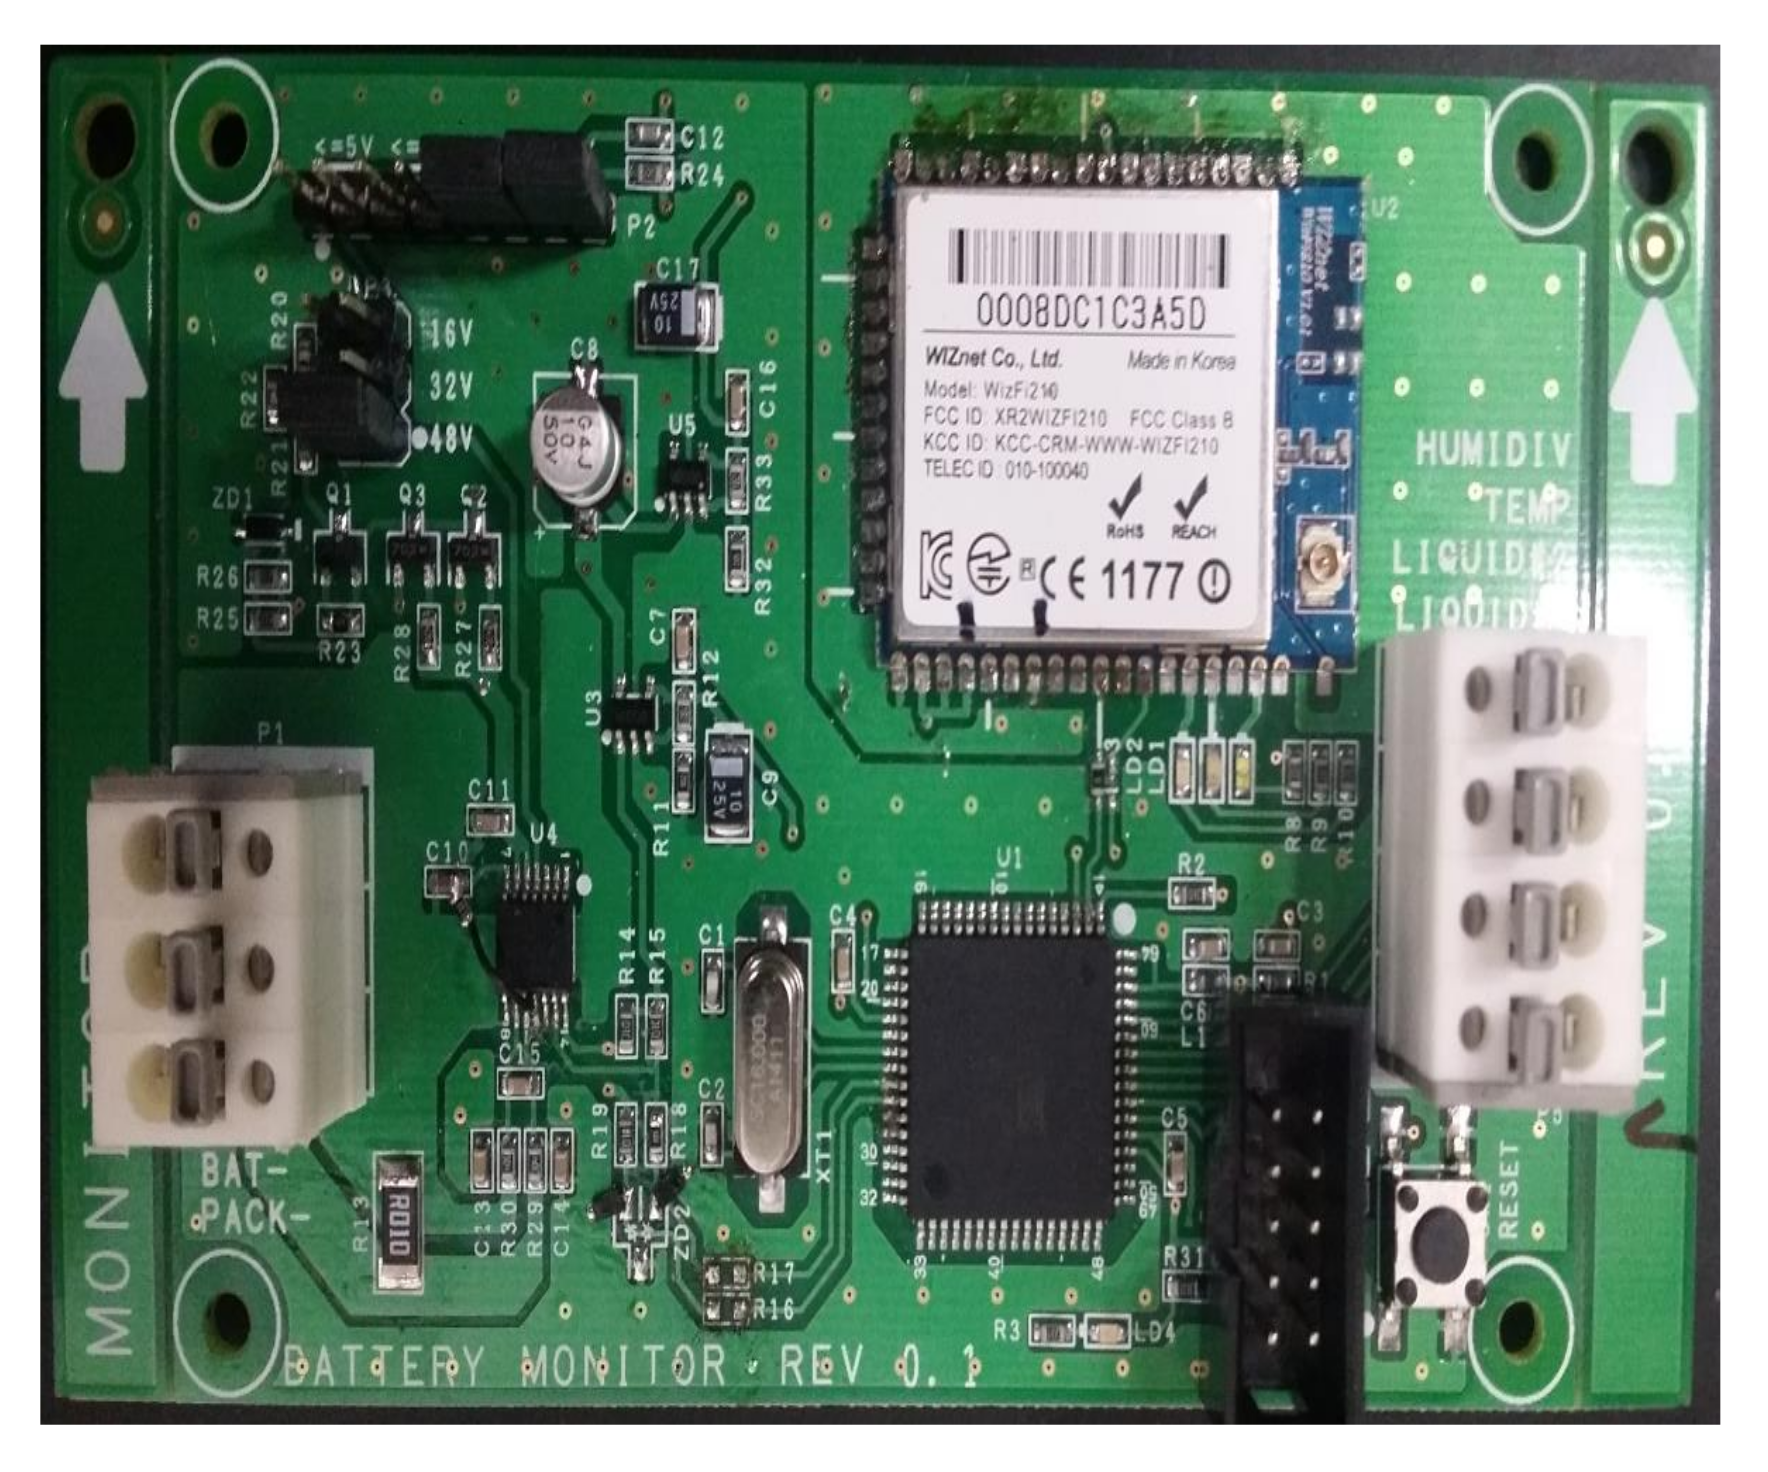
Figure 8, respectively. The BQ34Z110EVM board is connected to a microcontroller AtMega128a. We have used Port F to connect the analog input to the A/D converter. Port F is an input port only. The inputs of the humidity, temperature, and the liquid sensors are fed to port F as humidity PF.0, temperature PF.1 and both the outputs of the liquid level sensor to PF.2 and PF.3. Thus, the temperature and humidity sensor are connected to port PF.1 and PF.0 while the both the outputs of the liquid level sensor are connected to PF.2 and PF.3 of the microcontroller. The liquid level sensor has a common ground taken from the battery. All the information is collected from the battery using the BQ34Z110EVM and sent through the WLAN with the help of the microcontroller and the WizFi210 to the server and the android application. The data from the battery is transmitted using either a TCP or a UDP in real time, as explained in detail in the software development subsection. The printed circuit board (PCB) layout, PCB circuit diagram, and the final developed board of the proposed system are shown in
Figure 9,
Figure 10 and
Figure 11, respectively. For a fair comparison, we have compared our proposed prototype with existing devices such as the eGo! battery monitor from Philadelphia Scientific and the Bq34z100EVM, EV2400 from Texas Instruments, as shown in
Table 2.
3.1. Software Development
For processing the data from the lead–acid batteries in the microcontroller, C programming language is used. The data as shown in
Table 1 is processed in the microcontroller using C language. The different data fields of the battery such as the Battery ID, Temperature, Humidity, Acid Level Sensor, Remaining Capacity, Full Charge Capacity, Voltage, State of Charge, and the Average Current as shown in
Figure 9 constitute one data frame of the battery. The same data from an individual battery is cumulated into one data frame and sent periodically. The individual data frame of the battery is sent from the Wizfi to the server for further manipulation for a meaningful representation of the battery data display.
C♯ programming language is used to design the TCP/UDP server graphical user interface (GUI) for displaying the battery data. For our proposed battery monitoring system, we have designed both TCP- and UDP-based server socket programming. UDP is an alternate solution to the more commonly used TCP. The major difference between the two, with respect to sending data is that while the TCP has handshaking, the UDP does not have a handshaking mechanism. However, the UDP is more efficient than the TCP when sending the same data to multiple receivers.
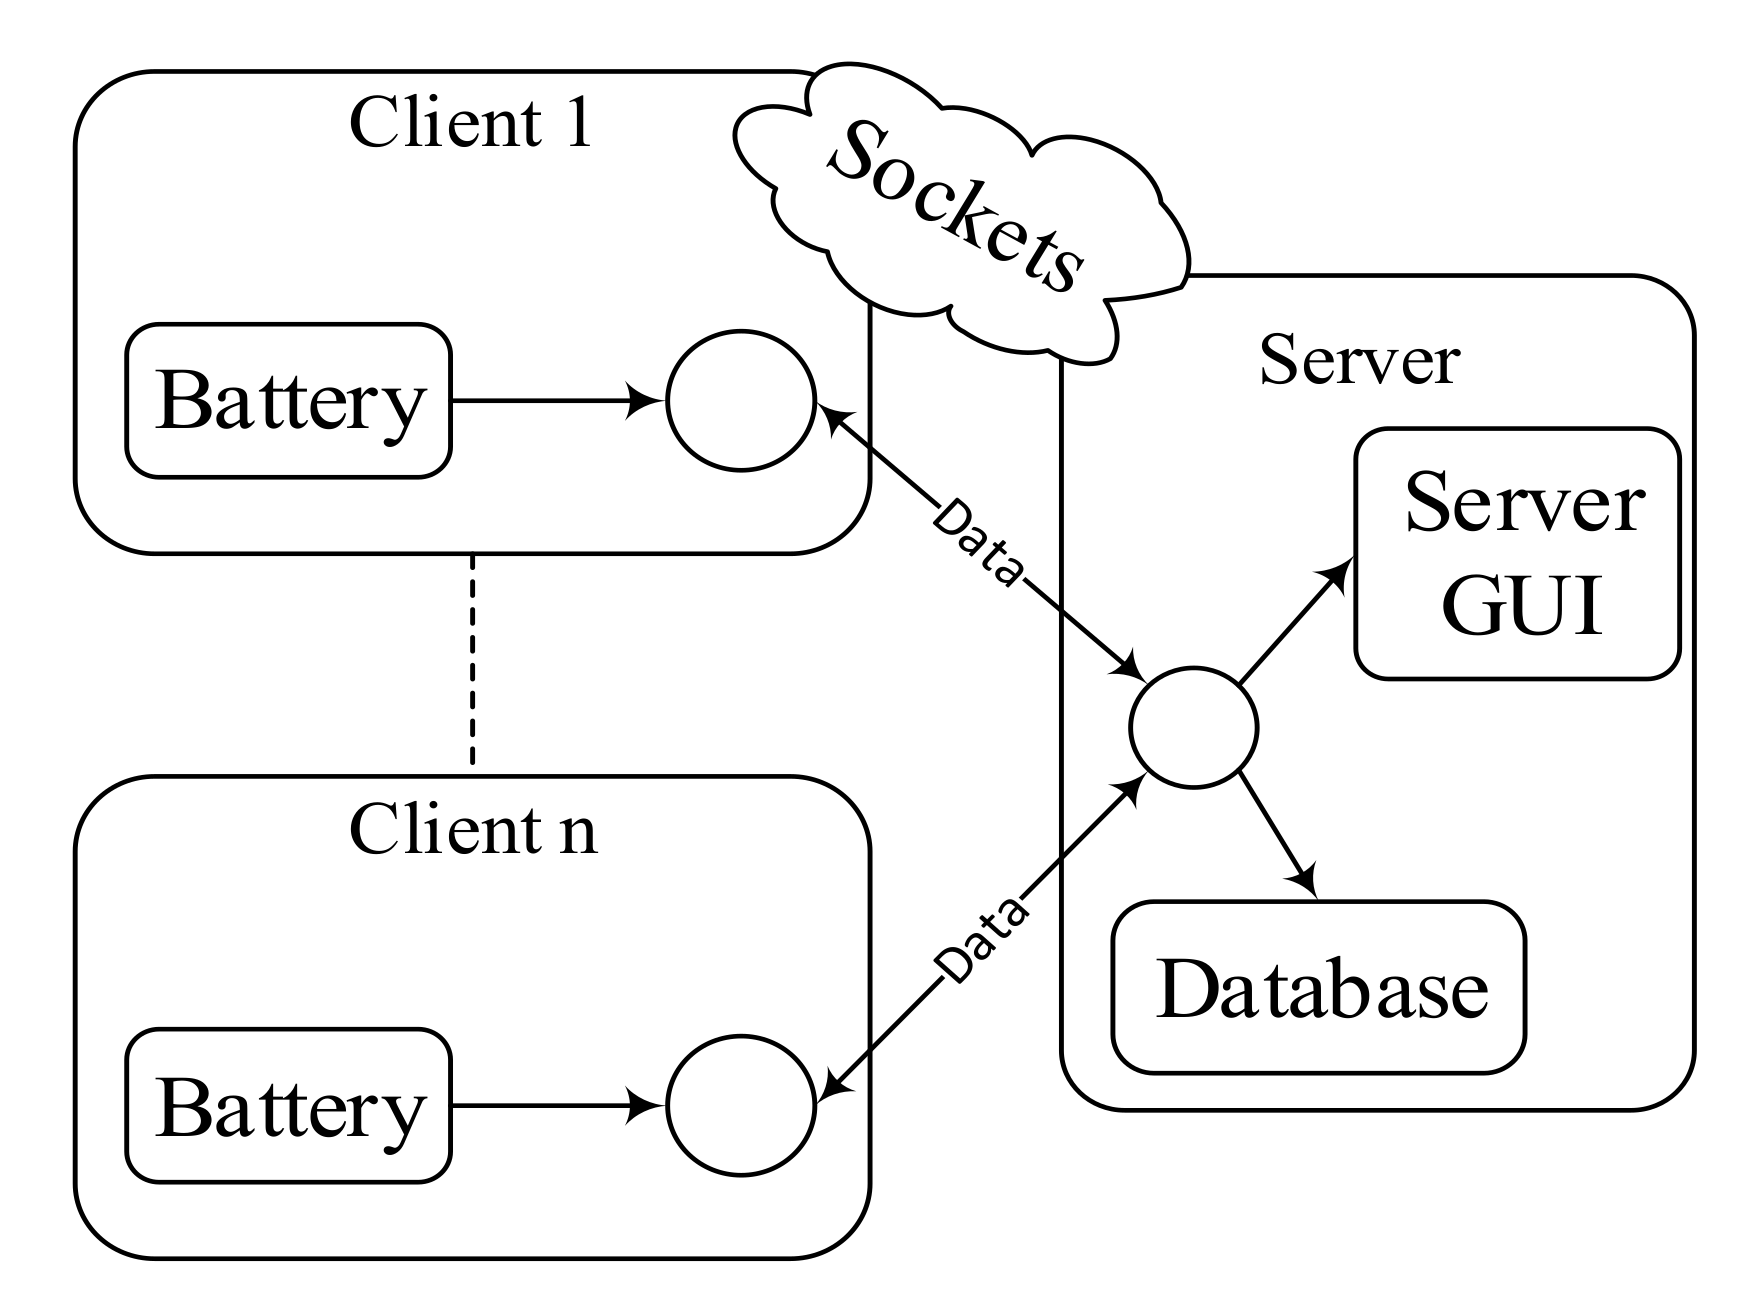
Choosing between the TCP and UDP is often an issue when streaming data over a network. The TCP will guarantee that all data is received at the logging side if a sensor is sending data to a logging application, for a point-to-point application. A more advanced TCP server-client code is needed if multiple clients would like the same guaranteed service. We get more network traffic once the data is transmitted to each client. If there are multiple clients that can tolerate some data loss, owing to the lack of handshaking, we can implement the communication using UDP. If the clients only listen to the stream, then it is far easier to use UDP for distributing one stream to many clients than using TCP, implementation-wise. A server socket programming framework for our proposed system is shown in
Figure 12.
3.2. TCP Server Socket-Based GUI
In our C♯ TCP server socket program, the server terminal opens the specified TCP port. It waits for the battery’s (client) connection, takes multiple connections and listens to the connected battery’s messages (bytes array). Every battery client that is connected to the TCP server is wrapped-up in the connected battery client object and it gets added to the battery collection. The connected battery client is instantiated for each battery that connects to the server. The messages coming from the connected battery client utilize the socket listener class that listens and delegates the message. The TCP server host instantiates the server terminal, registers for the appropriate events and calls the start listening class. As a result, multiple battery clients start sending messages by connecting to the specified port. Server terminals listen to the messages coming to a socket, allowed by the socket listener class. The socket listener determines whether the arrived message represents a new data or whether it represents a ‘connection dropped’ message. It calls forth the message received event and waits for the next message in case the arrived message represents a new data; it calls forth the disconnected event and exits in case the message indicates that the connection has been dropped.
The battery client’s message that arrives in the server is a stream of bytes of an array that constitutes one data frame, as explained earlier in
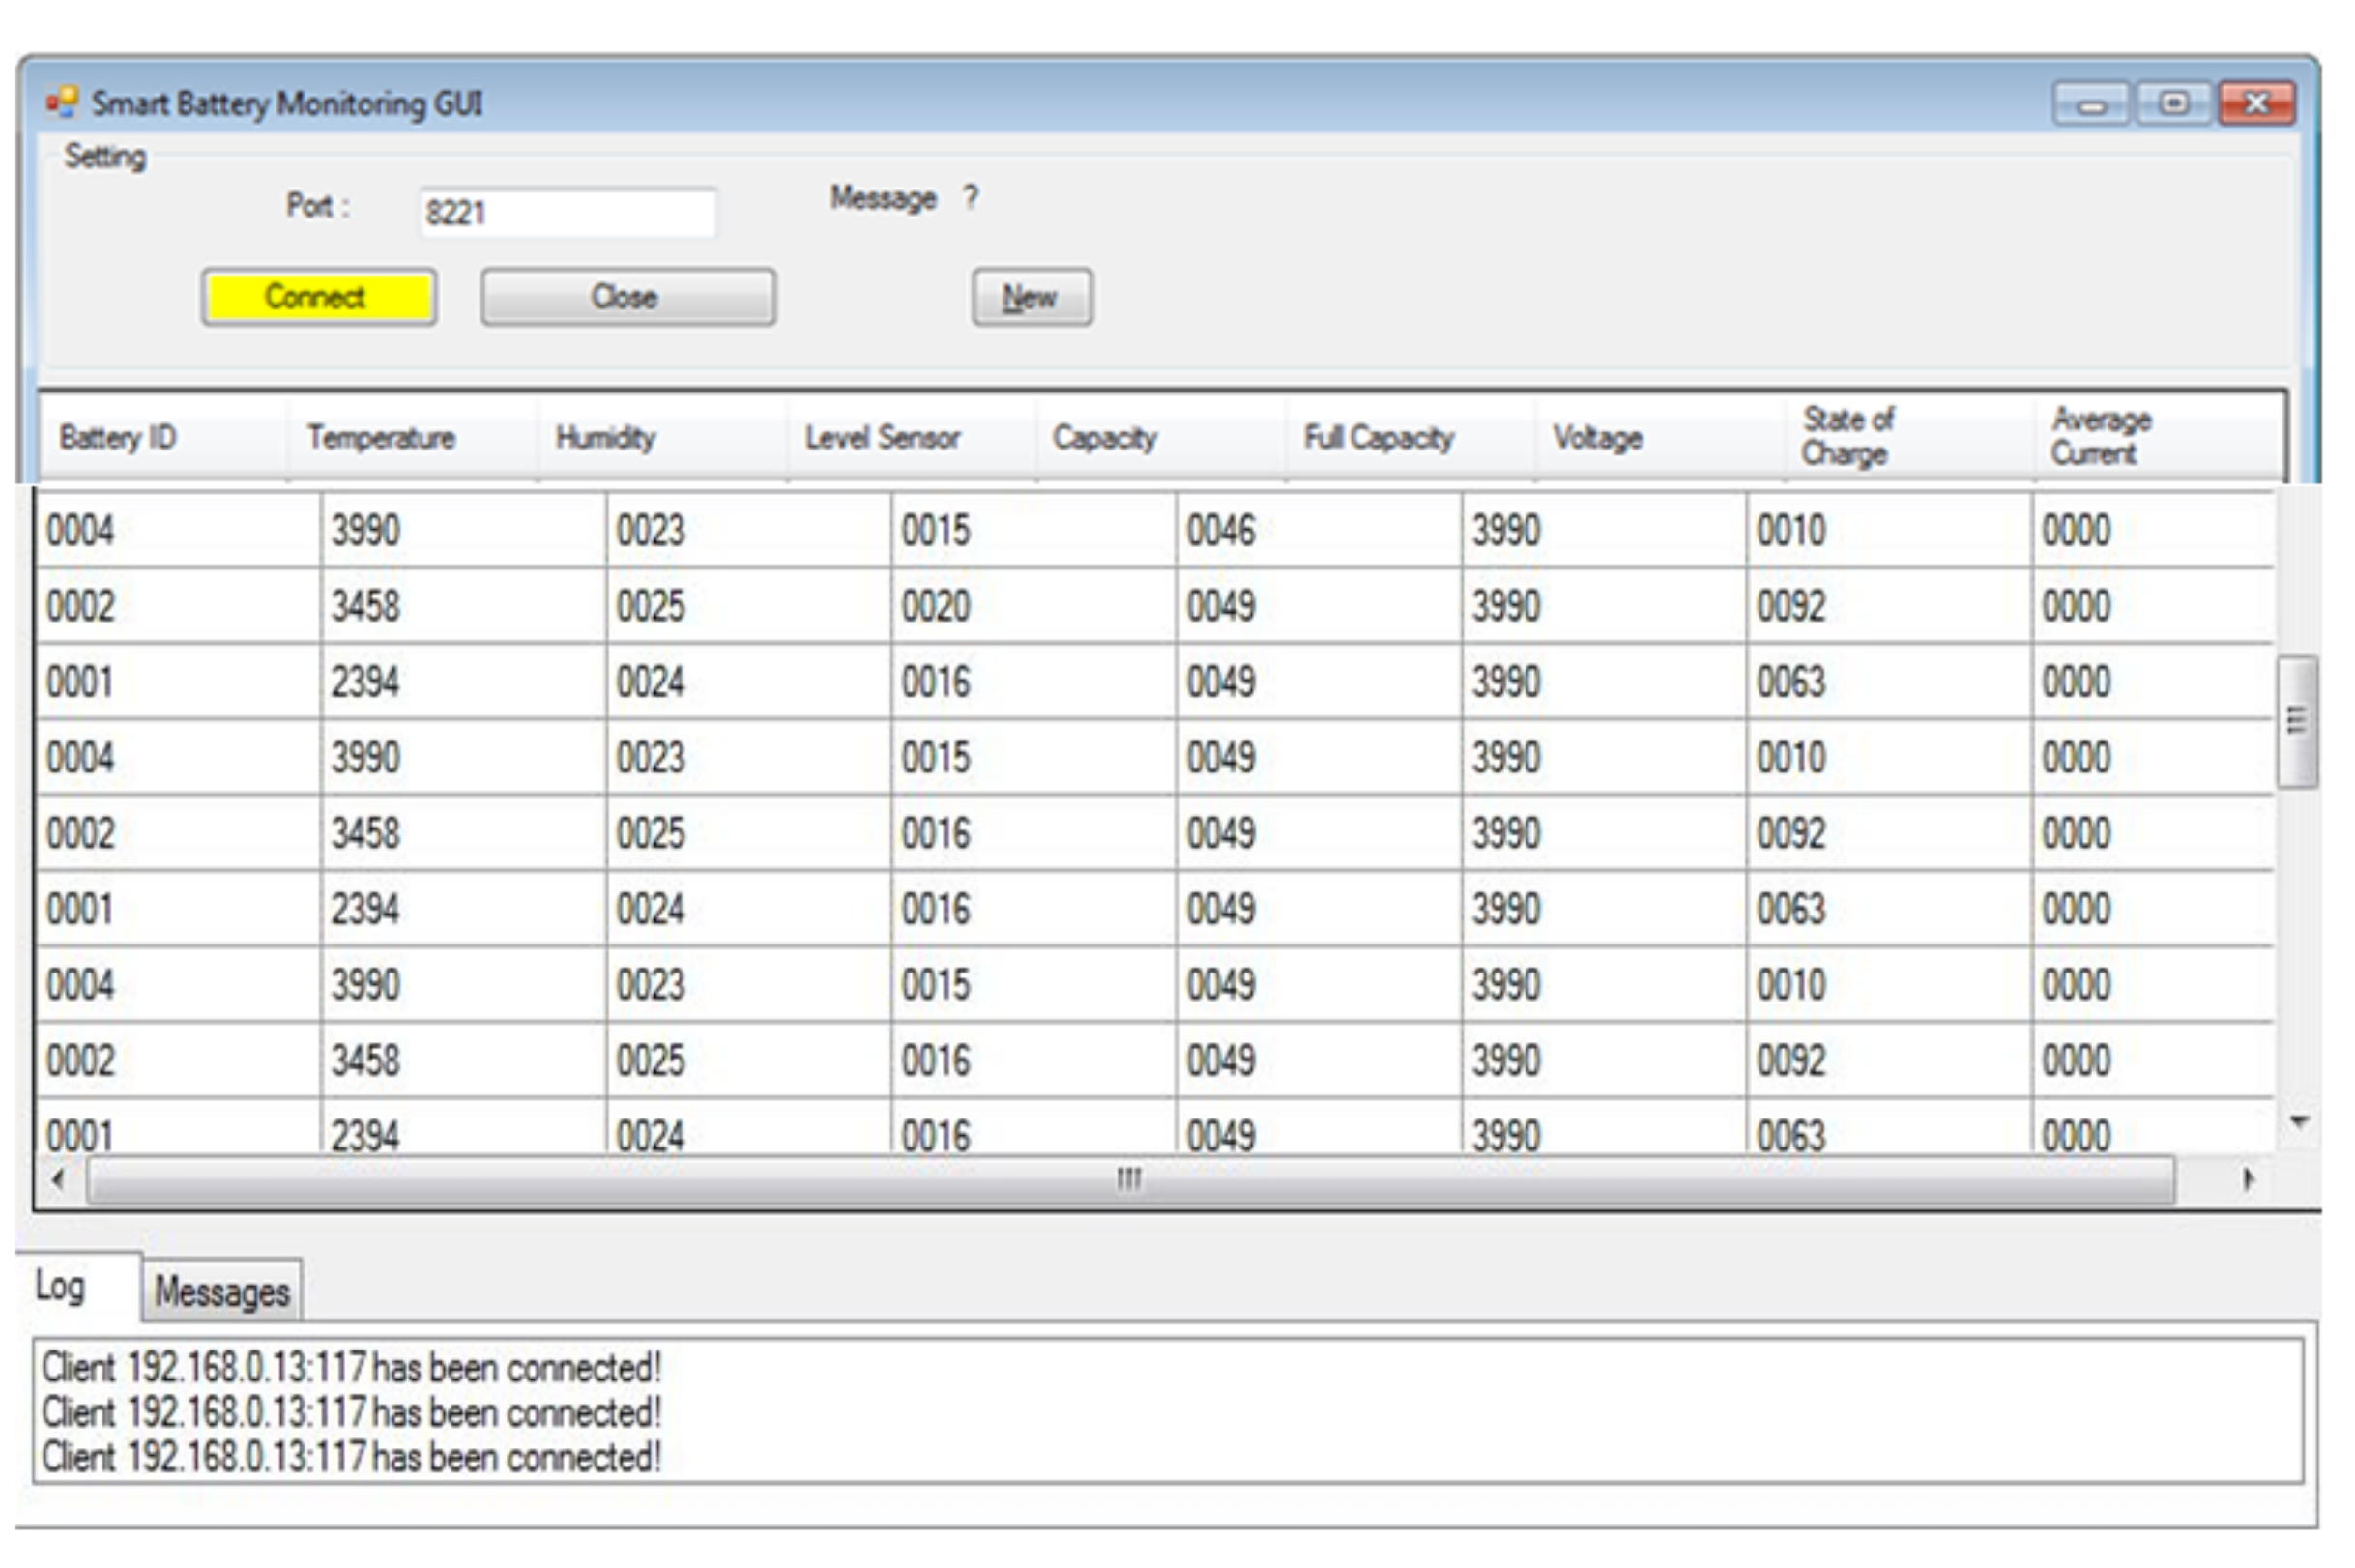
Section 2.5. Based on the unique battery id that is represented by the first four bits of the data frame, we divide the received data frame into four bits each and display it in the data-grid-view for a meaningful representation. The battery’s data is divided and displayed in the respective columns and the newly-connected battery’s data is added continually in same manner in next rows of the data-grid-view.
Figure 13 shows the TCP server socket GUI for our proposed system with three clients connected and receiving the data in real-time.
3.3. UDP Server Socket-Based GUI
The UDP can fire-off a message and immediately free the server-side network resources as it is a connectionless protocol. This also makes the UDP one of the easiest protocols to write a client/server application for. Also, the UDP preserves message boundaries, transmitting entire messages at once.
In our C♯-based UDP server socket GUI program, we define and create a new battery object. We set the inbound client port number. By using the UdpClient, our job of implementing the UDP was greatly simplified. The client is created using the set local port. The battery client object is declared with events because it implements two events: the ‘before receiveiving’ event and the ‘after receiveiving’ event. The event ‘before receiving’ is fired immediately before receiving the data. The ‘after receiving’ event is fired immediately after the battery client finishes receiving the data.
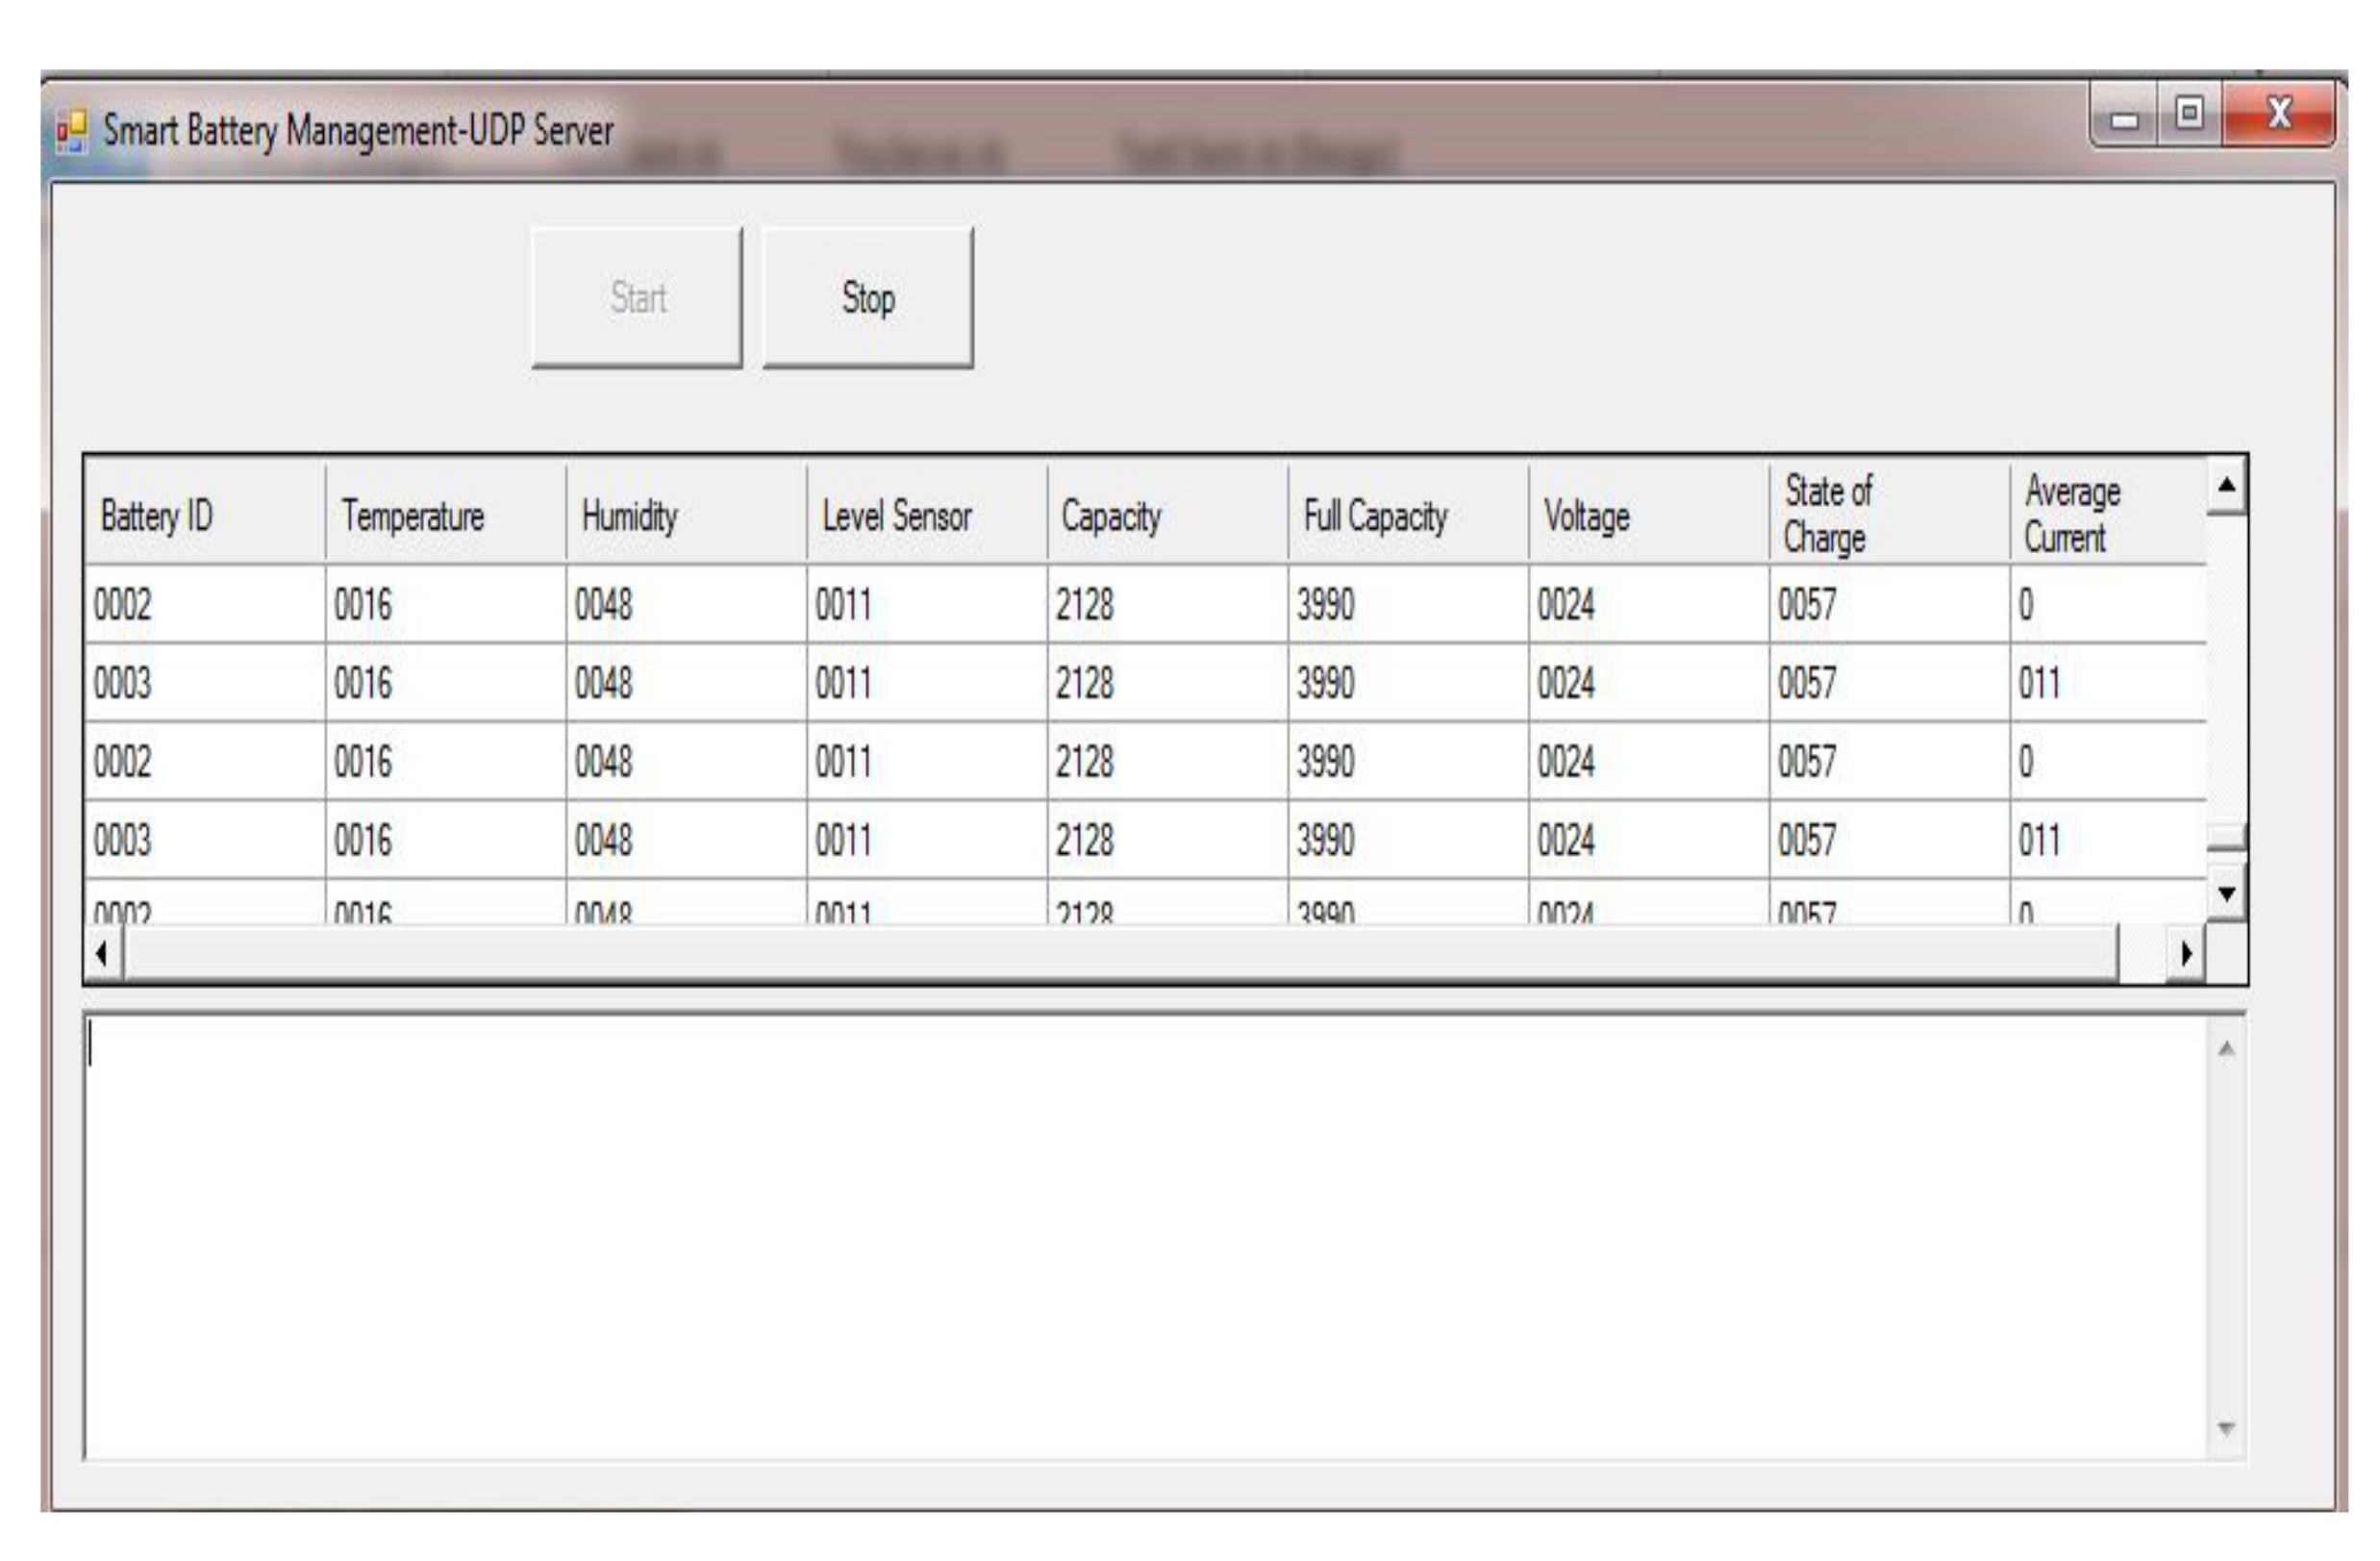
Figure 14 shows the UDP server socket GUI for our proposed system with two battery clients connected, receiving, and displaying the data in real-time. The data frame of the battery client is divided and displayed in the data-grid-view, as explained in the previous subsection. The start method in our program fires-off a worker thread that in turn waits for the data. We have set it on a separate worker thread because the receive method blocks the current thread until it is completed and we do not want it to lock-up our user interface. The thread exits immediately after a message is received by the worker thread. Hence, we start a new worker thread to continue waiting for the next message as these events are fired from the worker thread. This is necessary because of the nature of multi-threaded applications; the GUI from a worker thread should never be updated, the invoking required should always be checked and invoking used if it is true. Finally, when completed, the stop method should be fired to stop the worker thread and cleanly dispose the UDP battery client. The received messages in the server from three clients as shown in
Figure 14 are divided and displayed in the data-grid-view in the same way as explained in the previous sub-section.
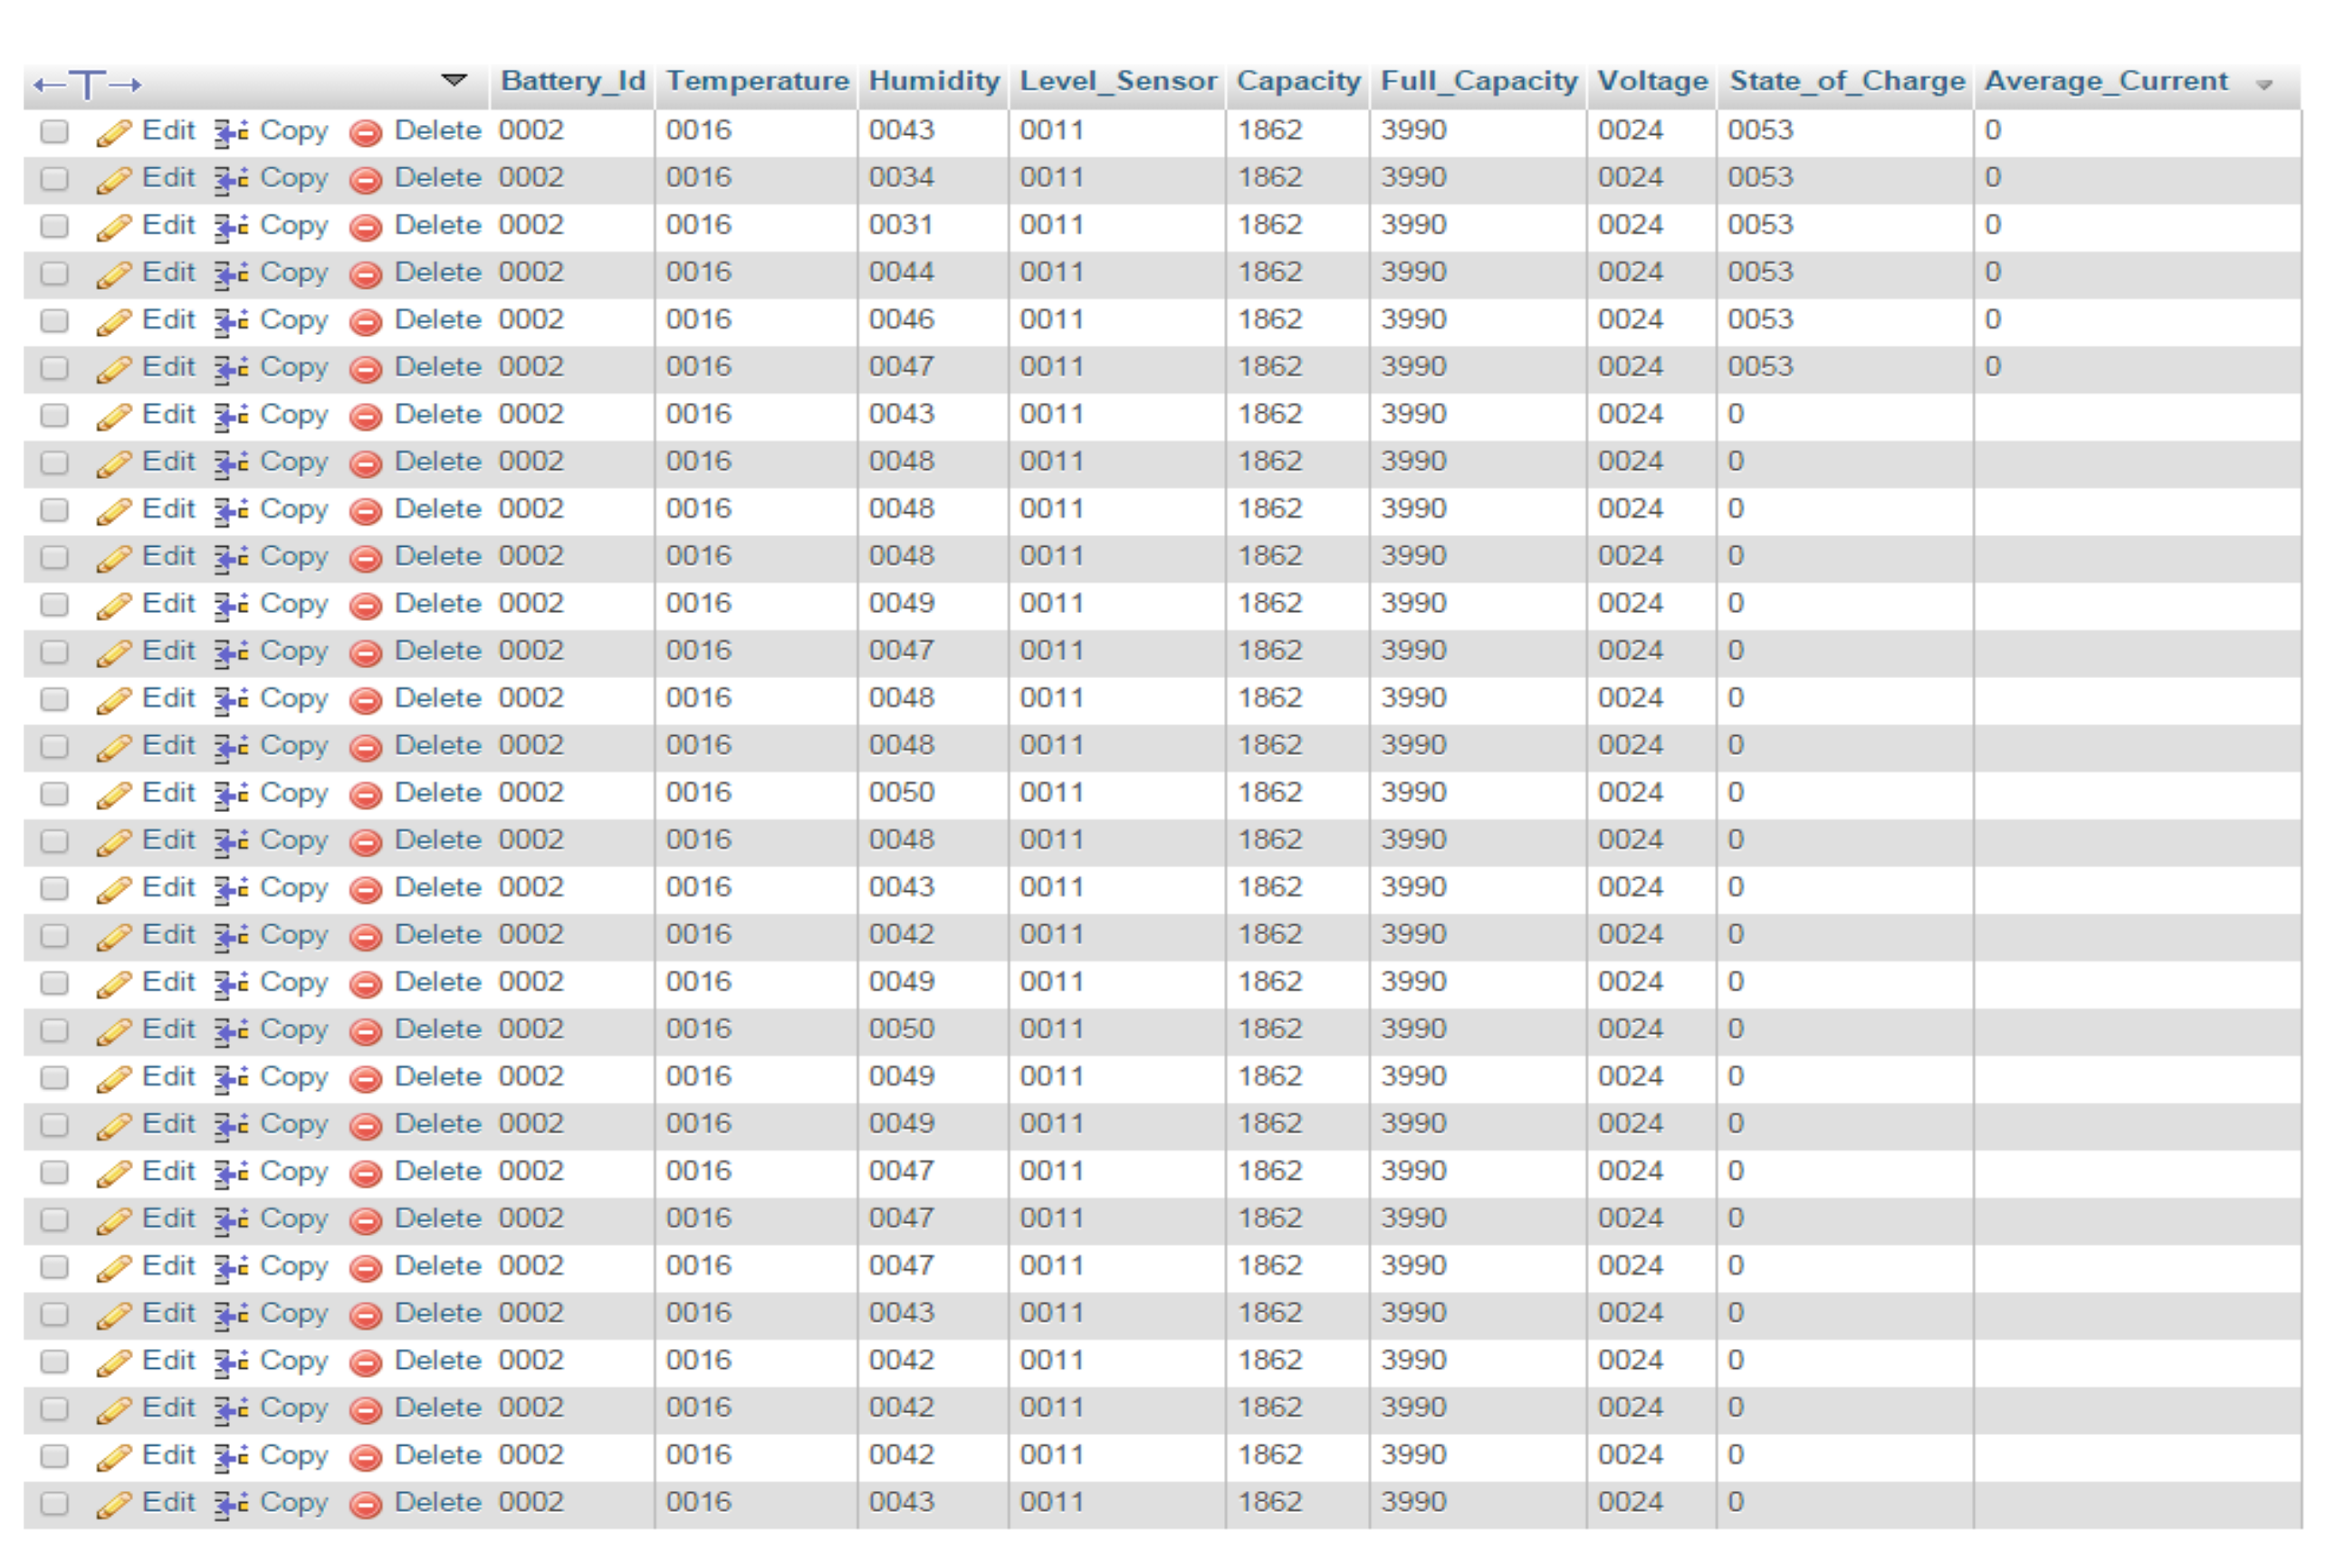
3.4. Database and Display Chart
Database management is most useful in providing a centralized view of the data that can be accessed by multiple users from multiple locations, in a controlled manner [
29]. It can limit the data that the end user can see, as well as how that end user can view the data, providing many views of a single database schema. End users and software programs are free from having to understand where the data is physically located or on what type of storage media it resides because the database handles all the requests. The greatest advantage of using a database is that it lets end users access and use the same data while managing data integrity. Instead of creating new iterations of the same data stored in new files for every new application, data is better protected and maintained when it can be shared using a database. The database provides a central store for data that can be accessed by multiple users in a controlled manner.
For our proposed battery monitoring system, we have designed the database using MySQL [
30]. The divided data in the TCP/UDP server GUI is automatically saved into our database where multiple battery data can be easily maintained and stored over a period of time, as shown in
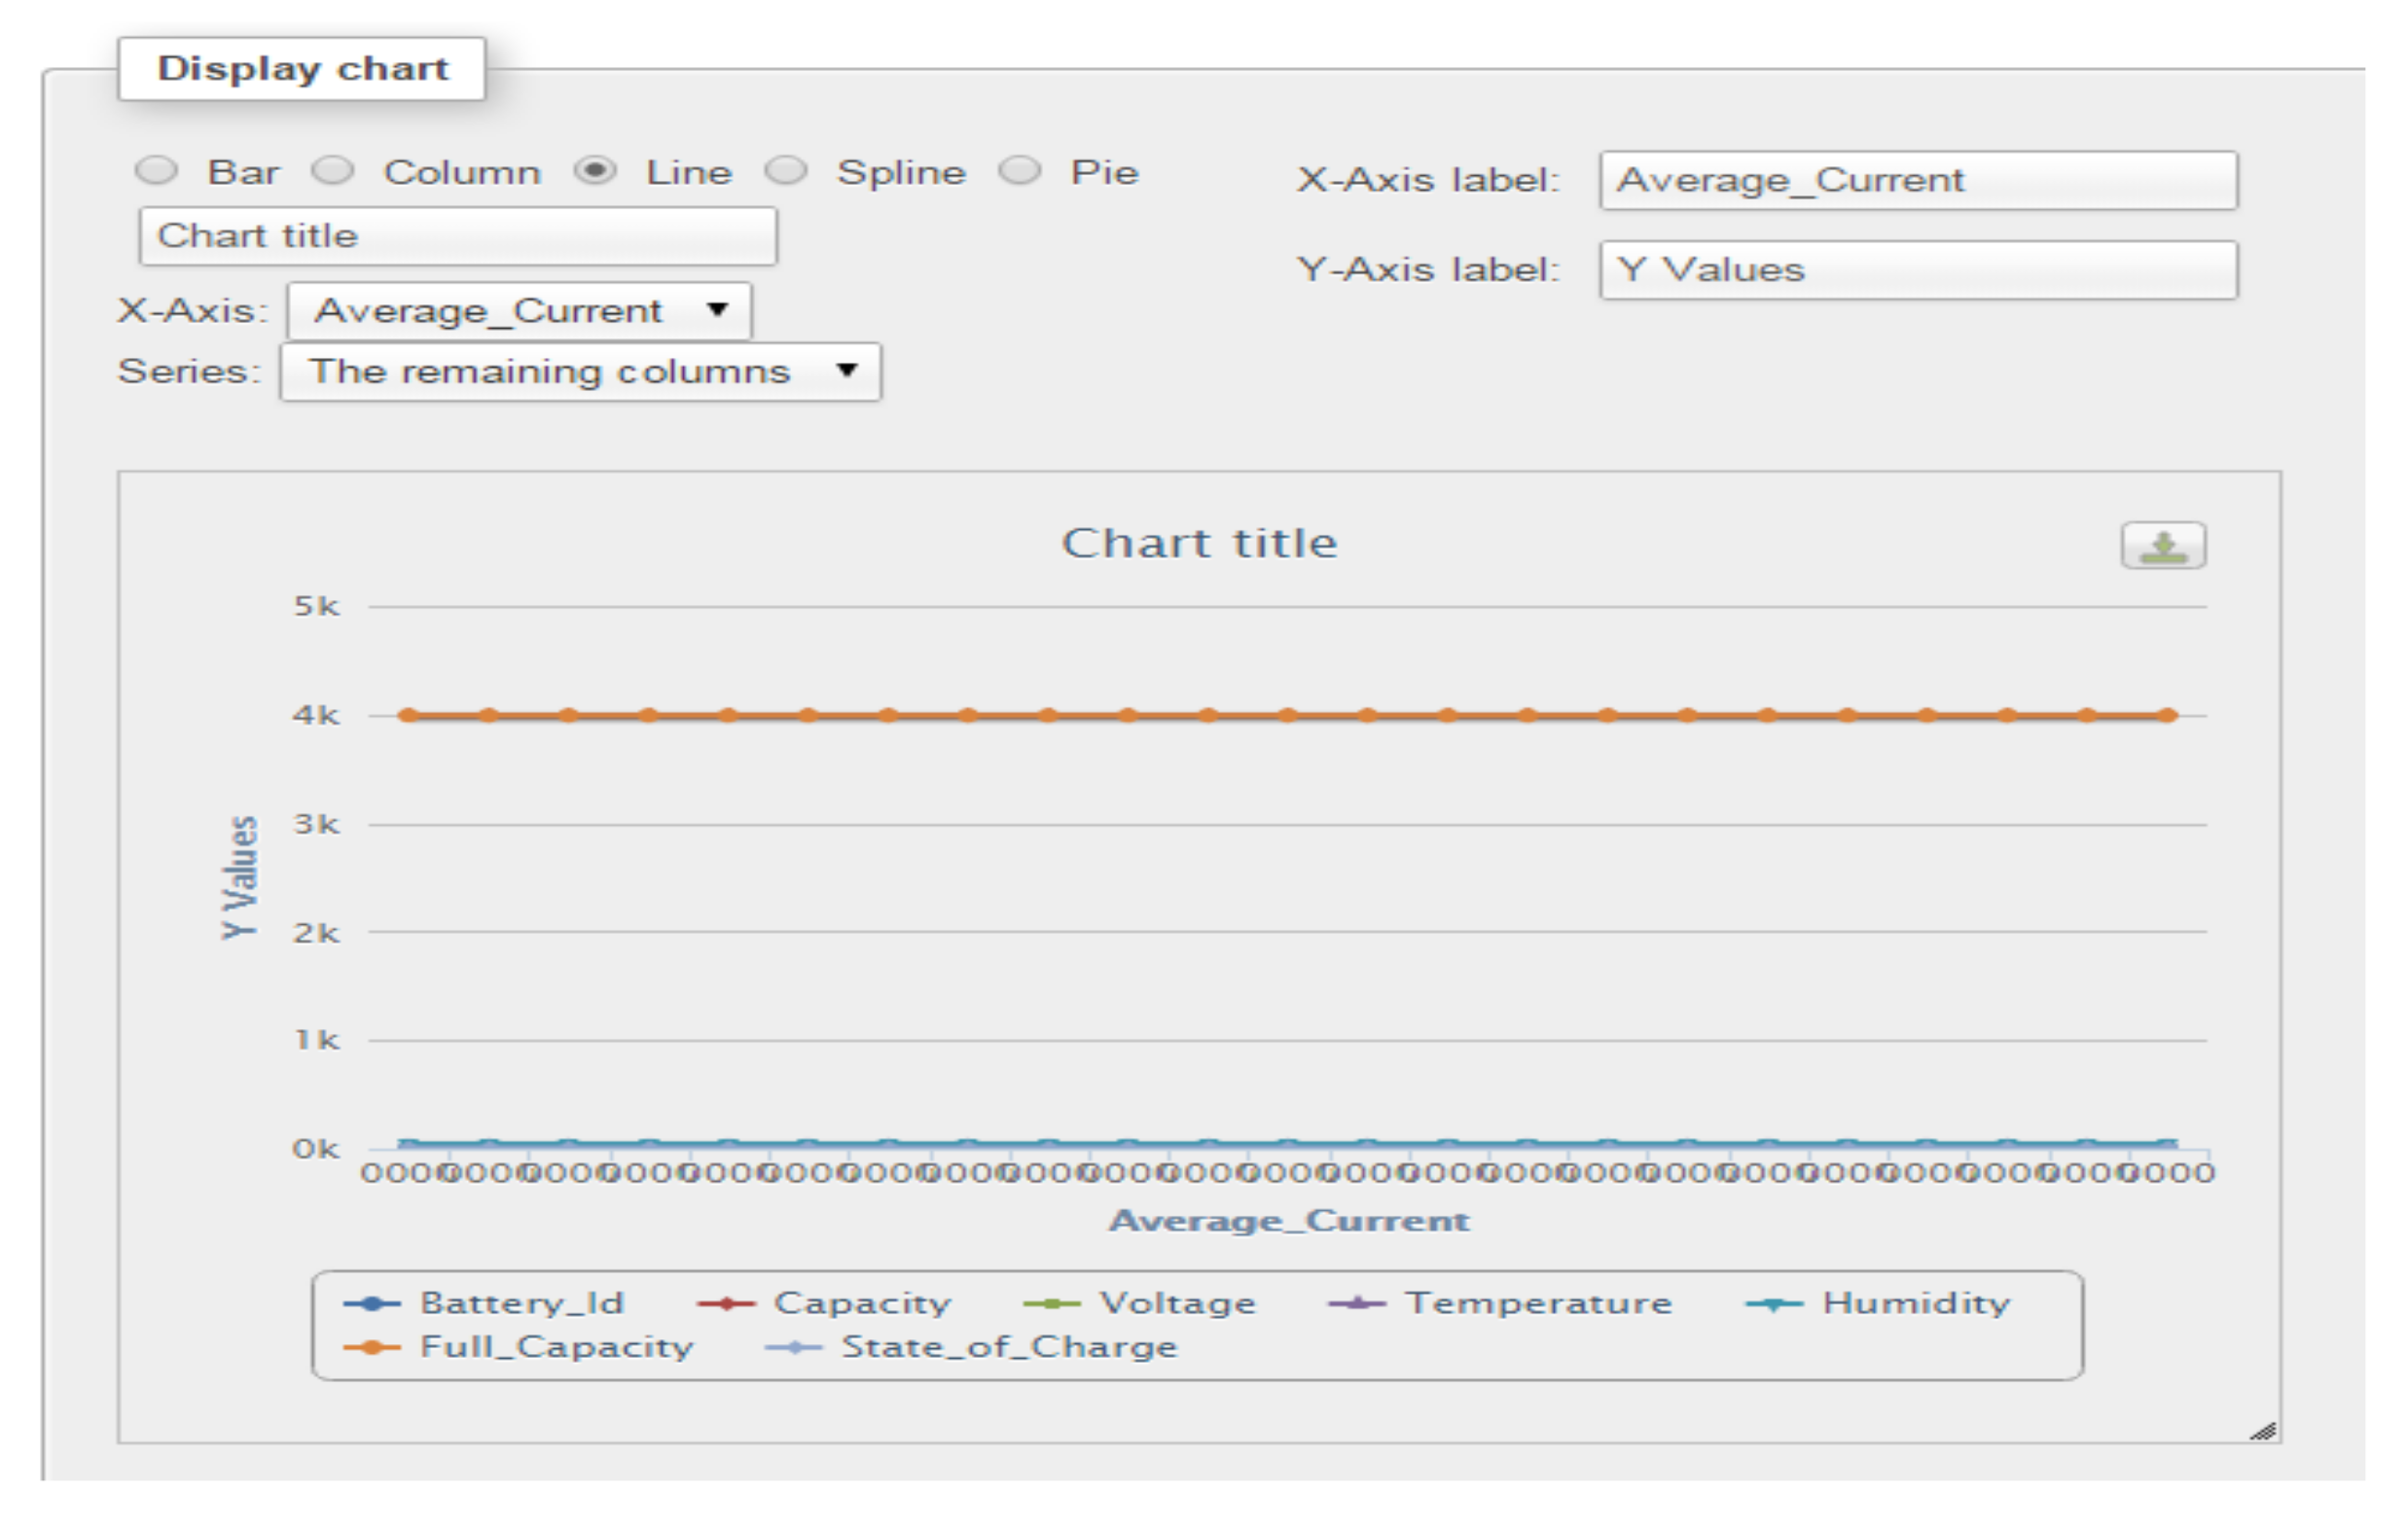
Figure 15. Also, the different parameters of the battery can be chosen and plotted in an appropriate bar, column, line, spline, pie form using the display chart for a meaningful visual representation of the battery data, as shown in
Figure 16.
3.5. Android Application
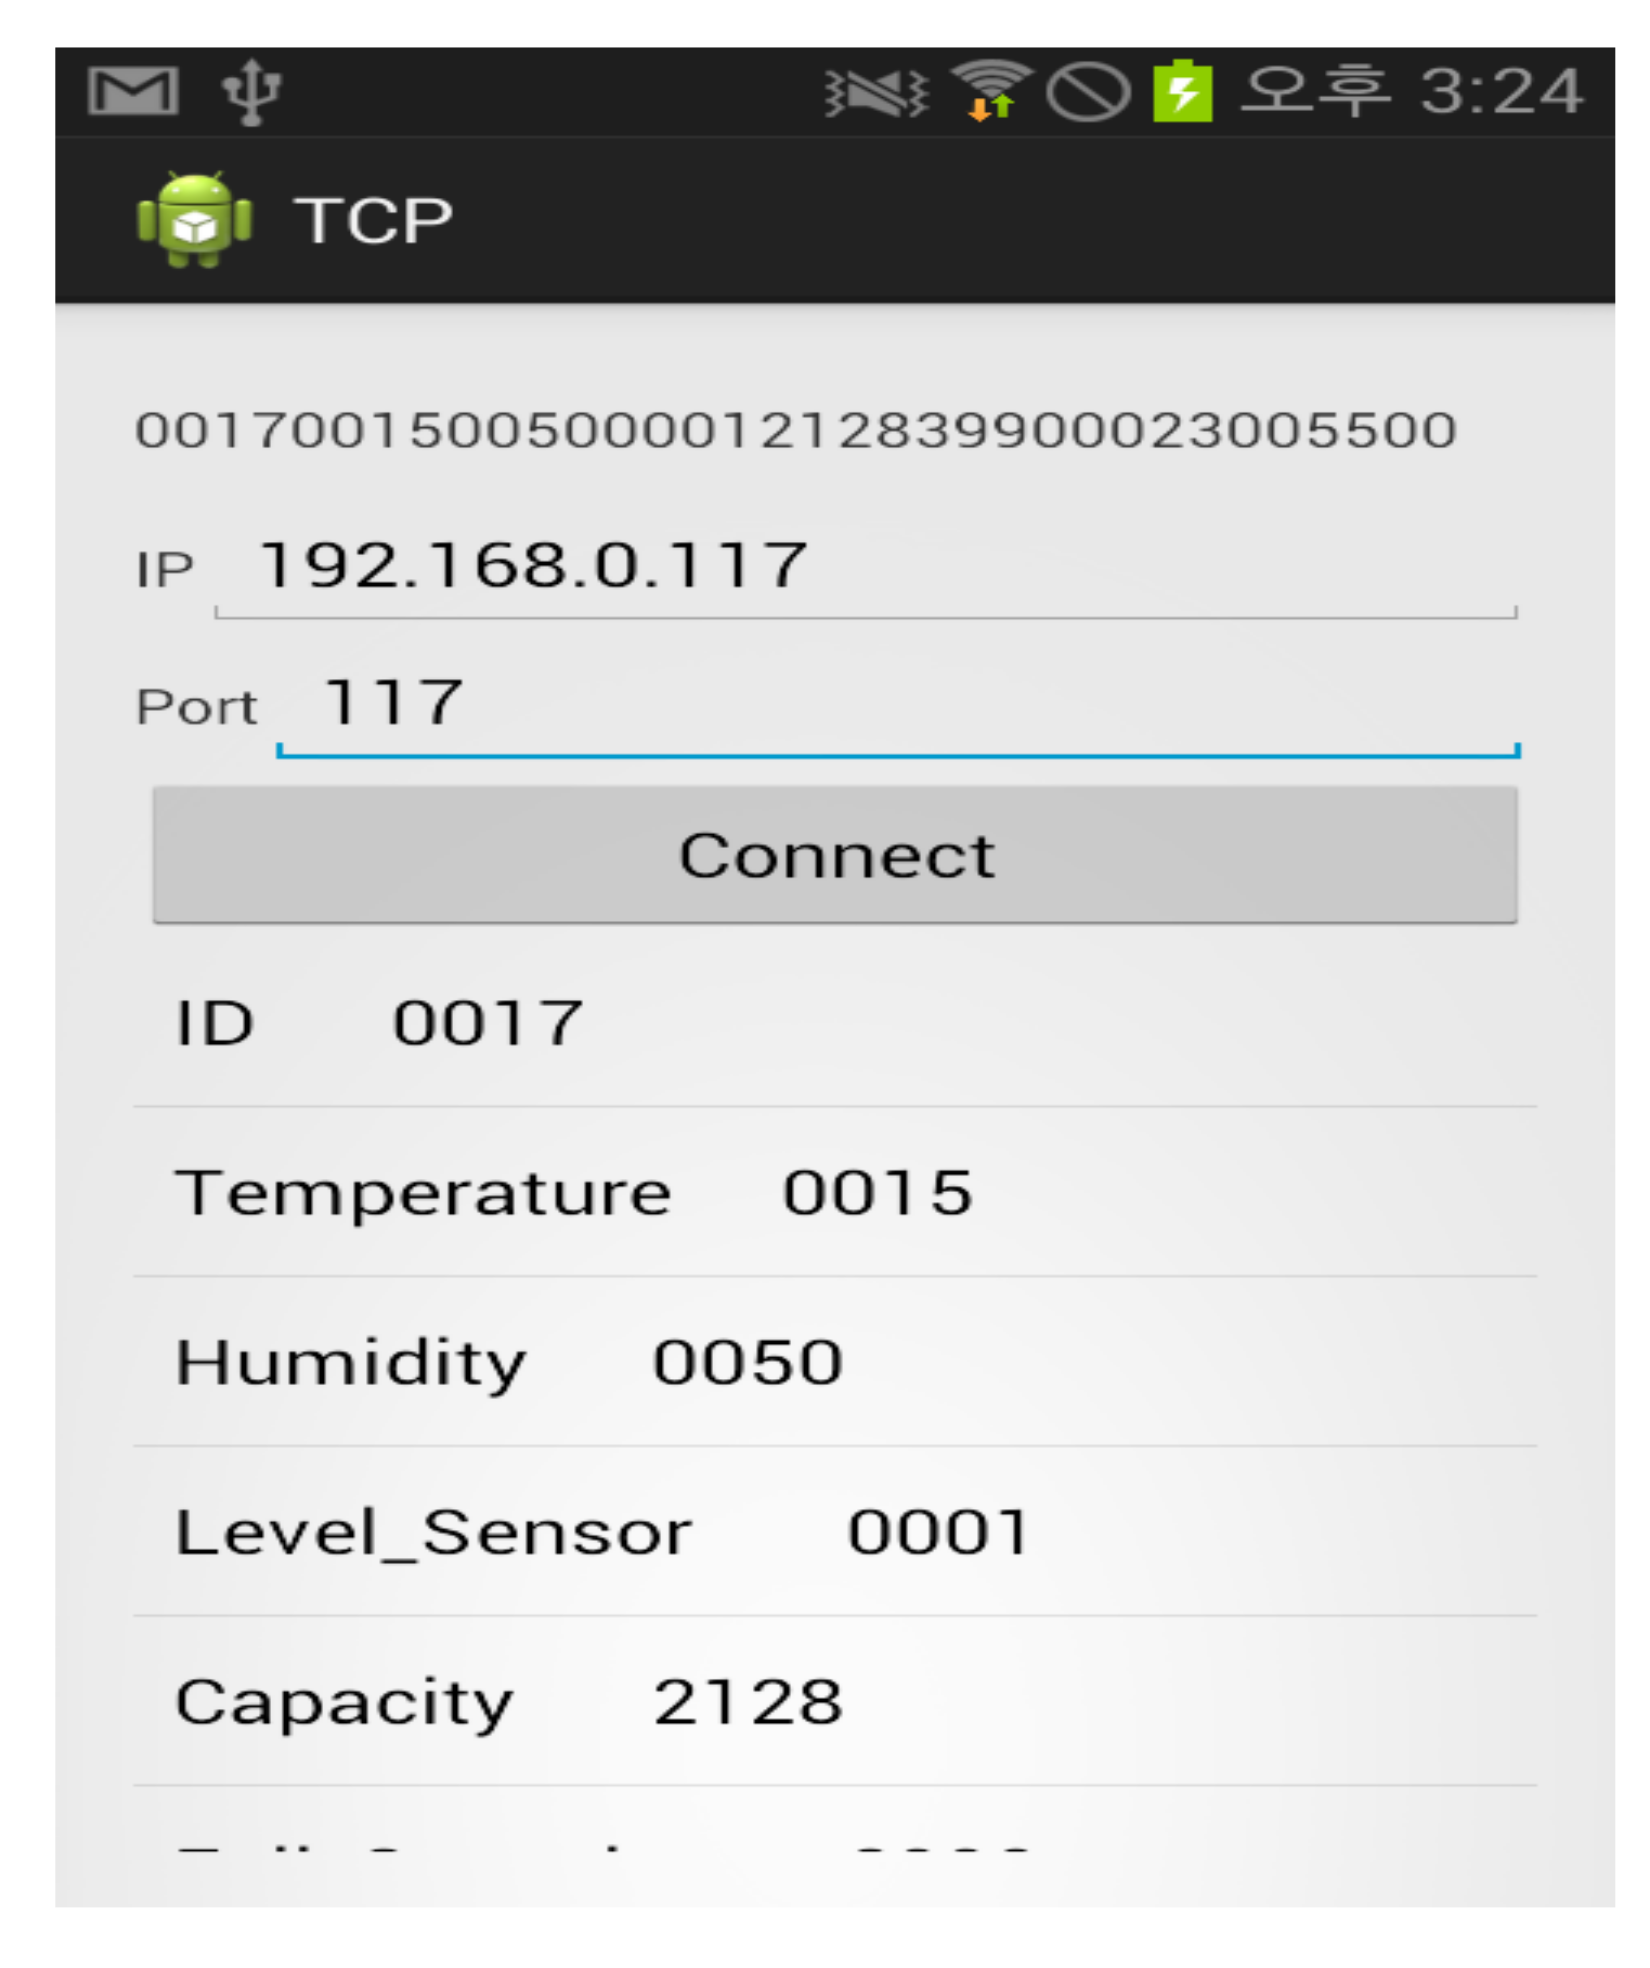
Considering the mobility of the vehicle in an industrial environment, it will be difficult for the vehicle’s operator to access the server and obtain the details of the battery. Therefore, we have designed a simple yet effective TCP socket-based android application that can be easily installed on the operator’s android device and can be executed at any time by the operator on the run. Our android application in a running condition is shown in
Figure 17. The operator should know the battery (device) IP address and port number so that it can be used to receive the serial data frame of a particular battery on a click of the connect button. The data of the data frame from single client is divided into its respective 4 bits and displayed in the columns separately, as shown in
Figure 17.
4. Conclusions
Understanding the importance of effective remote monitoring of the lead–acid batteries in industrial environments, in this paper, a monitoring system prototype for handling multiple lead–acid batteries is designed and developed in real time based on Internet of things. To achieve this, we have developed a data acquisition system by building an embedded system through dedicated software and hardware. We have further devised a cost-effective two-electrode-based electrolyte/liquid level sensor for the proposed method. The data from the multiple lead–acid batteries is transferred using WLAN as the backbone network. The information collected from multiple batteries is analyzed in a asynchronous TCP/UDP-based C♯ server socket program to examine the important parameters of the battery, so that appropriate action can be taken in advance to prevent excessive damage to the battery. Considering the mobility of the device, we have also developed an android application to receive the data from the battery on the run. Further, the data is also stored in an MySQL server database and different battery parameters from the database can be chosen and plotted using the display chart for a meaningful visual representation. All the schematic diagrams of the proposed system’s circuit layout as shown in the paper have been drawn using ORCAD software.
With our prototype, the battery maintenance is relatively easier than before and the cost is minimized. For a fair comparison of our prototype, we have compared it with existing devices as shown in
Table 2, that clearly indicates the superiority of our prototype.


