From Raw Data to Meaningful Information: A Representational Approach to Cadastral Databases in Relation to Urban Planning


Abstract
:
1. Introduction
1.1. Representational Approach
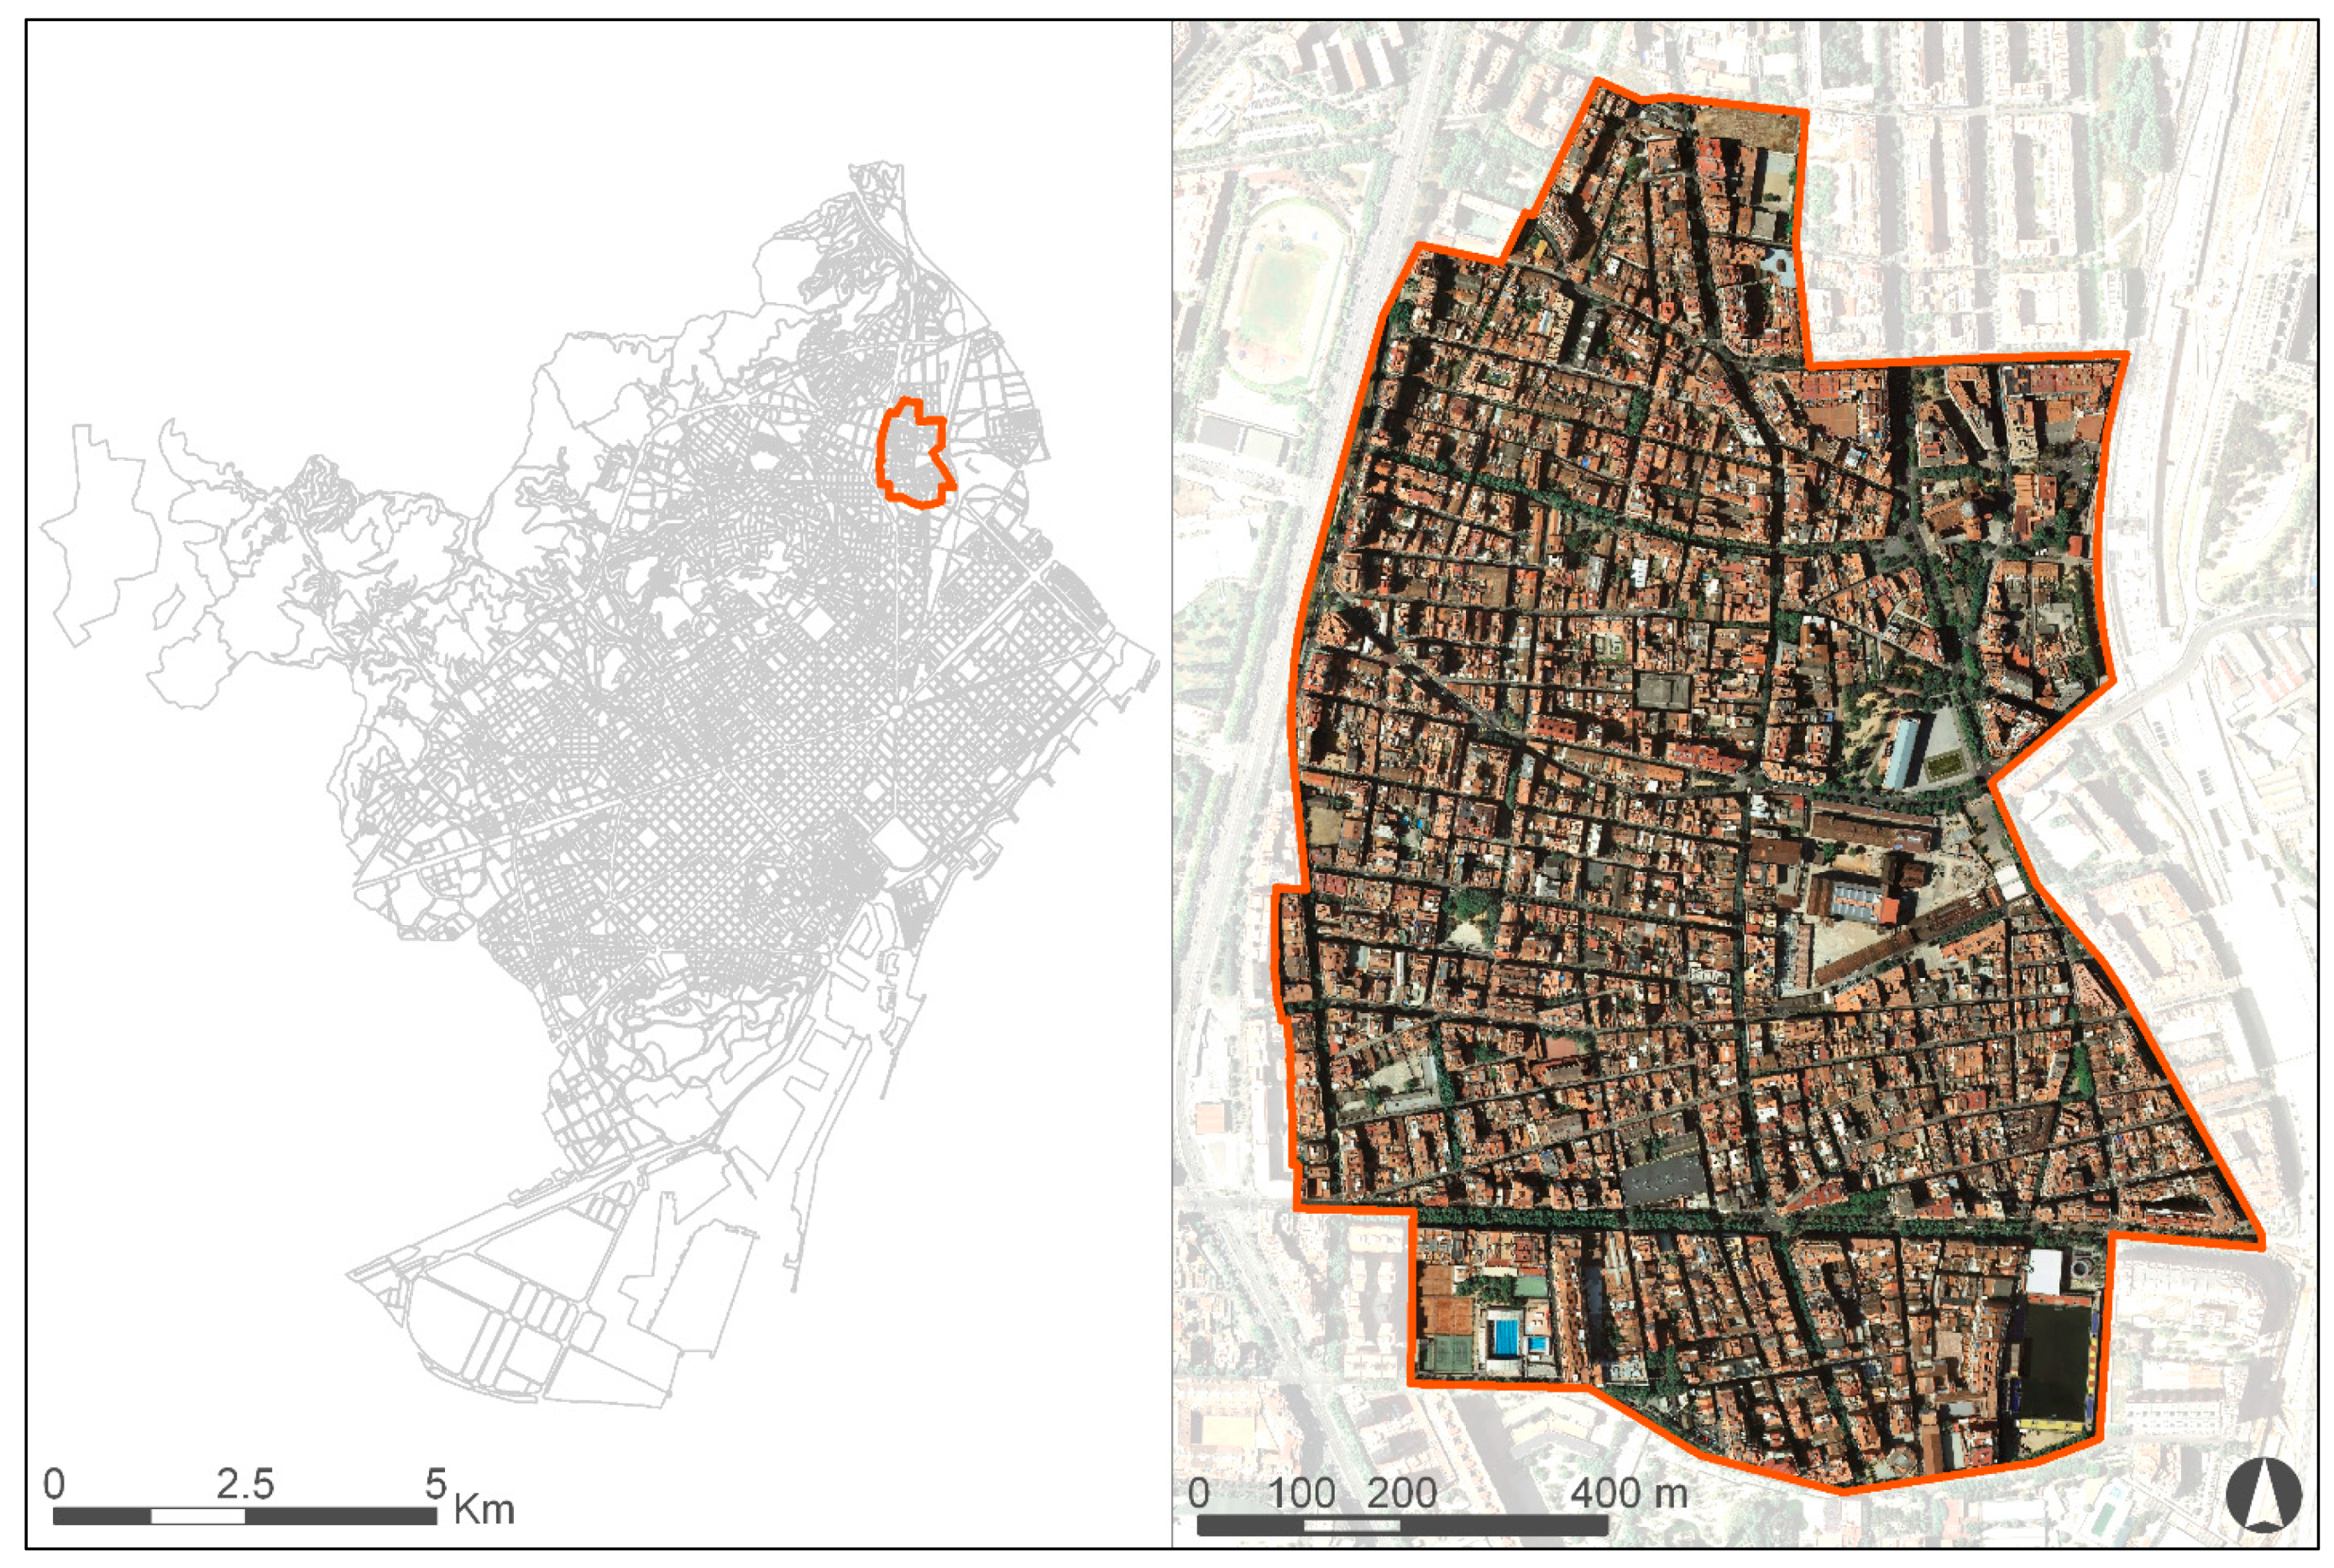
1.2. Case of Study
- Semantic correction of height information of cadastral and planning databases (Section 2.3)
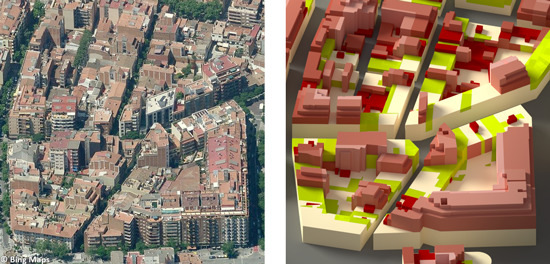
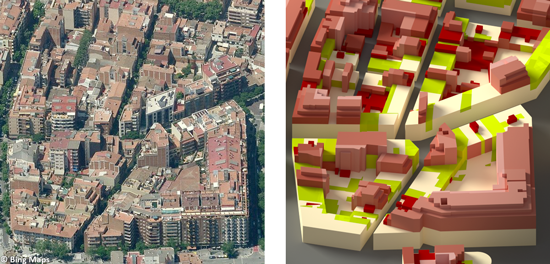
- 3D representation of height information on a 2D surface, compared to traditional 2D representation (Section 3.1 and Section 4.3)
- Occlusion of the built volumes from the street (Section 3.2 and Section 4.5) and onto neighboring volumes (Section 3.3 and Section 4.6)
- Visualization of the temporal evolution of the building stock (Section 4.8)
- Representation main of uses on the ground floor (Section 3.4 and Section 4.7)

2. Materials
2.1. Cadastral Data Import and Normalization
2.1.1. Cadastral Data Import
2.1.2. Cadastral Data Normalization
2.2. Parcel Level Aggregation
2.2.1. Year of Construction
2.2.2. Dominant Use
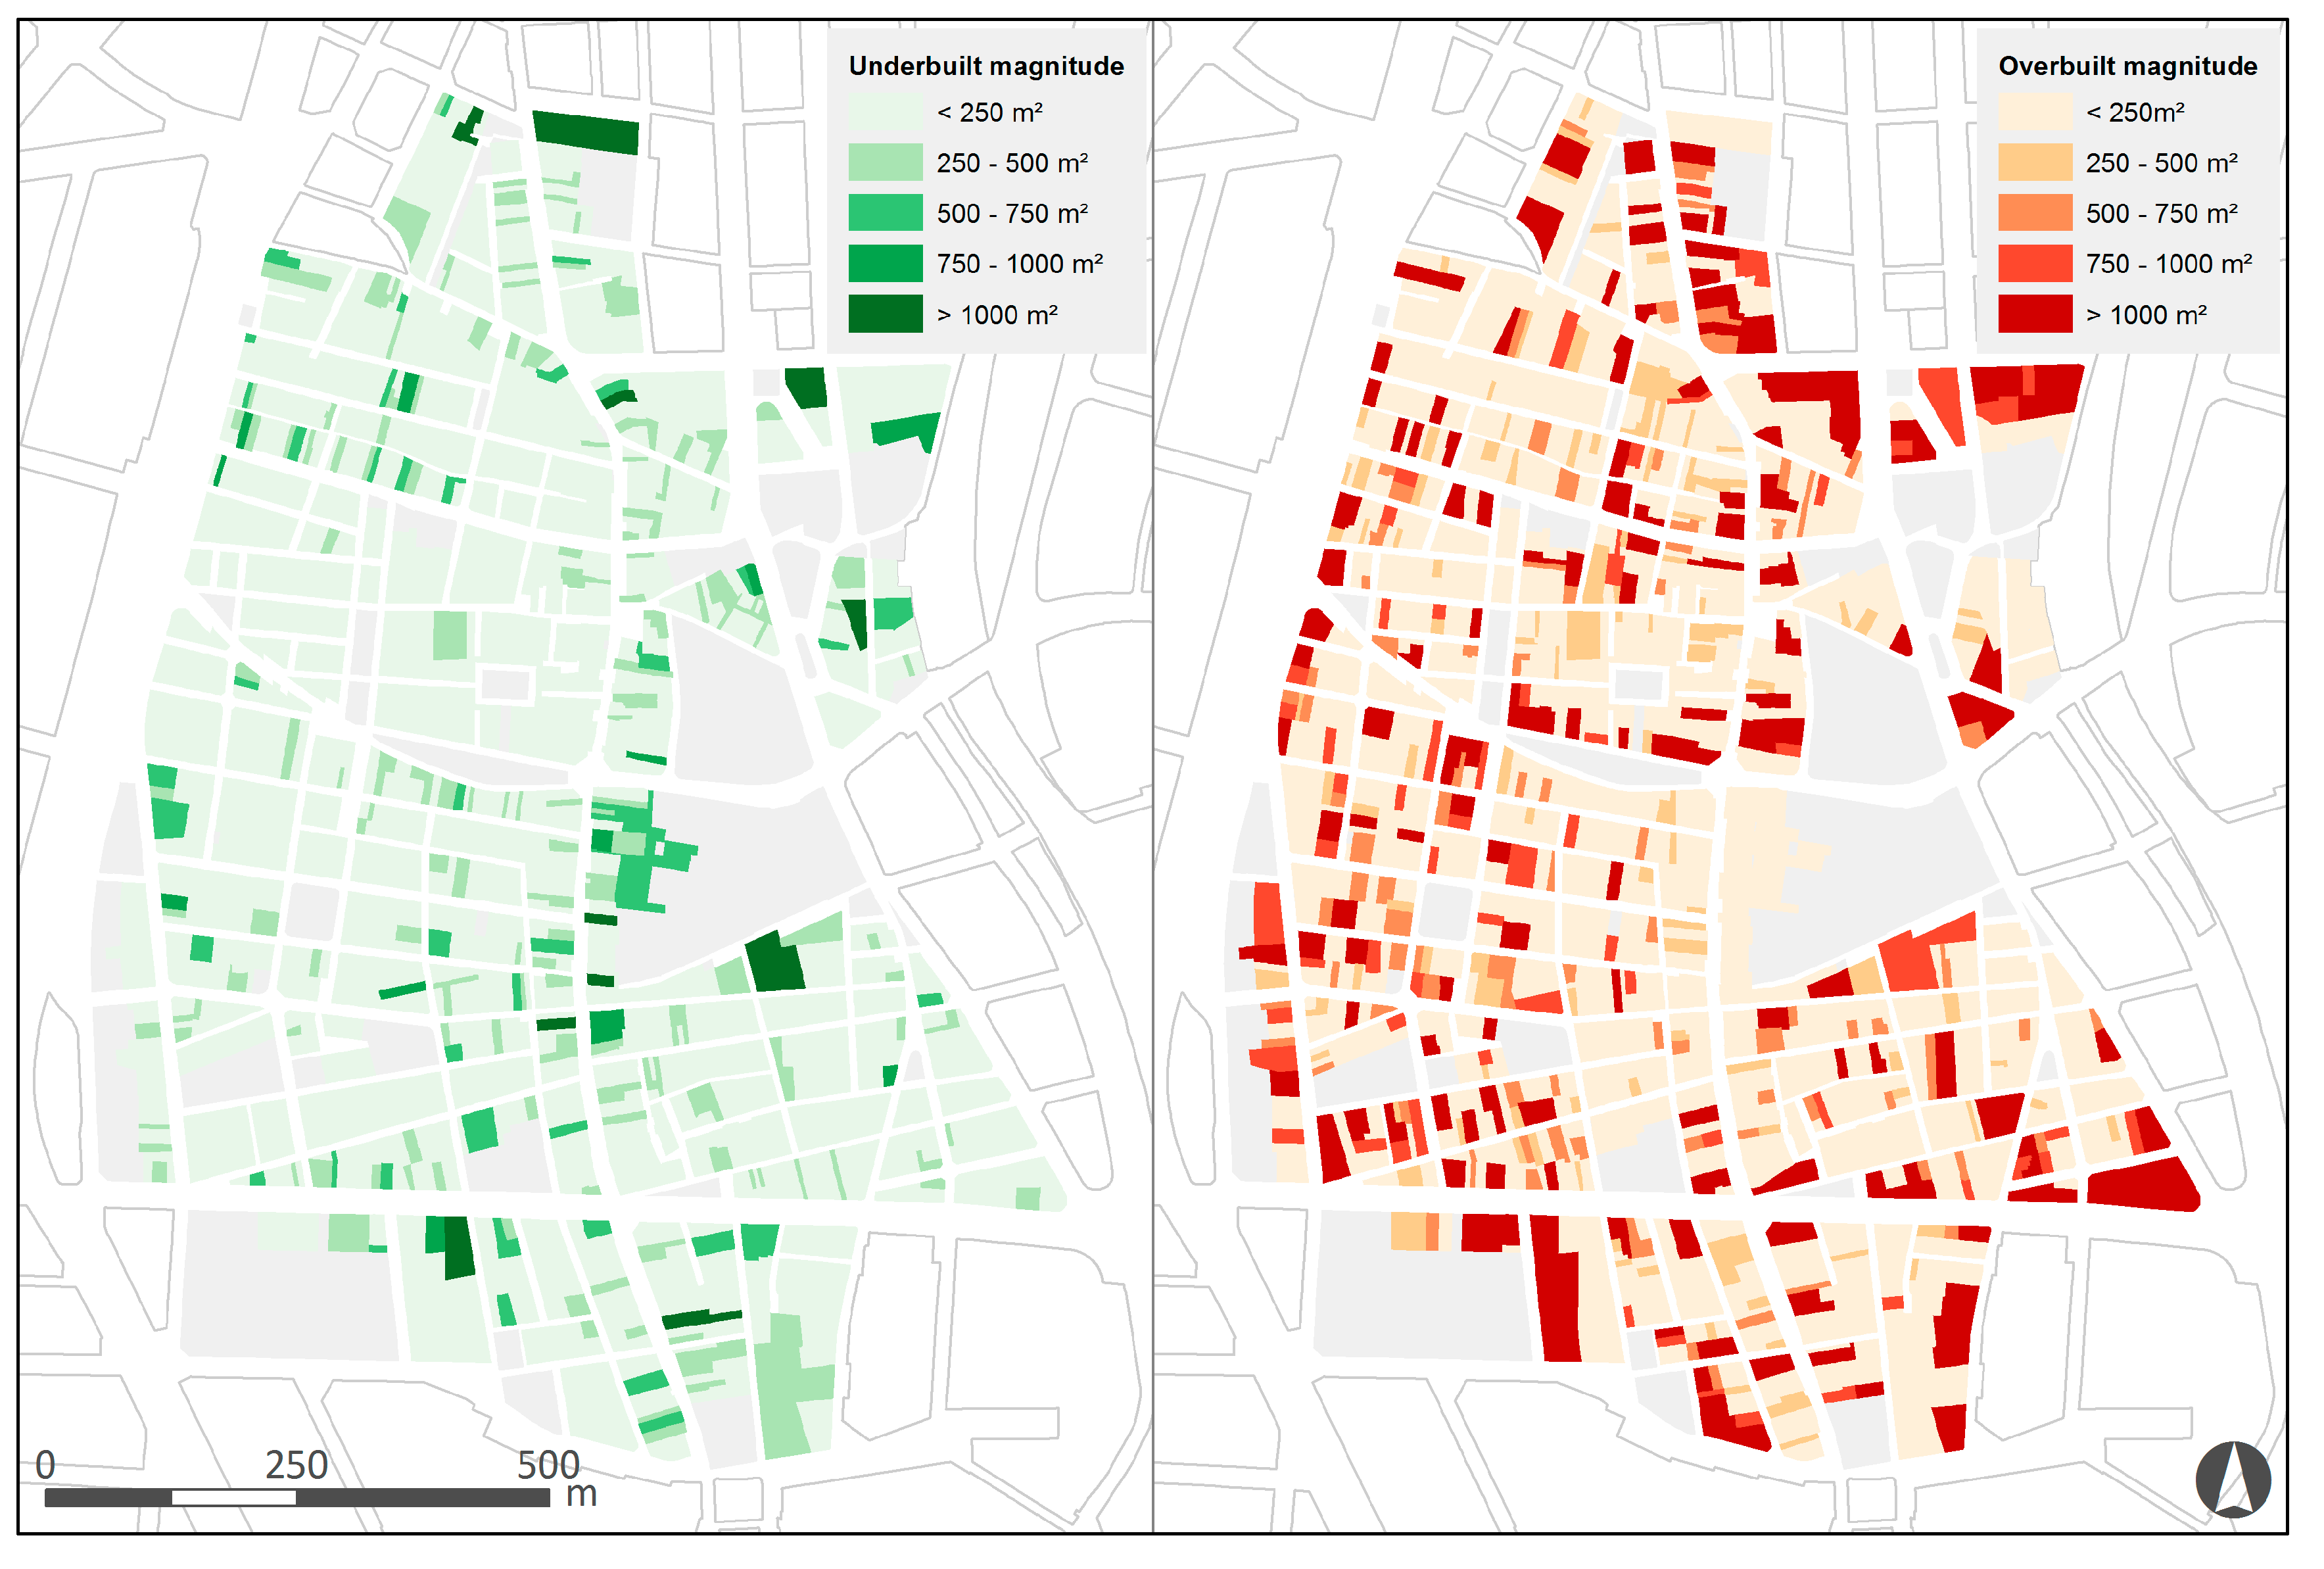
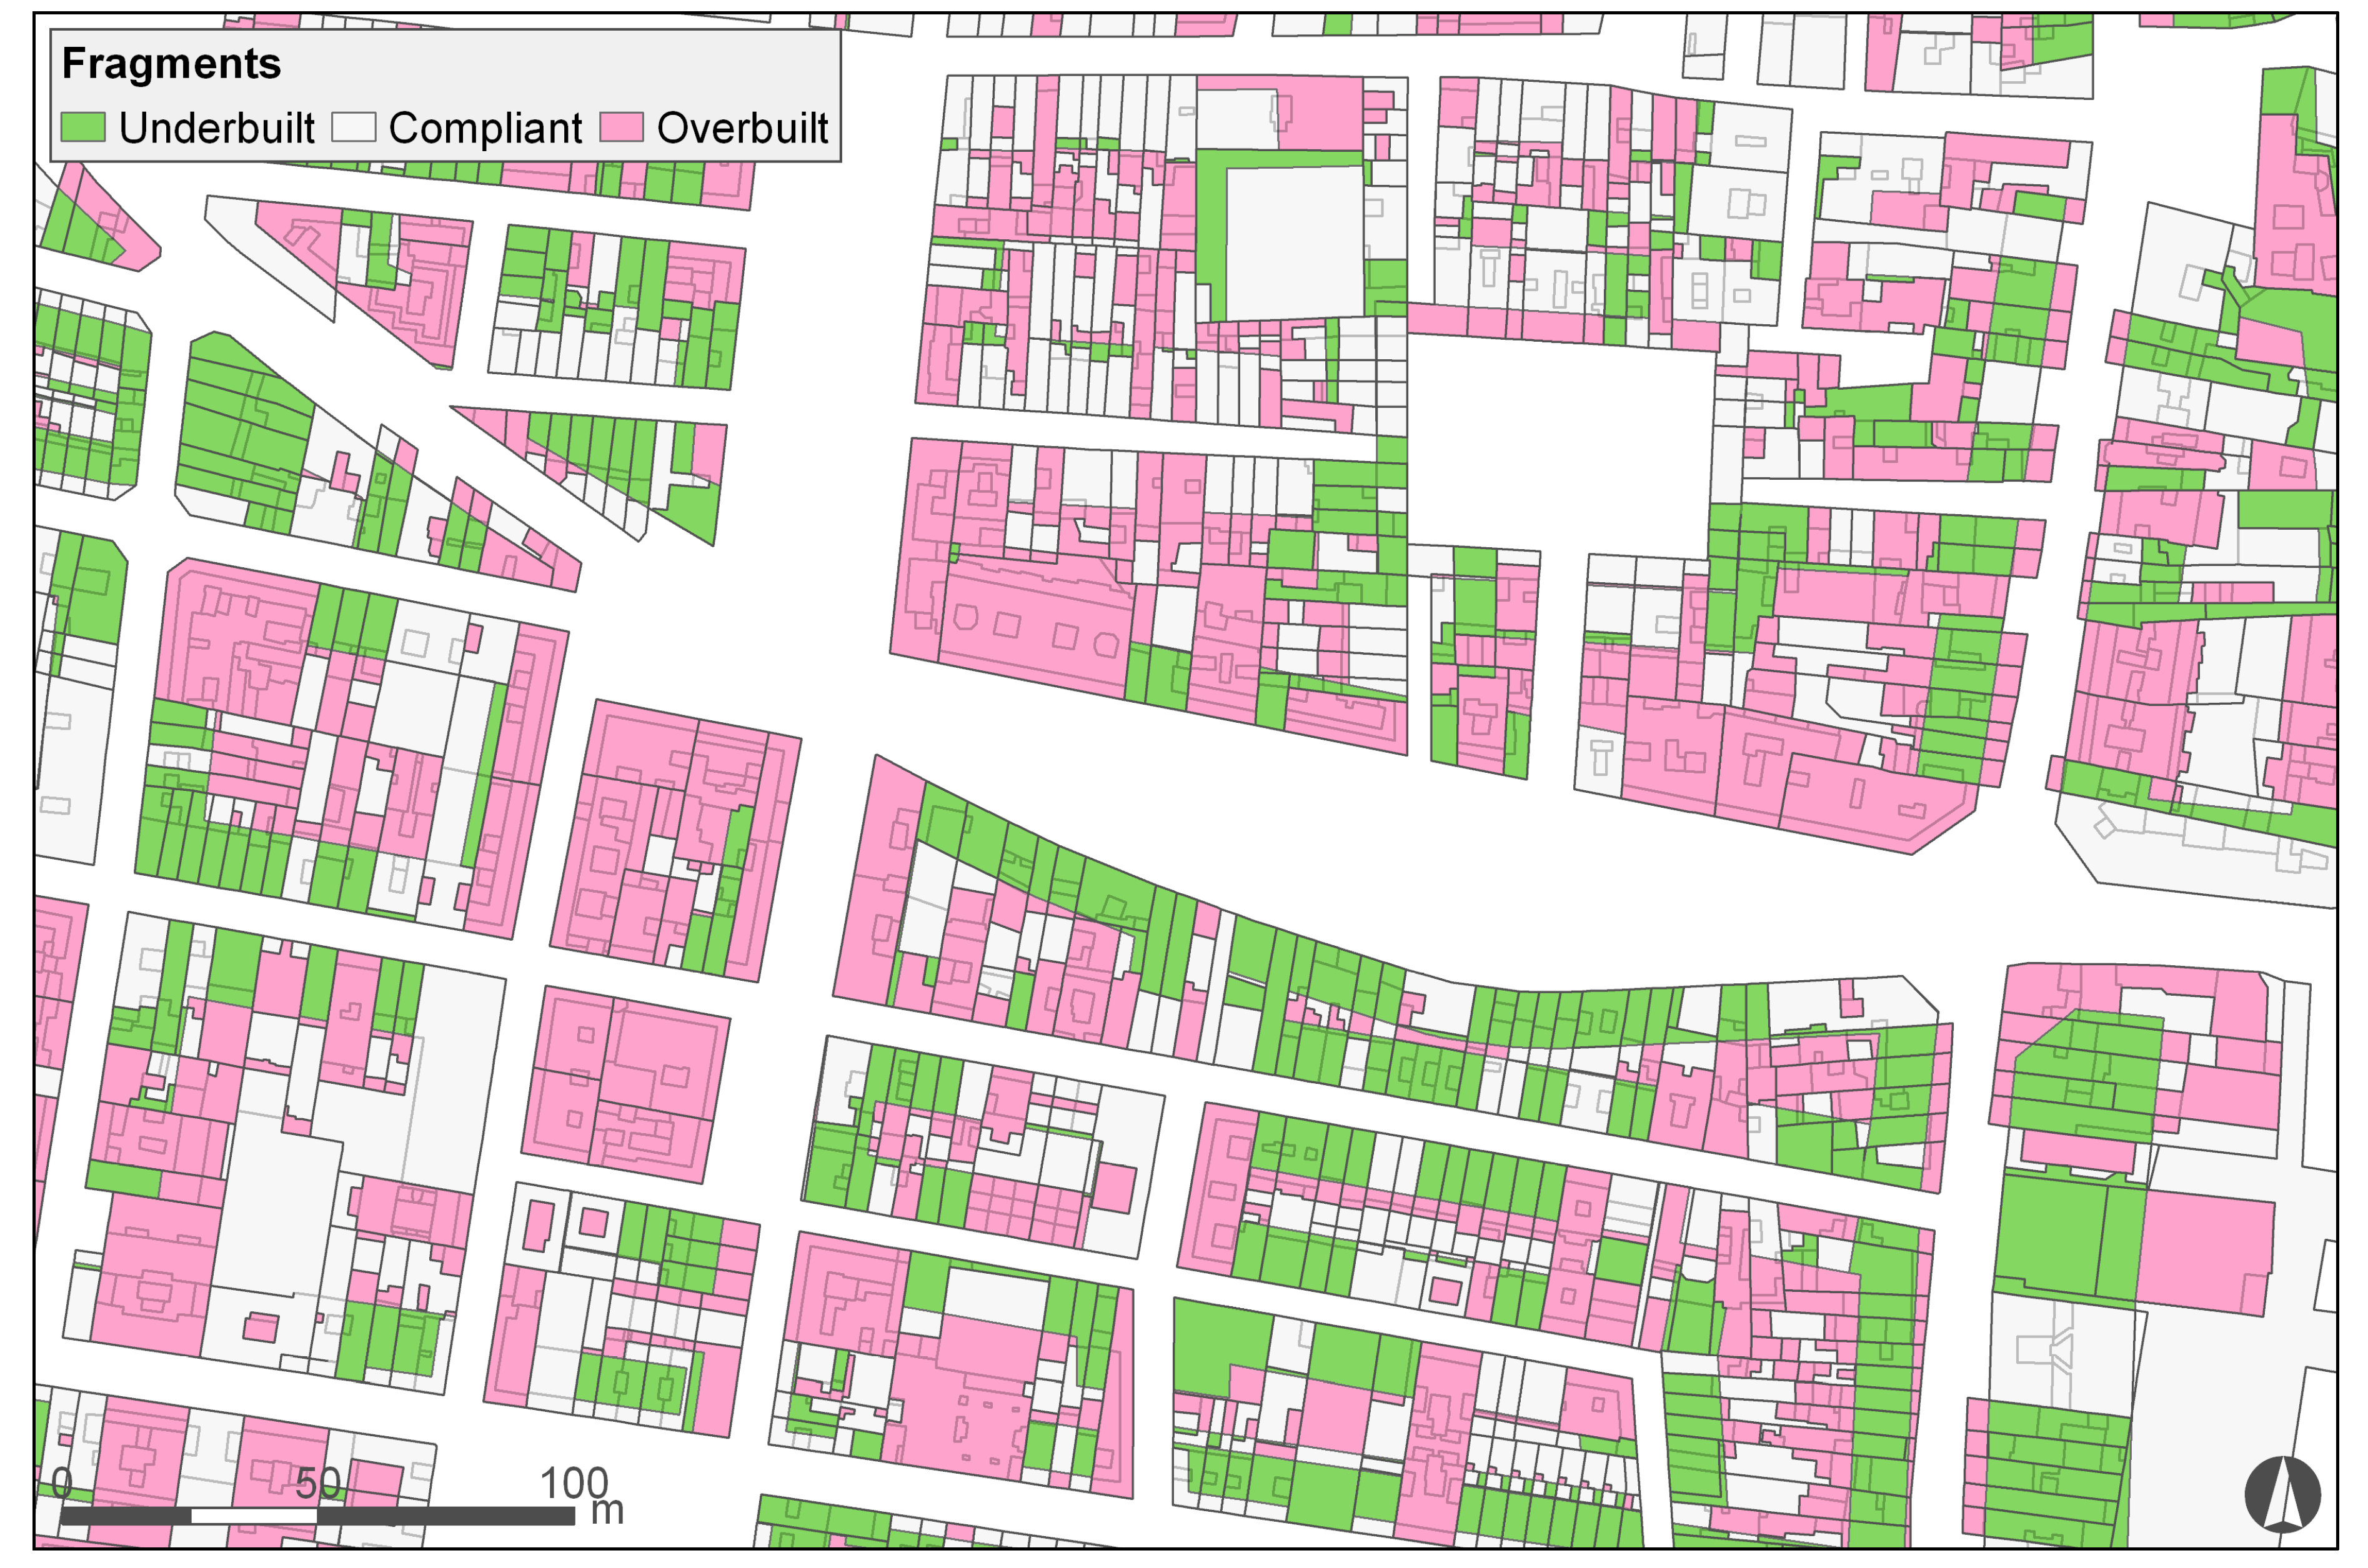
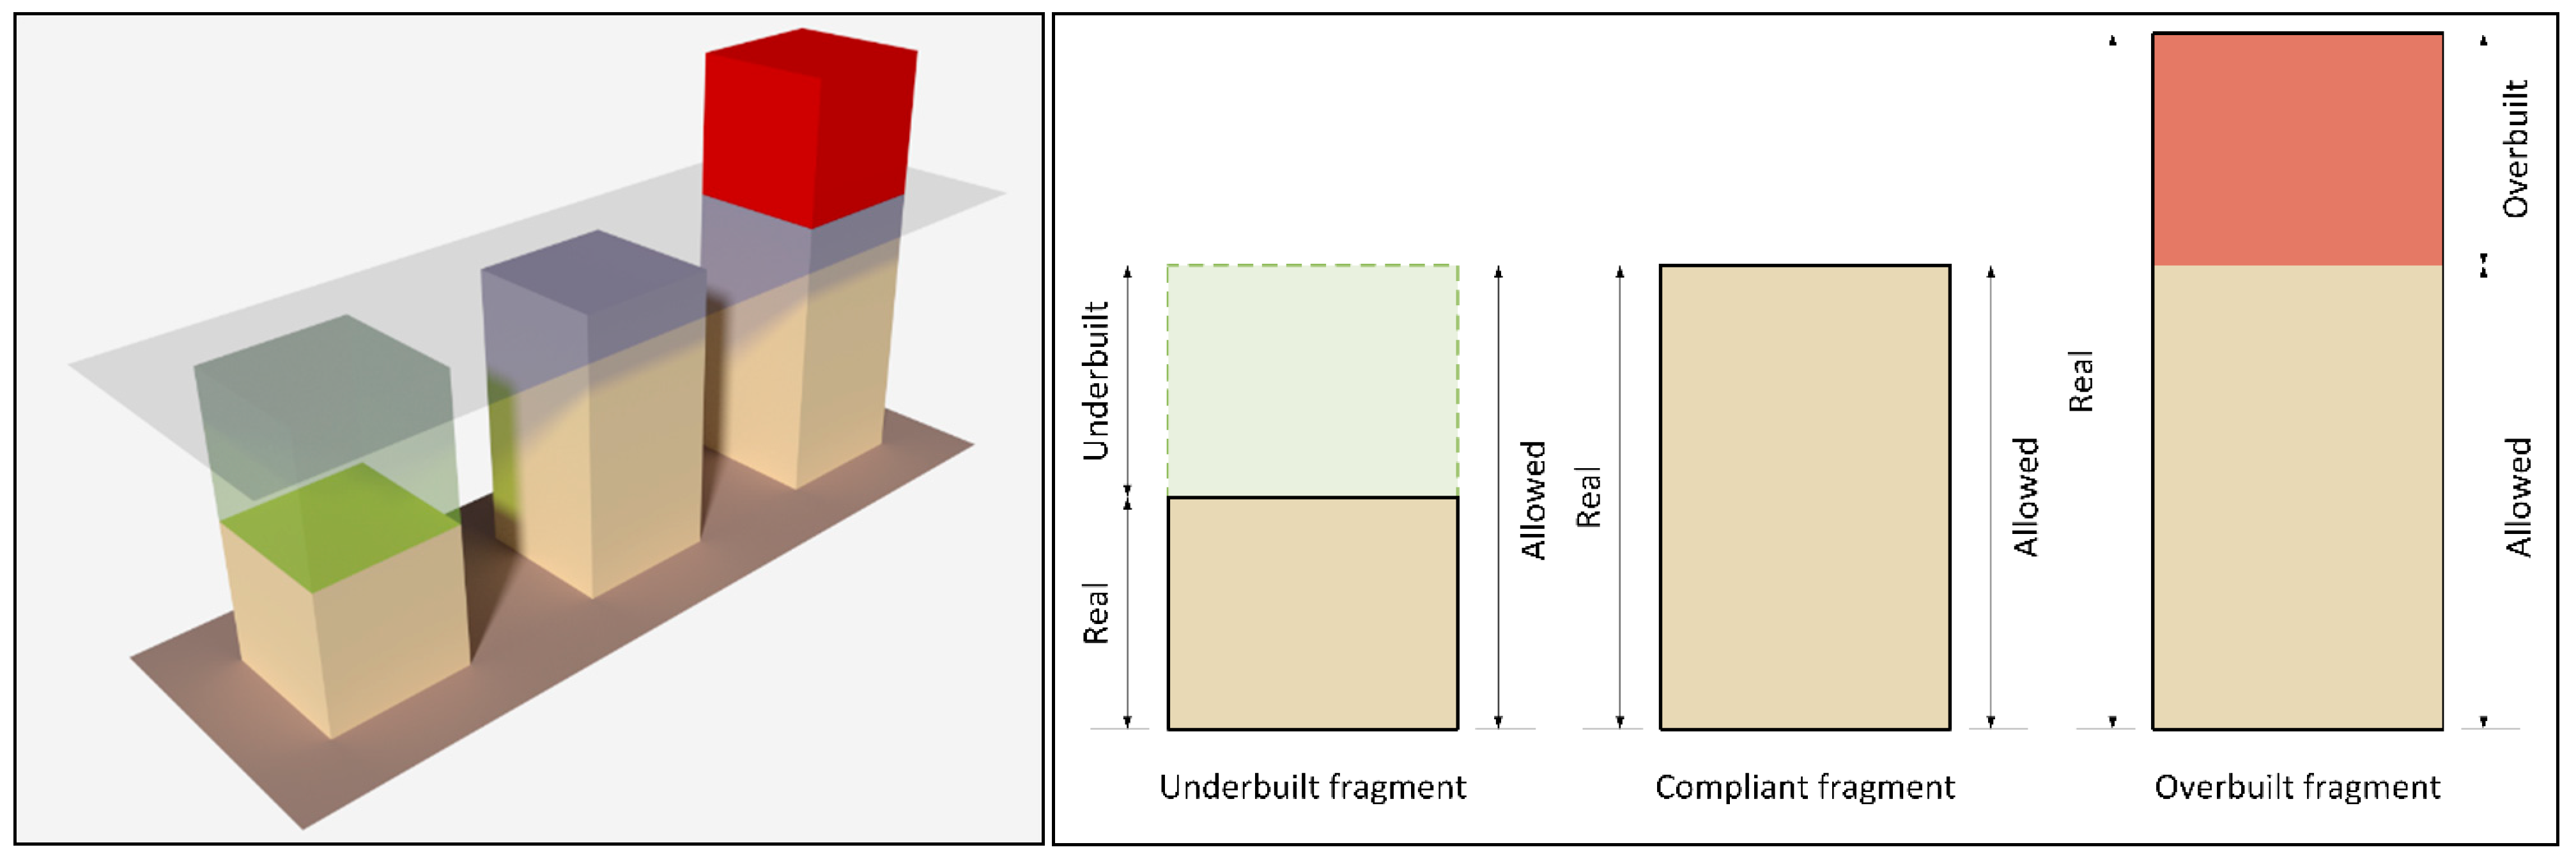
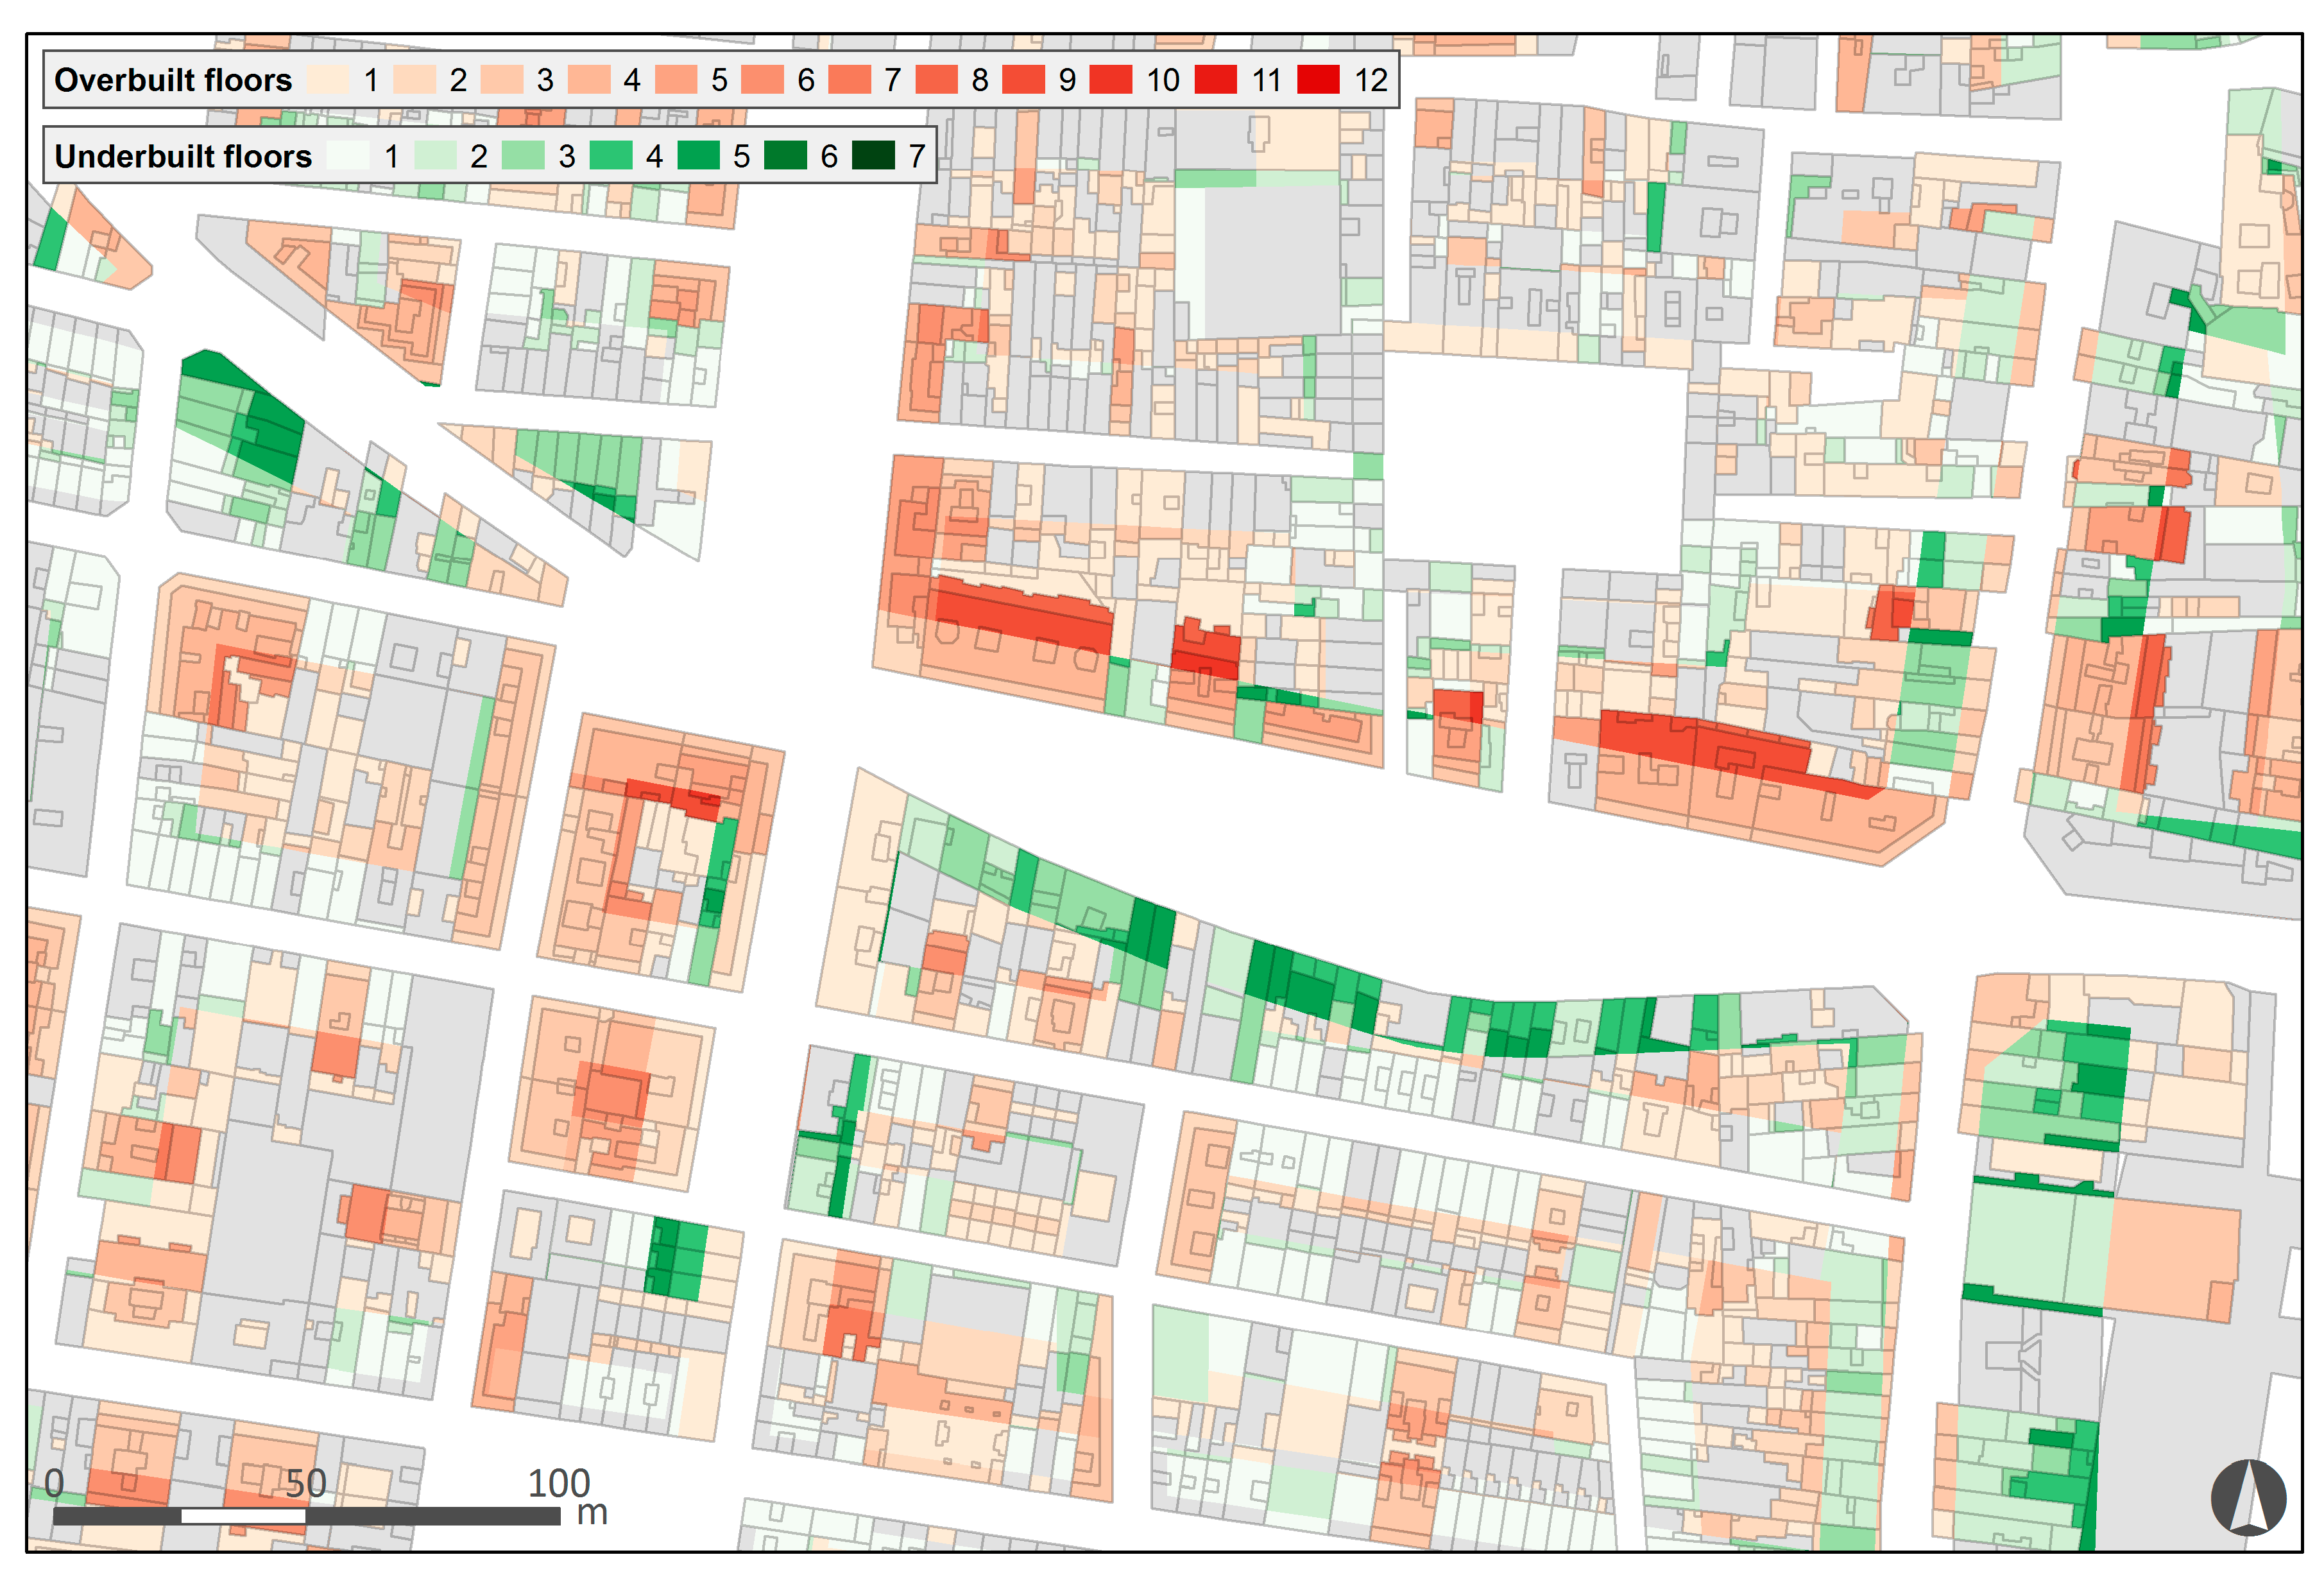
2.2.3. Overbuilt and Underbuilt Area Measurement
- HB: Real height of the building, measured in number of floors above street level.
- HP: Maximum height according to the plan, measured in number of floors above street level.
- A: Area of a polygon entity (surface of land occupied).
- Parc: Set of parcels inside the area of study.
- Subp: Set of sub-parcels.
- FragZ: Set of fragments from the spatial intersection between parcel and planning layers (in zones).
- FragS: Set of fragments from the spatial difference between parcel and planning layers (in systems).
2.3. Cadastral Cartography
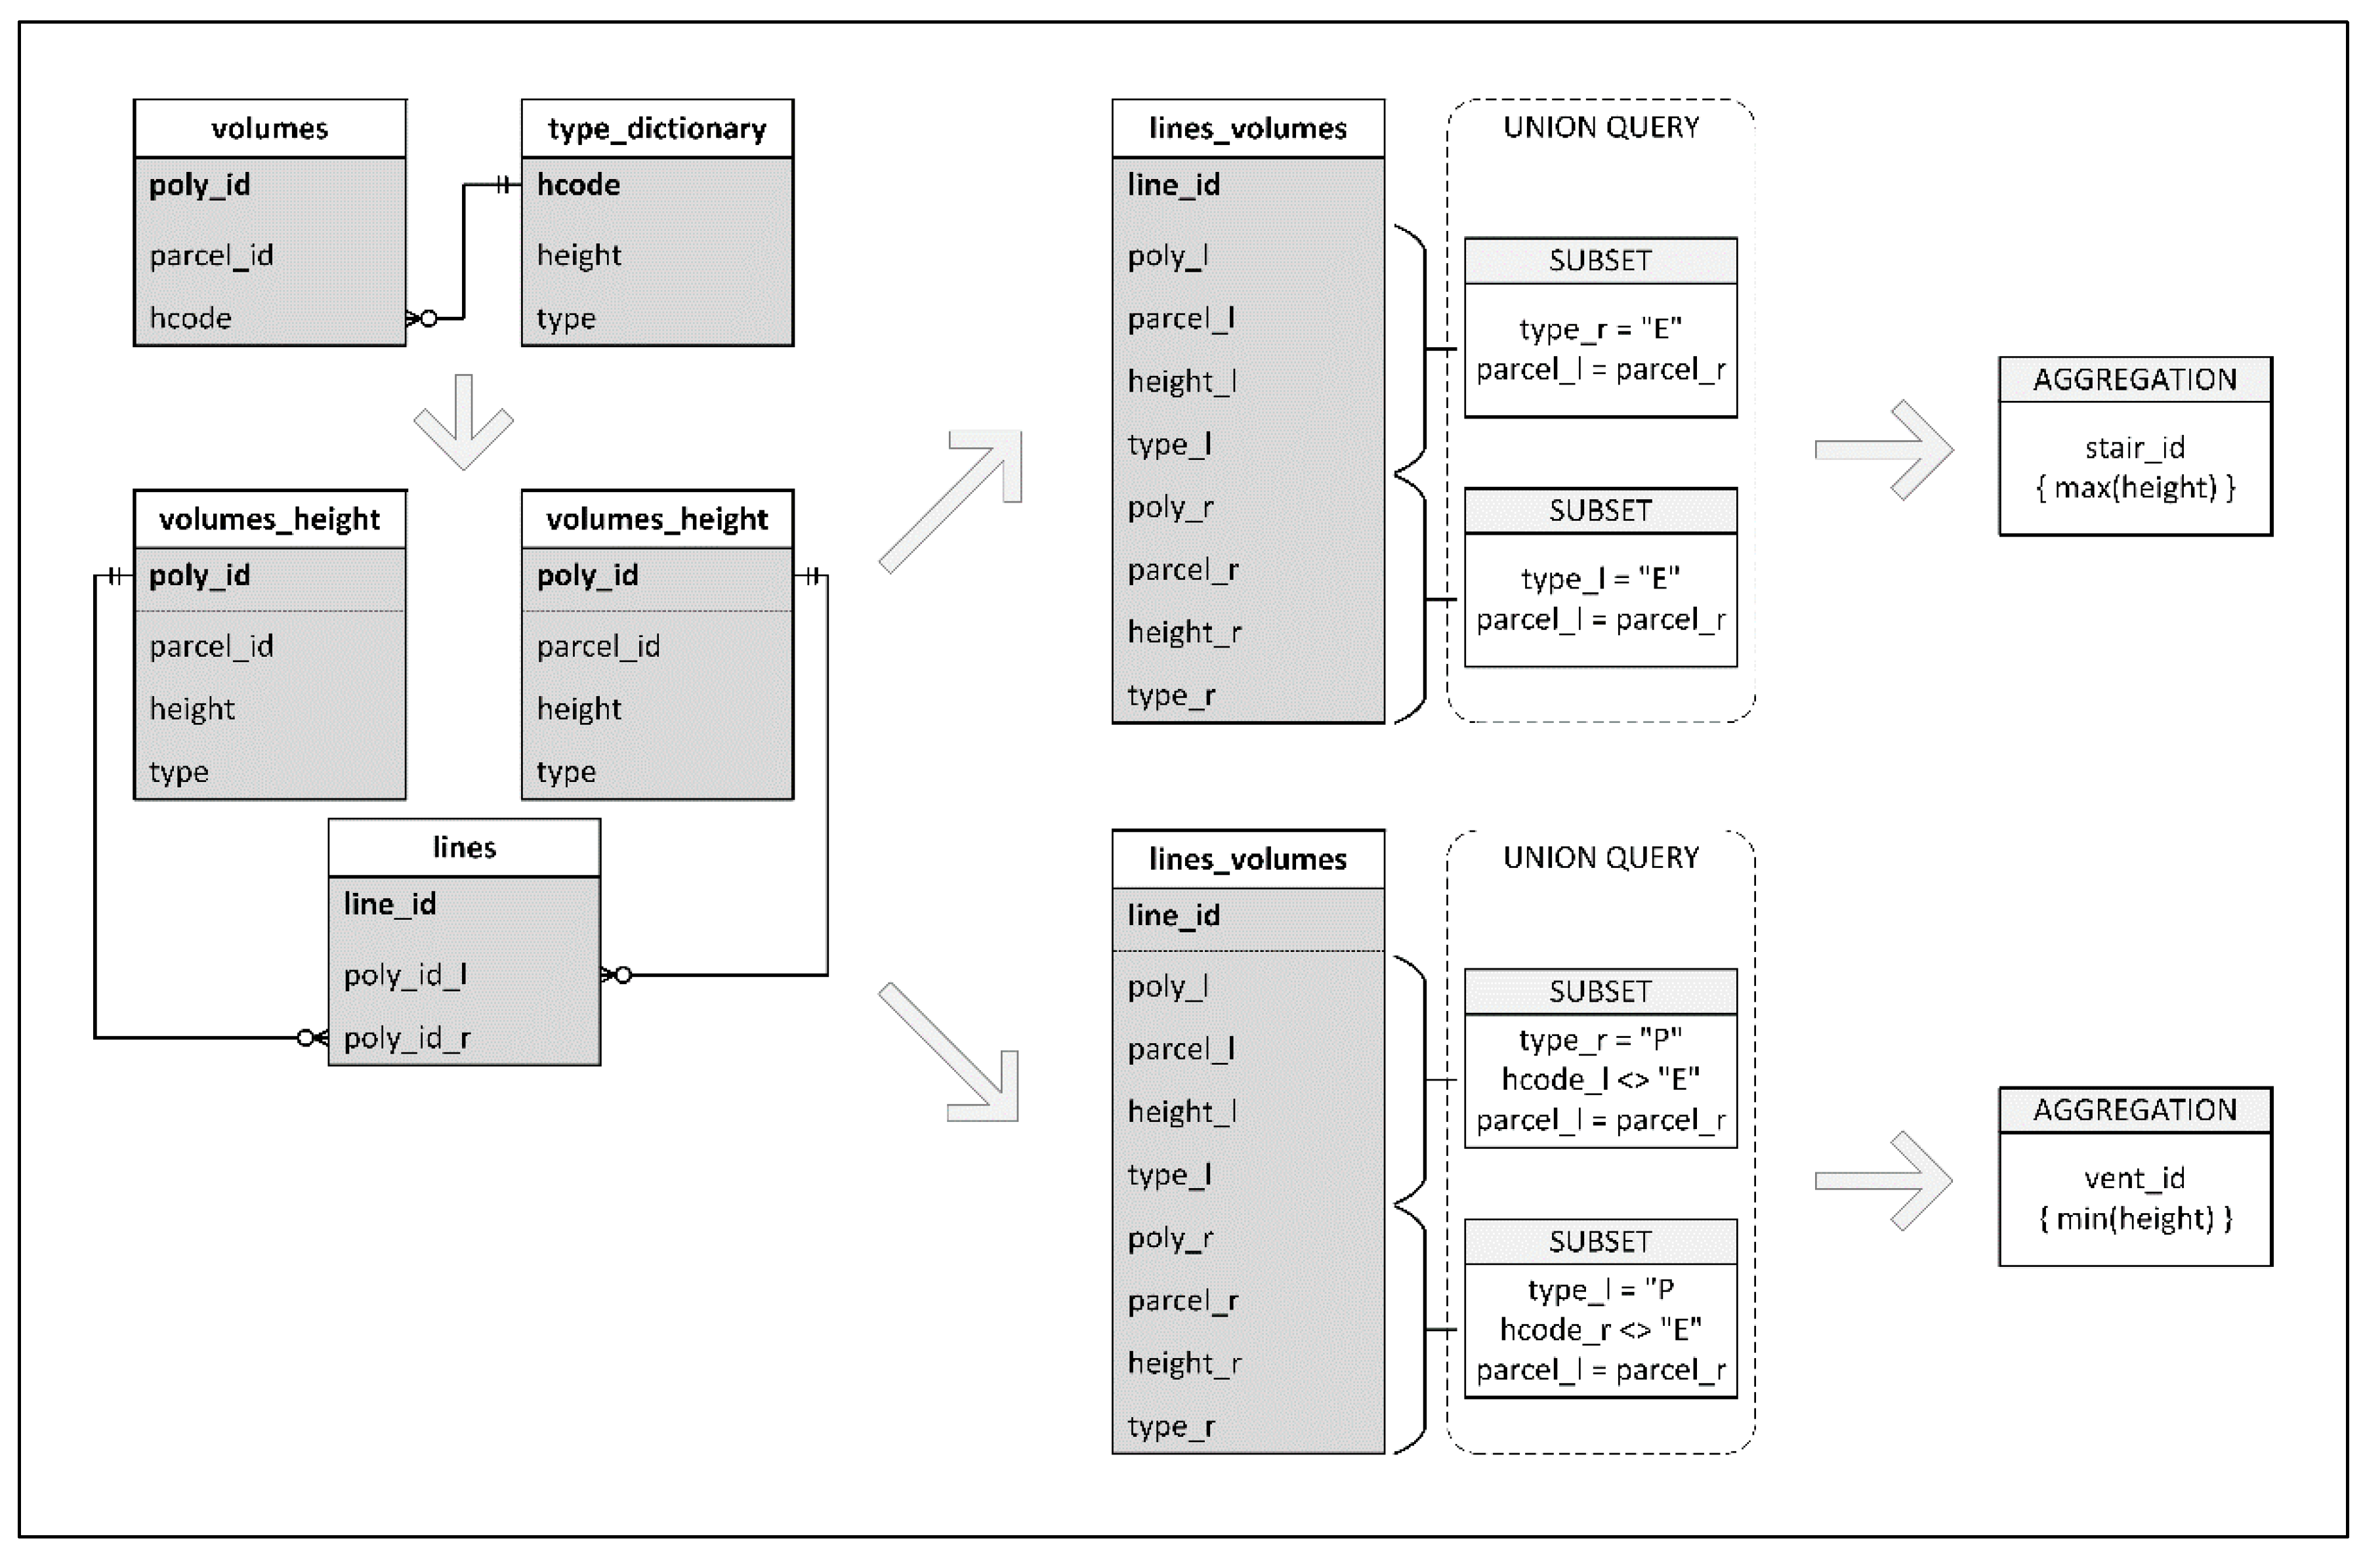
2.3.1. Height Information Correction
2.3.2. Semantically Adjusting Cartographic Data to Planning Regulations
- (a)
- The volumes of balconies over the streets were disregarded because the Metropolitan regulations do not directly regulate the maximum height of these volumes but instead the buildings they are attached to. Therefore, a balcony would not be allowed only as a consequence of the floor it was attached to not being allowed.
- (b)
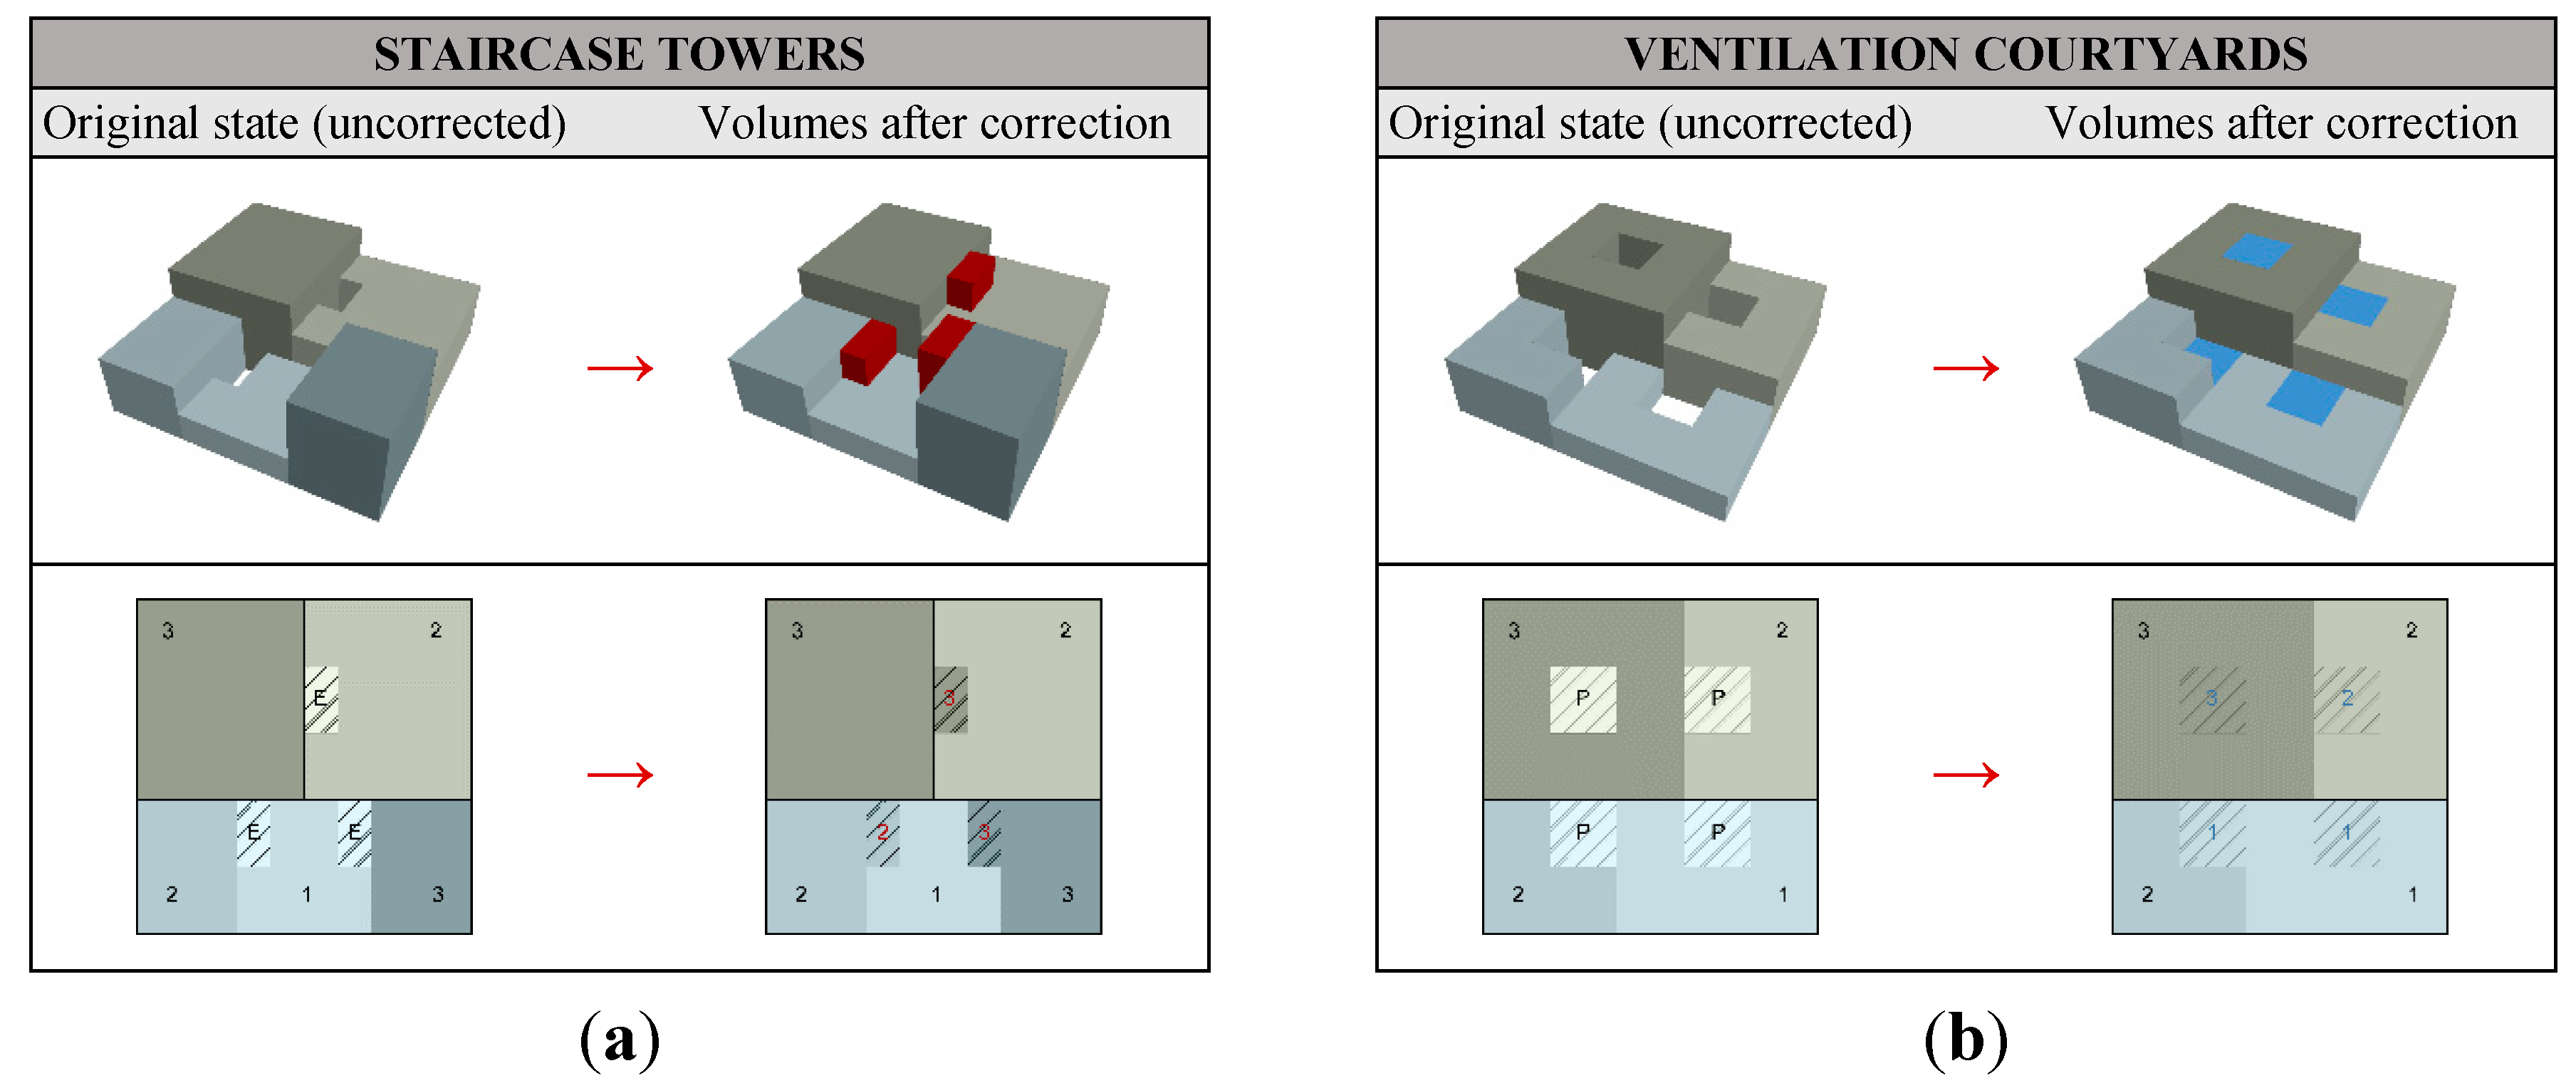
- Ventilation courtyards are a typological device that allows placing uses like kitchens and bedrooms in the core of the building and still be able to get ventilation and natural light. Although these courtyards are geometrically voids, from the planning regulations point of view, they are a design decision of the architect of the building and should not be considered as such but instead built up to the lowest volume they serve in its own parcel.
- (c)
- Staircase towers are not assigned a height value but are considered built volume. Since they have to give access to the adjacent volumes, its assumed height should be at least the height of the highest volume it serves in its own parcel.
2.4. Planning Data

| Fragment | Plan Entity | Condition | Operation | Symbology |
|---|---|---|---|---|
| Underbuilt | Zones | HB − HP < 0 | Intersection | Blue hues |
| Conformant | Zones | HB = HP | Intersection | Grey |
| Overbuilt | Zones | HB − HP > 0 | Intersection | Pink hues |
| Overbuilt | Systems | HB > 0 | Difference | Dark green |
| Conformant | Systems | HB = 0 | Difference | Light green |
3. Methods
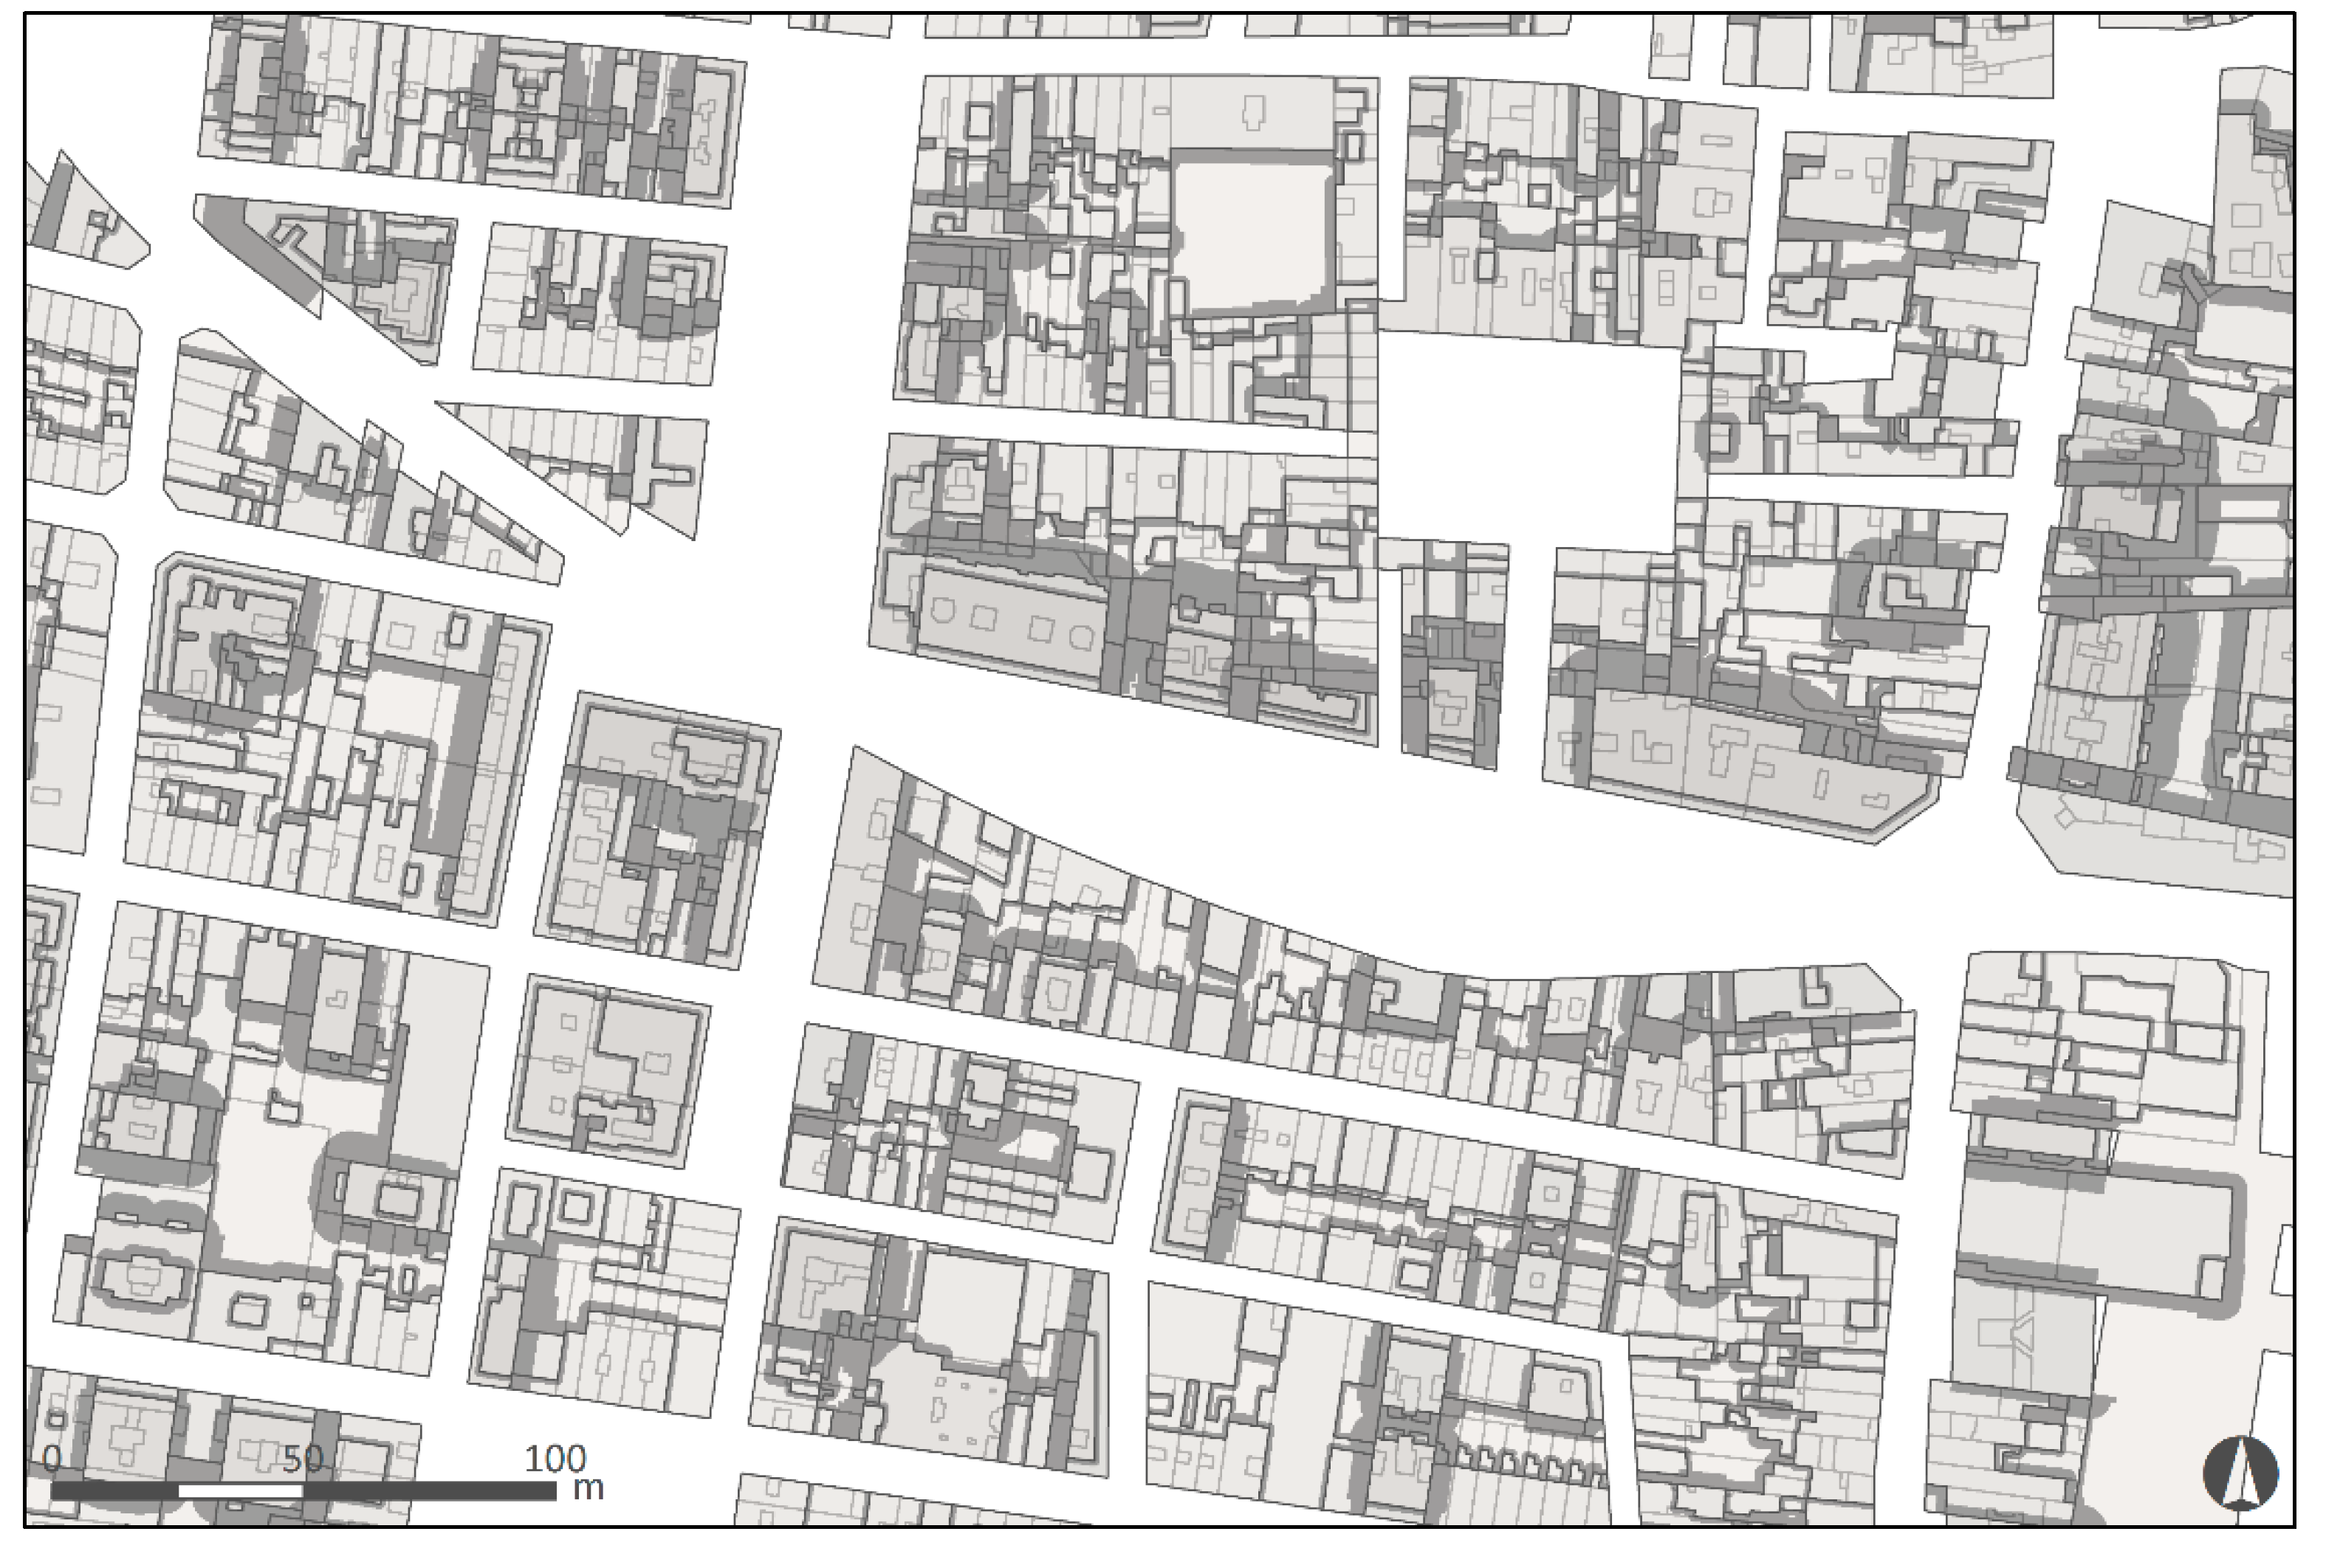
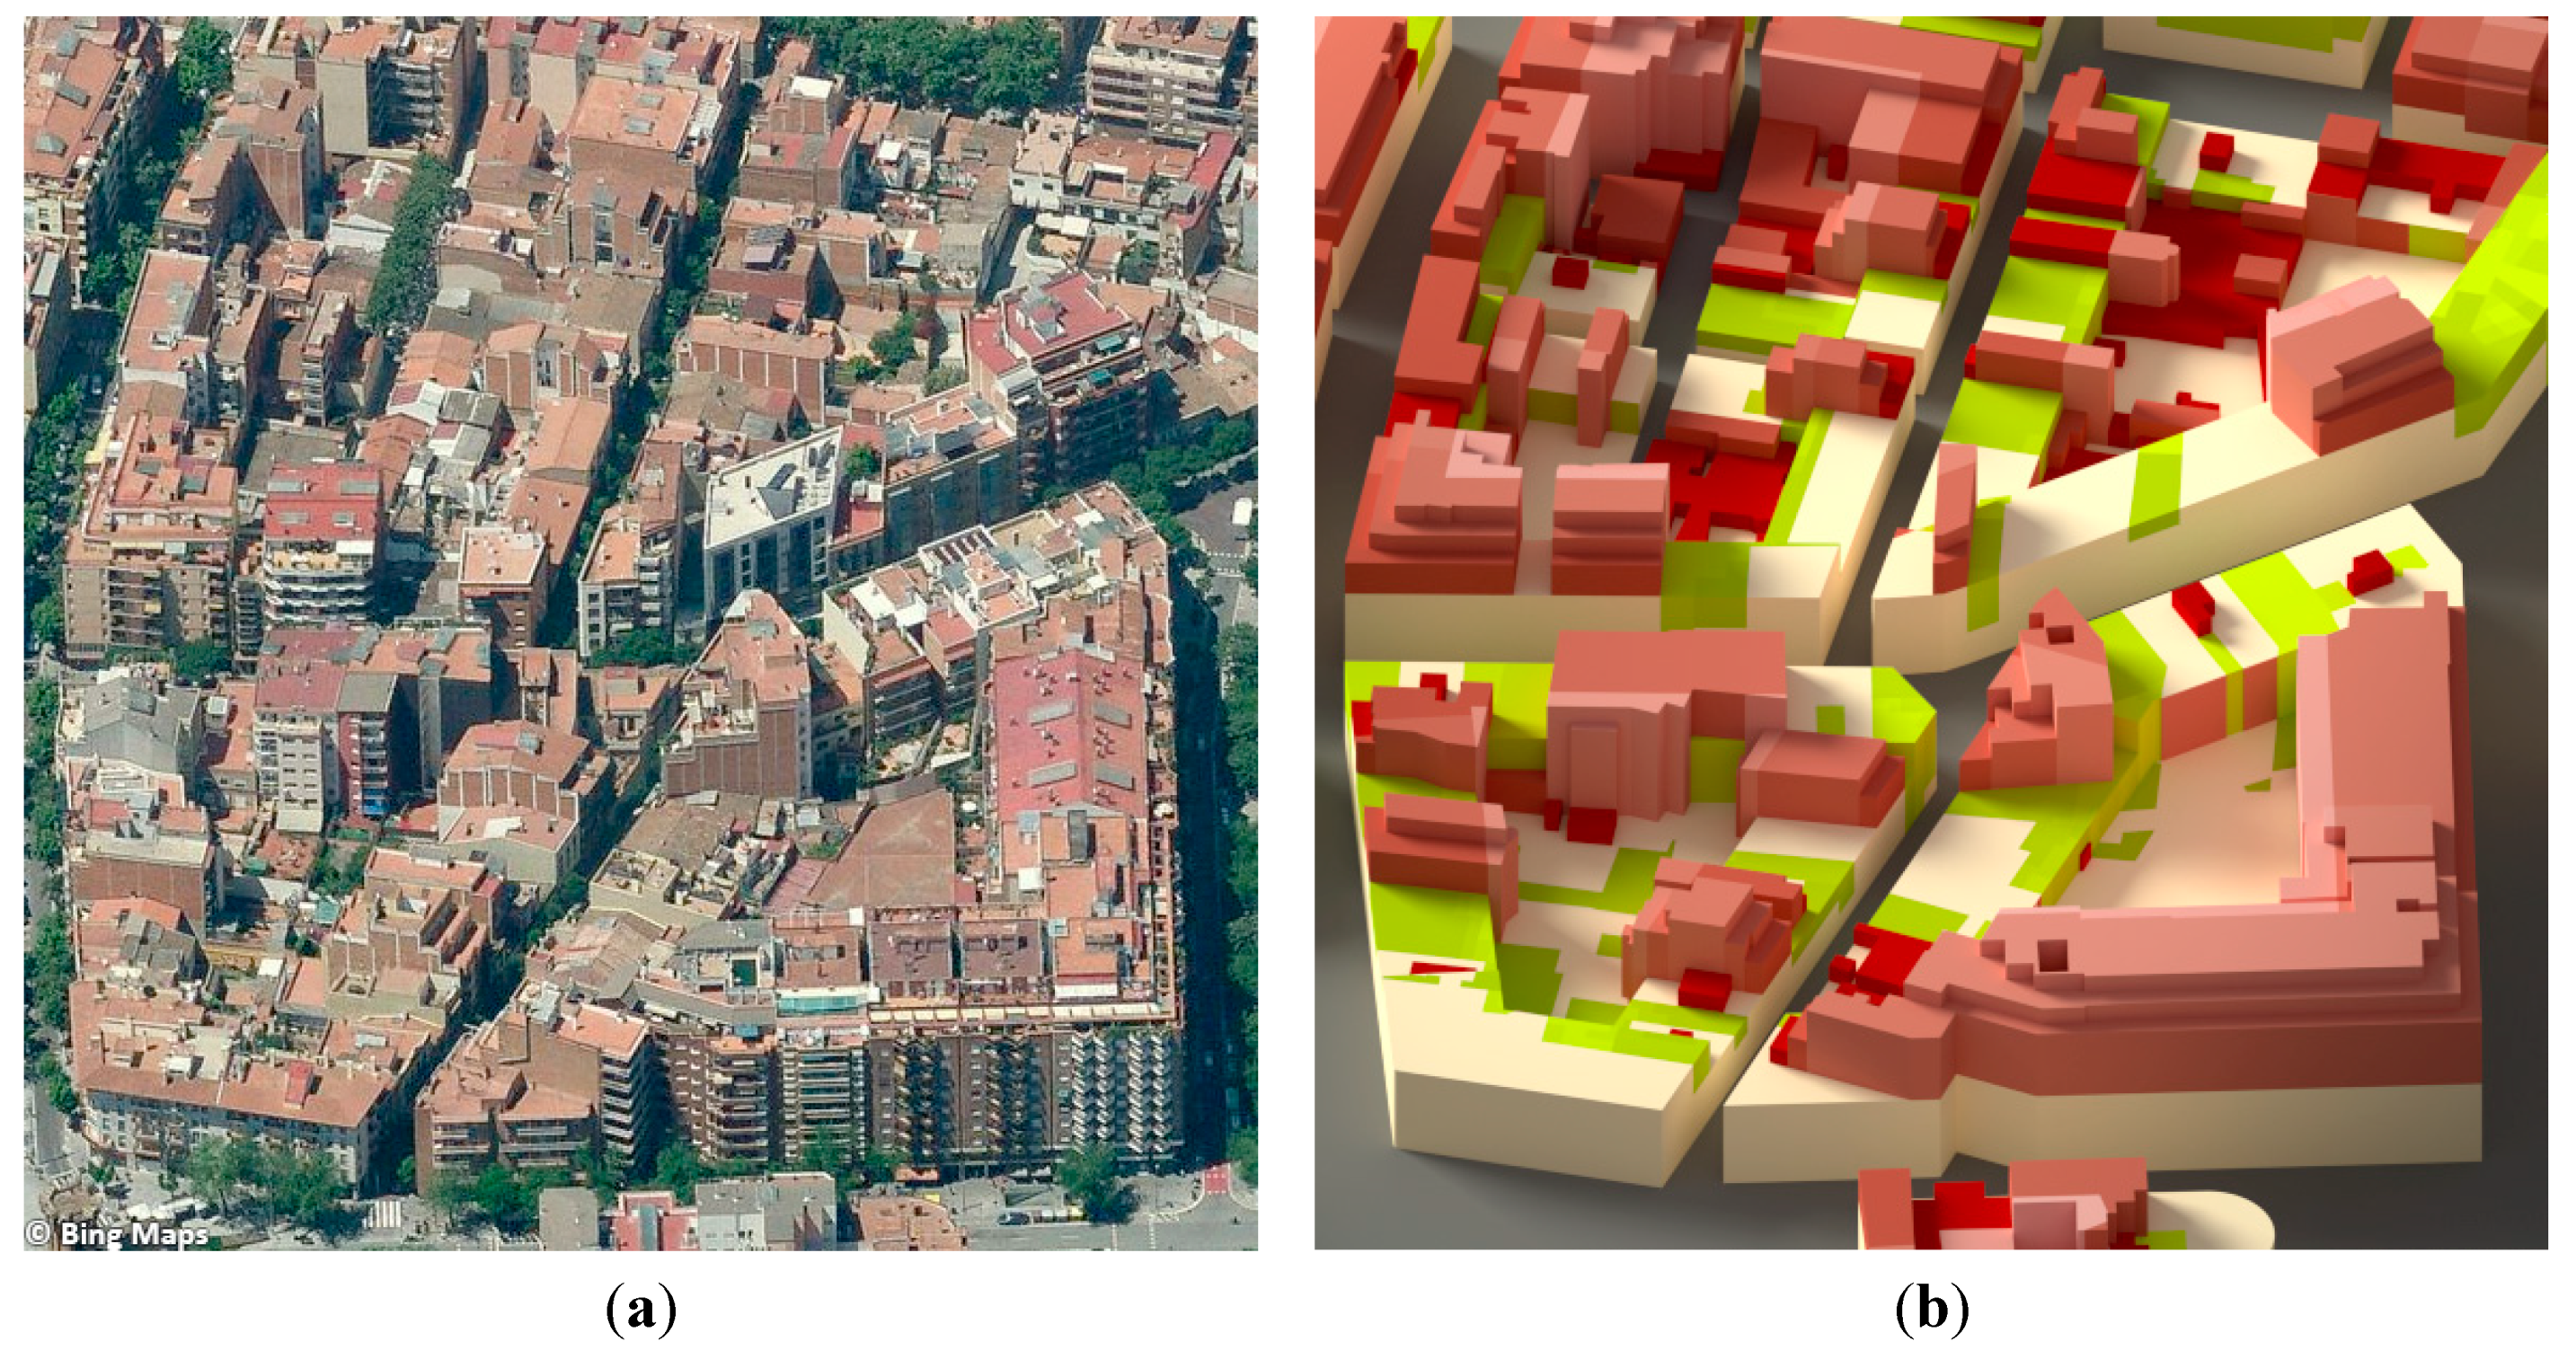
3.1. Representation of Overlapping Information in 3D
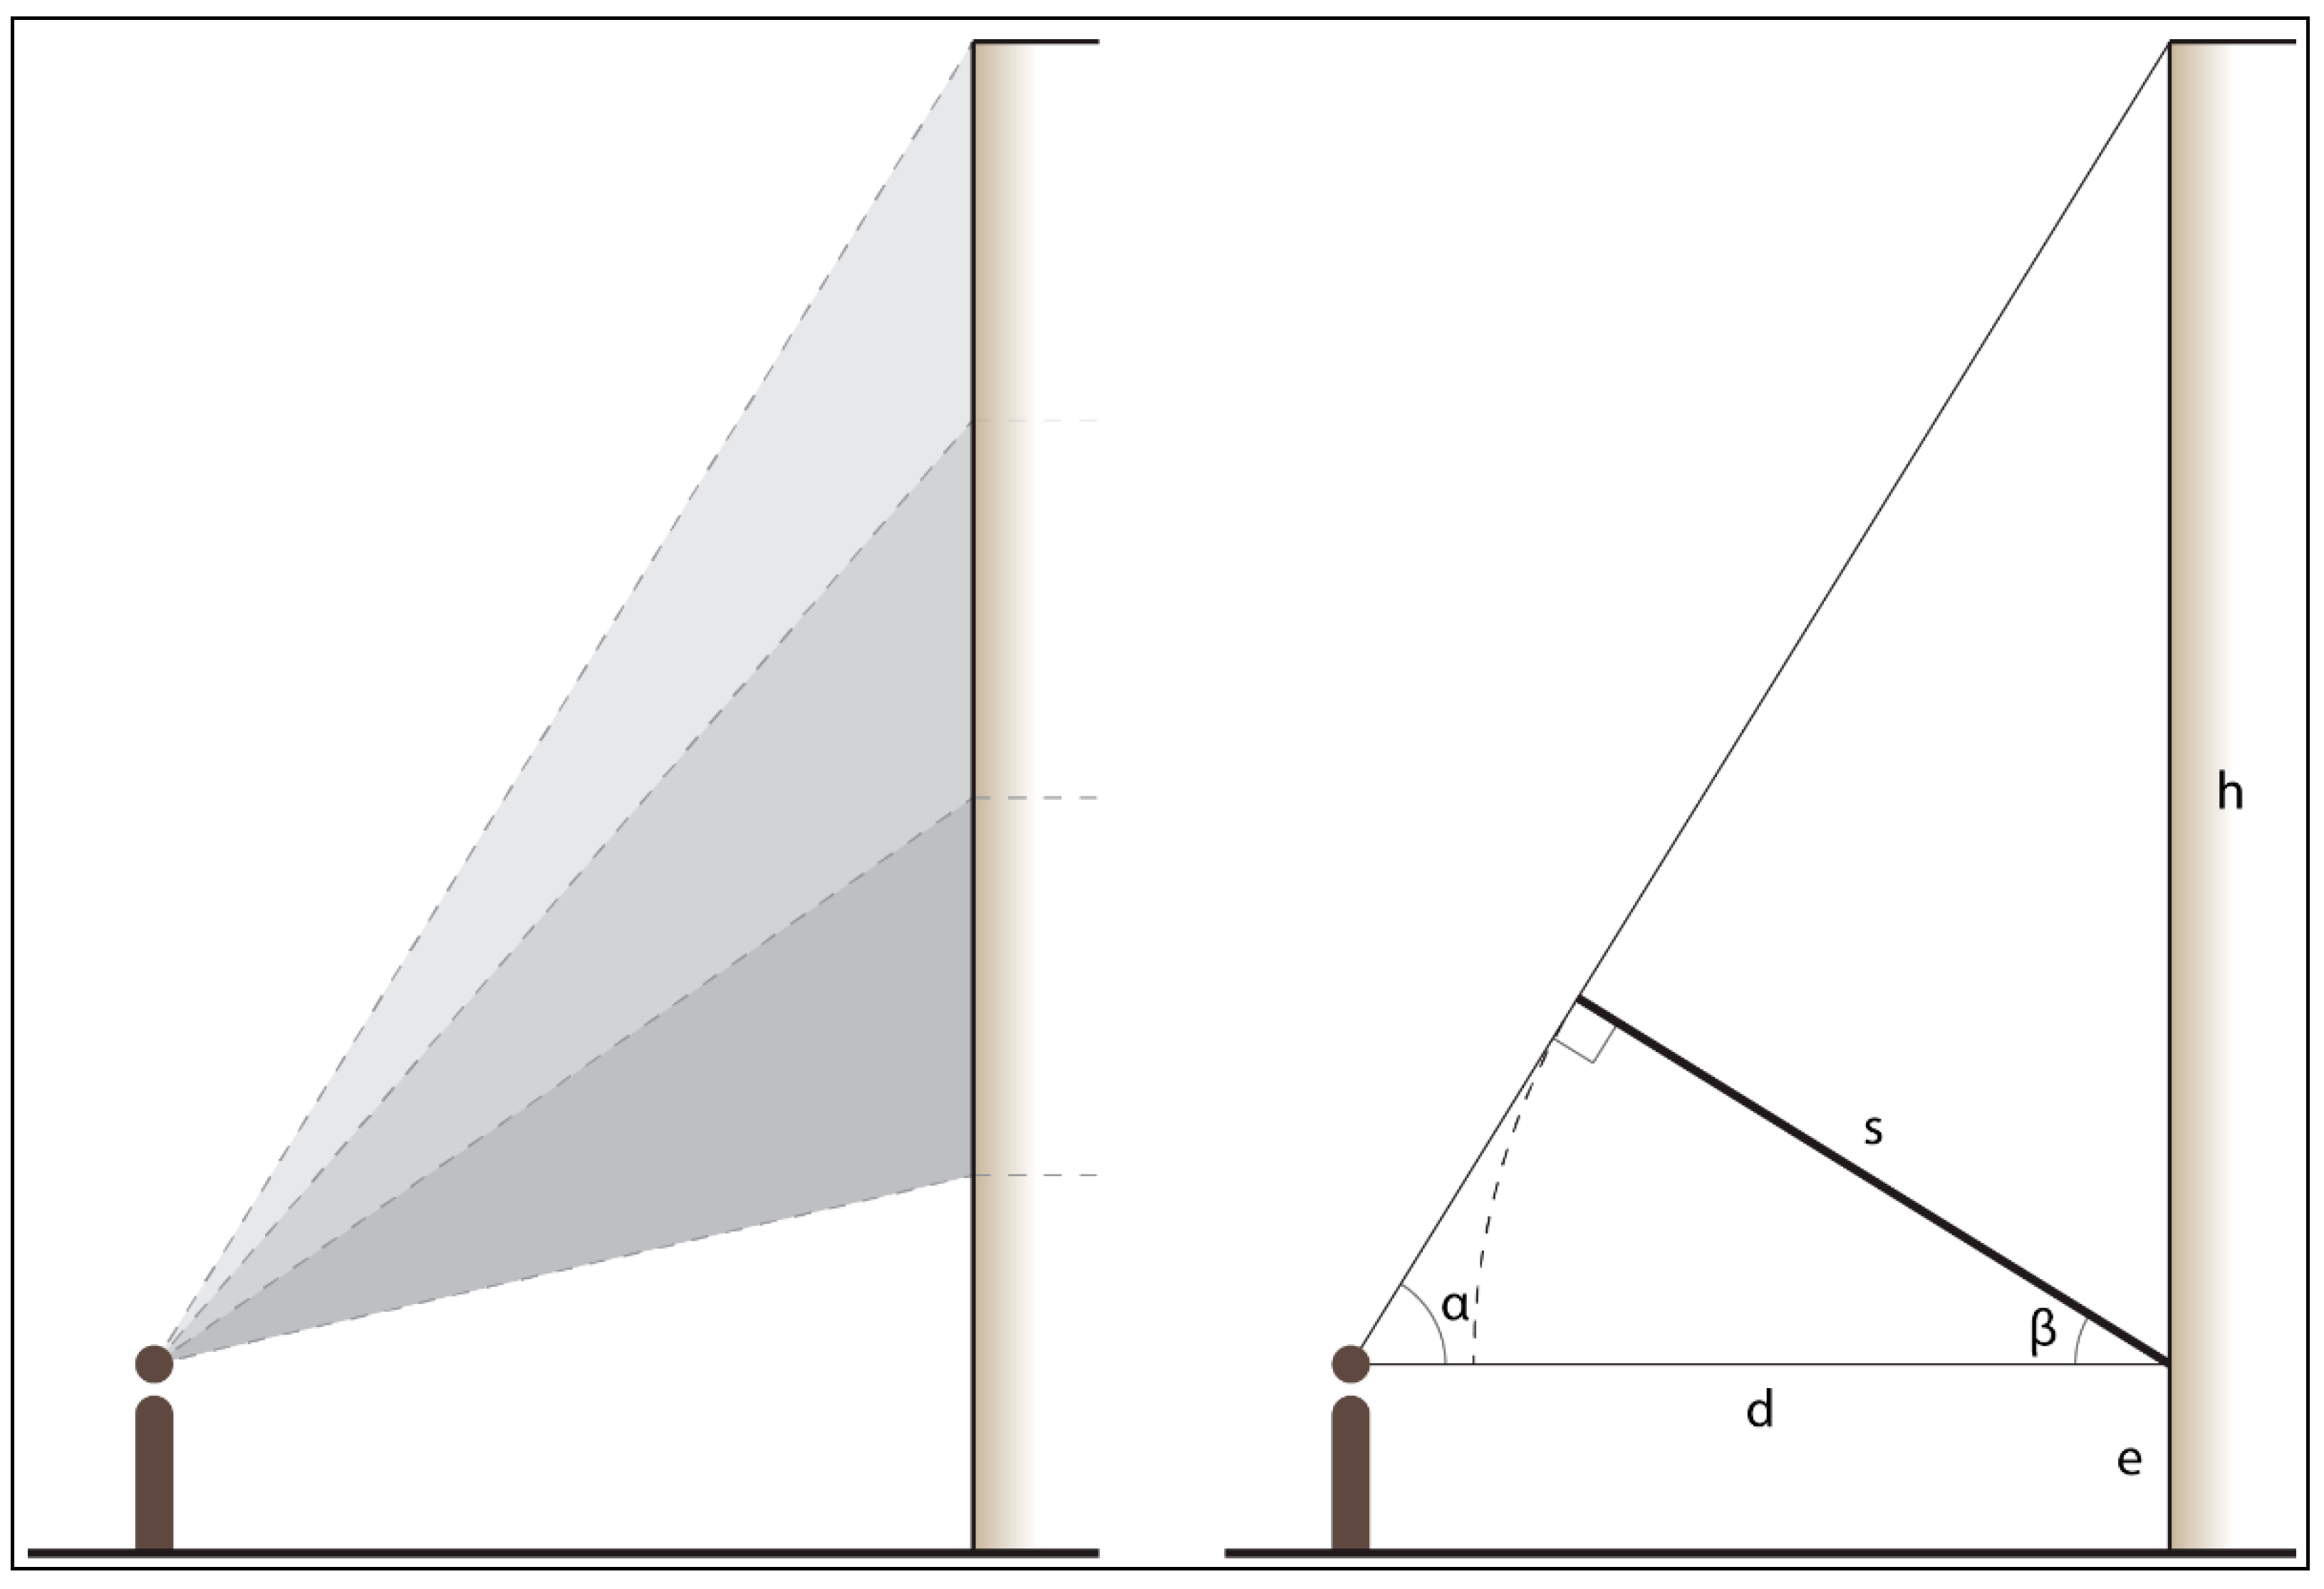
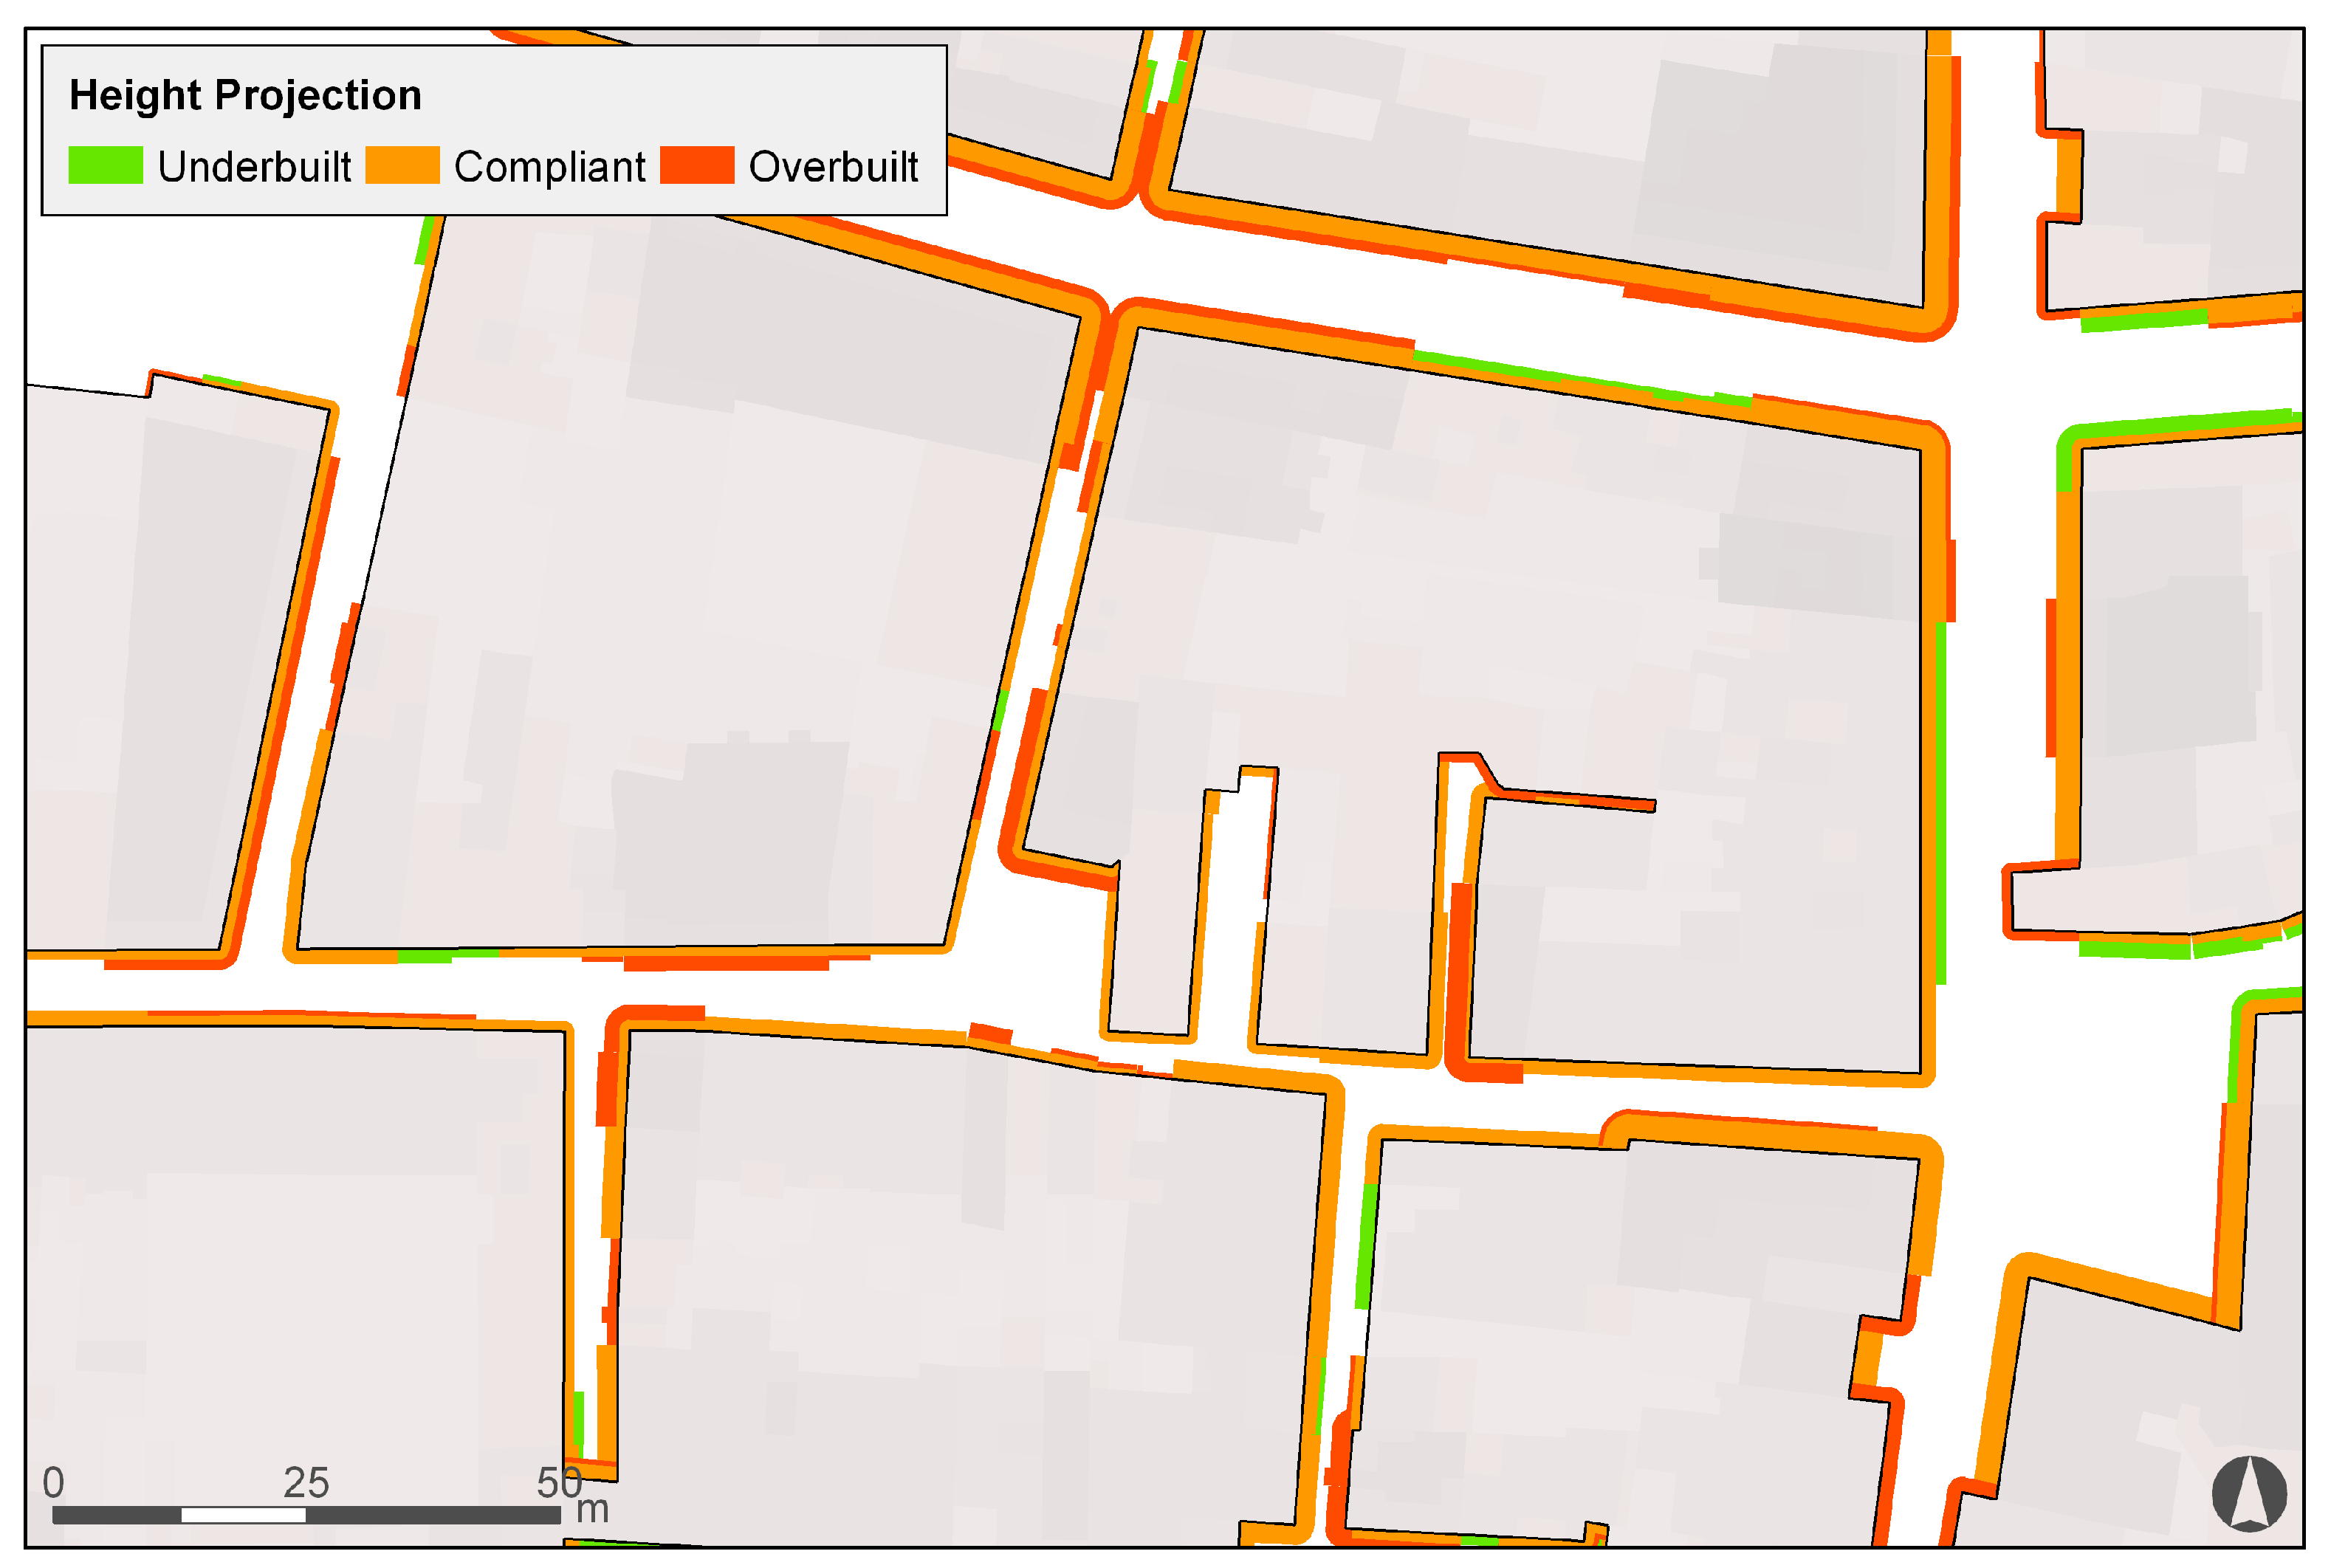
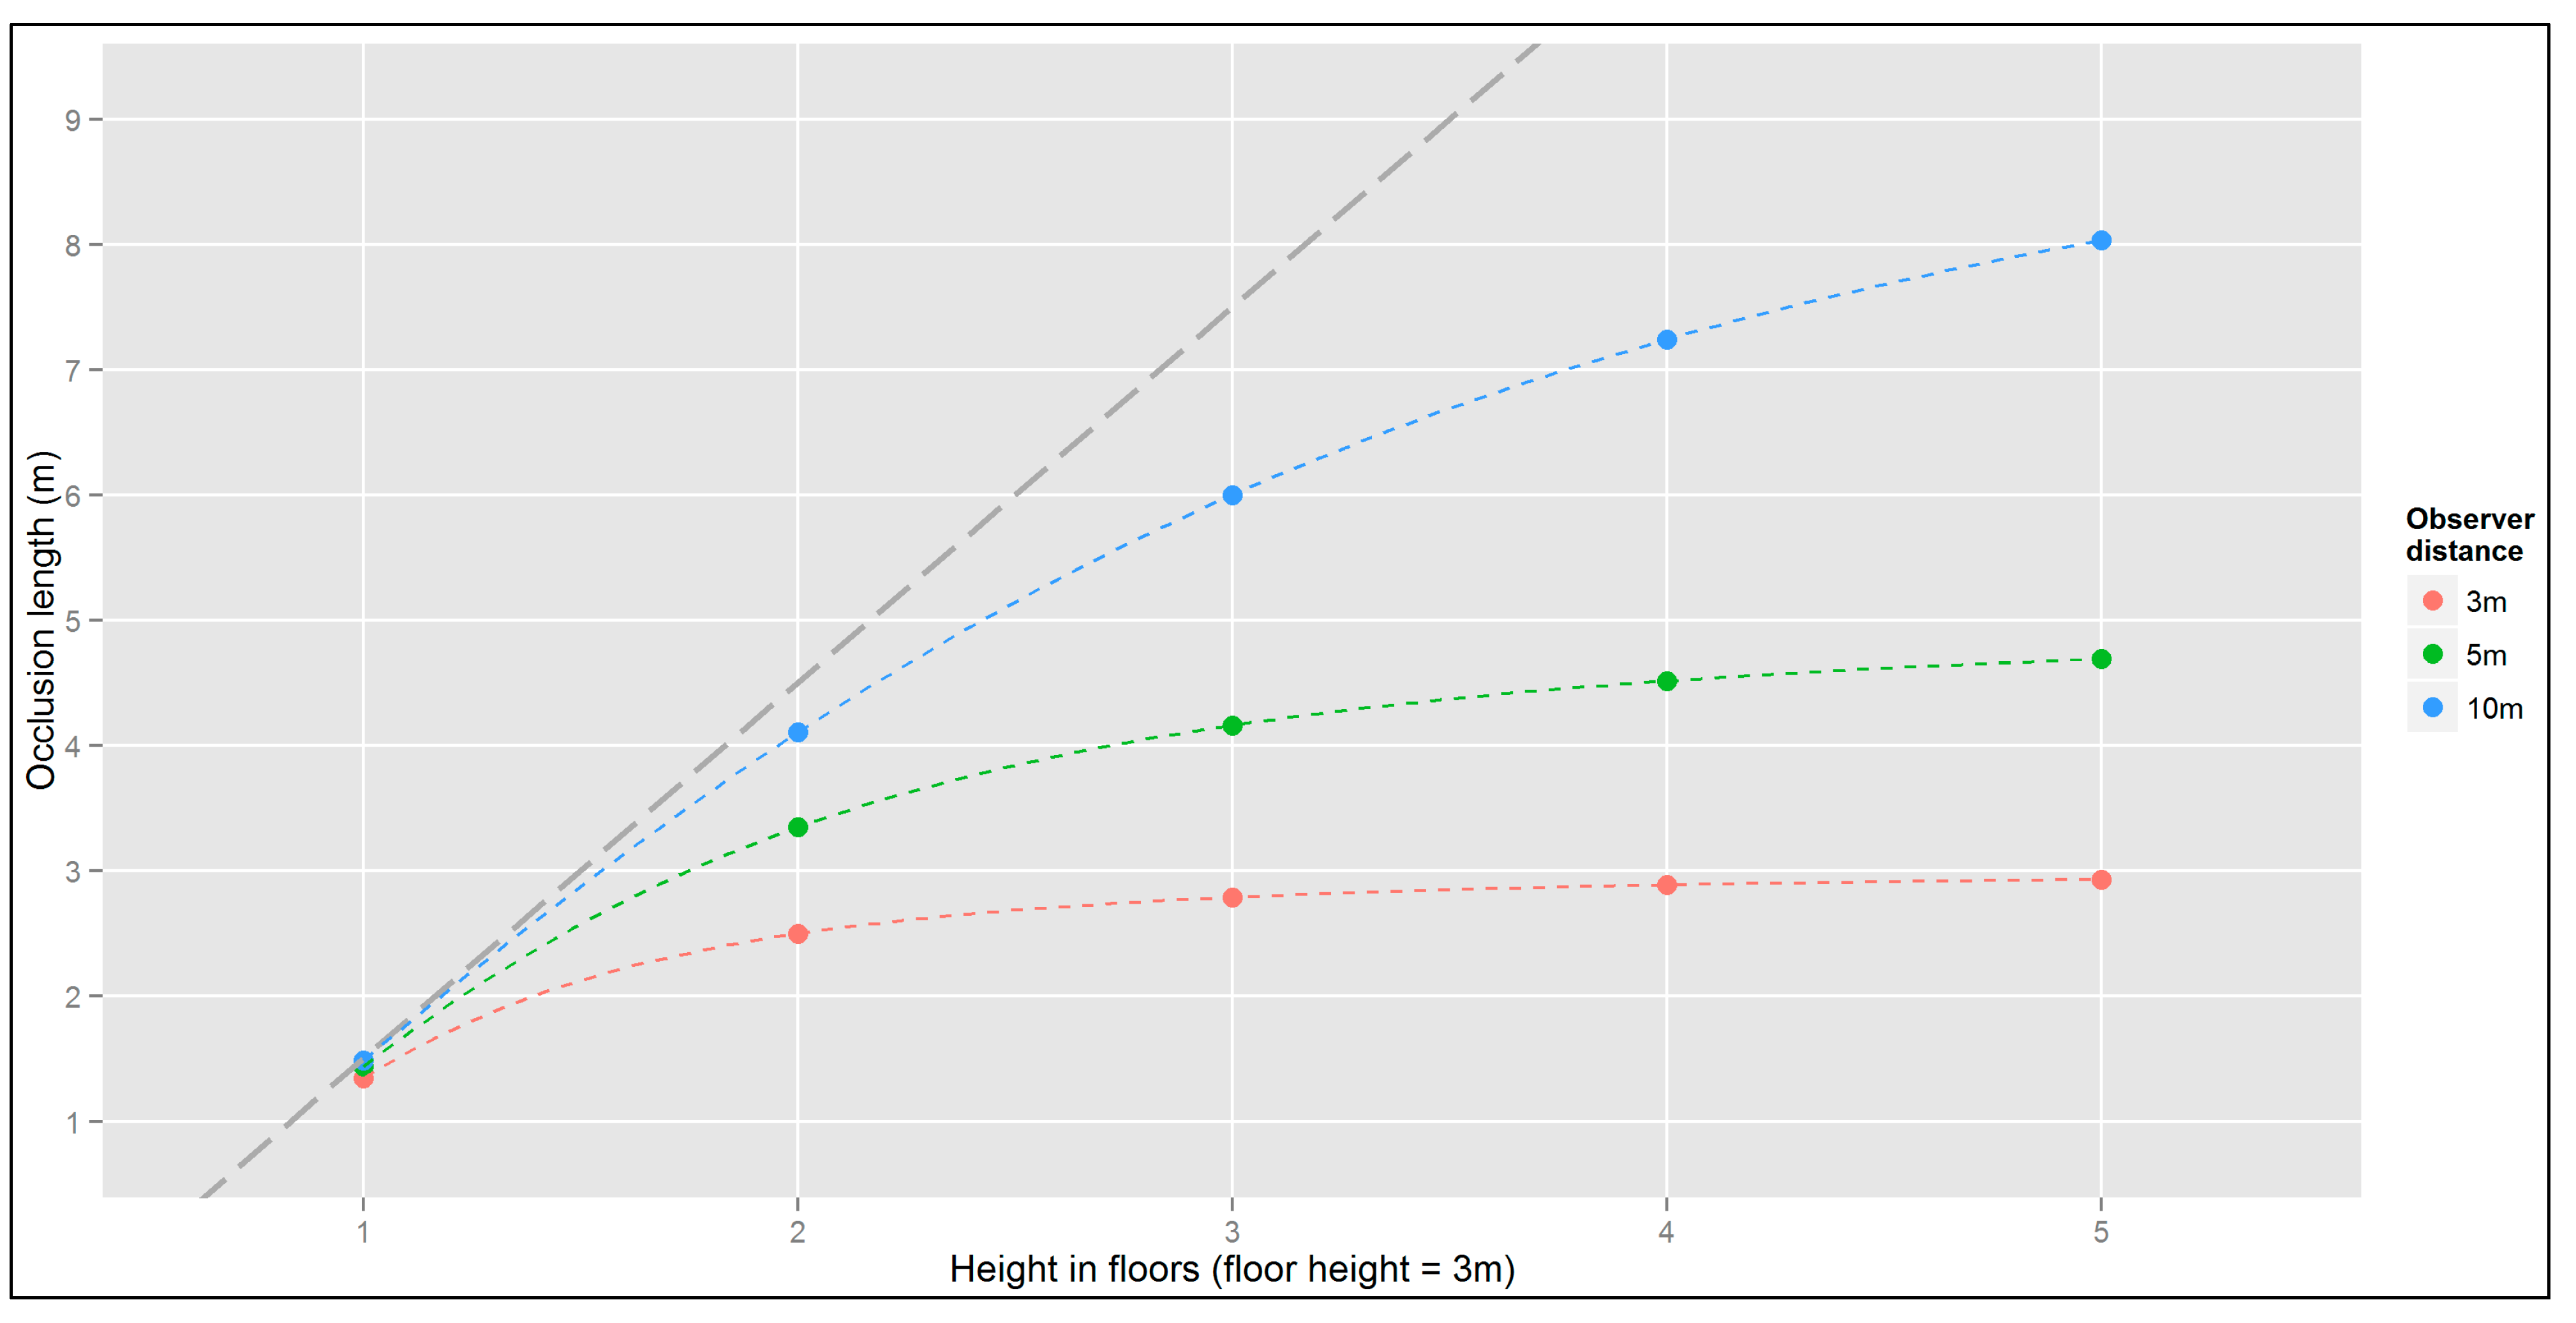
3.2. Pedestrian-centric Representation of Height in 2D

def segment(floors, dist, eye):
    # All numbers are assumed positive
    if floors == 0:
        return 0
    else:
        alpha = math.atan((floors * 3 - eye) / dist)
        beta = math.pi / 2 - alpha
        seg = dist * math.cos(beta)
        return seg
- For e = 0 is the apparent surface as seen from the pavement
- When d approaches infinity and e = 0, d is the projection of the height on the horizontal plane (d = h)
- As d increases, it has the oblique asymptote y = h·x − e
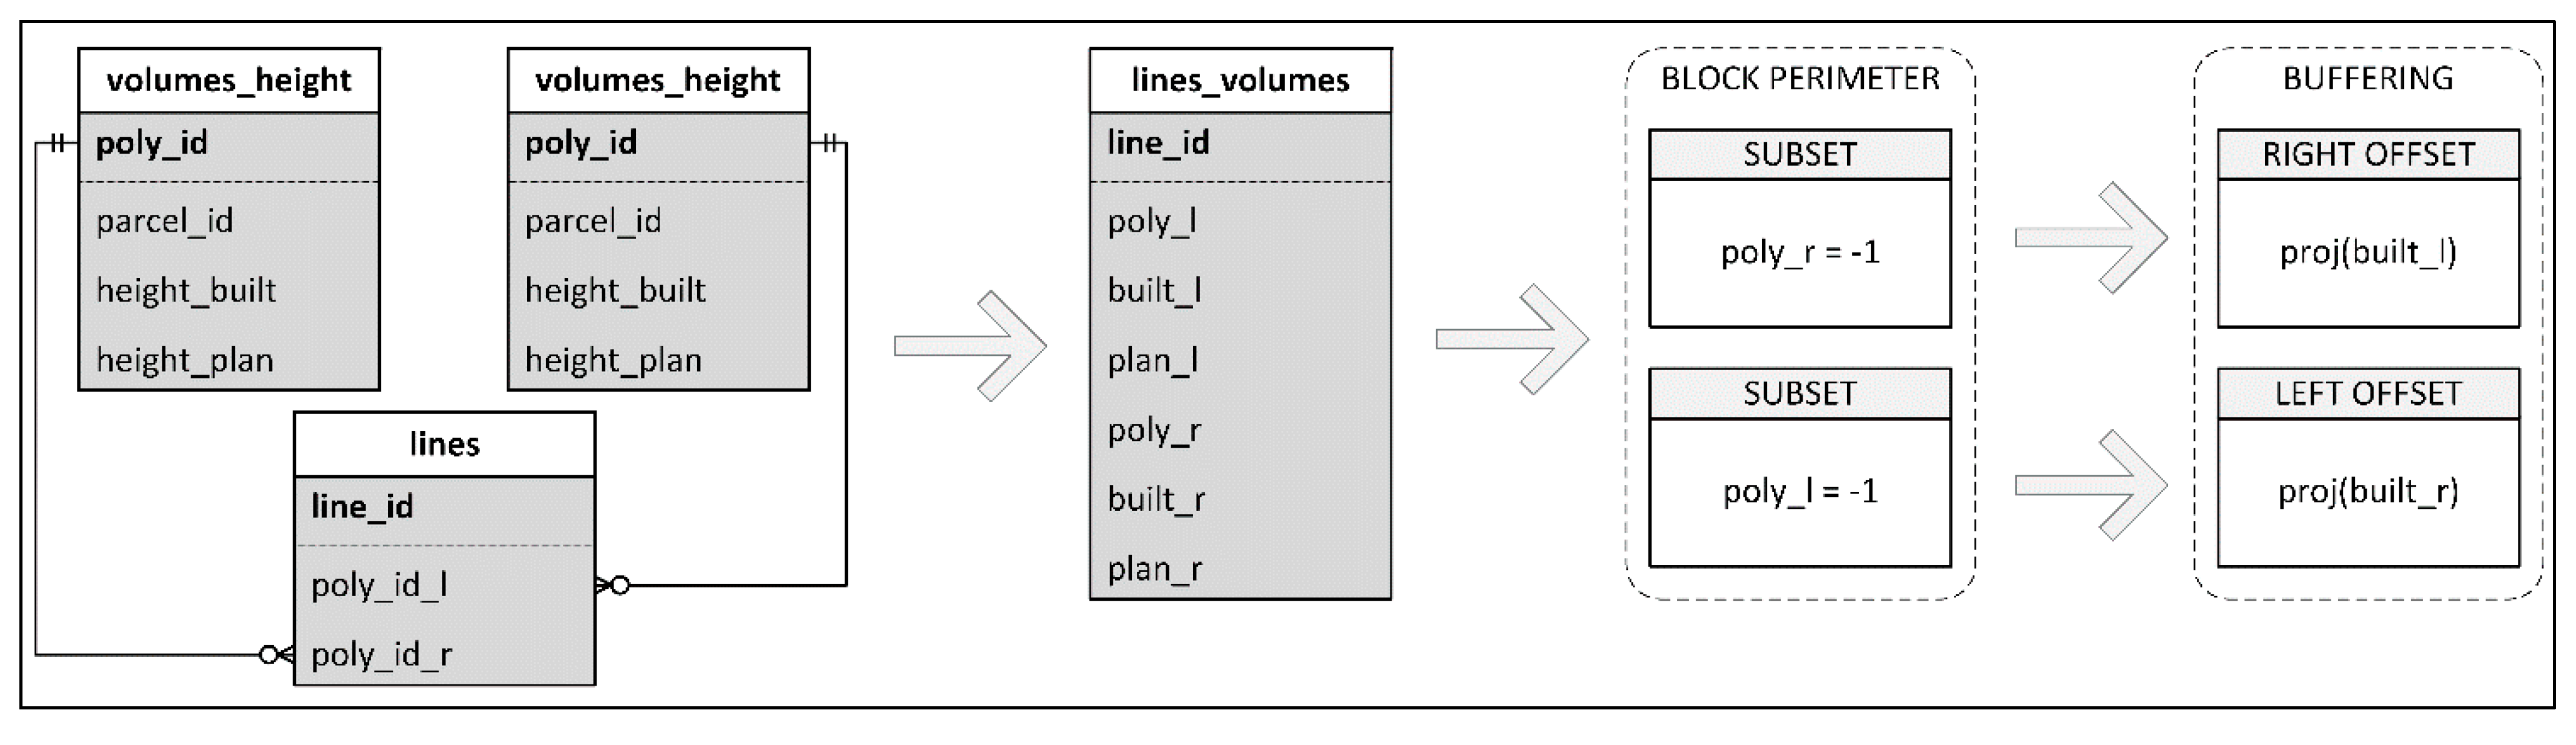
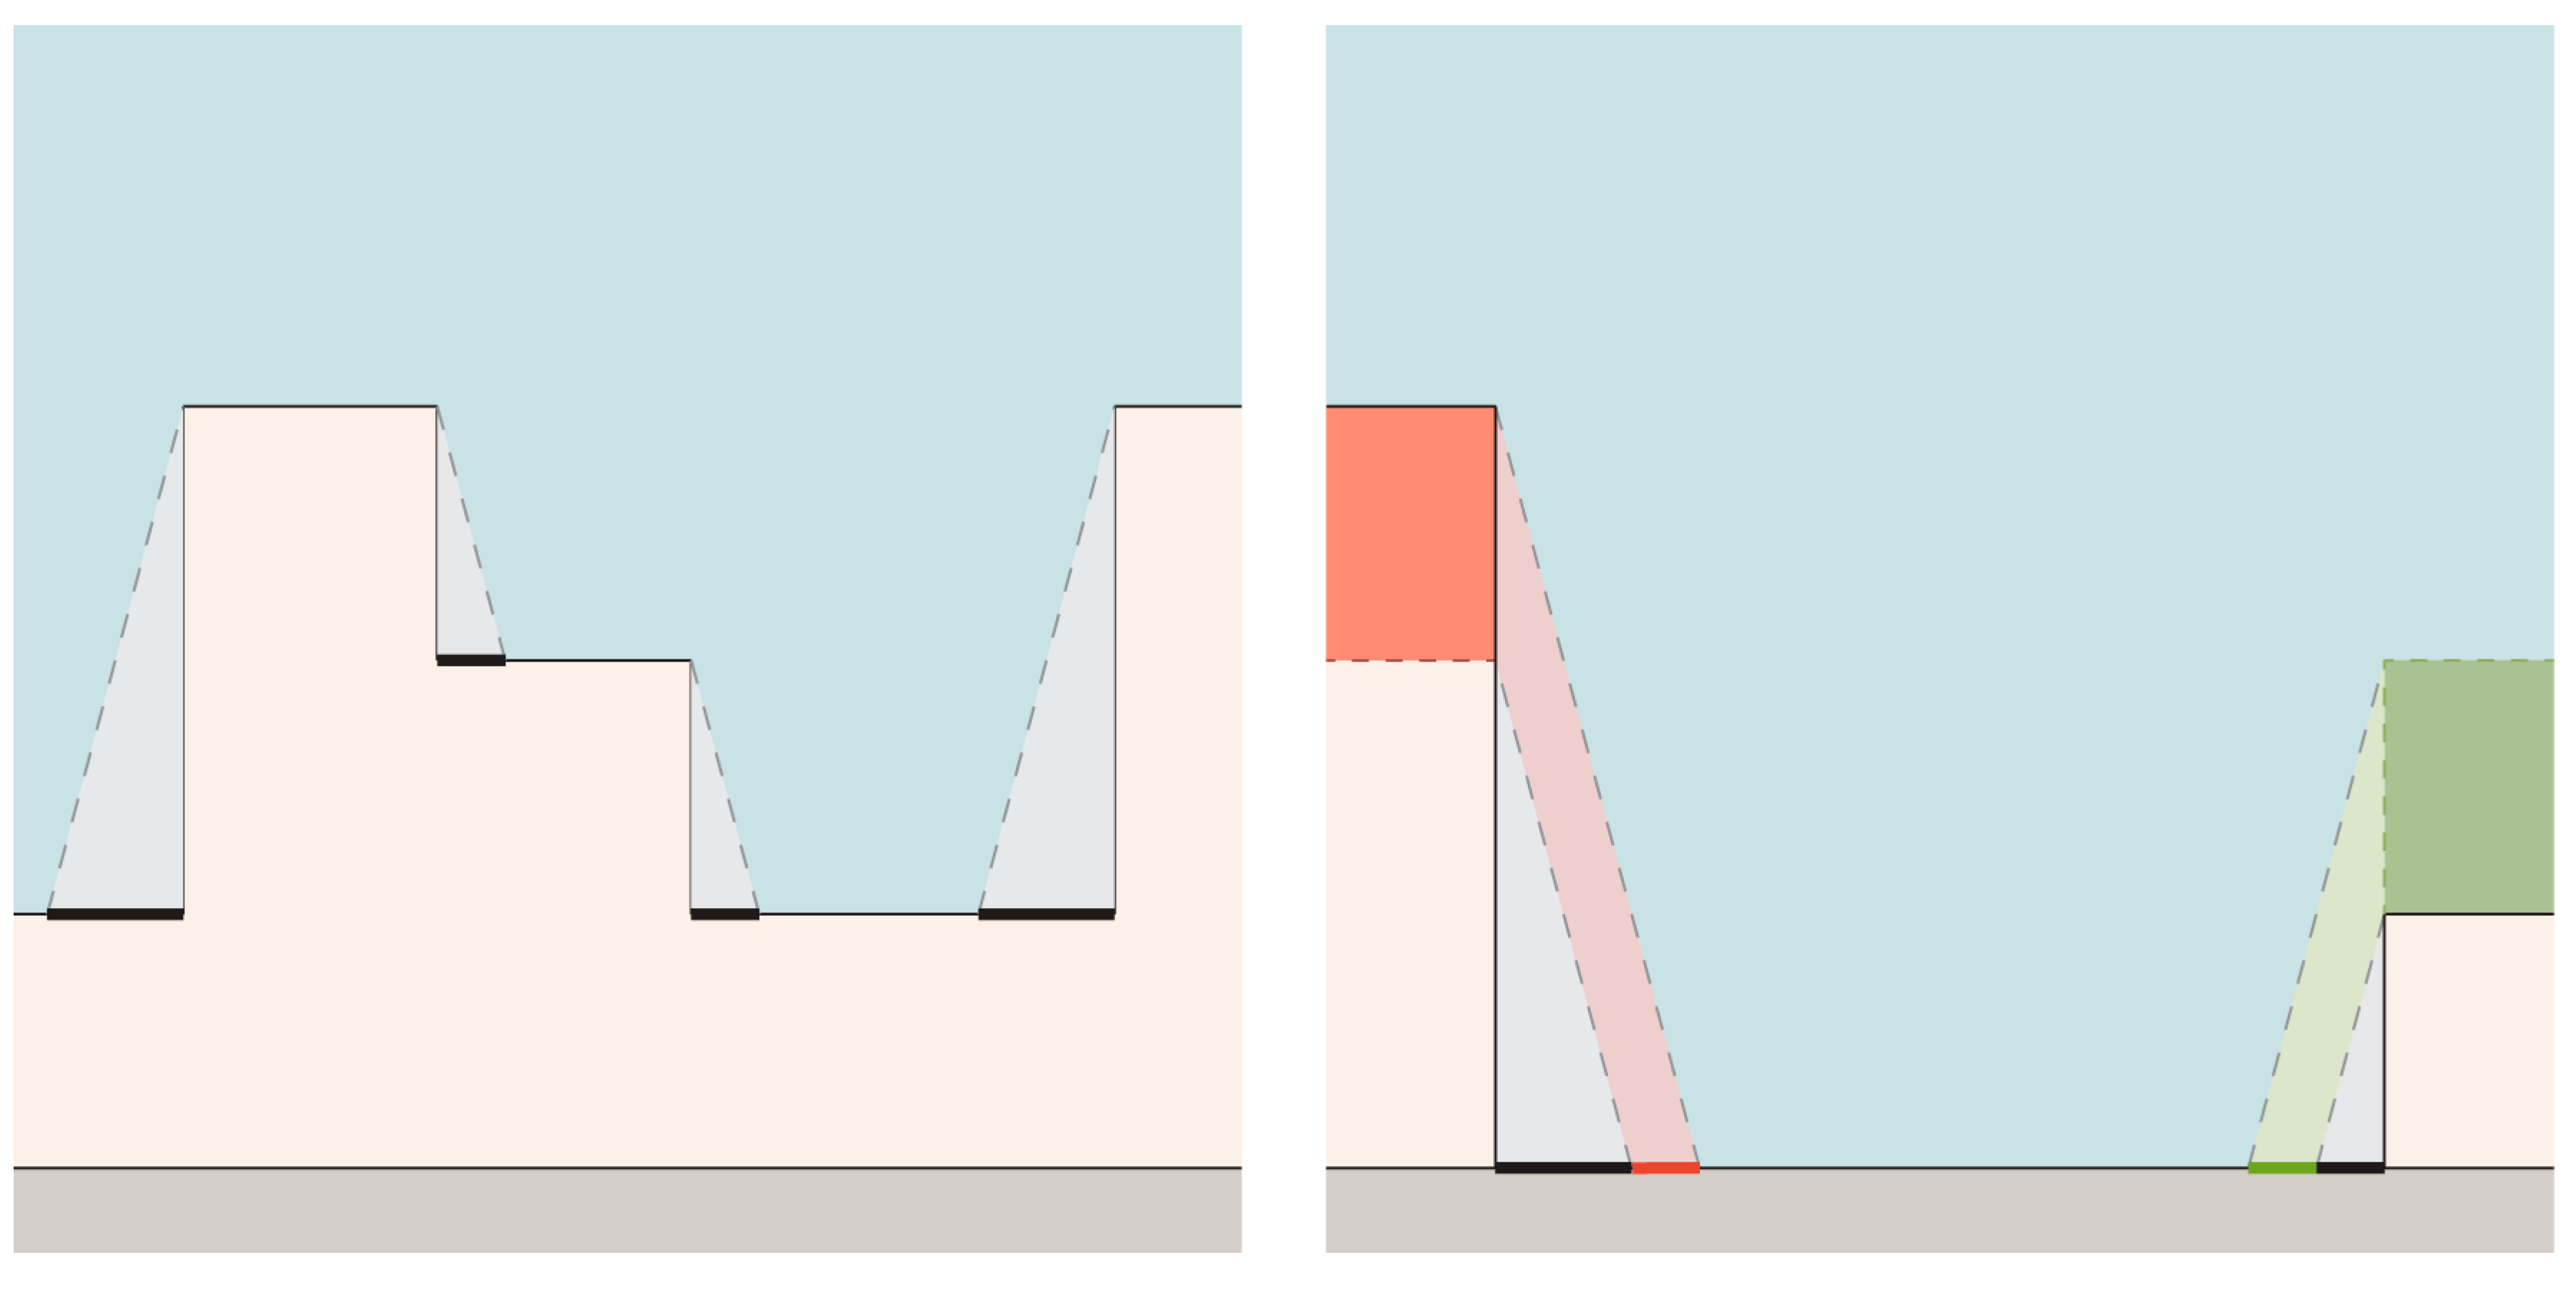
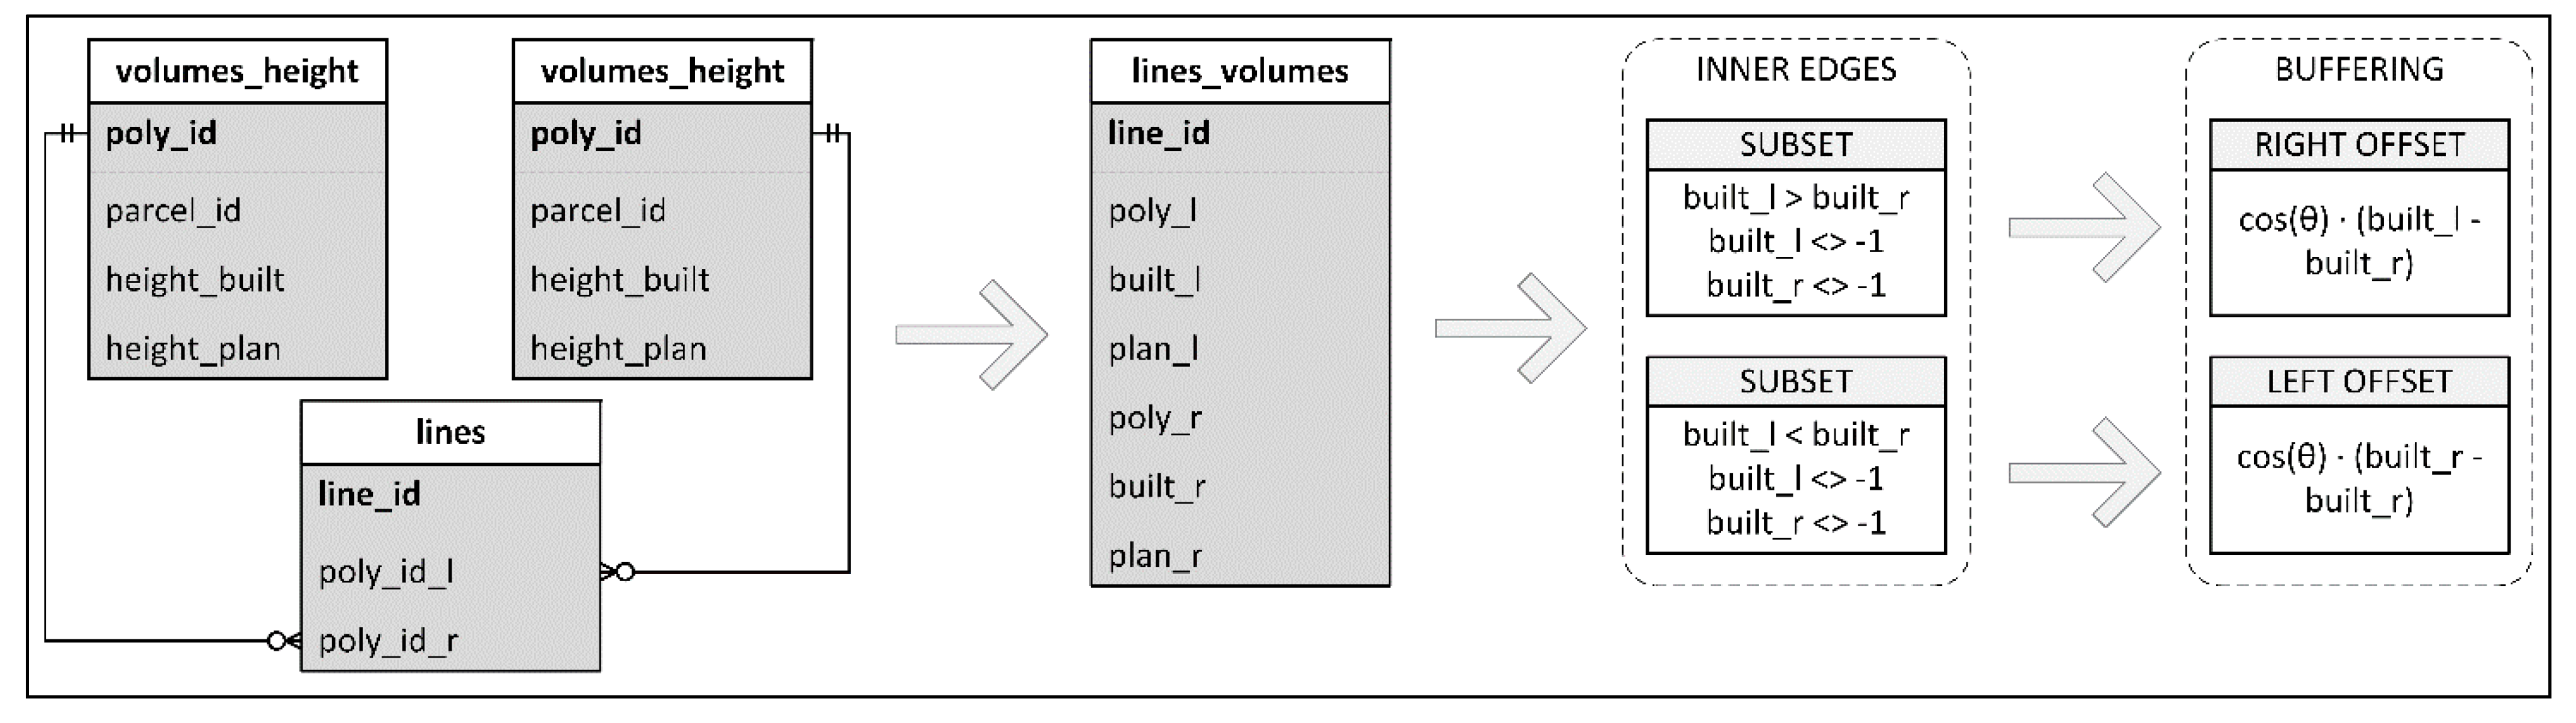
3.3. View Occlusion by Neighboring Volumes
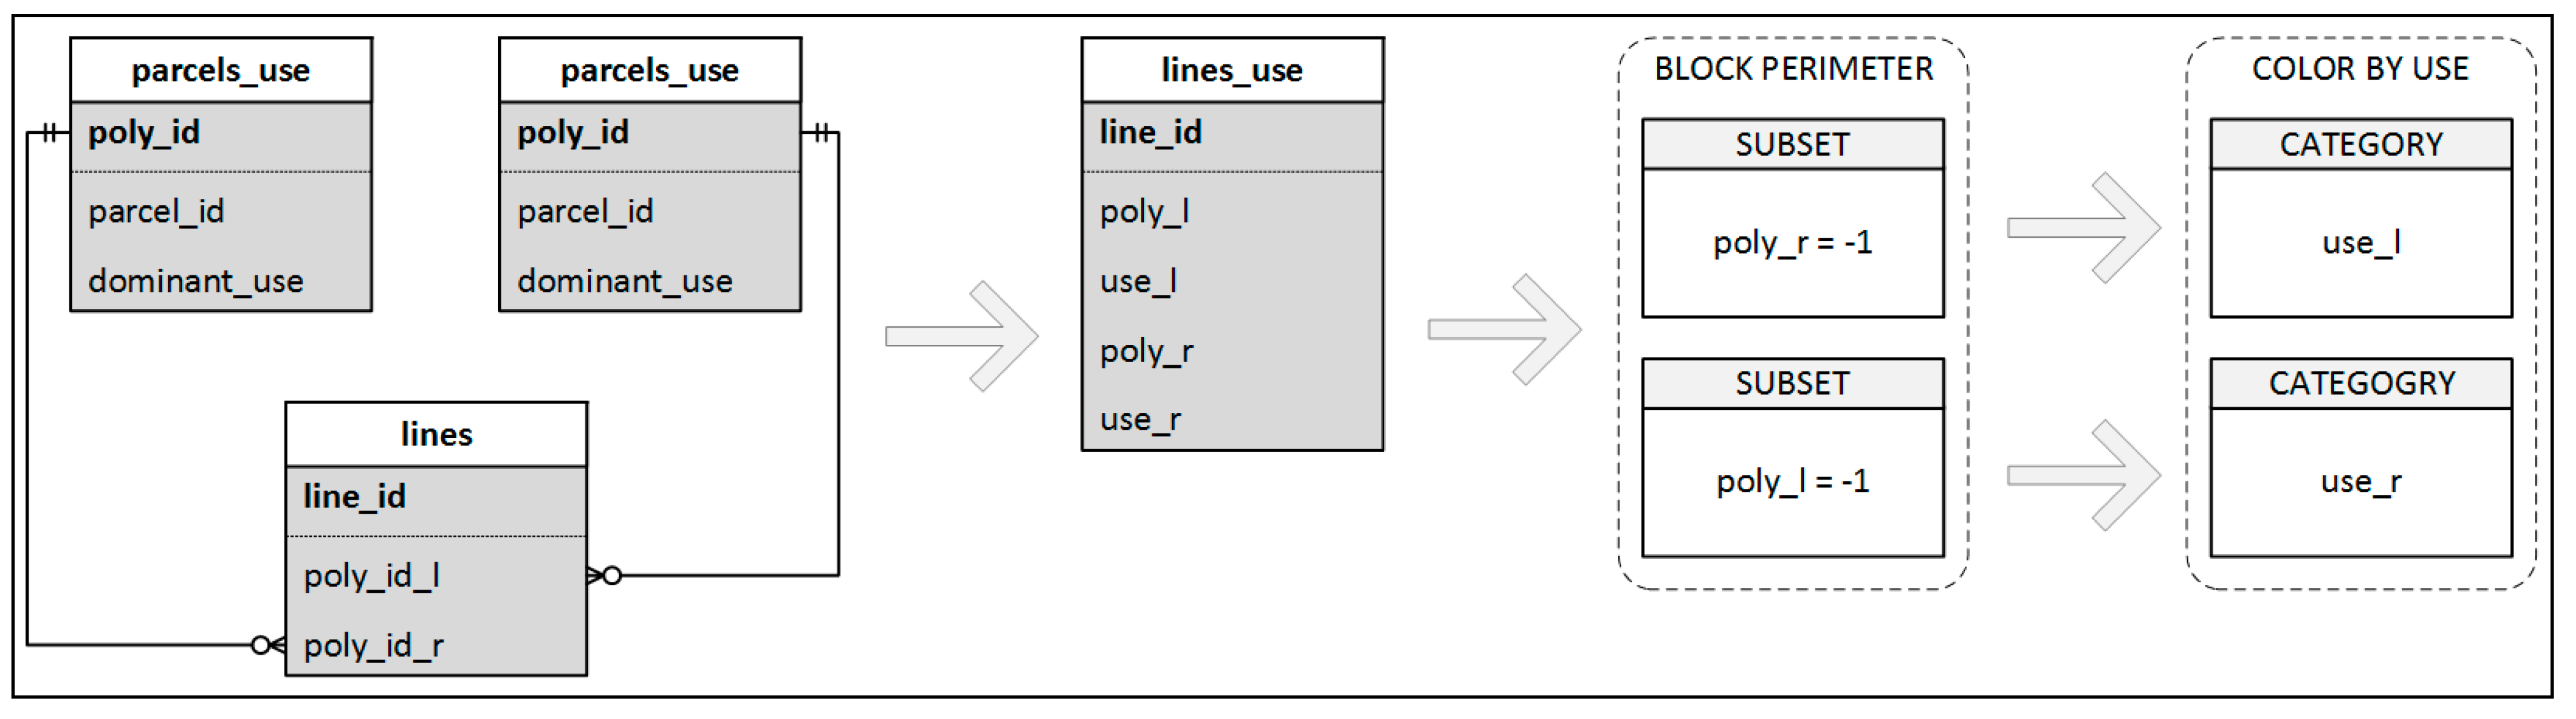
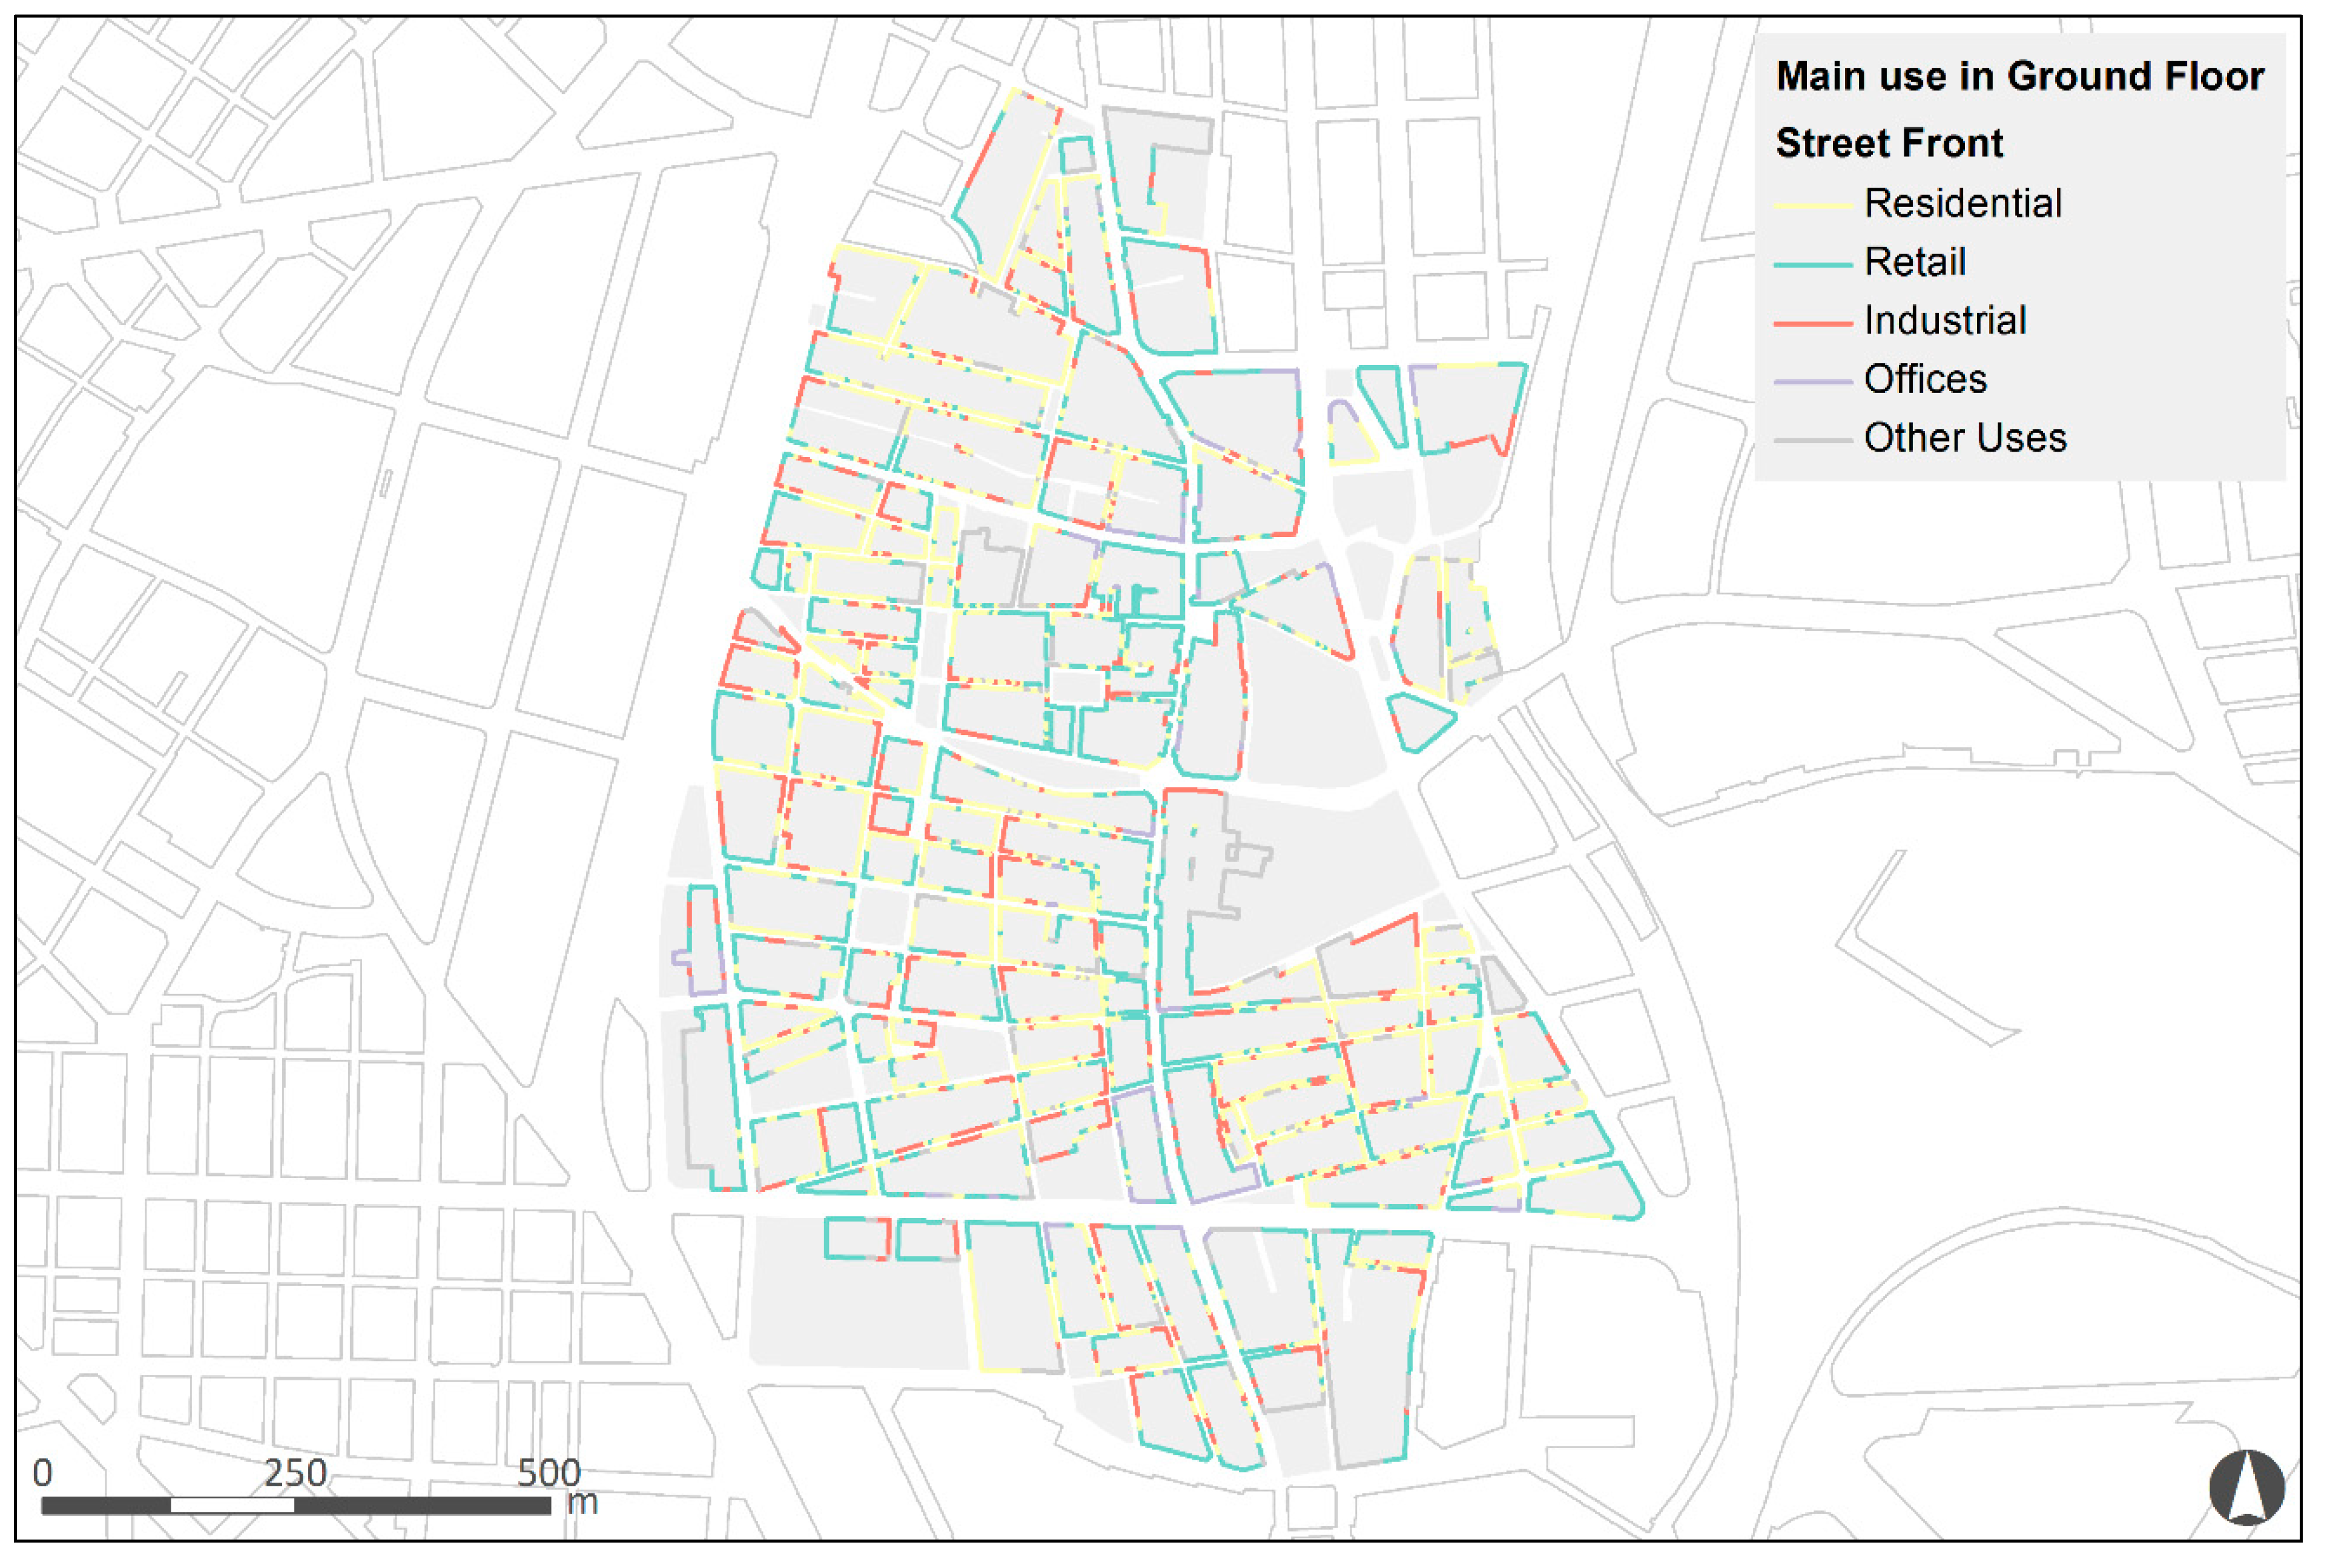
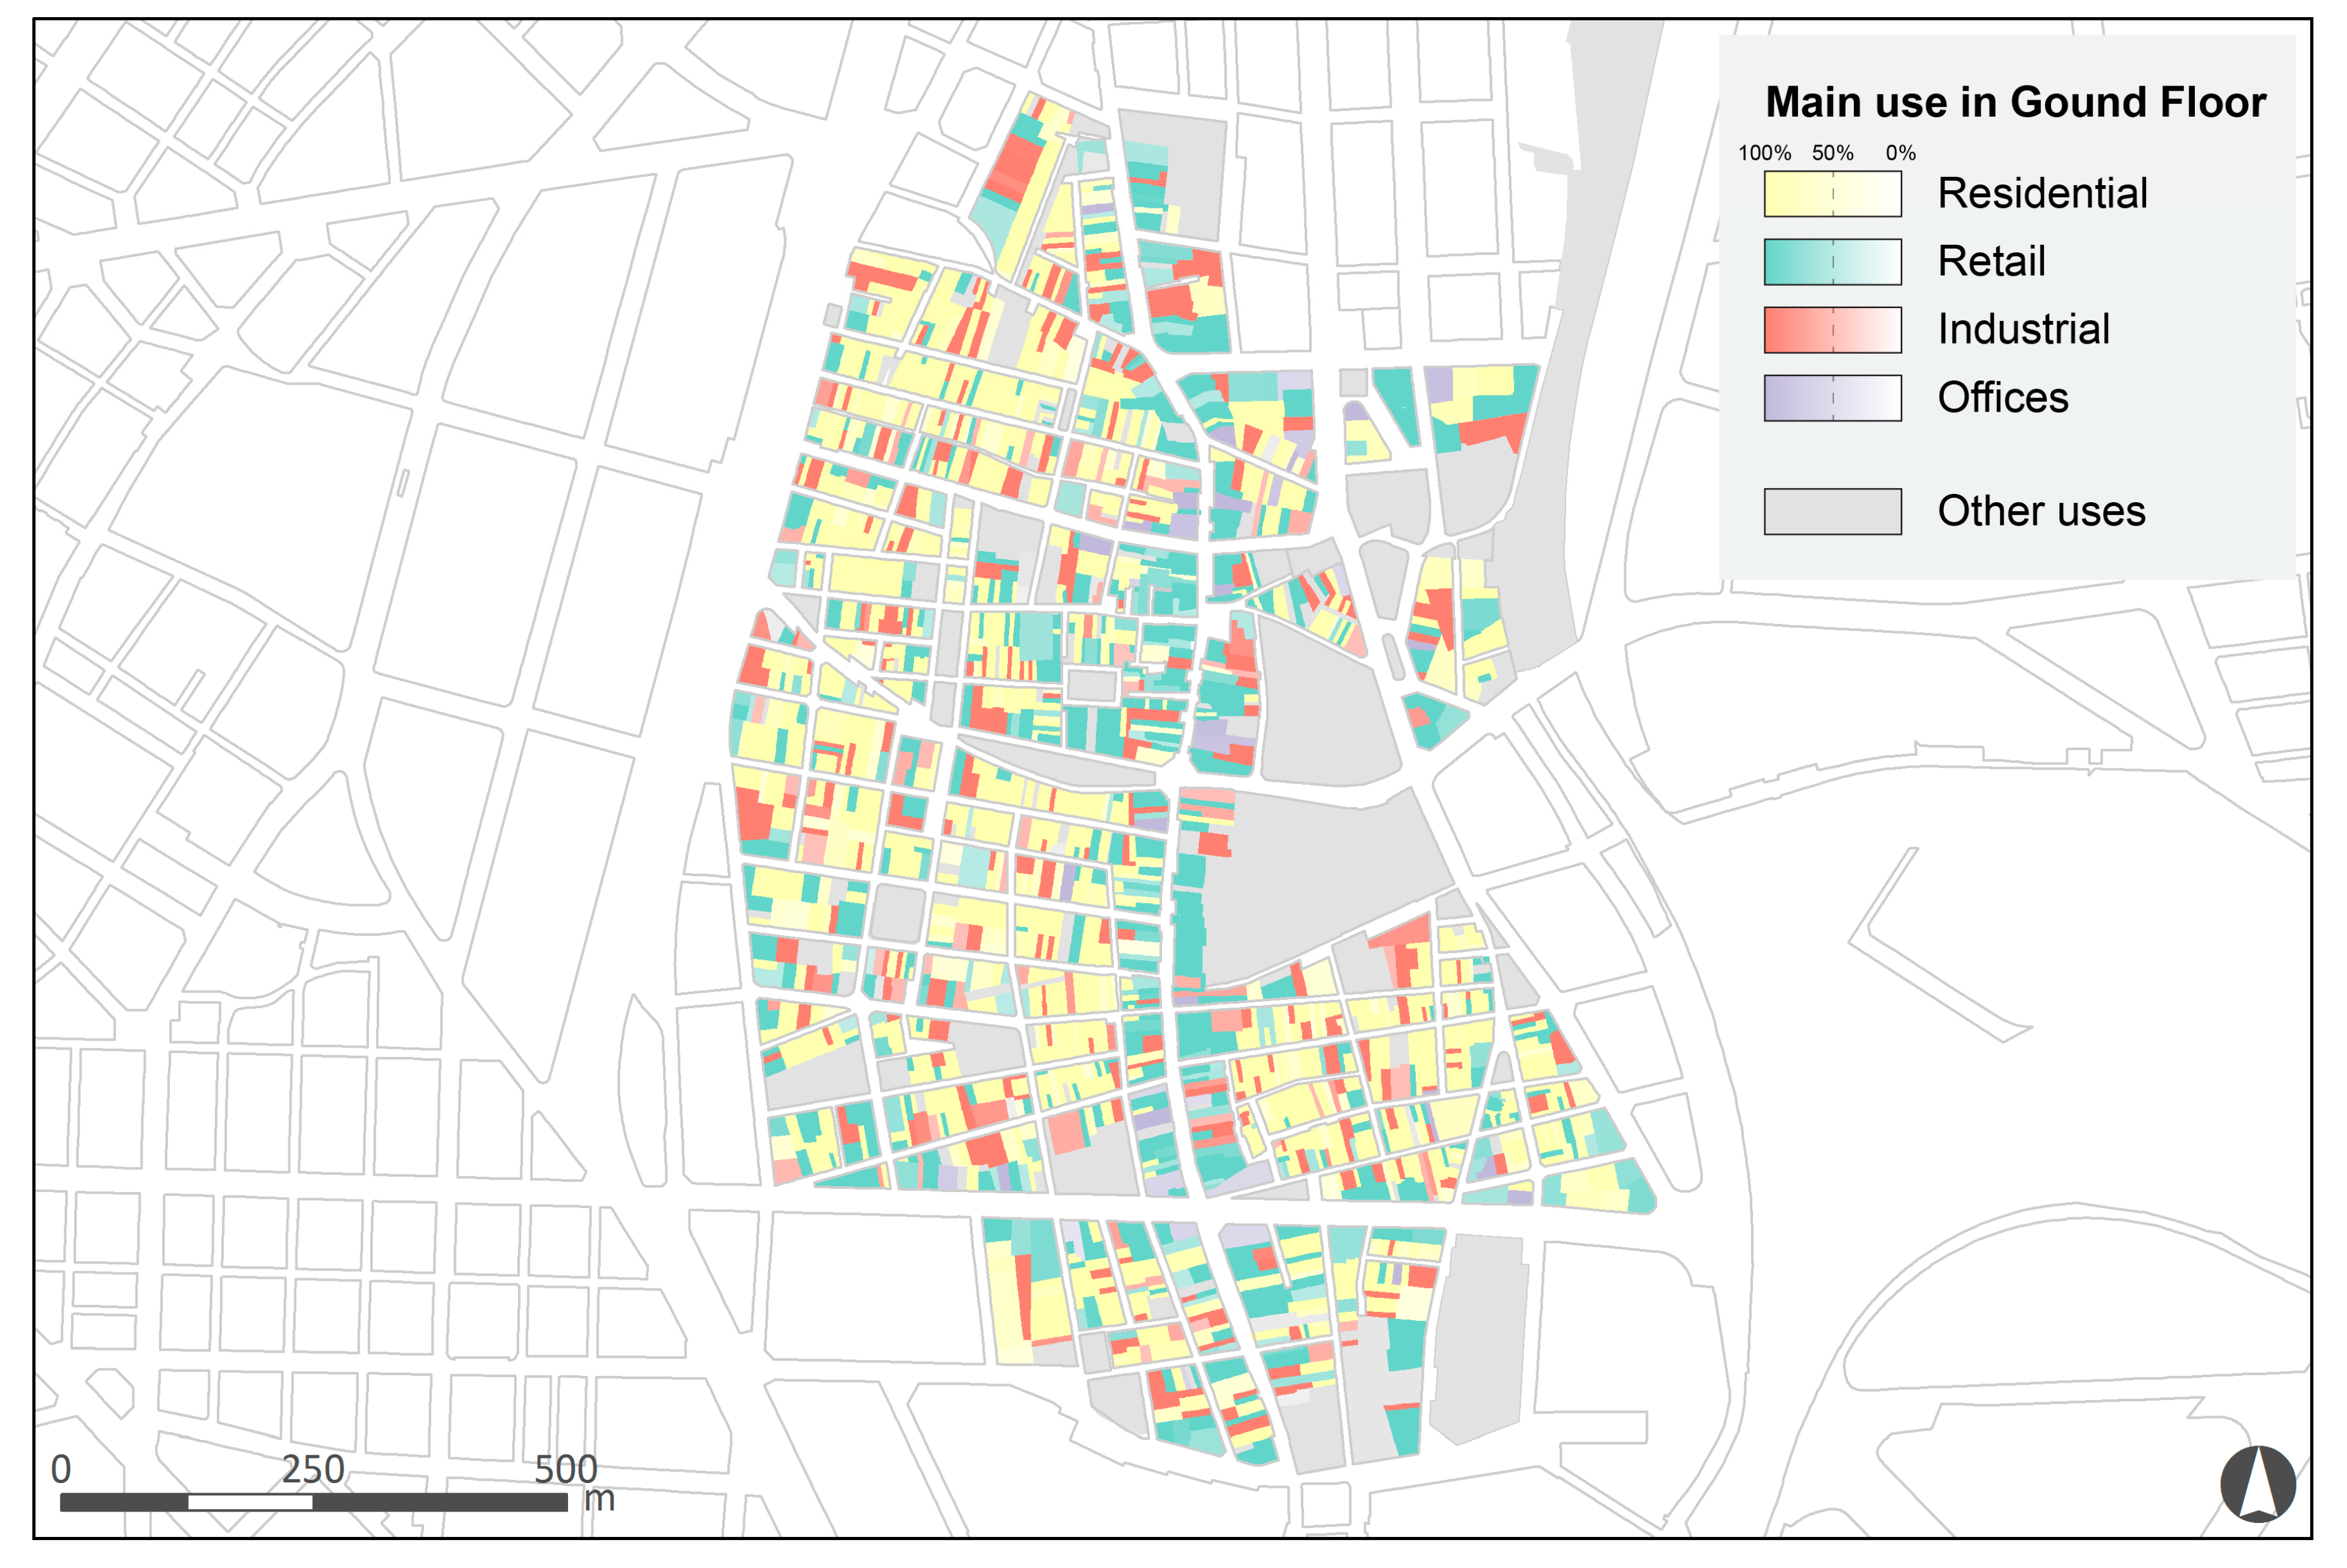
3.4. Dominant Use in Ground Floor from Pedestrian Point of View

4. Results
4.1. Representation of Aggregate Data

4.2. Representation of Fragments in 2D
| Dissolve | Moran’s I | Expected | z-score | p-value |
|---|---|---|---|---|
| None (a) | 0.515340 | −0.000060 | 95.380891 | <10−6 |
| Inside Parcel (b) | 0.136500 | −0.000183 | 14.635925 | <10−6 |
| All (c) | 0.108415 | −0.000142 | 12.782081 | <10−6 |

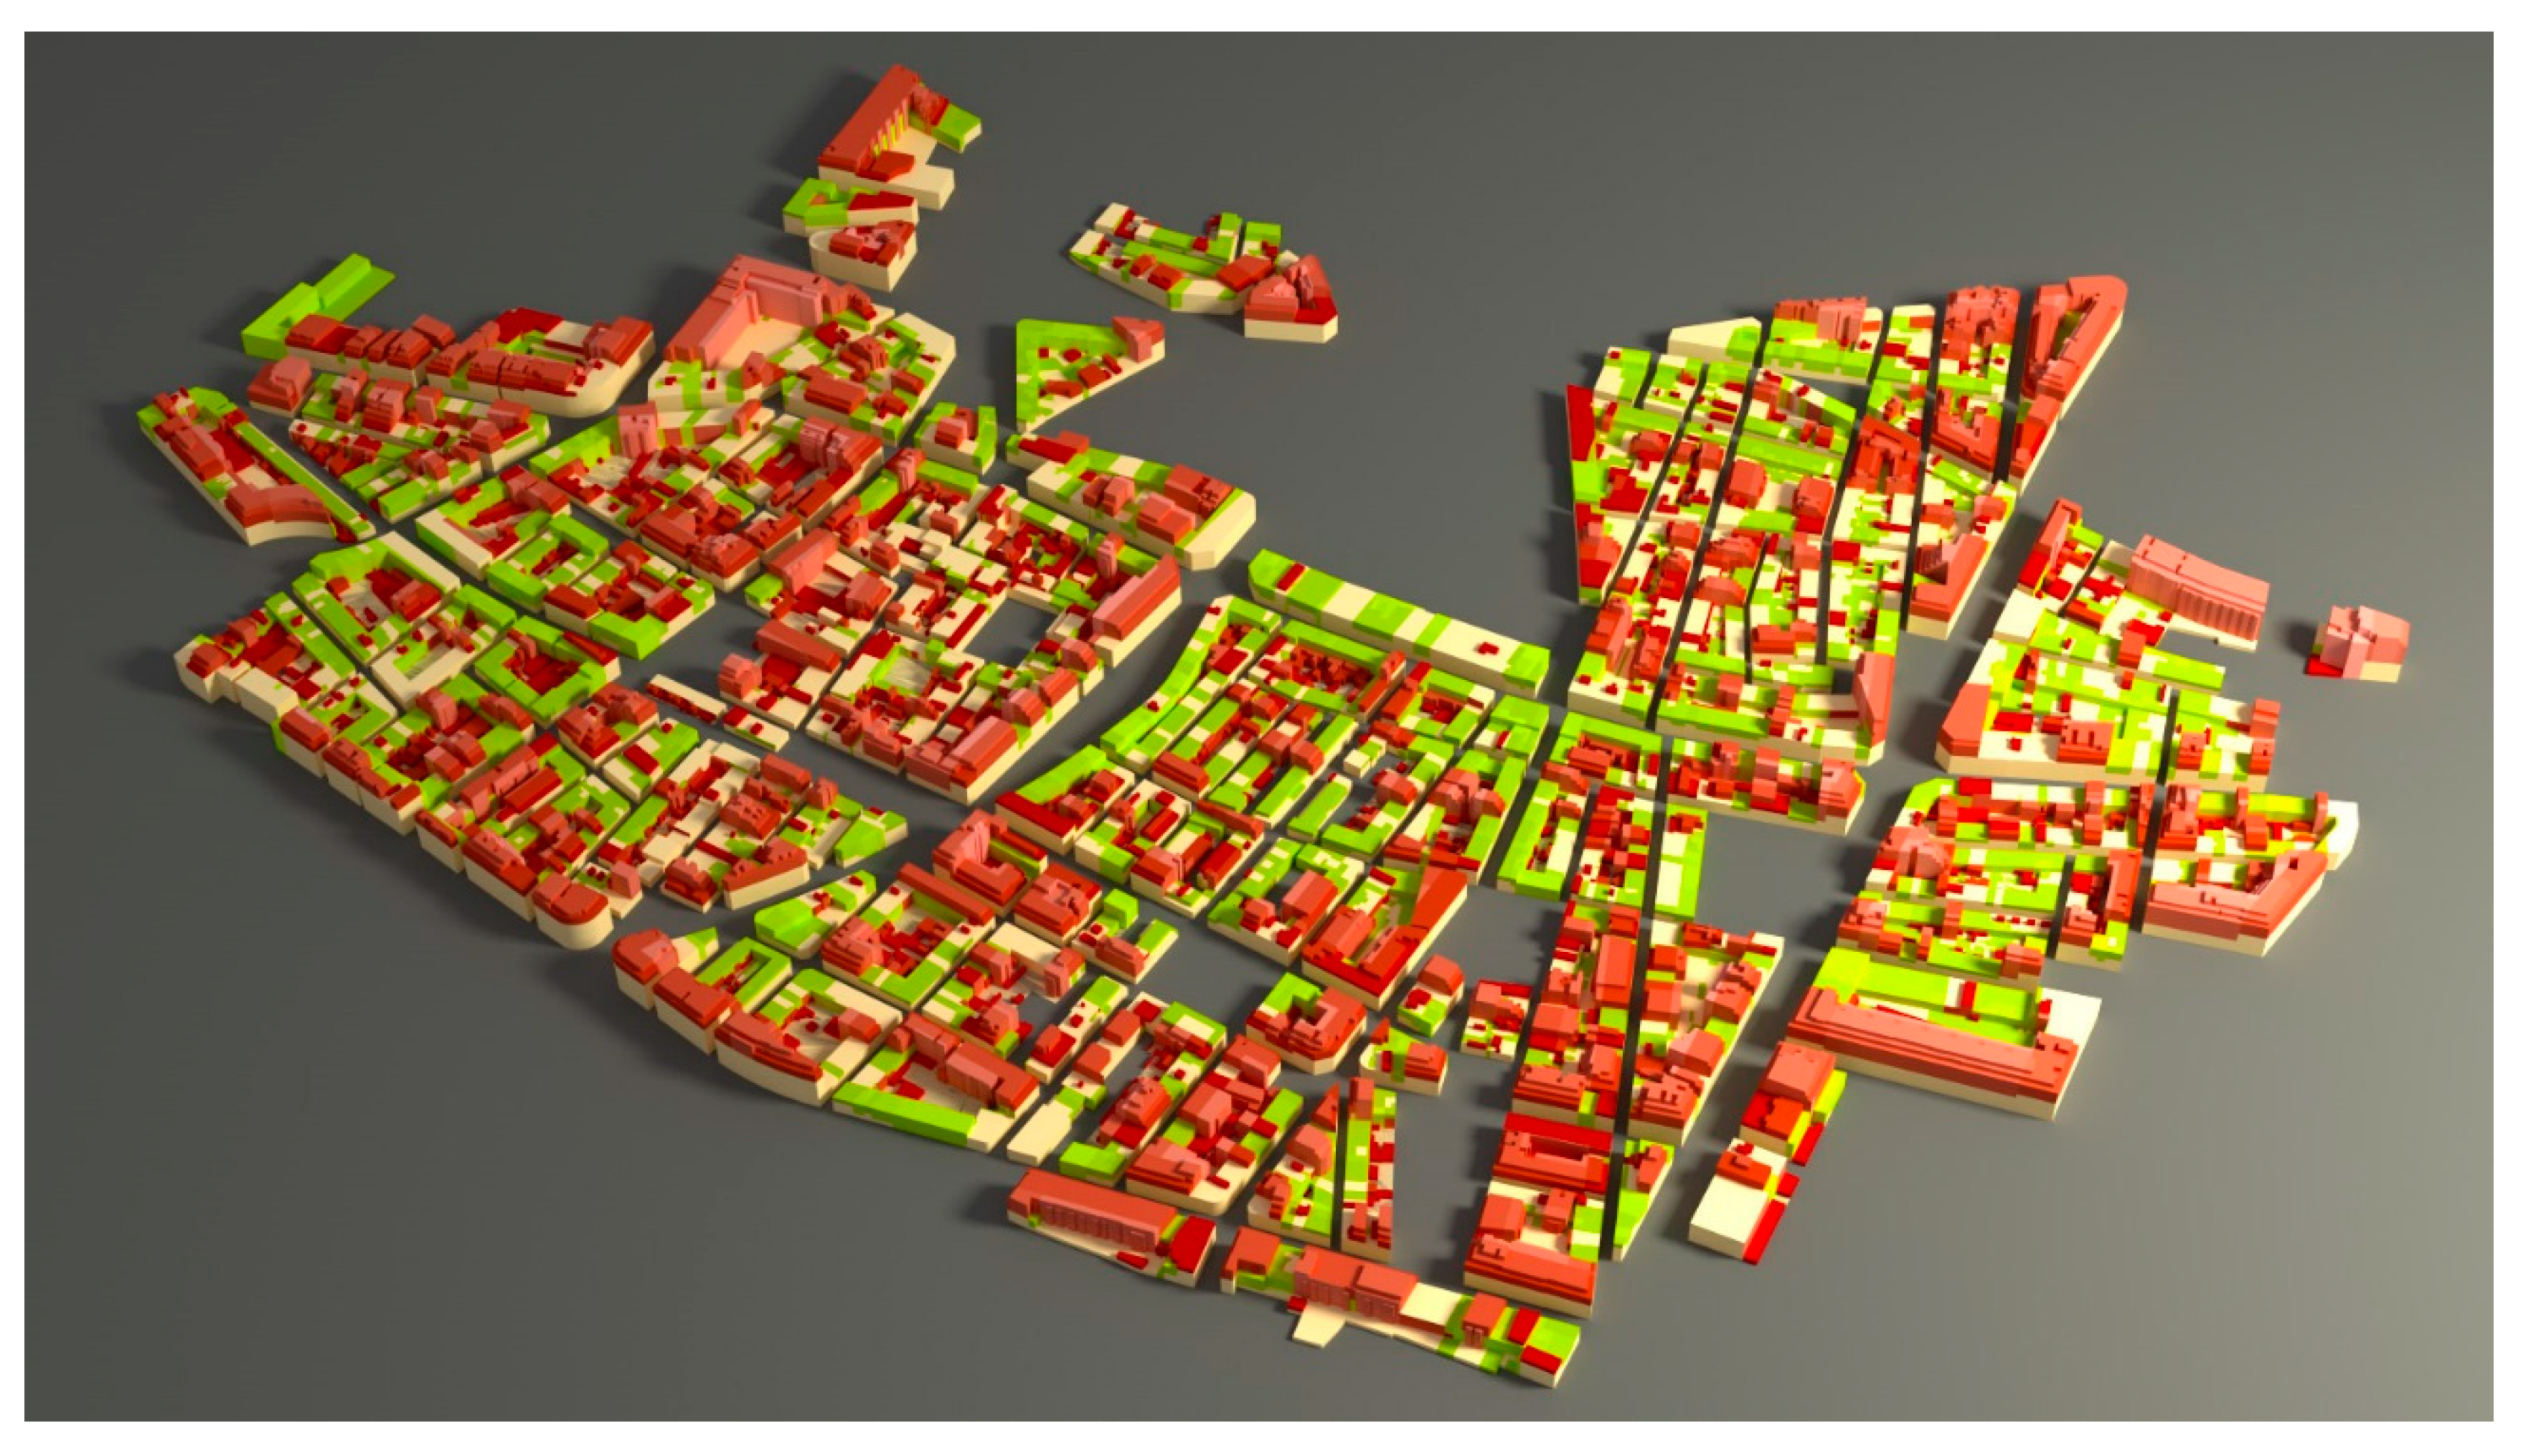
4.3. Representation of Fragments in 3D
4.4. Map of the Projection of the Apparent Surface

4.5. Façade Height Projection onto the Horizontal Plane

4.6. Occlusion by Higher Neighboring Volumes

4.7. Activities on Ground Floor

4.8. Historic Perspective
4.8.1. Building Age and Planning Regulations
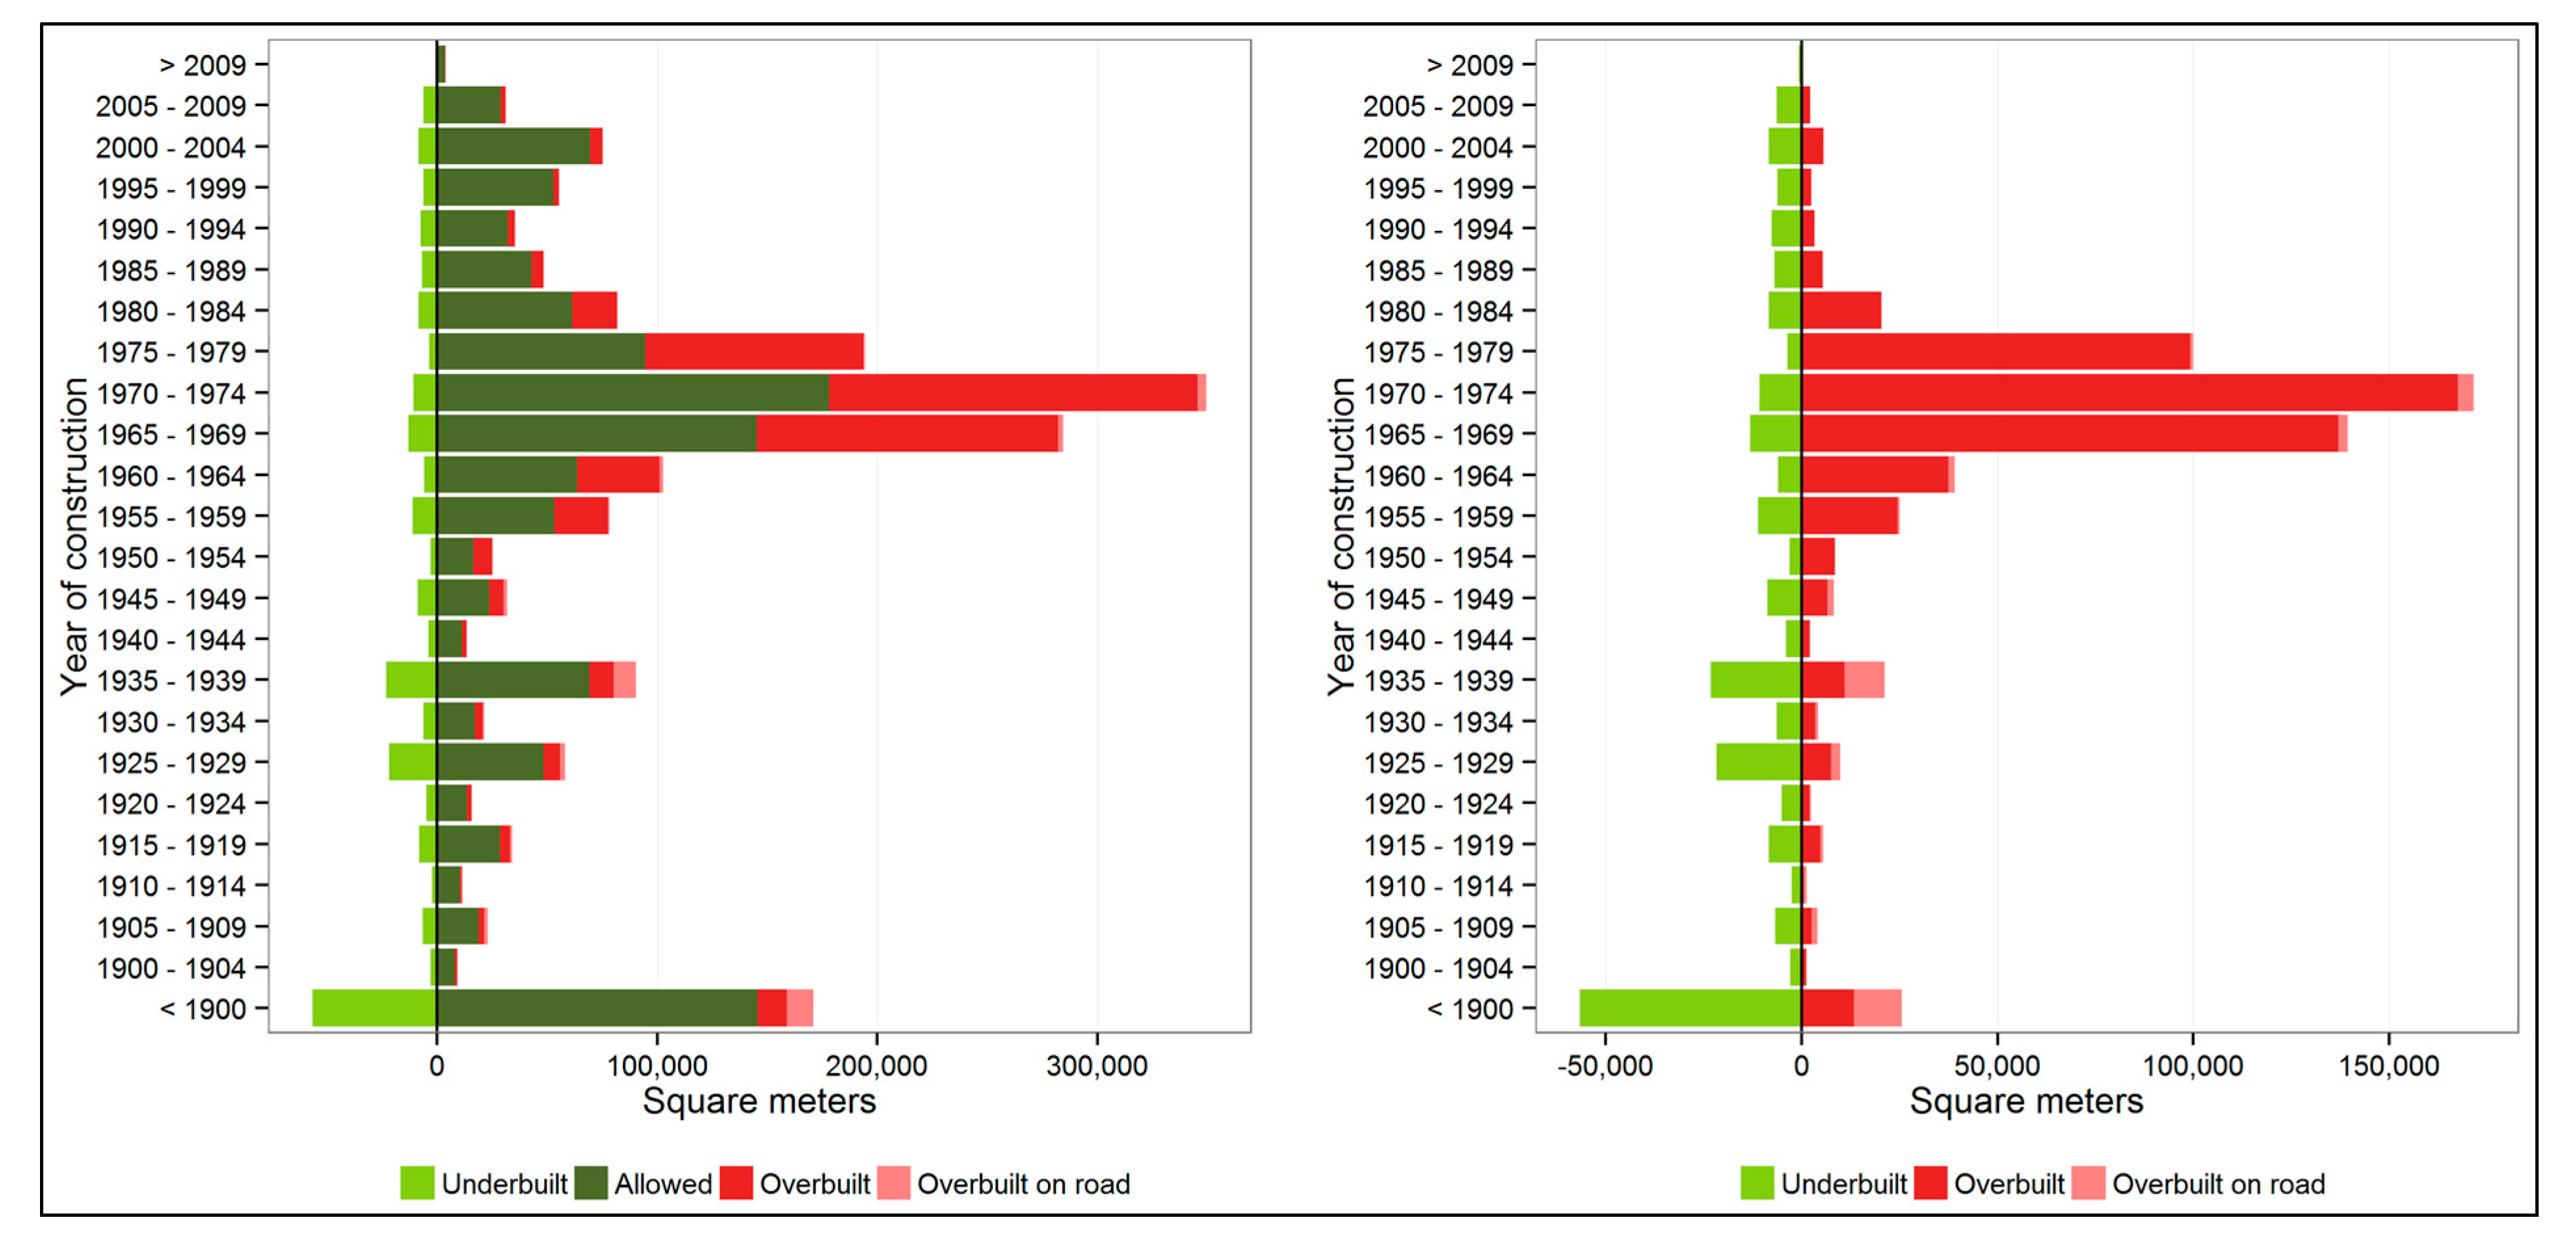
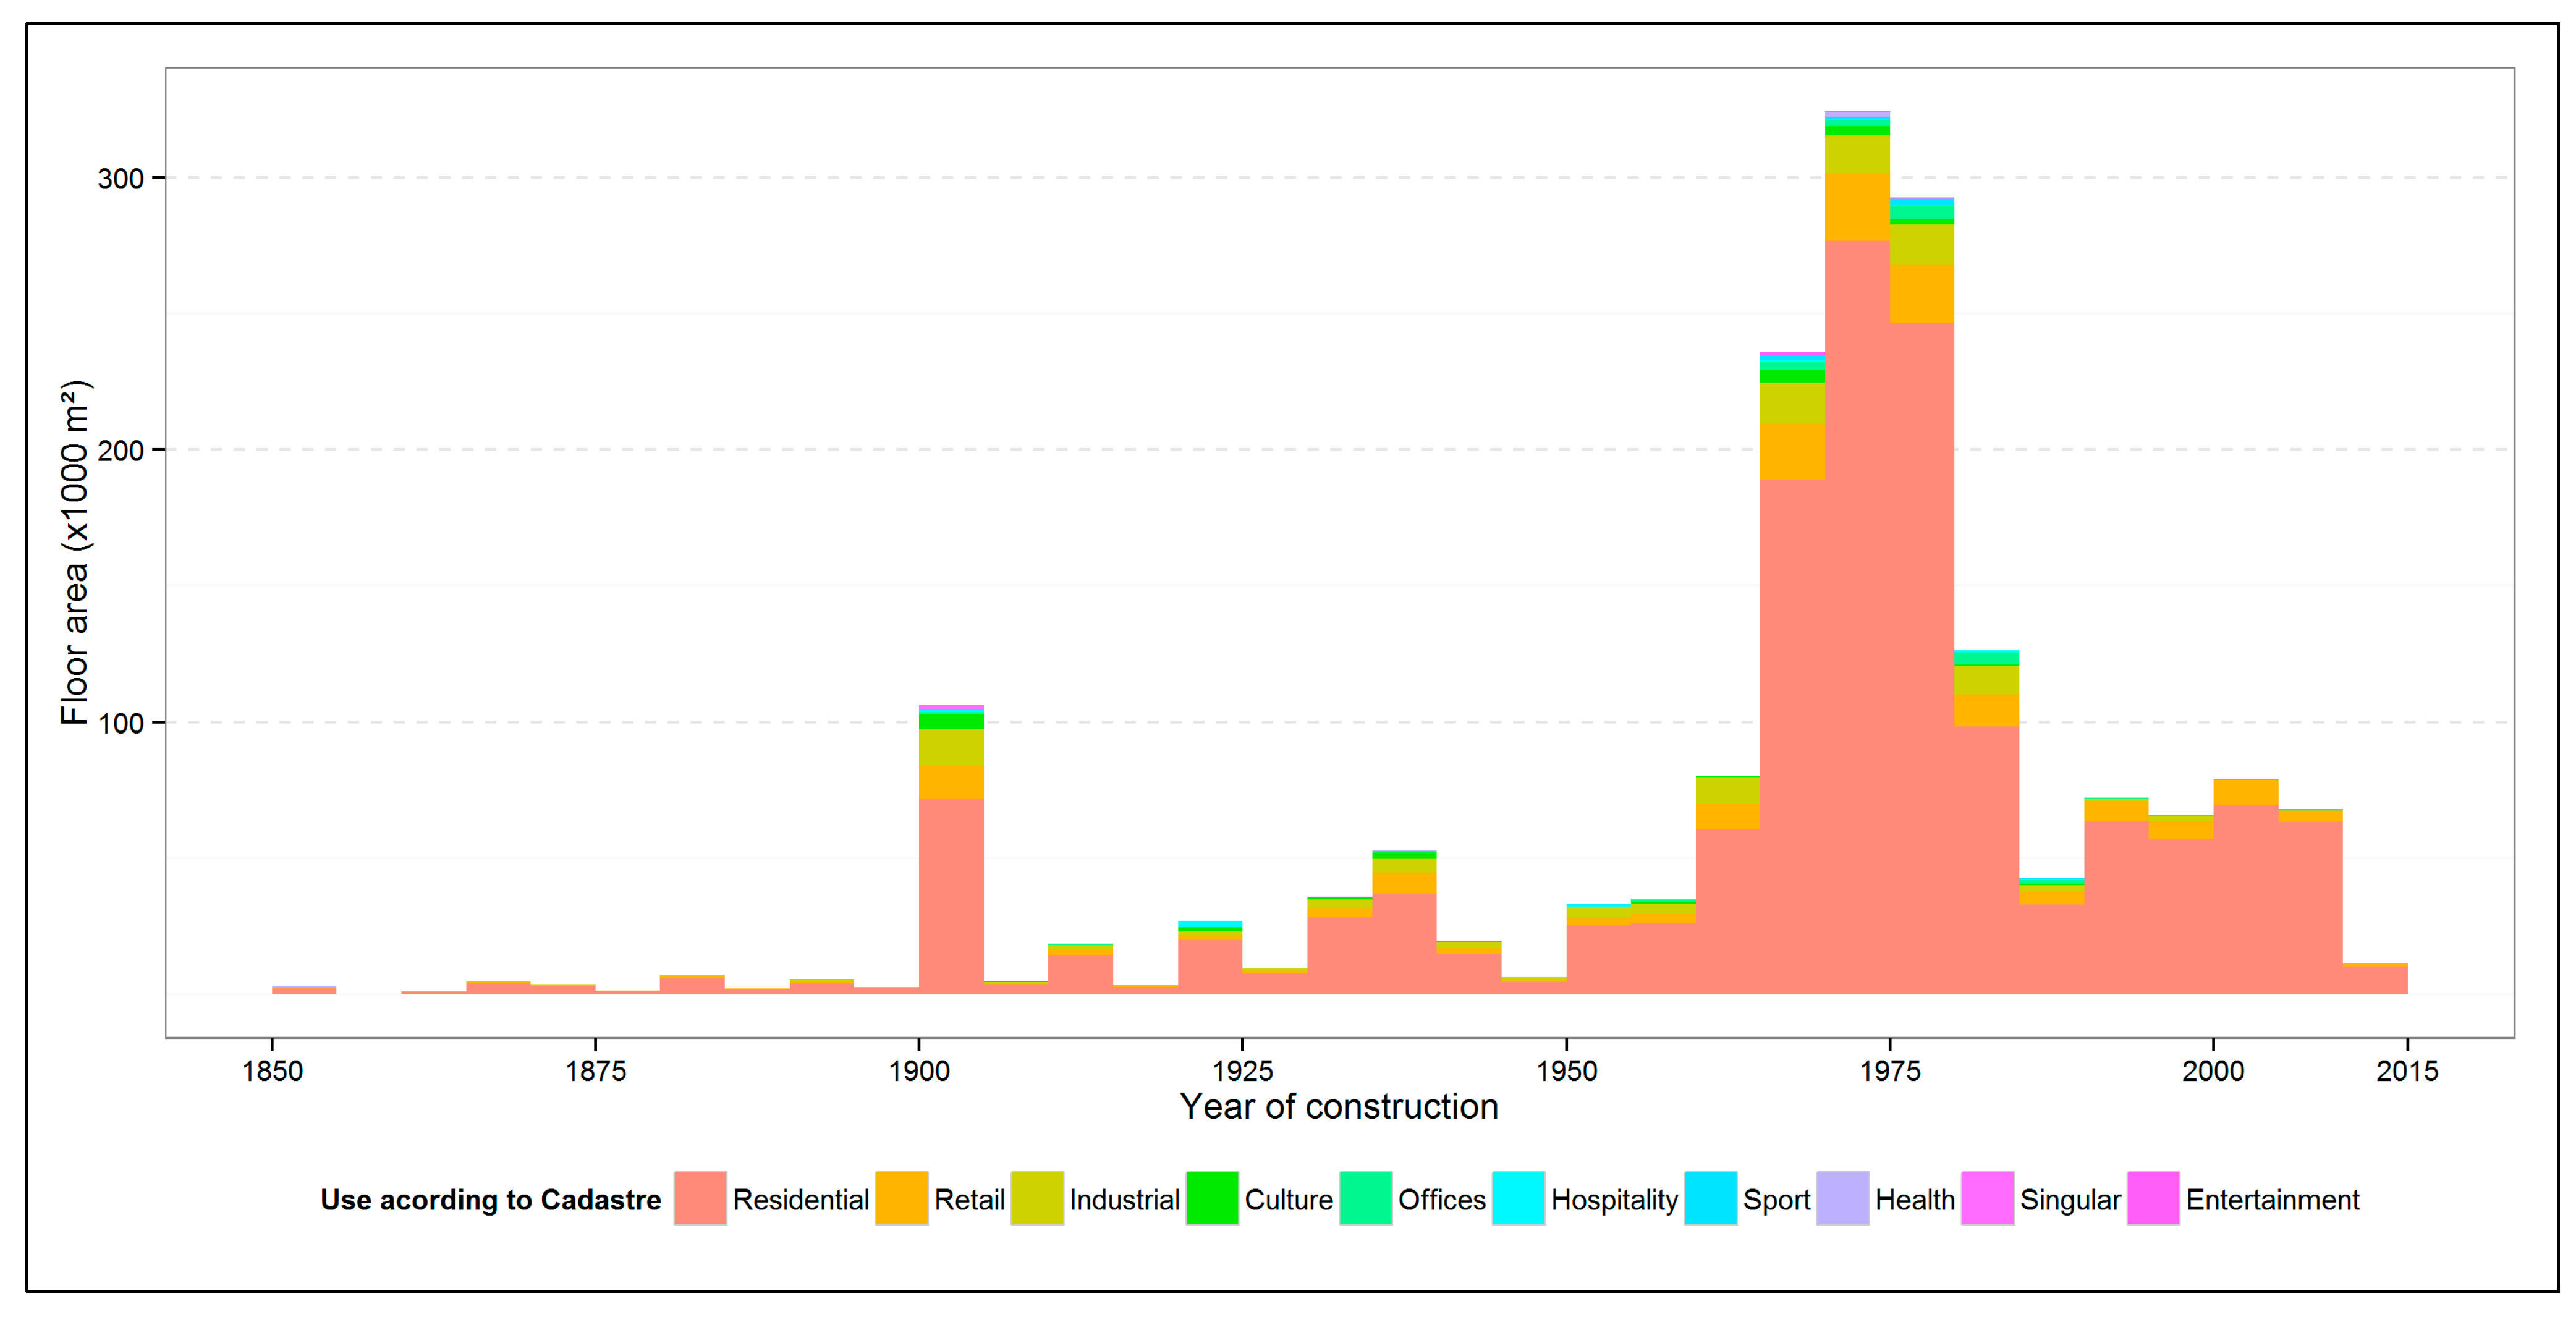
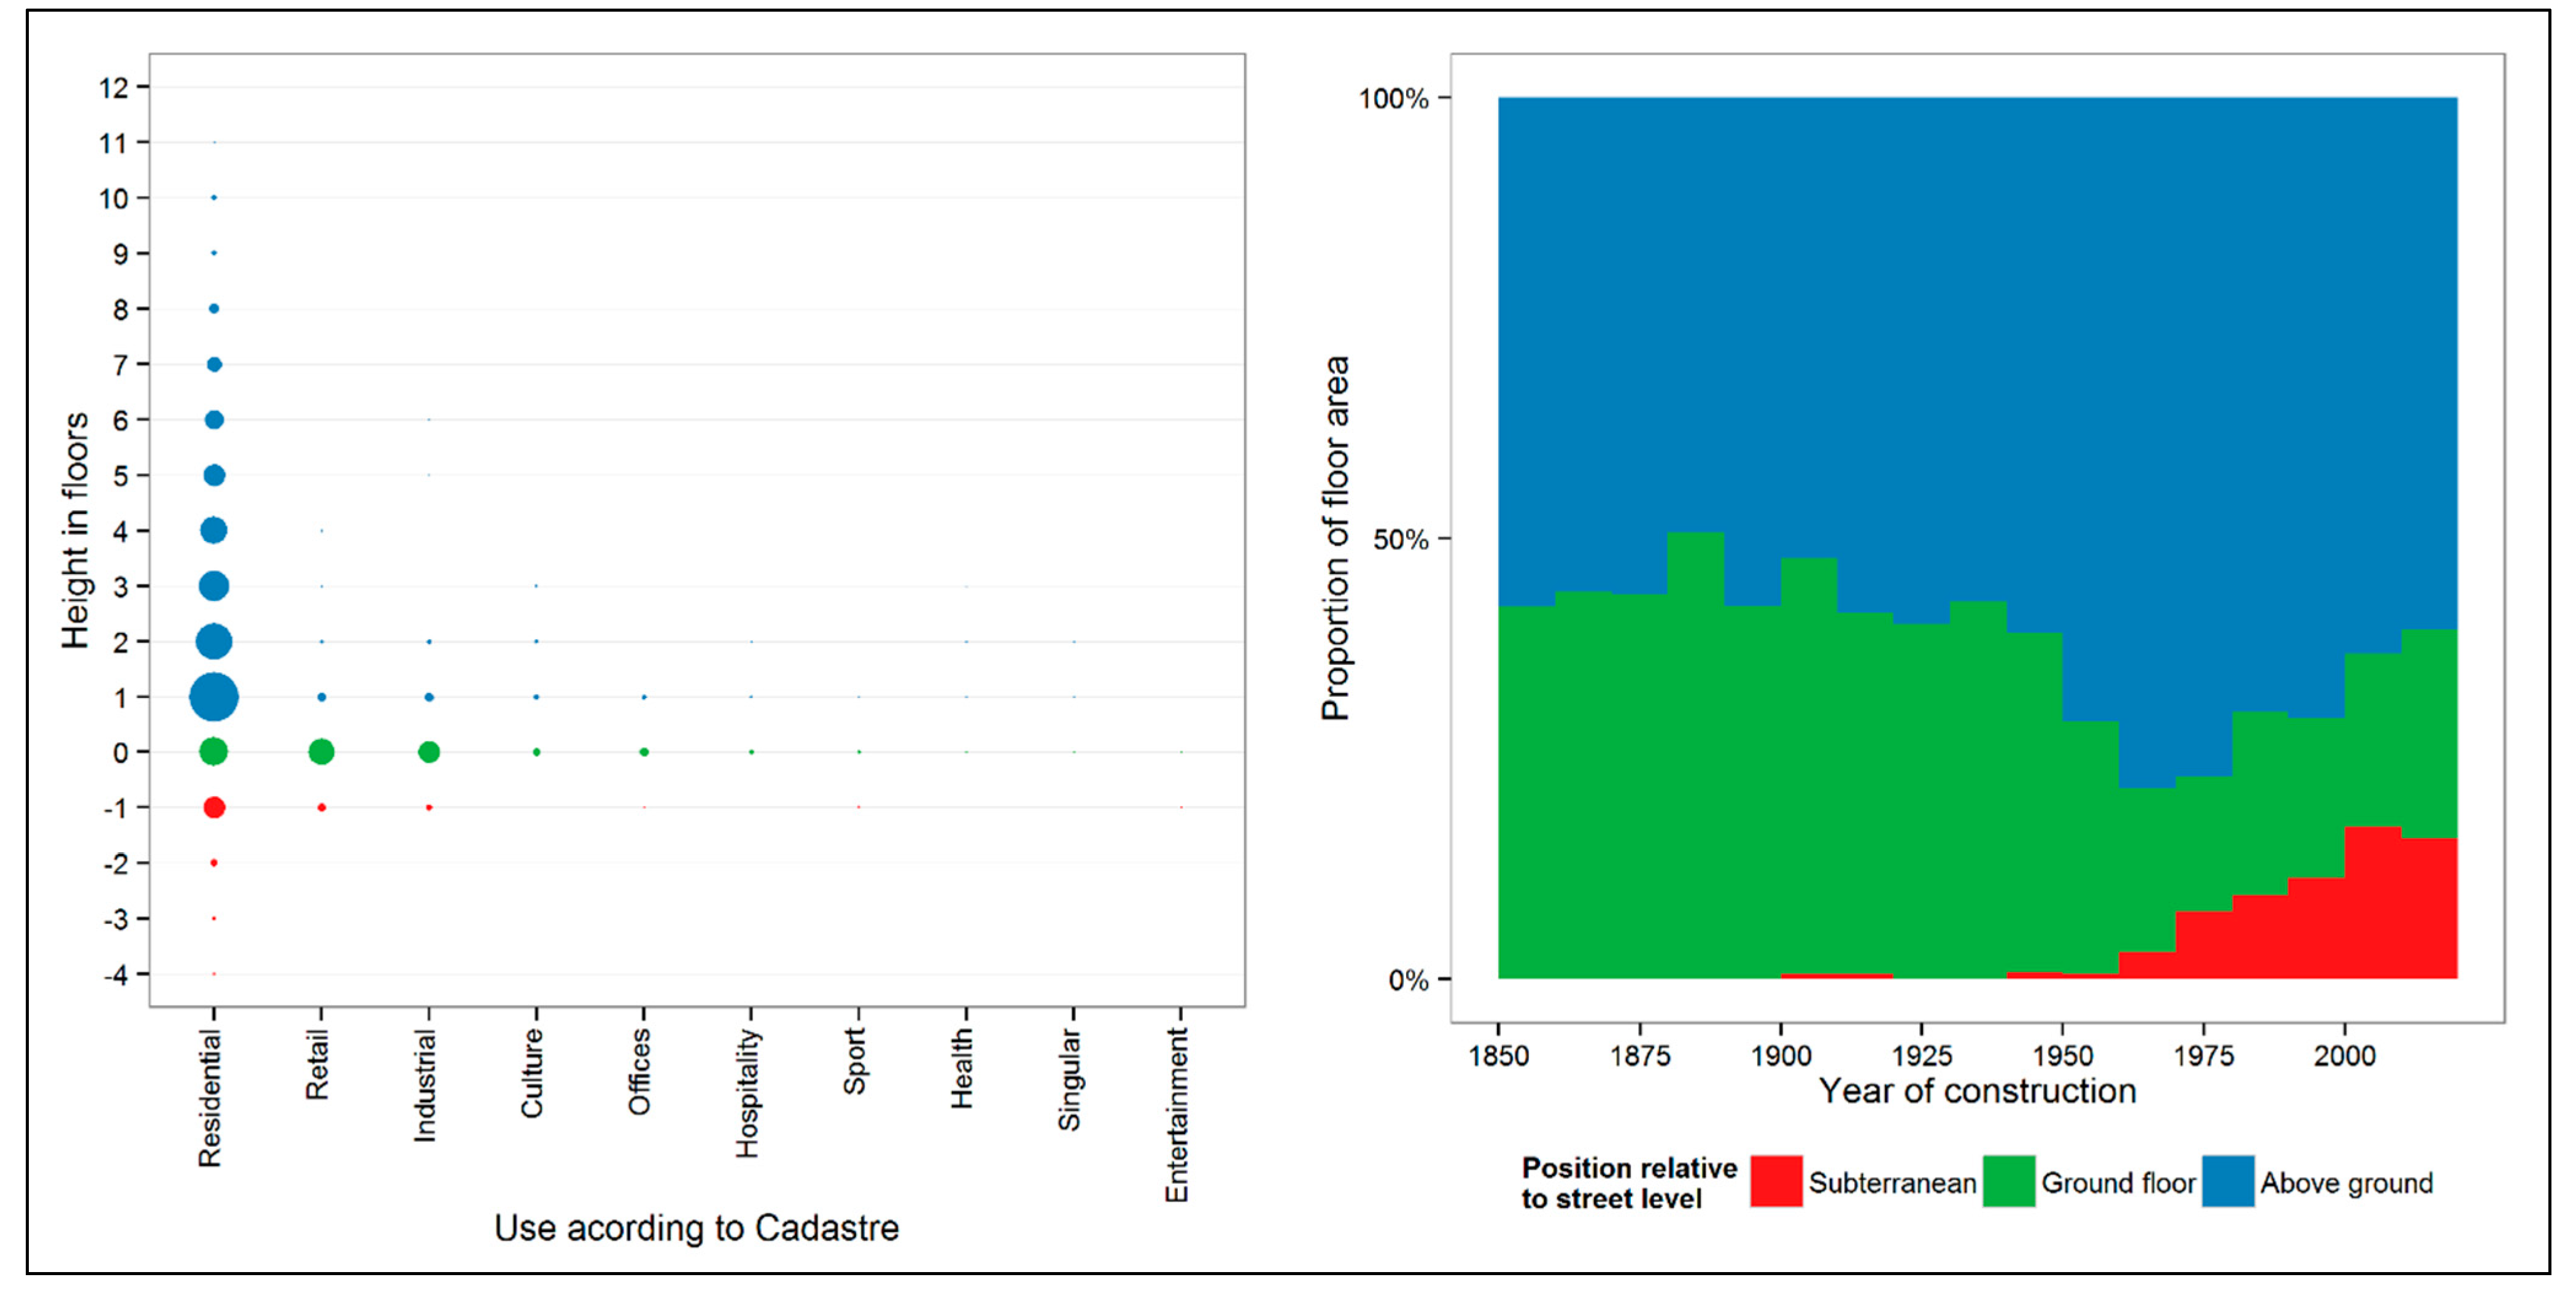
4.8.2. Built Area per Year of Construction and Use

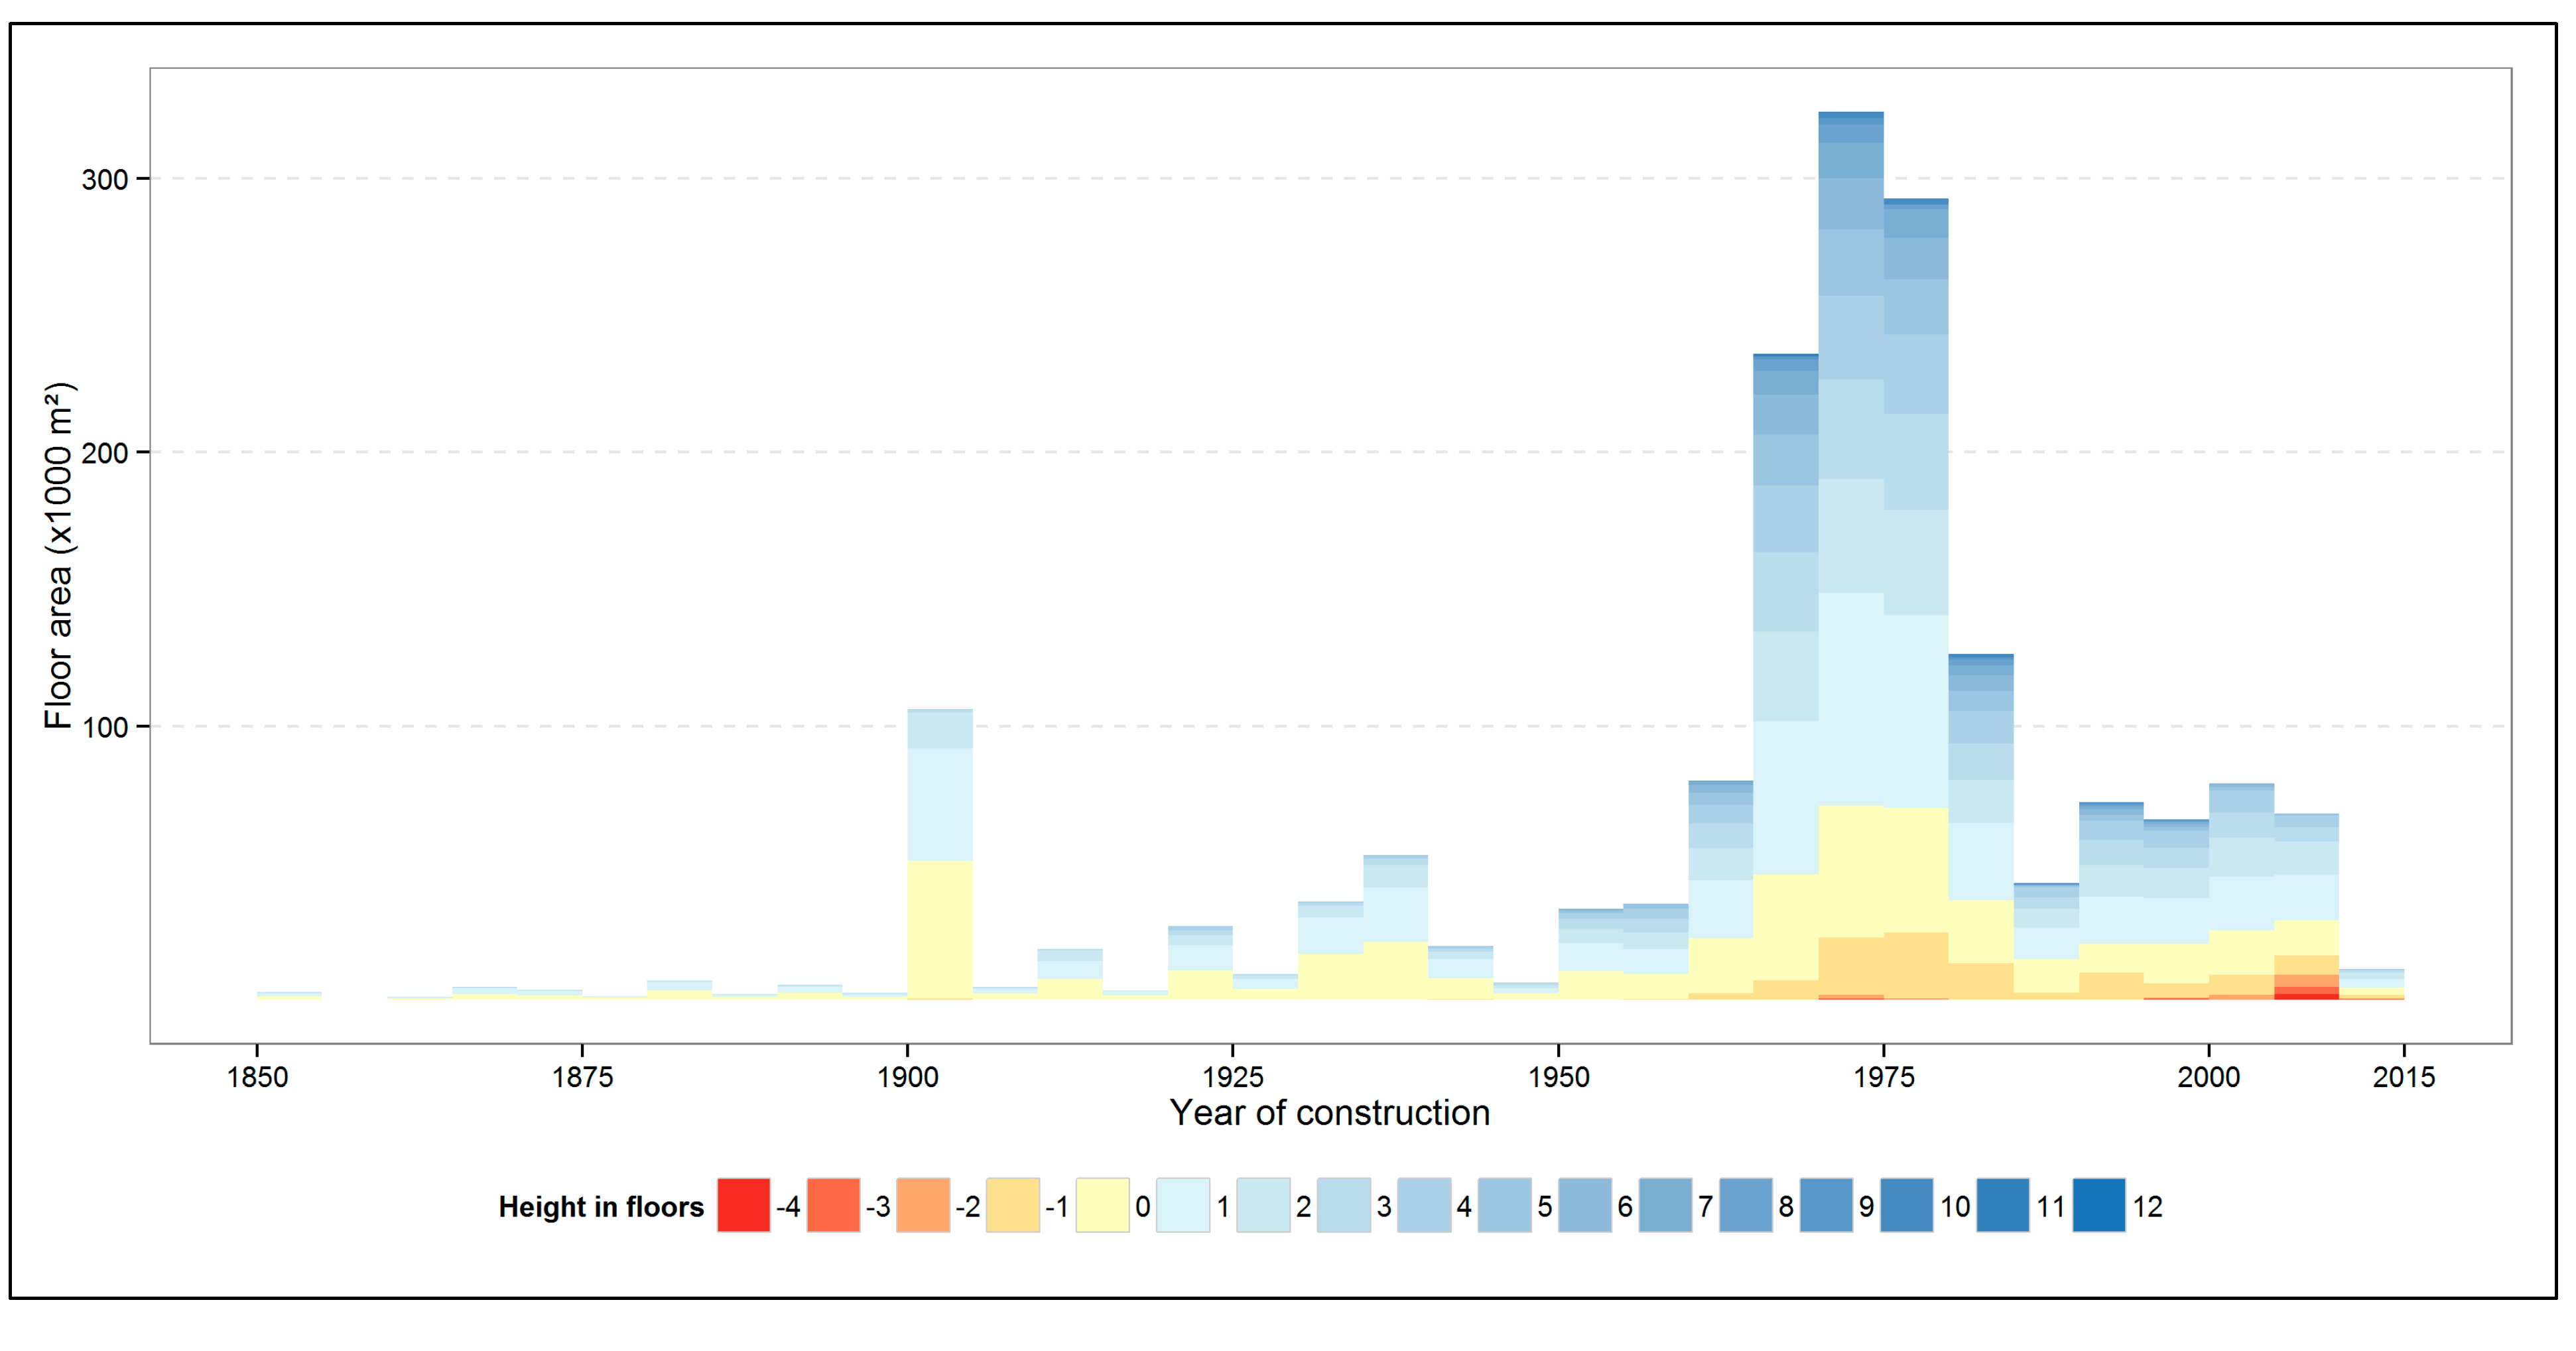
4.8.3. Built Area per Year of Construction and Floor

5. Conclusions
- The 3D visualization techniques allowed the discovery of patterns not obvious even for trained professionals, using the third dimension to convey information not possible in 2D, with the third dimension helping understand conceptual data.
- The 2D representation of height and use information onto the horizontal plan resulted in a very compact and synthetic visualization of the relation between the streets skyline, the planning regulations and the built environment from a pedestrian point of view.
- For data without associated cartography, multiple visualization techniques were used to extract meaningful data, in the form of charts or through aggregation operations into higher order geometric entities.
- To represent temporal information, a visualization similar to population pyramids was used for the age of buildings.
Future Work
Acknowledgments
Author Contributions
Conflicts of Interest
References
- Lynch, K. The Image of the City; The MIT Press: Cambridge, MA, USA, 1960. [Google Scholar]
- Borja, J. Luces y Sombras del Urbanismo de Barcelona,, 2nd ed.; Editorial UOC: Barcelona, Spain, 2010. (In Spanish) [Google Scholar]
- Nel·lo, O. Dinàmiques urbanes, activitats emergents i polítiques públiques a la Regió Metropolitana de Barcelona. Pap. Regió Metrop. Barc. Territ. Estratègies Planejament 2002, 2002, 105–114. (In Catalan) [Google Scholar]
- Klaasen, I.T. Knowledge-based Design: Developing Urban & Regional Design into a Science; Delft University of Technology: Delft, The Netherlands, 2003. [Google Scholar]
- Keim, D.A. Information visualization and visual data mining. IEEE Trans. Vis. Comput. Graph. 2002, 8, 1–8. [Google Scholar] [CrossRef]
- Zlatanova, S.; Itard, L.; Kibria, M.S.; Van Dorst, M. A user requirements study of digital 3D models for urban renewal. Open House Int. 2010, 35, 37–46. [Google Scholar]
- Nelson, A.C.; Burby, R.J.; Feser, E.; Dawkins, C.J.; Malizia, E.E.; Quercia, R. Urban Containment and Central-City Revitalization. J. Am. Plann. Assoc. 2004, 70, 411–425. [Google Scholar] [CrossRef]
- Garcia-Almirall, P.; Valls Dalmau, F.; Moix Bergada, M. Planned vs. Real City: 3D GIS for Analyzing the Transformation of Urban Morphology. In Proceedings of the 17th AGILE Conference on Geographic Information Science, Castellón de la Plana, Spain, 3–6 June 2014.
- Behnisch, M.; Ultsch, A. Urban data-mining: Spatiotemporal exploration of multidimensional data. Build. Res. Inf. 2009, 37, 520–532. [Google Scholar] [CrossRef]
- Spielman, S.E.; Thill, J.-C. Social area analysis, data mining, and GIS. Comput. Environ. Urban Syst. 2008, 32, 110–122. [Google Scholar] [CrossRef]
- Wainer, H. How to display data badly. Am. Stat. 1984, 38, 137–147. [Google Scholar]
- Bertin, J.; Barbut, M. Sémiologie Graphique. Les diagrammes, Les réseaux, Les cartes; Mouton: Paris, France, 1967. (In French) [Google Scholar]
- Bertin, J. La Graphique et le Traitement Graphique de L’information; Flammarion: Paris, France, 1977. (In French) [Google Scholar]
- Cleveland, W.S. Graphs in Scientific Publications. Am. Stat. 1984, 38, 261–269. [Google Scholar]
- Cleveland, W.S. Graphical Methods for Data Presentation: Full Scale Breaks, Dot Charts, and Multibased Logging. Am. Stat. 1984, 38, 270–280. [Google Scholar]
- Cleveland, W.S.; McGill, R. Graphical Perception: Theory, Experimentation, and Application to the Development of Graphical Methods. J. Am. Stat. Assoc. 1984, 79, 531–554. [Google Scholar] [CrossRef]
- Cleveland, W.S.; McGill, R. Graphical Perception and Graphical Methods for Analyzing Scientific Data. Science 1985, 229, 828–833. [Google Scholar] [CrossRef] [PubMed]
- Cleveland, W.S.; McGill, R. Graphical Perception: The visual decoding of quantitative information on graphical displays of data. J. R. Stat. Soc. Ser. Gen. 1987, 150, 192–229. [Google Scholar] [CrossRef]
- Tufte, E.R. Envisioning Information; Graphics Press: Cheshire, CT, USA, 1990. [Google Scholar]
- Tufte, E.R. Visual Explanations: Images and Quantities, Evidence and Narrative; Graphics Press: Cheshire, CT, USA, 1997. [Google Scholar]
- Tufte, E.R. The Visual Display of Quantitative Information, 2nd ed.; Graphics Press: Cheshire, CT, USA, 2001. [Google Scholar]
- Friendly, M.; SAS Institute. Visualizing Categorical Data; SAS Institute: Cary, NC, USA, 2001. [Google Scholar]
- Wilkinson, L.; Wills, G. The Grammar of Graphics; Springer: New York, NY, USA, 2005. [Google Scholar]
- Wickham, H. Ggplot2: Elegant Graphics for Data Analysis; Springer: Dordrecht, The Netherlands, 2009. [Google Scholar]
- Wickham, H. A layered grammar of graphics. J. Comput. Graph. Stat. 2010, 19, 3–28. [Google Scholar] [CrossRef]
- Harrower, M.; Brewer, C.A. ColorBrewer.org: An Online Tool for Selecting Colour Schemes for Maps. Cartogr. J. 2003, 40, 27–37. [Google Scholar] [CrossRef]
- Peuquet, D.J. Representations of geographic space: Toward a conceptual synthesis. Ann. Assoc. Am. Geogr. 1988, 78, 375–394. [Google Scholar] [CrossRef]
- Mennis, J.L.; Peuquet, D.J.; Qian, L. A conceptual framework for incorporating cognitive principles into geographical database representation. Int. J. Geogr. Inf. Sci. 2000, 14, 501–520. [Google Scholar] [CrossRef]
- Goodchild, M.F.; Yuan, M.; Cova, T.J. Towards a general theory of geographic representation in GIS. Int. J. Geogr. Inf. Sci. 2007, 21, 239–260. [Google Scholar] [CrossRef]
- Goodchild, M.F. Geographical data modeling. Comput. Geosci. 1992, 18, 401–408. [Google Scholar] [CrossRef]
- Gregory, I.N. “A map is just a bad graph”: Why spatial statistics are important in historical GIS. In Placing History: How Maps, Spatial Data and GIS are Changing Historical Scholarship; Knowles, A.K., Ed.; ESRI Press: Redlands, CA, USA, 2008; pp. 123–149. [Google Scholar]
- Harmon, K. You are Here: Personal Geographies and Other Maps of the Imagination, 1st ed.; Princeton Architectural Press: New York, NY, USA, 2003. [Google Scholar]
- Tufte, E.R. Beautiful Evidence, 1st ed.; Graphics Press: Cheshire, CT, USA, 2006. [Google Scholar]
- Harmon, K.; Clemans, G. The Map as Art: Contemporary Artists Explore Cartography; Princeton Architectural Press: New York, NY, USA, 2010. [Google Scholar]
- Parish, Y.I.H.; Müller, P. Procedural Modeling of Cities. In Proceedings of the 28th Annual Conference on Computer Graphics and Interactive Techniques; SIGGRAPH ’01. ACM: New York, NY, USA, 2001; pp. 301–308. [Google Scholar]
- Wonka, P.; Wimmer, M.; Sillion, F.; Ribarsky, W. Instant Architecture. In ACM SIGGRAPH 2003 Papers; SIGGRAPH ’03; ACM: New York, NY, USA, 2003; pp. 669–677. [Google Scholar]
- Müller, P.; Wonka, P.; Haegler, S.; Ulmer, A.; Van Gool, L. Procedural Modeling of Buildings. In ACM SIGGRAPH 2006 Papers; SIGGRAPH ’06; ACM: New York, NY, USA, 2006; pp. 614–623. [Google Scholar]
- Müller, P.; Zeng, G.; Wonka, P.; Van Gool, L. Image-based Procedural Modeling of Facades. In ACM SIGGRAPH 2007 Papers; SIGGRAPH ’07; ACM: New York, NY, USA, 2007. [Google Scholar]
- Gruen, A.; Behnisch, M.; Kohler, N. Perspectives in the reality-based generation, nD modelling, and operation of buildings and building stocks. Build. Res. Inf. 2009, 37, 503–519. [Google Scholar] [CrossRef]
- Döllner, J.; Walther, M. Real-time expressive rendering of city models. In Proceedings of the Seventh International Conference on Information Visualization, 2003, IV 2003. London, UK, 16–18 July 2003; pp. 245–250.
- Döllner, J.; Baumann, K.; Buchholz, H. Virtual 3D City Models as Foundation of Complex Urban Information Spaces. In 11th International Conference on Urban Planning and Spatial Development in the Information Society (REAL CORP); Schrenk, M., Ed.; CORP—Competence Center of Urban and Regional Planning: Vienna, Austria, 2006; pp. 107–112. [Google Scholar]
- Glander, T.; Döllner, J. Abstract representations for interactive visualization of virtual 3D city models. Comput. Environ. Urban Syst. 2009, 33, 375–387. [Google Scholar] [CrossRef]
- Semmo, A.; Trapp, M.; Kyprianidis, J.E.; Döllner, J. Interactive Visualization of Generalized Virtual 3D City Models Using Level-of-Abstraction Transitions. Comput. Graph. Forum 2012, 31, 885–894. [Google Scholar] [CrossRef]
- Peuquet, D.J. It’s About Time: A Conceptual Framework for the Representation of Temporal Dynamics in Geographic Information Systems. Ann. Assoc. Am. Geogr. 1994, 84, 441–461. [Google Scholar] [CrossRef]
- Peuquet, D.J. Making Space for Time: Issues in Space-Time Data Representation. GeoInformatica 2001, 5, 11–32. [Google Scholar] [CrossRef]
- Döner, F.; Thompson, R.; Stoter, J.; Lemmen, C.; Ploeger, H.; van Oosterom, P.; Zlatanova, S. 4D cadastres: First analysis of legal, organizational, and technical impact—With a case study on utility networks. Land Use Policy 2010, 27, 1068–1081. [Google Scholar] [CrossRef]
- Pushkarev, B.S. Urban Space for Pedestrians: A Quantitative Approach, 1st ed.; The MIT Press: Cambridge, MA, USA, 1976. [Google Scholar]
- Hillier, B.; Penn, A.; Hanson, J.; Grajewski, T.; Xu, J. Natural movement: Or, configuration and attraction in urban pedestrian movement. Environ. Plan. B Plan. Des. 1993, 20, 29–66. [Google Scholar] [CrossRef]
- Salesses, P.; Schechtner, K.; Hidalgo, C.A. The Collaborative Image of The City: Mapping the Inequality of Urban Perception. PLoS One 2013, 8, e68400. [Google Scholar] [CrossRef] [PubMed] [Green Version]
- Carr, D.B.; White, D.; MacEachren, A.M. Conditioned Choropleth Maps and Hypothesis Generation. Ann. Assoc. Am. Geogr. 2005, 95, 32–53. [Google Scholar] [CrossRef]
- Wood, J.; Dykes, J.; Slingsby, A. Visualisation of Origins, Destinations and Flows with OD Maps. Cartogr. J. 2010, 47, 117–129. [Google Scholar] [CrossRef]
- Gröger, G.; Plümer, L. CityGML—Interoperable semantic 3D city models. ISPRS J. Photogramm. Remote Sens. 2012, 71, 12–33. [Google Scholar] [CrossRef]
- Karki, S.; Thompson, R.; McDougall, K. Data validation in 3D cadastre. In Developments in 3D Geo-Information Sciences; Neutens, T., Maeyer, P., Eds.; Springer: Berlin/Heidelberg, Germany, 2010; pp. 92–122. [Google Scholar]
- Van Oosterom, P. Research and development in 3D cadastres. Comput. Environ. Urban Syst. 2013, 40, 1–6. [Google Scholar] [CrossRef]
- Corporación Metropolitana de Barcelona. In Plan General Metropolitano de Ordenación Urbana; Comisión Provincial de Urbanismo de Barcelona: Barcelona, Spain, 1976. (In Spanish)
- Esteban, J. Elementos de ordenación urbana; Edicions UPC: Barcelona, Spain, 1998. (In Spanish) [Google Scholar]
- Turner, A. Analysing the visual dynamics of spatial morphology. Environ. Plan. B Plan. Des. 2003, 30, 657–676. [Google Scholar] [CrossRef]
- Hillier, B. Space is the Machine: A Configurational Theory of Architecture; Space Syntax: London, UK, 2007. [Google Scholar]
- Li, W.; Goodchild, M.F.; Raskin, R. Towards geospatial semantic search: Exploiting latent semantic relations in geospatial data. Int. J. Digit. Earth 2012, 7, 17–37. [Google Scholar] [CrossRef]
- Benner, J.; Geiger, A.; Häfele, K.-H. Concept for building licensing based on standardized 3D geo information. In Proceedings of the 5th International 3D GeoInfo Conference, Berlin, Germany, 3–4 November 2010.
- Kazar, B.M.; Kothuri, R.; van Oosterom, P.; Ravada, S. On Valid and Invalid Three-Dimensional Geometries. In Advances in 3D Geoinformation Systems; van Oosterom, P., Zlatanova, S., Penninga, F., Fendel, E.M., Eds.; Springer: Berlin/Heidelberg, Germany, 2008; pp. 19–46. [Google Scholar]
- Gröger, G.; Plümer, L. How to achieve consistency for 3D city models. GeoInformatica 2011, 15, 137–165. [Google Scholar] [CrossRef]
- Ledoux, H.; Meijers, M. Topologically consistent 3D city models obtained by extrusion. Int. J. Geogr. Inf. Sci. 2011, 25, 557–574. [Google Scholar] [CrossRef]
- Ledoux, H.; Arroyo Ohori, K.; Meijers, M. A triangulation-based approach to automatically repair GIS polygons. Comput. Geosci. 2014, 66, 121–131. [Google Scholar] [CrossRef]
- OSM Foundation Simple 3D Buildings. Available online: http://wiki.openstreetmap.org/wiki/Simple_3D_Buildings (accessed on 18 September 2014).
- Over, M.; Schilling, A.; Neubauer, S.; Zipf, A. Generating web-based 3D City Models from OpenStreetMap: The current situation in Germany. Comput. Environ. Urban Syst. 2010, 34, 496–507. [Google Scholar] [CrossRef]
- Koeman, L. An Exploratory Study into the Public and Situated Visualisation of Local Data in Urban Communities. In Proceedings of the 2014 Companion Publication on Designing Interactive Systems; DIS Companion ’14. ACM: New York, NY, USA, 2014; pp. 173–176. [Google Scholar]
- Power, A. Does demolition or refurbishment of old and inefficient homes help to increase our environmental, social and economic viability? Energy Policy 2008, 36, 4487–4501. [Google Scholar] [CrossRef]
© 2014 by the authors; licensee MDPI, Basel, Switzerland. This article is an open access article distributed under the terms and conditions of the Creative Commons Attribution license (http://creativecommons.org/licenses/by/4.0/).
Share and Cite
Dalmau, F.V.; Garcia-Almirall, P.; Domínguez, E.R.; Escudero, D.F. From Raw Data to Meaningful Information: A Representational Approach to Cadastral Databases in Relation to Urban Planning. Future Internet 2014, 6, 612-639. https://doi.org/10.3390/fi6040612
Dalmau FV, Garcia-Almirall P, Domínguez ER, Escudero DF. From Raw Data to Meaningful Information: A Representational Approach to Cadastral Databases in Relation to Urban Planning. Future Internet. 2014; 6(4):612-639. https://doi.org/10.3390/fi6040612
Chicago/Turabian StyleDalmau, Francesc Valls, Pilar Garcia-Almirall, Ernest Redondo Domínguez, and David Fonseca Escudero. 2014. "From Raw Data to Meaningful Information: A Representational Approach to Cadastral Databases in Relation to Urban Planning" Future Internet 6, no. 4: 612-639. https://doi.org/10.3390/fi6040612