Time Series Irradiance Synthesizer for Optical GEO Satellite Downlinks in 5G Networks
by

Theodore T. Kapsis
, 
Nikolaos K. Lyras
,
Charilaos I. Kourogiorgas
and
Athanasios D. Panagopoulos
* School of Electrical and Computer Engineering, National Technical University of Athens, Athens GR15780, Greece
*
Author to whom correspondence should be addressed.
Future Internet 2019, 11(6), 131; https://doi.org/10.3390/fi11060131
Submission received: 10 May 2019
/
Revised: 29 May 2019
/
Accepted: 12 June 2019
/
Published: 13 June 2019
(This article belongs to the Special Issue Satellite Communications in 5G Networks)
Abstract
:Next generation 5G networks generate a need for broadband, low latency and power efficient backhauling and data-relay services. In this paper, optical satellite communications links, as an integrated component of 5G networks, are studied. More specifically, the Geostationary (GEO) satellite-to-ground optical communication link is investigated. Long-term irradiance statistics based on experimental measurements from the ARTEMIS program are presented and a new time series generator related to the received irradiance/power fluctuations due to atmospheric turbulence is reported. The proposed synthesizer takes into consideration the turbulence-induced scintillation effects that deteriorate the laser beam propagation, on the assumption of the Kolmogorov spectrum. The modeling is based on Rytov theory regarding weak turbulence conditions with the incorporation of first order stochastic differential equations. Summing up, the time series synthesizer is validated in terms of first and second order statistics with experimental results from the European Space Agency‘s ARTEMIS experimental optical downlink and simulated received power statistics for various weather conditions are presented using the proposed validated methodology. Some important conclusions are drawn.
1. Introduction
Next generation networks such as Long Term Evolution (LTE) Advanced Pro, 5G are expected to have rigorous specifications concerning the connectivity so that every user globally can connect to high bandwidth mobile internet for accessing a variety of services including live video streaming, remote healthcare and tutorship, Internet of Things (IoT), Vehicle-to-Vehicle (V2V) and Device-to-Device (D2D) communications [1,2,3,4]. Satellite communications in the upcoming 5G networks are planned to alleviate multimedia data traffic congestion by providing edge delivery services, effectively establishing fixed 5G backhaul links between terrestrial nodes to infrastructures and to optimize the backhaul links for high mobility means of transport, such as trains, airplanes and ships, by heavily improving the handover and user experience [1,2,3,4]. Future 5G satellite backhaul links operating along with terrestrial networks will ensure provision of broadband and highly reliable connectivity, full coverage as well as minimal delay by offering efficient data caching capabilities as proposed by the 3rd Generation Partnership Project (3GPP) standards [3,4]. Therefore, in order to comply with the 5G standards and key performance indicators, satellite communication systems are evolving to satisfy the needs of the increasing demands in terms of bandwidth and capacity of the growing number of connected users and devices.
Optical communication technology constitutes a flexible and beneficial solution for satellite systems as it manifests significant properties: relatively easy and quick deployment, tremendous amounts of bandwidth that can reach hundreds of terabits/s, no spectrum usage permissions needed, point-to-point technology due to the very narrow transmitted laser beam, thus making free space optics (FSO) suitable for 5G backhauling and gateway connections [5,6].
Unguided light beam propagation however suffers from numerous adverse atmospheric phenomena and most importantly by the occurrence of fog and clouds [2,5,6]. While rain is the dominant attenuation factor for a mmWave link inducing losses up to 50 dB/km for a 150 mm/h rain rate [2], in the case of an optical link fog losses can reach even 350dB/km due to the comparable fog droplet size to the optical wavelength [5]. Moreover, dense clouds and mostly cirrus clouds may completely block Line of Sight (LOS) communication [7,8,9,10]. Therefore, mitigation techniques are employed, such as hybrid Free Space Optics/Radio Frequency (FSO/RF) systems, site diversity through an interconnection of optical ground stations (OGSs) or high-altitude platforms (HAPs) and wavelength diversity where larger wavelengths in the order of 10 um are used, for example, 1550 nm [7,8,9,10]. The Earth’s atmosphere still remains a challenging environment for optical carriers, even for large values of atmospheric transmittance due to atmospheric or clear air turbulence [5,6,11]. Turbulence in the atmosphere is caused by variations in wind speed, pressure and temperature that subsequently cause spatial and temporal variations in the refractive index [5,6,11]. These turbulence effects are exhibited as small-scale fluctuations of the received irradiance known as scintillation and as beam effects, such as beam spreading and beam wander. Scintillation is the primary signal degradation factor in the downlink case while the beam aberrations are considered negligible. Physical layer methods like aperture averaging and adaptive optics are among the most applied techniques for mitigating scintillation. All in all, the optical system suffers from pointing and tracking errors caused by weak earthquakes, equipment vibrations and optical misalignments [1,5,6,11]. Many theoretical models are used to accurately analyze the downlink scintillation effects, but the most common are the log-normal distribution for weak turbulence conditions, gamma-gamma distribution for strong turbulence and double-Weibull for moderate to strong intensity [1,5,6,12]. In this paper, a time series generator for the reproduction of received irradiance long-term statistics for an optical GEO downlink is proposed. The temporal behavior of the scintillation is modeled with the employment of stochastic differential equations (SDEs). The synthesizer is validated in terms of first and second order statistics with experimental results from the ARTEMIS optical link campaign and afterwards derived numerical results are reported [13,14]. In a previous paper [15], a preliminary version of the proposed generator has been presented and only the first order statistics have been validated. In this contribution, an extensive validation of the synthesizer using both first and second order statistics results is performed and its usage for system-level simulation and for fading techniques modeling is highlighted.
The methodology is based on the assumptions detailed below:
- Downlink Propagation
- GEO satellite-to-ground optical link
- Rytov’s theory is considered and Kolmogorov’s spatial spectrum of refractive index is applied
- Optical links with elevation angle greater than 20 deg are assumed
- A single collimated Gaussian beam is transmitted
- Perfect link pointing and tracking
The remainder of the paper is structured as follows: in Section 2 a brief summary of ARTEMIS optical satellite experimental campaign is presented; in Section 3 the required theoretical background is reported including important metrics regarding the downlink’s turbulence effects and followed by the proposed methodology for the generation of received irradiance time series; in Section 4 numerical results using the synthesized data are validated with experimental results derived from ARTEMIS campaign and simulated received power statistics for various weather conditions are reported using the validated methodology; and finally Section 5 concludes this paper.
2. ARTEMIS Optical Satellite Program
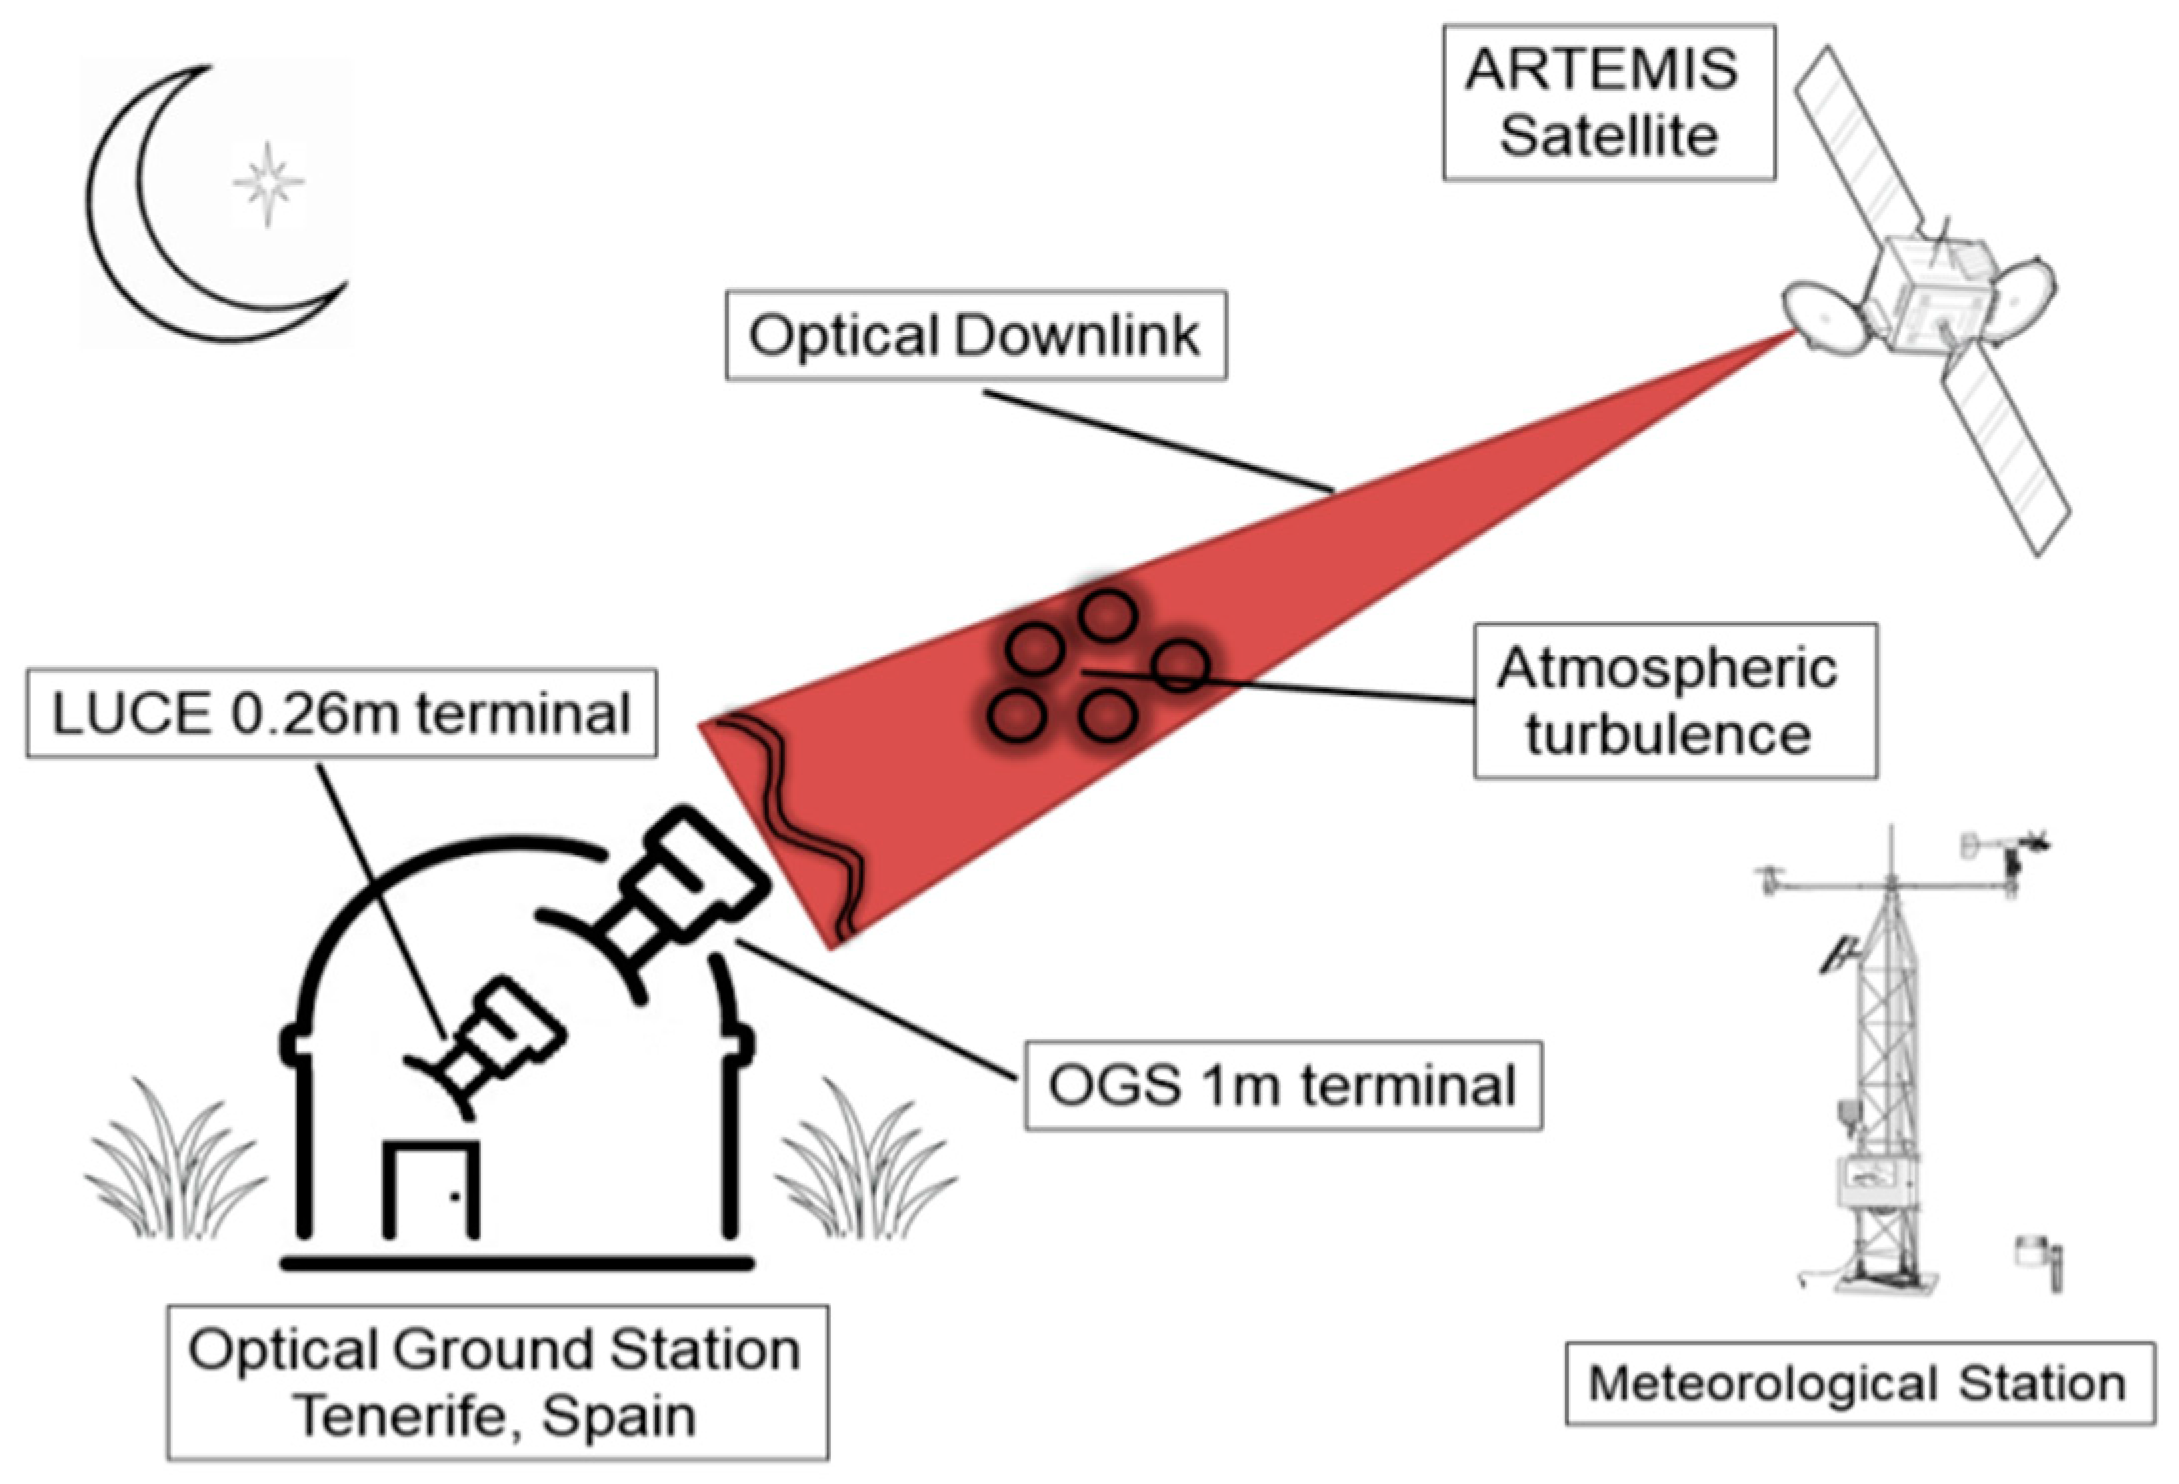
The ARTEMIS optical satellite link program was a data-relay mission set up by the European Space Agency (ESA) in 2003 where a series of optical link experiments were carried out between the ARTEMIS GEO satellite and the ESA’s optical ground station (OGS) in Tenerife, Spain [13]. The location parameters of ARTEMIS are shown in Table 1 and the technical features are shown in Table 2 [13].
An OGS was installed at a high altitude of 2400 m in order to achieve good atmospheric conditions for the optical channel study and contained two terminals: ESA’s 1m diameter telescope [13] and the smaller 0.26 m diameter LUCE optical receiver [14]. LUCE was designed by the Japanese Aerospace Exploration Agency (JAXA) for inter-orbit optical communications and was placed initially in OGS for compatibility tests [14].
In Figure 1 the setup of the complete optical experiment is exhibited. The downlink ARTEMIS to OGS through the turbulent atmosphere which causes irradiance scintillation is shown. The two telescopes installed allow for different reception while the weather station nearby provides information on the humidity, pressure, temperature and wind speed for the ground level. Two sets of experimental measurements are available in accordance with the two terminals and are used to compare the scintillation effects regarding the different aperture sizes. Afterwards, the downlink ARTEMIS GEO Satellite to the LUCE receiver will be specifically and thoroughly examined due to LUCE’s smaller aperture.
3. Proposed Time Series Synthesizer
3.1. Important Metrics
The strength of atmospheric turbulence in downlink can be estimated by the scintillation index (SI). The scintillation index is the normalized variance of the received irradiance and is derived from experimental data [5,6,11]:
where I is the irradiance. The Rytov method indicates that the scintillation index can be expressed in terms of the variance of the field log-amplitude as:
and under weak turbulence (SI < 1), the following approximation is valid [5,6,11]:
A theoretical formula for the evaluation of scintillation index for a plane wave is provided by Rytov [5,6,11]:
where is the wavenumber, is the wavelength, is the zenith angle, is the altitude, is the ground station’s altitude, is the turbulence altitude and is considered negligible for altitudes higher than 20 km [5], that is assuming HTurb = 20,000 m.
Finally, is the refractive index structure parameter as a function of the altitude h. The most common model for is the Hufnagel–Valley Model (H-V) modified however to incorporate the ground station’s altitude [16]:
where is the refractive index structure parameter at ground level and is the rms wind speed at high altitude:
where is the wind profile and can be estimated using the Bufton wind model [5,6,11]:
where is the slew rate indicating the relative motion between the satellite and the ground station—minimal for GEO satellite—and is the wind speed on ground.
To take into account the aperture averaging effect to (4), the Aperture Averaging Factor is employed where is the receiver’s aperture diameter. SI for a receiving telescope can be expressed as the following [6,11,12]:
Aperture averaging factor can also be derived from experimental data:
where is the mean value of the SIs calculated from the data. A notable theoretical approach for is the following [17]:
where
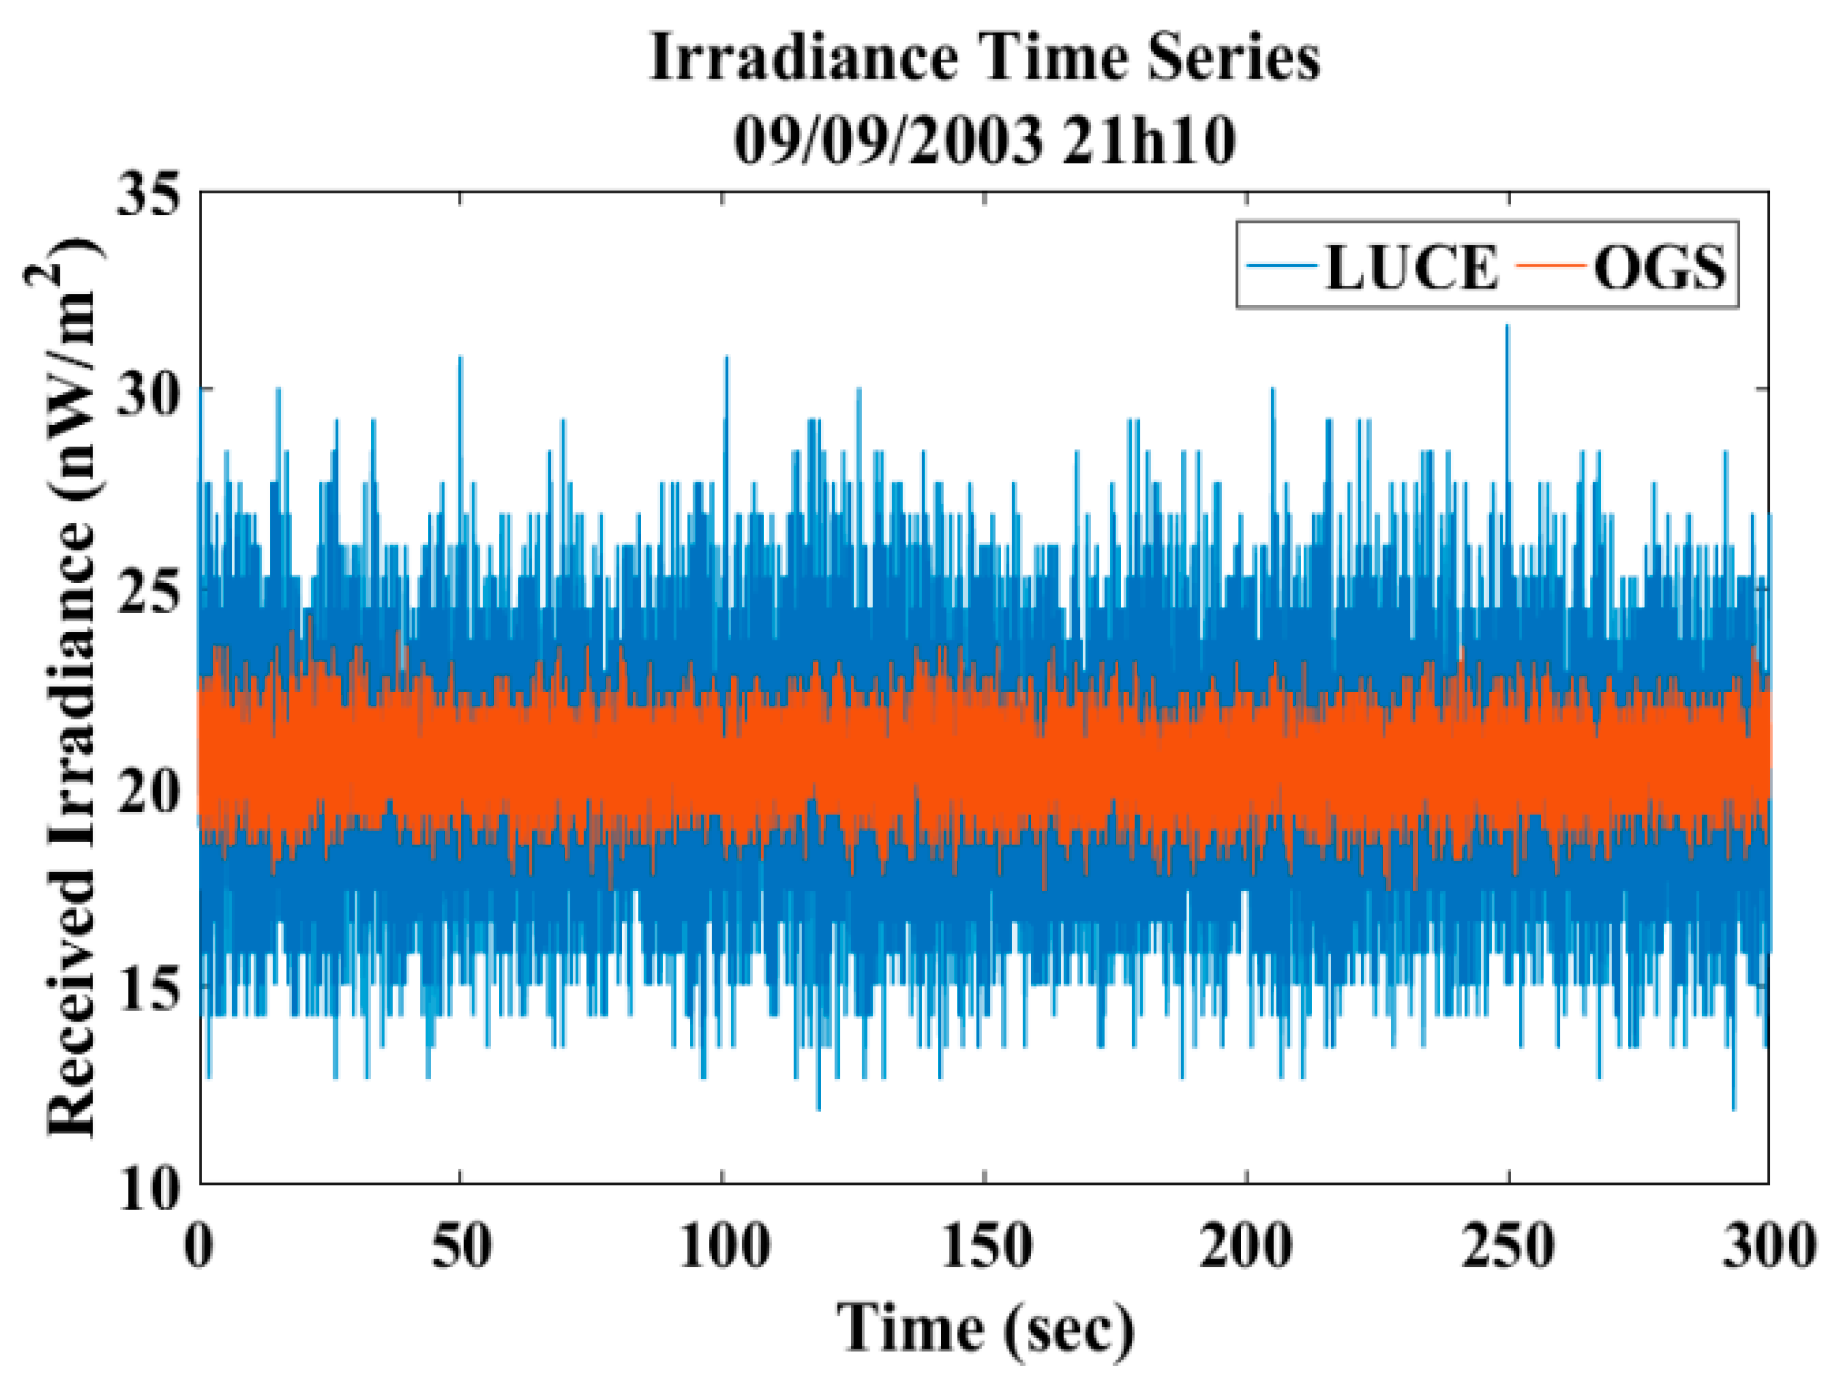
For better understanding the aperture averaging, in Figure 2 the time series of irradiance values as measured by LUCE and ESA’s OGS receivers are depicted. It is obvious that in the case of the LUCE telescope, there is more irradiance fluctuation than in ESA’s bigger telescope, implying that large size terminals benefit more from the aperture averaging effect. The SI computed from LUCE data using (1) is 0.0130 while the SI from OGS data is 0.0015.
3.2. Time Series Generator
The analysis begins examining the case where no turbulence is present and the optical signal, a single collimated Gaussian beam, is only affected by free-space diffraction. Therefore, for a free space optical GEO downlink communication system the received irradiance can be given according to the formula [6,11,15]:
where is the transmitted power, are the efficiencies of transmitter and receiver respectively, is the atmospheric transmittance, is the link distance (slant path), is the radial distance from the beam center and is the beam waist after propagation of distance L given according to the next formula [6,11,15]:
where is the initial beam waist of the source at which the irradiance falls to (spot size). In (13) the transmitter and receiver gains as well as the free space losses are incorporated. The received power in Watts can be extracted from (13) as .
In the presence of clear air turbulence, the signal propagation suffers from scintillation effects and beam effects, that is, beam wandering and beam spreading. However, in downlink only the scintillation effects are most significant, and based on the assumptions about Rytov theory and the Kolmogorov spatial spectrum, the received irradiance time series are given by the next expression [6,11,15]:
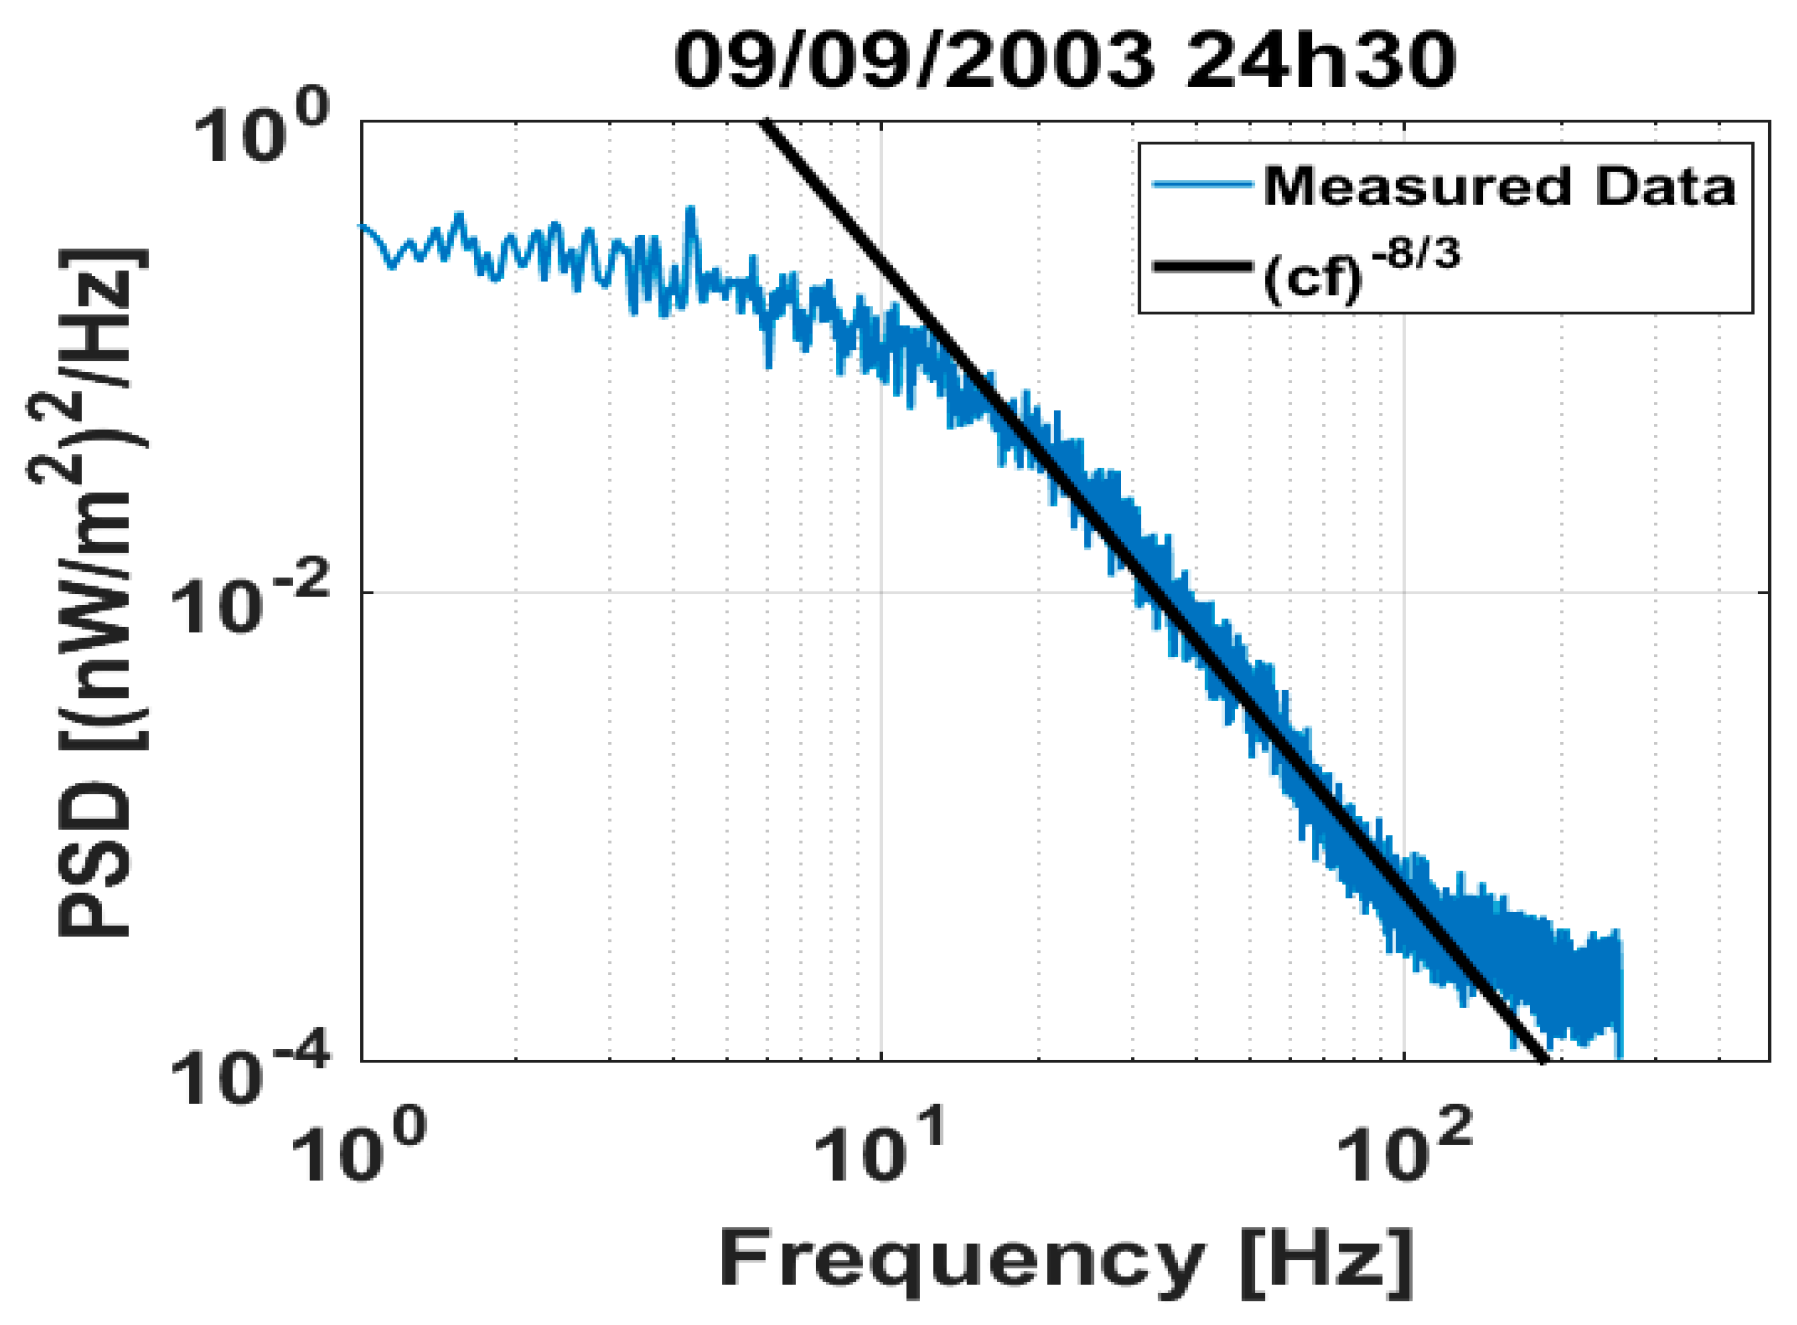
The scintillation effects are integrated in the term where is the fluctuations log-amplitude. Assuming weak turbulence conditions the log-amplitude is a normally distributed Gaussian process with mean value, variance [19] and low pass PSD with −80/3 dB/decade slope. In Figure 3 the PSD of downlink irradiance as received by LUCE is displayed along with the graph of the function where c is a constant. In log-log scale the latter function is a straight line with −8/3 slope and verifies that the spectra of downlink scintillation decreases with −80/3 dB/decade.
Stochastic differential equations (SDEs) driven by fractional Brownian motion are used to reproduce such processes as reported in [20]. The requested Gaussian process is the solution of the following SDE [20]:
where is given by:
The and depend on the dynamic parameters of the stochastic process and its long-term statistics, respectively [20]. is the Hurst exponent [20].
The log-amplitude time series can now be expressed as:
where
4. Validation and Numerical Results
4.1. Validation with Experimental Data
In this section, the accuracy, performance and capability of the proposed synthesizer to reproduce the received irradiance statistics will be evaluated. Therefore, good agreement in terms of first and second order irradiance statistics between the numerical and the experimental results is necessary. The validation procedure is the following:
- Computation of the first order statistics, that is, normalized probability density function (PDF), cumulative distribution function (CDF) of the available data from ARTEMIS optical experiments. For every session the SI is also calculated.
- Computation of the second order statistics, that is, power spectral density (PSD) of the available experimental data.
- Generation of received irradiance time-series using the proposed methodology. The model inputs are the ARTEMIS coordinates and transmitting settings given by Table 1 and Table 2, the refractive index structure parameter at ground level A0 which was kept fixed at a value of due to the fact that the sessions took place at night, the session’s ground wind speed which was provided by the nearby installed weather station and the aperture averaging factor where is the LUCE’s diameter. The is estimated close to 0.1 using (9).
- Computation of normalized PDF, CDF and PSD of the synthesized data and the corresponding SIs.
- Comparison of the derived numerical results with the respective experimental results and examination of possible discrepancies.
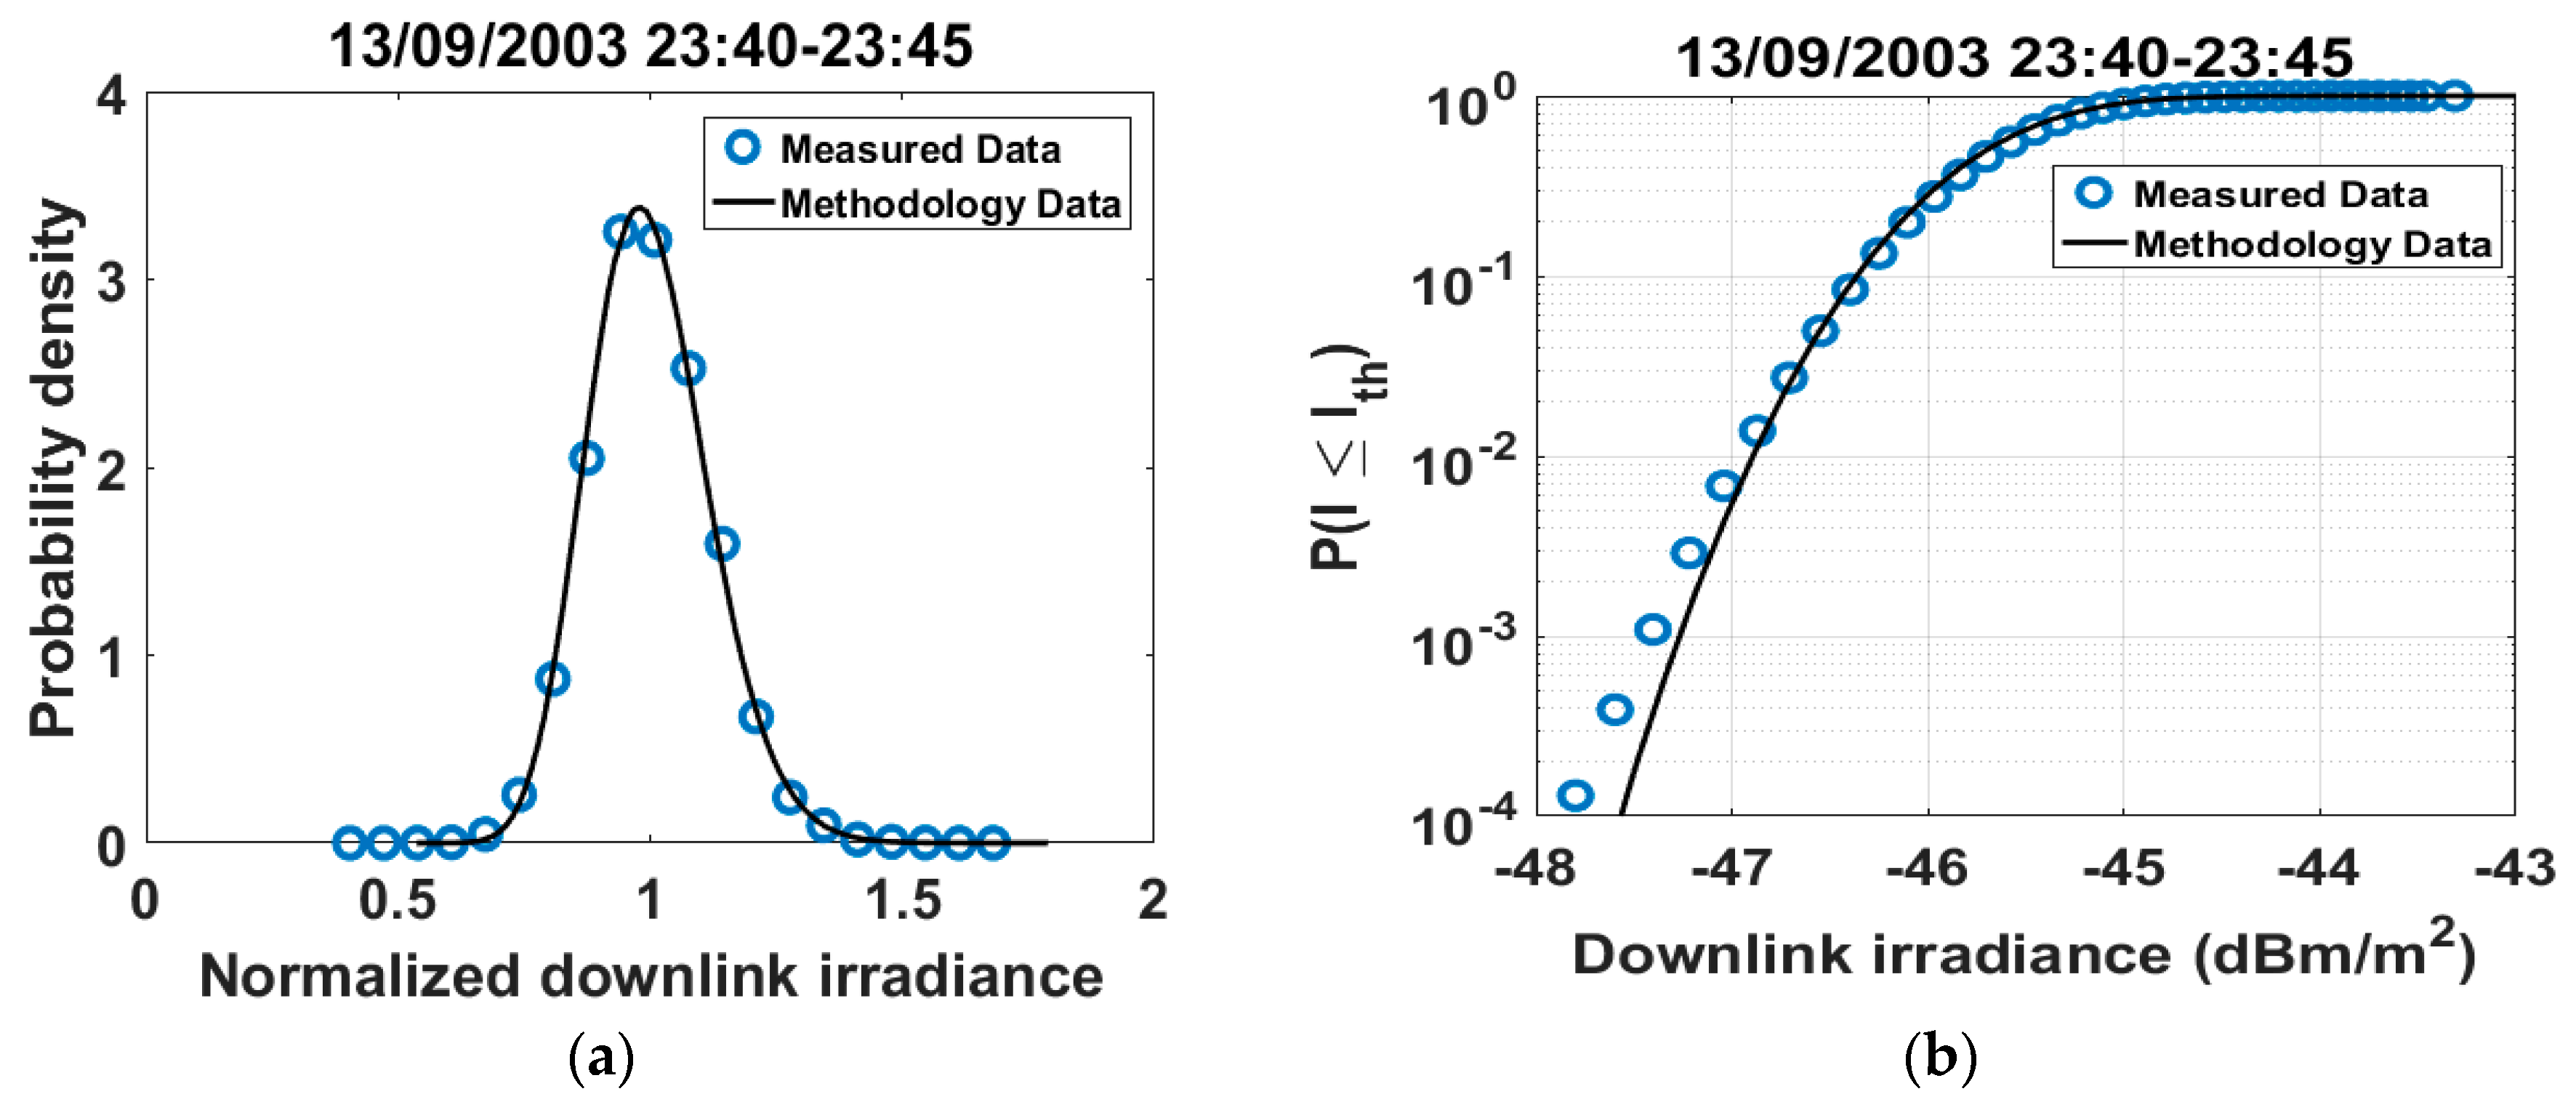
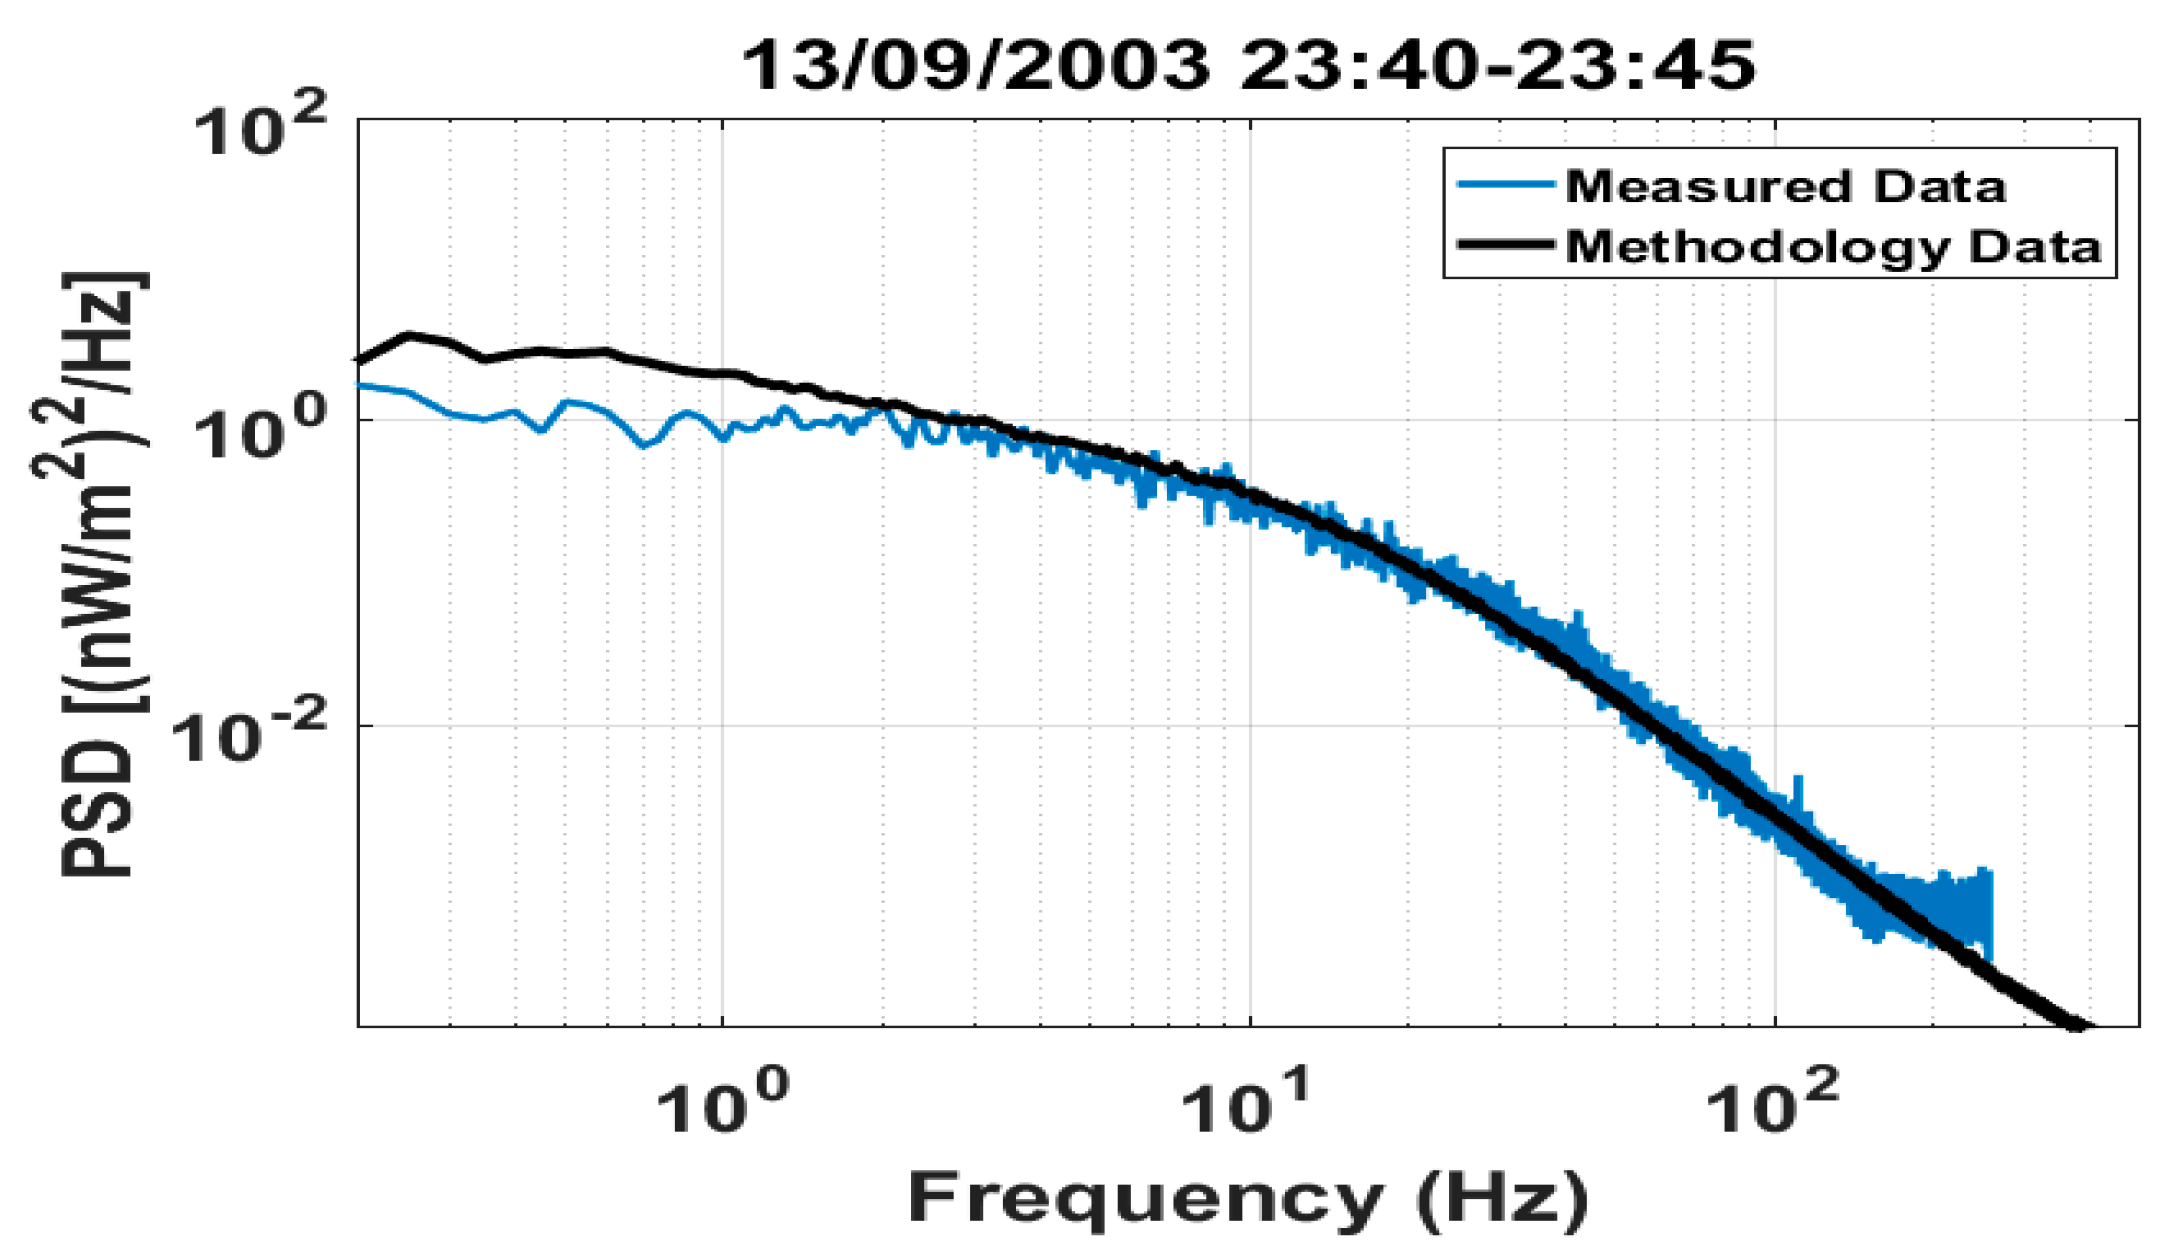
The first experimental session examined took place on 13/09/2003 during 23:30–23:50. In Table 3 the recorded ground wind speed, the derived SI from the synthesized data and the measured SI are given. In Figure 4 the numerical first order statistics, that is, normalized PDF and CDF for this session are presented and compared to the experimental results. In Figure 5 the numerical second order statistics, that is, PSD are shown and tested against the experimental results.
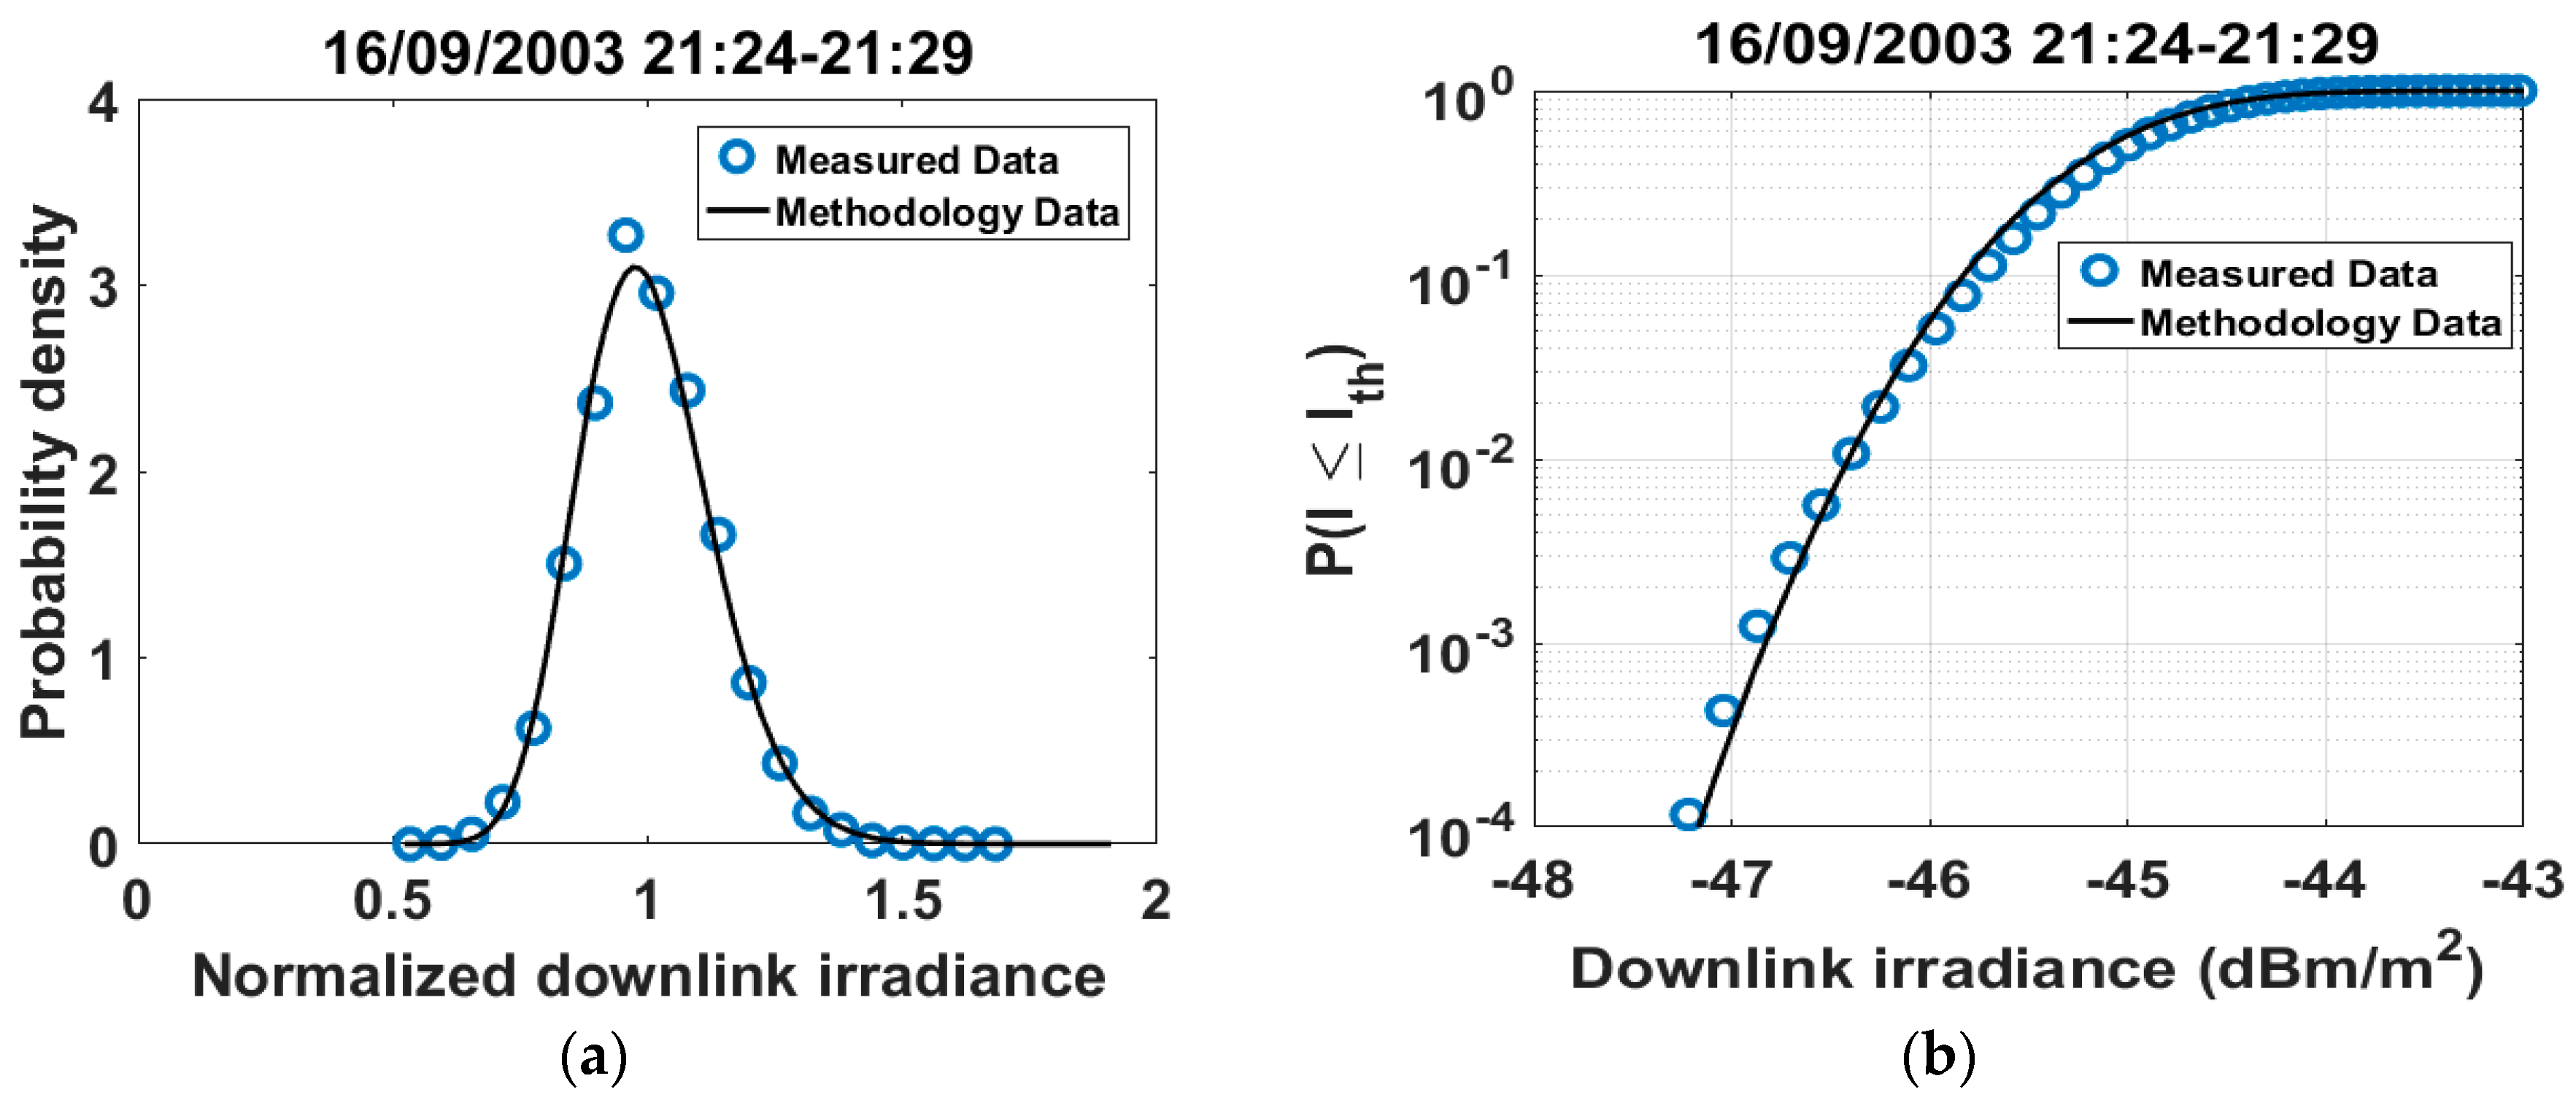
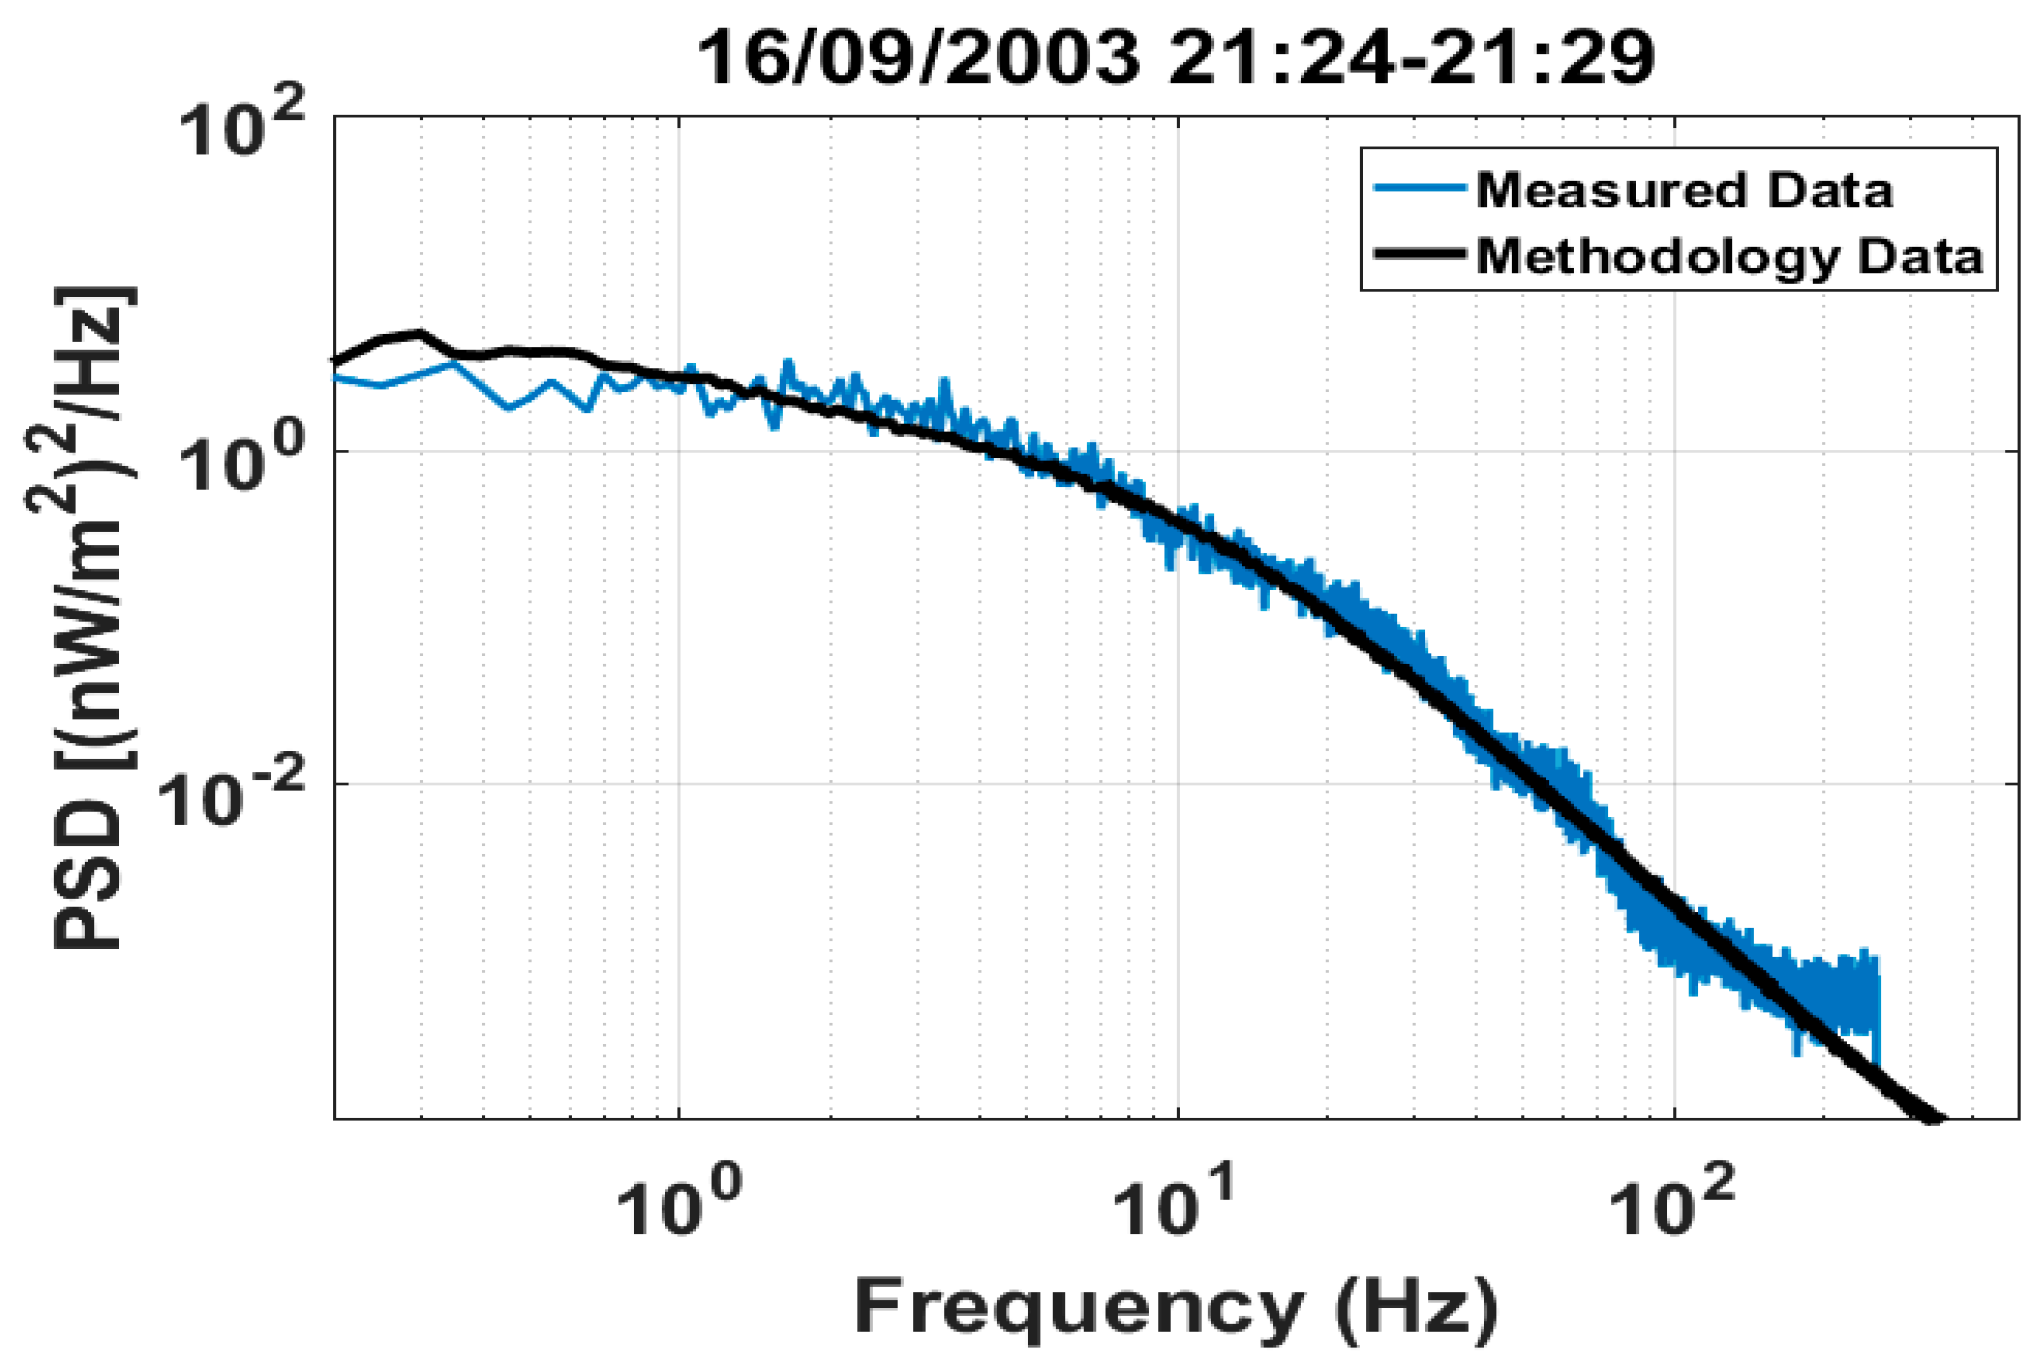
The next experimental session took place on 16/09/2003 during 21:10—21:30. In Table 3 the recorded ground wind speed, the derived SI from the synthesized data and the measured SI is given. In Figure 6 the numerical first order statistics, that is, normalized PDF and CDF for this session are presented and compared to the experimental results. In Figure 7 the numerical second order statistics, that is, PSD are shown and tested against the experimental results.
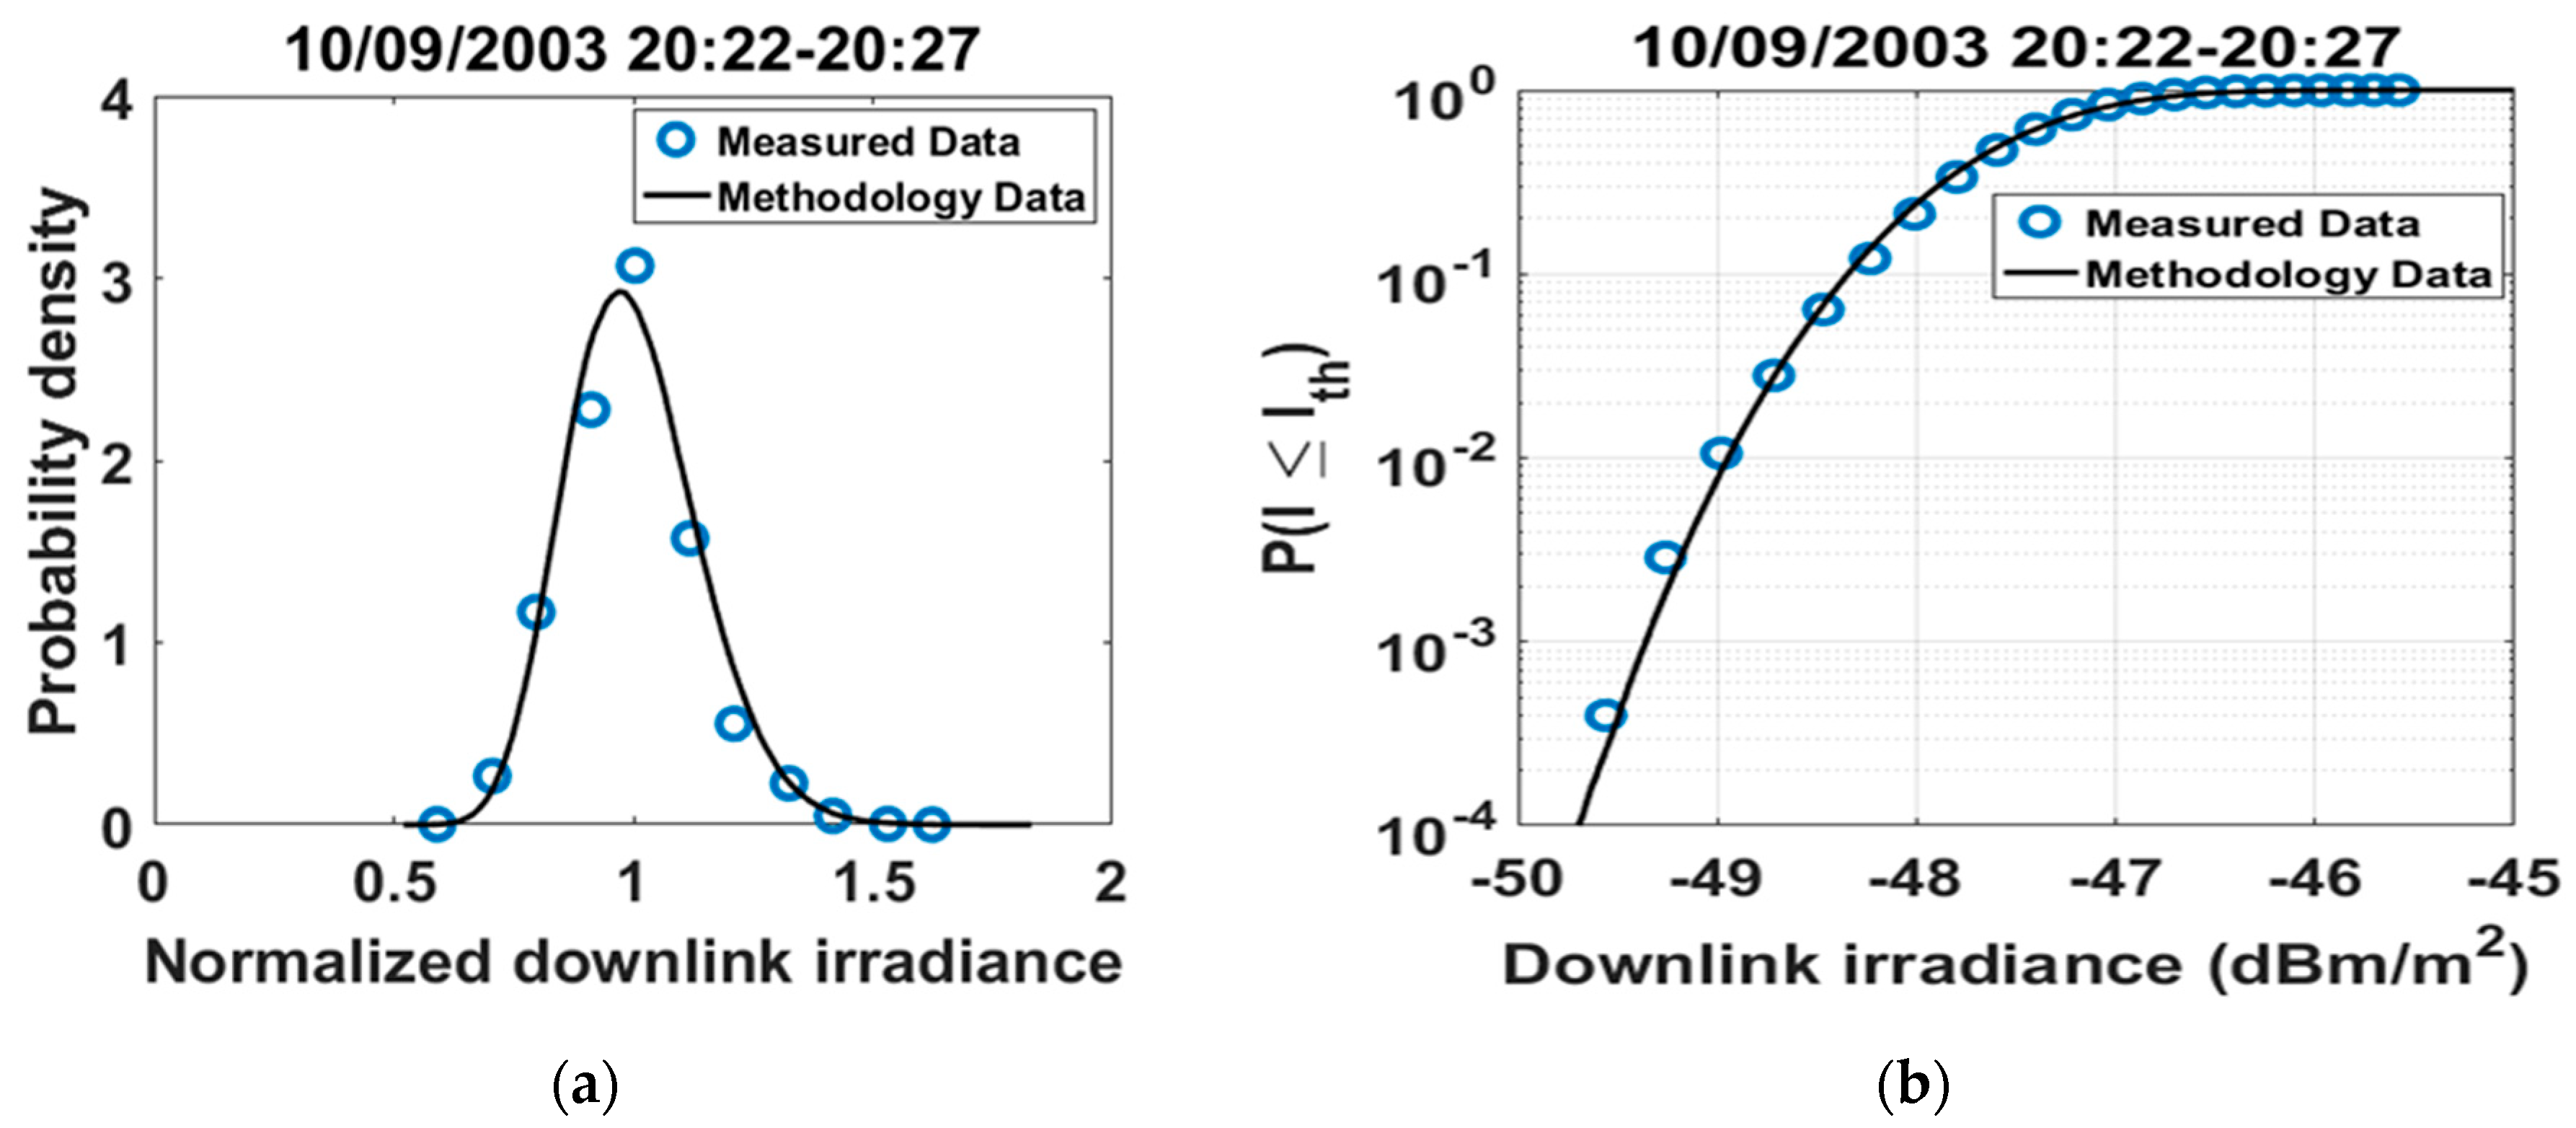
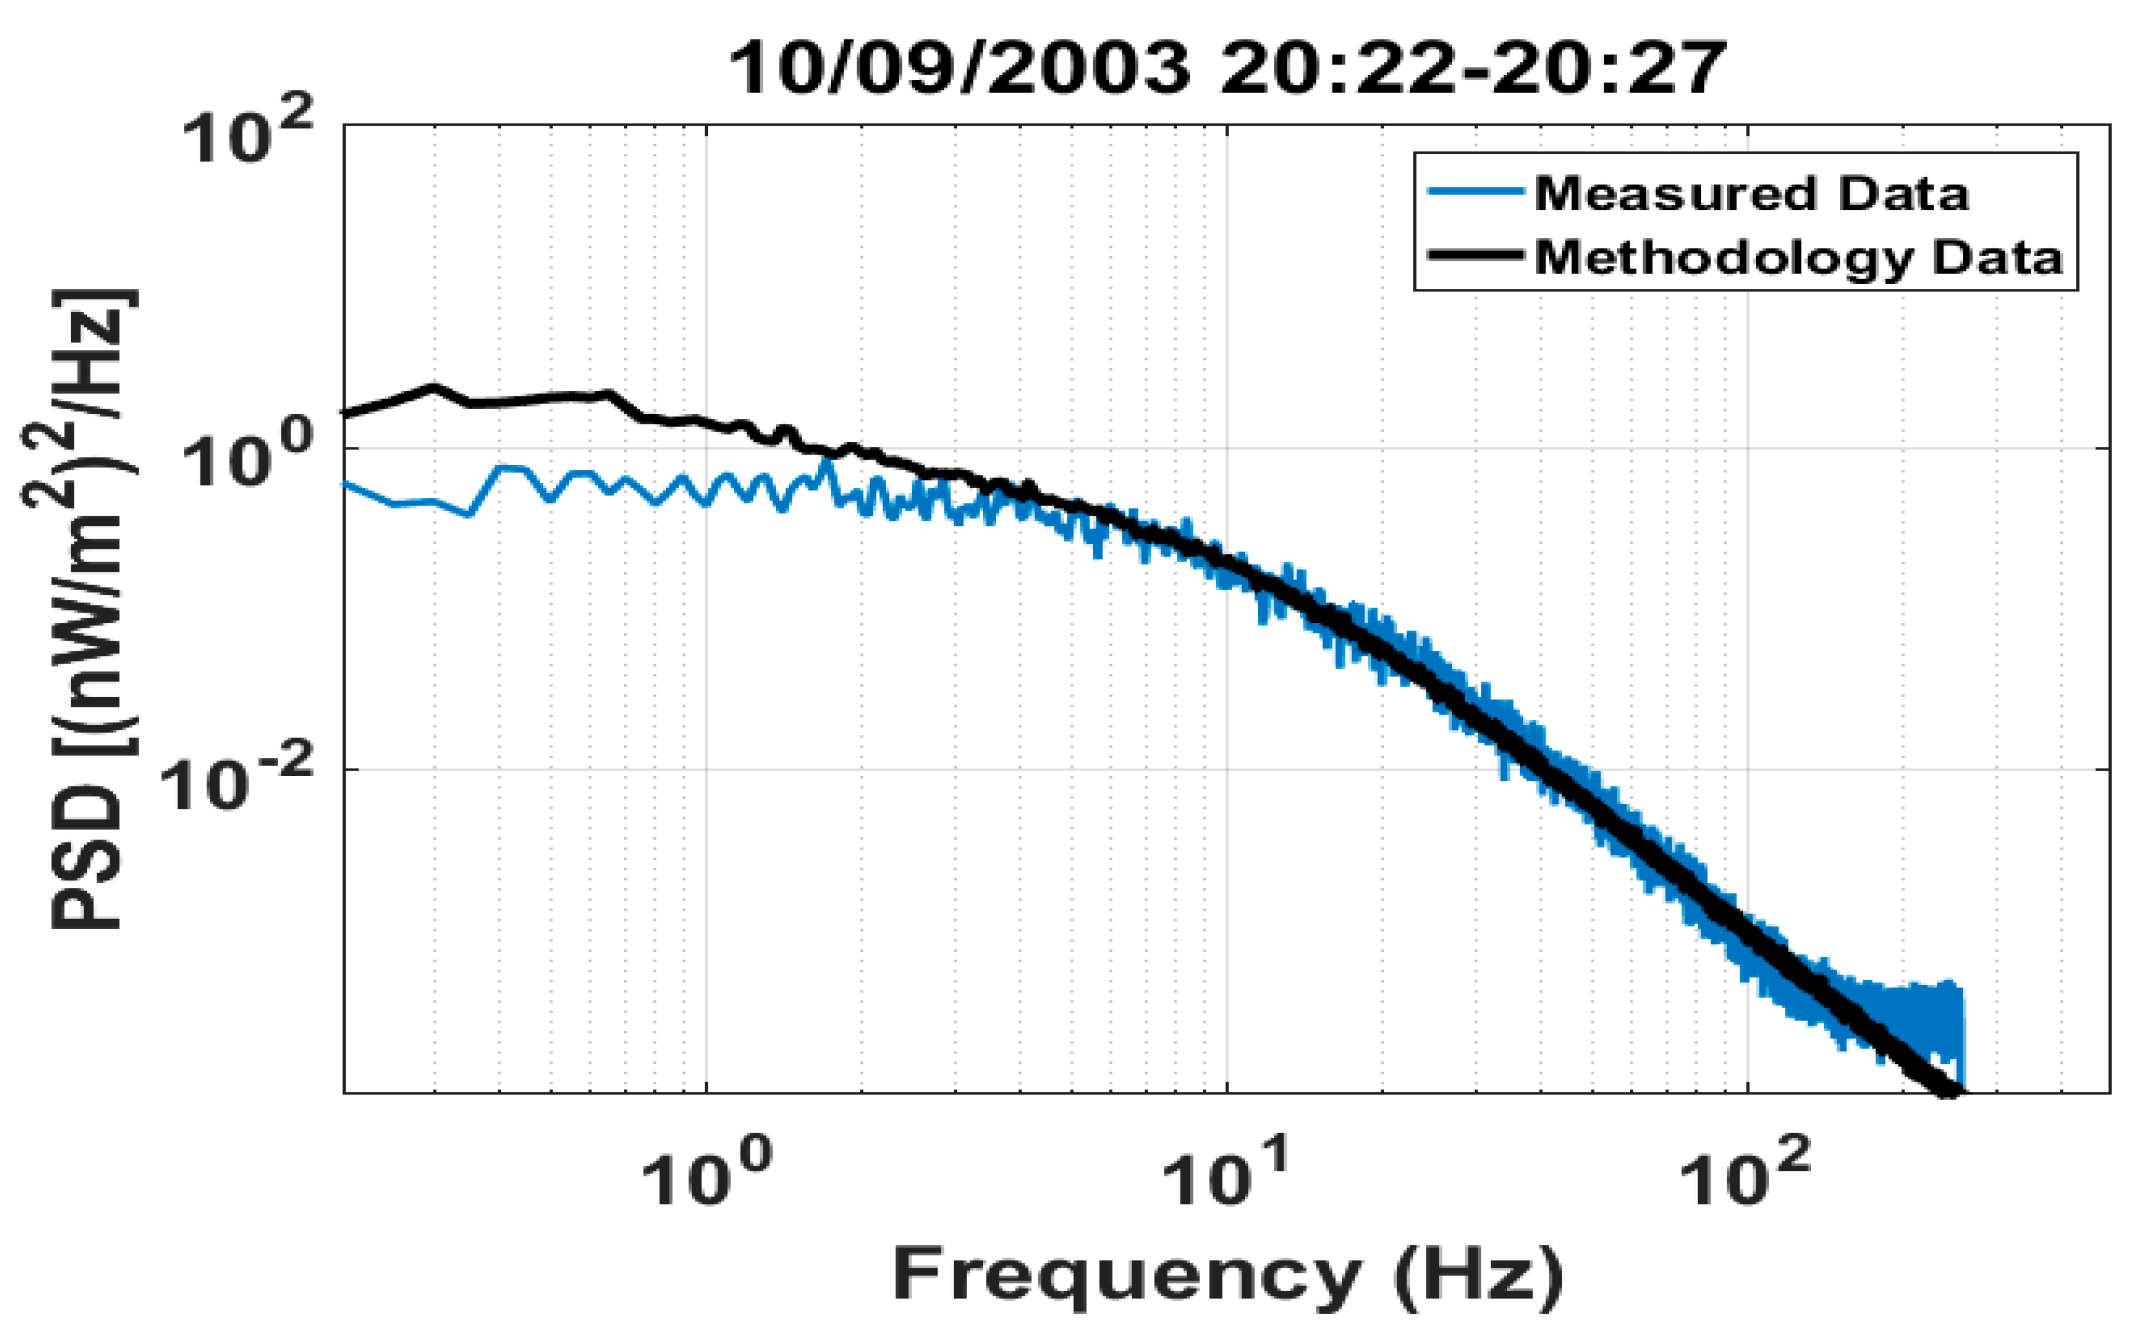
The following experimental session took place on 10/09/2003 during 20:10–20:30. In Table 3 the recorded ground wind speed, the derived SI from the synthesized data and the measured SI is given. In Figure 8 the numerical first order statistics, that is, normalized PDF and CDF for this session are presented and compared to the experimental results. In Figure 9 the numerical second order statistics, that is, PSD are shown and tested against the experimental results.
It was observed that the long-term irradiance statistics are re-produced by the proposed synthesizer and fully represent the experimental ones.
Concerning the first order statistics results, the scintillation indexes computed from the time-series generated are very similar to the measured ones as well as the corresponding normalized PDFs and CDFs which almost coincide. It is clear that the various wind speeds on the vertical (to the slant path) path cause different turbulence conditions and the larger the wind speed, the greater the SI value.
Regarding the second order statistics results, the methodology-obtained PSDs show good agreement with the ones computed from the optical experimental data. Moreover, it can be seen that the scintillation effect is dominant in the frequency range under 10 Hz with a 3dB bandwidth between 6 Hz and 8 Hz. From 10 Hz and after the power spectrum decreases steadily until the 100 Hz where the noise power spectra becomes significant.
4.2. Long-term Received Power
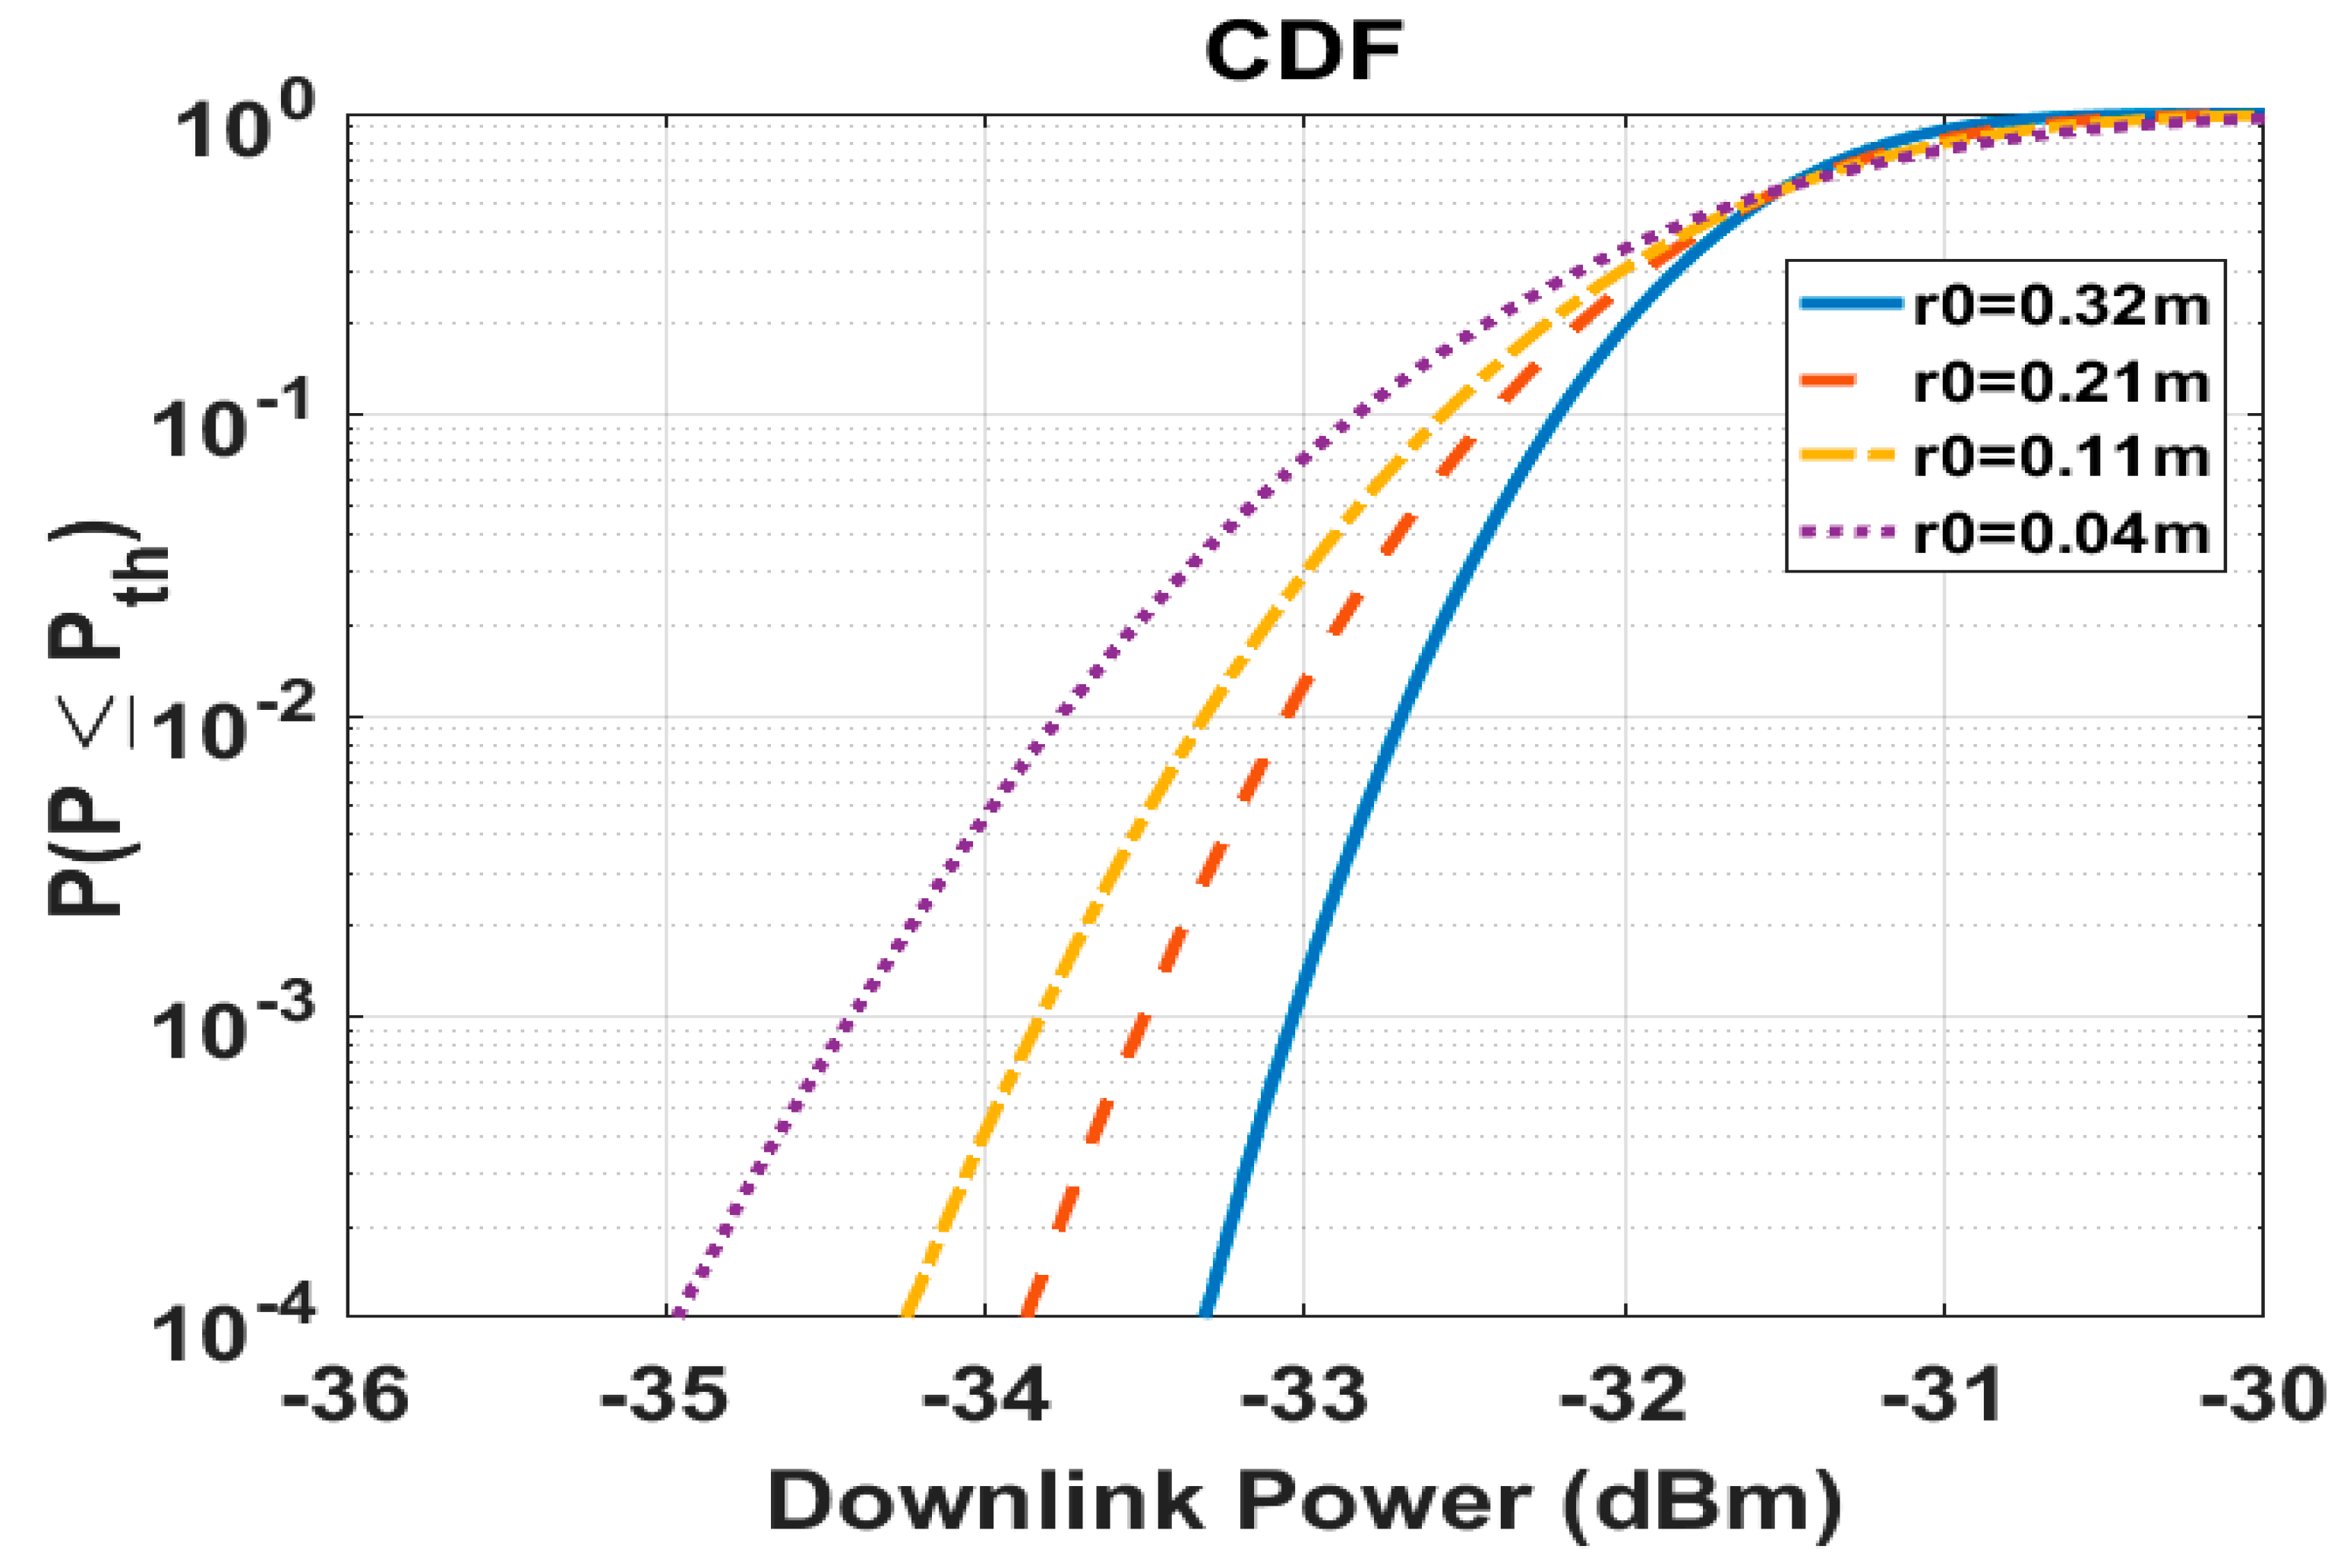
In this section the long-term received power statistics, the first order statistics, are presented using the validated synthesizer. The simulation of the turbulent optical channel is performed under various weather conditions in terms of different values, that is, different leading to various Fried parameters and scintillation index values.
The model hypothetical inputs are given below:
(a) Communication wavelength is ; (b) transmitting power is ; (c) transmitter’s efficiency is ; (d) receiver’s efficiency is including the quantum efficiency; (e) the atmospheric transmittance is ; (f) receiver’s aperture diameter is ; (g) beam diameter is ; (h) ground station’s height is with elevation angle 37°.
In Figure 10 the simulated CDFs are demonstrated.
In Table 4 the resulting Fried parameters and SIs from the numerical data are also given. It is concluded that the worse the turbulence effects the smaller the Fried parameter and the larger the SI, leading to reduced received power as it is easily observed by the simulated CDFs.
5. Conclusions
Optical communication satellite systems are the next step to a global network of the upcoming 5G cellular systems as they offer a variety of advantages but they also suffer from harsh atmospheric phenomena. In the case of an optical GEO downlink, air turbulence causes the scintillation of the optical signal, resulting in received irradiance fluctuations. The scintillation effects are more intense for short aperture ground receivers which are the most practical and affordable to employ and therefore the need emerges for scintillation profile modeling. In this contribution, a time series synthesizer for the accurate prediction of downlink irradiance scintillation is proposed. For modeling, the Rytov weak disturbance theory was considered and the Kolmogorov spatial spectrum was applied along with the integration of stochastic differential equations (SDEs). First and second order long-term irradiance statistics from the ARTEMIS optical link program were presented and used to successfully validate the proposed methodology while numerical results of received power statistics demonstrated the impact of atmospheric turbulence on the optical link.
Author Contributions
All authors contributed extensively to the work presented in this paper. T.K. and N.L. had the original idea on which we have based our current work and had the overall coordination in the writing of the article. C.K and A.P. were responsible for the overall orchestration of the performance evaluation work. All the authors have contributed to the writing of the article.
Funding
This research received no external funding.
Acknowledgments
The work presented in this paper was carried out under the ONSET-CCN ESA project.
Conflicts of Interest
The authors declare no conflict of interest.
References
- Illi, E.; El Bouanani, F.; Ayoub, F. A Performance Study of a Hybrid 5G RF/FSO Transmission System. In Proceedings of the 2017 International Conference on Wireless Networks and Mobile Communications (WINCOM), Rabat, Morocco, 1–4 November 2017. [Google Scholar]
- Leitgeb, E. Future Applications of Optical Wireless and Combination Scenarios with RF Technology. In Proceedings of the 2017 40th International Convention on Information and Communication Technology, Electronics and Microelectronics (MIPRO), Opatija, Croatia, 22–26 May 2017. [Google Scholar]
- Jou, B.T.; Vidal, O.; Cahill, J.; Arnal, F.; Honssin, L.M.; Boutin, M.; Chau, D.K. Architecture Options for Satellite Integration into 5G Networks. In Proceedings of the 2018 European Conference on Networks and Communications (EuCNC), Ljubljana, Slovenia, 18–21 June 2018. [Google Scholar]
- Sharma, S.K.; Chatzinotas, S.; Arapoglou, P.D. Satellite Communications in the 5G Era, 1st ed.; The Institution of Engineering and Technology: London, UK, 2018. [Google Scholar]
- Kaushal, H.; Kaddoum, G. Optical Communication in Space: Challenges and Mitigation Techniques. IEEE Comm. Surv. Tutor. 2016, 19, 57–96. [Google Scholar] [CrossRef]
- Hemmati, H. Near-Earth Laser Communications, 1st ed.; CRC Press: Boca Raton, FL, USA, 2009. [Google Scholar]
- Lyras, N.K.; Kourogiorgas, C.I.; Panagopoulos, A.D. Cloud Attenuation Statistics Prediction From Ka-Band to Optical Frequencies: Integrated Liquid Water Content Field Synthesizer. IEEE Trans. Antennas Propag. 2017, 65, 319–328. [Google Scholar] [CrossRef]
- Lyras, Ν.Κ.; Kourogiorgas, C.I.; Panagopoulos, A.D. Cloud Free Line of Sight Prediction Modelling for Optical Satellite Communication Network. IEEE Commun. Lett. 2017, 21, 1537–1540. [Google Scholar] [CrossRef]
- Kourogiorgas, C.I.; Lyras, N.; Panagopoulos, A.D.; Tarchi, D.; Vanelli-Coralli, A.; Ugolini, A.; Colavolpe, G.; Arapoglou, P.D. Capacity Statistics Evaluation for Next Generation Broadband MEO Satellite Systems. IEEE Trans. Aerosp. Electron. Syst. 2017, 53, 2344–2358. [Google Scholar] [CrossRef]
- Lyras, N.K.; Efrem, C.N.; Kourogiorgas, C.I.; Panagopoulos, A.D. Optimum Monthly-Based Selection of Ground Stations for Optical Satellite Networks. IEEE Commun. Lett. 2018, 22, 1192–1195. [Google Scholar] [CrossRef]
- Andrews, L.; Phillips, R. Laser Beam Propagation through Random Media, 2nd ed.; SPIE Press: Bellingham, WA, USA, 2005. [Google Scholar]
- Kolev, D.R.; Toyoshima, M. Received-Power Fluctuation Analysis for LEO Satellite-to-Ground Laser Links. J. Lightwave Technol. 2017, 35, 103–112. [Google Scholar] [CrossRef]
- Alonso, A.; Reyes, M.; Sodnik, Z. Performance of satellite-to-ground communications link between ARTEMIS and the Optical Ground Station. Proc. SPIE Opt. Atmos. Propag. Adapt. Syst. VII 2004, 5572, 372–384. [Google Scholar]
- Toyoshima, M.; Yamakawa, S.; Yamawaki, T.; Arai, K.; García-Talavera, M.R.; Alonso, A.; Sodnik, Z.; Demelenne, B. Long-term statistics of laser beam propagation in an optical ground-to-geostationary satellite communications link. IEEE Trans. Antennas Propag. 2005, 53, 842–850. [Google Scholar] [CrossRef]
- Kapsis, T.T.; Lyras, N.K.; Panagopoulos, A.D. Long Term Irradiance Statistics for Optical GEO Downlinks: Validation with ARTEMIS Experimental Measurements. Prog. Electromagn. Res. 2019, 82, 89–94. [Google Scholar] [CrossRef]
- Calvo, R.M.; Becker, P.; Giggenbach, D.; Moll, F.; Schwarzer, M.; Hinz, M.; Sodni, Z. Transmitter diversity verification on ARTEMIS geostationary satellite. Proc. SPIE Free-Space Laser Commun. Atmos. Propag. 2014, 8971, 897104. [Google Scholar]
- Yura, H.T.; McKinley, W.G. Aperture averaging of scintillation for space-to-ground optical communications. Appl. Opt. 1983, 22, 1608–1609. [Google Scholar] [CrossRef] [PubMed]
- Kolev, D.R.; Toyoshima, M. Satellite-to-ground optical communications using small optical transponder (SOTA)–received-power fluctuations. Opt. Express 2017, 25, 28319–28329. [Google Scholar] [CrossRef]
- Reyes, M.; Comeron, A.; Alonso, A.; Rodriguez, A.; Rubio, J.A.; Dios, V.F.; Chueca, S.; Sodnik, Z. Ground-to-satellite bidirectional laser links for validation of atmospheric turbulence model. Proc. SPIE Free Space Laser Commun. Act. Laser Illum. III 2003, 5160, 44–55. [Google Scholar]
- Shao, Y. The Fractional Ornstein-Uhlenbeck Process as a Representation of Homogeneous Eulerian Velocity Turbulence. Physica D 1995, 83, 461–477. [Google Scholar] [CrossRef]
Figure 1.
Setup of the ARTEMIS optical experiments.
Figure 2.
Received irradiance time series as measured by optical ground station (OGS) and LUCE terminals.
Figure 2.
Received irradiance time series as measured by optical ground station (OGS) and LUCE terminals.
Figure 3.
The power spectral density (PSD) of scintillation decreases with −80/3 dB/decade.
Figure 4.
First order irradiance statistics validation for session on 13/09/2003 23:30. (a) Normalized probability density function (PDF) of measured data vs. Normalized PDF of generated data; (b) cumulative distribution function (CDF) of measured data vs. CDF of generated data.
Figure 4.
First order irradiance statistics validation for session on 13/09/2003 23:30. (a) Normalized probability density function (PDF) of measured data vs. Normalized PDF of generated data; (b) cumulative distribution function (CDF) of measured data vs. CDF of generated data.
Figure 5.
Second order irradiance statistics validation for session on 13/09/2003 23:30. PSD of measured data vs. PSD of generated data.
Figure 5.
Second order irradiance statistics validation for session on 13/09/2003 23:30. PSD of measured data vs. PSD of generated data.
Figure 6.
First order irradiance statistics validation for session on 16/09/2003 21:10. (a) Normalized PDF of measured data vs. Normalized PDF of generated data; (b) CDF of measured data vs. CDF of generated data.
Figure 6.
First order irradiance statistics validation for session on 16/09/2003 21:10. (a) Normalized PDF of measured data vs. Normalized PDF of generated data; (b) CDF of measured data vs. CDF of generated data.

Figure 7.
Second order irradiance statistics validation for session on 16/09/2003 21:10. PSD of measured data vs. PSD of generated data.
Figure 7.
Second order irradiance statistics validation for session on 16/09/2003 21:10. PSD of measured data vs. PSD of generated data.

Figure 8.
First order irradiance statistics validation for session on 10/09/2003 20:10. (a) Normalized PDF of measured data vs. Normalized PDF of generated data; (b) CDF of measured data vs. CDF of generated data.
Figure 8.
First order irradiance statistics validation for session on 10/09/2003 20:10. (a) Normalized PDF of measured data vs. Normalized PDF of generated data; (b) CDF of measured data vs. CDF of generated data.
Figure 9.
Second order irradiance statistics validation for session on 10/09/2003 20:10. PSD of measured data vs. PSD of generated data.
Figure 9.
Second order irradiance statistics validation for session on 10/09/2003 20:10. PSD of measured data vs. PSD of generated data.

Figure 10.
Downlink received power for various weather conditions.

Table 1.
ARTEMIS location parameters.
| Longitude | Latitude | Altitude | Elevation Angle |
|---|---|---|---|
| 21.5° East | 0.0° ± 2.81° North | 35,787 km | 37° |
Table 2.
ARTEMIS technical features.
| Wavelength | Beam Diameter (1/e2) | Transmitted Power |
|---|---|---|
| 819 nm | 125 mm | 10 mW |
Table 3.
Methodology Scintillation Index vs. Experimental Scintillation Index.
| Session Date | Wind Speed on Ground (m/s) | Methodology Scintillation Index | Measured Scintillation Index |
|---|---|---|---|
| 13/09/2003 23h30 | 0.3 | 0.0142 | 0.0140 |
| 16/09/2003 21h10 | 2.8 | 0.0170 | 0.0164 |
| 10/09/2003 20h10 | 4.3 | 0.0190 | 0.0183 |
Table 4.
Fried parameter and scintillation index values for different .
| Vg (m/s) | A0 | r0 (m) | SIpoint |
|---|---|---|---|
| 0 | 0.32 | 0.126 | |
| 8 | 0.21 | 0.215 | |
| 12 | 0.11 | 0.302 | |
| 12 | 0.04 | 0.459 |
© 2019 by the authors. Licensee MDPI, Basel, Switzerland. This article is an open access article distributed under the terms and conditions of the Creative Commons Attribution (CC BY) license (http://creativecommons.org/licenses/by/4.0/).
Share and Cite
MDPI and ACS Style
Kapsis, T.T.; Lyras, N.K.; Kourogiorgas, C.I.; Panagopoulos, A.D. Time Series Irradiance Synthesizer for Optical GEO Satellite Downlinks in 5G Networks. Future Internet 2019, 11, 131. https://doi.org/10.3390/fi11060131
AMA Style
Kapsis TT, Lyras NK, Kourogiorgas CI, Panagopoulos AD. Time Series Irradiance Synthesizer for Optical GEO Satellite Downlinks in 5G Networks. Future Internet. 2019; 11(6):131. https://doi.org/10.3390/fi11060131
Chicago/Turabian StyleKapsis, Theodore T., Nikolaos K. Lyras, Charilaos I. Kourogiorgas, and Athanasios D. Panagopoulos. 2019. "Time Series Irradiance Synthesizer for Optical GEO Satellite Downlinks in 5G Networks" Future Internet 11, no. 6: 131. https://doi.org/10.3390/fi11060131
Note that from the first issue of 2016, this journal uses article numbers instead of page numbers. See further details here.