Article

No-Reference Depth Map Quality Evaluation Model Based on Depth Map Edge Confidence Measurement in Immersive Video Applications

1
Institute for Digital Technologies, Loughborough University London, London, E20 3BS, UK
2
Inmarsat, London, EC1Y 1AX, UK
*
Author to whom correspondence should be addressed.
Future Internet 2019, 11(10), 204; https://doi.org/10.3390/fi11100204
Submission received: 27 June 2019 / Revised: 2 September 2019 / Accepted: 16 September 2019 / Published: 20 September 2019

Abstract

:
When it comes to evaluating perceptual quality of digital media for overall quality of experience assessment in immersive video applications, typically two main approaches stand out: Subjective and objective quality evaluation. On one hand, subjective quality evaluation offers the best representation of perceived video quality assessed by the real viewers. On the other hand, it consumes a significant amount of time and effort, due to the involvement of real users with lengthy and laborious assessment procedures. Thus, it is essential that an objective quality evaluation model is developed. The speed-up advantage offered by an objective quality evaluation model, which can predict the quality of rendered virtual views based on the depth maps used in the rendering process, allows for faster quality assessments for immersive video applications. This is particularly important given the lack of a suitable reference or ground truth for comparing the available depth maps, especially when live content services are offered in those applications. This paper presents a no-reference depth map quality evaluation model based on a proposed depth map edge confidence measurement technique to assist with accurately estimating the quality of rendered (virtual) views in immersive multi-view video content. The model is applied for depth image-based rendering in multi-view video format, providing comparable evaluation results to those existing in the literature, and often exceeding their performance.

1. Introduction

Research into immersive video applications in the televised digital media domain has attracted growing attention in recent years. Such video applications include three-dimensional television (3DTV) [1] and free-viewpoint television (FTV) [2] with inclusive quality of experience (QoE) offering. Multi-view video (MVV) is a video format that allows for truly immersive user experiences with its support for navigating through multiple viewpoints in those immersive video applications [3]. However, the broadcast of high-quality MVV content stretches the bandwidth resource requirements significantly. Depth image-based rendering (DIBR) is used as a remedy to allow for creating virtual camera views at the receiver end, eliminating the need for transmitting a large number of real viewpoints [4]. Thus, the quality and accuracy of the information present in-depth maps and their ability to render the required views have become the subject of much greater scrutiny in multimedia research. Several challenges arise when assessing the quality of depth maps, such as the lack of a suitable reference for comparing the available depth maps, especially when it comes to live content.
In a typical 3DTV or FTV immersive video application, the lack of reference has a twofold effect: No reference for the resulting rendered colour views and no reference for the depth maps used in the rendering process. DIBR aims to render virtual views at locations where no original real view exists, i.e., completely new camera viewing angles, to enhance user QoE in these immersive video applications. This means that a rendered virtual view is at a different location (angle) with respect to any of the original colour views, which does not offer an accurate comparison if taken as a reference, as the two views contain different information of the same scene. An example of the original colour views and desired rendered virtual view locations are depicted in Figure 1.
Similarly, the lack of a suitable reference for a depth map corresponding to the rendered virtual colour view poses a challenge. Traditionally in computer vision applications, evaluation of the accuracy of depth maps has been performed using high precision “ground truth” depth maps as a reference [5,6]. These are very accurate representations of the 3D geometry information of their associated colour views. The presence of a ground truth depth map provides a reliable measure of the accuracy of the depth maps produced through depth/disparity (stereo-matching) algorithms [7,8,9,10,11,12]. However, ground truth depth maps are very complex and time-consuming to produce and are only viable when the scene in view is controlled in terms of size and depth. They are not easily accessible for high-quality natural scenes. Further, ground truth depth maps cannot be produced for live broadcast containing high-quality and dynamic content scenes that are typically used in 3DTV/FTV immersive video applications.
As the quality of the overall rendered views is also dictated by the contribution of their depth component, the quality of the depth maps utilised in the rendering process is a significant parameter for attention. Thus, this paper presents a no-reference depth map quality evaluation model based on a proposed depth map edge confidence measurement technique to assist with accurately estimating the quality of rendered (virtual) views in immersive multi-view video content. The rest of the paper is organised as follows. The second section introduces the background and related work. The third section focuses on the methods used to develop the depth map quality evaluation model. The fourth section presents the results obtained from the tests conducted using this newly developed model. The fifth section discusses the presented results in detail, while the sixth section concludes the paper.

2. Background and Related Work

2.1. Background

Video quality evaluation has been an active research topic for a while. From a users’ perspective, it is key to determine the impact of immersive video applications on the perceived QoE related to the videos consumed by the users of such applications. Signal processing applied on digital video, conversion of videos from one type to another, compression of videos for transmission purposes and errors introduced in the transmission process itself are some of the factors that have an impact on the quality of video signals, and thus, on the user QoE. Traditionally, evaluation of processed video quality has been carried out through subjective assessments, where the processed videos are displayed to a group of observers for recording their opinion on the perceived quality [13].
Although this subjective approach to video quality evaluation offers very representative observer opinion scores, it is a very tedious, time and effort consuming process. This may lead to negative effects on the development and enhancement of emerging immersive video applications and services. Video quality evaluation metrics define a link between physical parameters of the video and perceived video quality [14]. Objective quality assessment for conventional 2D video signals has been a focus of research for quite a long period. However, these assessment methods have not considered artefacts introduced by the new video processing techniques, such as the disocclusion artefacts introduced by the DIBR process in 3D immersive video rendering and viewing.
Recent developments in video quality evaluation research, particularly targeting 3D immersive video applications [15,16,17,18,19,20,21,22,23], provided an insight into building a reliable relationship between the objective measures and their predicted subjective counterparts without having to conduct long and tedious subjective tests. These research activities investigated predicting subjective measurement using full, reduced (partial) or no-reference evaluation methods. Our work solely focuses on no-reference quality evaluation for immersive video applications, such as 3DTV or FTV, as discussed with reasons in the previous section. Thus, the next section distils the related work into this particular topic of research interest.

2.2. Related Work on Conventional Approaches in No-Reference Quality Evaluation

In the past decade, research interest in no-reference quality evaluation has steadily grown with the introduction of a number of approaches in the literature. An approach that utilises natural scene statistics (NSS) is presented in [24] to blindly measure the quality of images compressed by wavelet-based image encoders. This work consists of using a non-linear statistical model that incorporates quantisation distortion modelling (by considering JPEG2000 compression distortions) to develop an algorithm that quantifies the deviation of compressed signals from the expected natural behaviour. This quantification was calibrated against the human judgement of video/image quality.
In many cases, earlier evaluation methods assumed that the types of video/image distortions were known, such as compression or blurred distortions. A two-step general-purpose framework approach is proposed in [25,26] for no-reference image quality evaluation based on the NSS model of images. The proposed framework’s two stages can be identified as an image distortion classification that is based on the modification of the NSS, which is followed by the selection of a distortion specific algorithm. The framework measures the image quality completely blindly, i.e., without any prior information on the type of source distortions.
A no-reference quality evaluation technique, which does not consider any specific type of distortions, is proposed in [27], where the image quality is assessed through scene statistics of locally normalised luminance coefficients to quantify the loss of naturalness in the processed image. The evaluation takes place in the spatial domain to identify the amount of loss in image naturalness through features derived from the empirical distribution of locally normalised luminance values.
A natural image quality evaluator (NIQE) proposed in [28] is described as a completely blind image quality analyser. The NIQE utilises measurable deviations from the statistical regularities observed in natural images without training on human-rated distorted images. This approach is advantageous when distorted images and human assessment of these distortions are not available during the quality evaluation model training and development.
An image sharpness assessment based no-reference quality evaluation is presented in [29], where the image sharpness is identified as a strong local phase coherence (LPC) near distinctive image features evaluated in the complex wavelet transform domain. This work also presents a further simplification of the LPC computation through an efficient algorithm, rendering the computation as attractive and applicable in practical applications.
A no-reference quality evaluation approach based on spatial and spectral entropies is proposed in [30]. This approach uses entropy as an effective measure of the amount of information present in an image. It utilises down-sampled responses as inputs, then extracts local entropy feature vectors from the inputs and learns to predict the image quality scores from these features. The complexity of this method was said to be superior to similar approaches with improved quality assessment results.
No-reference approach adopted whilst developing our proposed quality evaluation model is different from the conventional approaches of no-reference quality assessment methods as introduced above. While those conventional methods are blindly assessing the quality of colour views directly without taking much into account the depth dimension, our proposed model provides the quality measure indirectly by assessing the quality of the depth map used in the rendering process, as presented in the methods section next.

3. Methods

This section presents the methods used to develop our proposed no-reference depth map quality evaluation model aimed to provide an accurate estimation of the quality of rendered (virtual) views in immersive multi-view video content. The section first elaborates on the proposed model development in two steps. First, edge detection is performed on the input DIBR views, leading to a new depth map edge confidence measure computation. This is then followed by building a model based subjective quality prediction mechanism. All of these constitute the core of the proposed no-reference depth map quality evaluation model presented in this work, as illustrated in Figure 2. Subsequently, the dataset and test methods employed in the evaluations are presented in the section.

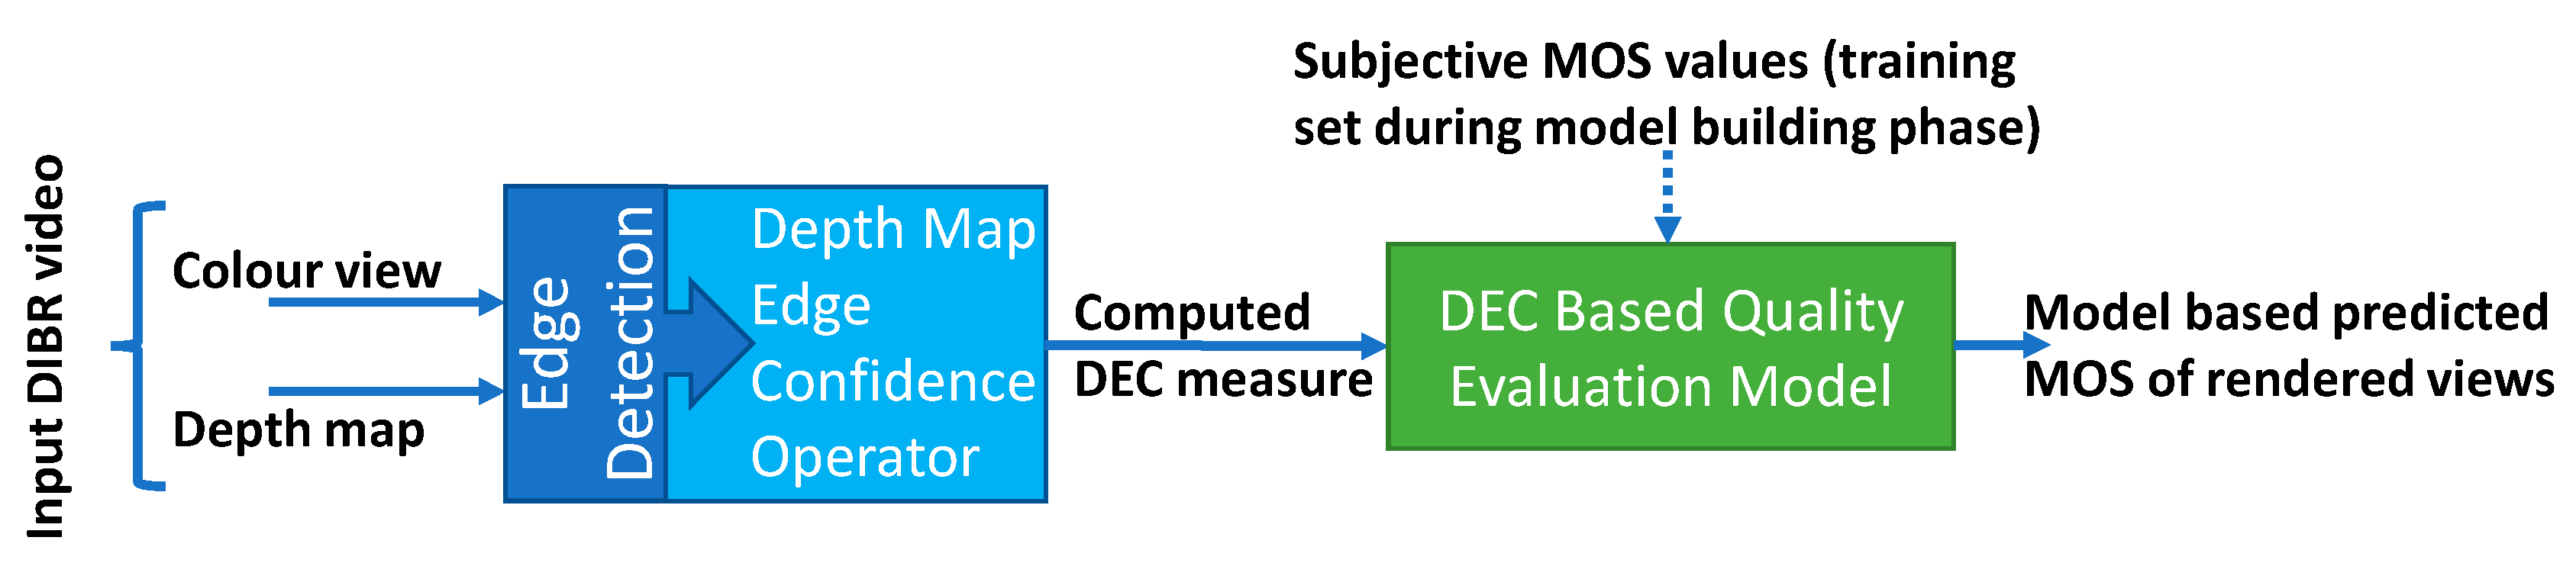
3.1. Proposed No-Reference Depth Map Quality Evaluation Model

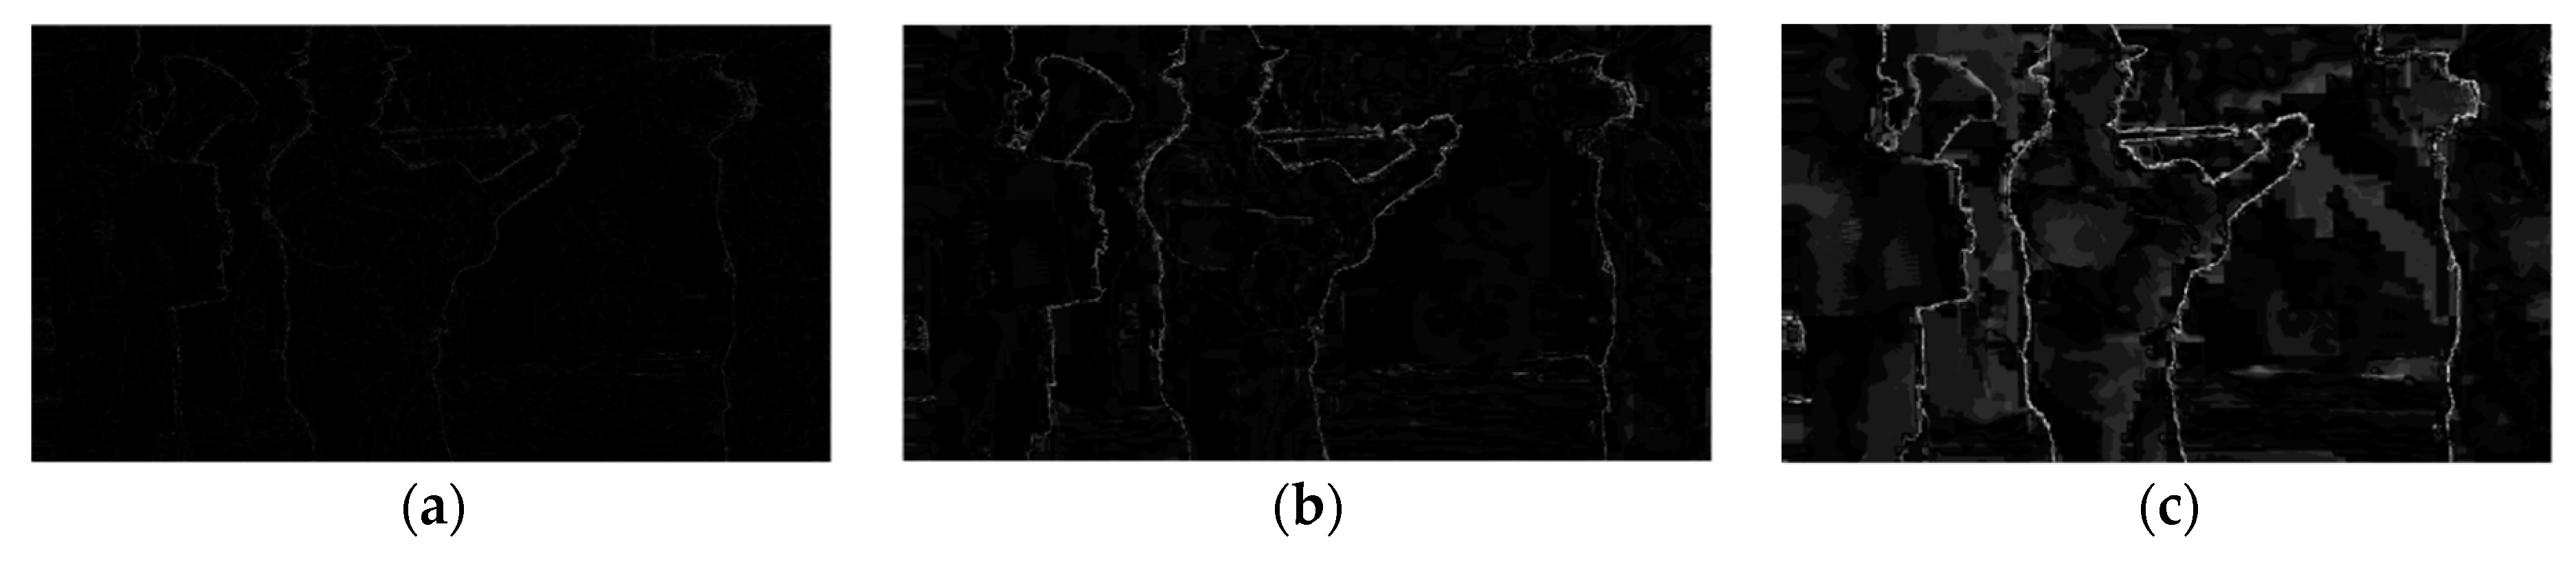
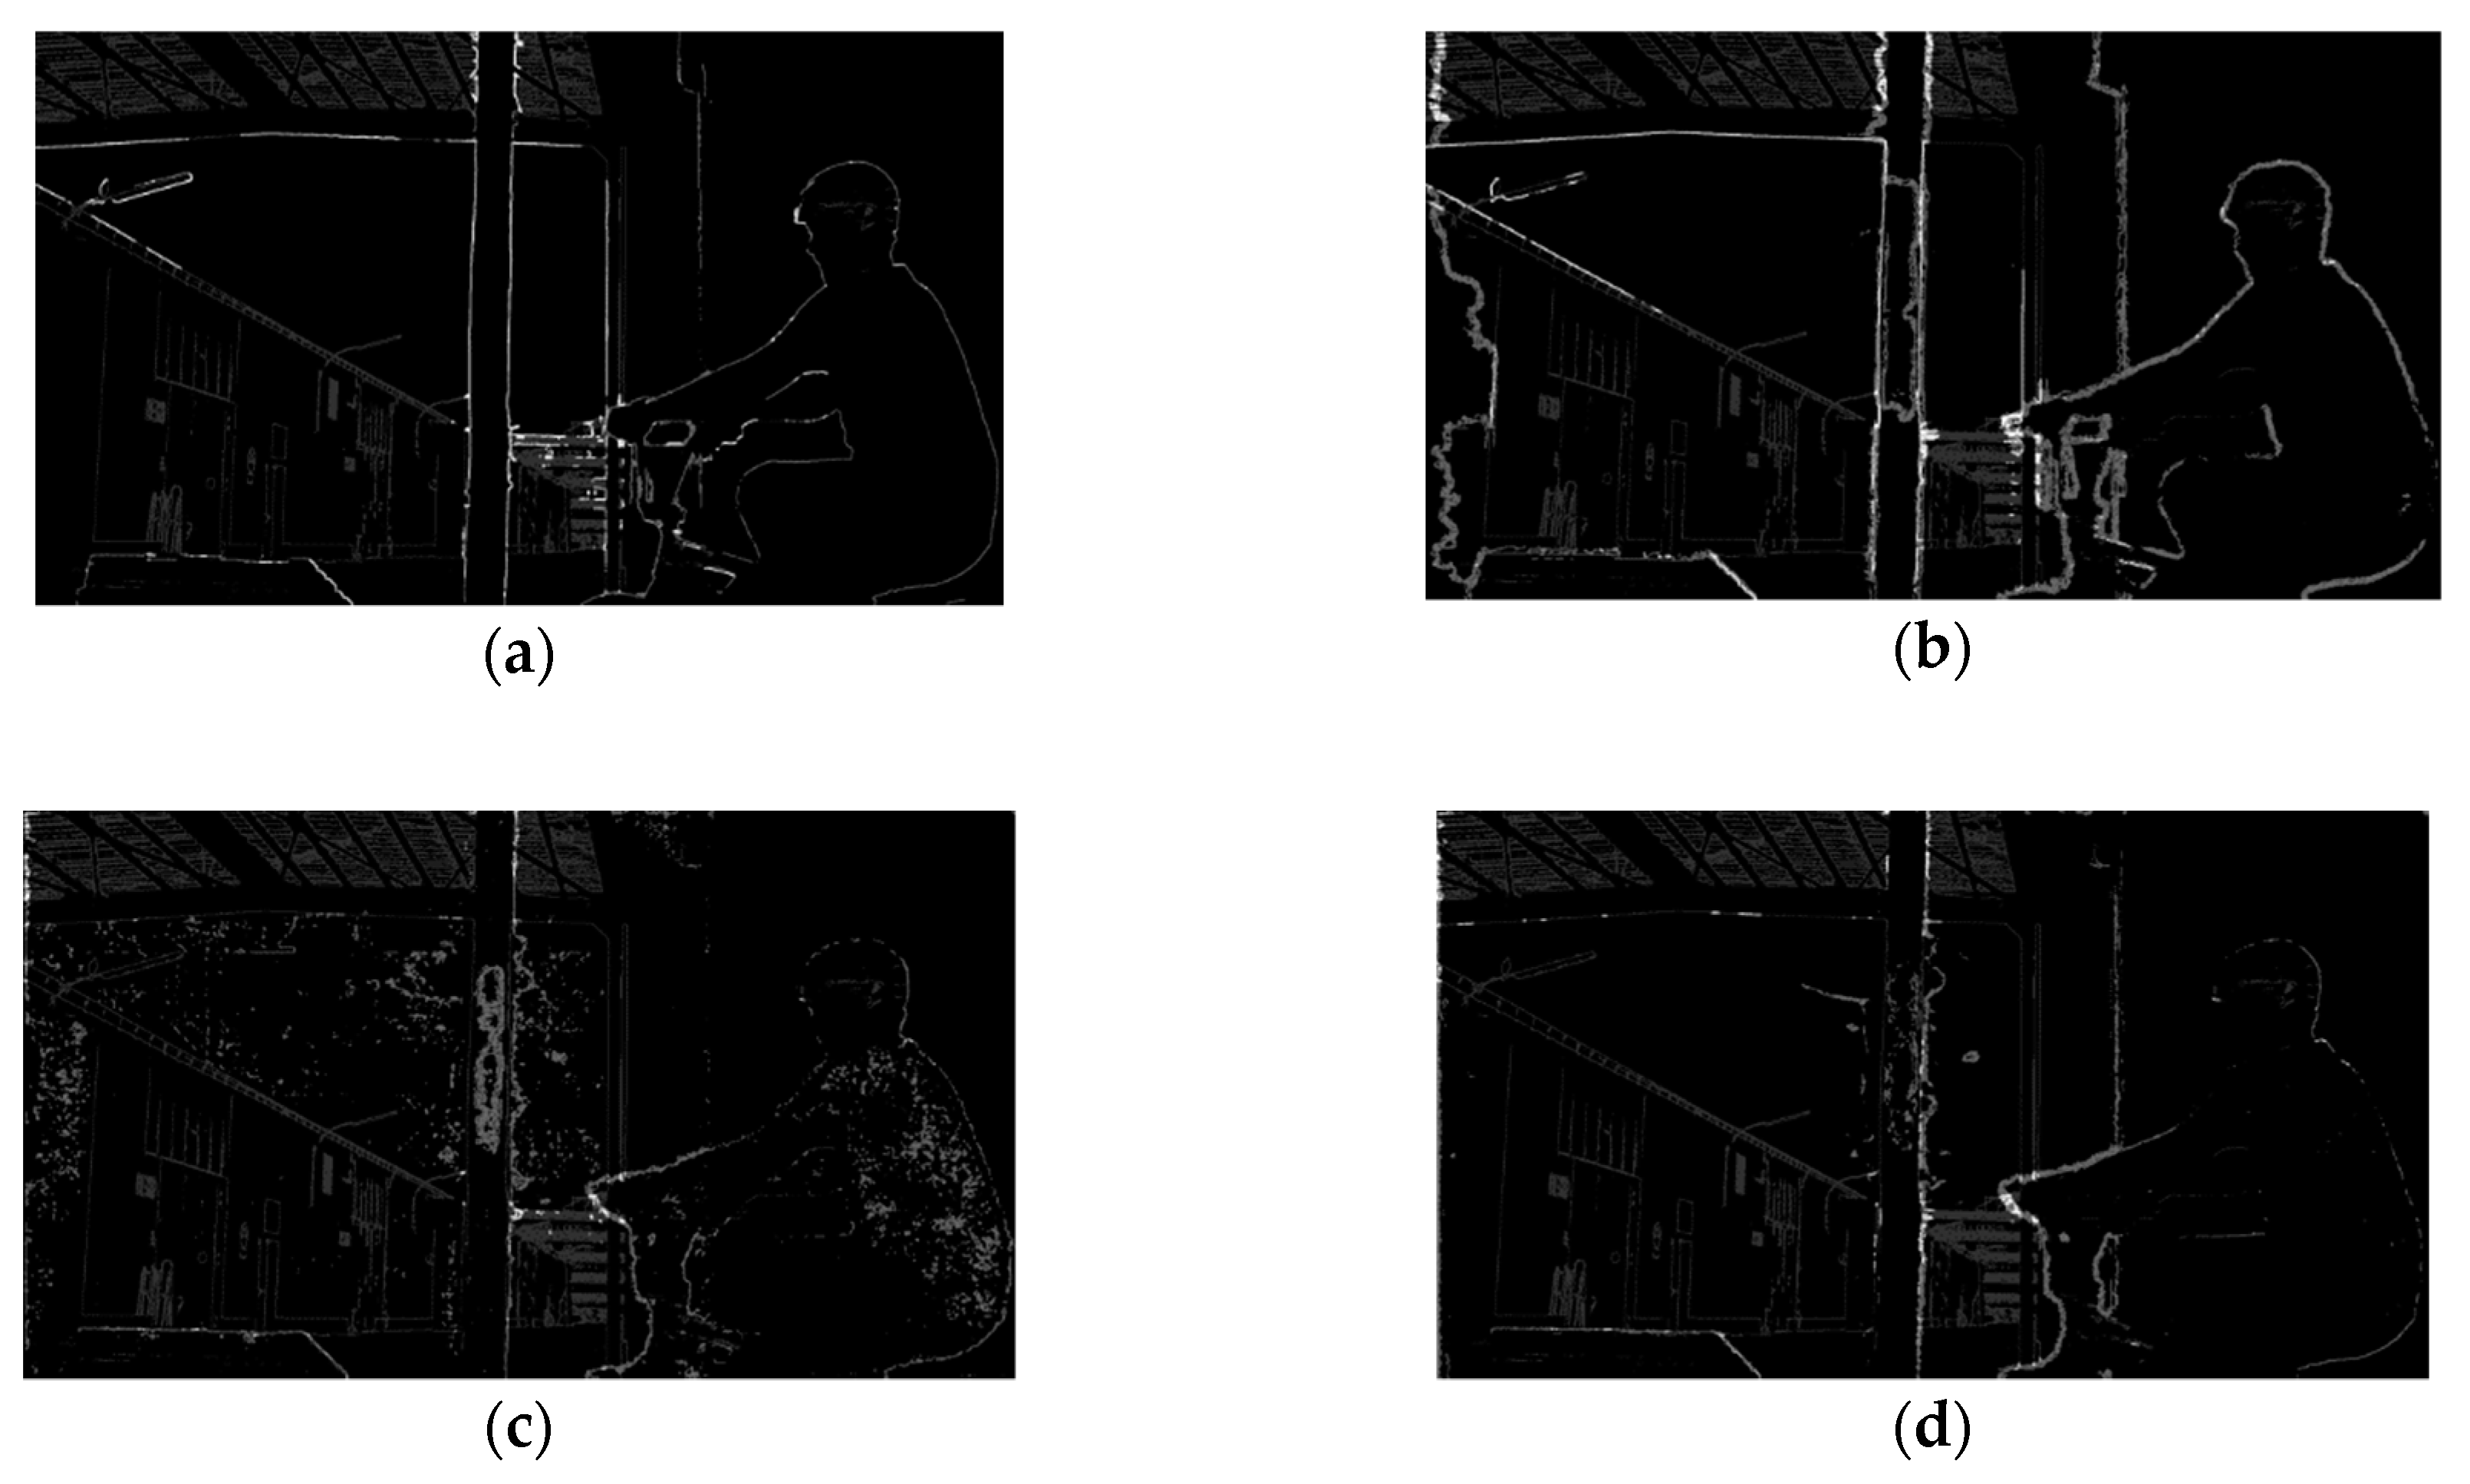
3.1.1. Depth Map Edge Confidence Measure

Conventional no-reference quality evaluation methods assess the quality of the rendered colour views primarily when DIBR is used. Contrary to this, the approach adopted in our research focuses on evaluating the quality of the depth maps used in the rendering process in scenarios where there is no real reference to evaluate their quality for immersive video applications. Our proposed model targets building a measure to quantify the edge confidence in the depth maps used in rendering the views through DIBR.
To achieve this, we have conducted several experiments where we introduced errors through varying levels of compression into the depth maps used in the rendering process. As a result of this initial experimentation, a difference map comparing the various compressed depth maps with the original one provided a good indication of the errors introduced into the depth maps. It was then observed that the highest level of error in the compressed depth maps was concentrated around the edges within a depth map, which motivated for devising a depth map edge confidence measure.
Figure 3 presents the difference maps obtained from comparing the depth maps, compressed at quality parameter (QP) levels of 22, 32 and 42, with the original depth map for the Musicians colour sequence. These QPs broadly represent high quality (low compression), medium quality (medium compression) and low quality (high compression) levels, respectively. The errors in the difference maps appear at varying luminance levels. The brighter the luminance values, the larger the difference for each pixel between the compared depth maps (i.e., the higher the error occurring, due to compression) at the corresponding locations. It can be noticed that the errors increase with the higher compression levels. The brighter luminance values at all compression levels occur on the edges in the depth maps, which represent notable changes in-depth values (i.e., different depth planes) rather than edges of objects within a colour view. The errors in these areas have a significant impact on the quality of the overall view rendered utilising the particular depth map. This observation reinforces the depth map edge confidence approach, which is a clear indication of the quality of the depth map. The results in Figure 3 have been obtained via comparison between a selected depth map and its compressed versions. This scenario is useful for computing the depth map edge confidence for the compressed versions, but this cannot be the case if the edge confidence is required for the original depth map, where reference depth map is not available.
To compute the edge confidence for a stand-alone depth map without a reference, an edge detection process is applied for both the depth map and its associated colour view, which results in building an edge confidence map. The per-pixel edge confidence map outlines the significant edge information contained in both the depth map and corresponding colour view. Subsequent to the edge detection process (based on the Sobel operator) applied on both the depth map and colour video component, the edge confidence map is constructed.
The detected edge information is classified under three groups by different intensity values in the resulting confidence map. The first group comprises the pixels that are classified as edges in both the colour view and depth map. The second group consists of the pixels that are classified as edges only in the colour view and the third group consists of the pixels that are classified as edge pixels only in the depth map. The rest of the pixels are not classified as an edge in either the depth map or the associated colour view. Figure 4 presents examples of the resulting edge confidence maps for a selection of depth maps utilised for rendering the BMX colour sequence.
The edge confidence measure operates on the principle that if a pixel is classified as an edge in the depth map, but not as an edge in the corresponding colour view, this pixel most likely indicates an error. The total number of depth-only edge pixels is divided by the total number of edge pixels in the corresponding colour view to provide a confidence rating, which points at the level of edge errors that exist in the depth map. This edge confidence calculation is performed for each frame of the available depth map dataset. This measurement is referred to as the depth edge confidence (DEC) measurement in this research and is utilised in developing the proposed no-reference quality evaluation model.

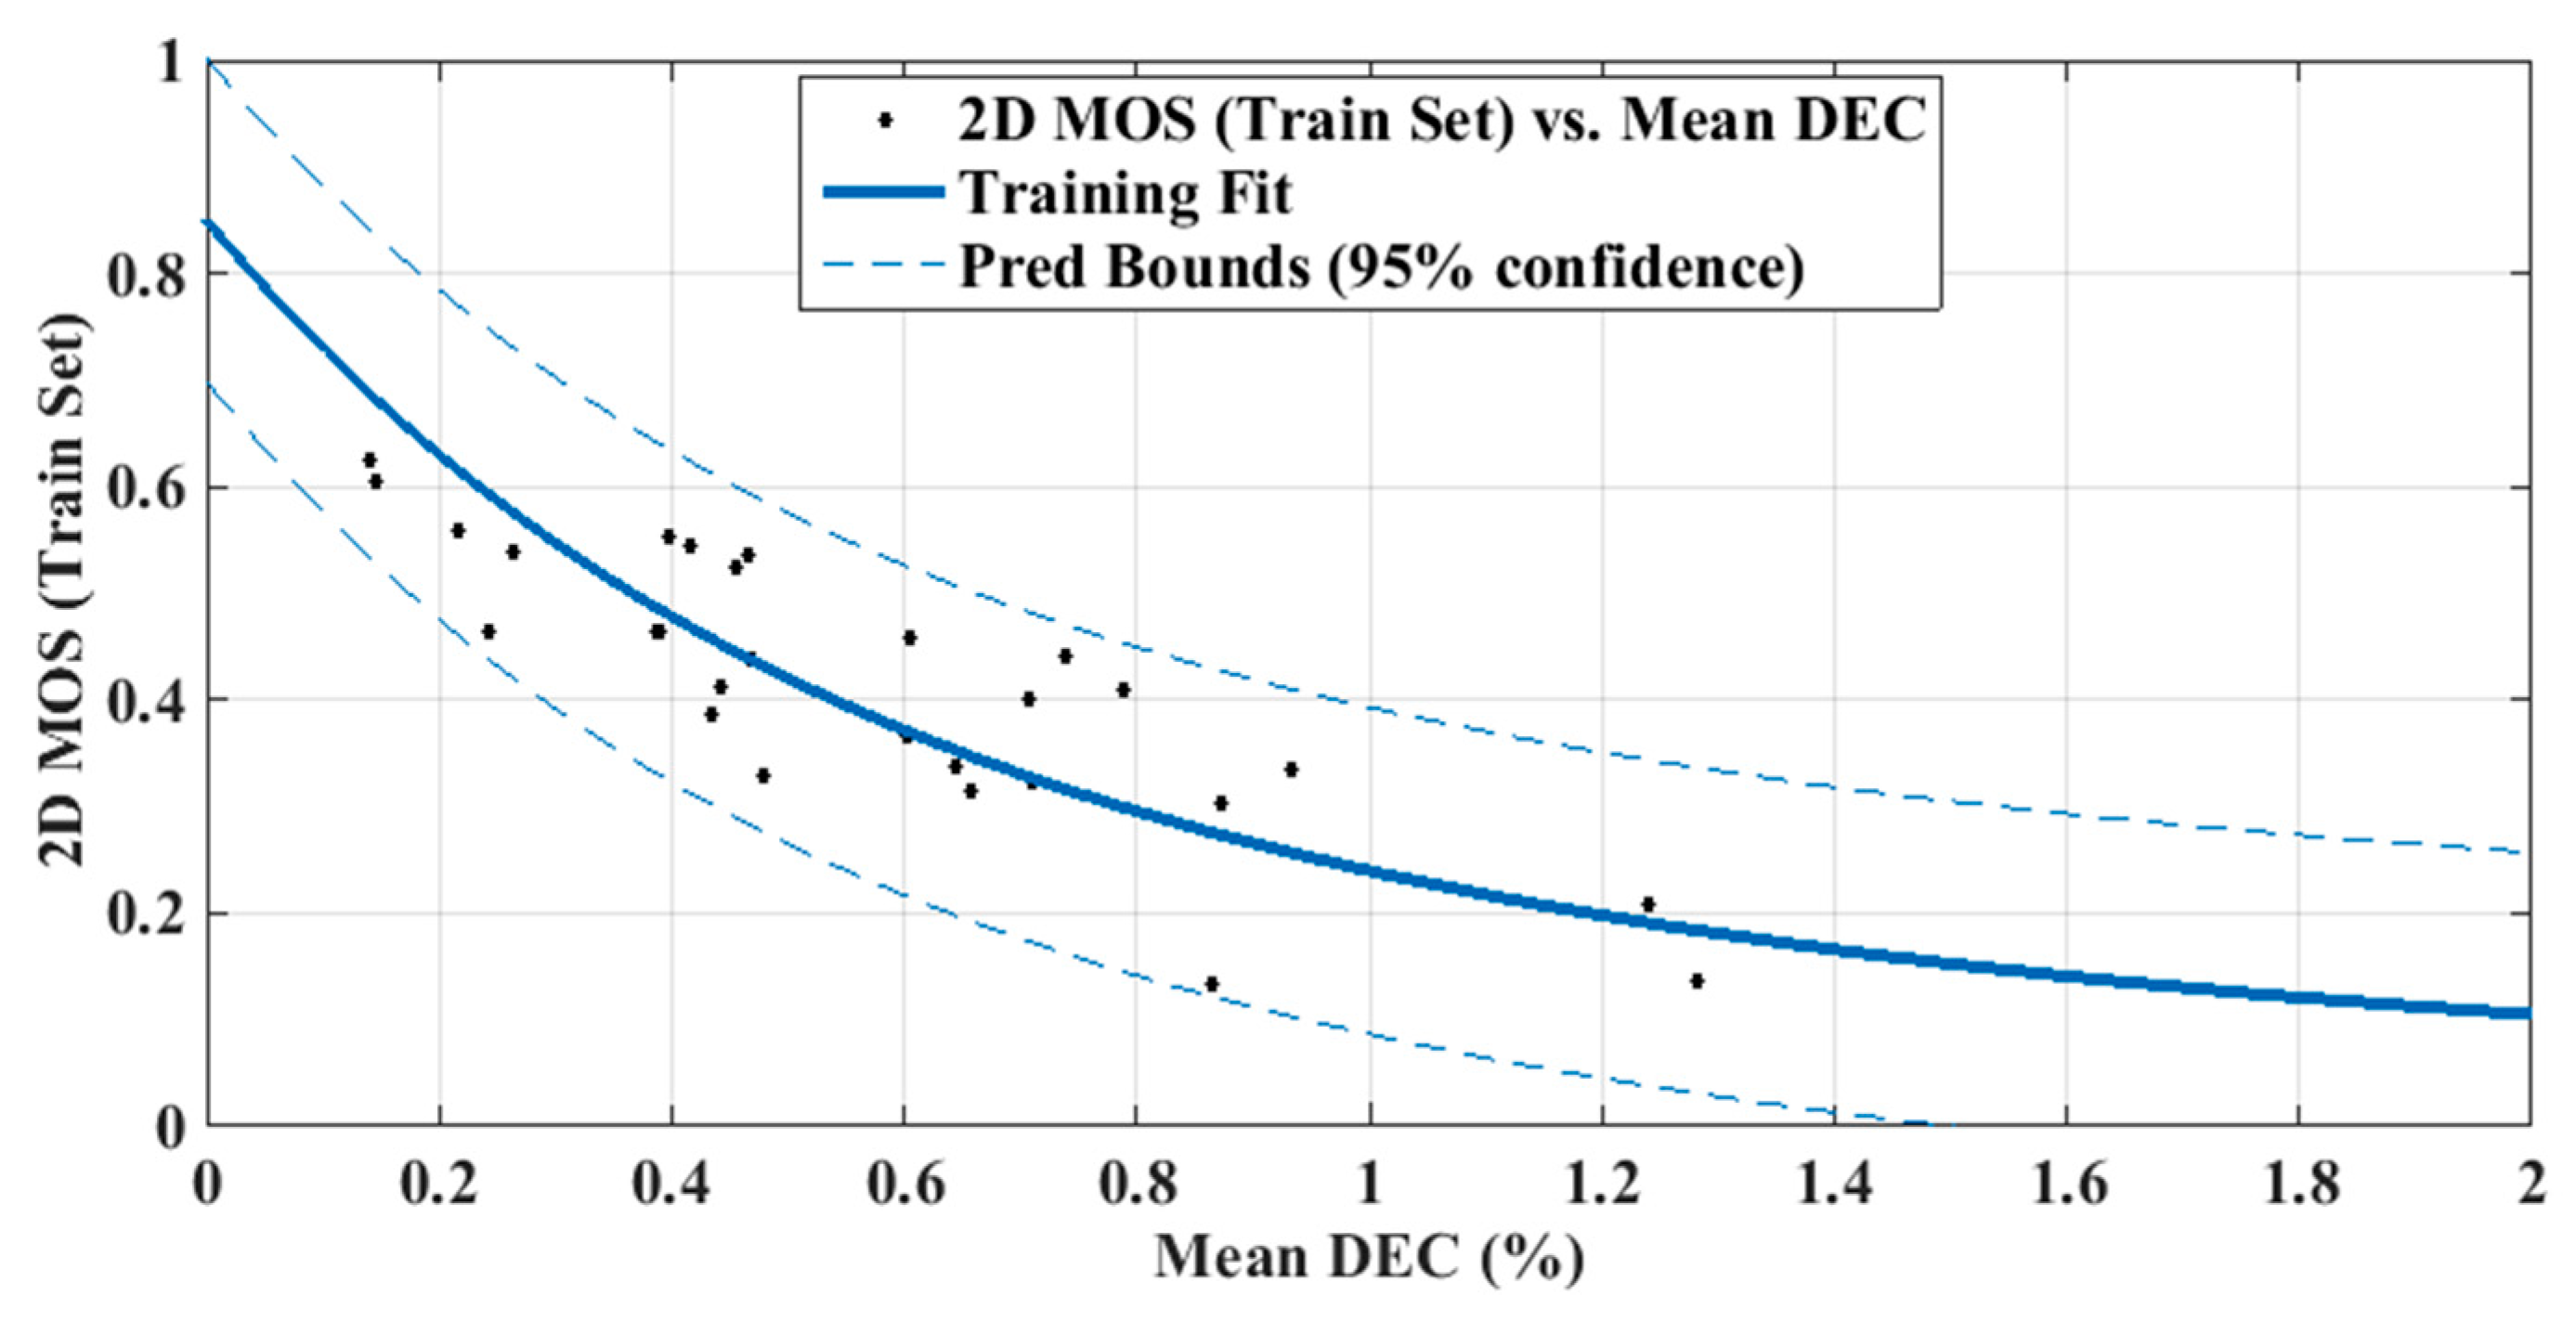
3.1.2. DEC Measurement-Based No-Reference Quality Evaluation Model
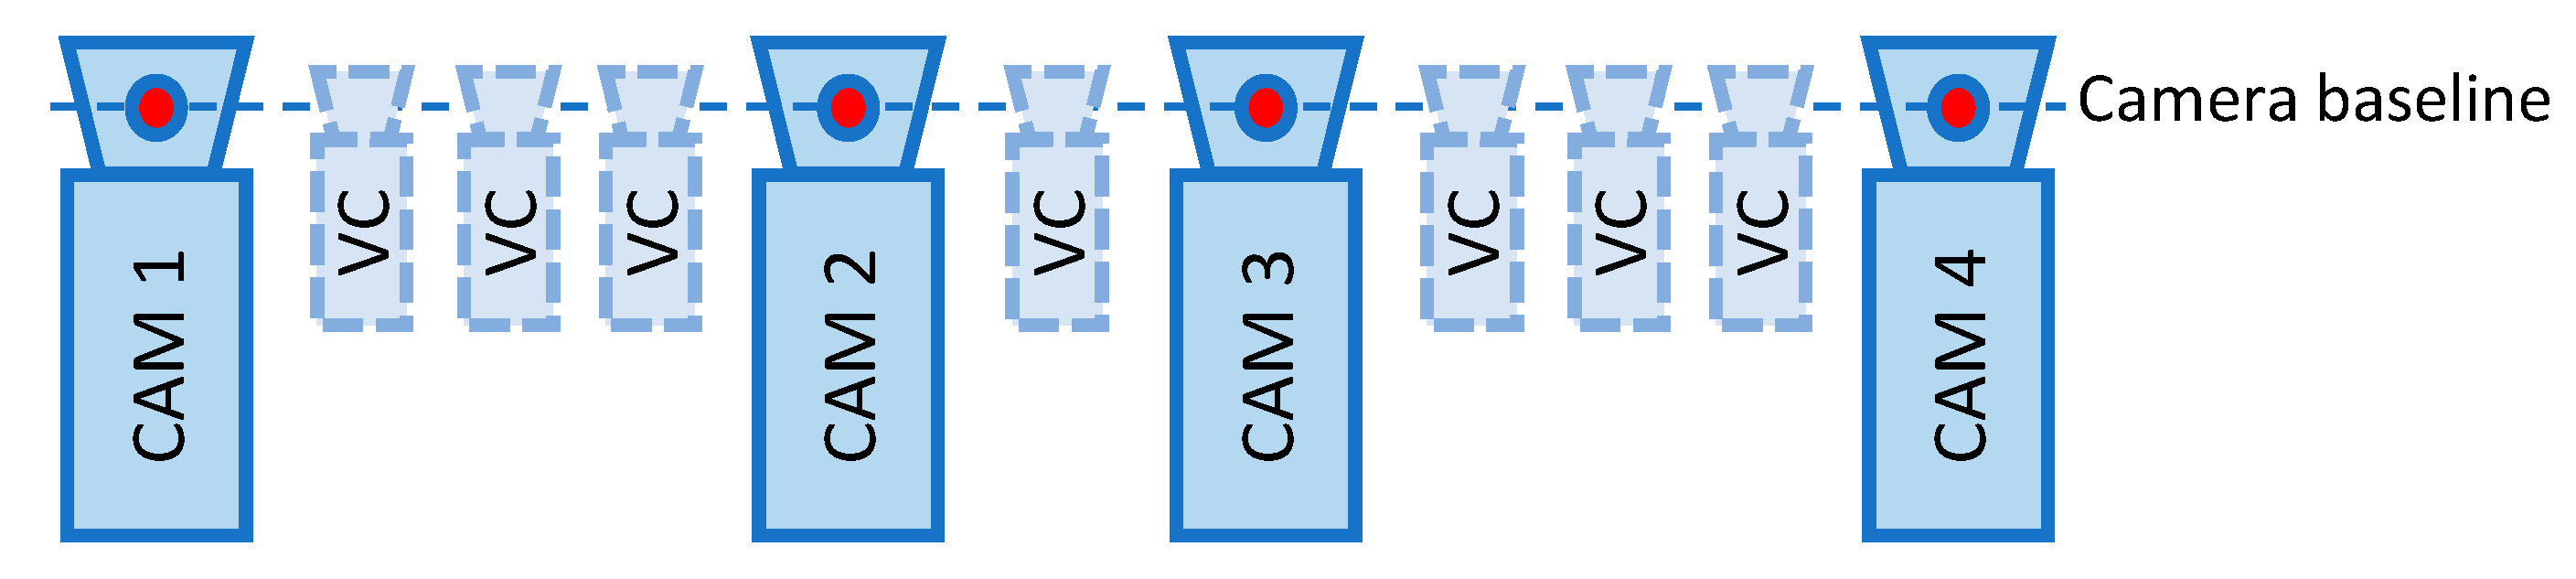
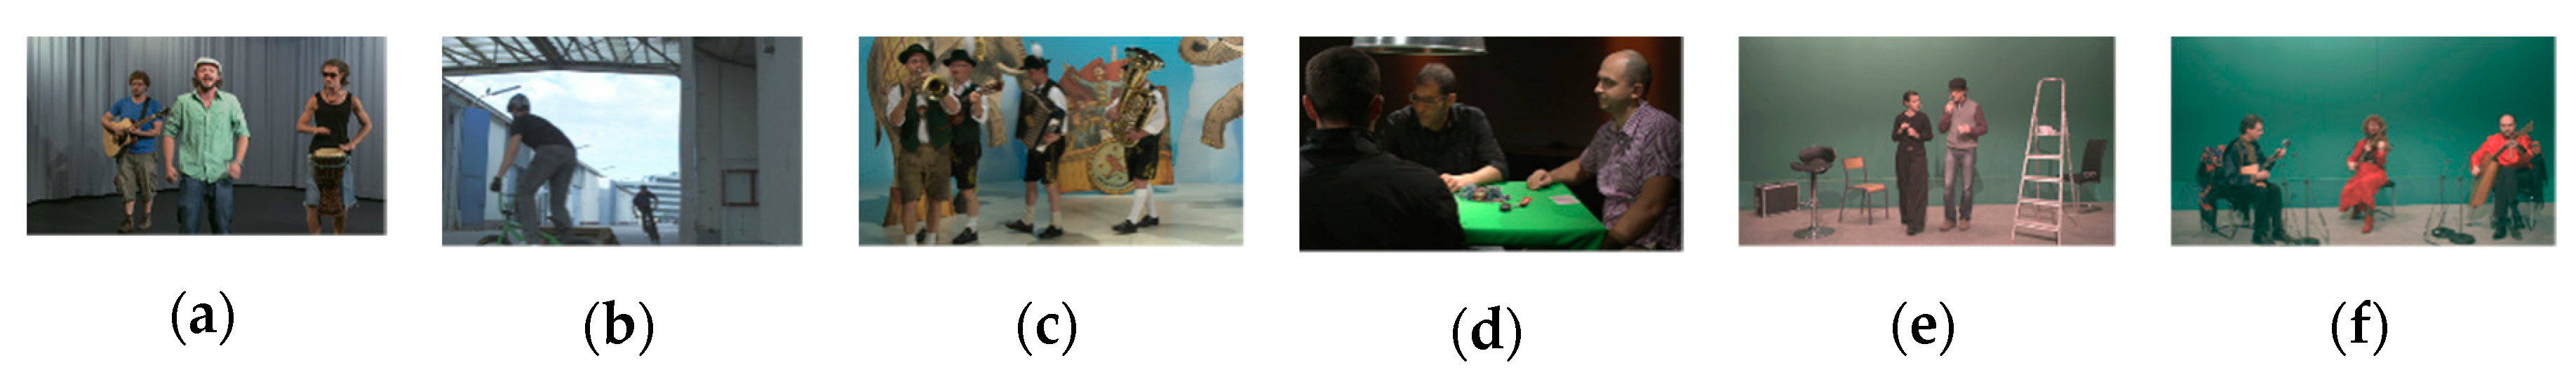
The proposed DEC measurement-based quality evaluation model has been developed using a curve-fitting operation. The target of this operation is to exhaustively search and find a mathematical model that can best represent the mean opinion score (MOS) values recorded for the rendered views during subjective testing with respect to the obtained DEC measurement of the depth maps used in rendering those views.
For the purpose of developing this mathematical representation, the 2D video subjective assessment results presented in Section 4.1 are utilised. The 2D MOS values are divided equally (at a 50%-50% fraction) into two sets: A training, and a testing set, respectively. The aim of dividing these MOS results into two halves is twofold: First to utilise the training set to develop the proposed quality evaluation model through dataset training on one half of the dataset only, and then to independently employ the testing set to assess the performance of the established model on the remaining half. In turn, this ensures obtaining results with dataset independence. The mean value (measured over the total number of frames per video test sequence) was calculated with respect to the DEC measure for each of the corresponding depth maps.
Several mathematical models were examined by performing the curve-fitting process to identify the best matching mathematical relation between the 2D MOS results with the equivalent mean DEC measurement values. The results were classified in terms of correlation coefficient (CC), and root mean square error (RMSE) values. The curve-fitting operation was performed with the prediction bounds set within a 95% confidence interval. From the several curve-fitting steps tested, the top-performing equation was selected for constructing the DEC measurement-based model, and the constant parameters of the model were tuned to produce the maximum correlation for the training set. The resulting graph for the selected model obtained from the curve-fitting process is depicted in Figure 5.
The resulting model from the curve-fitting process between the 2D MOS and corresponding mean DEC measurement values is represented by the following equation:
Y = a/(X2 + bX + c),
where Y is the model’s output MOS value for the rendered view; X is the mean DEC value for the depth map used in rendering the view; and a, b and c are the constant coefficients equal to 0.85, 1.544 and 1, respectively.

3.2. Dataset

A total of six multi-view plus depth (MVD) video sequences have been used in this research, produced using a multi-camera setup for colour views with the associated depth maps available for all real camera locations. The main advantage of using MVD within DIBR is that virtual (non-existing) views can be synthesised from the available reference viewpoints for the MVV format [36,37]. These sequences are namely: Band, BMX, Musicians, Poker, Act and Parisband, with samples depicted in Figure 6. The sequences are of full HD resolution at 25 fps and were captured by a camera rig, as shown in Figure 1. In this setup, the two centremost cameras (CAM 2 and CAM 3) were arranged with a 7~10 cm inter-camera distance between them, i.e., stereoscopic distance, while outer satellite cameras (CAM 1 and CAM 4) were at variable distances. Ten-second segments of the test sequences were used in the tests, which covered a range of scene texture complexities and diverse nature of motion content. During the tests, depth map quality variations have been both subjectively and objectively assessed, whose results were reported in our earlier work [38].

3.3. Test Setup

In this work, two further subjective depth map quality assessments were carried out to allow developing the proposed depth map quality evaluation model. They targeted testing the quality of the sequences rendered utilising a variety of depth maps available within both 2D and 3D video sets. Both subjective assessments were performed in line with the ITU-R guidelines [39,40].
The 2D video subjective depth map quality assessment sessions included 69 stimuli, shown in a random order to the observers during tests. Video sequences refer to the source video files viewed by the observers, while the stimuli are various versions of the processed video sequences displayed in subjective tests for observer evaluations. These stimuli were composed of 58 rendered videos (ten stimuli for each of the Band, BMX, Musicians and Poker sequences and nine stimuli each for the Act and Parisband sequences). The six original colour video sequences (at camera location CAM 3) were also included in addition to five stabilising sequences, which were randomly chosen from the existing 58 rendered videos and inserted at the beginning of the test session. The role of the stabilising sequences was to familiarise the observers with the nature of video material that will be presented in the assessment session, so as to stabilise any potential variations in their voting pattern for the remainder of the test. The scores recorded for the stabilising sequences were discarded later. In the 3D video depth map quality assessment session, the stimuli were the same rendered views as in the 2D session together with the original view (at camera position CAM 2) arranged as side-by-side stereoscopic pairs. The stabilising sequences were the stereoscopic version of the same set selected for the 2D session. For both subjective assessments, the video sequences were shown for a duration of ten seconds each with a greyscale background separation shown between sequences.
Eighteen female/male observers, with an age range of 18–42 years old, took part in both the 2D and 3D subjective quality assessments. They were asked to rate the observed overall video perception quality in each of the assessment tests for the range of stimuli, as discussed above. The single stimulus method was used for all the test sessions where the original sequences at the rendered locations were also used as hidden references. A continuous quality grading scale (from 0 to 100 with adjective categories: 0–20: Bad; 21–40: Poor; 41–60: Fair; 61–80: Good; 81–100: Excellent) was used to record the opinions of the observers. A 47″ LG Full HD LED display was used to conduct the tests with passive polarised glasses for carrying out 3D assessments. The viewing distance was set to 2.5 m, which complies with the preferred viewing distance [39,40].

4. Results

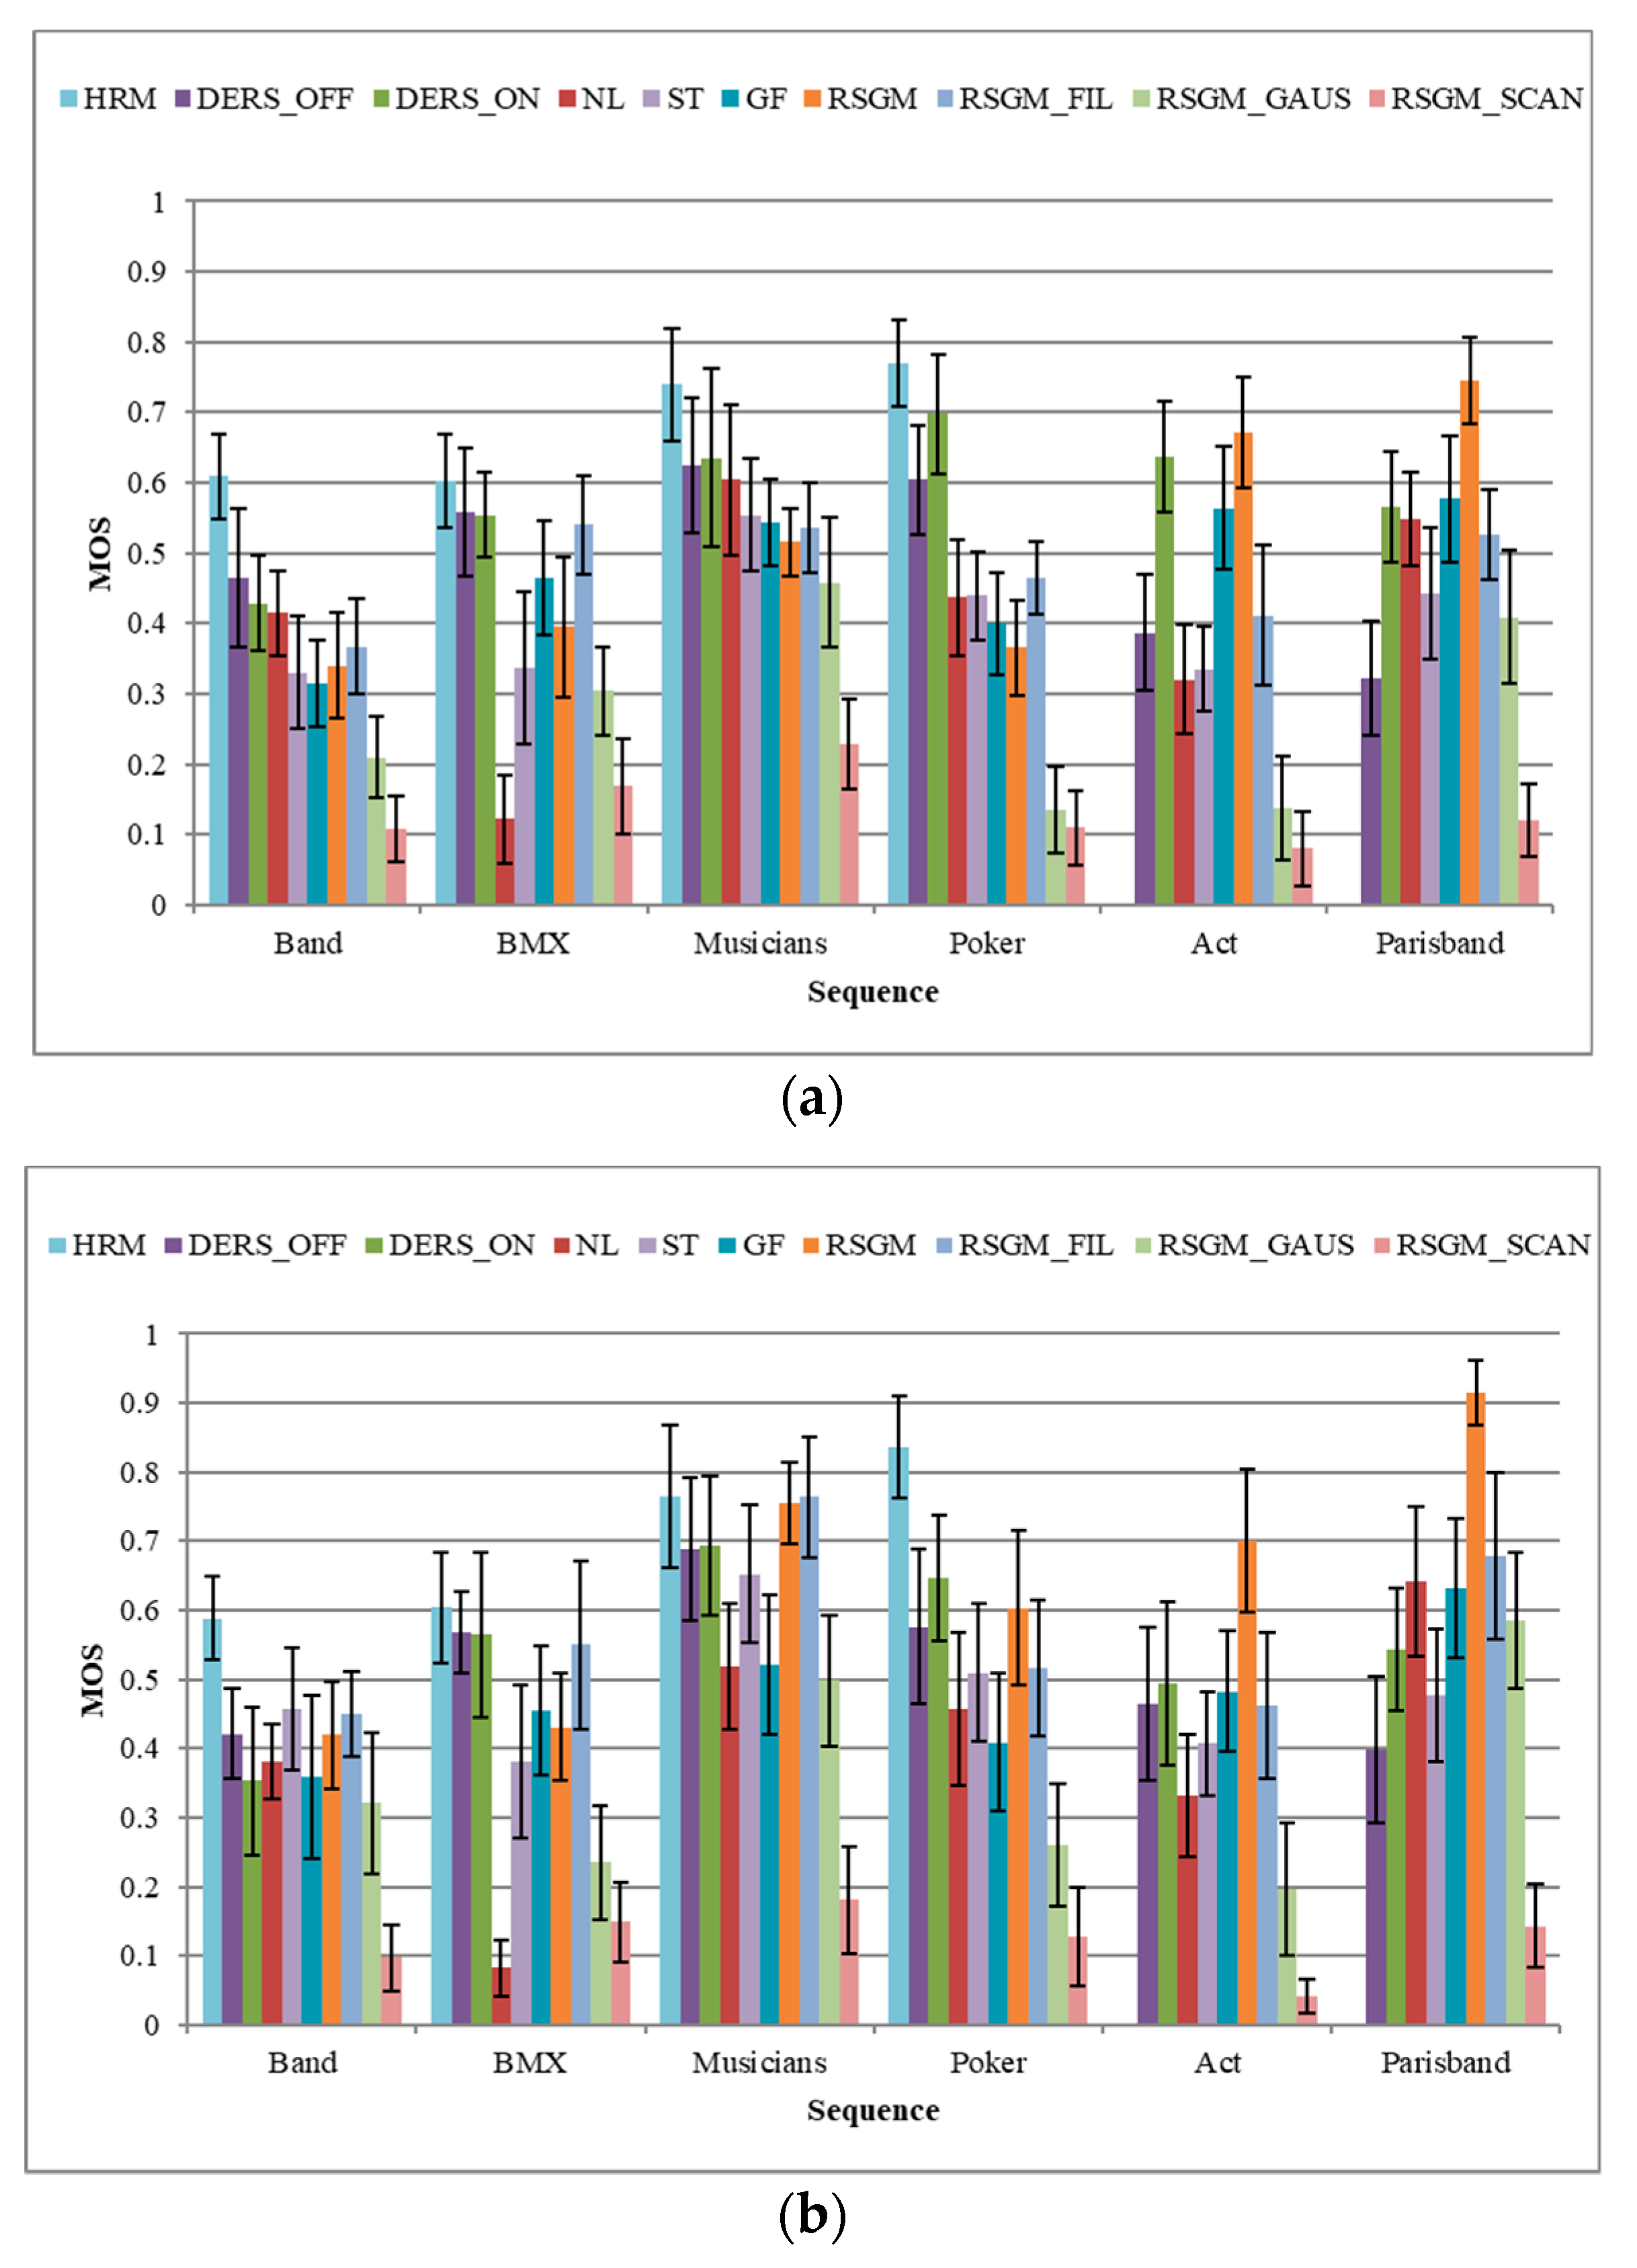
4.1. Initial Test Results

Figure 7 presents the depth map quality MOS results for both the 2D and 3D video subjective assessments together with their 95% confidence intervals. The series (as seen in the legend) in both charts represent the depth map utilised for rendering the virtual view at camera location CAM 3 for each sequence. It is worth noting that the MOS values for the hybrid recursive matching (HRM) based depth map are not present for the Act and Parisband sequences, as the corresponding depth maps were not available for these sequences.
From the results presented in Figure 7, the following observations can be made. Firstly, neither graph shows any significant changes in the MOS patterns between the 2D and 3D results. This observation indicates that the depth maps utilised in the rendering process have not resulted in rendered views that contain parallax problems when utilised in a 3D viewing environment. Secondly, the results indicate that different depth maps utilised in rendering the views have a significant effect on the opinion scores as they vary greatly. Thirdly, it can be observed that the same depth map (i.e., same depth/disparity estimation algorithm) has a variable level of performance when utilised for rendering virtual views of different sequences. In other words, the content (i.e., spatiotemporal information) of the sequence can influence the performance of a specific depth map, and as such depth map rendering performance is dependent on the sequence utilised. These results and observations are used to develop our proposed depth map quality evaluation model next.

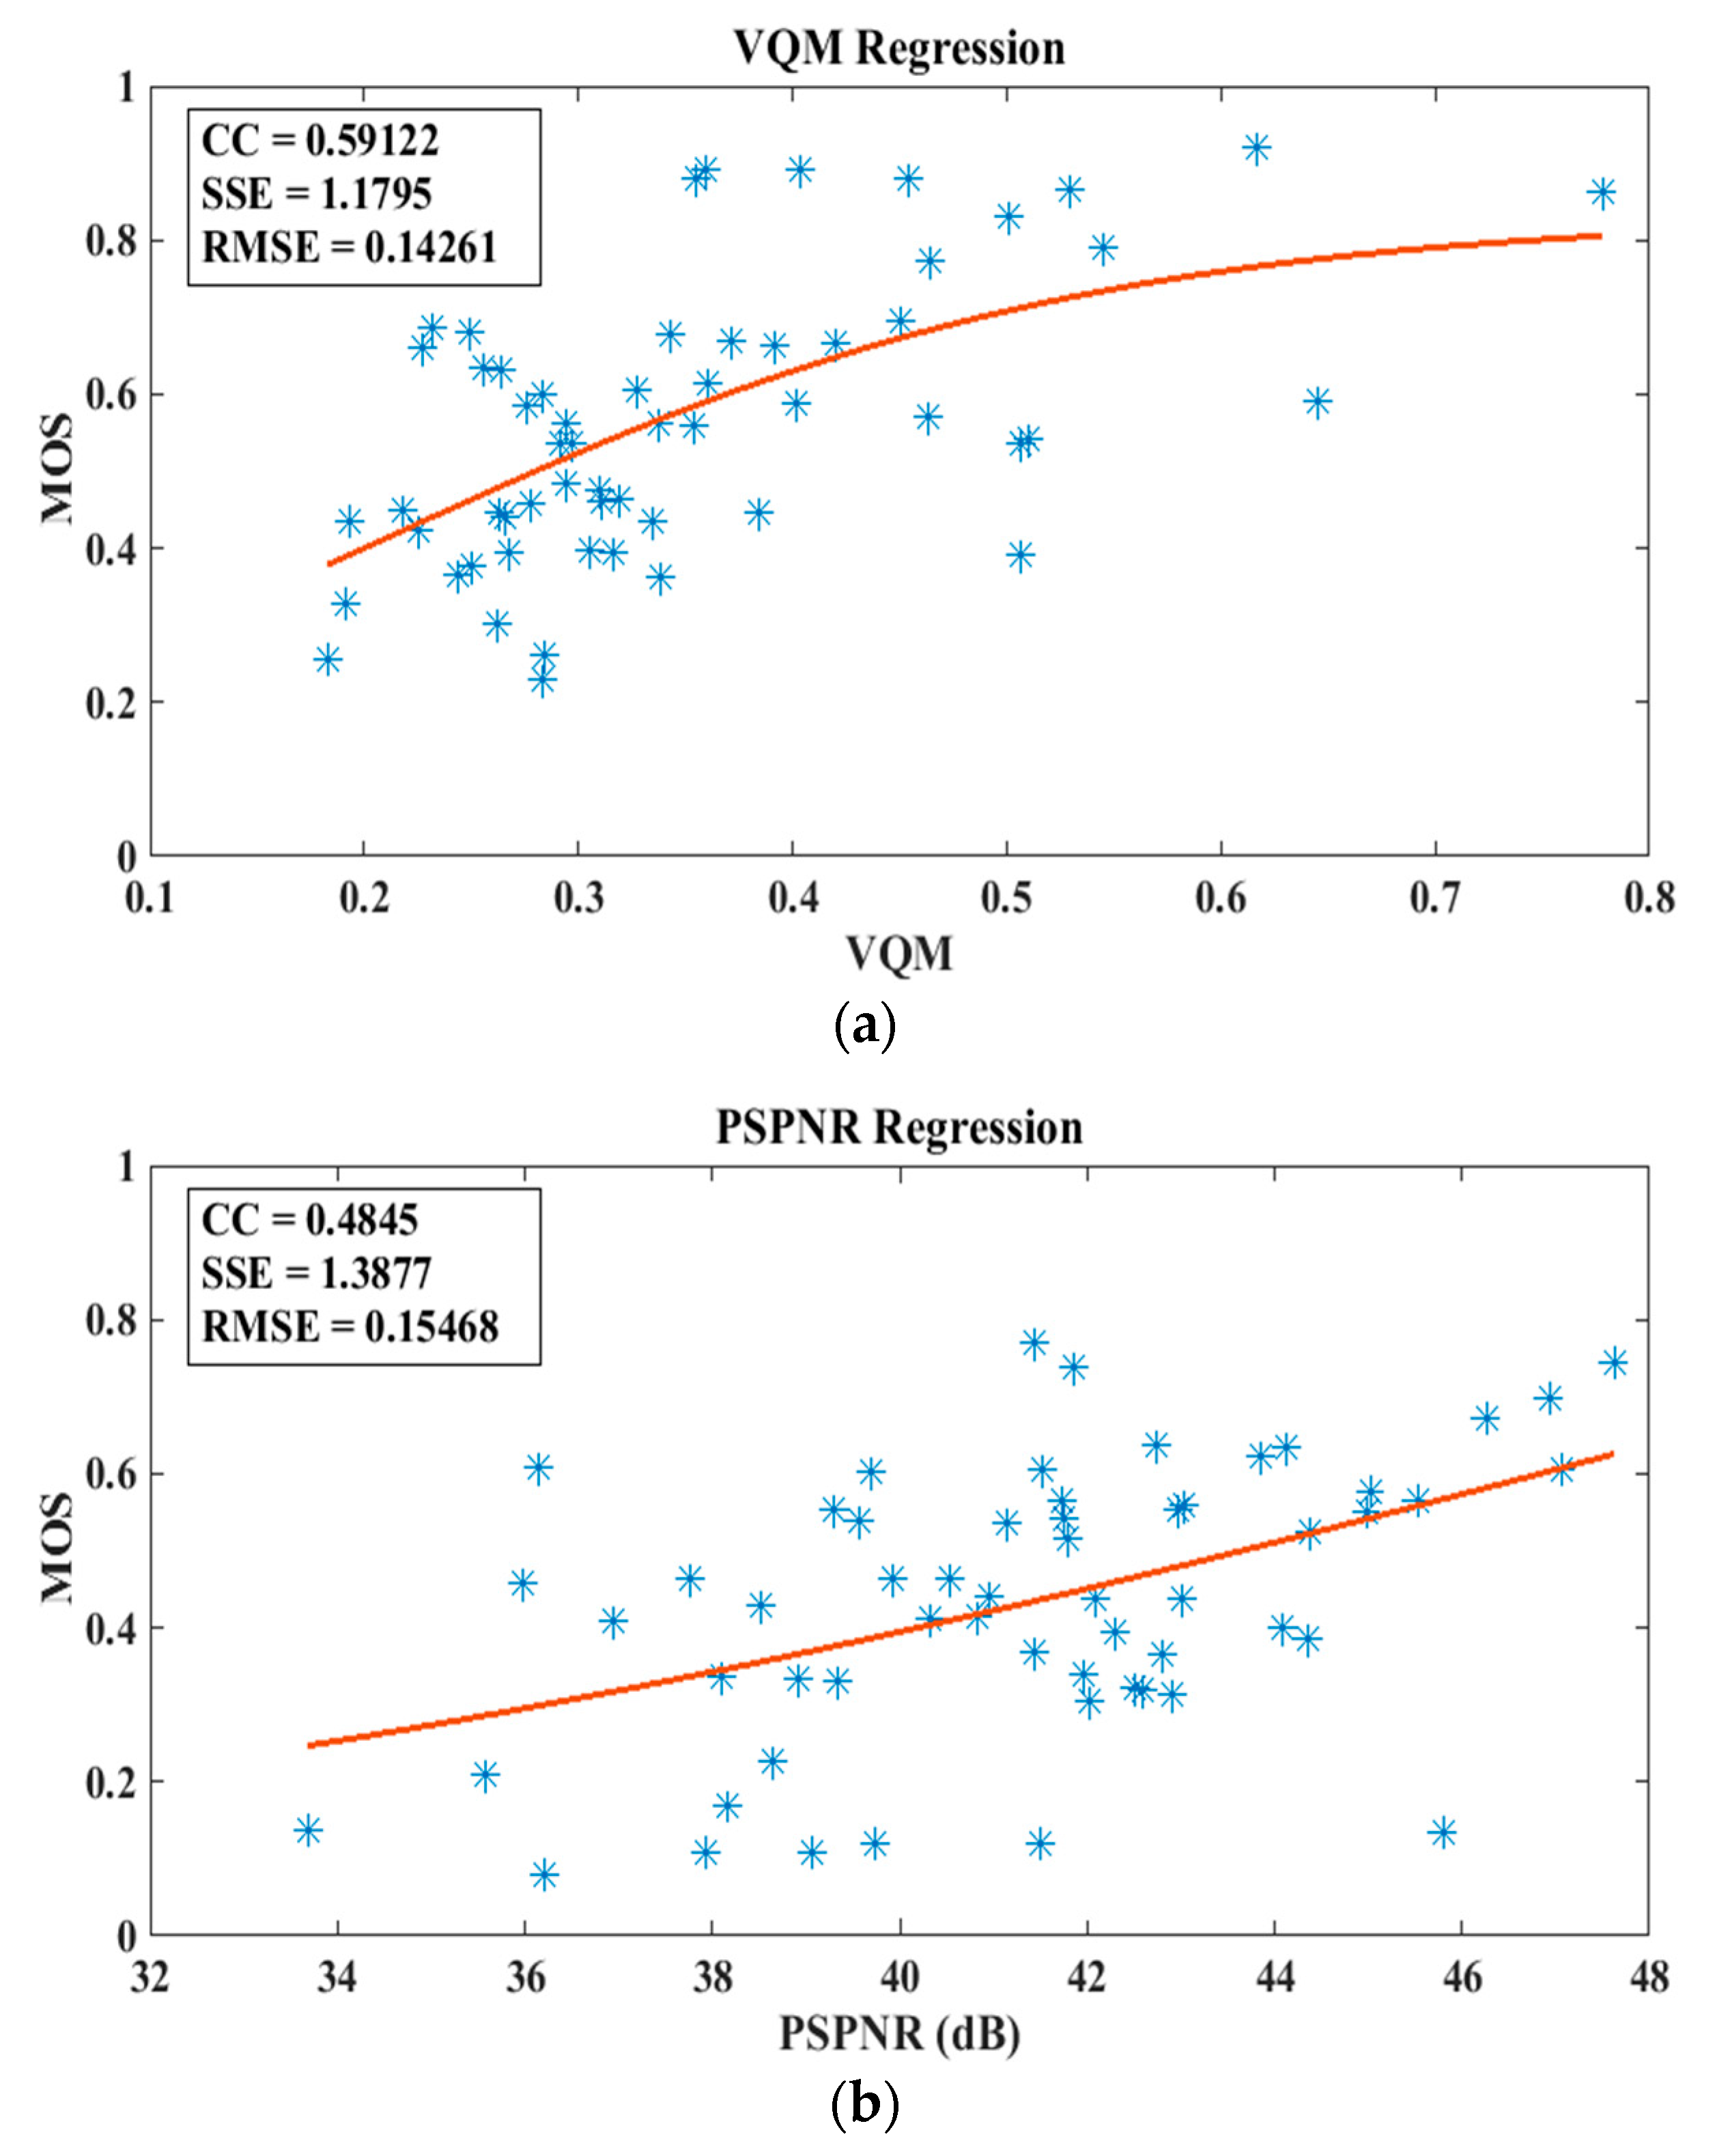
4.2. Performance of the Conventional Objective Quality Evaluation Methods

It is possible to objectively assess the quality of a rendered view against the available original colour view at the same location with the camera setup depicted in Figure 1. The 2D objective quality evaluation methods used for analysis in this section are: Peak signal to noise ratio (PSNR) [44], peak signal to perceptual noise ratio (PSPNR) [45], structural similarity index (SSIM) [46] and video quality metric (VQM) [47].
To better understand the performance of these methods in assessing the quality of the rendered views, a regression approximation using a symmetrical logistic function (as detailed in [39]) has been performed. The regression analysis utilises the 2D video subjective assessment results obtained in the previous section (Section 4.1) and 2D objective measurements for the stimuli related to those subjective assessments. The aim of this analysis is to attain a correlation to estimate the relation between the objective measurements and recorded subjective assessment results. The results of the regression analysis are depicted in Figure 8, where the obtained CC values together with the sum of square error (SSE) and RMSE statistics for the regression operation, are presented. Note that the figure presents the regression results for PSPNR and VQM only, as the regression analysis for both PSNR and SSIM offered insignificant CC values, and thus, have been omitted. PSPNR and VQM offer partial correlation with the subjective results to some extent, as they are used for video quality evaluation rather than image quality measurements.
Although PSPNR and VQM results offer some degree of a match for the quality of the assessed rendered views, the correlation levels obtained are very limited. This can be explained by the fact that the traditional objective quality evaluation methods are designed to be effective in measuring specific distortions and artefacts, such as compression noise, random noise and blurriness. The artefacts present in the synthesised rendered views are different from those and can vary depending on the quality of the depth map used in the rendering process. As such, the traditional methods are ineffective at quantifying the unconventional artefacts that may appear in the synthesised views resulting from the DIBR process.
To get a full insight into the abovementioned phenomenon, Table 1 presents the subjective and objective measurements recorded for two rendered stimuli: Views rendered from the Musicians colour sequence utilising the RSGM_GAUS and RSGM_SCAN depth maps. The RSGM_GAUS depth map has been obtained by applying Gaussian blur on the RSGM_FIL maps to study the effects of non-sharp edges in a depth/disparity map on the resulting rendered sequences. An RSGM_SCAN depth map has been obtained by introducing high edge errors in the RSGM_FIL depth maps using a scan-line error code. The recorded 2D MOS values indicate a clear difference between the subjective qualities of the two stimuli. The stimuli rendered utilising the RSGM_GAUS depth map has a much higher MOS than that recorded for the stimuli rendered utilising the RSGM_SCAN depth map.
On the contrary, the 2D objective measurements recorded for both stimuli indicate the complete opposite, i.e., the objective measurements obtained by all four objective quality evaluation methods state that the RSGM_SCAN based depth map rendered view is objectively better than the RSGM_GAUS based depth map rendered view. It is worth noting that for VQM, the lower the value recorded the better the quality of the measured video. The opposite is true for the remainder of the utilised objective assessment methods. Figure 9 shows a visual comparison between the two stimuli.
These results present testimony for not relying on the conventional objective assessment methods when it comes to assessing the rendered view qualities in immersive video applications, particularly when a variety of depth map qualities are involved in view rendering in complete no-reference scenarios. Thus, the next subsection presents our results obtained for this purpose, so as to compare against both the existing work in the area and objective assessment methods.

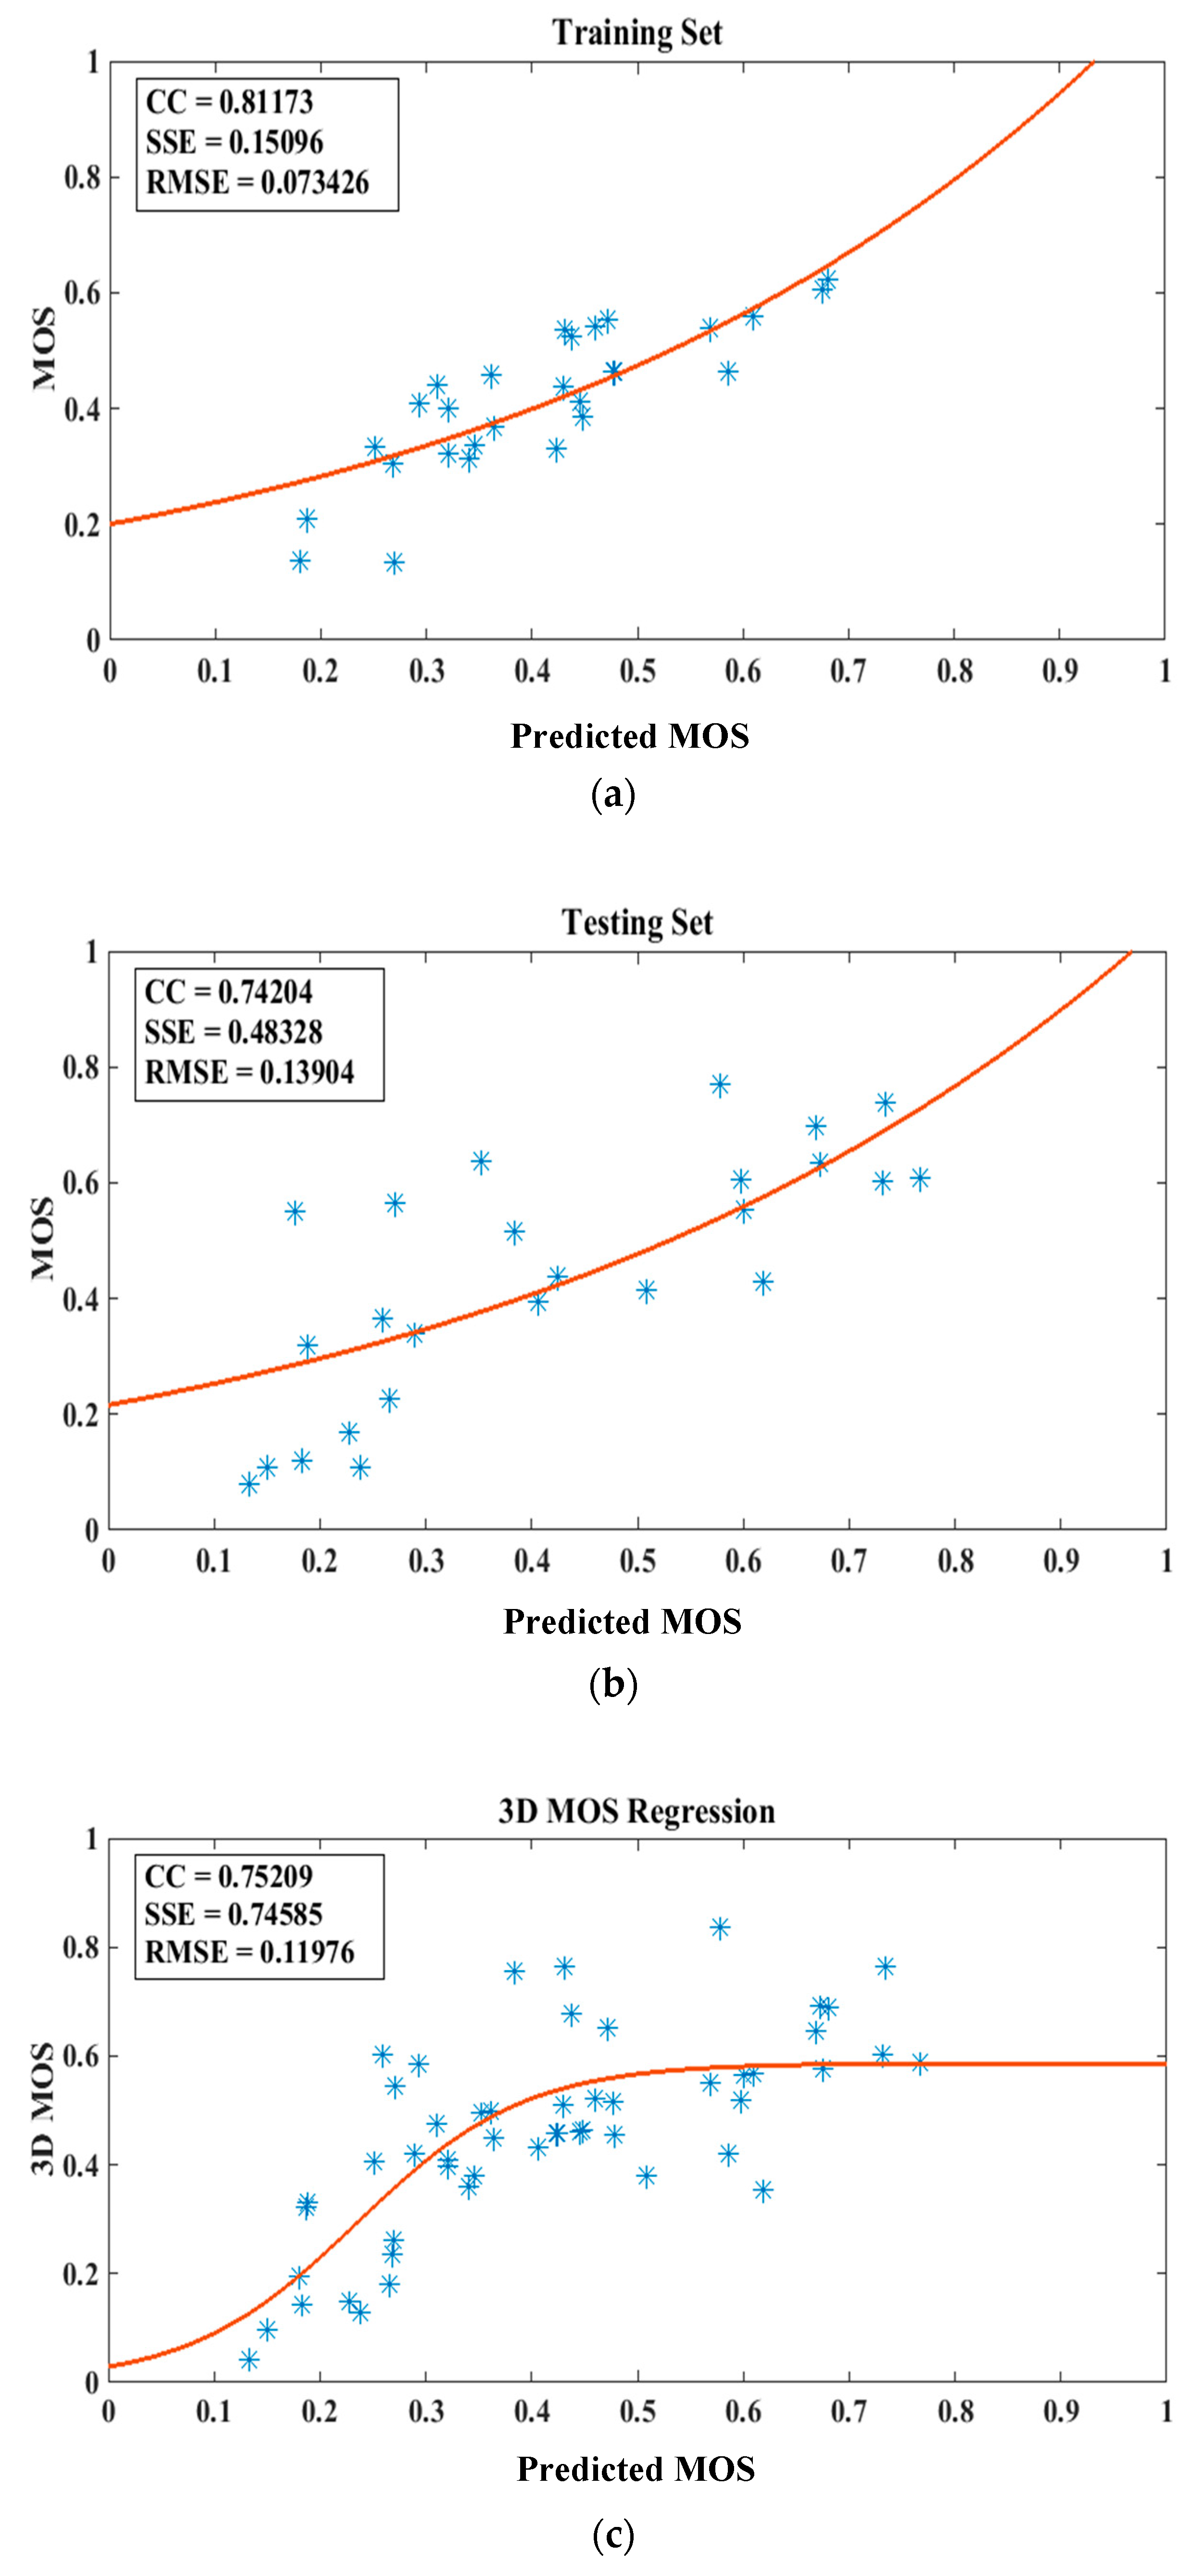
4.3. Validating the Accuracy of the Proposed DEC Measurement-Based Model

To validate the accuracy of the developed model fit from Section 3.1.2, a symmetrical logistic function is used to obtain the regression statistics. Figure 10a,b present the logistic regression results for both the training and testing sets of the 2D video subjective assessment. For this purpose, the available 2D MOS subjective assessment dataset has been divided equally into the training and testing sets, as mentioned previously.
The correlation coefficients obtained for both sets are high, and the low RMSE values point at the high accuracy of the trained model in predicting the quality of the views rendered utilising the available depth maps. The correlation results also demonstrate superior performance when compared to the correlation results obtained for the 2D full-reference objective quality assessment methods, whose results have been presented in the previous section (Section 4.2). For further validation of the developed DEC measurement-based no-reference quality evaluation model, Figure 10c presents the logistic regression results between the model based MOS values and 3D video subjective assessment. These results are consistent with the results obtained in the training and testing phases of the developed quality evaluation model.
Further validation of the DEC measurement-based model’s results calls for a comparison with the results of the conventional no-reference quality evaluation methods discussed in Section 2.2. For this, all of the methods have been compared utilising their available implementations for research purposes [48]. All of the results presented here have been obtained using the same testing set across all experiments without the influence of the training set that was used to build and calibrate our model initially. It is worth noting that these methods are designed to assess the quality of the rendered views directly, rather than assessing the quality of the depth maps used in the rendering process as advocated in our research. The correlation between the aforementioned methods and 2D MOS results is very low. Table 2 demonstrates the lack of correlation by presenting the results of the different methods with respect to the views rendered using various depth maps for the Poker colour sequence. In contrast, the proposed DEC measurement-based model results correlate well with the recorded real user MOS results (taken as the ground truth for this experiment, as listed in the second column of the table). A variety of depth map production techniques (as listed in the first column of the table) were involved during the subjective tests where the MOS values were recorded. To simplify the understanding of the results, the table is presented in ranking order. As such, each score has been converted to rank for all the methods tested across the board, and they are aligned according to the 2D MOS values in the table. Similar results have been obtained using all video test sequences available in the dataset.

4.4. Performance of the Proposed Model

To analyse the performance of the proposed DEC measurement-based no-reference quality evaluation model for providing accurate assessment of the rendered view quality, a logistic regression-based comparison has been designed using the video sequences from the dataset. Table 3 presents the logistic regression statistics for the results of both 2D MOS and DEC measurement-based model that are grouped by the utilised colour sequence.
The DEC measurement-based model’s good performance can be noticed from most results reported in the table, i.e., offering high correlation and low error readings. However, a variation in the performance level of the model can also be noted between different sequences. This observation can be explained by the fact that depth map performance is dependent on the colour sequence used in the rendering process. As such, the different spatio-temporal information levels present in the video sequences have an influence on the overall quality performance, as was also noted in a previous section. For example, the BMX and Musicians sequences are characterised as high texture and motion video contents. Therefore, the different quality depth maps used in the rendering process has a major impact on the perceived quality of the rendered overall view. On the other hand, the Parisband sequence has low spatio-temporal information characteristics. Thus, variation in the quality of the rendered depth maps has less of a noticeable effect on the perceived quality of the rendered view. In other words, rendered views from sequences with low texture complexities and little motion content are more immune to errors in the depth map used in the rendering process.
Despite the regression results for the Parisband sequence offering low correlation, the adopted DEC measurement-based model outperforms the traditional objective quality assessment methods. Table 4 shows the regression results between the 2D MOS values and VQM when considered per sequence. VQM is taken as an example here, since it is the top-performing objective quality method out of all the traditional objective quality methods assessed in our experiments. It is clearly evident from the comparison of both Table 3 and Table 4 that the adopted DEC measurement-based model outperforms VQM results with respect to all of the considered sequences, including the Parisband sequence.

5. Discussion

5.1. Findings and Their Implications

The two previous sections have presented the development and experimental results of the proposed no-reference evaluation model in assessing the quality of depth maps used in view rendering via DIBR. This model has exploited the edges existing in the available depth maps and compared those to the edges in the corresponding colour views. Through this comparison, edge pixels in-depth maps have been classified into correct and error edge pixels. The results have been correlated with the subjective results. The result analysis of the model has provided clear indications of depth map performance and its dependency on the associated colour sequence selection.
The novelty of this work is realised by the adoption of a proposed depth map quality measure, namely the DEC measure, as an indication of the quality of the view rendered using the particular depth map whose quality has been scrutinised. DEC measure has proved to be a very powerful tool in quantifying the quality of a depth map in rendering the DIBR based view. No-reference approach adopted whilst developing the proposed quality evaluation model is different from the conventional approaches of no-reference quality assessment methods. While conventional methods are blindly assessing the quality of colour views directly, our proposed model provided the quality measure indirectly by assessing the quality of the depth map used in the rendering process.
The developed no-reference quality evaluation model can be used to indicate the quality of the depth map used in the rendering process, as it has provided strong correlation with the subjective assessment results of the views rendered using these depth maps, as seen in Figure 10. The developed model produced good results in evaluating the quality of the rendered views, particularly when compared to the results of the traditional 2D full-reference objective quality assessment methods or the conventional no-reference methods reported in the literature. To be specific, the DEC measurement-based model has offered a 27% improvement in correlation with the subjective results when compared to the VQM correlation results when compared to the results shown in Table 3 and Table 4. A better performance can also be observed when the results presented in Figure 8 and Figure 10 are compared. This improvement has also been verified by considering the correlation for the range of video sequences tested. VQM has been selected for benchmarking, as it was overall the best performing objective quality assessment method among the state-of-the-art methods employed in this research.
It is also clear from the results presented in Table 2 that the conventional approaches to no-reference quality evaluation do not offer good results when the views assessed are the views resulting from the DIBR process. This can be explained by the fact that these methods are designed to assess conventional artefacts and distortions in a natural scene. The artefacts specific to the synthesised DIBR rendered views are of a different nature. Thus, measuring the quality of the depth map used in the rendering process, as advocated by the study presented in this paper, is more representative of the overall quality of the rendered view.
Another observation that can be made from the obtained experimental results is related to the effect of using different colour sequences in the rendering process on the resulting quality of the rendered view. It seems it is more beneficial to use colour sequences with high spatio-temporal information to more accurately assess the performance of a set of depth maps in the rendering process. This observation is more important when the depth dataset has relatively equivalent quality performances. As a final observation, the developed model can be considered as an effective measurement of the quality of the depth map used in the rendering process, particularly when there is a lack of real depth reference in immersive video applications for the depth comparison purposes.
In summary, subjective evaluation results have been used for training a model, and through a series of regression and curve-fitting operations, we have arrived at devising our resulting equation (Section 3.1.2) which plays the centre role in predicting the subjective evaluation results as close as possible to the real subjective assessment scores. The results then demonstrate that the accuracy obtained is better than those of 2D objective metrics and/or other no-reference techniques presented earlier. By nature, the proposed no-reference quality evaluation model based on DEC measurement is limited in computational complexity, since the calculation of edges requires a two-dimensional filter. Furthermore, the training process is performed offline to compute the model coefficients, which with today’s fast CPU and GPU capabilities and availability is not a demanding operation as opposed to those other quality evaluation techniques that are based heavily on machine learning techniques.
We have presented the results compared with those obtained from the literature, based on conventional implementations (as introduced in Section 2.2), where possible and available. We also compared our results against the well-known objective quality metrics and showed that our model performed significantly better than those.

5.2. Future Research Directions

Depth map quality is a key area in developing immersive video applications, as it provides the potential for generating more views available at the receiver end without excessively utilising valuable communication bandwidth resources. As such, further research will be beneficial in the following directions. Firstly, developing a complementary measure that consists of inter-view depth confidence, coupling with the depth map quality model proposed here, is envisaged to offer a higher degree of objective quality estimation when richer MVD datasets are available for testing. The inter-view depth confidence can be explained as a per-view and per-pixel spatial confidence map that outlines the pixel positions, for which the depth value is consistent across different views. A spatial confidence map can be generated in the forward projection of the depth values of all available views into the coordinate system of a common viewpoint (i.e., the synthesised view position). This is then followed by the calculation of depth differences at every pixel location. This will provide added depth confidence measure when two reference colour views and their associated depth maps are used in the rendering process. The overall model can combine the DEC measurement presented in this paper together with inter-view confidence measurement with the prospect for predicting the quality of the resulting rendered views in much higher accuracies.
Secondly, limitations on accurate depth data generation for wide baseline camera setups call for further research. Depth map production for wide baseline camera setups is very challenging that has been widely researched. Depth map quality has an impact on the quality of the rendered views in those camera setups. Particularly, depth quality is expected to have a more prominent impact when the target rendered view location is set at a further distance from the reference colour view than the stereoscopic distance. As such, errors in mapping colour information from the reference to the correct locations in the target view will significantly increase with the growing distance between the views. The DEC measurement-based model, together with the aforementioned inter-view depth confidence measurement, would provide a remedy to overcome inaccuracies owing to the larger view distances in-depth map quality prediction in these setups.
Lastly, future research may involve studying the effect of utilising the developed depth map quality model as direct feedback into the depth production process, where it provides an input for the depth estimation and post-processing techniques. This can particularly be beneficial when real-time depth production process is considered for enhancing QoE of viewers in live 3DTV/FTV immersive video applications. The advantage of such implementation would come from exploiting the DEC measurement-based model’s performance in instantly assessing depth map quality. This is essential in enabling faster and more convenient depth map production without resorting to the time and effort consuming subjective assessment methodology each time new developments into depth map production are introduced.

6. Conclusions

This paper has presented a no-reference quality evaluation model aimed to assess the quality of views rendered using DIBR. The novelty of this model comes from the direct use of a new depth map quality measure, called the DEC measure, as a reliable indication of the overall rendered view quality. As such, developing the proposed DEC measure proved to be a very powerful tool in quantifying the quality of a depth map. The no-reference feature of the developed model has diverged from the conventional no-reference quality assessment concepts. Conventional no-reference methods perform the quality assessment directly on the colour view, while the model developed in this research has provided such measure through assessing the quality of the depth map used in the rendering process. The experiments conducted to assess its performance have resulted in a 27% improvement in correlation with subjective results recorded by the real viewers over that offered by VQM, which was taken as the benchmark objective quality assessment method in this research. This model has also provided superior performance results compared to those of the conventional no-reference quality assessment methods reported in the literature.
The developed no-reference quality evaluation model is expected to provide great benefits in-depth map production, as it has the potential to offer a reliable measurement of depth map quality. This is particularly significant when there is a lack of depth reference in immersive video applications for depth comparison and generation. Utilising the developed DEC measurement-based model will also offer benefits to the 3D multi-view research field, as it eliminates the need for time and effort consuming subjective tests, which are traditionally used for assessing the quality of rendered views. In turn, this can lead to faster improvements in-depth map production and can also be used in live broadcast services for the immersive video applications whilst offering higher QoE to the users.

Author Contributions

Conceptualization, S.D., N.H. and A.M.K.; methodology, N.H. and S.D.; software, N.H.; validation, N.H. and E.E.; formal analysis, E.E.; investigation, N.H. and S.D.; resources, E.E. and A.M.K.; data curation, N.H. and E.E.; writing—original draft preparation, N.H. and S.D.; writing—review and editing, S.D. and E.E.; visualization, N.H. and S.D.; supervision, A.M.K. and S.D.

Funding

This research received no external funding.

Conflicts of Interest

The authors declare no conflict of interest.

References

  1. Vetro, A.; Tourapis, A.M.; Muller, K.; Tao, C. 3D-TV content storage and transmission. IEEE Trans. Broadcast. 2011, 57, 384–394. [Google Scholar] [CrossRef]
  2. Tanimoto, M. Overview of FTV (Free-Viewpoint Television). In Proceedings of the IEEE International Conference on Multimedia and Expo (ICME 2009), New York, NY, USA, 28 June–3 July 2009; pp. 1552–1553. [Google Scholar]
  3. Merkle, P.; Smolic, A.; Muller, K.; Wiegand, T. Multi-view video plus depth representation and coding. In Proceedings of the IEEE International Conference on Image Processing (ICIP 2007), San Antonio, TX, USA, 16–19 September 2007; pp. 201–204. [Google Scholar]
  4. Fehn, C. Depth-image-based rendering (DIBR), compression, and transmission for a new approach on 3D-TV. Proc. SPIE 2004, 5291, 93–104. [Google Scholar]
  5. Middlebury Stereo Evaluation. Available online: http://vision.middlebury.edu/stereo/eval/ (accessed on 25 June 2019).
  6. The KITTI Vision Benchmark Suite. Available online: http://www.cvlibs.net/datasets/kitti/ (accessed on 25 June 2019).
  7. Scharstein, D.; Szeliski, R. A taxonomy and evaluation of dense two-frame stereo correspondence algorithms. Int. J. Comp. Vis. 2002, 47, 7–42. [Google Scholar] [CrossRef]
  8. Yang, Q. A Non-local cost aggregation method for stereo matching. In Proceedings of the IEEE Computer Society Conference on Computer Vision and Pattern Recognition (CVPR 2012), Providence, RI, USA, 16–21 June 2012; pp. 1402–1409. [Google Scholar]
  9. Hirschmuller, H. Accurate and efficient stereo processing by semi-global matching and mutual information. In Proceedings of the IEEE Computer Society Conference on Computer Vision and Pattern Recognition (CVPR 2005), San Diego, CA, USA, 20–25 June 2005; pp. 807–814. [Google Scholar]
  10. Hirschmuller, H.; Innocent, P.R.; Garibaldi, J. Real-time correlation-based stereo vision with reduced border errors. Int. J. Comp. Vis. 2002, 47, 229–246. [Google Scholar] [CrossRef]
  11. Boykov, Y.; Veksler, O.; Zabih, R. Fast approximate energy minimization via graph cuts. IEEE Trans. Pattern Anal. Mach. Intell. 2001, 23, 1222–1239. [Google Scholar] [CrossRef]
  12. Sun, J.; Zheng, N.-N.; Shum, H.-Y. Stereo matching using belief propagation. IEEE Trans. Pattern Anal. Mach. Intell. 2003, 25, 787–800. [Google Scholar]
  13. Ghanbari, M. Standard Codecs: Image Compression to Advanced Video Coding, 3rd ed.; IET: London, UK, 2011. [Google Scholar]
  14. Fernando, A.; Worrall, S.T.; Ekmekcioglu, E. 3DTV: Processing and Transmission of 3D Video Signals, 3rd ed.; John Wiley & Sons Ltd.: Chichester, UK, 2013. [Google Scholar]
  15. Tran, H.T.T.; Pham, C.T.; Ngoc, N.P.; Pham, A.T.; Thang, T.C. A study on quality metrics for 360 video communications. IEICE Trans. Inf. Syst. 2018, E101–D, 28–36. [Google Scholar] [CrossRef]
  16. Battisti, F.; Le Callet, P. Quality assessment in the context of FTV: Challenges, first answers and open issues. IEEE COMSOC MMTC Commun. Front. 2016, 11, 22–26. [Google Scholar]
  17. Galkandage, C.; Calic, J.; Dogan, S.; Guillemaut, J.-Y. Stereoscopic video quality assessment using binocular energy. IEEE J. Sel. Top. Sig. Process. 2017, 11, 102–112. [Google Scholar] [CrossRef]
  18. Kourtis, M.; Koumaras, H.; Liberal, F. Reduced-reference video quality assessment using a static video pattern. Spie J. Electron. Imaging 2016, 25, 1–10. [Google Scholar] [CrossRef]
  19. Paudyal, P.; Battisti, F.; Carli, M. Reduced reference quality assessment of light field images. IEEE Trans. Broadcast. 2019, 65, 152–165. [Google Scholar] [CrossRef]
  20. Tian, S.; Zhang, L.; Morin, L.; Deforges, O. NIQSV+: A no-reference synthesized view quality assessment metric. IEEE Trans. Image Process. 2018, 27, 1652–1664. [Google Scholar] [CrossRef] [PubMed]
  21. Chen, Z.; Zhou, W.; Li, W. Blind stereoscopic video quality assessment: From depth perception to overall experience. IEEE Trans. Image Process. 2018, 27, 721–734. [Google Scholar] [CrossRef] [PubMed]
  22. Yang, J.; Wang, H.; Lu, W.; Li, B.; Atta, B.; Qinggang, M. A no-reference optical flow-based quality evaluator for stereoscopic videos in curvelet domain. Inf. Sci. 2017, 414, 133–146. [Google Scholar] [CrossRef] [Green Version]
  23. Xu, M.; Li, C.; Chen, Z.; Wang, Z.; Guan, Z. Assessing visual quality of omnidirectional videos. IEEE Trans. Circuits Syst. Video Technol. 2018, 12, 1–14. [Google Scholar] [CrossRef]
  24. Sheikh, H.R.; Bovik, A.C.; Cormack, L. No-reference quality assessment using natural scene statistics: JPEG2000. IEEE Trans. Image Process. 2005, 14, 1918–1927. [Google Scholar] [CrossRef] [PubMed]
  25. Moorthy, A.K.; Bovik, A.C. A Two-stage Framework for Blind Image Quality Assessment. In Proceedings of the IEEE International Conference on Image Processing (ICIP 2010), Hong Kong, China, 26–29 September 2010; pp. 2481–2484. [Google Scholar]
  26. Moorthy, A.K.; Bovik, A.C. A two-step framework for constructing blind image quality indices. IEEE Sig. Process. Lett. 2010, 17, 513–516. [Google Scholar] [CrossRef]
  27. Mittal, A.; Moorthy, A.K.; Bovik, A.C. No-reference image quality assessment in the spatial domain. IEEE Trans. Image Process. 2012, 21, 4695–4708. [Google Scholar] [CrossRef] [PubMed]
  28. Mittal, A.; Soundararajan, R.; Bovik, A.C. Making a completely blind image quality analyzer. IEEE Sig. Process. Lett. 2013, 20, 209–212. [Google Scholar] [CrossRef]
  29. Hassen, R.; Zhou, W.; Salama, M.M.A. Image sharpness assessment based on local phase coherence. IEEE Trans. Image Process. 2013, 22, 2798–2810. [Google Scholar] [CrossRef]
  30. Liu, L.; Liu, B.; Huang, H.; Bovik, A.C. No-reference image quality assessment based on spatial and spectral entropies. Sig. Process. Image Commun. 2014, 29, 856–863. [Google Scholar] [CrossRef]
  31. Atzpadin, N.; Kauff, P.; Schreer, O. Stereo analysis by hybrid recursive matching for real-time immersive video conferencing. IEEE Trans. Circuits Syst. Video Technol. 2004, 14, 321–334. [Google Scholar] [CrossRef]
  32. Mei, X.; Sun, X.; Dong, W.; Wang, H.; Zhang, X. Segment-tree based cost aggregation for stereo matching. In Proceedings of the IEEE Computer Society Conference on Computer Vision and Pattern Recognition (CVPR 2013), Portland, OR, USA, 23–28 June 2013; pp. 313–320. [Google Scholar]
  33. Spangenberg, R.; Langner, T.; Adfeldt, S.; Rojas, R. Large scale semi-global matching on the CPU. In Proceedings of the IEEE Intelligent Vehicles Symposium (IV 2014), Dearborn, MI, USA, 8–11 June 2014; pp. 195–201. [Google Scholar]
  34. Shen, Y.; Li, J.; Lu, C. Depth map enhancement method based on joint bilateral filter. In Proceedings of the International Congress on Image and Signal Processing (CISP 2014), Dalian, China, 14–16 October 2014; pp. 153–158. [Google Scholar]
  35. De Silva, D.V.S.X.; Fernando, W.A.C.; Kodikaraarachchi, H.; Worrall, S.T.; Kondoz, A.M. Improved depth map filtering for 3D-TV systems. In Proceedings of the IEEE International Conference on Consumer Electronics (ICCE 2011), Las Vegas, NV, USA, 9–12 January 2011; pp. 645–646. [Google Scholar]
  36. Zhu, C.; Zhao, Y.; Yu, L.; Tanimoto, M. 3D-TV System with Depth-Image-Based Rendering: Architectures, Techniques and Challenges, 1st ed.; Springer: New York, NY, USA, 2013. [Google Scholar]
  37. Abdulkadir, A.; Sadka, A.H. Metric aspect of depth image-based rendering. In Proceedings of the International Conference on Communications, Signal Processing, and their Applications (ICCSPA 2013), Sharjah, UAE, 12–14 February 2013; pp. 324–329. [Google Scholar]
  38. Haddad, N.; Dogan, S.; Arachchi, H.K.; De Silva, V.; Kondoz, A.M. A disocclusion replacement approach to subjective assessment for depth map quality evaluation. In Proceedings of the 3DTV-Conference: The True Vision-Capture, Transmission and Display of 3D Video (3DTV-CON 2014), Budapest, Hungary, 2–4 July 2014; pp. 1–4. [Google Scholar]
  39. International Telecommunication Union. ITU-R BT. 500-13: Methodology for the Subjective Assessment of the Quality of Television Pictures; International Telecommunication Union: Geneva, Switzerland, 2012. [Google Scholar]
  40. International Telecommunication Union. ITU-R BT. 1788: Methodology for the Subjective Assessment of Video Quality in Multimedia Applications; International Telecommunication Union: Geneva, Switzerland, 2007. [Google Scholar]
  41. Tanimoto, M.; Fujii, M.; Panahpour, M.; Wilderboer, M. Depth Estimation Reference Software DERS 5.0; Technical Report, ISO/IEC JTC1/SC29/WG11; International Organization for Standardization: Geneva, Switzerland, 2009. [Google Scholar]
  42. Lee, S.; Ho, Y. Enhancement of Temporal Consistency for Multi-view Depth Map Estimation; ISO/IEC MPEG Doc. M15594; International Organization for Standardization: Geneva, Switzerland, 2008. [Google Scholar]
  43. Hosni, A.; Rhemann, C.; Bleyer, M.; Rother, C.; Gelautz, M. Fast Cost-Volume Filtering for Visual Correspondence and Beyond. IEEE Trans. Pattern Anal. Mach. Intell. 2013, 35, 504–511. [Google Scholar] [CrossRef] [PubMed]
  44. International Telecommunication Union. ITU-R J.340: Reference Algorithm for Computing Peak Signal to Noise Ratio of a Processed Video Sequence with Compensation for Constant Spatial Shifts, Constant Temporal Shift, and Constant Luminance Gain and Offset; International Telecommunication Union: Geneva, Switzerland, 2010. [Google Scholar]
  45. Zhao, Y.; Yu, L. Perceptual Measurement for Evaluating Quality of View Synthesis; ISO/IEC MPEG Doc. M16407; International Organization for Standardization: Geneva, Switzerland, 2009. [Google Scholar]
  46. Wang, Z.; Lu, L.; Bovik, A.C. Video quality assessment using structural distortion measurement. In Proceedings of the IEEE International Conference on Image Processing (ICIP 2002), Rochester, NY, USA, 22–25 September 2002; pp. 65–68. [Google Scholar]
  47. Pinson, M.H.; Wolf, S. A new standardized method for objectively measuring video quality. IEEE Trans. Broadcast. 2004, 50, 312–322. [Google Scholar] [CrossRef]
  48. Laboratory for Image and Video Engineering—The University of Texas at Austin. Available online: http://live.ece.utexas.edu/research/quality/index.htm (accessed on 25 June 2019).
Figure 1. Camera and potential rendering positions in a typical include 3DTV or FTV application (CAM (real camera) and VC (desired virtual camera/view locations), which may be requested at the receiver end by the viewer).
Futureinternet 11 00204 g001
Figure 2. Main blocks of the proposed no-reference depth map quality evaluation model.
Futureinternet 11 00204 g002
Figure 3. Effect of compression on depth maps of the Musicians sequence: (a) Depth map compressed at QP=22 (high quality/low compression); (b) depth map compressed at QP=32 (medium quality/medium compression); (c) depth map compressed at QP=42 (low quality/high compression).
Futureinternet 11 00204 g003
Figure 4. Examples of various edge confidence maps for the BMX sequence: (a) Hybrid recursive matching (HRM) [31] based depth map; (b) segment tree (ST) [32] based depth map; (c) rapid semi global matching (RSGM) [33] based depth map; (d) RSGM with joint bilateral filter (RSGM_FIL) [34,35] based depth map.
Futureinternet 11 00204 g004
Figure 5. 2D MOS vs. mean DEC curve-fitting results for building the quality evaluation model.
Futureinternet 11 00204 g005
Figure 6. Sample thumbnails of the colour views extracted from the six test sequences: (a) Band; (b) BMX; (c) Musicians; (d) Poker; (e) Act; (f) Parisband.
Futureinternet 11 00204 g006
Figure 7. Subjective depth map quality assessment results across a range of depth maps used in DIBR based view rendering: (a) 2D video; (b) 3D video (HRM; DERS_OFF/ON: MPEG depth estimation reference software (DERS) temporal enhancement feature off/on [41,42]; NL: Non-Local method [8]; ST; GF: Guided Filter method [43]; RSGM; RSGM_FIL; RSGM_GAUS: Gaussian blur introduced to RSGM_FIL; RSGM_SCAN: Scan-line error introduced to RSGM_FIL).
Futureinternet 11 00204 g007
Figure 8. Correlation of 2D objective quality evaluation and subjective assessment results: (a) VQM regression results; (b) PSPNR regression results.
Futureinternet 11 00204 g008
Figure 9. Visual comparison between the rendered views of the Musicians sequence: (a) View rendered utilising RSGM_GAUS depth map; (b) view rendered utilising RSGM_SCAN depth map.
Futureinternet 11 00204 g009
Figure 10. MOS logistic regression results: (a) 2D training set results; (b) 2D testing set results; (c) 3D MOS logistic regression results.
Futureinternet 11 00204 g010
Table 1. Selected rendered stimuli measurements for the Musicians sequence.
RSGM_SCANRSGM_GAUS
2D MOS0.2280.458
VQM0.4640.511
PSPNR (dB)38.65335.974
PSNR (dB)28.16825.082
SSIM0.8710.822
Table 2. Ranking table for MOS and no-reference quality evaluation methods (DEC: Proposed model).
2D MOSDEC[27][28][24][25,26][29][30]
HRM11891848
DERS_OFF2210101929
DERS_ON3396110110
RSGM_FIL45447435
ST54531266
NL66751687
GF773865103
RSGM89177771
RSGM_GAUS986110194
RSGM_SCAN1010227352
Table 3. Logistic regression statistics for DEC measurement-based model per sequence.
CCSSERMSE
Band0.940150.0197710.044640
BMX0.976300.0045860.022573
Musicians0.958580.0134280.036644
Poker0.899050.0791530.088968
Act0.840980.0562470.089639
Parisband0.329500.1335400.138120
Table 4. Logistic regression statistics for VQM per sequence.
CCSSERMSE
Band0.789790.1661600.128900
BMX0.930440.0226140.050127
Musicians0.806340.0788220.106110
Poker0.731610.0766000.087522
Act0.368770.1126900.137040
Parisband0.161540.1696900.130260

