Formulation and Characterization of Native and Crosslinked Hyaluronic Acid Microspheres for Dermal Delivery of Sodium Ascorbyl Phosphate: A Comparative Study

 , and
, and
Abstract
:
1. Introduction
2. Materials and Methods
2.1. Materials
2.2. Prepair of Hyaluronan and Hyaluronan-SAP Solutions (Aqueous Phases)
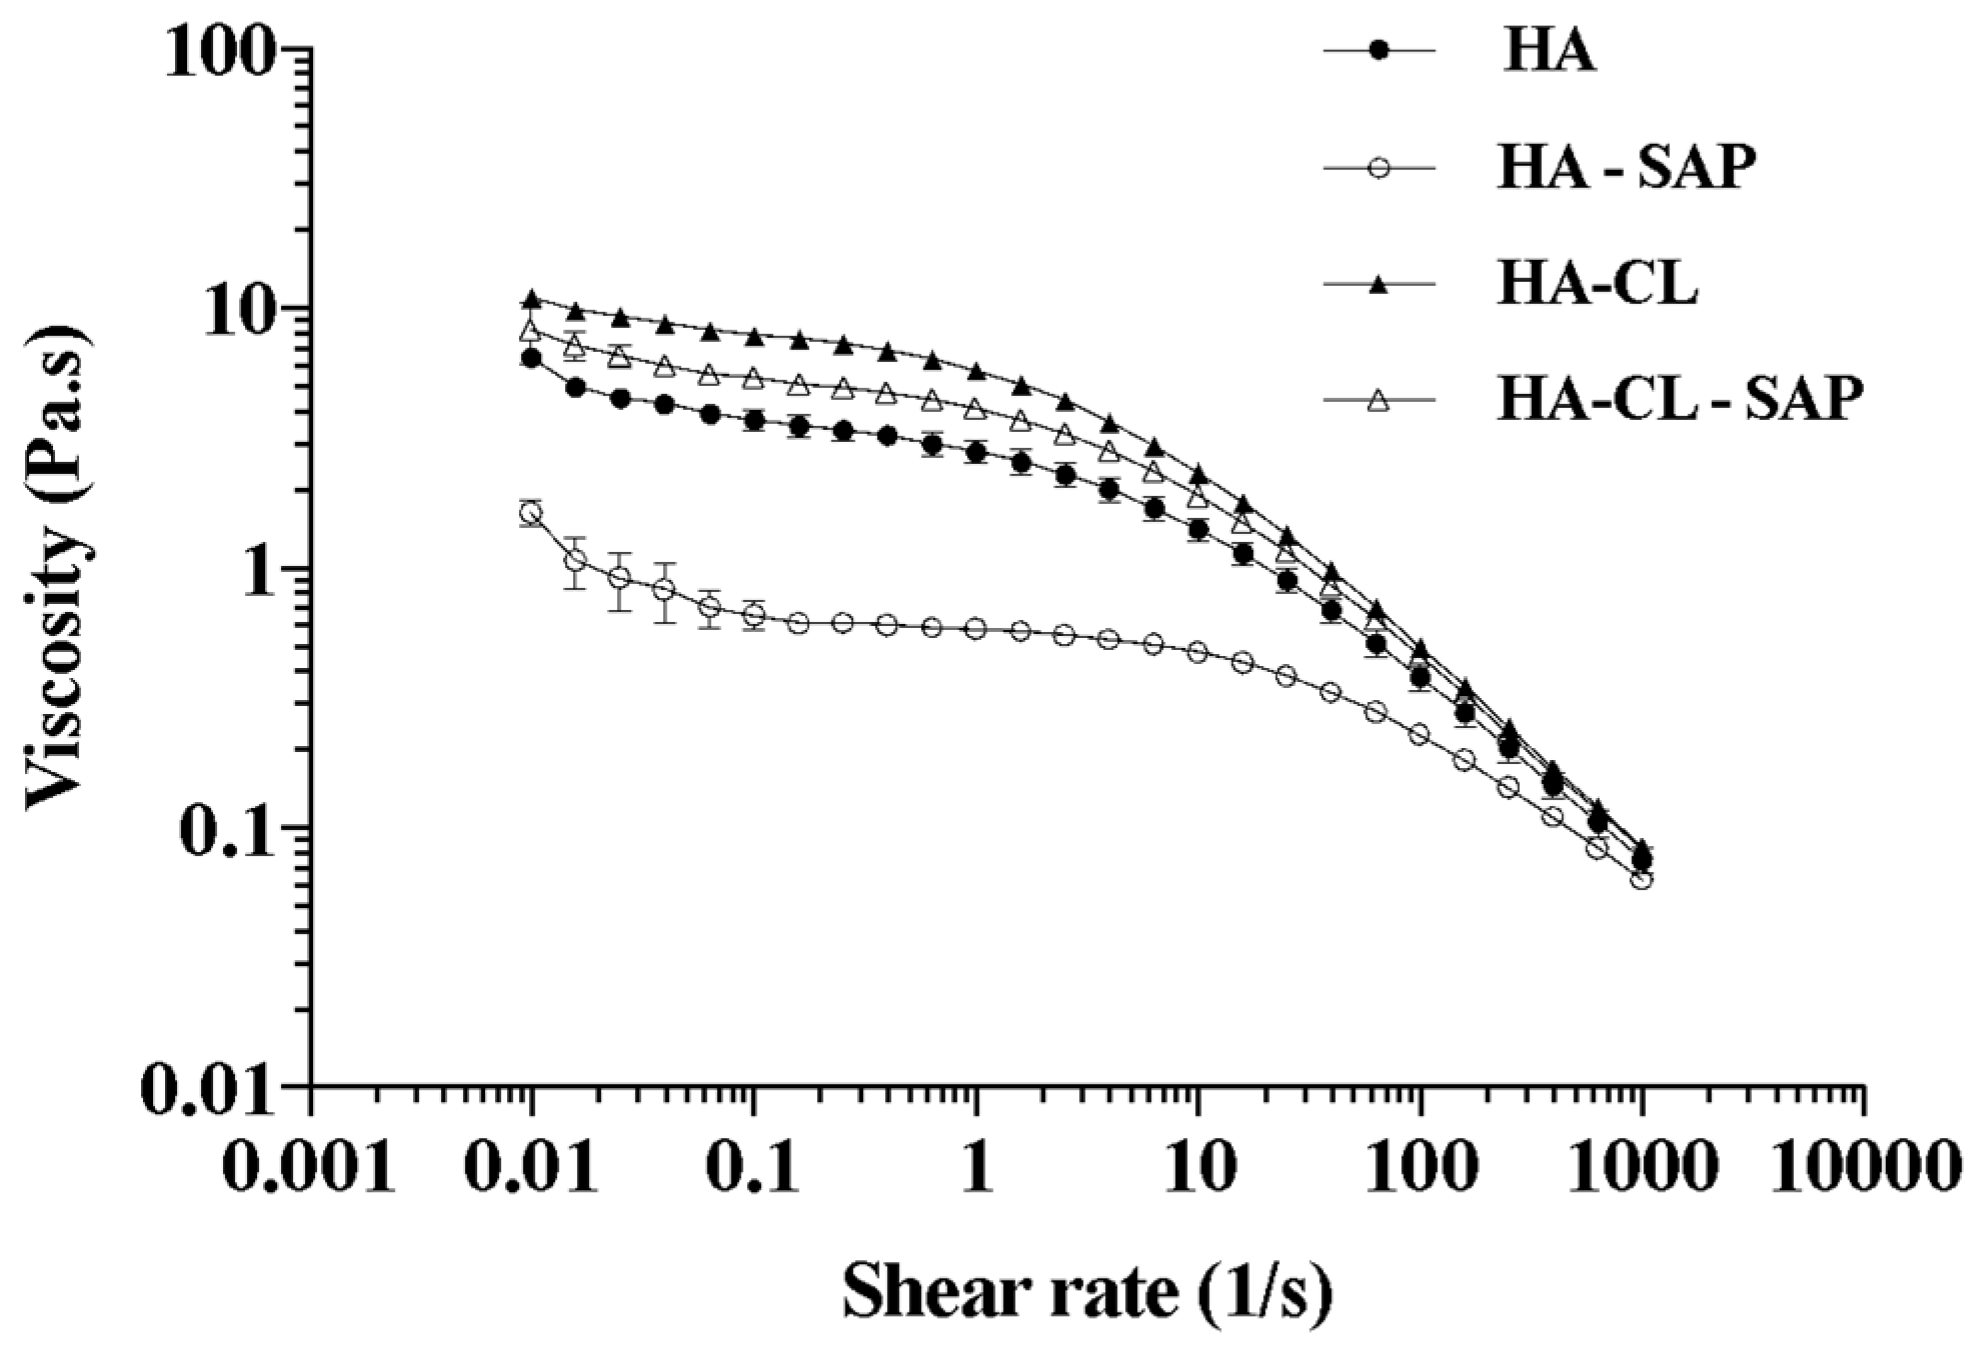
2.3. Characterization of Hyaluronan and Hyaluronan-SAP Solutions: pH and Rheology
2.4. Formulation of HA and HA-CL Microspheres Containing or not SAP
2.5. MS Yield, Drug Loading, and Encapsulation Efficiency
2.6. Particle Size Analysis
2.7. SEM Morphological Analysis
2.8. X-ray Powder Diffraction
2.9. Thermal Analysis (DSC and TGA)
2.10. Dynamic Vapor Sorption (DVS)
2.11. Solubility Test
2.12. In Vitro Drug Release Studies
2.12.1. Dialysis
2.12.2. Franz Cells
2.13. Drug Release Data Analysis
2.13.1. Similarity and Difference Factors for SAP Release Profiles
2.13.2. Analysis of SAP Release Kinetics Using Mathematical Models
2.14. Statistical Analysis
3. Results and Discussion
3.1. Pre-Formulation Study: Evaluation and Optimization of Microspheres
3.2. Characterization of Optimized Microspheres
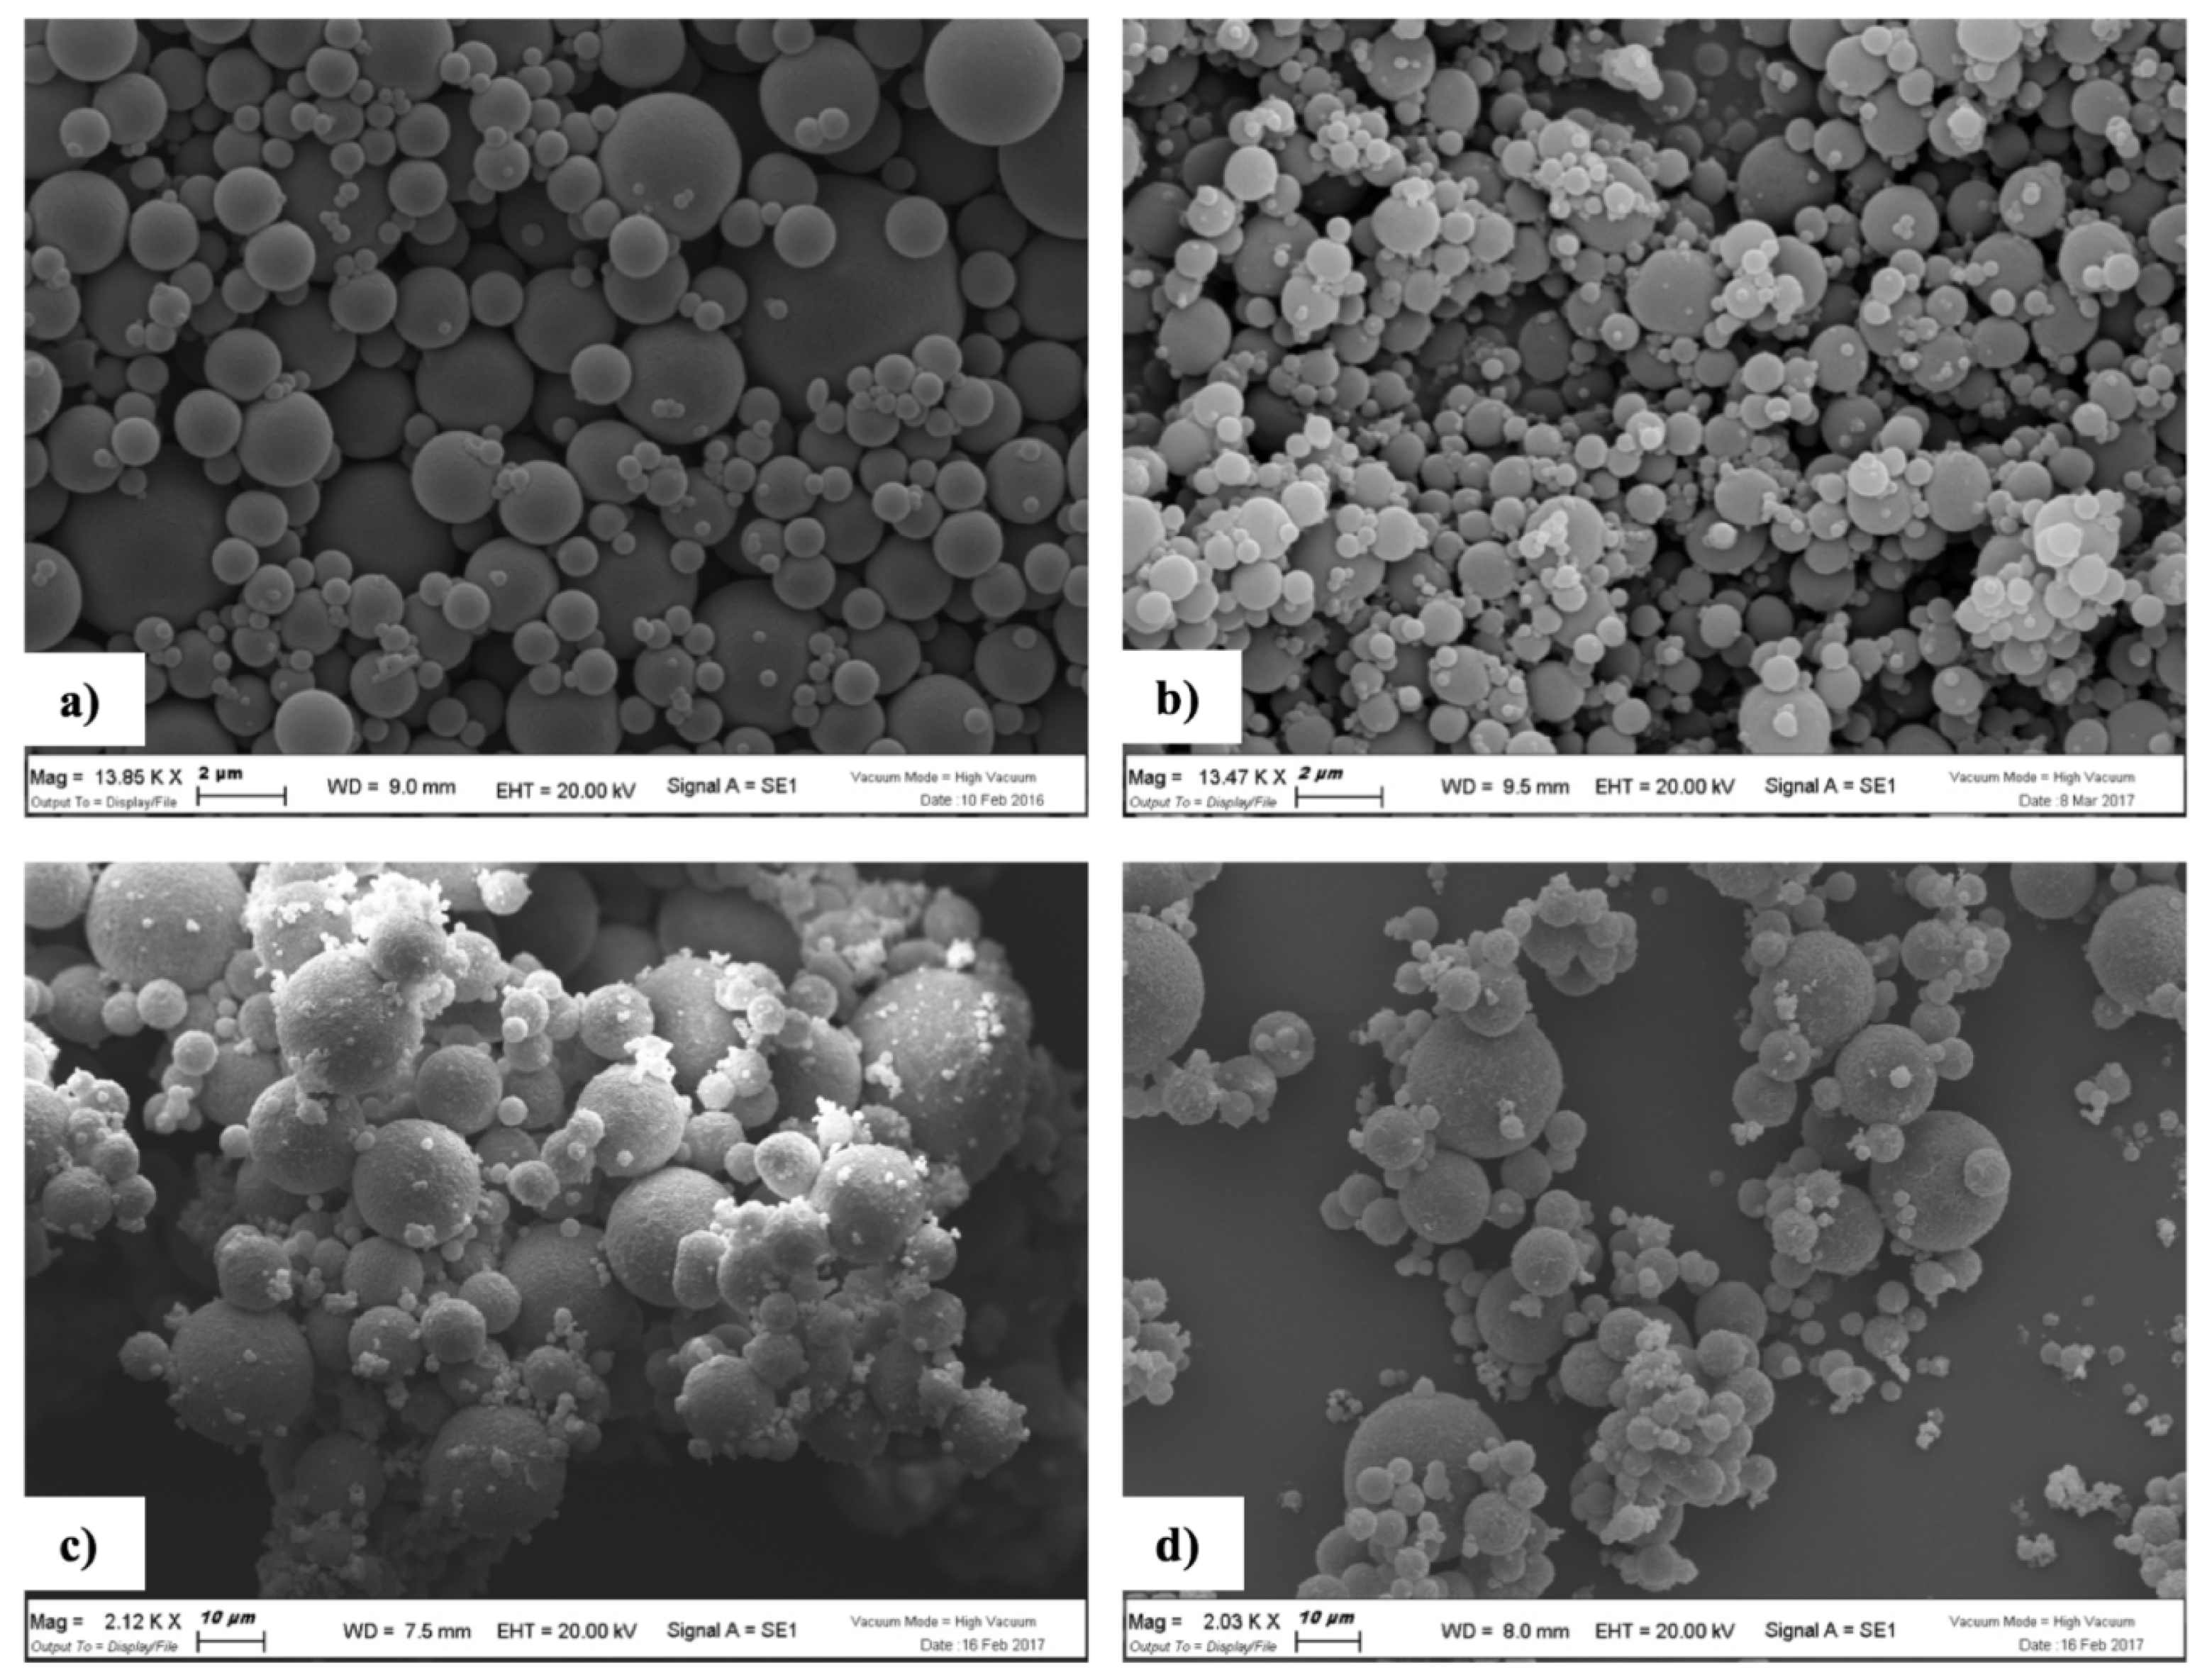
3.2.1. SEM Morphological Analysis
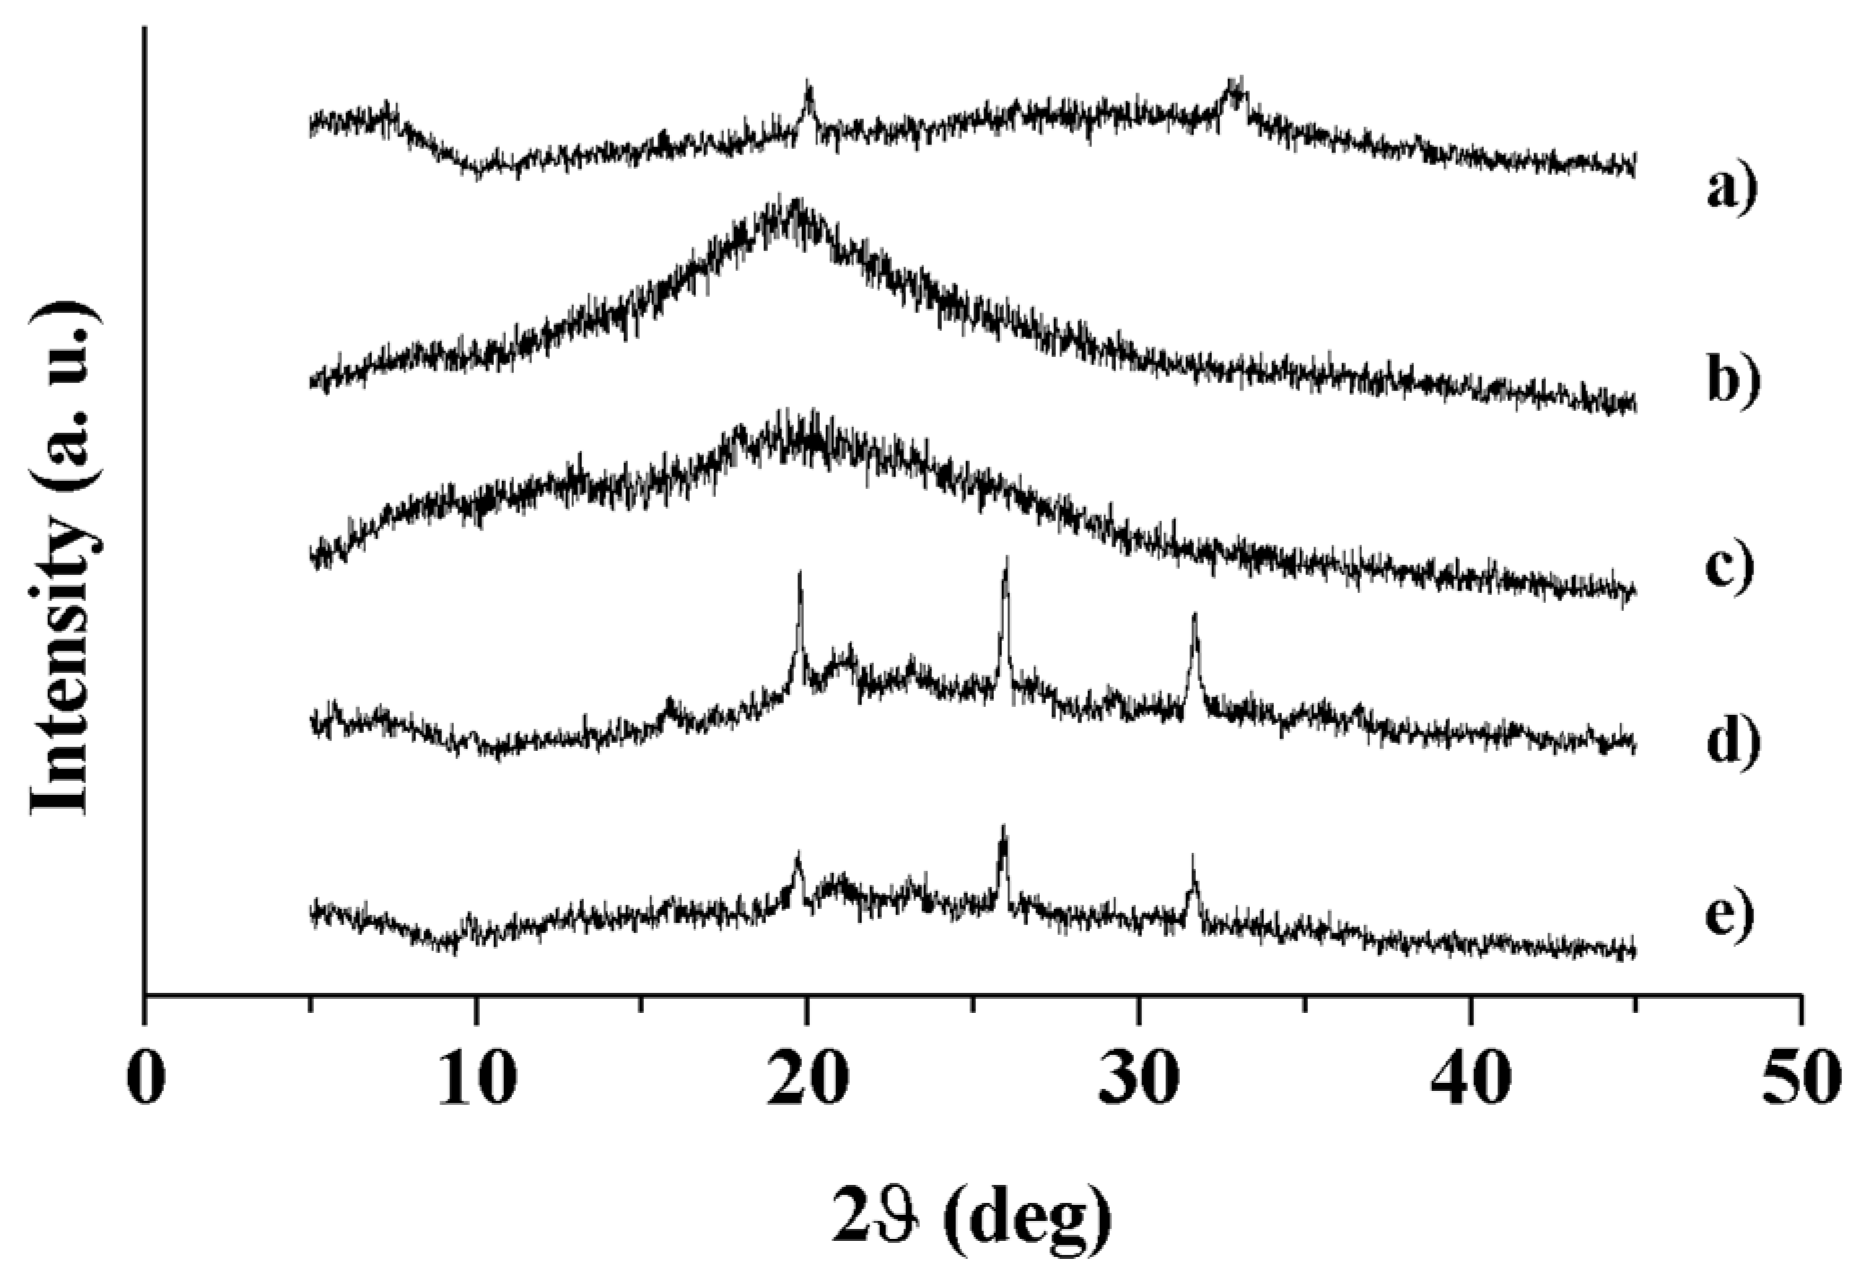
3.2.2. X-ray Diffraction
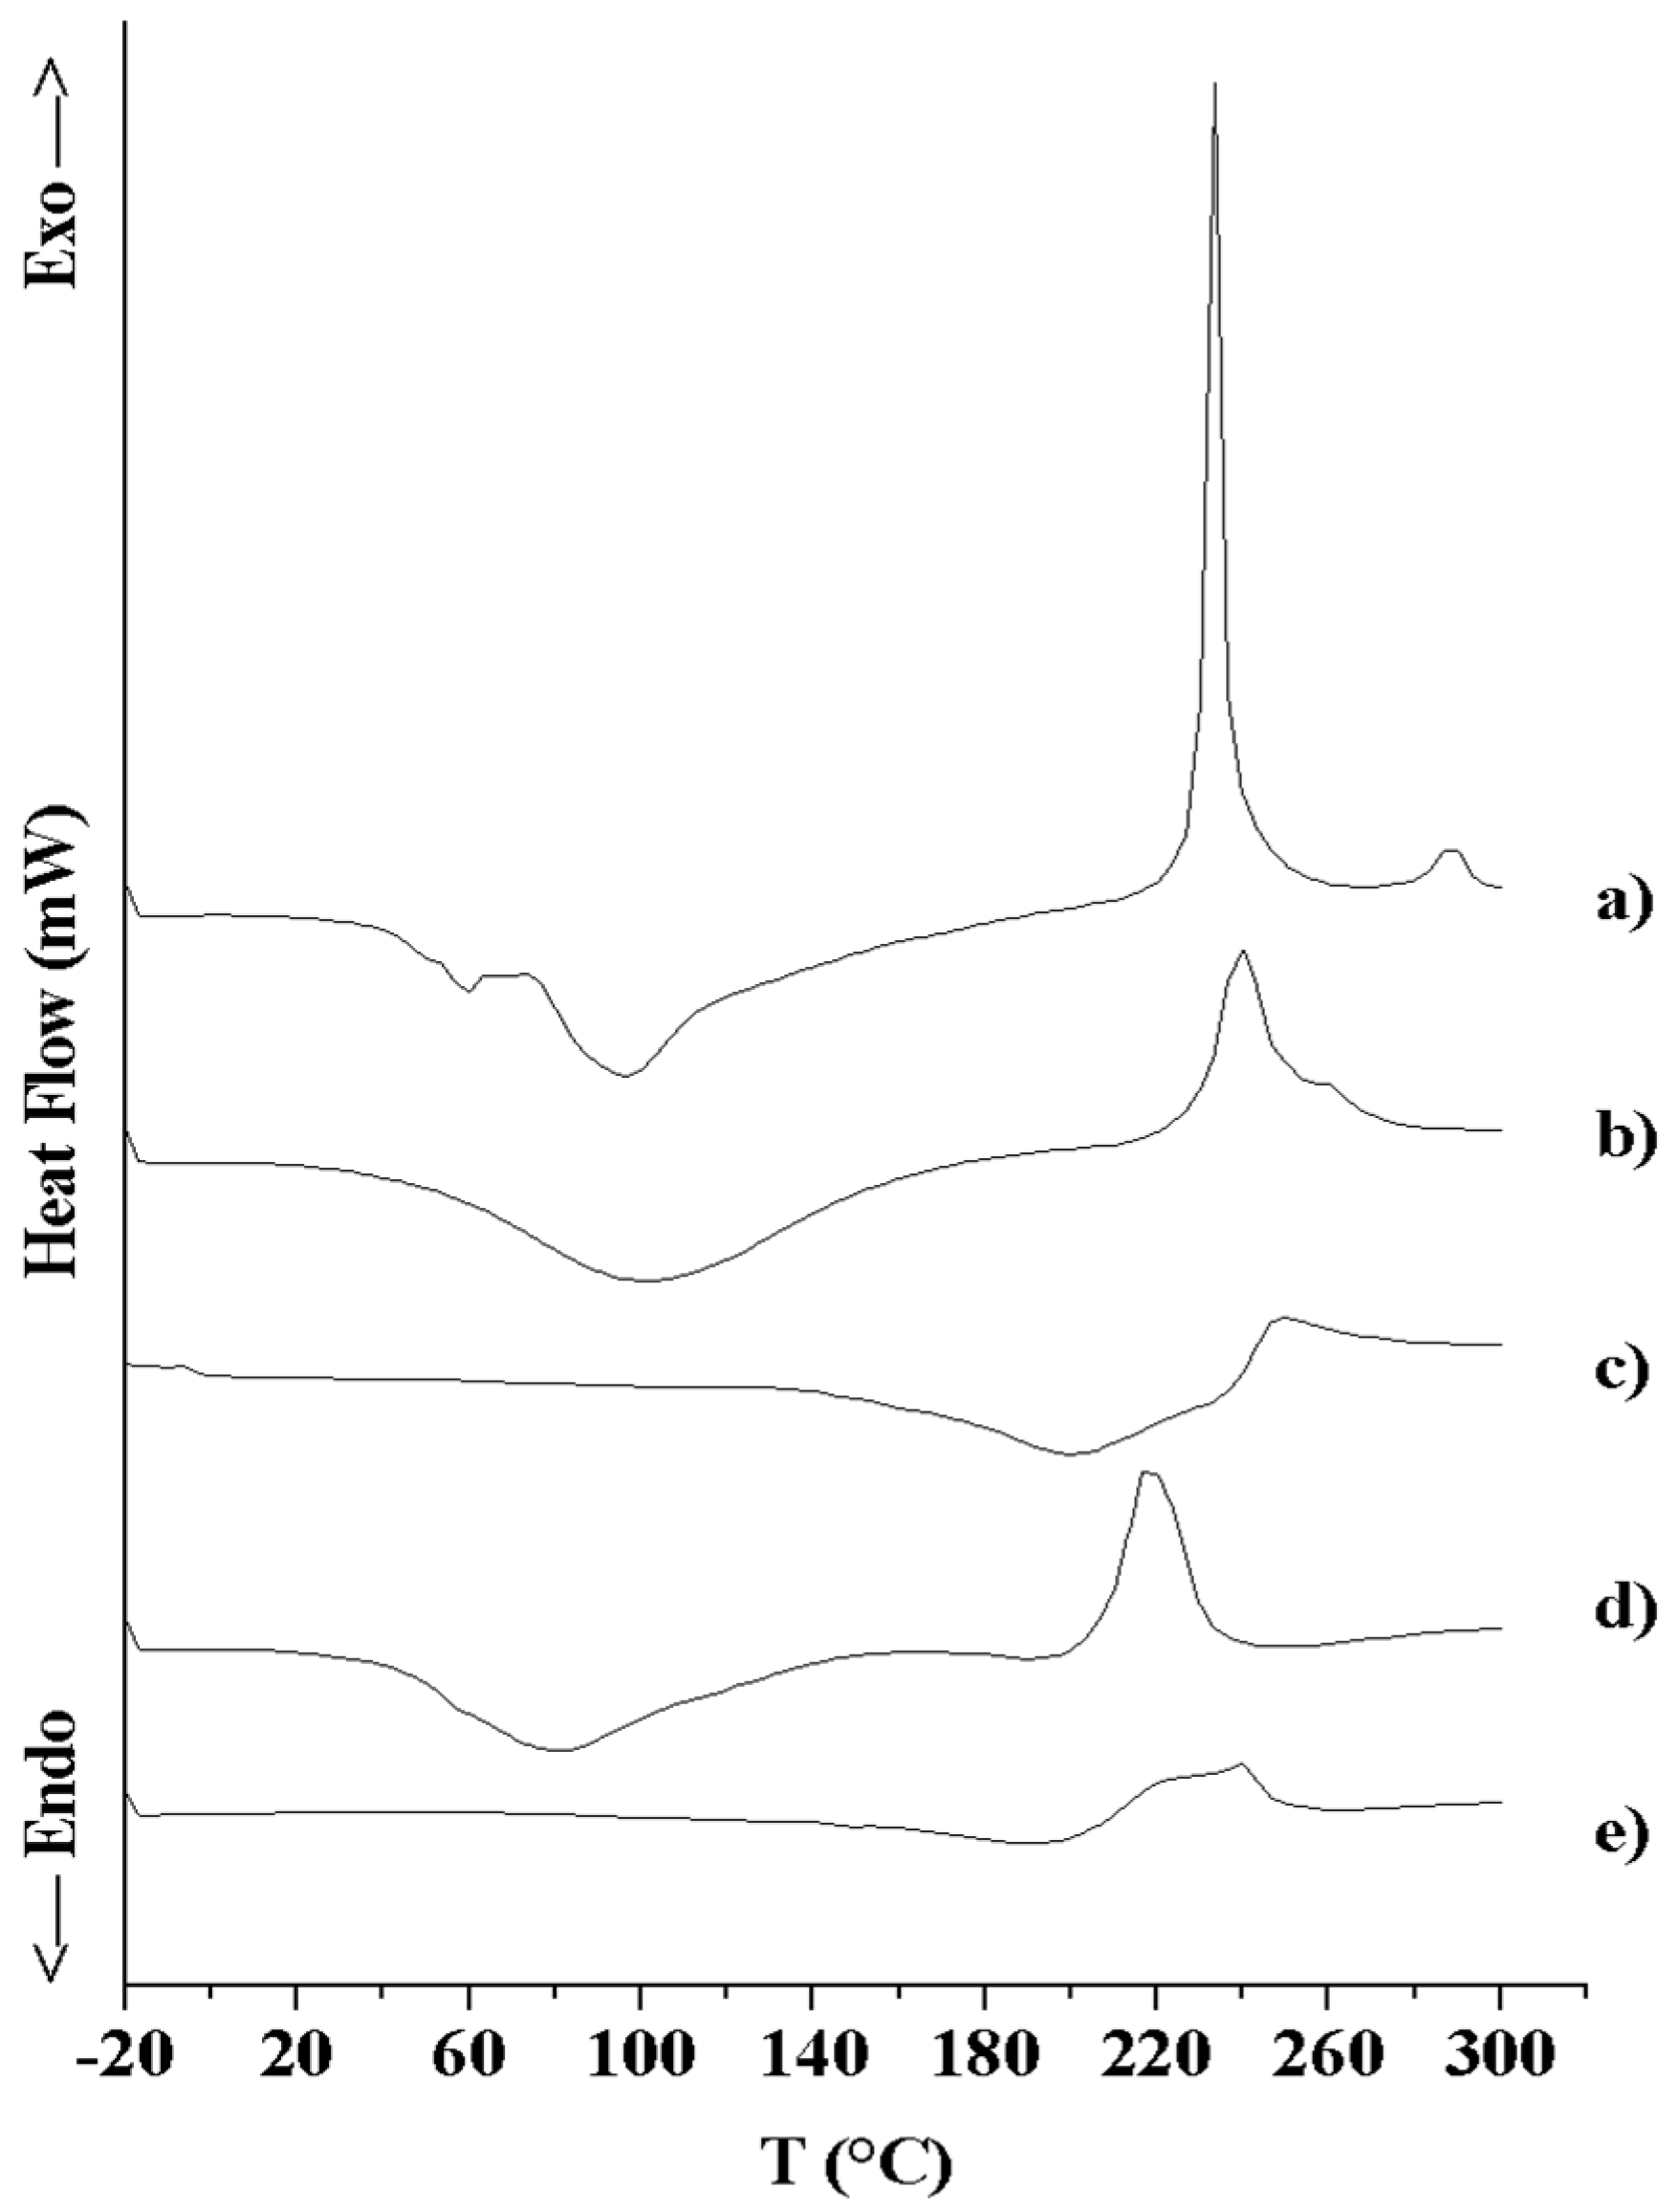
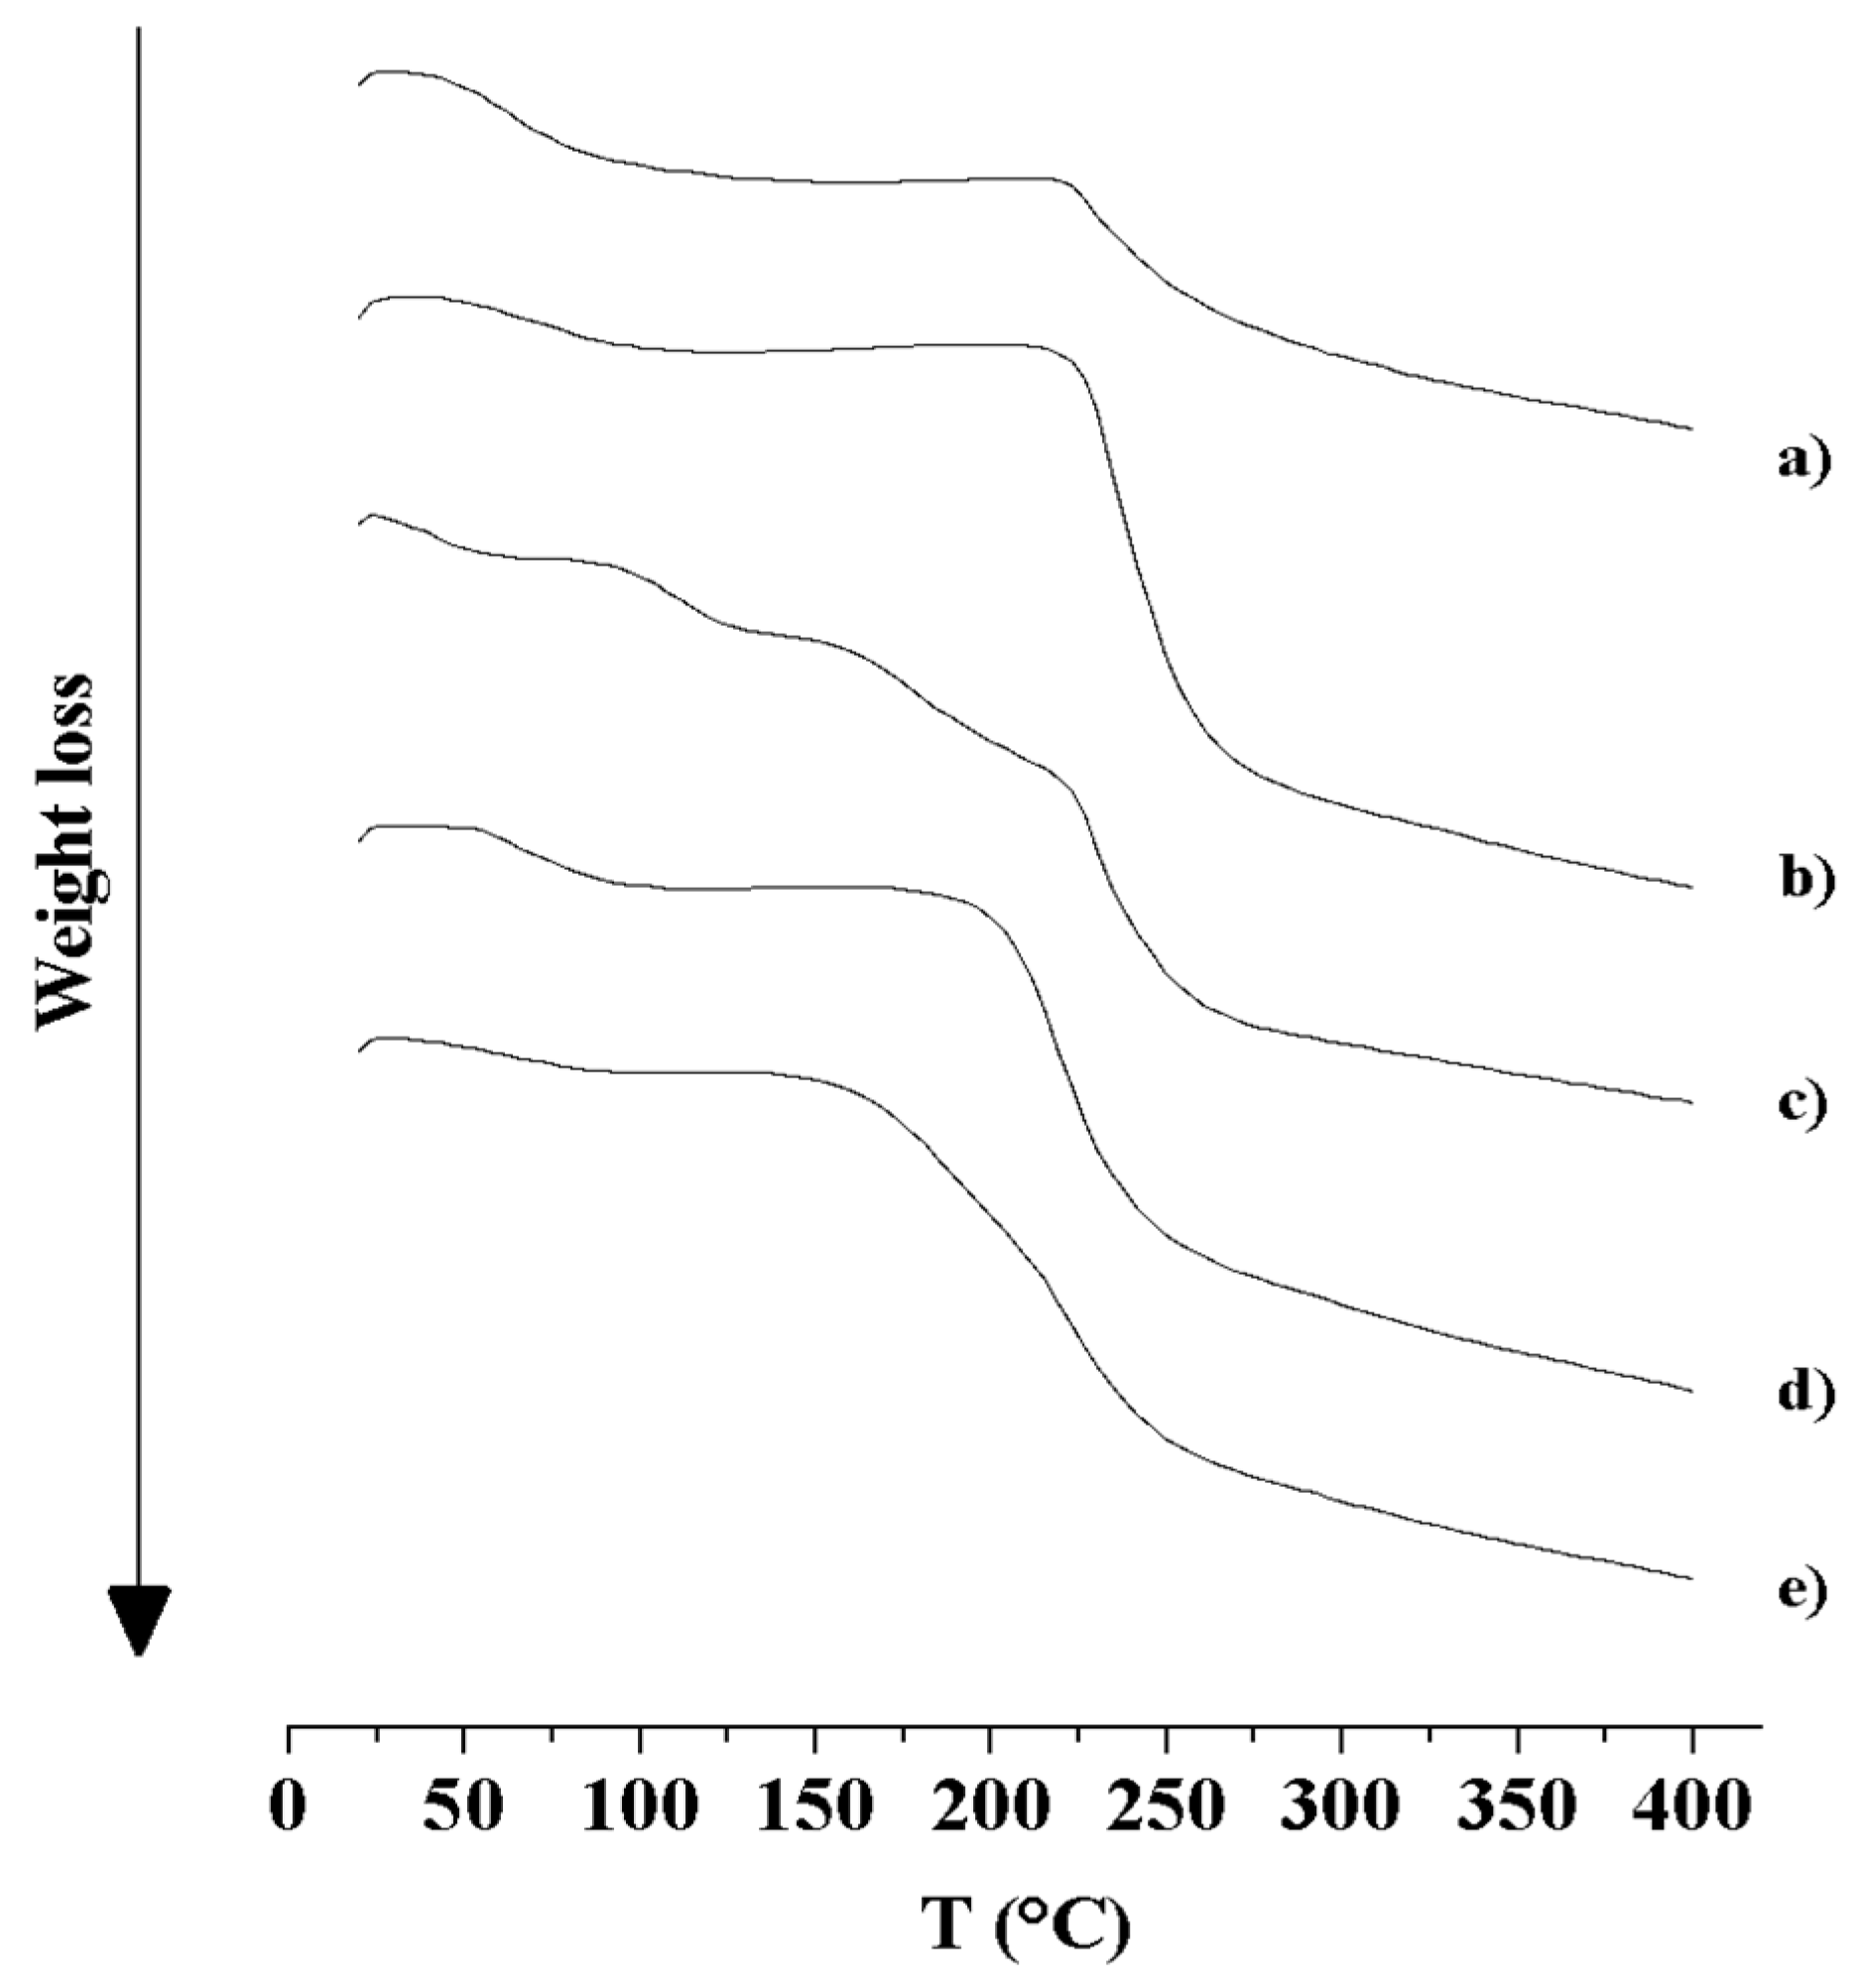
3.2.3. Thermal Analysis (DSC and TGA)
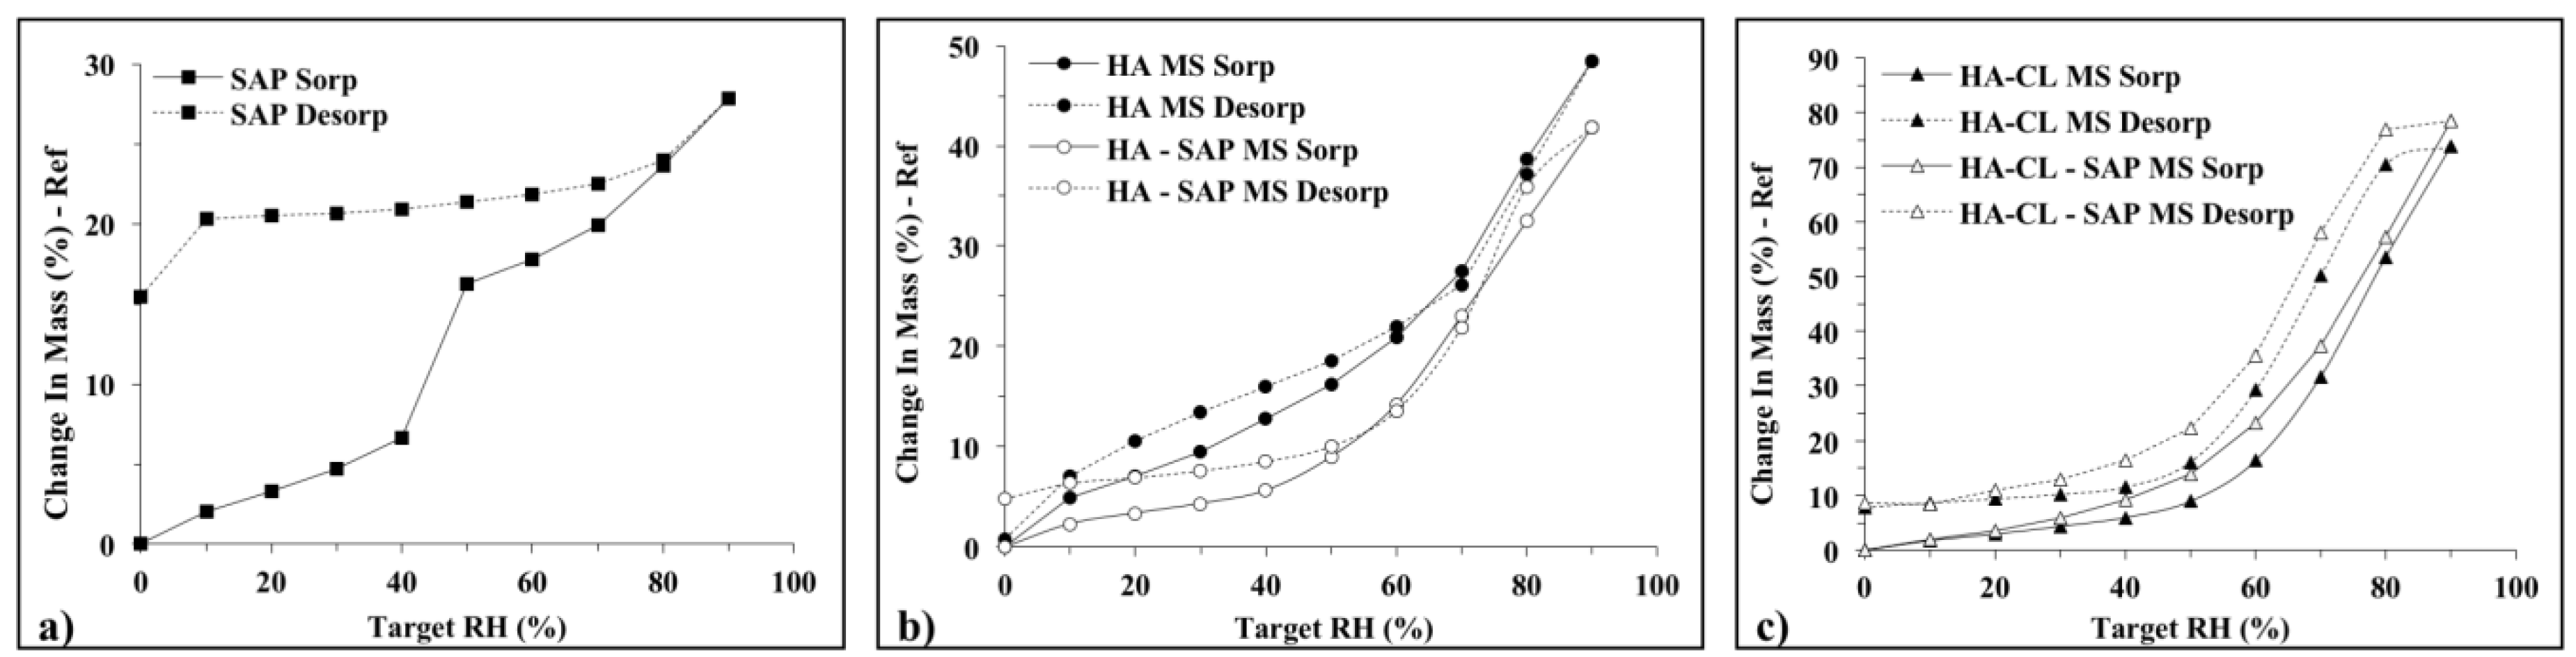
3.2.4. Dynamic Vapor Sorption (DVS)
3.2.5. SAP Solubility
3.2.6. In Vitro Drug Release Studies and Kinetic Analysis
4. Conclusions
5. Patent
Author Contributions
Funding
Acknowledgments
Conflicts of Interest
References
- Fallacara, A.; Baldini, E.; Manfredini, S.; Vertuani, S. Hyaluronic Acid in the Third Millennium. Polymers 2018, 10, 701. [Google Scholar] [CrossRef]
- Laurent, T.C.; Laurent, U.G.B.; Fraser, J.R.E. Functions of hyaluronan. Ann. Rheum. Dis. 1995, 54, 429–432. [Google Scholar] [CrossRef] [PubMed]
- Liao, Y.H.; Jones, S.A.; Forbes, B.; Martin, G.P.; Brown, M.B. Hyaluronan: Pharmaceutical characterization and drug delivery. Drug Deliv. 2005, 2, 327–342. [Google Scholar] [CrossRef] [PubMed]
- Mayol, L.; Quaglia, F.; Borzacchiello, A.; Ambrosio, L.; La Rotonda, M.I. A novel poloxamers/hyaluronic acid in situ forming hydrogel for drug delivery: Rheological, mucoadhesive and in vitro release properties. Eur. J. Pharm. Biopharm. 2008, 1, 199–206. [Google Scholar] [CrossRef]
- Benedetti, L.M.; Topp, E.M.; Stella, V.J. Microspheres of hyaluronic acid esters–fabrication methods and in vitro hydrocortisone release. J. Control. Release 1990, 13, 33–41. [Google Scholar] [CrossRef]
- Casale, M.; Moffa, A.; Sabatino, L.; Pace, A.; Oliveto, G.; Vitali, M.; Baptista, P.; Salvinelli, F. Hyaluronic acid: Perspectives in the upper aero-digestive tract. A systematic review. PLoS ONE 2015, 10, e0130637. [Google Scholar] [CrossRef] [PubMed]
- El Kechai, N.; Geiger, S.; Fallacara, A.; Cañero Infante, I.; Nicolas, V.; Ferrary, E.; Huang, N.; Bochot, A.; Agnely, F. Mixtures of hyaluronic acid and liposomes for drug delivery: Phase behavior, microstructure, and mobility of liposomes. Int. J. Pharm. 2017, 523, 246–259. [Google Scholar] [CrossRef]
- Esposito, E.; Menegatti, E.; Cortesi, R. Hyaluronan-based microspheres as tools for drug delivery: A comparative study. Int. J. Pharm. 2005, 288, 35–49. [Google Scholar] [CrossRef]
- Fallacara, A.; Manfredini, S.; Durini, E.; Vertuani, S. Hyaluronic acid fillers in soft tissue regeneration. Facial Plast. Surg. 2017, 33, 87–96. [Google Scholar] [CrossRef]
- Li, Y.; Han, M.; Liu, T.; Cun, D.; Fang, L.; Yang, M. Inhaled hyaluronic acid microparticles extended pulmonary retention and suppressed systemic exposure of a short-acting bronchodilator. Carbohydr. Polym. 2017, 172, 197–204. [Google Scholar] [CrossRef]
- Lim, S.T.; Martin, G.P.; Berry, D.J.; Brown, M.B. Preparation and evaluation of the in vitro drug release properties and mucoadhesion of novel microspheres of hyaluronic acid and chitosan. J. Control. Release 2000, 66, 281–292. [Google Scholar] [CrossRef]
- Saadat, E.; Shakor, N.; Gholami, M.; Dorkoosh, F.A. Hyaluronic acid based micelle for articular delivery of triamcinolone, preparation in vitro and in vivo evaluation. Int. J. Pharm. 2015, 489, 218–225. [Google Scholar] [CrossRef] [PubMed]
- Shimojo, A.A.; Pires, A.M.; Lichy, R.; Rodrigues, A.A.; Santana, M.H. The crosslinking degree controls the mechanical, rheological, and swelling properties of hyaluronic acid microparticles. J. Biomed. Mater. Res. A 2015, 103, 730–737. [Google Scholar] [CrossRef] [PubMed]
- Ramamurthi, A.; Vesely, I. Smooth muscle cell adhesion on cross-linked hyaluronan gels. J. Biomed. Mater. Res. 2002, 60, 195–205. [Google Scholar] [CrossRef] [PubMed]
- Tomihata, K.; Ikada, Y. Preparation of cross-linked hyaluronic acid films of low water content. Biomaterials 1997, 18, 189–195. [Google Scholar] [CrossRef]
- Citernesi, U.R.; Beretta, L.; Citernesi, L. Crosslinked Hyaluronic Acid, the Process for the Preparation Thereof and Use Thereof in the Aesthetic Field. Patent WO/2015/007773 A1, 22 January 2015. [Google Scholar]
- Fallacara, A.; Vertuani, S.; Panozzo, G.; Pecorelli, A.; Valacchi, G.; Manfredini, S. Novel Artificial Tears Containing Cross-Linked Hyaluronic Acid: An In Vitro Re-Epithelialization Study. Molecules 2017, 22, 2104. [Google Scholar] [CrossRef] [PubMed]
- Fallacara, A.; Busato, L.; Pozzoli, M.; Ghadiri, M.; Ong, H.X.; Young, P.M.; Manfredini, S.; Traini, D. Combination of urea-crosslinked hyaluronic acid and sodium ascorbyl phosphate for the treatment of inflammatory lung diseases: An in vitro study. Eur. J. Pharm. Sci. 2018, 120, 96–106. [Google Scholar] [CrossRef] [PubMed]
- Albèr, C.; Brandner, B.D.; Björklund, S.; Billsten, P.; Corkery, R.W.; Engblom, J. Effects of water gradients and use of urea on skin ultrastructure evaluated by confocal Raman microspectroscopy. Biochim. Biophys. Acta 2013, 1828, 2470–2478. [Google Scholar] [CrossRef]
- Charlton, J.F.; Schwab, I.R.; Stuchell, R. Topical urea as a treatment for non-infectious keratopathy. Acta Ophthalmol. Scand. 1996, 74, 391–394. [Google Scholar] [CrossRef]
- Pan, M.; Heinecke, G.; Bernardo, S.; Tsui, C.; Levitt, J. Urea: A comprehensive review of the clinical literature. Dermatol. Online J. 2013, 19, 20392. [Google Scholar]
- Degim, Z. Use of microparticulate systems to accelerate skin wound healing. J. Drug Target. 2008, 16, 437–448. [Google Scholar] [CrossRef] [PubMed]
- Abd El-Hameed, M.D.; Kellaway, I.W. Preparation and in vitro characterisation of mucoadhesive polymeric microspheres as intra-nasal delivery systems. Eur. J. Pharm. Biopharm. 1997, 44, 53–60. [Google Scholar] [CrossRef]
- Kulkarni, A.D.; Bari, D.B.; Surana, S.J.; Pardeshi, C.V. In vitro, ex vivo and in vivo performance of chitosan-based spray-dried nasal mucoadhesive microspheres of diltiazem hydrochloride. J Drug Deliv. Sci. Technol. 2016, 31, 108–117. [Google Scholar] [CrossRef]
- Khan, H.; Akhtar, N.; Ali, A. Assessment of combined ascorbyl palmitate (AP) and sodium ascorbyl phosphate (SAP) on facial skin sebum control in female healthy volunteers. Drug Res. (Stuttg) 2017, 67, 52–58. [Google Scholar] [CrossRef] [PubMed]
- Klock, J.; Ikeno, H.; Ohmori, K.; Nishikawa, T.; Vollhardt, J.; Schehlmann, V. Sodium ascorbyl phosphate shows in vitro and in vivo efficacy in the prevention and treatment of acne vulgaris. Int. J. Cosmet. Sci. 2005, 27, 171–176. [Google Scholar] [CrossRef] [PubMed]
- Amirlak, B.; Mahedia, M.; Shah, N. A clinical evaluation of efficacy and safety of hyaluronan sponge with vitamin C versus placebo for scar reduction. Plast. Reconstr. Surg. Glob. Open 2016, 4, e792. [Google Scholar] [CrossRef] [PubMed]
- Spiclin, P.; Homar, M.; Zupancic-Valant, A.; Gasperlin, M. Sodium ascorbyl phosphate in topical microemulsions. Int. J. Pharm. 2003, 256, 65–73. [Google Scholar] [CrossRef]
- Wetton, R.E.; Whorlow, R.W. Polymer Systems: Deformation and Flow; Macmillan: London, UK, 1968; ISBN 10 0333062035. [Google Scholar]
- Couarraze, G.; Grossiord, J.L. Initiation à la Rhéologie; TEC & DOC: Paris, France, 2000; ISBN 2-7430-0285-9. [Google Scholar]
- Balzus, B.; Colombo, M.; Sahle, F.F.; Zoubari, G.; Staufenbiel, S.; Bodmeier, R. Comparison of different in vitro release methods used to investigate nanocarriers intended for dermal application. Int. J. Pharm. 2016, 513, 247–254. [Google Scholar] [CrossRef]
- Lusina Kregar, M.; Durrigl, M.; Rozman, A.; Jelcic, Z.; Cetina-Cizmek, B.; Filipovic-Grcic, J. Development and validation of an in vitro release method for topical particulate delivery systems. Int. J. Pharm. 2015, 485, 202–214. [Google Scholar] [CrossRef]
- Schlupp, P.; Blaschke, T.; Kramer, K.D.; Höltje, H.D.; Mehnert, W.; Schäfer-Korting, M. Drug release and skin penetration from solid lipid nanoparticles and a base cream: A systematic approach from a comparison of three glucocorticoids. Skin Pharmacol. Physiol. 2011, 24, 199–209. [Google Scholar] [CrossRef]
- Zoubari, G.; Staufenbiel, S.; Volz, P.; Alexiev, U.; Bodmeier, R. Effect of drug solubility and lipid carrier on drug release from lipid nanoparticles for dermal delivery. Eur. J. Pharm. Biopharm. 2017, 110, 39–46. [Google Scholar] [CrossRef] [PubMed]
- Moore, H.H.; Flanner, J.W. Mathematical comparison of dissolution profiles. Pharm. Technol. 1996, 20, 64–74. [Google Scholar]
- Food and Drug Administration. Guidance for Industry; Dissolution Testing on Immediate Release Solid Oral Dosage Forms; FDA: Rockville, MD, USA, 1997.
- Cirri, M.; Roghi, A.; Valleri, M.; Mura, P. Development and characterization of fast-dissolving tablet formulations of glyburide based on solid self-microemulsifying systems. Eur. J. Pharm. Biopharm. 2016, 104, 19–29. [Google Scholar] [CrossRef] [PubMed]
- Ong, H.X.; Traini, D.; Bebawy, M.; Young, P.M. Epithelial Profiling of Antibiotic Controlled Release Respiratory Formulations. Pharm. Res. 2011, 28, 2327–2338. [Google Scholar] [CrossRef] [PubMed]
- Pozzoli, M.; Traini, D.; Young, P.M.; Sukkar, M.B.; Sonvico, F. Development of a Soluplus budesonide freeze-dried powder for nasal drug delivery. Drug Dev. Ind. Pharm. 2017, 43, 1510–1518. [Google Scholar] [CrossRef] [PubMed]
- Salama, R.O.; Traini, D.; Chan, H.K.; Young, P.M. Preparation and characterisation of controlled release co-spray dried drug-polymer microparticles for inhalation 2: Evaluation of in vitro release profiling methodologies for controlled release respiratory aerosols. Eur. J Pharm. Biopharm. 2008, 70, 145–152. [Google Scholar] [CrossRef] [PubMed]
- Costa, P.; Sousa Lobo, J.M. Modeling and comparison of dissolution profiles. Eur. J. Pharm. Sci. 2001, 13, 123–133. [Google Scholar] [CrossRef]
- Higuchi, T. Rate of release of medicaments from ointment bases containing drugs in suspension. J. Pharm. Sci. 1961, 50, 874. [Google Scholar] [CrossRef]
- Arifin, D.Y.; Lee, L.Y.; Wang, C.H. Mathematical modelling and simulation of drug release from microspheres: Implication to drug delivery systems. Adv. Drug Deliv. Rev. 2006, 58, 1274–1325. [Google Scholar] [CrossRef]
- Korsmeyer, R.W.; Peppas, N.A. Effect of the morphology of hydrophilic polymeric matrices on the diffusion and release of water-soluble drugs. J. Membr. Sci. 1981, 9, 211–227. [Google Scholar] [CrossRef]
- Peppas, N.A. Analysis of fickian and non-fickian drug release from polymers. Pharm. Acta Helv. 1985, 60, 110–111. [Google Scholar] [PubMed]
- Singhvi, G.; Singh, M. Review: In-vitro drug release characterization models. Int. J. Pharm. Sci. Res. 2011, 2, 77–84. [Google Scholar]
- Liu, Z.; Li, X.; Xiu, B.; Duan, C.; Li, J.; Zhang, X.; Yang, X.; Dai, W.; Johnson, H.; Zhang, H.; et al. A novel and simple preparative method for uniform-sized PLGA microspheres: Preliminary application in antitubercular drug delivery. Colloids Surf. B Biointerfaces 2016, 145, 679–687. [Google Scholar] [CrossRef] [PubMed]
- Falcone, S.J.; Palmeri, D.M.; Berg, R.A. Rheological and cohesive properties of hyaluronic acid. J. Biomed. Mater. Res. A 2006, 76, 721–728. [Google Scholar] [CrossRef] [PubMed]
- Collins, N.M.; Birkinshaw, C. Physical properties of crosslinked hyaluronic acid hydrogels. J. Mater. Sci. Mater. Med. 2008, 19, 3335–3343. [Google Scholar] [CrossRef] [PubMed]
- Ré, M.A.; Messias, L.S.; Schettini, H. The influence of the liquid properties and the atomizing conditions on the physical characteristics of the spray-dried ferrous sulfate microparticles. In Proceedings of the 14th International Drying Symposium (IDS 2004), São Paulo, Brazil, 22–25 August 2004; pp. 1174–1181. [Google Scholar]
- Gatej, I.; Popa, M.; Rinaudo, M. Role of pH on hyaluronan behavior in aqueous solution. Biomacromolecules 2005, 6, 61–67. [Google Scholar] [CrossRef] [PubMed]
- Maleki, A.; Kjoniksen, A.; Nystrom, B. Effect of pH on the behavior of hyaluronic acid in dilute and semidilute aqueous solutions. Macromol. Symp. 2008, 274, 131–140. [Google Scholar] [CrossRef]
- Bari, E.; Arciola, C.R.; Vigani, B.; Crivelli, B.; Moro, P.; Marrubini, G.; Sorrenti, M.; Catenacci, L.; Bruni, G.; Chlapanidas, T.; et al. In vitro effectiveness of microspheres based on silk sericin and Chlorella vulgaris or Arthrospira platensis for wound healing applications. Materials (Basel) 2017, 10, 983. [Google Scholar] [CrossRef] [PubMed]
- Ranjan, S.; Fontana, F.; Ullah, H.; Hirvonen, J.; Santos, H.A. Microparticles to enhance delivery of drugs and growth factors into wound sites. Ther. Deliv. 2016, 7, 711–732. [Google Scholar] [CrossRef] [PubMed]
- Anonymous. Benzoyl peroxide microsphere formulations: What is the science supporting microsphere vehicle technology and clinical use? J. Clin. Aesthet. Dermatol. 2009, 2, 46–54. [Google Scholar]
- Vertuani, S.; Cvetkovska, A.D.; Zauli, S.; Virgili, A.; Manfredini, S.; Bettoli, V. The topical vehicle as a key factor in the management of the psoriatic patients’ therapy. G. Ital. Dermatol. Venereol. 2013, 148, 679–685. [Google Scholar]
- Klug, H.P.; Alexander, L.E. X-ray Diffraction Procedures for Polycrystalline and Amorphous Materials, 2nd ed.; John Wiley and Sons: New York, NY, USA, 1974; ISBN 978-0-471-49369-3. [Google Scholar]
- Siepmann, J.; Peppas, N.A. Modeling of drug release from delivery systems based on hydroxypropyl methylcellulose. Adv. Drug Deliv. Rev. 2001, 48, 139–157. [Google Scholar] [CrossRef]
- Yang, S.C.; Zhu, J.B. Preparation and characterization of camptothecin solid lipid nanoparticles. Drug Dev. Ind. Pharm. 2002, 28, 265–274. [Google Scholar] [CrossRef] [PubMed]
- Moyano, M.A.; Broussalis, A.M.; Segall, A.I. Thermal analysis of lipoic acid and evaluation of the compatibility with excipients. J. Therm. Anal. Calorim. 2010, 99, 631–637. [Google Scholar] [CrossRef]
- Collins, M.N.; Birkinshaw, C. Comparison of the effectiveness of four different crosslinking agents with hyaluronic acid hydrogel films for tissue-culture applications. J. Appl. Polym. Sci. 2007, 104, 3183–3191. [Google Scholar] [CrossRef]
- Kafedjiiski, K.; Jetti, R.K.; Föger, F.; Hoyer, H.; Werle, M.; Hoffer, M.; Bernkop-Schnürch, A. Synthesis and in vitro evaluation of thiolated hyaluronic acid for mucoadhesive drug delivery. Int. J. Pharm. 2007, 343, 48–58. [Google Scholar] [CrossRef] [PubMed]
- Lapcik, L.; Otyepkovà, E.; Lapcìkovà, B.; Otyepka, M.; Vlcek, J.; Kupskà, I. Physicochemical analysis of hyaluronic acid powder for cosmetic and pharmaceutical processing. In Hyaluronic acid for biomedical and pharmaceutical applications, 1st ed.; Collins, M.N., Ed.; Smithers Rapra Technology: Shropshire, UK, 2014; pp. 89–101. ISBN 10 9781909030770. [Google Scholar]
- Lewandowska, K.; Sionkowska, A.; Grabska, S.; Kaczmarek, B. Surface and thermal properties of collagen/hyaluronic acid blends containing chitosan. Int. J. Biol. Macromol. 2016, 92, 371–376. [Google Scholar] [CrossRef] [PubMed]
- Réeff, J.; Gaignaux, A.; Goole, J.; De Vriese, C.; Amighi, K. New sustained-release intraarticular gel formulations based on monolein for local treatment of arthritic diseases. Drug Dev. Ind. Pharm. 2013, 39, 1731–1741. [Google Scholar] [CrossRef]
- Albèr, C.; Engblom, J.; Falkman, P.; Kocherbitov, V. Hydration of hyaluronan: Effects on structural and thermodynamic properties. J. Phys. Chem. B 2015, 119, 4211–4219. [Google Scholar] [CrossRef]
- Panagopoulou, A.; Vázquez Molina, J.; Kyritsis, A.; Monleón Pradas, M.; Vallés Lluch, A.; Gallego Ferrer, G.; Pissis, P. Glass Transition and Water Dynamics in Hyaluronic Acid Hydrogels. Food Biophys. 2013, 8, 192–202. [Google Scholar] [CrossRef] [Green Version]
- Servaty, R.; Schiller, J.; Binder, H.; Arnold, K. Hydration of polymeric components of cartilage—An infrared spectroscopic study on hyaluronic acid and chondroitin sulfate. Int. J. Biol. Macromol. 2001, 28, 121–127. [Google Scholar] [CrossRef]
- Montenegro, L.; Trapani, A.; Fini, P.; Mandracchia, D.; Latrofa, A.; Cioffi, N.; Chiarantini, L.; Giusi, G.P.; Brundu, S.; Puglisi, G. Chitosan nanoparticles for topical co-administration of the antioxidants glutathione and idebenone: Characterization and in vitro release. Br. J. Pharm. Res. 2014, 4, 2387–2406. [Google Scholar] [CrossRef]
- Alves, A.C.; Ramos, I.I.; Nunes, C.; Magalhães, L.M.; Sklenárová, H.; Segundo, M.A.; Lima, J.L.F.C.; Reis, S. On-line automated evaluation of lipid nanoparticles transdermal permeation using Franz diffusion cell and low-pressure chromatography. Talanta 2016, 146, 369–374. [Google Scholar] [CrossRef] [PubMed] [Green Version]
- Dürrigl, M.; Kwokal, A.; Hafner, A.; Šegvi Klari, M.; Dumicic, A.; Cetina-Cižmek, B.; Filipovic-Grcic, J. Spray dried microparticles for controlled delivery of mupirocin calcium: Process-tailored modulation of drug release. J. Microencapsul. 2011, 28, 108–121. [Google Scholar] [CrossRef] [PubMed]
- Moreno-Bautista, G.; Tam, K.C. Evaluation of dialysis membrane process for quantifying the in vitro drug-release from colloidal drug carriers. Colloids Surf. A Physicochem. Eng. Asp. 2011, 389, 299–303. [Google Scholar] [CrossRef]
- Zambito, Y.; Pedreschi, E.; Di Colo, G. Is dialysis a reliable method for studying drug release from nanoparticulate systems?—A case study. Int. J. Pharm. 2012, 434, 28–34. [Google Scholar] [CrossRef] [PubMed]
- Garti, N. Delivery and Controlled Release of Bioactives in Foods and Nutraceuticals, 1st ed.; Woodhead Publishing: Sawston, UK, 2008; p. 496. ISBN 978-1-84569-145-5. [Google Scholar]


| Solution | pH | η0 (Pa.s) | G′1Hz (Pa) | Cf (Hz) |
|---|---|---|---|---|
| HA | 6.8 ± 0.1 | 4.2 ± 0.2 | 5.5 ± 0.7 | 6.2 ± 1.8 |
| HA-SAP | 8.9 ± 0.1 | 0.7 ± 0.0 | 0.8 ± 0.0 | 15.9 ± 0.4 |
| HA-CL | 7.2 ± 0.0 | 9.1 ± 0.3 | 13.2 ± 0.6 | 1.8 ± 0.0 |
| HA-CL–SAP | 8.1 ± 0.1 | 6.3 ± 0.5 | 9.2 ± 0.4 | 3.1 ± 0.1 |
| MS Formulation | Dv50 (μm) | D[4,3] (μm) | Span | Y(%) | DL(%) | EE(%) |
|---|---|---|---|---|---|---|
| 10 min | ||||||
| HA | 117.7 ± 20.0 | 246.0 ± 53.6 | 4.2 ± 0.4 | 68.6 ± 1.6 | - | - |
| HA–SAP | 71.7 ± 4.2 | 121.0 ± 13.4 | 4.3 ± 0.1 | 75.2 ± 4.4 | 39.2 ± 0.4 | 59.0 ± 4.0 |
| HA-CL | 290.0 ± 32.5 | 311.0 ± 32.5 | 1.5 ± 0.2 | 56.7 ± 5.4 | - | - |
| HA-CL–SAP | 245.5 ± 27.6 | 300.5 ± 24.7 | 2.4 ± 0.5 | 70.6 ± 1.1 | 32.5 ± 1.4 | 65.3 ± 3.5 |
| 30 min | ||||||
| HA | 113.7 ± 19.6 | 154.7 ± 27.5 | 2.9 ± 0.1 | 79.4 ± 2.9 | - | - |
| HA–SAP | 54.6 ± 3.0 | 63.2 ± 2.6 | 2.0 ± 0.1 | 81.5 ± 1.4 | 39.3 ± 1.0 | 64.1 ± 2.9 |
| HA-CL | 181.5 ± 3.8 | 208.7 ± 6.7 | 2.5 ± 0.1 | 76.7 ± 1.3 | - | - |
| HA-CL–SAP | 117.0 ± 4.2 | 135.0 ± 3.5 | 2.3 ± 0.0 | 78.2 ± 3.3 | 32.1 ± 1.0 | 68.9 ± 1.0 |
| 60 min | ||||||
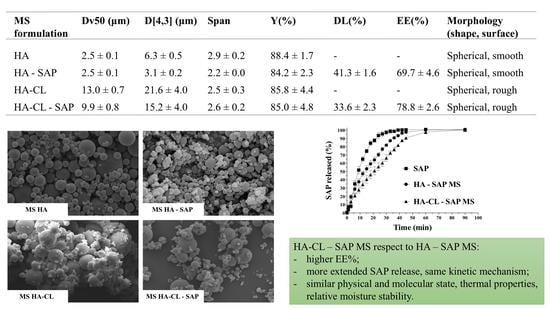
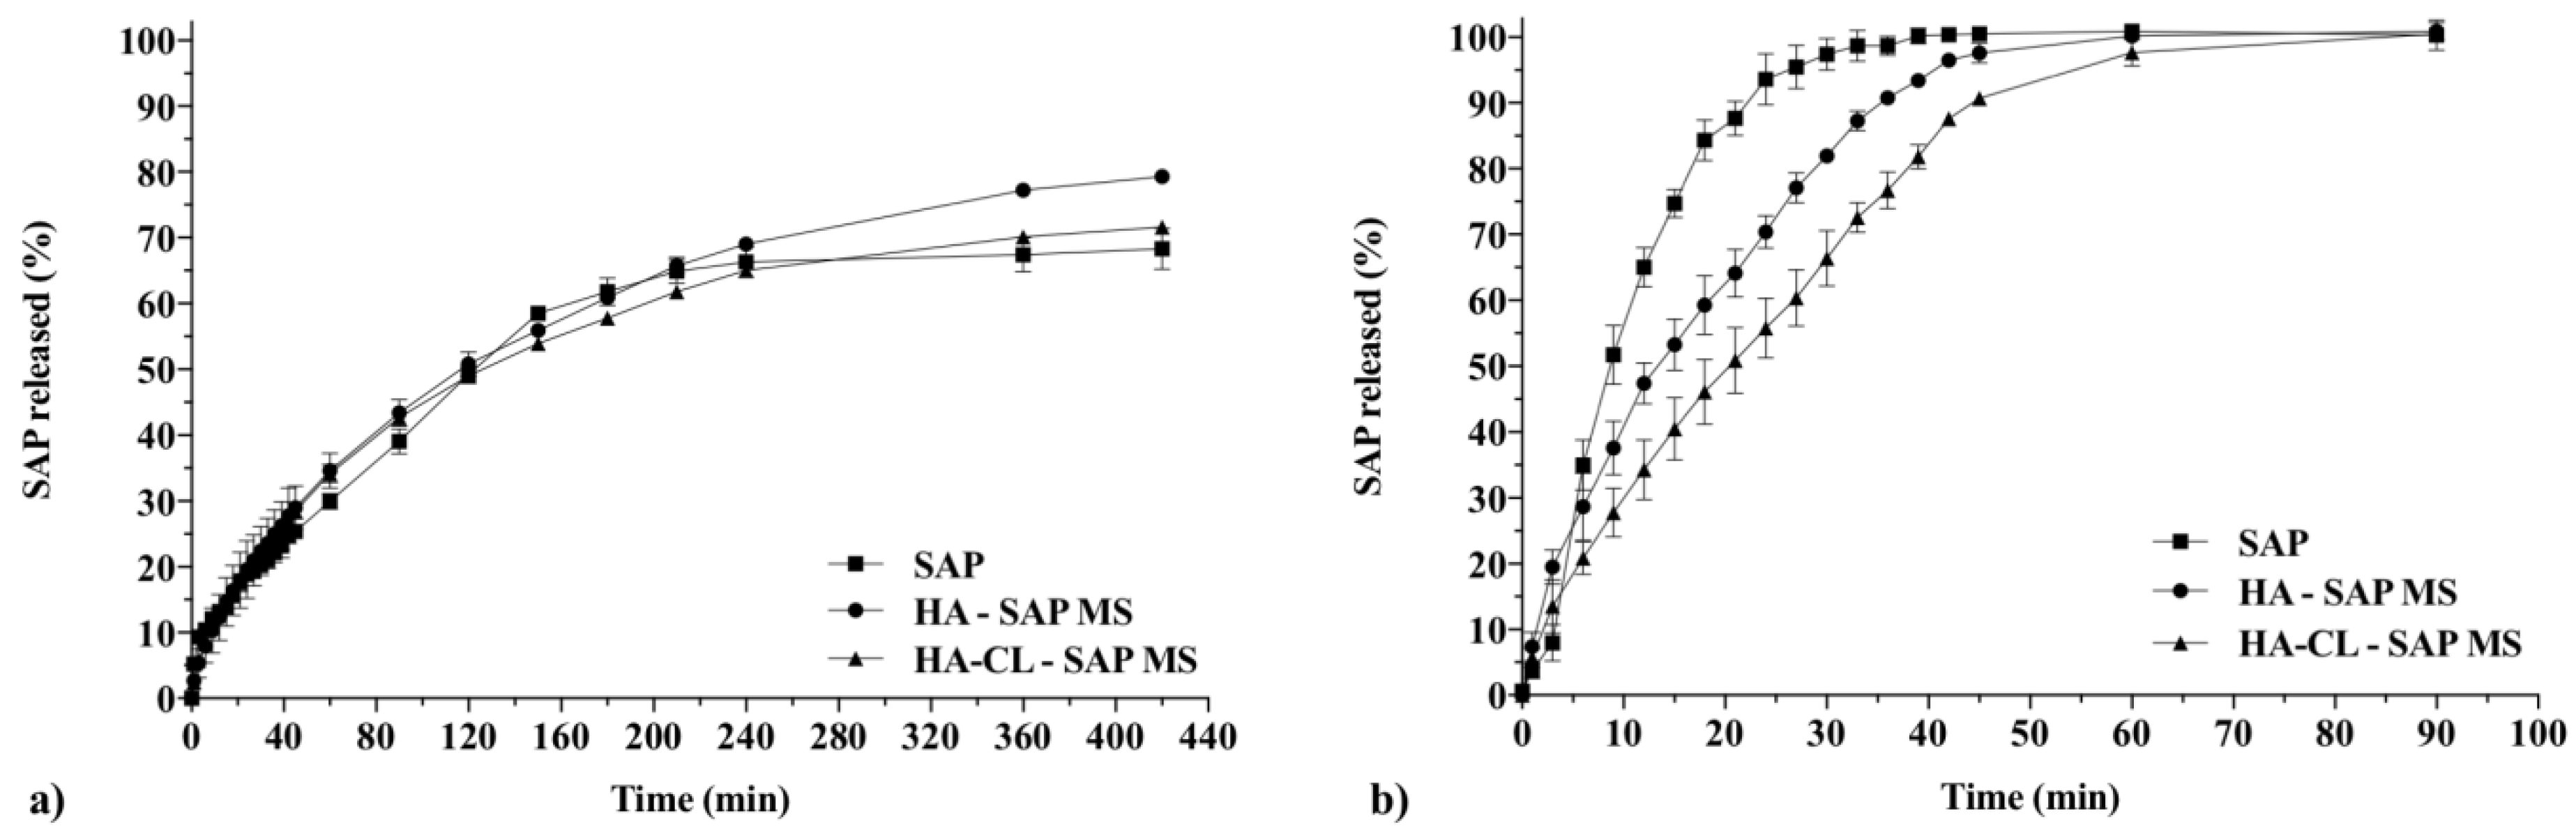
| HA | 2.5 ± 0.1 | 6.3 ± 0.5 | 2.9 ± 0.2 | 88.4 ± 1.7 | - | - |
| HA–SAP | 2.5 ± 0.1 | 3.1 ± 0.2 | 2.2 ± 0.0 | 84.2 ± 2.3 | 41.3 ± 1.6 | 69.7 ± 4.6 |
| HA-CL | 13.0 ± 0.7 | 21.6 ± 4.0 | 2.5 ± 0.3 | 85.8 ± 4.4 | - | - |
| HA-CL–SAP | 9.9 ± 0.8 | 15.2 ± 4.0 | 2.6 ± 0.2 | 85.0 ± 4.8 | 33.6 ± 2.3 | 78.8 ± 2.6 |
| Release Method | Reference Formulation | Test Formulation | f1 | f2 |
|---|---|---|---|---|
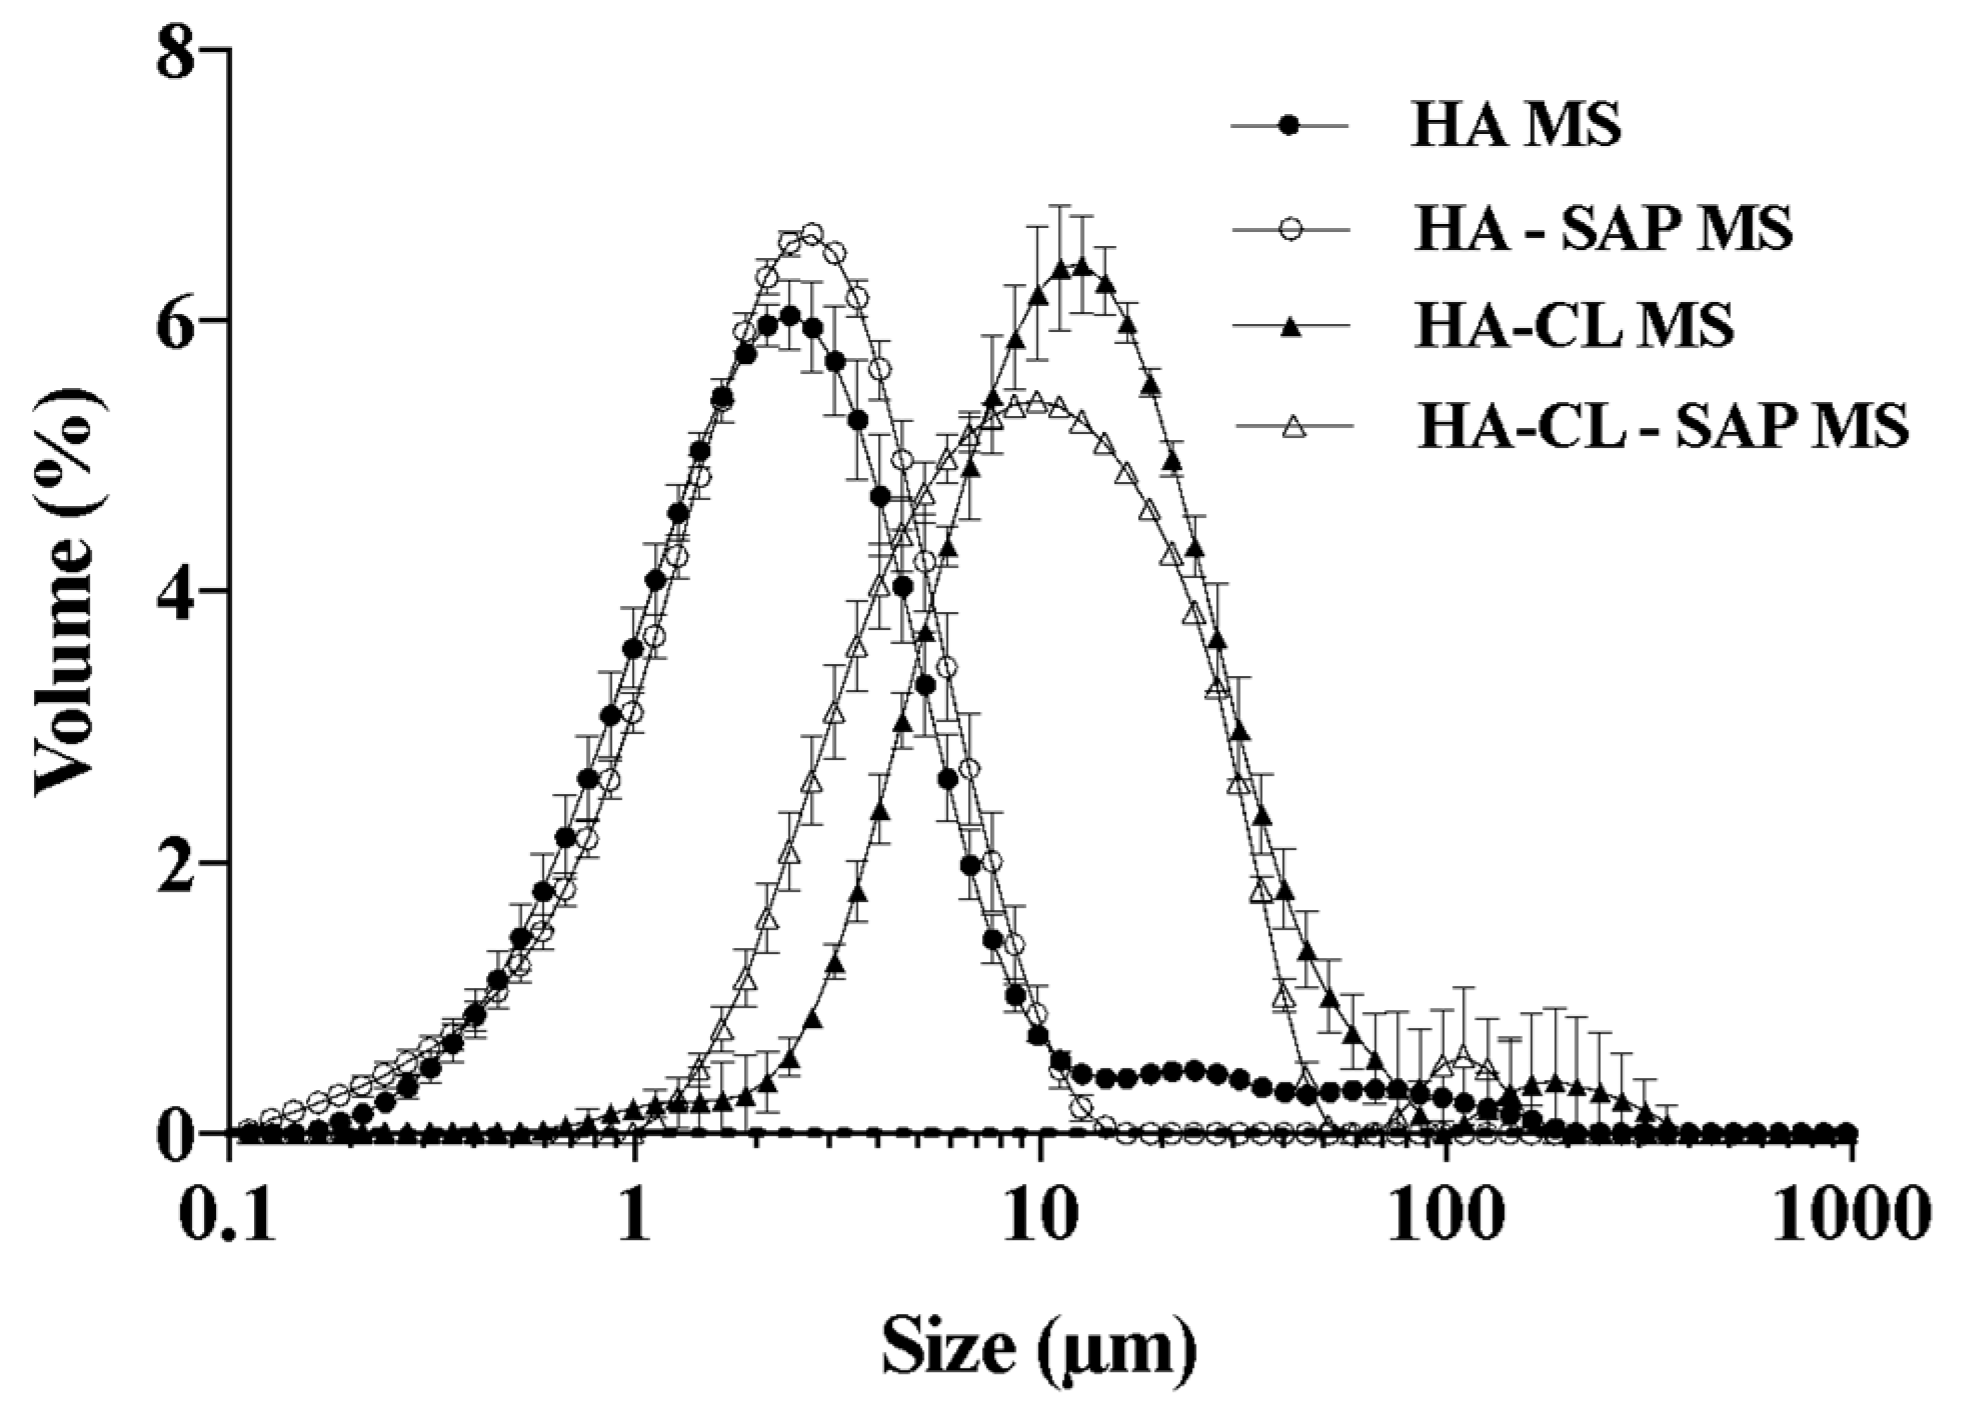
| Dialysis | SAP | HA–SAP MS | 7.9 | 71.4 |
| SAP | HA-CL–SAP MS | 7.0 | 74.9 | |
| HA–SAP MS | HA-CL–SAP MS | 3.3 | 82.5 | |
| Franz diffusion cell | SAP | HA–SAP MS | 15.4 | 42.7 |
| SAP | HA-CL–SAP MS | 27.4 | 30.8 | |
| HA–SAP MS | HA-CL–SAP MS | 15.1 | 47.9 |
| Formulation | Correlation Coefficient R2 | |||
|---|---|---|---|---|
| Zero Order | First Order | Higuchi | Korsmeyer-Peppas | |
| HA–SAP MS | 0.729 | 0.941 | 0.929 | 0.993 |
| HA-CL–SAP MS | 0.837 | 0.922 | 0.960 | 0.999 |
© 2018 by the authors. Licensee MDPI, Basel, Switzerland. This article is an open access article distributed under the terms and conditions of the Creative Commons Attribution (CC BY) license (http://creativecommons.org/licenses/by/4.0/).
Share and Cite
Fallacara, A.; Marchetti, F.; Pozzoli, M.; Citernesi, U.R.; Manfredini, S.; Vertuani, S. Formulation and Characterization of Native and Crosslinked Hyaluronic Acid Microspheres for Dermal Delivery of Sodium Ascorbyl Phosphate: A Comparative Study. Pharmaceutics 2018, 10, 254. https://doi.org/10.3390/pharmaceutics10040254
Fallacara A, Marchetti F, Pozzoli M, Citernesi UR, Manfredini S, Vertuani S. Formulation and Characterization of Native and Crosslinked Hyaluronic Acid Microspheres for Dermal Delivery of Sodium Ascorbyl Phosphate: A Comparative Study. Pharmaceutics. 2018; 10(4):254. https://doi.org/10.3390/pharmaceutics10040254
Chicago/Turabian StyleFallacara, Arianna, Filippo Marchetti, Michele Pozzoli, Ugo Raffaello Citernesi, Stefano Manfredini, and Silvia Vertuani. 2018. "Formulation and Characterization of Native and Crosslinked Hyaluronic Acid Microspheres for Dermal Delivery of Sodium Ascorbyl Phosphate: A Comparative Study" Pharmaceutics 10, no. 4: 254. https://doi.org/10.3390/pharmaceutics10040254