Effect of Species Complementarity on Financial Return in Mixed Stands of European Beech and Scots Pine in Northern Spain


Department of Forestry and Environmental Engineering and Management, School of Forestry, Universidad Politécnica de Madrid, C/José Antonio Novais 10, 28040 Madrid, Spain
Forests 2018, 9(9), 559; https://doi.org/10.3390/f9090559
Submission received: 4 August 2018
/
Revised: 7 September 2018
/
Accepted: 9 September 2018
/
Published: 12 September 2018
(This article belongs to the Special Issue Competition and Facilitation in Mixed Species Forests)
Abstract
:The research on mixed-species forestry has rapidly increased in recent decades because there is a growing interest in these types of stands for environmental reasons. Their positive influence on ecosystem biodiversity, stability and resilience, as well as their role in the new challenge brought up by the adaptation to global change, have been the object of many research works. However, the economic implications of mixed-species forest management have not deserved the same attention. The objective of this work is to study the effect of species interactions on productivity, and to economically assess this effect. This research is focused on the analysis of financial return and risk in even aged mixed stands of Pinus sylvestris and Fagus sylvatica in Northern Spain. Growth and yield projections for monospecific and mixed stands of Scots pine and European beech were made by means of a previous model developed from a set of the Spanish National Forest Inventory plots in the region of Navarre. Data from yield tables for both species were used. The effect of species proportion on total stand yield was assessed and transgressive overyielding was found for some mixing ratios. A data series on average stumpage price for both species in Spain over a 29-year period was compiled and the joint probability distribution of price data was used to generate 500 price scenarios. Different management alternatives based on species proportion and rotation age were considered and evaluated in terms of profitability and risk. Some management recommendations can be derived from the results obtained, which point at an optimum mixing ratio from 30% to 40% Scots pine and 70% to 60% European beech.
1. Introduction
The discussion on the convenience of single-species or mixed-species forest management has been present since the beginning of Forest Science. During the XIXth century, mixed-species forest management was favored by Cotta and Gayer, among other eminent foresters, who claimed that only mixed forests could provide the conditions to deal with the uncertainty of future development and environmental risks [1,2].
There seems to be a trend towards mixed species forest management in Europe and elsewhere mainly due to environmental reasons [3]. It is known that they have positive influence on soil properties regarding nutrient cycling [4] and their higher stability against biotic and abiotic disturbances such as pests, diseases, windthrows, fire and snow damage [5], and it seems accepted that mixed stands are associated with higher biodiversity levels [6,7,8].
One of the benefits of mixed-species stands from an ecological point of view is the role that they can play as carbon sinks, thus mitigating the effects of global change, and their higher resilience which can turn them into a key element of an adaptation strategy.
With regard to these benefits of global change mitigation and adaptation, Maraseni and Pandey [9] assessed soil organic carbon (SOC) stocks under five different forest types in Nepal and determined that forest types can be an indicator of SOC. They also found that, for similar site conditions, soils under mixed-species forests have higher amounts of SOC than those under monospecific forests. In addition, the increase in SOC associated to mixed stands has positive effects on site productivity and sustainability through the modification of soil characteristics leading to a higher nutrient and water availability.
From an economic point of view, mixed forests do not seem to be equally attractive, and thus the trend towards the establishment of mixed stands has not been embraced by private investors [10]. Despite the fact that a higher timber yield has been reported in some cases and a wider variety of products is available, mixed stands have always been assumed to be less profitable than monospecific stands.
However, it is important to analyze the behavior of mixed stands from a financial point of view to ascertain if their environmental benefits are accompanied by economic advantages. Knoke et al. [1] considered the economic implications of mixed investments of monospecific Norway spruce and European beech stands by using portfolio theory to assess the risk reduction associated with a diversification strategy in a forest investment. Existing yield models for both species were used and price volatility was analyzed from historical data on stumpage price for spruce and beech. The Monte Carlo simulation technique was used to generate 1000 scenarios and estimate the financial return (Net Present Value, NPV) and the associated risk (measured by the standard deviation of NPV) for monospecific stands and for different proportions of both species. A literature review was conducted by Knoke et al. [2] who identified the need to integrate the findings on biophysical properties of mixed forests such as growth, yield, and ecological stability against natural hazards into forest economic models, especially if these models were to be used in decision-making.
Neuner et al. [11] estimated financial return and risk of a private forest in Bavaria with over ten species and determined the species combination leading to the optimal portfolio, as well as the convenience of pruning and naturally regenerating the stands.
Portfolio theory was also used by Neuner and Knoke [12] to study the effect of climate change on the financial return of Norway spruce and European beech stands considering its impact on tree mortality and different silvicultural treatments such as pruning and planting of spruce versus natural regeneration of beech.
Brunette et al. [13] applied portfolio selection theory to determine the optimal productivity-risk combinations of tree species in the French administrative departments. Instead of using Monte Carlo simulations, they used historical data on productivity from the French National Forest Inventory to simulate the portfolio selection, and used a biotechnical indicator such as productivity instead of financial return in the optimization process. The variation of productivity was used as an indicator of risk and was the variable to minimize. The optimal species combinations were then compared to the species probability of presence and significant positive correlations were found between portfolio weights and probability of presence for all species. The authors concluded that the most resilient species should be privileged in the optimal portfolios.
A similar approach was used by Dragicevic et al. [14] who determined the optimal tree species combinations within reach of forest managers considering three objectives, wood production, carbon sequestration and soil expectation value, and their respective variations, and three different IPCC climate change scenarios. They found that risk aversion of forest managers is high and that the first two objectives led to similar solutions, while the financial objective led to a lower species diversification.
The objective of carbon sequestration was also addressed by Maraseni and Cockfield [15], who compared the financial return of mixed-species environmental plantations for conservation and carbon sequestration in Australia with that of alternative land uses. The remuneration for the farmers was calculated from the valuation in monetary terms of the accumulated above and below ground biomass along the afforestation project lifespan.
Alternative silvicultural treatments have also been considered. Vettenranta [16] analyzed the relationship between species composition and net present value for different thinning alternatives in a mixed stand of Norway spruce and Scots pine. He concluded that there is an optimum treatment program in terms of thinning intensity, thinnings from the above led to higher NPVs than thinnings from below, but the optimum species proportion did not depend significantly on whether thinnings were performed from above or from below.
Lu and Gong [17] proposed a decision model to determine adaptive thinning strategies for mixed-stands of Norway spruce and Scots pine with stochastic timber prices by using a feedback control function.
However, none of these authors considered the facilitation effect and positive interaction which may occur when both species grow in the same stand. Griess and Knoke [18] considered the ecological interdependence between species that can lead to enhanced resistance against natural hazards, and used the results of a study by Kennel in 1965 to model changes in growth performance. According to this study (as cited in Griess and Knoke [18]), a mixed-species stand of 50% spruce and 50% beech results in an increase in volume increment of 15% for spruce and a decrease of 13% for beech. This result was used to generate volume increment factors for different proportions of both species by means of a linear interpolation.
Forest yield in mixed stands can be similar or lower than in monospecific stands if the species present are not complementary or the mixture is not adapted to site conditions [19,20]. On the contrary, complementary species may lead to overyielding in mixed stands because of reduced competition and facilitation [21]. Therefore, these effects must be considered when analyzing the financial return of a mixed-species forest investment considering that the relationship between species diversity and productivity depends on a number of factors which must be studied for each particular case.
Forrester et al. [22] found out that the interactions between Abies alba and Picea abies vary with climate, site quality and stand density. Complementarity is higher when mixed-species stands show an improvement in resource use efficiency when compared to monospecific stands. The relationships between productivity and complementarity depend on the resources limiting productivity (water, nutrients, light, ...) and are also influenced by stand density [23,24].
Pukkala et al. [25] found that mixed stands of Scots pine and Norway spruce on medium fertility sites grow better than monospecific stands of any of the two species. Similar results were obtained for these two species in Sweden and Great Britain [26,27]. Lu et al. [28] studied periodic annual volume increment in four two-species combinations of Douglas fir, European beech, Scots pine and pedunculate oak and found that, in most cases, overyielding was higher at poor soils than at rich soils.
Complementarity effects in mixed stands have been investigated in different areas of the world and with different species. Yang et al. reported in 2009 that mixed plantations of Eucalyptus U6 and Acacia crassicarpa in Southern China in a proportion of 2 to 1 attain a total biomass which is 119% of that measured in monospecific Eucalyptus stands or 170% of the biomass in monospecific Acacia stands (as cited in Maraseni et al. [29]).
Condés et al. [23] found that the mixing effect in Scots pine-European beech stands in the province of Navarre (Spain) was mainly positive resulting in an increase in volume growth of both species (transgressive overyielding) for some proportions. This positive effect depends on stocking degree and dominant height of the stand.
The paragraphs above show that the impact of species interactions on productivity has been thoroughly studied for different species in Europe and elsewhere. However, this effect has not been considered when estimating financial return of investments in mixed-species stands.
Therefore, any sound analysis on the financial attractiveness of mixed stands must consider the existing information on timber yield in monospecific stands, the need to develop an estimate of overyielding in mixed stands for different proportions of the species concerned, and a proper way to address an important risk source as the volatility of stumpage price for the different species.
The objective of this work is to perform a financial analysis of mixed stands of Pinus sylvestris L. and Fagus sylvatica L. in Navarre (Northern Spain) in order to determine if mixed-species forest management results in economic advantages for decision-makers. In addition, an assessment of the optimum mixing ratios both in terms of financial return and risk is also intended.
The results indicate that mixed stands of these species are characterized by a higher timber yield, a higher soil expectation value and a lower financial risk than monospecific stands of any of the two species considered.
2. Materials and Methods
2.1. Study Site and Target Species
The geographical range of the study is the province of Navarre near the Pyrenees in Northern Spain. In this area, beech (Fagus sylvatica) is the main tree species in terms of distribution area and economic importance with approximately 132,000 ha, representing a third of the distribution of this species in the Iberian Peninsula. Scots pine (Pinus sylvestris) covers an area about 59,000 ha, being the second most important forest type in that province [30].
Both species are very important for the forestry sector in Navarre, since they account for 48% (33% beech and 15% Scots pine) of the total forest area in the province. Although they are managed for a variety of goals, wood production is still a relevant management objective, especially in privately owned land. The average harvested roundwood volume during the period 2011–2016 is 112,000 m3/year for beech and 38,100 m3/year for Scots pine [31]. As for the products obtained from these species in the study area, beech produces saw timber and firewood, while Scots pine produces saw timber and chipwood.
2.2. Data Sets
As mentioned in the introduction, data on timber yield (both in monospecific and mixed stands), as well as data on stumpage price, are needed to perform a financial analysis of this kind of investment. The data used are described below:
- The calculation of overyielding in mixed stands was carried out by means of one of the models developed by Sterba et al. [34] that used 695 permanent plots from the third and fourth Spanish National Forest Inventory (SNFI) located in the region of Navarre. Sixty nine out of the 695 plots were located in mixed stands of P. sylvestris and F. sylvatica. The remaining plots corresponded to monospecific pine or beech stands. A summary table of the database as well as a map showing the location of the plots can be respectively found in Sterba et al. [34] (p. 551) and Condés et al. [23] (p. 88).
- A data series on average stumpage price for both species covering the period 1976–2004 was obtained from the official forest statistics data [35]. It must be mentioned that the yearbooks published by the Ministry of Agriculture until 1976 did not collect data on stumpage price and since 2005 this information is not included in the official statistics.
The yield tables referenced above cover a range of site conditions (five quality classes for beech and three for Scots pine), but the 69 plots of the SNFI in Navarre that were actually established in mixed stands were mainly located in areas which correspond to quality III for beech (site index of 21 at the age of 100 years) and quality II for Scots pine (site index of 13 at the age of 50 years). Therefore, the yield tables which were used to estimate timber stock in the present study are depicted in Figure 1.
2.3. Growth and Yield Assessment
It has already been mentioned that, according to Condés et al. [23], the mixing effect on Scots pine-European beech stands in the province of Navarre (Spain) resulted in an increase in volume growth of both species for a large range of species proportions and stocking degrees, with growth efficiency being dependent on stocking degree and stand dominant height.
In the present work, the methodology used in the calculation of the overyielding follows a simpler model by Sterba et al. [34]. According to this model, the growth of a particular species (i) in a mixed stand depends on a series of variables (dominant height, quadratic mean diameter, stand density, proportion of (i) and it is also proportional to the proportion of the species i in the stand. It can be described as:
On the other hand, if no interaction is assumed, that is, if the annual volume increment of the species i is assumed to be unaffected by any mixture, the growth of species i, referred to as “reference growth”, can be given by:
The overyielding (or underyielding) can be calculated as the ratio between the volume increment in a mixed stand (IVi MIX) and the volume increment of a monospecific stand in the same conditions (IVi REF). In the case of the particular model developed by Sterba et al. [34] for mixed stands of Scots pine and European beech in the province of Navarre, it is given by:
where: IVi: Current annual increment of species i; hdom i: Dominant height of species i; dg i: Quadratic mean diameter of species i; SD: Stand density; Pi: Proportion of species i; a, b, c, d and k: Coefficients.
Sterba et al. [34] estimated four different models corresponding to the four definitions of species proportions used. The model used in the present work is the one in which species proportions are defined based on basal area corrected by maximum basal area. According to this, the proportion of species i is defined as:
where Pi: Proportion of species i; Gi: Basal area of species i; Gmax i: Potential (maximum) basal area for species i at the site; Gj: Basal area of species j; Gmax j: Potential (maximum) basal area for species j at the site.
By using the value of the k coefficient corresponding to the selected model, the overyielding (or the underyielding) for both species in this area was calculated by means of the following equations:
Standing timber stock in the mixed stands was calculated from the volume increments by using the expressions described hereafter.
The volume of pine in the mixture at age t is calculated as:
and, substituting IVpine MIX(t) for its value according to Equations (3) and (5),
where: Vpine MIX(t): Volume of pine in the mixture at age t; Vpine MIX(t−10): Volume of pine in the mixture at age t − 10; Ppine: Proportion of Scots pine; IVpine REF(t): Current annual volume increment of pine at age t obtained from the yield table for monospecific pine stands.
The volume of beech in the mixed stand at age t is calculated in the same way:
with all the variables having the same meaning as in Equation (8) but referred to beech.
Finally, total timber stock in the mixed stand (including overyielding) is the result of adding up the volume of both species:
Equations (8)–(10) were used to model timber yield in mixed stands for different proportions of both species (mixing ratios) and for different rotations. An example of the results obtained for a 90-year-old stand is depicted in Figure 2 where dashed lines represent timber stock without interaction and solid lines represent timber stock with interaction (including overyielding). Pine volume is shown in green, beech volume in orange and total volume of the mixed stand in blue.
2.4. Stumpage Price Scenarios
The methodology described above allows for the generation of the necessary information to understand timber growth in monospecific and mixed stands of Scots pine and beech in this particular area. Since the objective of this work is to perform a long-term analysis of the investment in mixed-species stands, the behavior of the stumpage market for both species must also be investigated.
With that purpose in mind, historical data on average stumpage price for Pinus sylvestris and Fagus sylvatica were gathered. The data source was the Statistical Yearbook of the Spanish Ministry of Agriculture, Fisheries, Food and Environment [35]. Unfortunately, the available data series for these two species is short (it covers just the period 1976–2004) and the publication of stumpage price data was discontinued in 2005. However, this is the only reliable information available and that is the reason why it was used in the analysis.
Timber prices are considered independent from period to period, an assumption which is justified if periods are long enough.
The original data series on stumpage price covered a 29-year period and it had to be referred to a common base. Consumer Price Index (CPI) data published by the Spanish Statistical Office [36] were used to refer timber prices to base year 2001. The corrected price data series are depicted in Figure 3a. Both series show a slightly downward trend which tends to stabilize from year 2000 especially for Scots pine.
The corrected stumpage price series of both species are non-independent random variables which show a certain degree of correlation (ρ = 0.616) and follow a joint probability distribution.
A bivariate normal distribution was successfully fitted to the corrected stumpage price data and the following means vector μ and covariance matrix σ were obtained:
In order to consider the risk associated with the volatility of stumpage price, the Monte Carlo simulation technique was used to generate 500 stumpage price scenarios for both species along a five rotation time horizon (Figure 3b). This technique, which allows for the production of random samples, is widely used to reflect the effects of stochastic processes [1]. Since stumpage prices for pine and beech follow a bivariate normal distribution, this distribution was used to simulate the 500 scenarios mentioned above. An example of two timber price scenarios is depicted in Figure 4.
2.5. Financial Return and Risk Assessment
A simple forest investment model was used to estimate financial return. The proposed management model involves an unlimited time horizon and consists of stand regeneration at the beginning of each rotation, final harvest at the end of each rotation and the indefinite repetition of this management scheme. Thinnings have not been considered in this work. Therefore, management costs are limited to regeneration cost at the beginning of each rotation (€1800/ha) and revenues can be calculated from stumpage price and harvest volume at rotation age.
Common forest management practice in the region of Navarre involves rotations around 90 to 100 years for these two species, and most harvests take place in stands which are 90 to 100 years old. The market stumpage prices used in the proposed model correspond to this rotation range.
Financial return on investment was measured by soil expectation value (SEV), but the Faustmann formula could not be used directly since stumpage price is different for each rotation and each scenario. To solve this problem, the unlimited time horizon was split into two sections: the first one included the first five rotations (and the net present value of the investment in this period was calculated from the simulated prices), and the second one was the SEV at the beginning of the sixth rotation (which was calculated by means of the Faustmann formula using the average stumpage price for pine and beech).
In particular, SEV for any scenario j can be calculated as:
where:
- is simulated pine price for rotation i in scenario j (€/m3).
- is pine timber stock in the mixed stand at age T (m3/ha).
- is simulated beech price for rotation i in scenario j (€/m3).
- is beech timber stock in the mixed stand at age T (m3/ha).
- T is rotation age in years
- cr is regeneration cost (€/ha).
- r is discount rate
- is average pine price (€/m3).
- is average beech price (€/m3).
This expression allows for the calculation of SEV for the 500 simulated scenarios and thus the characterization of a probability density function of SEV. This probability distribution was obtained for monospecific pine and beech stands and also for mixed stands with different species proportions. The average SEV value for each management alternative is a measure of the expected return on investment while the coefficient of variation (Cv) is a measure of the financial risk associated with each alternative.
From this point, the analysis makes use of the portfolio theory by Markowitz and Sharpe who found that a combined investment in different financial assets might increase profit when compared to an individual investment of the same risk or might reduce risk when compared to a single investment of the same profitability [1].
Mixed-species stands can be considered as combined investments where the diversification effect may lead to a higher profit or a lower risk. As a matter of fact, in our case, both effects (increased profitability and reduced risk) can be achieved simultaneously due to the occurrence of transgressive overyielding.
A 2% discount rate was used in the calculation of SEV, and a sensitivity analysis was carried out to ascertain the effect of discount rate on the results obtained, particularly on the optimum proportions of species in the mixture.
3. Results
3.1. Timber Yield
For a particular rotation age, timber stocks of monospecific pine and beech stands, as well as timber stocks of mixed-species stands for different proportions of both species, have been calculated.
As previously mentioned in the methodology section, Scots pine grows faster than European beech but, when both species grow together in a mixture, there is an age from which total volume stock is higher than the volume of Scots pine alone. This age depends on the mixing ratio of both species as shown in Table 1.
The older the stand, the higher the proportion of beech in the mixture (management alternative) leading to the maximum timber stock. Pine slows down its average volume growth from t = 80 while beech keeps its growth steadier along time (see Figure 1b). In older stands, maximum timber stock is reached for a 30% beech proportion while in younger stands the proportion of beech leading to maximum timber yield is just 20%.
3.2. Financial Return and Risk
By means of Equation (11) in Section 2.5, values of SEV were obtained for the 500 price scenarios in eleven different alternatives (pure pine, pure beech and nine mixed stands with different proportions of both species) using a 2% discount rate. Three different rotations were considered (T = 80, T = 90 and T = 100 years). The probability distributions of SEV for different management alternatives were obtained by applying the described methodology. An example of the probability distributions for three management alternatives (pure pine stands, pure beech stands and stands with a species proportion of 40% pine and 60% beech) is depicted in Figure 5.
The probability distributions of the mixed stands show a higher average and a similar dispersion than the monospecific stands distributions.
The average SEV values for each management alternative and different rotations (T = 80, 90, 100 years), as well as the values taken by the coefficient of variation of SEV, are shown in Table 2 (r = 2%). Notice that, for the three rotations considered, the minimum risk alternative is the mixed stand with 30% pine and 70% beech proportions.
As observed when analyzing maximum timber stocks for different alternatives (Table 1), the optimal solution regarding financial return is also associated to higher beech proportions when longer rotations are considered. The lowest risk is usually attained for lower proportions of pine in the mixture that the highest return. Both situations are displayed in Figure 6.
Both financial return and risk can be plotted together to display a comparison of the performance of the different management alternatives in terms of their attractiveness for the forest investor. Figure 7 displays average SEV, coefficient of variation (Cv) and standard deviation of SEV for different proportions of pine and beech, a 2% discount rate and a 90-year rotation age. The blue curve represents the different combinations of financial return and risk when there is no interaction between both species and risk abatement is entirely due to the diversification effect of the investment. This curve would be relevant for an investor managing monospecific stands of pine and beech in different locations. On the other hand, the red curve shows the combinations of financial return and risk when there is overyielding because of reduced competition and facilitation in mixed stands. These effects, together with the diversification effect mentioned above, lead to a higher average SEV value and a lower risk for some mixing ratios within the stand.
In particular, for a 90-year rotation, the highest SEV (€2527/ha) is attained at a mixing ratio of 40% pine and 60% beech, while the lowest risk (Cv = 29.03%) is attained at a proportion of 30% pine and 70% beech. The best decision for the forest investor is bounded within this range considering that both mixing ratios (40/60 and 30/70) are very similar in terms of SEV and Cv as can be observed in Table 2.
The results presented have been calculated using a 2% discount rate. The effect of discount rate on the results obtained has been analyzed by redoing the calculations using r = 3%. As expected, SEV values are much lower in the 500 scenarios for all the mixing ratios and rotations considered. In particular, while for r = 2% average SEV was always positive, for r = 3% average SEV is always negative for 90 and 100-year rotations, and attains positive values for T = 80 years in mixed stands where pine proportions range from 20% to 80%.
SEV is very sensitive to discount rate since the internal rate of return (IRR) for the considered management alternatives ranges from 2.4% to 3.0% as can be observed in Table 3.
The alternatives corresponding to the three mixing ratios shown in Table 3 have almost the same IRR. They are very close in terms of SEV and risk as can be noticed in Figure 7.
The optimal proportions in the mixture are not affected by discount rate. The best management alternative for T = 90 years is a mixed stand with a proportion of 40% pine and 60% beech, although slightly different proportions in one direction or another lead to very similar results according to Table 3.
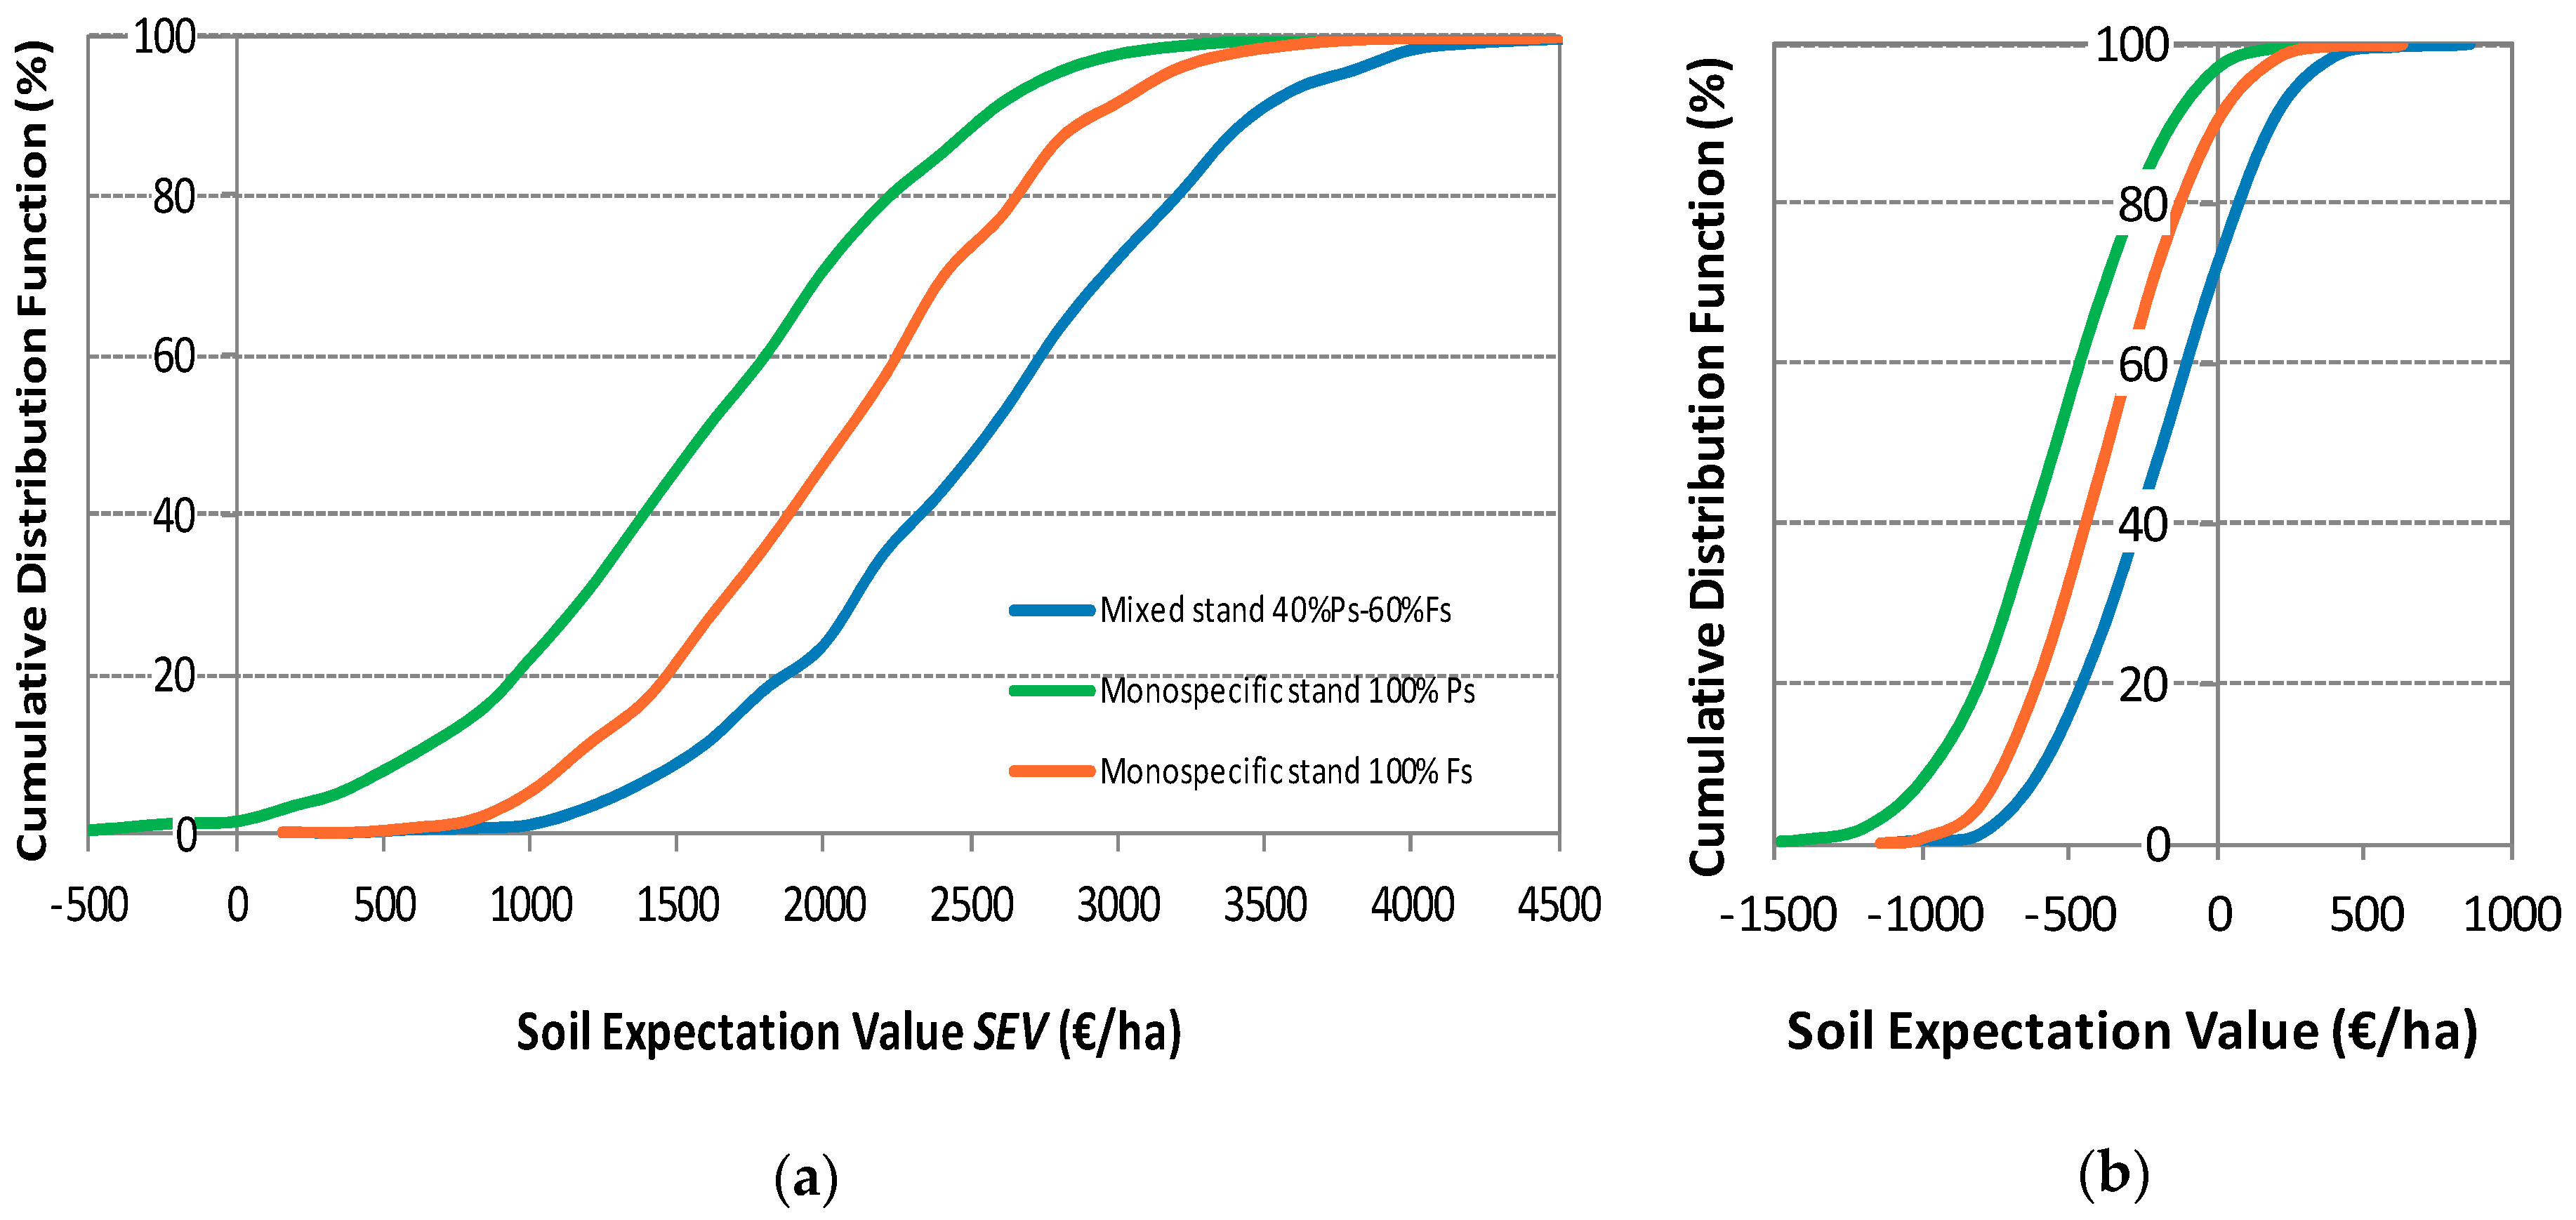
The effect of discount rate on the probability distribution of SEV is depicted in Figure 8. The increase in r negatively affects SEV, and it also reduces the dispersion of its values. As can be noticed from Figure 8, the standard deviation of SEV is significantly lower for r = 3% than for r = 2%. As a matter of fact, the decrease in standard deviation is around 60%, and ranges from 55% for T = 80 years to 63% for T = 100 years.
The probability that SEV is negative is practically null for a discount rate of 2%. For a 90-year rotation, in monospecific pine stands a financial loss was detected for 1.6% of the simulated scenarios, while in monospecific beech or mixed stands, SEV was always positive. However, for the same rotation and a 3% discount rate, the probability of SEV being negative is 97% for pure pine, 90% for pure beech and 72% for a mixed stand with a proportion of 40% pine and 60% beech. The risk of incurring in a financial loss is much lower for the mixed stand.
The effect of species complementarity on financial return is shown in Figure 8. For a 2% discount rate, there is a 76% probability that a mixed stand with a proportion of 40% pine and 60% beech has a SEV higher than €2000/ha, while the probability of attaining at least that financial return is just 53% for monospecific beech stands and 29% for monospecific pine stands.
4. Discussion
According to the yield tables used (Madrigal et al. [32], García Abejón and Tella Ferreiro [33]), timber yield at any age for Scots pine is higher than for beech (see Figure 1a). The calculations of volume increment performed following the methodology developed by Sterba et al. [34] show the occurrence of transgressive overyielding for several mixing ratios of both species and for different rotations. Both species grow better in mixed stands than in monospecific stands. In particular, 90-year-old stands of Scots pine with a 10% to 50% proportion of beech show a higher yield than monospecific pine stands as depicted in Figure 2 and Table 1.
Due to the scope of the present work, this facilitation effect cannot be explained alone by the results obtained, but species-specific ecological characteristics such as shade tolerance, crown shape, root systems depth and growth response to temperature and soil water availability are possible influencing factors. González de Andrés et al. [37] studied mixed stands of Pinus sylvestris and Fagus sylvatica at two different sites in Navarre and found that mixed-species stands can improve water use efficiency and light interception. According to Pretzsch et al. [38], a more structured multi-layered canopy can favor higher light use efficiency, and root systems which reach different depths explore soil in a more efficient way, allowing for a better access to water and nutrients. The role played by soil organic carbon may also be important, since, in some cases, soils under mixed-species forests have higher amounts of soil organic carbon than those under monospecific forests, causing a positive effect on site productivity and sustainability through the modification of soil characteristics, and leading to a higher nutrient and water availability [9].
Houpert et al. [39] studied the influence of site quality, stand age and moisture availability in mixed Norway spruce-European beech stands and found out that Fagus sylvatica grew better in mixtures and this effect increased with site quality. A significant interaction between species proportions and stand age was found for both species: the older the stand, the better the growth of Fagus sylvatica and the lower the growth of Picea abies. The results of the present work seem to confirm this relationship between species proportions and stand age. For longer rotations, the maximum timber stock is attained at a higher proportion of beech in the mixture (see Table 1).
However, it is important to emphasize that the consideration of stand age was limited to the calculation of timber stock at rotation age. As mentioned in Section 2.5, common forest management practice in the region of Navarre involves rotations around 90 to 100 years for these two species, and the stumpage prices considered correspond to this rotation range. It is a short rotation, but it must be taken into account that, in Navarre, the usual rotations that are actually implemented in beech stands are strongly influenced by red heart formation, a reddish-brown coloration of trunk heartwood, apparently related to tree age, which negatively affects wood value. Approximately 50% of the trees between 90 and 120 years and 65% of the trees older than 120 years are affected by this anomaly [32]. This is the reason why beech rotation age is usually kept under 100 years.
Regarding the influence of site quality on the complementarity effect, Pretzsch et al. [38] carried out a research on mixed versus monospecific stands of Pinus sylvestris and Fagus sylvatica along a productivity gradient through Europe, covering an area where climatic variables took very different values, and did not find that overyielding was dependent on site quality or climate. On the other hand, other studies have pointed out that the interactions between species depend on a series of factors such as site quality, climate, stand age or stand density [22,23,24,39].
The effect of site quality on species complementarity was not considered in this work, since the mixed stands of these two species in Navarre were mainly located in areas which correspond to quality III for beech (site index of 21 at the age of 100 years) and quality II for Scots pine (site index of 13 at the age of 50 years) as mentioned in Section 2.2.
In the model used for the overyielding calculation (Equations (5) and (6)), based on the work by Sterba et al. [34], overyielding does not depend on stand density, and thus this factor has not been considered either.
As explained in Section 2, the standing timber volume in a mixed stand at a particular age t has been obtained by adding the annual increment (with interaction), calculated by using the model from Sterba et al. [34], to the standing timber volume at age t − 1. Therefore, natural mortality has not been addressed in the present work, but the resulting overestimation of standing timber volume is considered to be low since the yield tables used are not fully stocked and natural mortality is assumed to be negligible. The approach undertaken is just a first approximation and it shows the need for the development of growth models incorporating mortality and yield tables specifically developed for mixed-species stands where species interaction is taken into account.
Mixed-species stands can be considered as a combination of financial assets. Based on portfolio theory, since stumpage prices of Scots pine and European beech are not perfectly correlated, there is a diversification effect of the investment which causes a simultaneous decrease in risk and increase in SEV when different proportions of beech are introduced in a monospecific pine stand. In addition, the occurrence of transgressive overyielding due to the complementarity of both species leads to an increase in SEV which adds to the first effect.
Therefore, both diversification effect and transgressive overyielding result in a higher profitability and a lower financial risk for a range of mixing ratios between both species and for different rotations. In particular, as depicted in Figure 7a, 90-year-old beech stands with proportions of Scots pine from 10% to 70% simultaneously show a higher soil expectation value and a lower financial risk than pure beech stands at the same age.
The diversification effect of combined investments in monospecific stands of Norway spruce and European beech was analyzed by Knoke et al. [1,2], reporting a significant risk reduction for different investment proportions, but the complementarity effect of both species growing together in a mixed stand was not considered. As mentioned in the Introduction section, other studies have also addressed the trade-off between productivity and risk of mixed-species forests, incorporating to the analysis the effect of climate change, natural hazards or silvicultural treatments [11,12,13,14], but none of them has considered the effect of tree species interactions on productivity.
In the present work, which takes into account the complementarity effect, the highest SEV for a 90-year rotation is obtained for a mixing ratio of 40% Scots pine and 60% beech, while the lowest risk (measured in terms of Cv of SEV) is obtained for a proportion of 30% Scots pine and 70% beech. To determine the best option for the forest stakeholder, Neuner et al. [11] came up with different measures of risk, such as standard deviation (SD) and value at risk (VaR), and used them to rank the different portfolios. The highest SEV and lowest risk combinations, as well as the monospecific alternatives and the equal proportions combination, were evaluated in terms of these measures and the results obtained are depicted in Table 4.
The highest SEV and lowest risk alternatives are very similar in terms of return and risk and there is a difference in VaR of just €0.67/ha (€1307.42–€1306.75). Therefore, both alternatives are almost identical and it is better to provide a range of recommended species proportions rather than an optimum solution based on a particular mixing ratio.
Given the long rotations involved, SEV is very sensitive to discount rate. An increase in discount rate leads to a decrease in SEV and a reduction in the standard deviation of its probability distribution. The optimal proportions in the mixture, however, are not affected by discount rate.
Even though the implications of mixed-species plantations on carbon sequestration have not been explicitly addressed in the present work, the results presented are especially relevant if they are placed in the current context of global change. Mixed stands of Scots pine and European beech in Navarre are not only more productive and profitable than monospecific stands, but they make a more efficient use of the available resources [37]. In addition, Knoke et al. [2] cite several studies reporting a lower susceptibility of these stands to storm damage and other natural hazards. A lower incidence of biotic and abiotic disturbances results in an increase in biomass production and carbon sequestration.
In order to study if carbon sequestration and biodiversity conservation were conflicting objectives, Pandey et al. [40] assessed carbon stocks and species richness in Nepal in a series of community forests participating in “Reducing emissions from deforestation and forest degradation (REDD+)” projects. In these areas, they assessed above and below ground biomass (including trees, saplings, other living plants, litter and debris) and found that, under the management carried out by the local communities, carbon stocks increase along time and dense forests have higher carbon stocks increments than sparse forests. They also found a slight decrease in the average number of species in all types of forests.
This finding reinforces the concern that forest management practices aimed at increasing forest carbon stocks might have a negative impact on biological diversity by favoring certain tree species to the detriment of others. In some geographical areas characterized by a high number of species, community forestry may involve silvicultural operations favoring some species and clearing unwanted ones [40]. The authors advocate for the establishment of an economic incentive to reconcile the objectives of maintaining species richness and increasing carbon benefits. In European temperate mixed forests, where the number of tree species is much lower, the situation is probably very different and mixed-species forestry practices would lead to a higher number of tree species. The effect of this admixing on accompanying vegetation has not yet been addressed and it is uncertain if total species richness would be negatively affected.
In summary, mixed species forests can lead to an increase in above and below ground biomass [40], as well as in soil organic carbon [9], thus playing an important role in climate change mitigation and adaptation. According to the results obtained in the present work, mixed species stands of Scots pine and European beech are associated to a higher above ground tree biomass (the main source of carbon sequestration) and, since they make a more efficient use of the available resources [37,38], they are prone to a better adaptation to global change. For González de Andrés et al. [37], encouraging Scots pine-European beech mixtures could be an effective way of adaptation to climate change in a scenario of increased droughts.
The environmental and social benefits of mixed-species stands seem to be undeniable, especially in a context of uncertainty and change. Public forests are increasingly being managed for biodiversity conservation, landscape and watershed protection or carbon sequestration and they provide value to society under the form of ecosystem services. In this case, the superiority of mixed stands is universally accepted and species selection in public forests is done according to ecological and social criteria.
As for the forests located on private land, the owners usually require some kind of return from their properties and want to optimize species composition to maximize their profit at a reasonable risk level. The results of this work, showing that mixed-species stands are financially superior to monospecific stands, may help them embrace mixed-species forest management. However, the internal rate of return (IRR) for the considered management alternatives ranges from 2.4% to 3.0% (see Table 3) which means that the financial return of these forests is still quite low for a private investor.
Therefore, if the government is interested in encouraging mixed-species forest management, some kind of incentives should probably be implemented. This conclusion was also attained by Maraseni and Cockfield [15] who estimated the financial return of mixed-species environmental plantations for conservation and carbon sequestration in Australia and proposed the payment of additional incentives based on the environmental services these stands provide. The policy incentive mechanisms that could be implemented to encourage mixed-species forest management could be similar to the ones proposed by Maraseni et al. [29,41] in two study cases in Vietnam and Lao PDR.
Maraseni et al. [29] analyzed why landholders were not willing to increase the rotation length of acacia plantations in Vietnam despite their higher financial return, their environmental benefits and their positive effect on employment and value added of the products obtained. Longer rotations involved a higher risk and, to overcome this, the authors defended the implementation of incentives such as the provision of insurance or the establishment of a secondary market where the added risk could be shared among the growers, the government and the industry.
Maraseni et al. [41] compared the profitability of teak plantations in Lao PDR for three groups of stakeholders (growers, traders and processors) and discussed the incentives that could lead to an increased domestic wood processing and an improvement of the teak furniture industry value chain. These incentives consisted of supplying improved germplasm to growers, training them to help them make better management decisions and simplifying regulatory procedures to reduce transaction costs.
The present work is focused on studying the effect of species interactions on productivity, and its financial consequences, to help decision-making on the optimal species proportion within a stand. This decision belongs to the land manager, and the roles of other stakeholders such as timber merchants, government and industry have not been considered. Nevertheless, some policy measures aiming at increasing the flow of information and reducing costs and risk could have a positive effect on promoting mixed-species forest management. Some of these measures could be: (1) supply of improved seedlings for new plantations at a subsidized price; (2) organization of training and extension activities for land managers to improve decision-making; (3) implementation of a favorable tax environment (tax exemptions or deductions); (4) facilitation of a transparent market where there is more information on prices for logs of different species according to size and grade; (5) simplification of regulatory requirements or (6) implementation of risk sharing mechanisms among different stakeholders.
Some limitations of the study are the short available data series on stumpage price, the simplicity of the proposed silviculture in which thinnings were not considered and the assumption of the same regeneration cost for the different management alternatives.
Regarding the effect of silviculture, Rossiger et al. [42] studied the role of mixed-species forests and ‘near-natural’ silvicultural treatments in a risk aversion context and concluded that the optimal silvicultural strategy was a highly diversified treatment with a species proportion of 42% Norway spruce and 58% European beech (similar to the optimum mixing ratio obtained in the present work) and a 70-year regeneration period with regeneration harvests taking place from age 50 to 120 years.
According to this, some future research directions might take into account more flexible silvicultural alternatives considering thinnings and different rotation ages. The aim of the research would be to determine not only the optimal species proportion in the mixture, but the optimal silvicultural strategy to be implemented.
5. Conclusions
A financial analysis of an investment in mixed stands of Pinus sylvestris and Fagus sylvatica in Navarre was carried out. The results obtained indicate that mixed stands of these species, in some proportions, are characterized by a higher timber yield, a higher soil expectation value and a lower financial risk than monospecific stands of any of the two species considered. Therefore, the economic attractiveness of mixed stands of Scots pine and European beech in Navarre seems to be confirmed.
The effect of overyielding and the slightly lower variability of Pinus sylvestris stumpage price favor the introduction of pine in the mixture, while the higher price of European beech encourages this species to be dominant if a high financial return is sought.
Even though the only source of risk considered is the variability of stumpage price, the combination of the effects of species interaction and investment diversification leads to a financial superiority of mixed stands over monospecific stands for a wide range of mixing ratios and the three rotations considered. It can be expected that the inclusion of other risk sources in the model would lead to results which are even more conclusive.
Some recommendations on the mixing ratio of both species in the mixed stands can also be made. The minimum risk is attained for a proportion of 30% pine and 70% beech for rotations between 80 and 100 years. On the other hand, the maximum soil expectation value corresponds to a proportion of 40% pine and 60% beech for rotations between 90 and 100 years although, for shorter rotations, the maximum SEV is associated with higher pine proportions as expected. Both solutions are identical in practical terms, and, rather than an optimum mixing ratio, a range of 30% to 40% admixture of Scots pine can be recommended.
However, from the point of view of a private investor, the resulting financial return is still quite modest and some public incentives could probably be implemented to encourage mixed-species forest management.
Author Contributions
F.G.-R. designed the methodology, compiled the data, selected the model to make the growth and yield projections, performed the calculations, analyzed the results, wrote the first draft, incorporated the modifications resulting from the reviews and wrote the final version of the manuscript.
Funding
Part of this work was carried out during a stay of F. García Robredo in the Department of Ecosystem Science and Management of Pennsylvania State University. The research stay was funded by the project ForEAdapt, “Knowledge exchange between Europe and America on forest growth models and optimization for adaptive forestry. Marie Curie International Research Staff Exchange Scheme. FP7-PEOPLE-2009-IRSES”.
Acknowledgments
The author would like to express his gratitude to Sonia Condés from Universidad Politécnica de Madrid and Marc McDill from Pennsylvania State University for their valuable inputs in the design of the methodology. The author would also like to thank the three anonymous reviewers for their valuable comments and suggestions.
Conflicts of Interest
The author declares no conflict of interest.
References
- Knoke, T.; Stimm, B.; Ammer, C.; Moog, M. Mixed forests reconsidered: A forest economics contribution on an ecological concept. For. Ecol. Manag. 2005, 213, 102–116. [Google Scholar] [CrossRef]
- Knoke, T.; Ammer, C.; Stimm, B.; Mosandl, R. Admixing broadleaved to coniferous tree species: A review on yield, ecological stability and economics. Eur. J. For. Res. 2008, 127, 89–101. [Google Scholar] [CrossRef]
- Kelty, M.J. Comparative productivity of monocultures and mixed-species stands. In The Ecology and Silviculture of Mixed-Species Forests; Kelty, M.J., Larson, B.C., Oliver, M.J., Eds.; Springer: Berlin/Heidelberg, Germany, 1992; pp. 125–141. ISBN 978-94-015-8052-6. [Google Scholar]
- Wen, L.; Lei, P.F.; Xiang, W.H.; Yan, W.D.; Liu, S.T. Soil microbial biomass carbon and nitrogen in pure and mixed stands of Pinus massoniana and Cinnamomum camphora differing in stand age. For. Ecol. Manag. 2014, 328, 150–158. [Google Scholar] [CrossRef]
- Jactel, H.; Nicoll, B.C.; Branco, M.; Gonzalez-Olabarria, J.R.; Grodzki, W.; Langstrom, B.; Moreira, F.; Netherer, S.; Orazio, C.; Piou, D.; et al. The influences of forest stand management on biotic and abiotic risks of damage. Ann. For. Sci. 2009, 66, 701. [Google Scholar] [CrossRef]
- Cavard, X.; Macdonald, S.E.; Bergeron, Y.; Chen, H.Y.H. Importance of mixedwoods for biodiversity conservation: Evidence for understory plants, songbirds, soil fauna, and ectomycorrhizae in northern forests. Environ. Rev. 2011, 19, 142–161. [Google Scholar] [CrossRef]
- Oxbrough, A.; French, V.; Irwin, S.; Kelly, T.C.; Smiddy, P.; O’Halloran, J. Can mixed species stands enhance arthropod diversity in plantation forests? For. Ecol. Manag. 2012, 270, 11–18. [Google Scholar] [CrossRef] [Green Version]
- Gamfeldt, L.; Snäll, T.; Bagchi, R.; Jonsson, M.; Gustafsson, L.; Kjellander, P.; Ruiz-Jaen, M.C.; Fröberg, M.; Stendahl, J.; Philipson, C.D.; et al. Higher levels of multiple ecosystem services are found in forests with more tree species. Nat. Commun. 2013, 4, 1340. [Google Scholar] [CrossRef] [PubMed] [Green Version]
- Maraseni, T.N.; Pandey, S.S. Can vegetation types work as an indicator of soil organic carbon? An insight from native vegetations in Nepal. Ecol. Indic. 2014, 46, 315–322. [Google Scholar] [CrossRef]
- Nichols, J.D.; Bristow, M.; Vanclay, J.K. Mixed-species plantations: Prospects and challenges. For. Ecol. Manag. 2006, 233, 383–390. [Google Scholar] [CrossRef] [Green Version]
- Neuner, S.; Beinhofer, B.; Knoke, T. The optimal tree species composition for a private forest enterprise—Applying the theory of portfolio selection. Scand. J. For. Res. 2013, 28, 38–48. [Google Scholar] [CrossRef]
- Neuner, S.; Knoke, T. Economic consequences of altered survival of mixed or pure Norway spruce under a dryer and warmer climate. Clim. Chang. 2017, 140, 519–531. [Google Scholar] [CrossRef]
- Brunette, M.; Dragicevic, A.; Lenglet, J.; Niedzwiedz, A.; Badeau, V.; Dupouey, J.L. Biotechnical portfolio management of mixed-species forests. J. Bioecon. 2017, 19, 223–245. [Google Scholar] [CrossRef]
- Dragicevic, A.; Lobianco, A.; Leblois, A. Forest planning and productivity-risk trade-off through the Markowitz mean-variance model. For. Policy Econ. 2016, 64, 25–34. [Google Scholar] [CrossRef]
- Maraseni, T.N.; Cockfield, G. The financial implications of converting farmland to state-supported environmental plantings in the Darling Downs region, Queensland. Agric. Syst. 2015, 135, 57–65. [Google Scholar] [CrossRef]
- Vettenranta, J. Effect of species composition on economic return in a mixed stand of Norway spruce and Scots pine. Silva Fenn. 1996, 30, 47–60. [Google Scholar] [CrossRef]
- Lu, F.D.; Gong, P.C. Adaptive thinning strategies for mixed-species stand management with stochastic prices. J. For. Econ. 2005, 11, 53–71. [Google Scholar] [CrossRef]
- Griess, V.C.; Knoke, T. Bioeconomic modeling of mixed Norway spruce-European beech stands: Economic consequences of considering ecological effects. Eur. J. For. Res. 2013, 132, 511–522. [Google Scholar] [CrossRef]
- Kelty, M.J.; Cameron, I. Plot designs for the analysis of species interactions in mixed stands. Commonw. For. Rev. 1995, 74, 322–332. [Google Scholar]
- Pretzsch, H.; Block, J.; Dieler, J.; Dong, P.H.; Kohnle, U.; Nagel, J.; Spellmann, H.; Zingg, A. Comparison between the productivity of pure and mixed stands of Norway spruce and European beech along an ecological gradient. Ann. For. Sci. 2010, 67, 712. [Google Scholar] [CrossRef]
- Pretzsch, H.; Schutze, G. Transgressive overyielding in mixed compared with pure stands of Norway spruce and European beech in Central Europe: Evidence on stand level and explanation on individual tree level. Eur. J. For. Res. 2009, 128, 183–204. [Google Scholar] [CrossRef]
- Forrester, D.I.; Kohnle, U.; Albrecht, A.T.; Bauhus, J. Complementarity in mixed-species stands of Abies alba and Picea abies varies with climate, site quality and stand density. For. Ecol. Manag. 2013, 304, 233–242. [Google Scholar] [CrossRef]
- Condés, S.; Del Río, M.; Sterba, H. Mixing effect on volume growth of Fagus sylvatica and Pinus sylvestris is modulated by stand density. For. Ecol. Manag. 2013, 292, 86–95. [Google Scholar] [CrossRef] [Green Version]
- Río, M.; Condés, S.; Sterba, H. Productividad en masas mixtas vs. masas puras: Influencia de la espesura en la interacción entre especies. In Proceedings of the Actas del 6º Congreso Forestal Español, Vitoria-Gasteiz, Spain, 10–14 June 2013; Sociedad Española de Ciencias Forestales: Madrid, Spain, 2013. ISBN 978-84-937964-9-5. [Google Scholar]
- Pukkala, T.; Vettenranta, J.; Kolstrom, T.; Miina, J. Productivity of mixed stands of Pinus-sylvestris and Picea-abies. Scand. J. For. Res. 1994, 9, 143–153. [Google Scholar] [CrossRef]
- Jonsson, B. Om Barrblandskogens Volymproduktion; English Summary: Yield of Mixed Coniferous Forest; Meddelanden från Statens Skogsforskningsinstitut; Statens Skogsforskningsinstitut: Stockholm, Sweden, 1962; Volume 50, 143p. [Google Scholar]
- Kerr, G.; Nixon, C.J.; Matthews, R.W. Silviculture and yield of mixed-species stands: The UK experience. In The Ecology of Mixed-Species Stands of Trees; Cannel, M.G.R., Malcolm, D.C., Robertson, P.A., Eds.; Blackwell Scientific Publications: Oxford, UK, 1992; pp. 35–51. [Google Scholar]
- Lu, H.C.; Condés, S.; del Río, M.; Goudiaby, V.; den Ouden, J.; Mohren, G.M.J.; Schelhaas, M.J.; de Waal, R.; Sterck, F.J. Species and soil effects on overyielding of tree species mixtures in the Netherlands. For. Ecol. Manag. 2018, 409, 105–118. [Google Scholar] [CrossRef]
- Maraseni, T.N.; Son, H.L.; Cockfield, G.; Duy, H.V.; Nghia, T.D. Comparing the financial returns from acacia plantations with different plantation densities and rotation ages in Vietnam. For. Policy Econ. 2017, 83, 80–87. [Google Scholar] [CrossRef]
- Ministerio de Medio Ambiente. Tercer Inventario Forestal Nacional: Navarra, Organismo Autónomo Parques Nacionales: Madrid, Spain, 2002; 340p.
- ADEMAN (Wood Producers Association of Navarre). Mercado de la madera. Revista Más Madera 2017, 11, 2–3. [Google Scholar]
- Madrigal, A.; Puertas, F.; Martínez-Millán, F.J. Tablas de Producción Para Fagus sylvatica L. en Navarra; Serie Agraria nº 3; Departamento de Agricultura, Ganadería y Montes, Gobierno de Navarra: Pamplona, Spain, 1992; p. 122. [Google Scholar]
- García-Abejón, J.L.; Tella-Ferreiro, G. Tablas de Producción de Densidad Variable Para Pinus sylvestris L. en el Sistema Pirenaico; Comunicaciones INIA, Serie: Recursos Naturales; Ministerio de Agricultura, Pesca y Alimentación: Madrid, Spain, 1986; Volume 43, pp. 1–28. [Google Scholar]
- Sterba, H.; del Río, M.; Brunner, A.; Condés, S. Effect of species proportion definition on the evaluation of growth in pure vs. mixed stands. For. Syst. 2014, 23, 547–559. [Google Scholar] [CrossRef]
- MAPAMA (Ministry of Agriculture, Fisheries, Food and Environment). Anuario de Estadística Agraria (1977–2005); Ministerio de Agricultura, Pesca, Alimentación y Medio Ambiente: Madrid, Spain, 2018; Available online: https://www.mapama.gob.es/es/estadistica/temas/publicaciones/anuario-de-estadistica/ (accessed on 3 July 2018).
- Instituto Nacional de Estadística (Spanish Statistical Office). Anuario Estadístico de España (1977–2005); Instituto Nacional de Estadística, Ministerio de Economía, Industria y Competitividad: Madrid, Spain, 2018; Available online: www.ine.es/prodyser/pubweb/anuarios_mnu.htm (accessed on 7 May 2018).
- González de Andres, E.; Seely, B.; Blanco, J.A.; Imbert, J.B.; Lo, Y.H.; Castillo, F.J. Increased complementarity in water-limited environments in Scots pine and European beech mixtures under climate change. Ecohydrology 2017, 10, e1810. [Google Scholar] [CrossRef]
- Pretzsch, H.; del Rio, M.; Ammer, C.; Avdagic, A.; Barbeito, I.; Bielak, K.; Brazaitis, G.; Coll, L.; Dirnberger, G.; Drossler, L.; et al. Growth and yield of mixed versus pure stands of Scots pine (Pinus sylvestris L.) and European beech (Fagus sylvatica L.) analysed along a productivity gradient through Europe. Eur. J. For. Res. 2015, 134, 927–947. [Google Scholar] [CrossRef] [Green Version]
- Houpert, L.; Rohner, B.; Forrester, D.I.; Mina, M.; Huber, M.O. Mixing Effects in Norway Spruce-European Beech Stands Are Modulated by Site Quality, Stand Age and Moisture Availability. Forests 2018, 9, 83. [Google Scholar] [CrossRef]
- Pandey, S.S.; Cockfield, G.; Maraseni, N. Dynamics of carbon and biodiversity under REDD+ regime: A case from Nepal. Environ. Sci. Policy 2014, 38, 272–281. [Google Scholar] [CrossRef]
- Maraseni, T.N.; Phimmavong, S.; Keenan, R.J.; Vongkhamsao, V.; Cockfield, G.; Smith, H. Financial returns for different actors in a teak timber value chain in Paklay District, Lao PDR. Land Use Policy 2018, 75, 145–154. [Google Scholar] [CrossRef]
- Roessiger, J.; Griess, V.C.; Knoke, T. May risk aversion lead to near-natural forestry? A simulation study. Forestry 2011, 84, 527–537. [Google Scholar] [CrossRef] [Green Version]
Figure 1.
Yield tables for Pinus sylvestris and Fagus sylvatica. Source: García Abejón and Tella Ferreiro [33], Madrigal et al. [32]. (a) Standing timber volume for both species in m3/ha at age t; (b) Mean and current annual volume increment for both species in m3·ha−1·year−1 at age t.
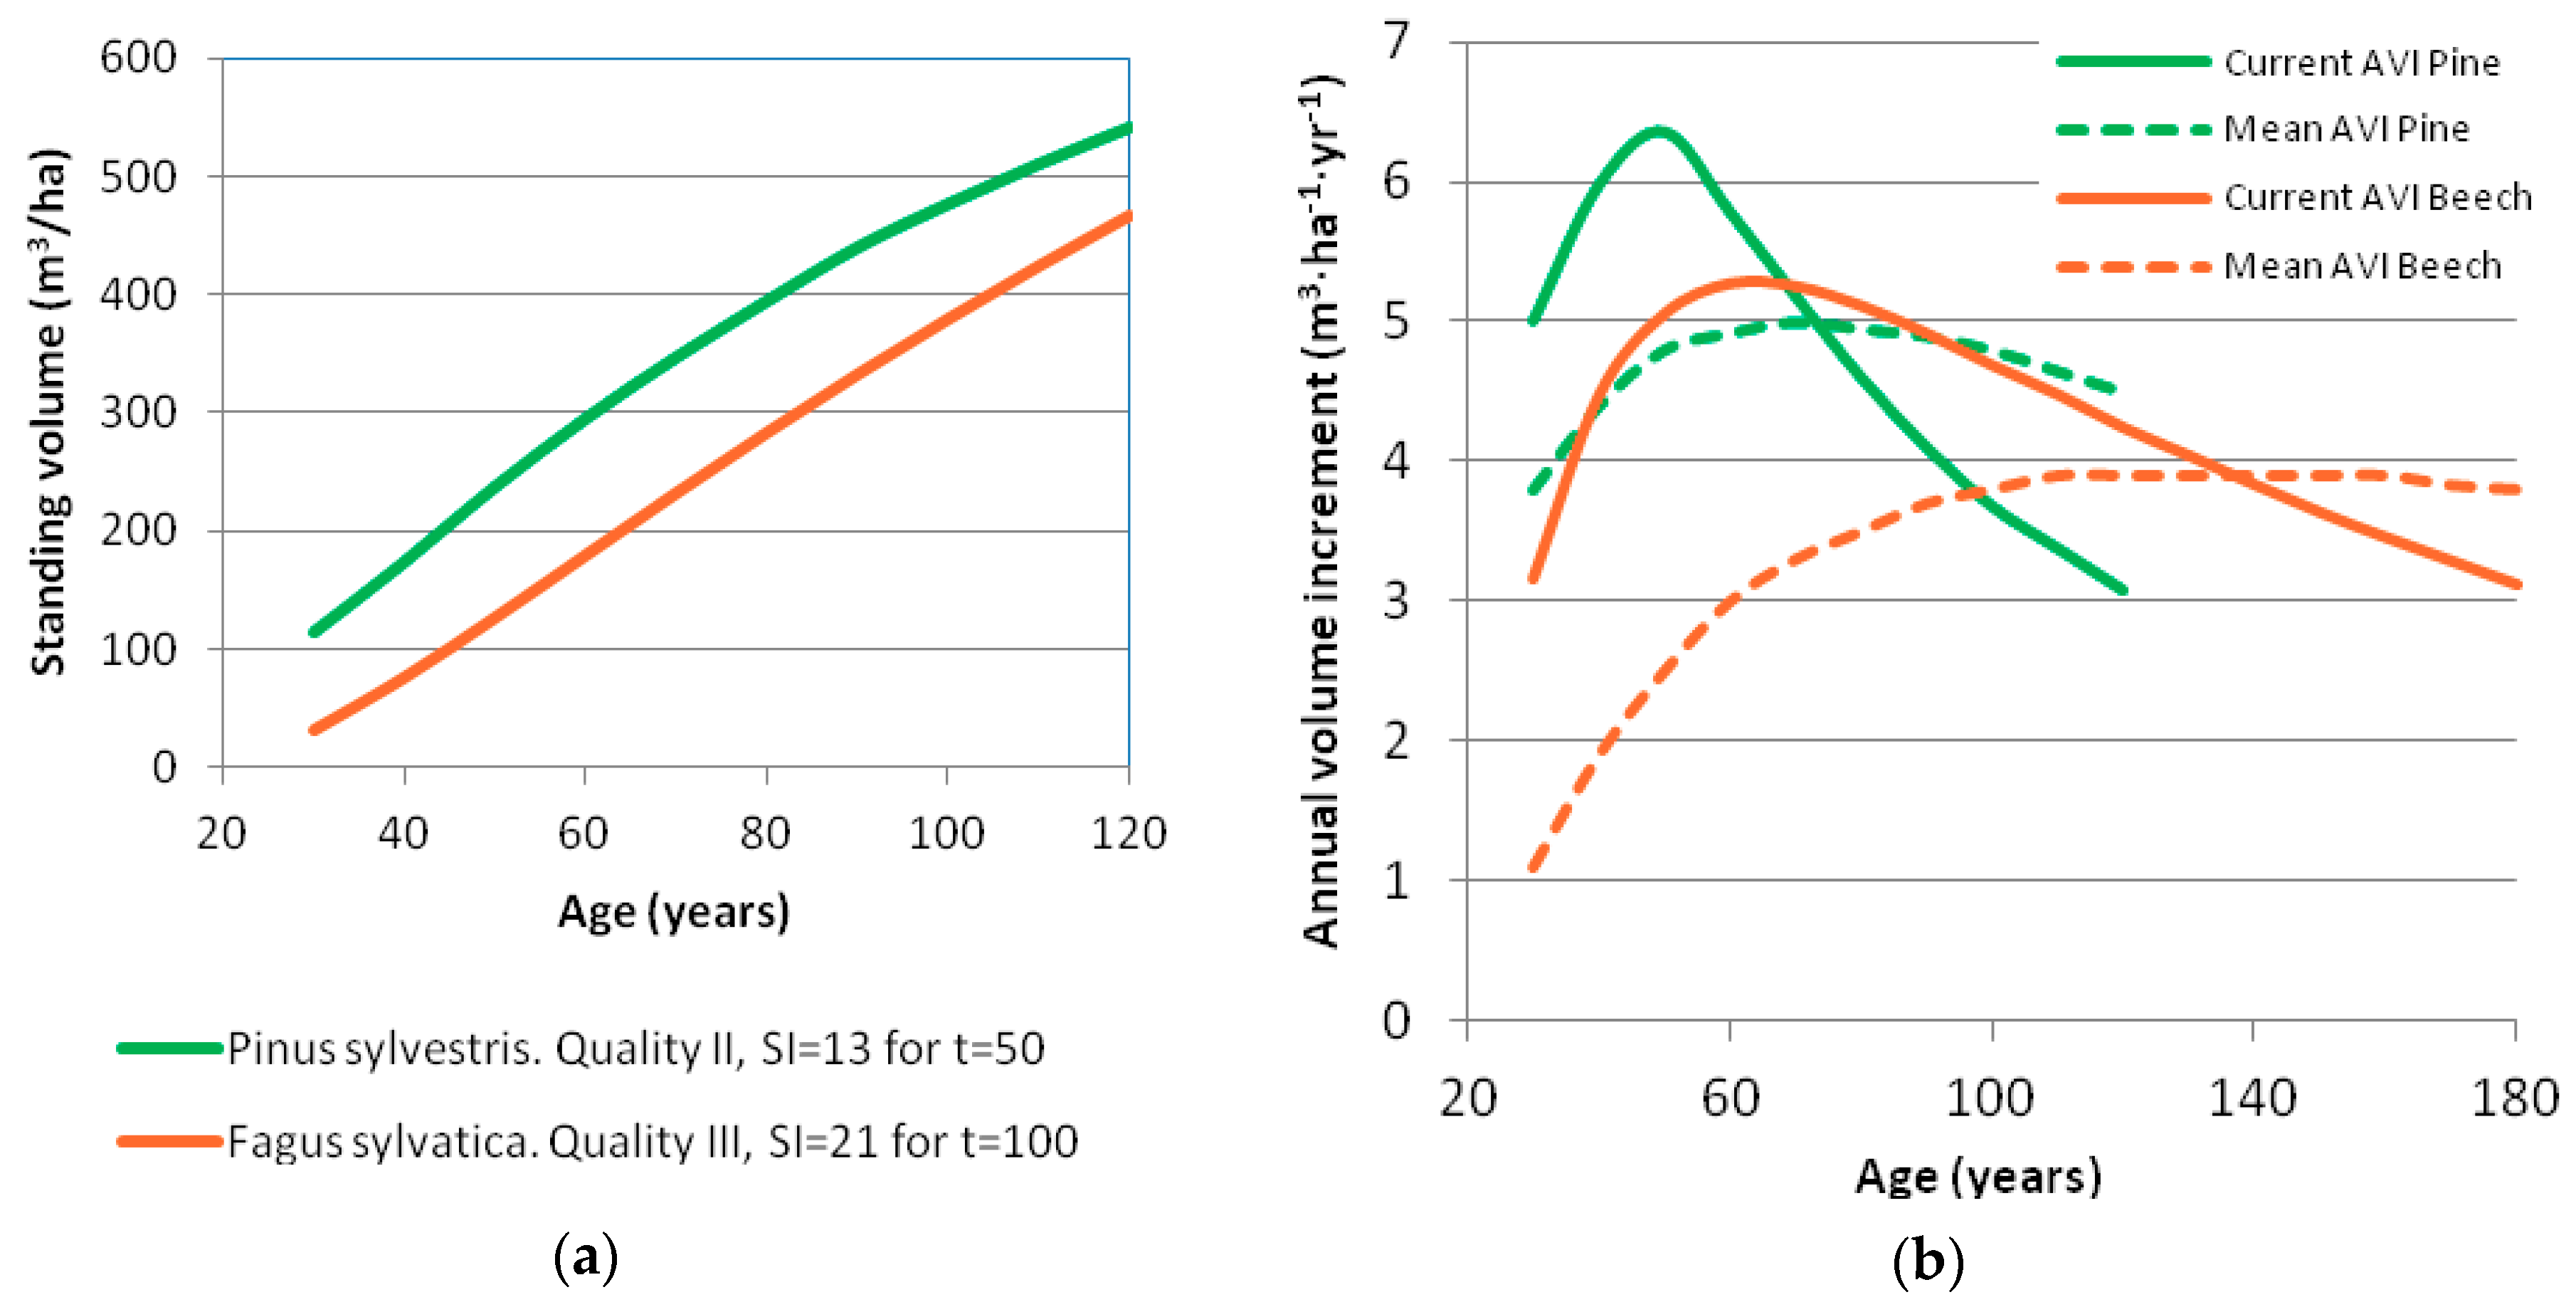
Figure 2.
Overyielding in mixed stands of Pinus sylvestris and Fagus sylvatica for a 90-year-old stand. Source: Own elaboration from the findings by Sterba et al. [34].
Figure 2.
Overyielding in mixed stands of Pinus sylvestris and Fagus sylvatica for a 90-year-old stand. Source: Own elaboration from the findings by Sterba et al. [34].
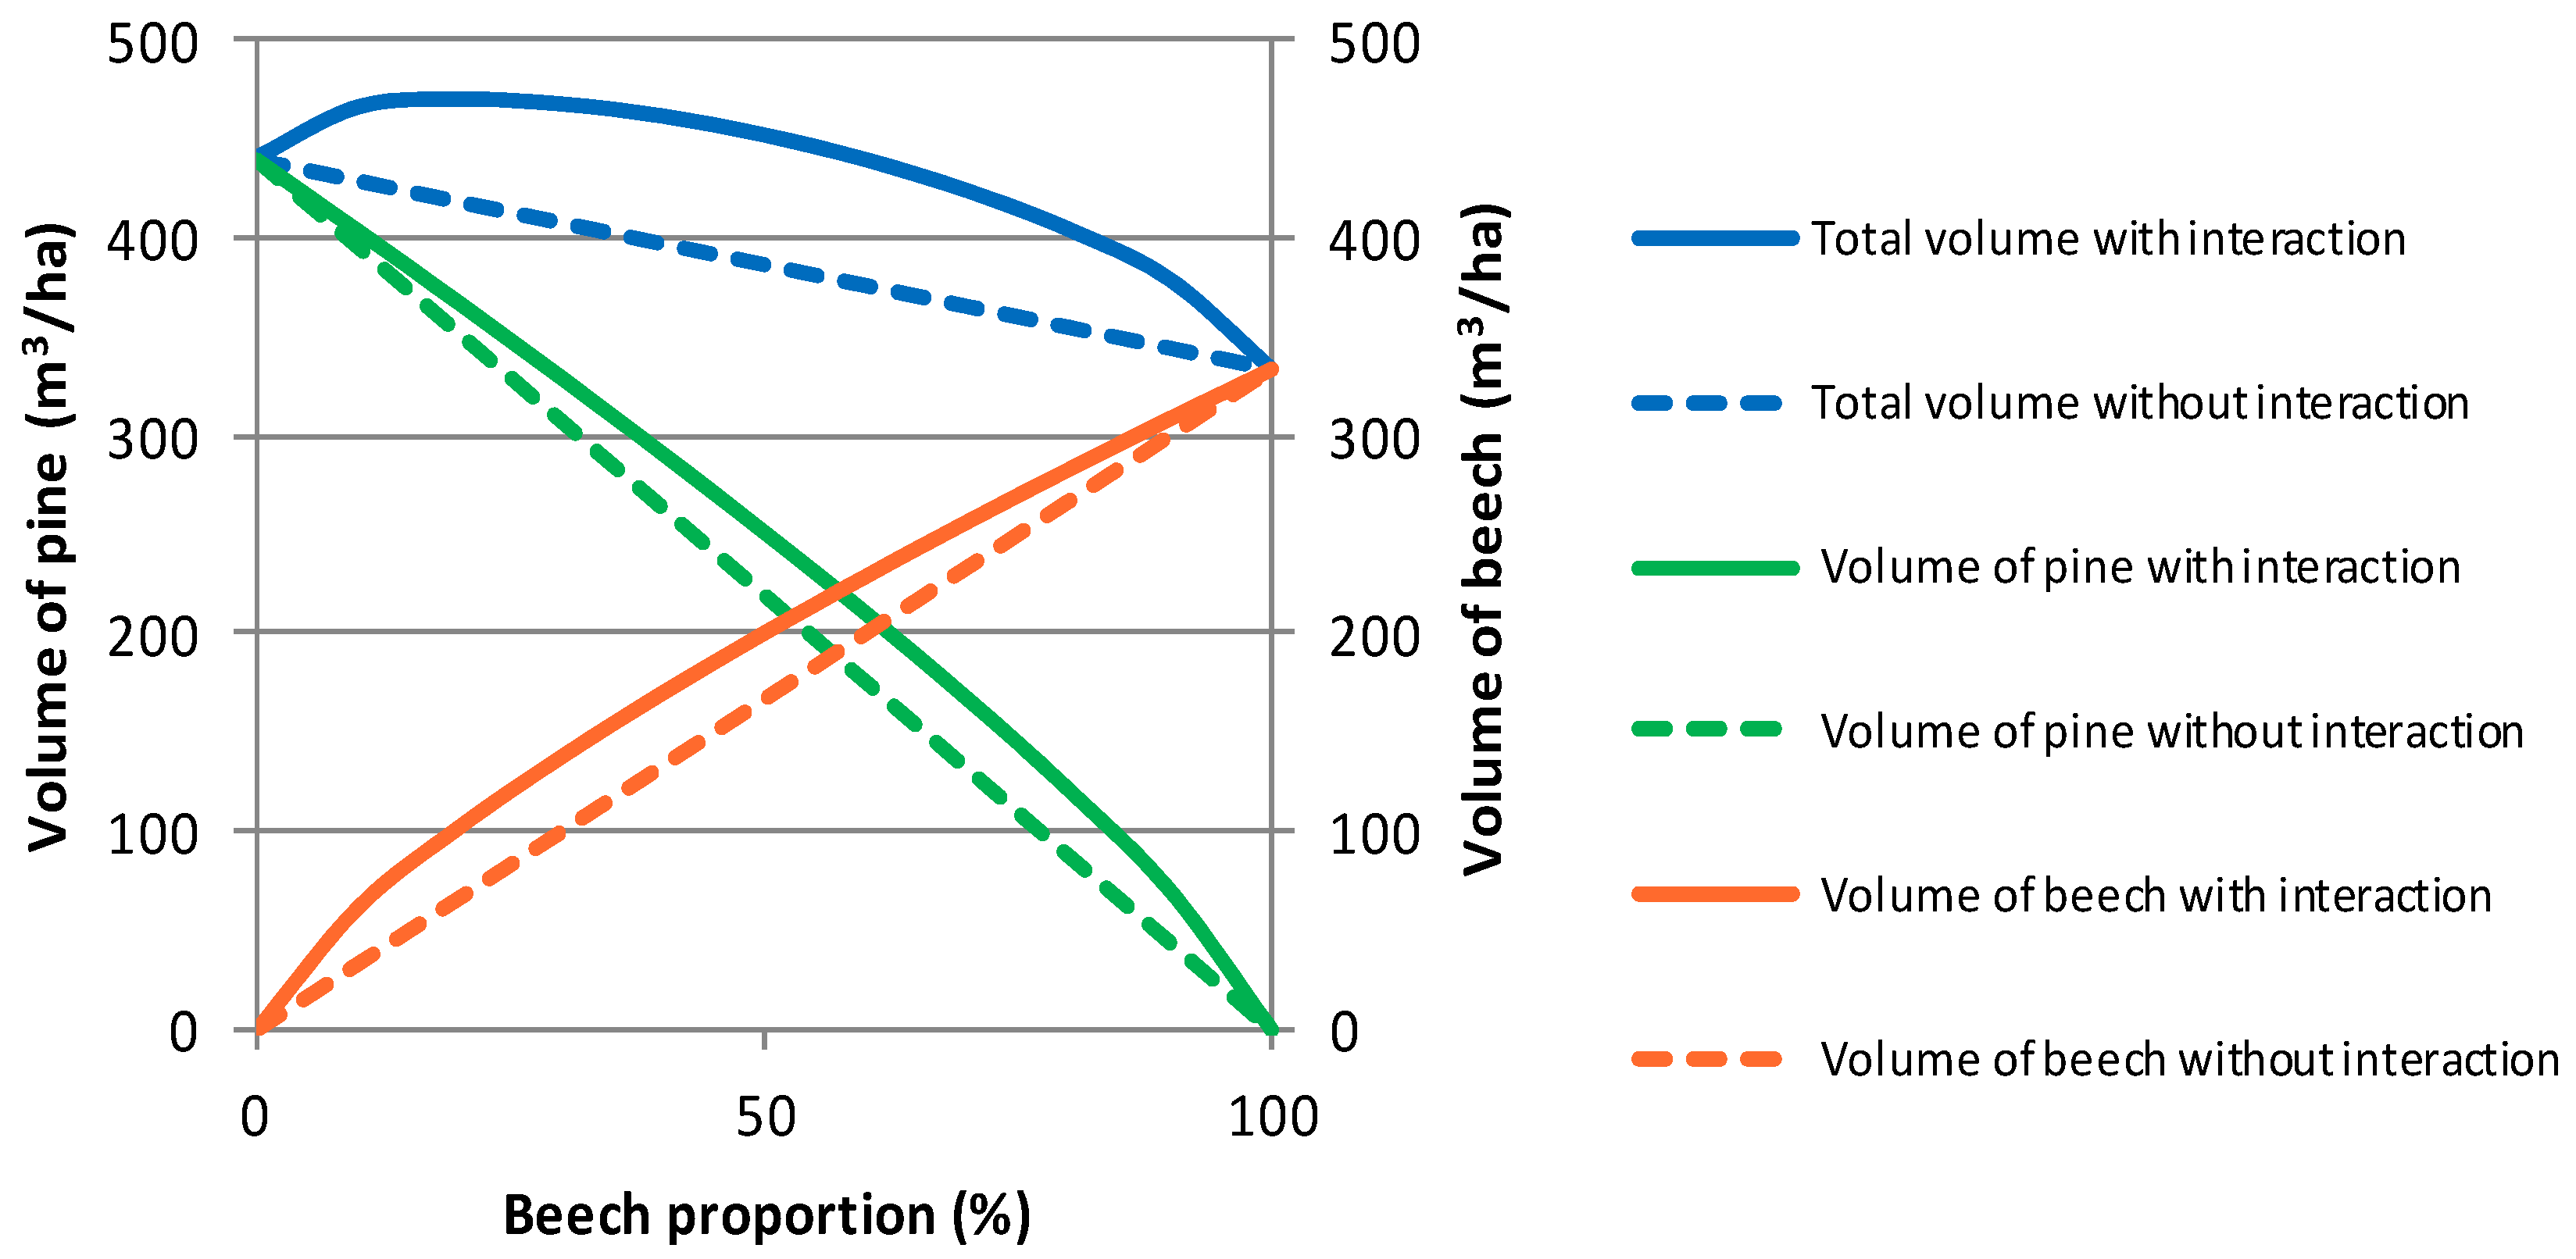
Figure 3.
Stumpage price data for Scots pine and European beech and distribution of observed and simulated prices. (a) Corrected stumpage price data for both species from 1976 to 2004 (Base year 2001); (b) Distribution of actual price data (29 observations) and dispersion diagram of the generated data used in the simulations. The 90%, 95% and 99% confidence ellipses are shown.
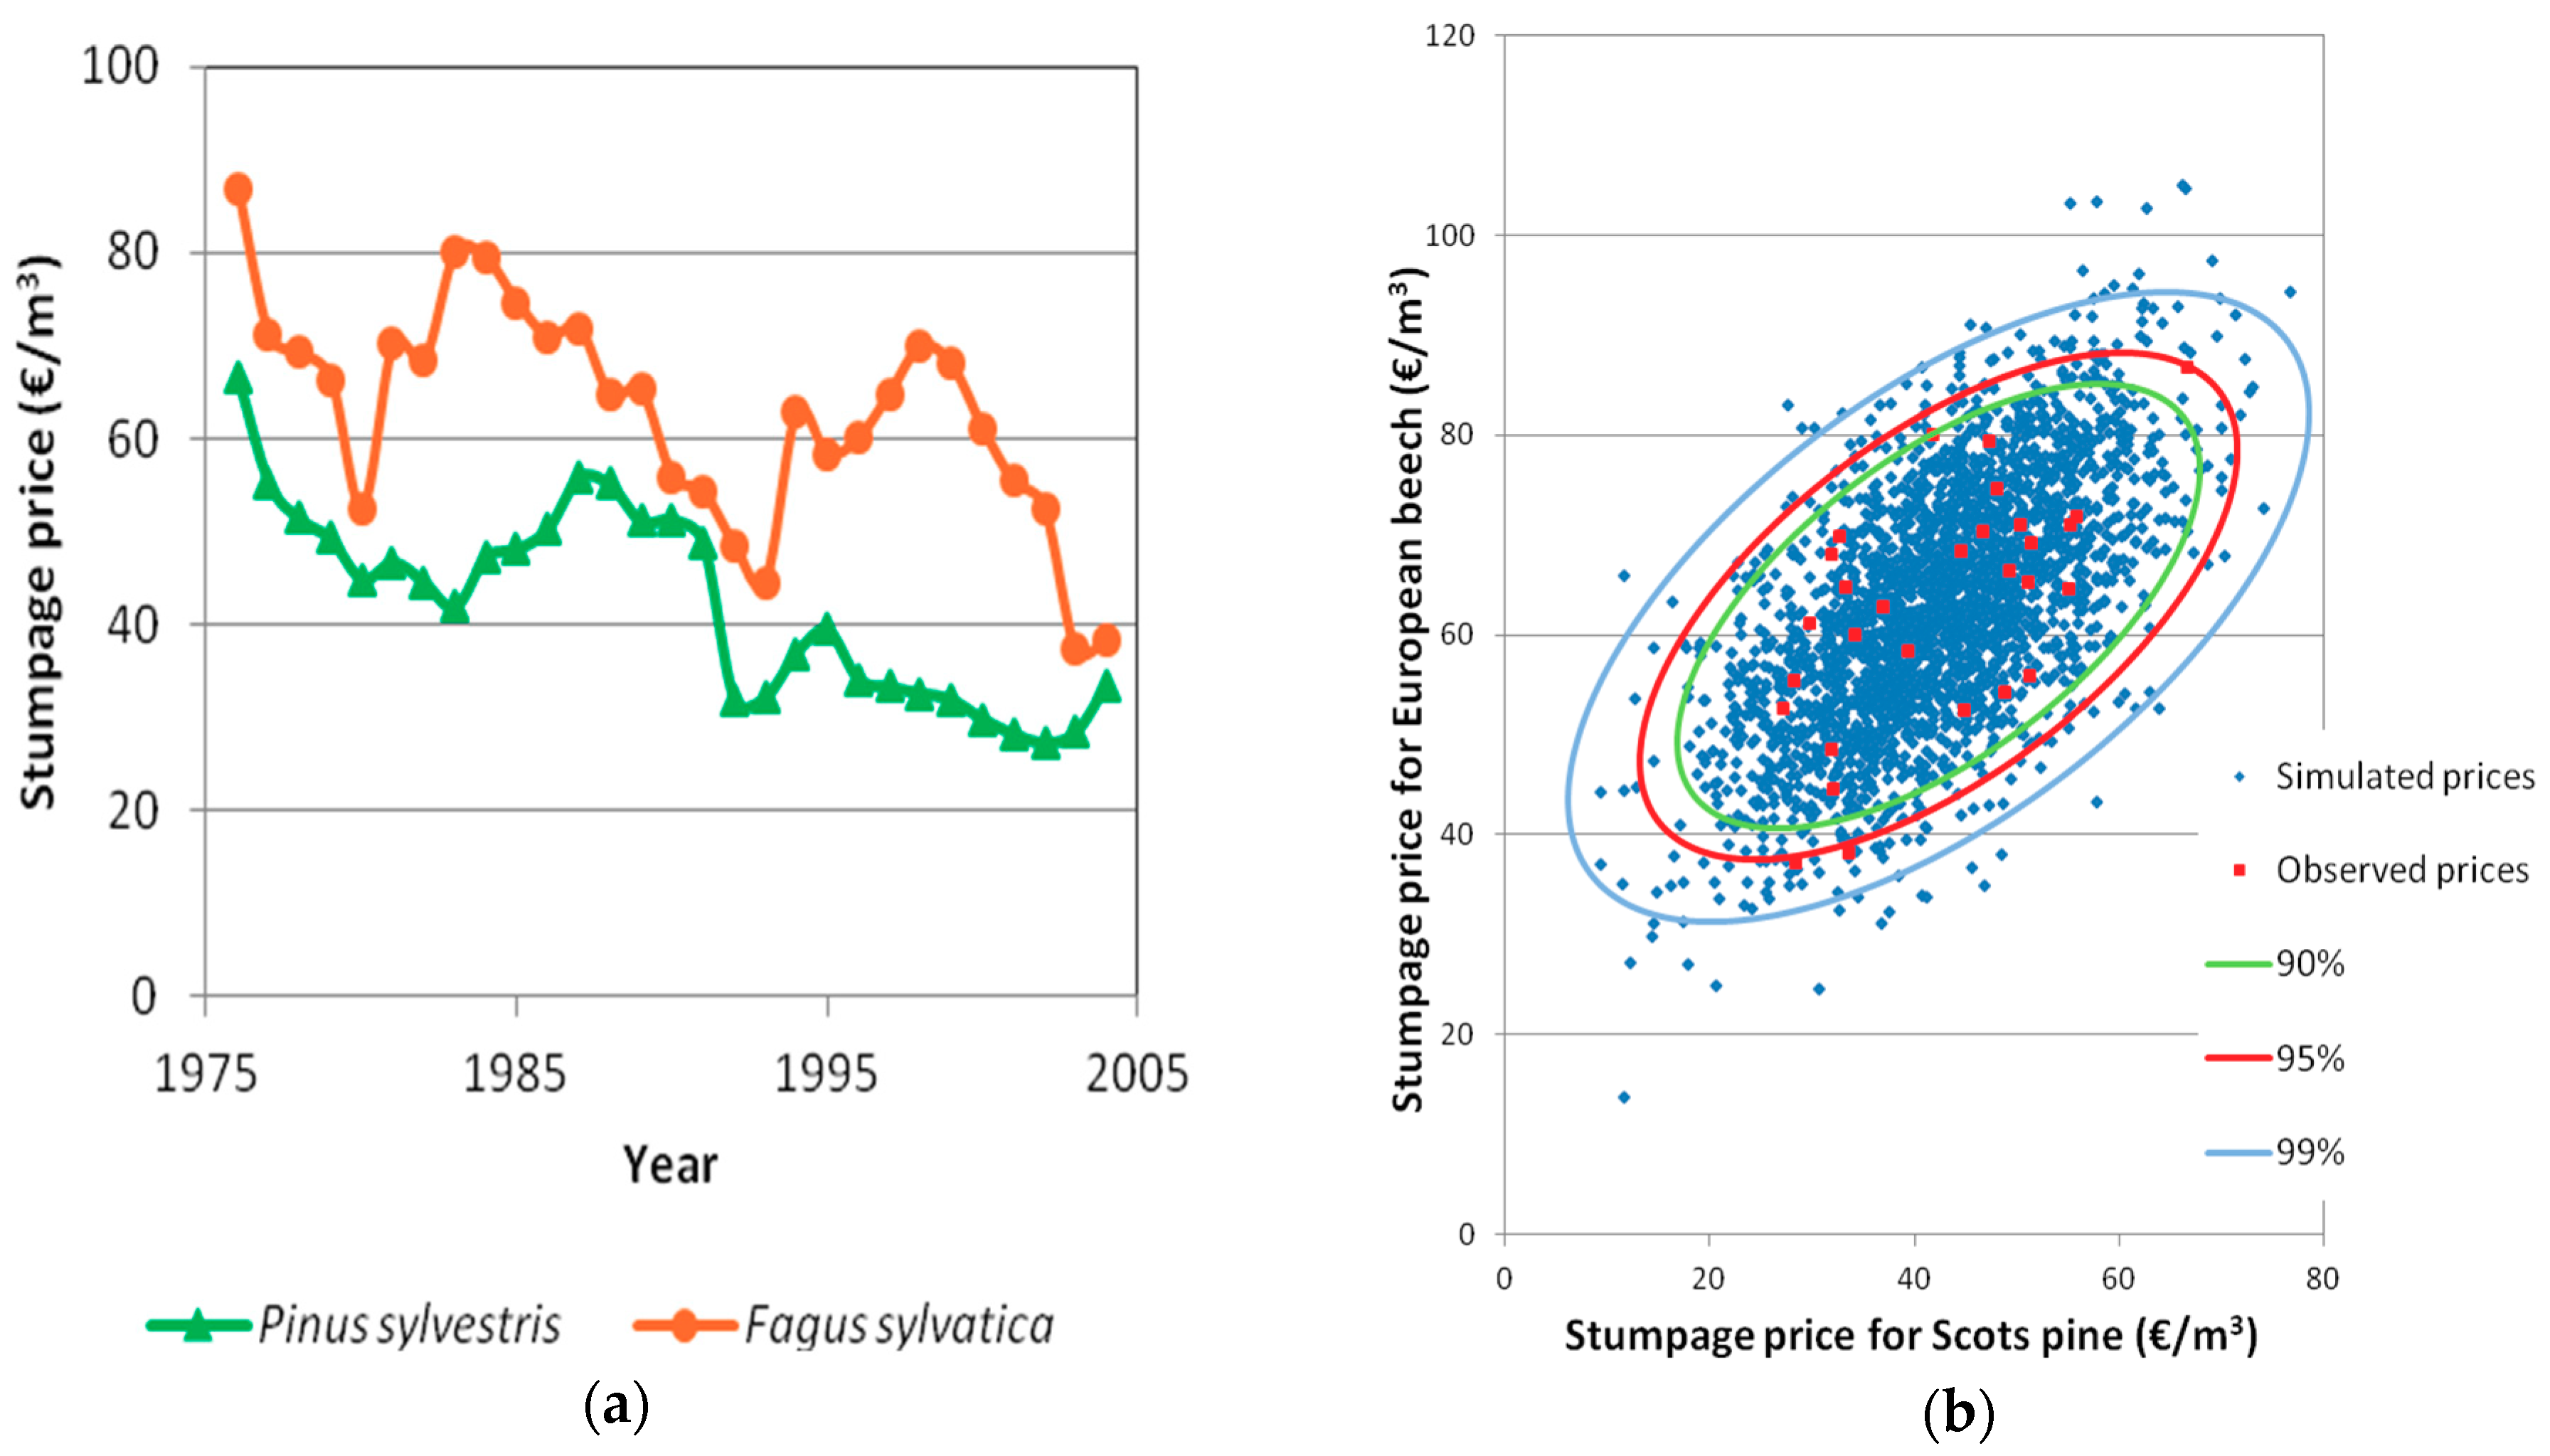
Figure 4.
Examples of timber price scenarios no. 38 and 214 for beech and pine.
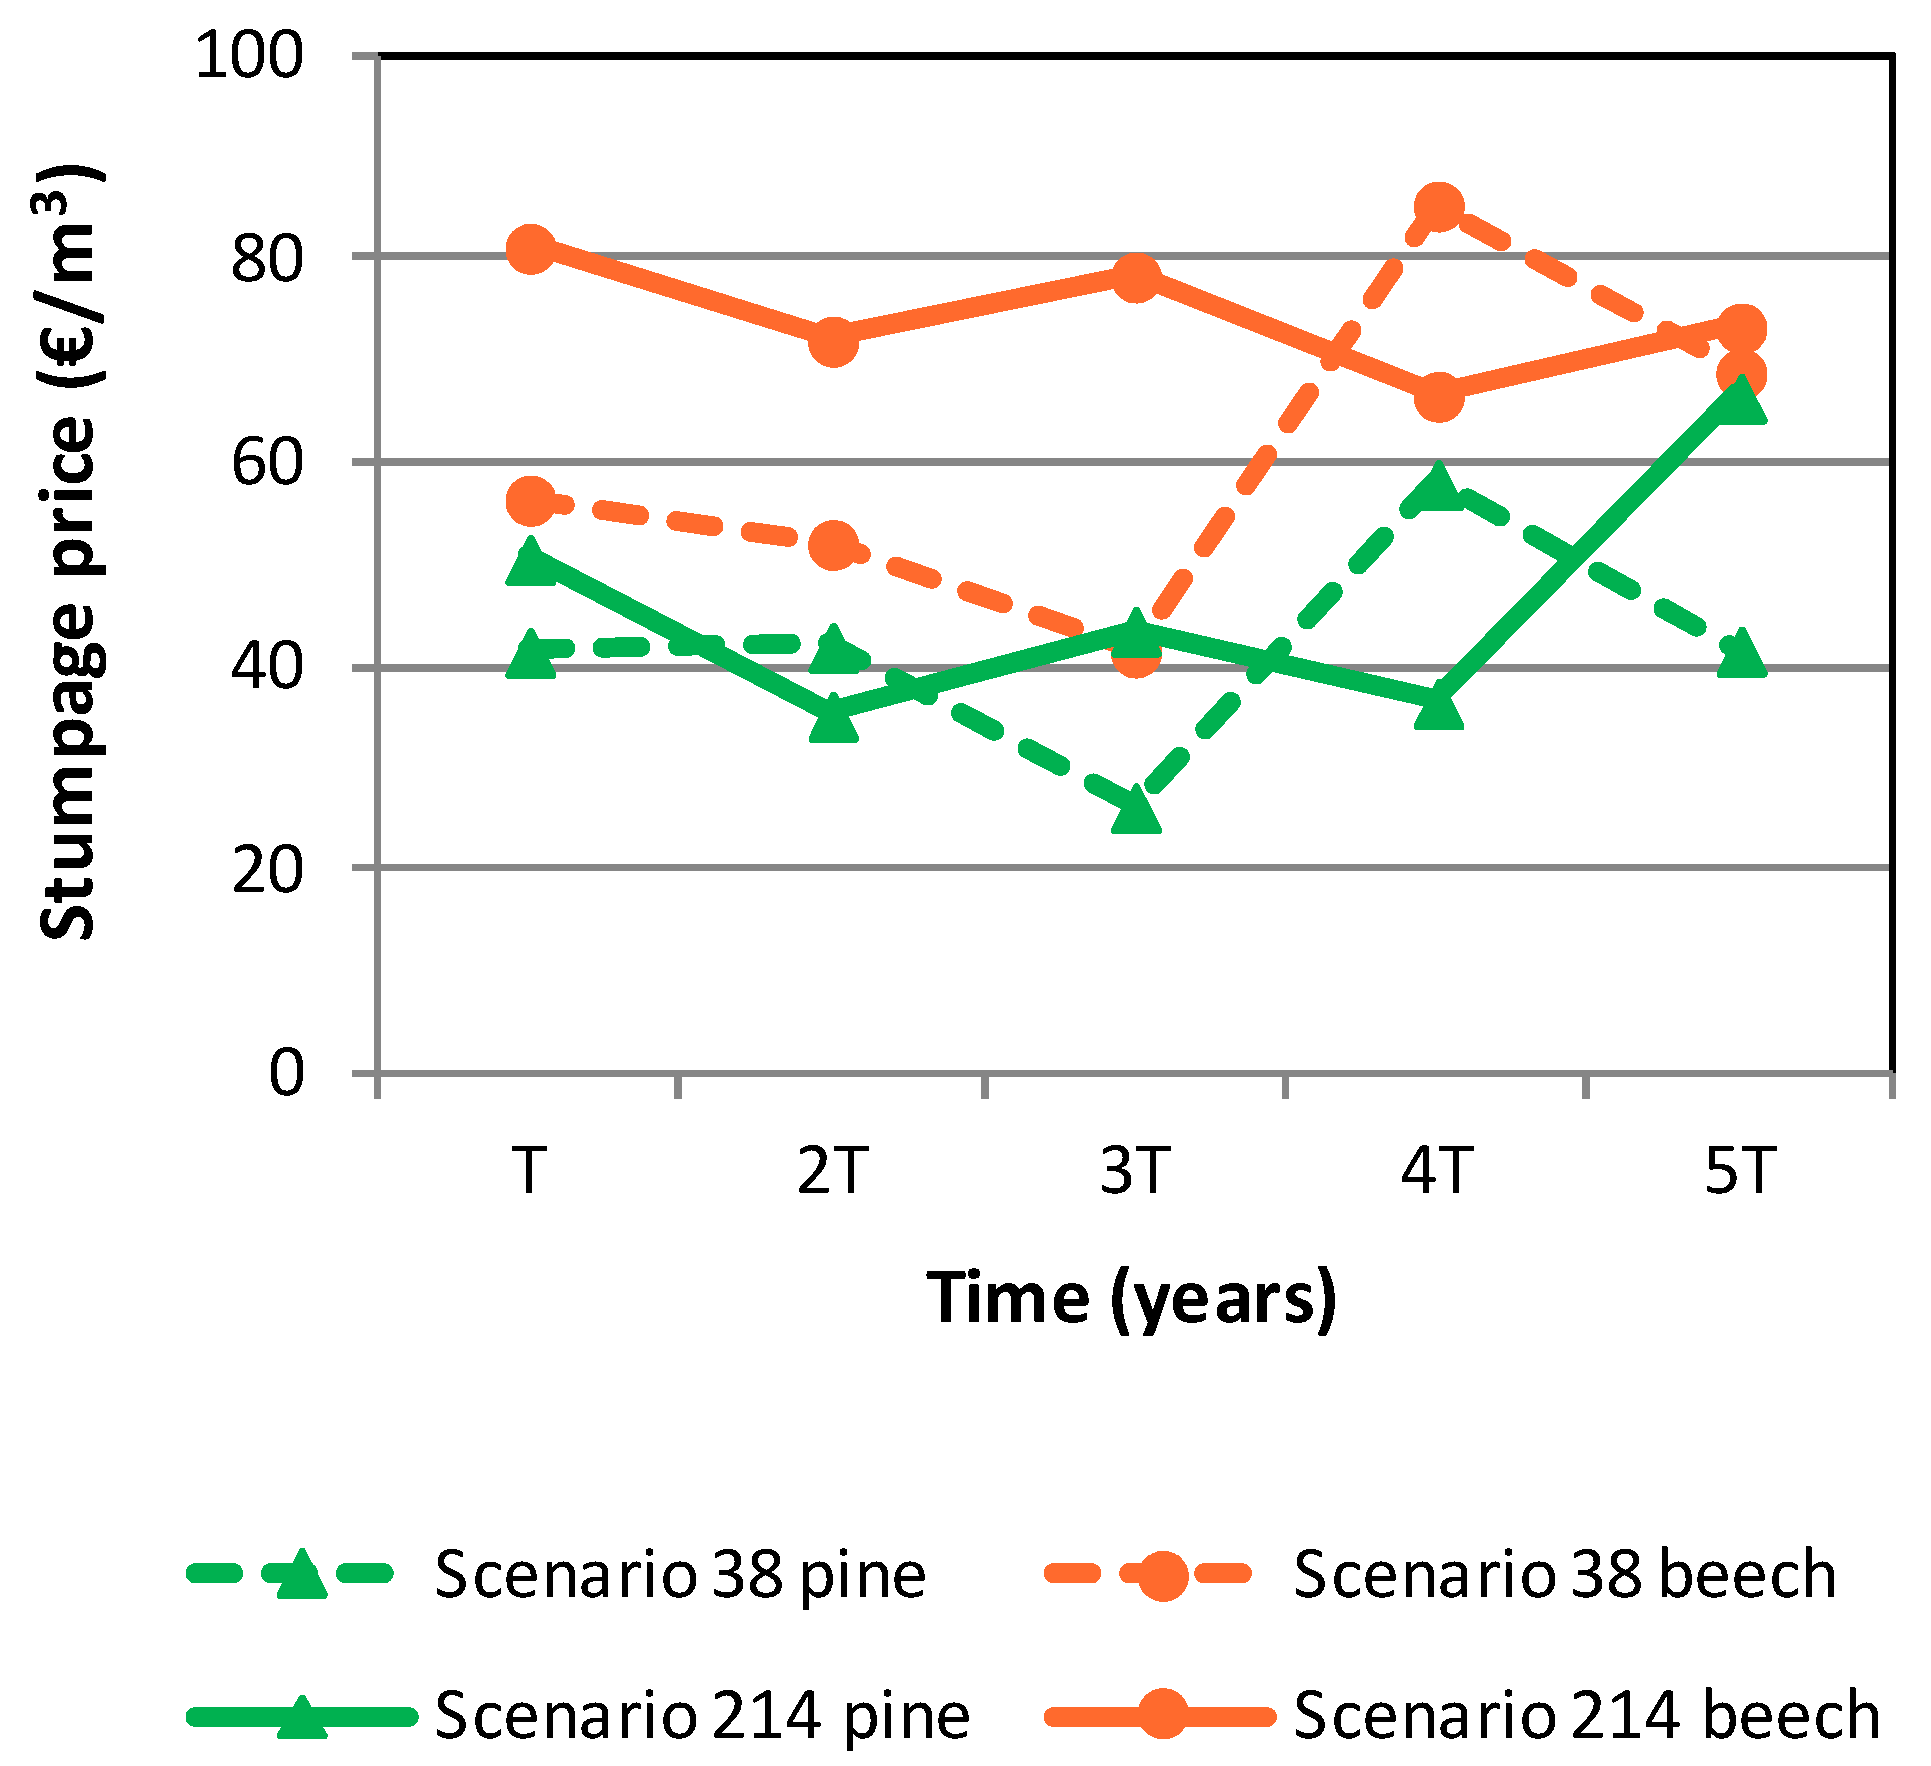
Figure 5.
Probability distributions of soil expectation value (SEV) for pure and mixed stands of Scots pine (Ps) and beech (Fs) for a 2% discount rate and a 90-year rotation.
Figure 5.
Probability distributions of soil expectation value (SEV) for pure and mixed stands of Scots pine (Ps) and beech (Fs) for a 2% discount rate and a 90-year rotation.
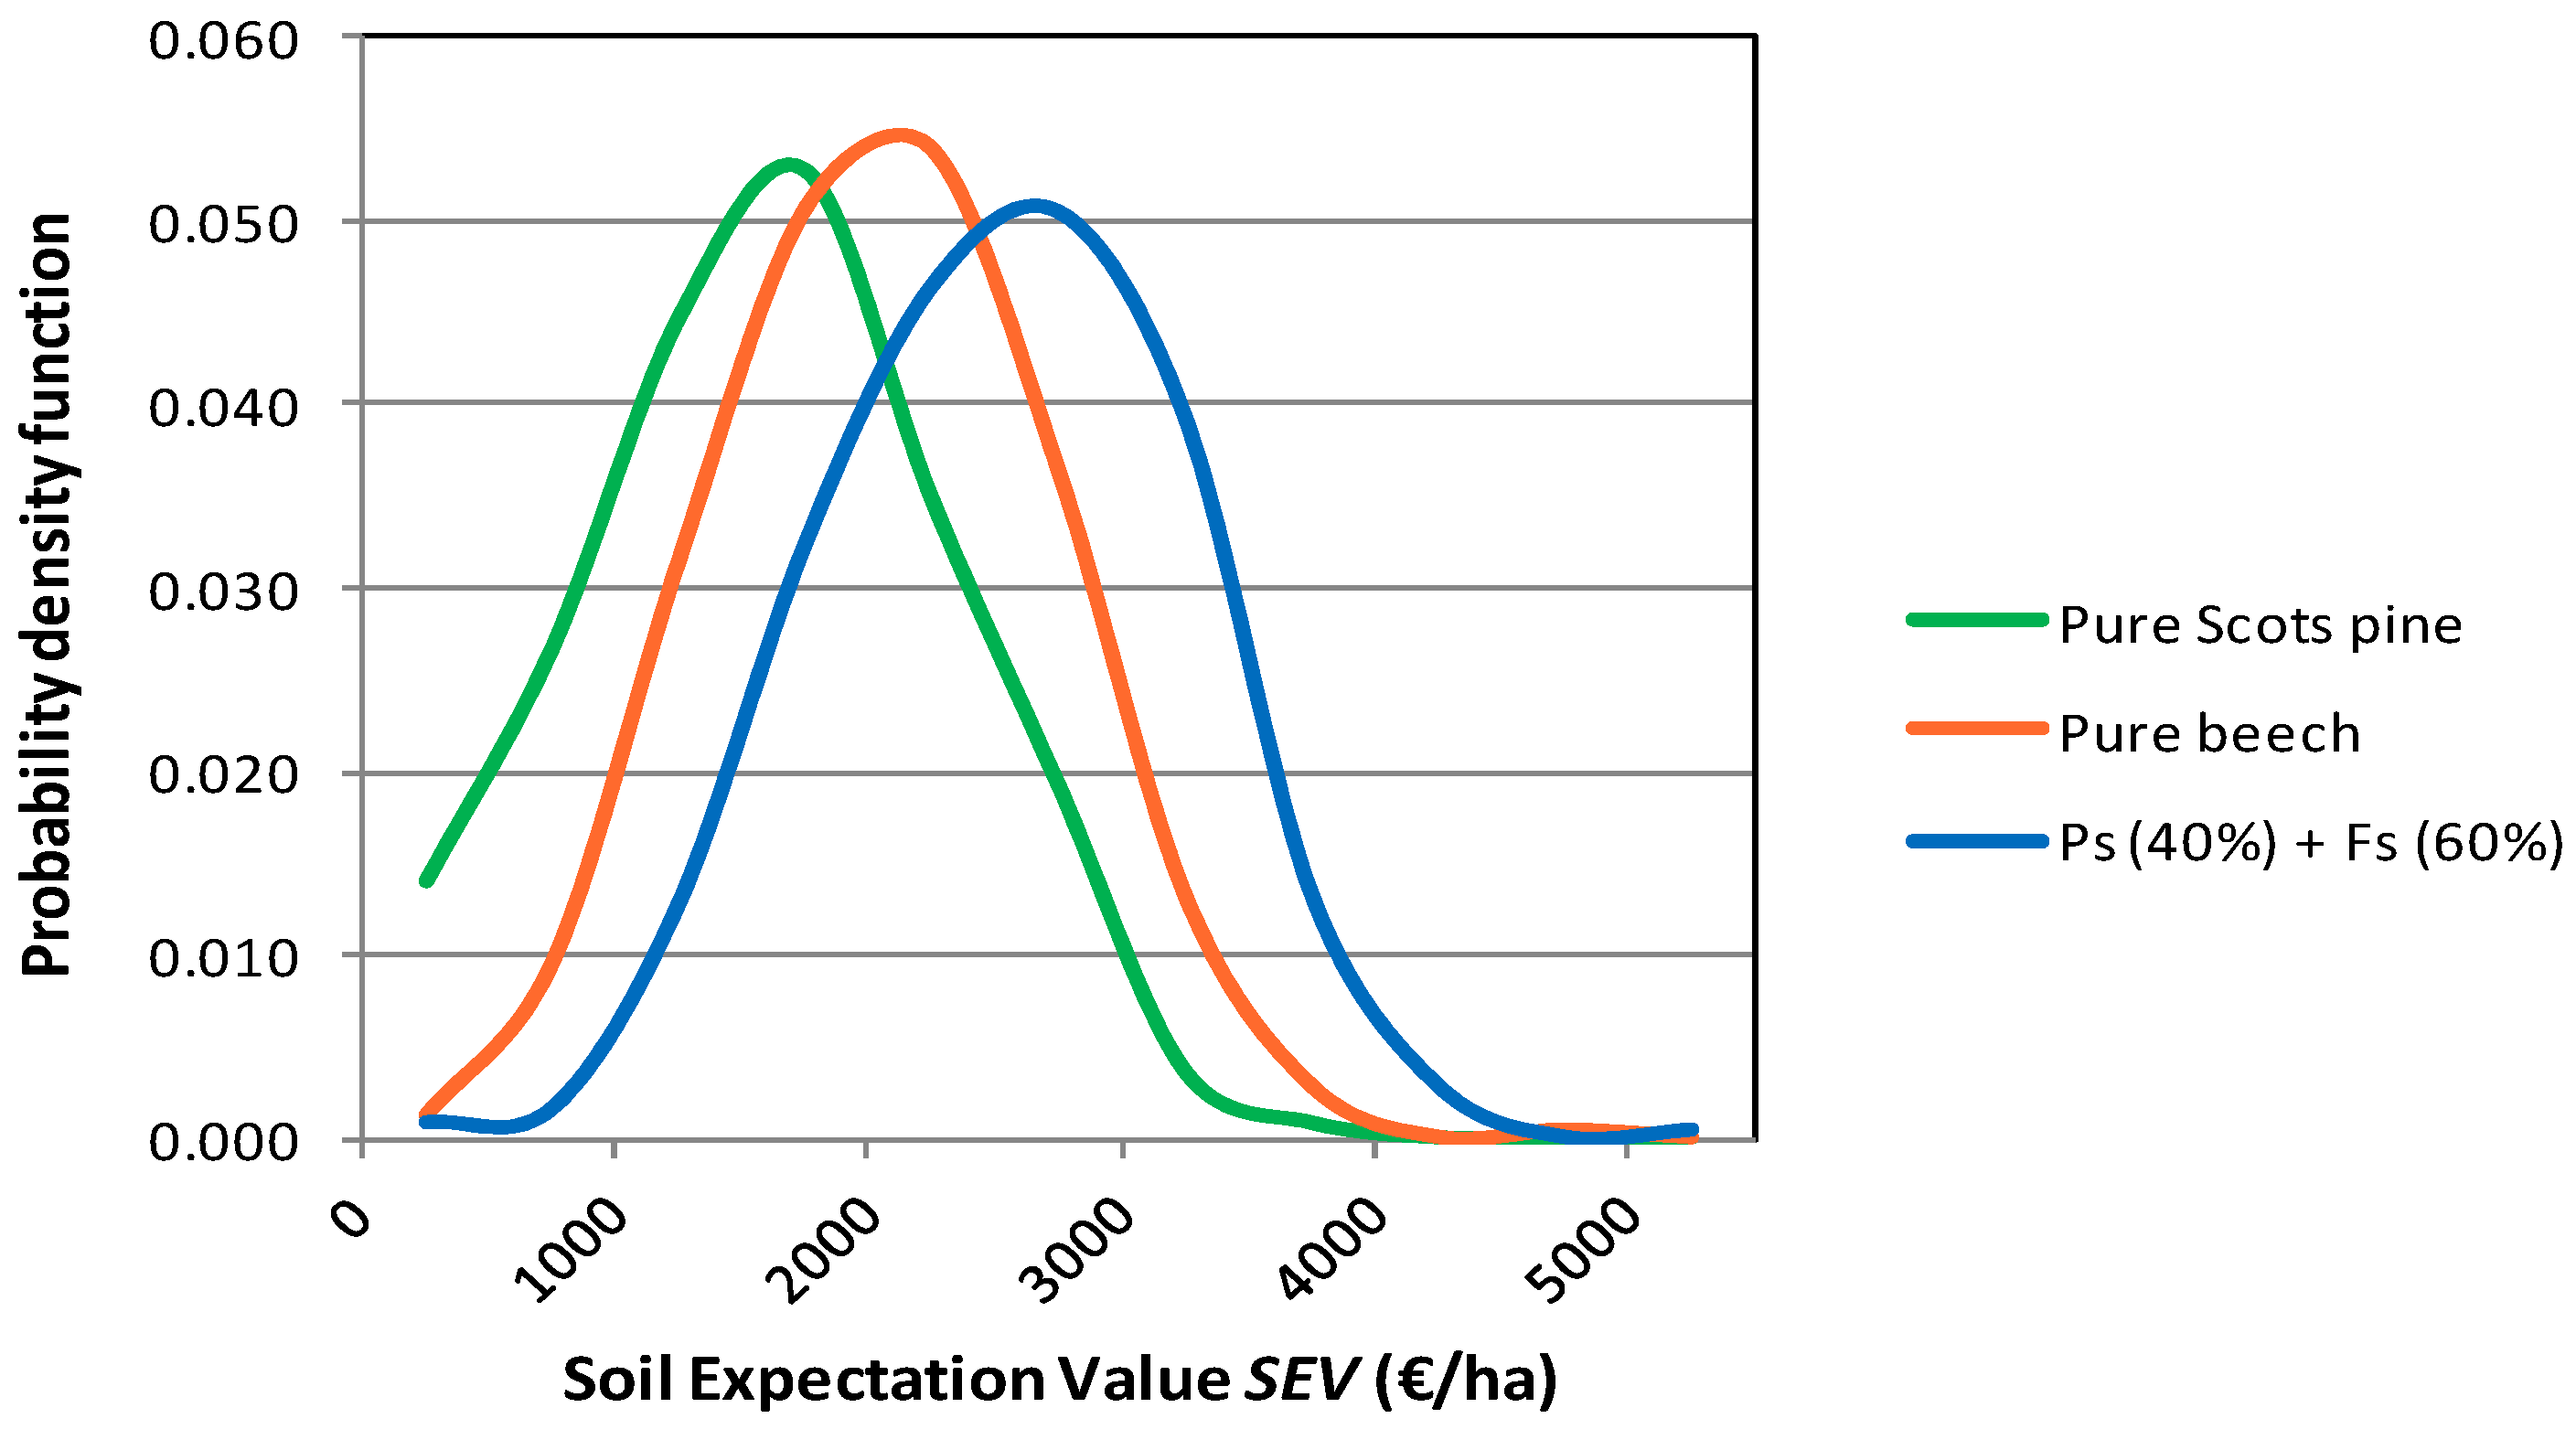
Figure 6.
Variation of financial return (Mean SEV) and risk (Cv of SEV) as a function of the proportion of beech in the mixture for three different rotation ages (T = 80, 90 and 100 years) and r = 2% (a) Average soil expectation value (€/ha) showing combinations where it reaches its maximum; (b) Coefficient of variation of SEV (%) and combinations where a minimum value is reached.
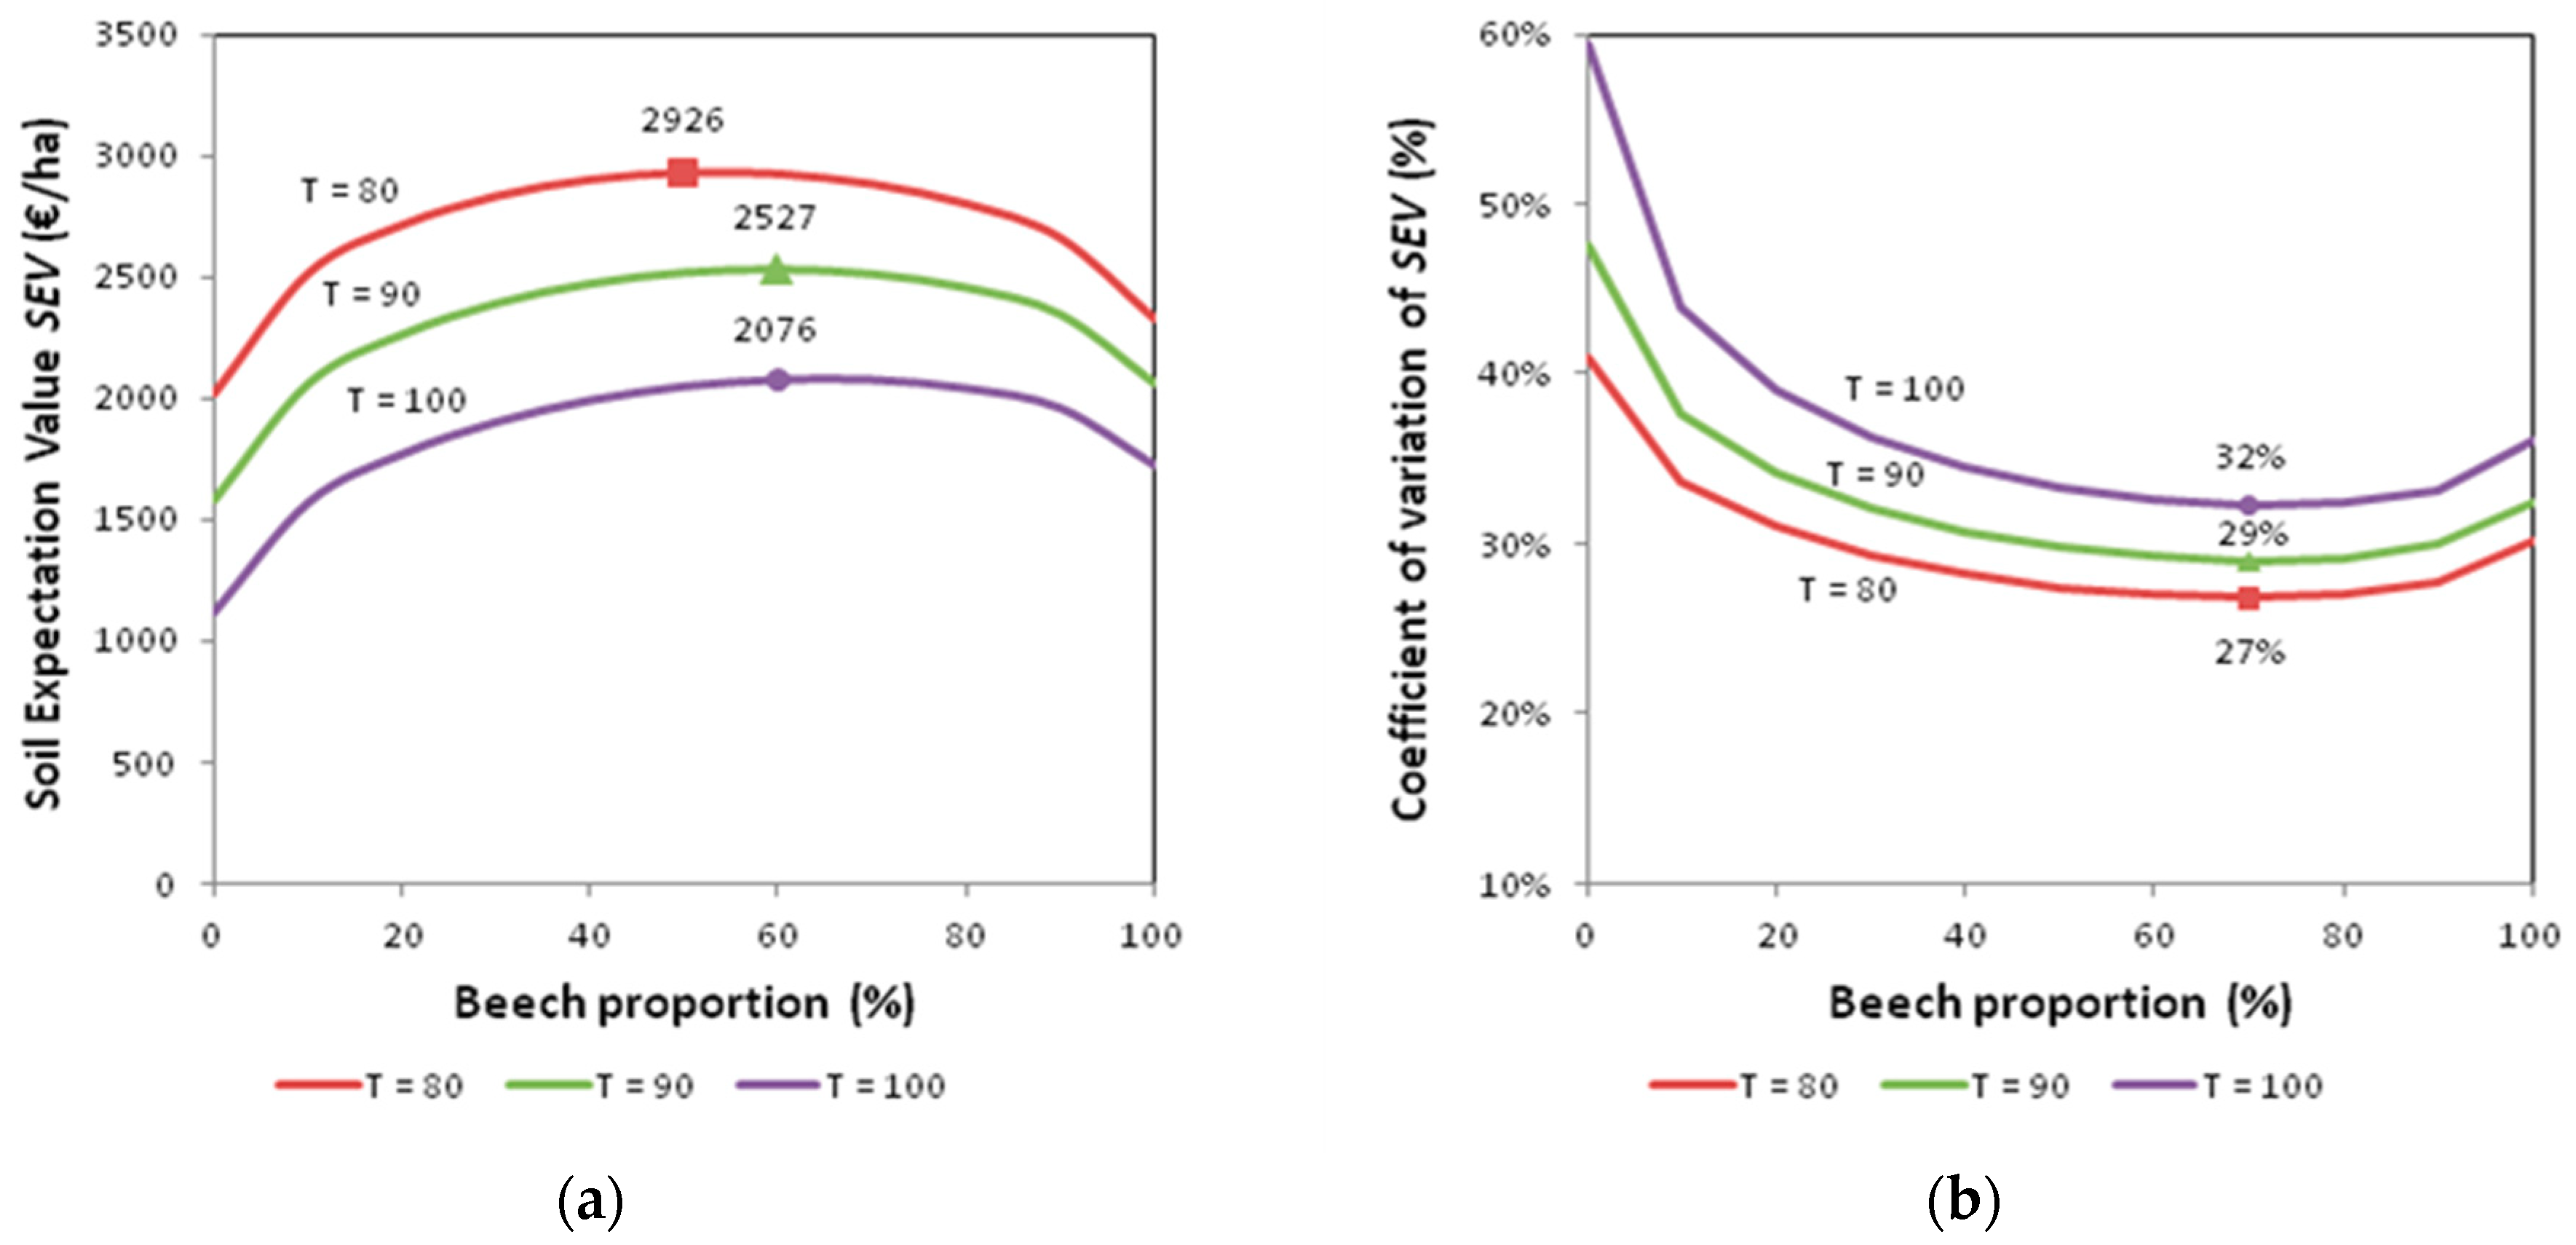
Figure 7.
Financial return (SEV) and risk for different proportions of pine (Ps) and beech (Fs). Rotation is 90 years for both species and discount rate is 2%. (a) Average SEV and risk (measured by Cv); (b) Average SEV and standard deviation of SEV.
Figure 7.
Financial return (SEV) and risk for different proportions of pine (Ps) and beech (Fs). Rotation is 90 years for both species and discount rate is 2%. (a) Average SEV and risk (measured by Cv); (b) Average SEV and standard deviation of SEV.
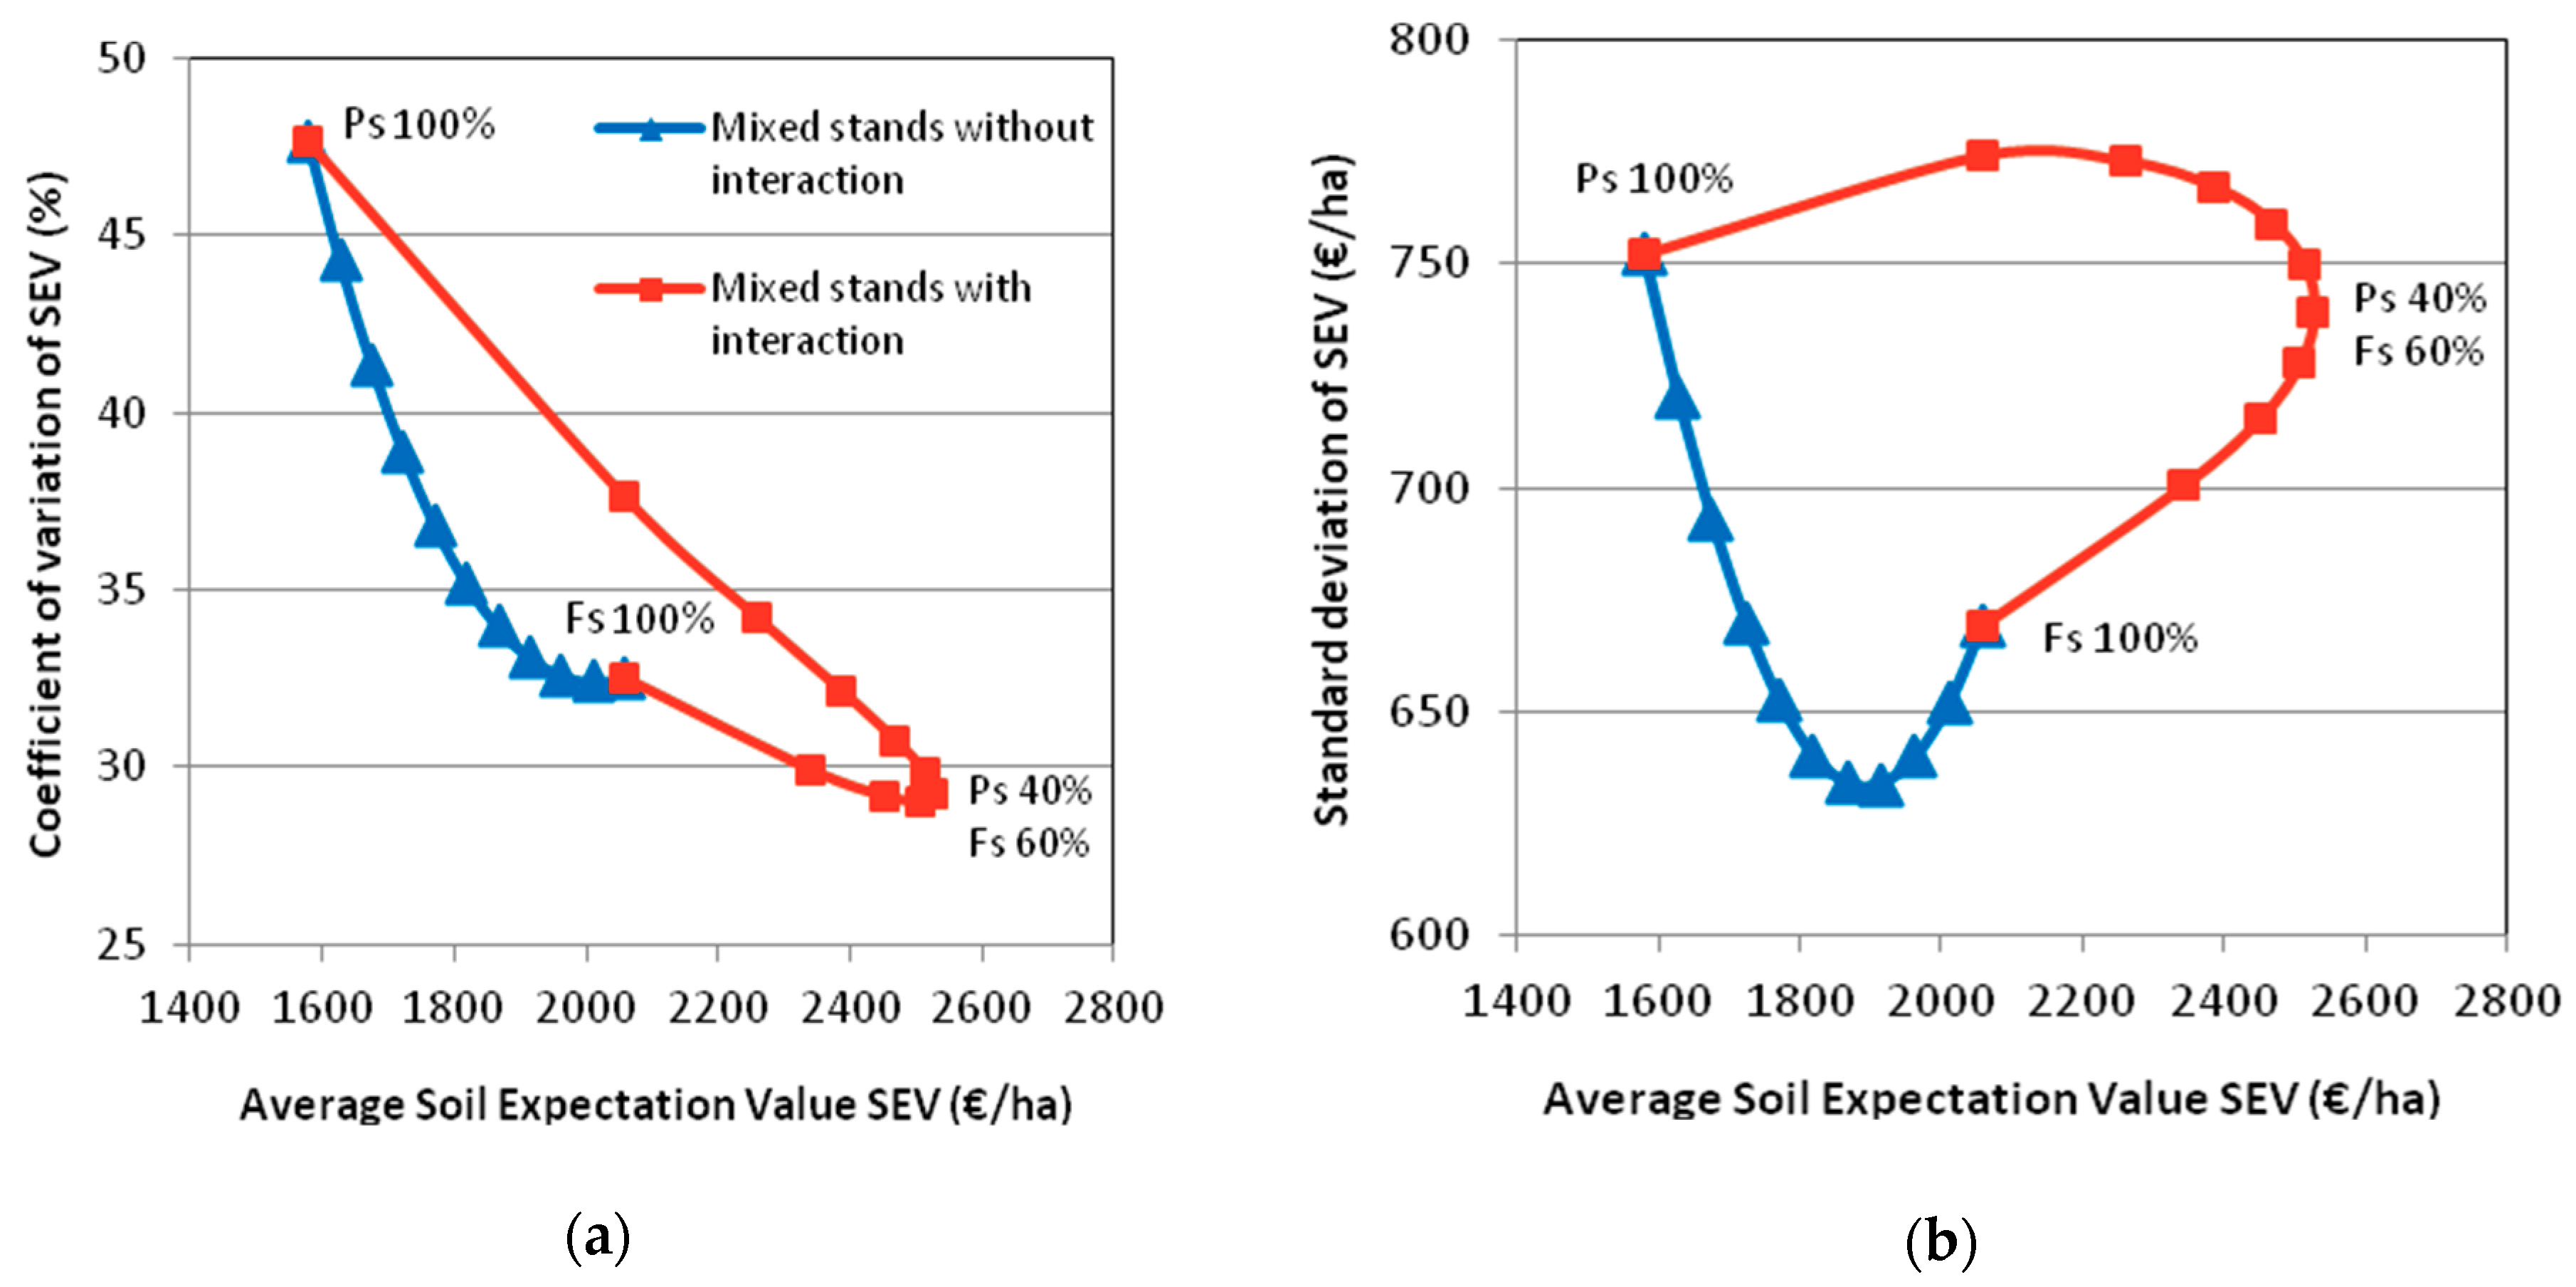
Figure 8.
Cumulative distribution function of soil expectation value from 500 price scenarios for monospecific pine stands (green), monospecific beech stands (orange) and mixed stands with a proportion of 40% pine and 60% beech (blue) for a 90-year rotation. (a) Distribution of SEV (€/ha) for a discount rate r = 2%; (b) Distribution of SEV (€/ha) for a discount rate r = 3%.

Table 1.
Total timber stock at age t for different mixing ratios of Pinus sylvestris and Fagus sylvatica. The mixtures leading to a timber volume at a given age higher than that of monospecific Scots pine stands are highlighted.
Table 1.
Total timber stock at age t for different mixing ratios of Pinus sylvestris and Fagus sylvatica. The mixtures leading to a timber volume at a given age higher than that of monospecific Scots pine stands are highlighted.
| Pine Proportion (%) | Beech Proportion (%) | Timber Stock at Age t (m3/ha) | |||||
|---|---|---|---|---|---|---|---|
| t = 70 | t = 80 | t = 90 | t = 100 | t = 110 | t = 120 | ||
| 100 | 0 | 347.6 | 395.1 | 440.5 | 477.3 | 511.1 | 541.9 |
| 90 | 10 | 360.8 | 414.7 | 466.3 | 509.4 | 549.4 | 586.1 |
| 80 | 20 | 359.3 | 415.9 | 470.1 | 516.2 | 559.1 | 598.7 |
| 70 | 30 | 353.8 | 412.0 | 467.7 | 515.9 | 560.9 | 602.5 |
| 60 | 40 | 345.5 | 404.7 | 461.4 | 511.1 | 557.6 | 600.7 |
| 50 | 50 | 335.0 | 394.7 | 451.9 | 502.5 | 550.1 | 594.4 |
| 40 | 60 | 322.4 | 382.1 | 439.3 | 490.6 | 538.8 | 583.9 |
| 30 | 70 | 307.5 | 366.7 | 423.5 | 475.0 | 523.6 | 569.1 |
| 20 | 80 | 290.0 | 348.1 | 403.8 | 455.0 | 503.4 | 548.9 |
| 10 | 90 | 268.2 | 324.3 | 378.2 | 428.4 | 476.1 | 521.0 |
| 0 | 100 | 232.2 | 283.4 | 332.6 | 379.5 | 424.3 | 466.7 |
Table 2.
Average soil expectation value (SEV) and coefficient of variation (Cv) as a measure of financial return and risk for different mixing ratios of Pinus sylvestris and Fagus sylvatica.
Table 2.
Average soil expectation value (SEV) and coefficient of variation (Cv) as a measure of financial return and risk for different mixing ratios of Pinus sylvestris and Fagus sylvatica.
| Pine Proportion | Beech Proportion | SEV | Cv | SEV | Cv | SEV | Cv |
|---|---|---|---|---|---|---|---|
| T = 80 Years | T = 90 Years | T = 100 Years | |||||
| (%) | (%) | (€/ha) | (%) | (€/ha) | (%) | (€/ha) | (%) |
| 100 | 0 | 2022 | 40.94 | 1579 | 47.62 | 1120 | 59.43 |
| 90 | 10 | 2514 | 33.65 | 2057 | 37.62 | 1571 | 43.91 |
| 80 | 20 | 2711 | 30.99 | 2259 | 34.21 | 1770 | 39.12 |
| 70 | 30 | 2829 | 29.32 | 2387 | 32.13 | 1902 | 36.32 |
| 60 | 40 | 2897 | 28.19 | 2469 | 30.75 | 1992 | 34.50 |
| 50 | 50 | 2926 | 27.43 | 2514 | 29.82 | 2048 | 33.29 |
| 40 | 60 | 2920 | 26.98 | 2527 | 29.25 | 2076 | 32.55 |
| 30 | 70 | 2879 | 26.82 | 2508 | 29.03 | 2075 | 32.23 |
| 20 | 80 | 2797 | 27.00 | 2452 | 29.19 | 2040 | 32.36 |
| 10 | 90 | 2657 | 27.70 | 2342 | 29.91 | 1959 | 33.15 |
| 0 | 100 | 2327 | 30.10 | 2058 | 32.51 | 1724 | 36.15 |
Table 3.
Internal Rate of Return (IRR) for different mixing ratios of Pinus sylvestris and Fagus sylvatica. Three different rotations have been considered (T = 80, T = 90 and T = 100 years).
Table 3.
Internal Rate of Return (IRR) for different mixing ratios of Pinus sylvestris and Fagus sylvatica. Three different rotations have been considered (T = 80, T = 90 and T = 100 years).
| Pine Proportion (%) | Beech Proportion (%) | Internal Rate of Return (IRR) % | ||
|---|---|---|---|---|
| T = 80 | T = 90 | T = 100 | ||
| 100 | 0 | 2.81 | 2.62 | 2.44 |
| 50 | 50 | 3.06 | 2.88 | 2.70 |
| 40 | 60 | 3.06 | 2.88 | 2.70 |
| 30 | 70 | 3.05 | 2.87 | 2.70 |
| 0 | 100 | 2.90 | 2.76 | 2.61 |
Table 4.
Average soil expectation value (SEV), measures of risk (Cv, SD) and threshold SEV value exceeded with a probability of 95% (VaR) for T = 90 years and different mixing ratios.
Table 4.
Average soil expectation value (SEV), measures of risk (Cv, SD) and threshold SEV value exceeded with a probability of 95% (VaR) for T = 90 years and different mixing ratios.
| Pine Proportion | Beech Proportion | SEV | Cv | SD | VaR |
|---|---|---|---|---|---|
| (%) | (%) | (€/ha) | (%) | (€/ha) | (€/ha) |
| 100 | 0 | 1579 | 47.62 | 752 | 338 |
| 50 | 50 | 2514 | 29.82 | 750 | 1277 |
| 40 | 60 | 2527 | 29.25 | 739 | 1307 |
| 30 | 70 | 2508 | 29.03 | 728 | 1307 |
| 0 | 100 | 2058 | 32.51 | 669 | 954 |
© 2018 by the author. Licensee MDPI, Basel, Switzerland. This article is an open access article distributed under the terms and conditions of the Creative Commons Attribution (CC BY) license (http://creativecommons.org/licenses/by/4.0/).
Share and Cite
MDPI and ACS Style
García-Robredo, F. Effect of Species Complementarity on Financial Return in Mixed Stands of European Beech and Scots Pine in Northern Spain. Forests 2018, 9, 559. https://doi.org/10.3390/f9090559
AMA Style
García-Robredo F. Effect of Species Complementarity on Financial Return in Mixed Stands of European Beech and Scots Pine in Northern Spain. Forests. 2018; 9(9):559. https://doi.org/10.3390/f9090559
Chicago/Turabian StyleGarcía-Robredo, Fernando. 2018. "Effect of Species Complementarity on Financial Return in Mixed Stands of European Beech and Scots Pine in Northern Spain" Forests 9, no. 9: 559. https://doi.org/10.3390/f9090559
Note that from the first issue of 2016, this journal uses article numbers instead of page numbers. See further details here.