Effect of Fertilization on Growth and Mortality of Jack Pine Growing on Poor, Sandy Soils in Michigan, USA: Implications for Sustainable Management

Department of Forestry, Michigan State University, 480 Wilson Road, Room 126, East Lansing, MI 48824-1222, USA
Forests 2018, 9(9), 549; https://doi.org/10.3390/f9090549
Submission received: 9 August 2018
/
Revised: 1 September 2018
/
Accepted: 3 September 2018
/
Published: 8 September 2018
(This article belongs to the Special Issue Nutrient Dynamics of Planted Forests)
Abstract
:Our understanding of nutrient limitations to jack pine (Pinus banksiana Lamb.) growth is lacking across the Lake States of the USA (Michigan, Wisconsin and Minnesota), where this species makes up an important forest cover type on nutrient poor sands. Currently this cover type is managed using whole-tree harvesting (WTH) across large areas of state and federal forestland, which raises concerns for long-term declines in soil fertility and future productivity. In this study, I carried out a factorial fertilization experiment to better understand potential nutrient limitations to jack pine growth on excessively drained sandy soils in northern Lower Michigan. Treatments were nitrogen (N), phosphorus (P) and base cations applied singly and in all factorial combinations. In addition, I constructed input-output nutrient budgets for jack pine management in northern Lower Michigan using existing data on atmospheric deposition, weathering and harvest nutrient removals. In no case did I observe an increase in tree growth rate to fertilization, instead I observed an overall decline in growth rates, and an increase in mortality rates, in trees fertilized with N. Nitrogen-induced imbalances of foliar N: potassium (K) were strongly correlated with decreased growth in N amended plots. Together with nutrient budget analysis, which indicated that harvest removals of K greatly exceed inputs over the planned rotation, this suggests that WTH may not be sustainable over multiple rotations. Furthermore, the impacts of WTH on ecosystem K status are likely to be exacerbated over time by anthropogenic N deposition.
1. Introduction
The degree and nature of nutrient limitations to forest productivity have important implications for designing silvicultural systems that will sustain long-term soil productivity, as well as for understanding the impacts of anthropogenic nitrogen (N) deposition on forest productivity. Nitrogen availability has long been viewed as limiting the productivity of most temperate and boreal forests, a view that has been strongly supported by recent meta analyses of N addition experiments [1,2]. However, other metanalyses and reviews have indicated that co-limitation of forest productivity by phosphorus (P) may be widespread, even in high-latitude systems [3,4]. More recently, a global review of the literature on potassium (K) biogeochemistry has argued that K availability may be as limiting as either N or P for terrestrial productivity [5]. I investigated the nature of nutrient limitations to tree growth in young jack pine (Pinus banksiana Lamb.) plantations in Michigan, USA, in order to better understand the sustainability of current silvicultural practices, and to assess the likely response of this system to anthropogenic N deposition.
For decades, there has been great concern in the forestry literature over the prospect that large nutrient removals associated with intensive harvesting of forest residues may result in long-term declines in soil fertility. This topic was intensively researched in the 1980s with comparisons of traditional stem-only harvesting (SOH) vs. whole-tree harvesting (WTH) (e.g., [6,7]). Interest in this topic revived in the late 2000s with increasing emphasis on intensification of forest harvesting to meet biomass energy goals (e.g., [8,9]). From the 1980s through the present day, a consistent finding has been that forests found on sandy soils with low inherent fertility are more susceptible to long-term declines in soil fertility from intensive harvesting compared to forests on finer-textured soils with greater capacity to supply base cations through weathering [6,7,8,9,10,11]. Despite this clear understanding, jack pine forests growing on extremely acidic, nutrient-poor outwash sands across the Lake States region continue to be managed with WTH. In fact, woody biomass harvesting guidelines for both the state of Michigan and the state of Wisconsin, provide special exemptions to forest residue retention guidelines for this species, allowing for WTH [12,13]. The rationale provided for this exception in both states’ guidelines is that jack pine has a lower demand for nutrients, compared to other species, therefore, greater nutrient removals are unlikely to impact future forest productivity. In addition, anecdotally, foresters in this region view moisture as the overarching limiting factor on the excessively drained outwash sands where jack pine grows, and thus see nutrient availability as relatively unimportant to growth of these forests. Whereas, jack pine has been shown to be very responsive to fertilization (particularly N) in Canadian studies (reviewed by [14]), we are not aware of any studies of nutrient limitation to jack pine growth on excessively drained outwash sands in the Lake States.
Anthropogenic additions of reactive N to the global N cycle represent one of the most significant components of global environmental change [15,16]. Widespread inputs of a growth-limiting nutrient through atmospheric N deposition have been attributed with increasing forest productivity and carbon sequestration on a global basis [2,17,18,19]. The fact that boreal conifer forests have been traditionally viewed as being strongly limited by N [20,21], suggests that they should be particularly responsive to anthropogenic N deposition. However, other studies have indicated that coniferous trees are either less responsive to added N compared to broadleaved trees [22], or even experience growth declines in response to increased N availability [19], especially where base cation availability is low and N additions lead to imbalances or deficiencies in tree nutrition [23]. Xeric site conditions also have the potential to inhibit the response of conifer stands to N additions. Several studies have indicated that N fertilized conifers are more susceptible to drought stress compared to trees grown with lower levels of N [20,24,25], or that the response to added N can be nullified by inadequate moisture [26]. Thus jack pine in the Lake States growing at the southern limit of the species’ distribution and restricted to excessively-drained sands may be less responsive to atmospheric N deposition due to the combination of low base cation availability and drought stress.
In this study, I used a factorial fertilization experiment to assess the degree to which young jack pine plantations growing on excessively drained outwash sands are limited by N, P or base cations. I expected jack pine would respond with increased growth to N fertilization, but that growth response to N would be modest in this drought stressed ecosystem, compared to responses documented for jack pine growing in less drought stressed conditions in boreal Canada. Furthermore, I expected that growth response to N would be constrained by the availability of P and base cations on these extremely coarse textured soils.
2. Materials and Methods
2.1. Study Sites and Experimental Design
I assessed nutrient limitations to growth in two young jack pine plantations located in the Highplains District of northern Lower Michigan [27]. One plantation was located in Presque Isle County (PI; 45.219°, −84.166°) and the other was located in Ogemaw County (OG; 44.473°, −84.283°). Both plantations were established by the Michigan Department of Natural Resources (MDNR) to provide breeding habitat for the endangered Kirtland’s warbler (KW; Setophaga kirtlandii) following whole-tree harvesting of a preceding stand of mature jack pine. The PI plantation was established in 2008, whereas the OG plantation was established in 2007. Soil at the PI site is classified as a sandy, isotic, frigid Typic Udipsamment (Grayling Sand), whereas soil at the OG site is classified as a sandy, mixed, frigid, Alfic Haplorthod (Mancelona Sand). Both plantations were planted at relatively high densities (ca. 1.3 × 2.0 m spacing) in undulating rows characteristic of KW plantations [28].
On 7 May 2015, I established 24 plots at each site in a randomized complete block design with three replications. Blocks were located on level ground, in relatively homogeneous areas of the plantation determined a priori from satellite imagery. Each plot contained 25 trees (5 rows of 5 trees each), with at least a 4-tree buffer between plots. Within each block, I randomly assigned plots to one of 8 factorial fertilization treatments. Treatments were N (applied as urea), P (applied as triple superphosphate), and base cations (abbreviated B; applied as a combination of K-Mag fertilizer and pelletized gypsum (20% Ca, 16% S). Application rates were 100 kg ha−1 for N, 100 kg ha−1 for P and 100 kg K ha−1, 100 kg Ca ha−1, and 51 kg Mg ha−1 in the B treatment. In addition to the base cations, the B treatment also delivered 170 kg ha−1 of sulfur (S). I applied fertilizer treatments in a complete factorial combination including all interactions for a total of 8 treatments (control, N, P, B, N + P, N + B, P + B and N + P + B). Fertilizer was spread evenly by hand throughout each entire 25-tree plot; however, measurements were only conducted on the interior 9 (3 × 3) trees.
2.2. Field Measurements and Data Analysis
I measured initial tree heights of the interior 9 trees in every plot on 19–20 May 2015, prior to bud break. Heights were measured with a height pole to the nearest cm. Plots were visited again on 26 October 2015, 23 October 2016 and 19 October 2017, and trees were recorded as alive or dead and heights measured for all living trees. For simplicities sake, herein I only report cumulative height growth and cumulative mortality for the entire period May 2015 through October 2017. In addition to absolute height growth (cm), for each tree I calculated relative growth rate (RGR) using the formula:
where H2 and H1 are heights at t2 (October 2017) and t1 (May 2015).
RGR = (ln H2 − ln H1)/(t2 − t1)
On 1 November 2017, I collected foliage from three interior trees per plot that were either dominant or co-dominant in height. From each tree I collected a single shoot of new (2017) growth from the upper 1/4 of the crown, on the north side of the tree, making sure that that shoot was completely unshaded by any other branches. Shoots from the three trees were composited by plot, returned to the laboratory and dried at 65 °C. Needles were plucked from each shoot, mixed well and then pulverized to a fine powder in a ball mill. Needles were sent to a commercial lab (A & L Great Lakes Laboratories, Fort Wayne, IN, USA) for analysis of N by dry-combustion gas chromatography and of P, K, Ca and Mg by microwave-assisted nitric acid digestion and inductively-coupled plasma atomic emission spectrometry (ICP-AES).
Growth, RGR, mortality and foliar nutrient concentration data were analyzed using a Linear Mixed Model for a randomized complete block design with fixed effects of Site, N, P and B, random effects of blocks within each site, and experimental plots for factorial fertilizer assignment. We used the normal residuals as the error term. I accounted for heterogeneous variances in blocks/sites and fertilizer treatments by fitting an unequal-variance model. Mortality data were arcsine transformed prior to analysis. Dunnett-Hsu multiple comparison procedure was used to compare growth, RGR and mortality for each fertilizer treatment against the unfertilized control. As an exploratory tool to understand foliar nutrient factors that might underlie variability in tree growth among treatments, I conducted simple linear correlations of absolute growth and RGR against foliar concentrations of individual macronutrients, as well as foliar ratios of all macronutrients to N. Statistical significance for all analyses was accepted at the 0.05 level. Statistical analyses were performed using SAS version 9.3 software (©2010 SAS Institute Inc., Cary, NC, USA).
2.3. Nutrient Budgets
In order to put growth and mortality responses to fertilizer applications into a broader ecosystem and management context, I constructed basic, input-output nutrient budgets for current KW habitat management on glacial outwash landforms in northern Lower Michigan. This exercise was based on publically available environmental monitoring data (e.g., atmospheric deposition rates, soil survey data) and publications in the peer-reviewed literature. Jack pine plantations managed for Kirtland’s warbler are established after whole-tree harvesting on a planned rotation length of 50 years. Therefore, I estimated the amount of N, P, K, Ca and Mg removed in whole-tree harvesting as the average of total above ground nutrient stocks for jack pine plantations on similar soils in northern Lower Michigan quantified by Alban [29]. I also estimated harvest nutrient removals from a hypothetical stem-only harvest scenario using just bolewood and bark nutrient stocks from the same source. I estimated nutrient inputs via atmospheric deposition over a 50-year rotation using total deposition data from the National Atmospheric Deposition Program [30]. These deposition estimates account for both wet and dry deposition using a combination of empirical and modeled data as described by Schwede and Lear [31]. I calculated the annual average total deposition for the study area across all 16 years of data available (2000–2015) from the National Atmospheric Deposition Program (NADP). I estimated base cation weathering rates using the “clay fraction method” [32], texture data available from the soil survey [33], and proportions of exchangeable cations in comparable soils from Rothstein and Spaulding [34]. I estimated inputs of P from weathering as 0.3 kg ha−1 y−1 based on data reported in Newman et al. [35]. For nitrogen inputs, I made the highly conservative estimate that rates of biological fixation averaged 1 kg N ha−1 y−1. Non-symbiotic fixation alone has been estimated to average 2–3 kg N ha−1 y−1 in forest ecosystems worldwide [36], and these jack pine forests have abundant symbiotic N fixers including Comptonia perigrina (L.) J.M. Coult. (Myricaceae) and lichens. Because I had no data available on leaching losses of N, P, K, Ca or Mg from these ecosystems, I constructed nutrient budgets under three scenarios of assumed leaching rates: (1) 100% of annual inputs are retained (i.e., a completely closed system); (2) 2/3 of annual inputs are retained and 1/3 leached (i.e., a moderately leaky system); and (3) 1/3 of annual inputs are retained and 2/3 are leached (i.e., a highly leaky system). Under each of these scenarios, I estimated the number of years of nutrient inputs that would be required for the system to recover the nutrients removed in WTH or SOH.
3. Results
3.1. Tree Growth and Mortality
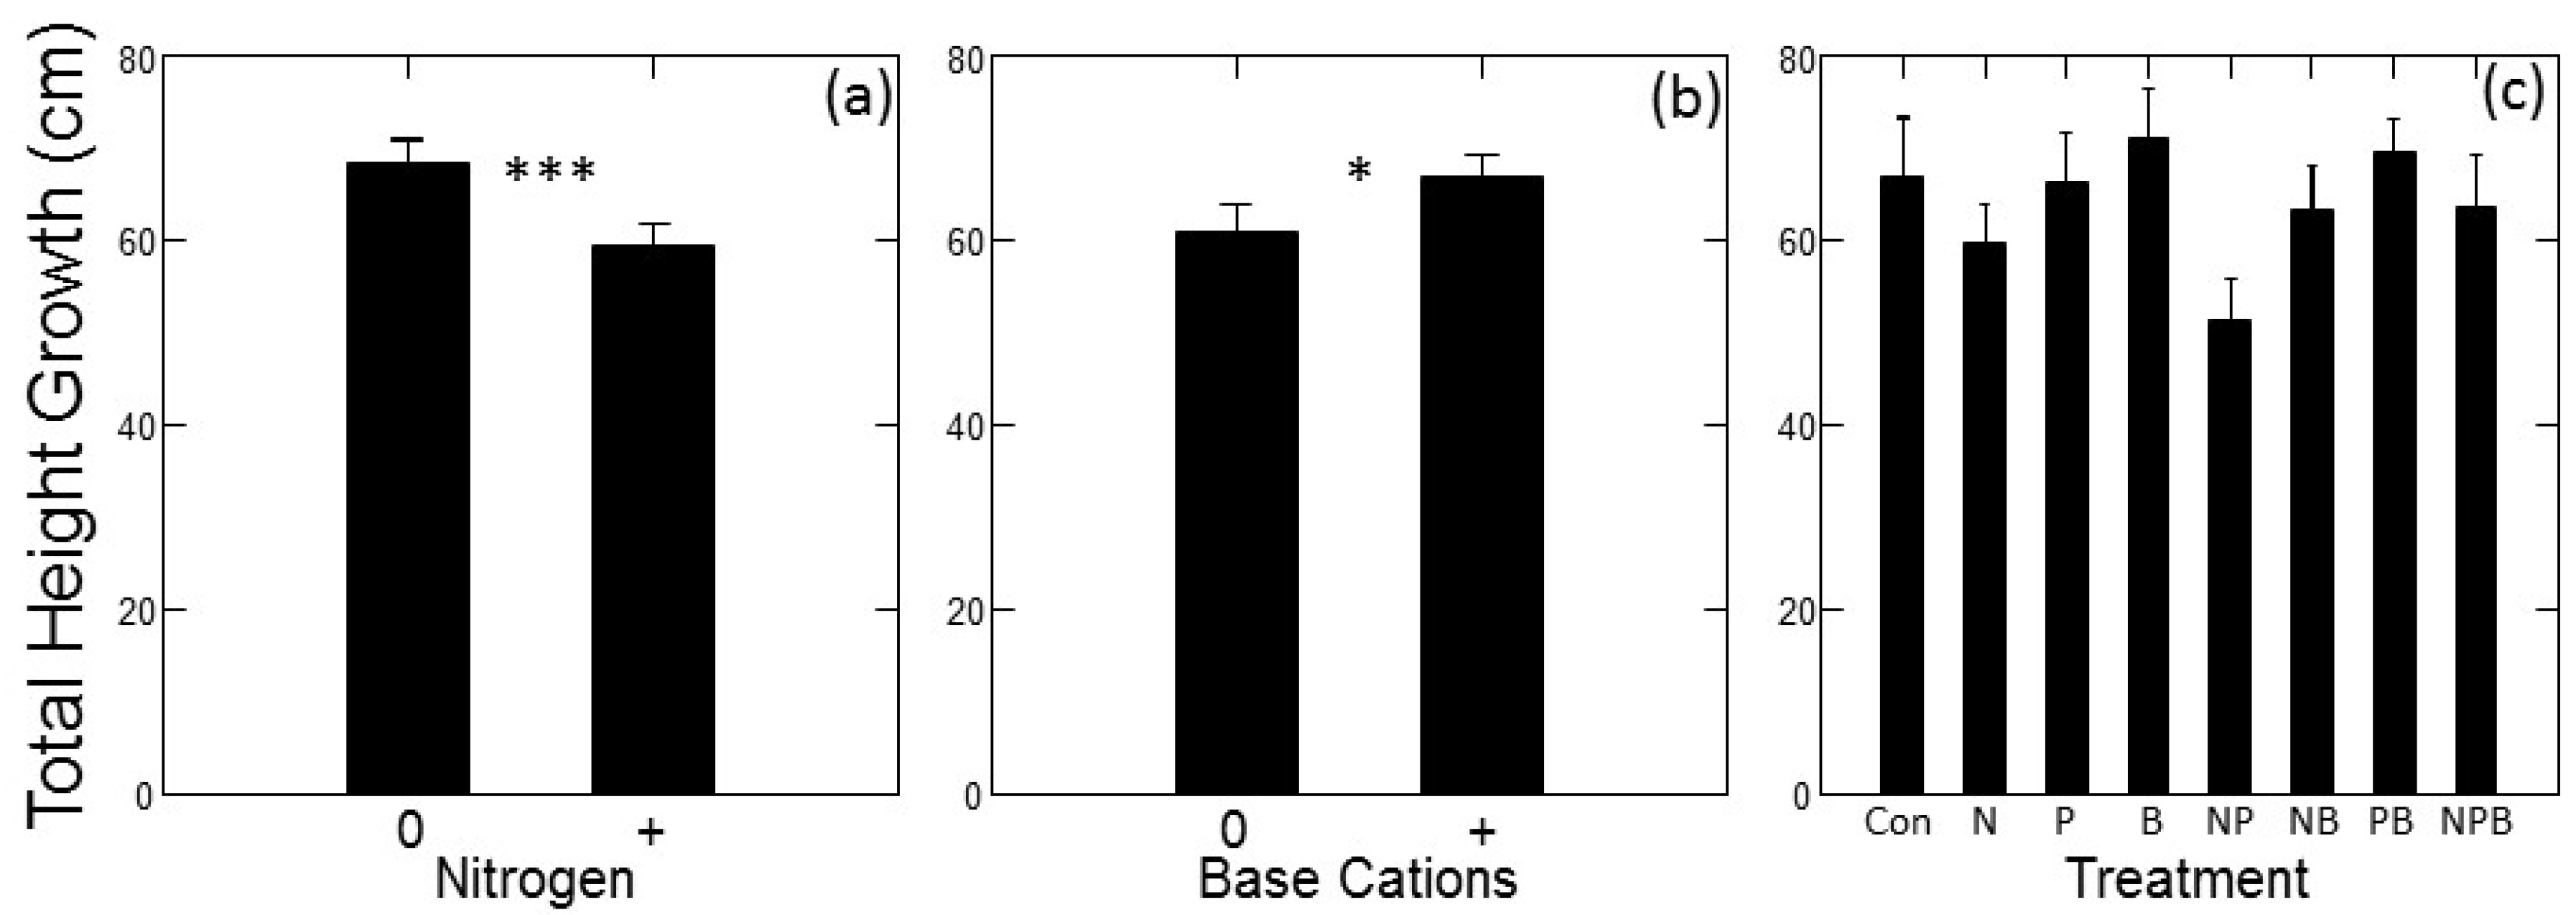
There were significant main effects of N addition (p < 0.001) and base cation addition (p = 0.010) on absolute tree growth rates over the course of the experiment. Tree growth was lower overall in plots with added N compared to plots without added N (Figure 1a), whereas tree growth was greater overall in plots with added base cations compared to plots without (Figure 1b). No other main effects or interactions had a significant effect on absolute growth rates. Dunnett’s multiple comparison tests indicated that the N + P treatment had significantly lower growth than the control treatment (p = 0.001), but none of the other individual fertilizer treatments had growth rates significantly different from the control (Figure 1c).
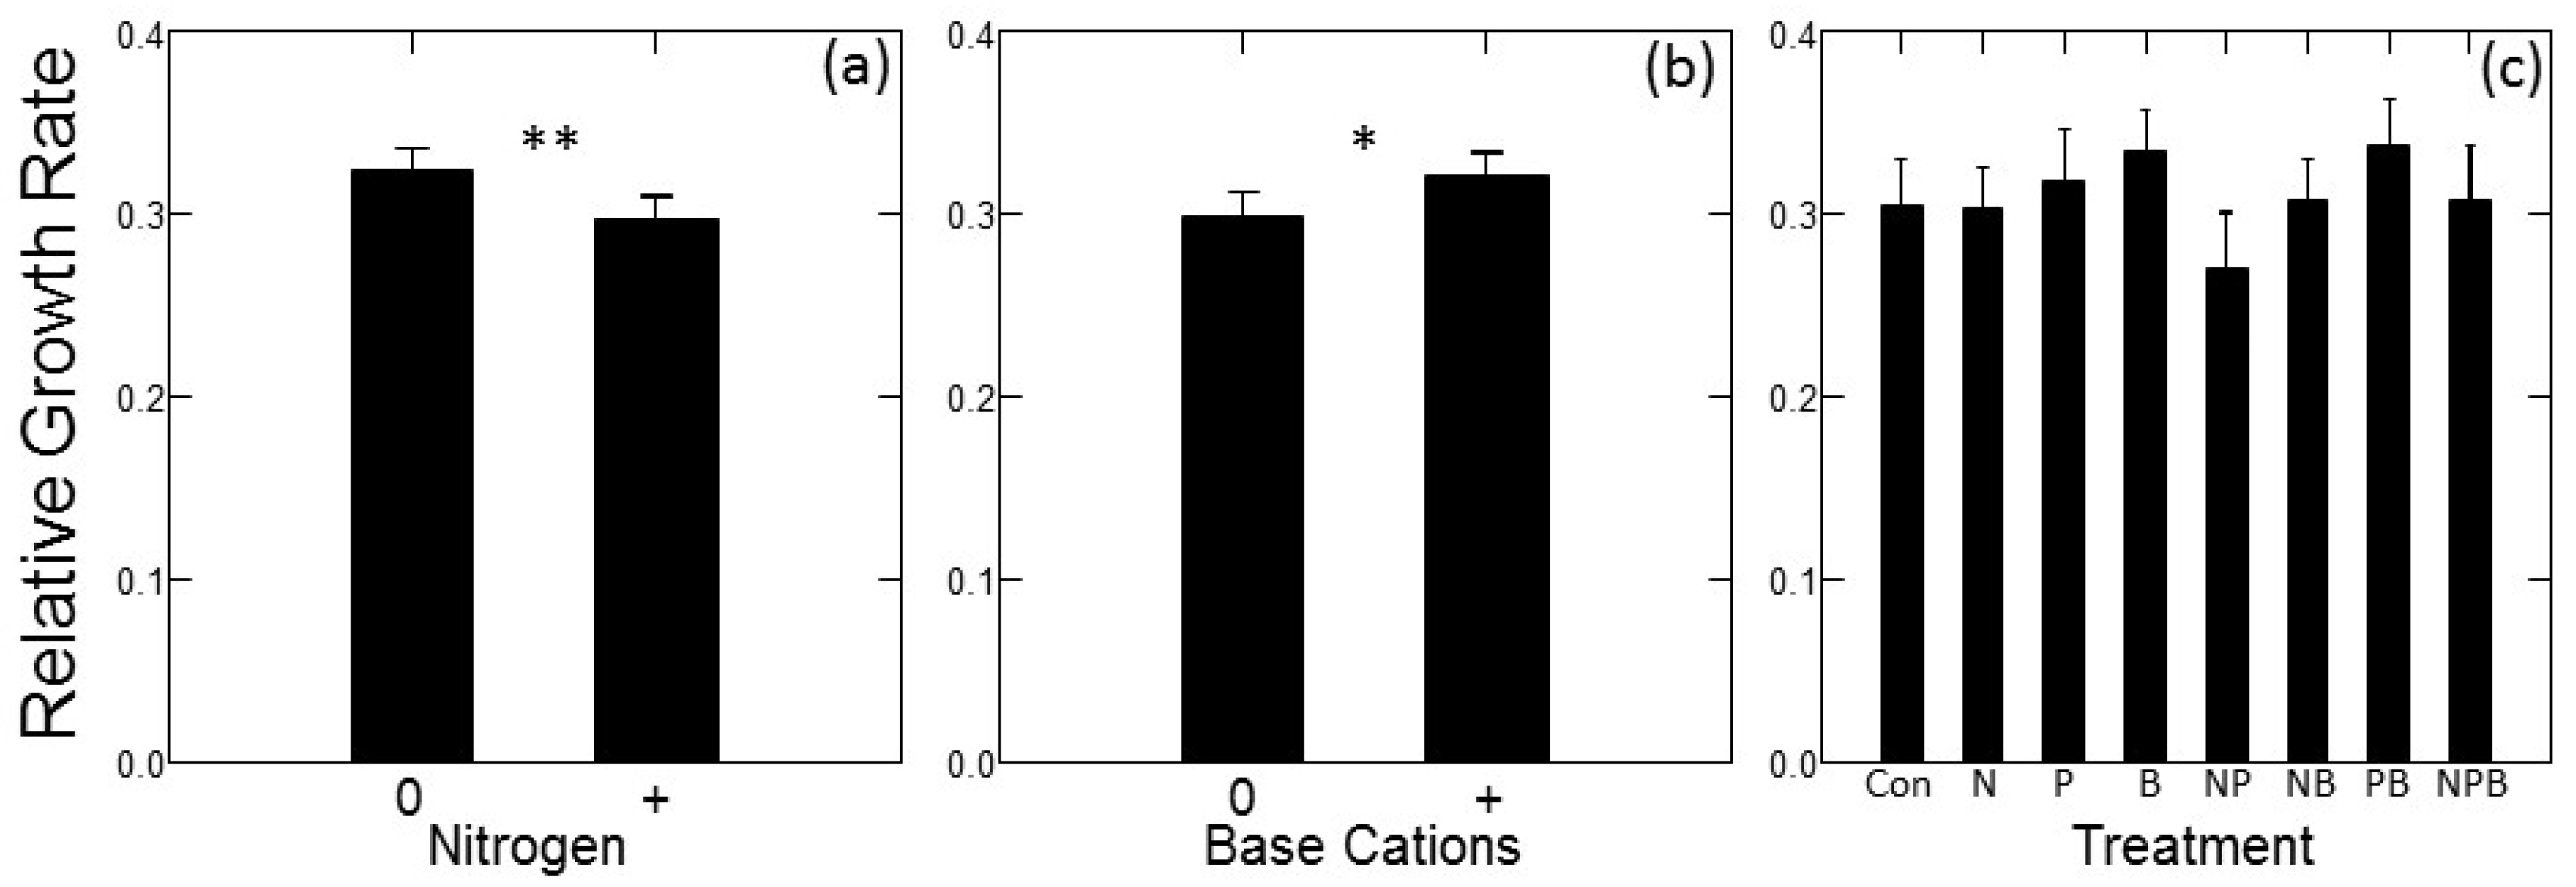
There were significant main effects of site (p = 0.031), N addition (p = 0.005) and base cation addition (p = 0.011) on relative growth rates over the course of the experiment. No other main effects or interactions had a significant effect on relative growth rates. Relative growth rates were higher in the OG site, solely because trees at this site were shorter at the start of the experiment: initial heights at OG averaged 160 cm (s.d. = 24.5) compared to 193 cm (s.d. = 30.1) at PI. Responses of RGR to added nutrients were essentially identical to those of absolute growth. N-amended plots had lower RGR (Figure 2a) and base cation amended plots had higher RGR (Figure 2b). Dunnett’s multiple comparison tests indicated that the N + P treatment had significantly lower RGR than the control treatment (p = 0.034), but none of the other individual fertilizer treatments had RGR significantly different from the control.
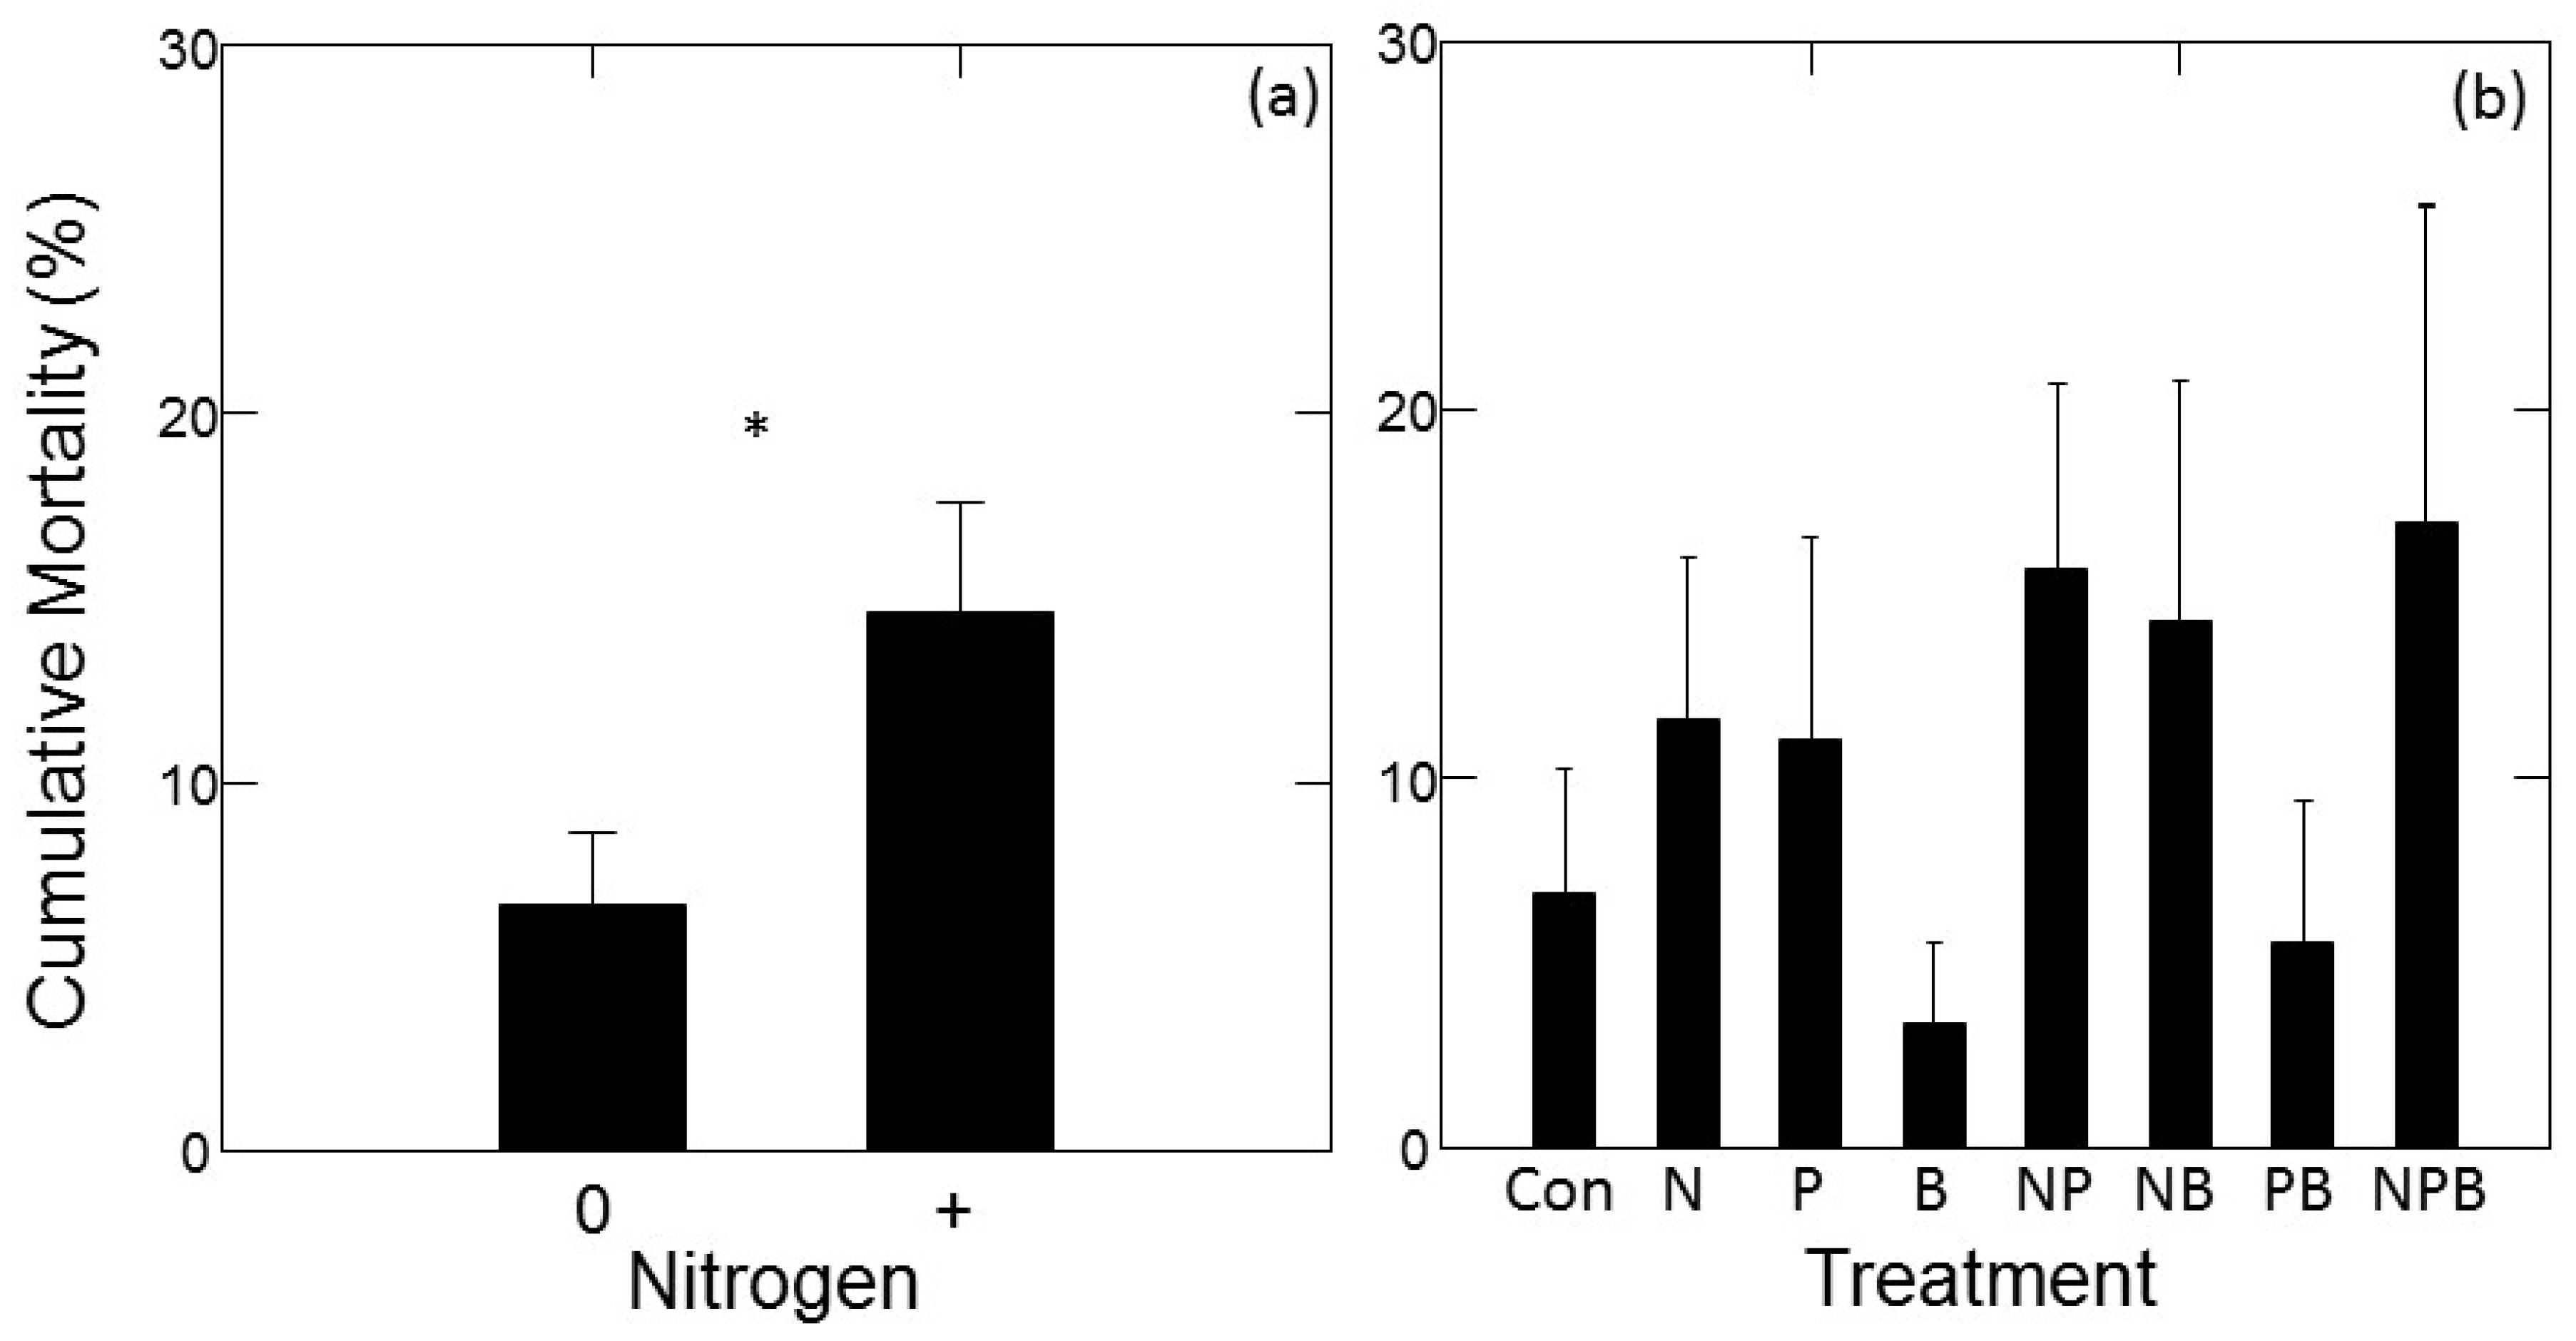
There was a significant main effect of N addition on mortality rate (F1,14.1 = 6.92; p = 0.020), with higher mortality in treatments with added N compared to treatments without added N (Figure 3a). No other main effects or interactions had a significant effect on tree mortality. Dunnett’s multiple comparison tests also indicated that none of the individual fertilizer treatments had mortality rates significantly different from the control.
3.2. Foliar Nutrition
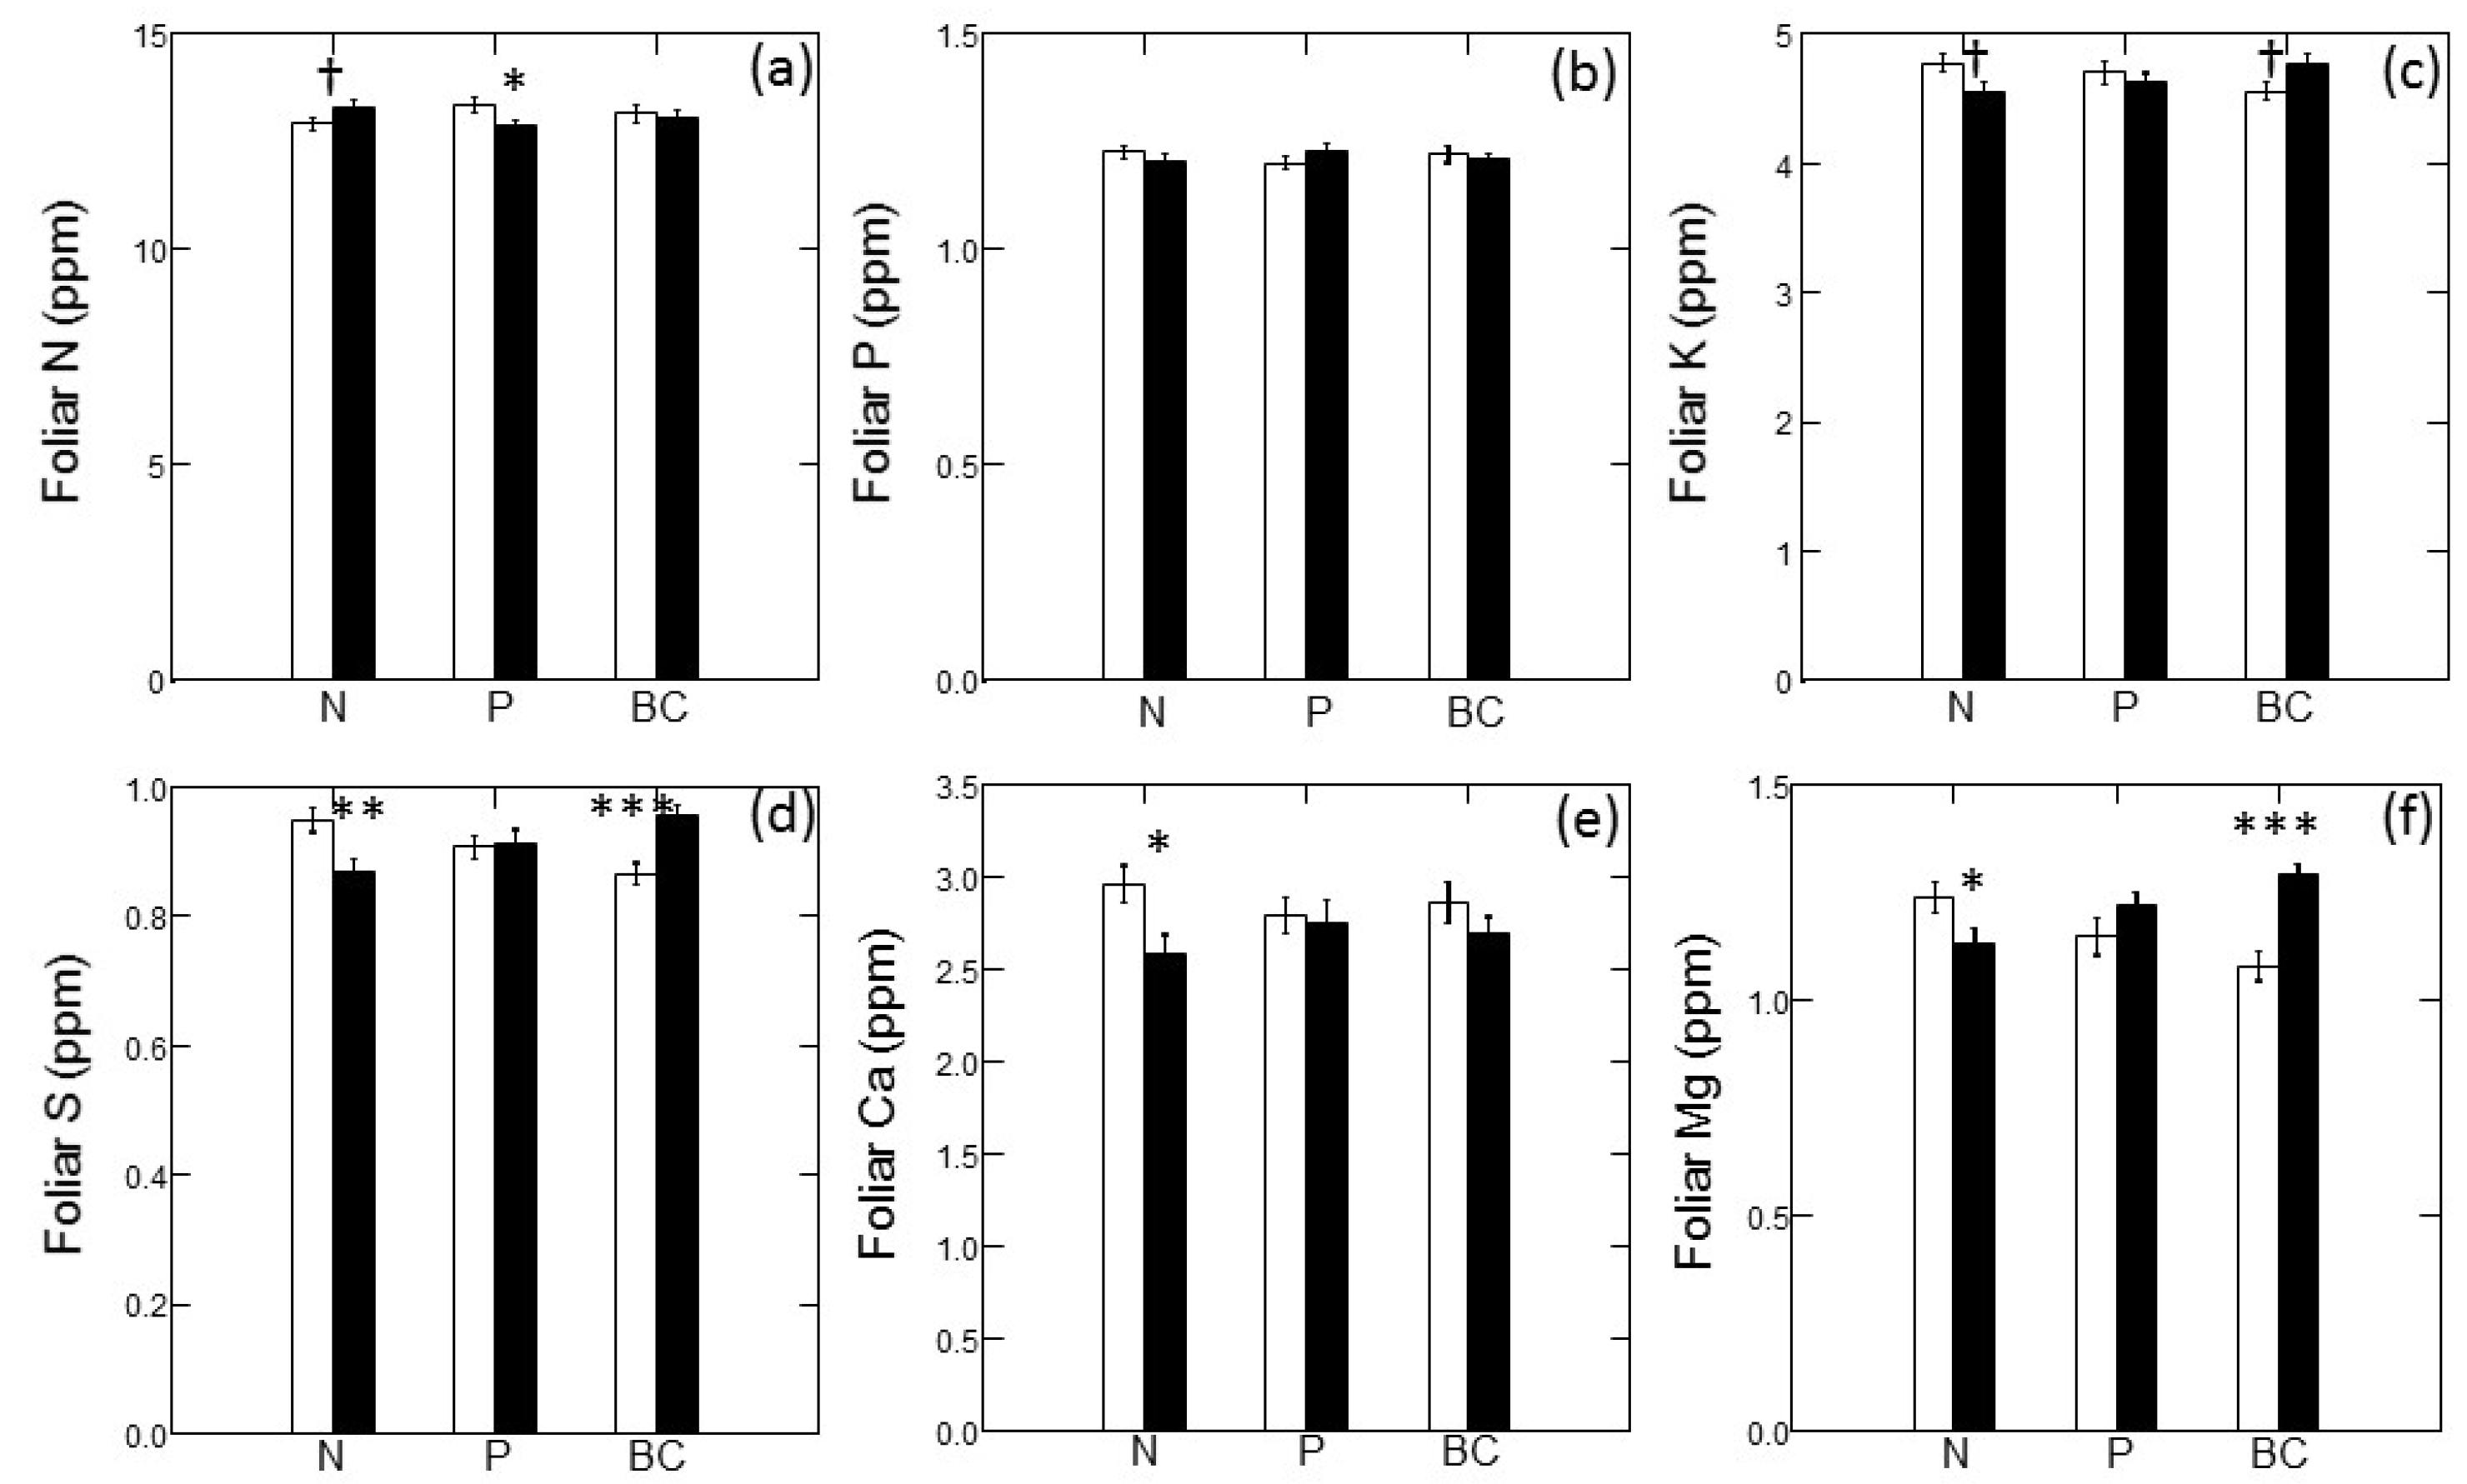
Figure 4 illustrates the main effects of fertilizer treatments on foliar macronutrient concentrations; there were no significant interactive effects on any foliar nutrition parameters. Foliar N concentrations trended higher in N-amended plots; however, the main effect of N addition was not statistically significant (Figure 4a; p = 0.086). In contrast, addition of N tended to decrease concentrations of other macronutrients. Foliar S (Figure 4d; p = 0.001), foliar Ca (Figure 4e; p = 0.011) and foliar Mg (Figure 4f; p = 0.004) all declined significantly with N addition; however, the decline in foliar K with N addition was not quite statistically significant (Figure 4c; p = 0.065). Addition of P led to a significant decrease in foliar N (Figure 4a; p = 0.024) but did not significantly affect any other foliar macronutrient. Addition of base cations (and S) led to a marginally-significant increase in foliar K (Figure 4c; p = 0.086) and significant increases in foliar S (Figure 4d; p < 0.001) and foliar Mg (Figure 4f; p < 0.001).
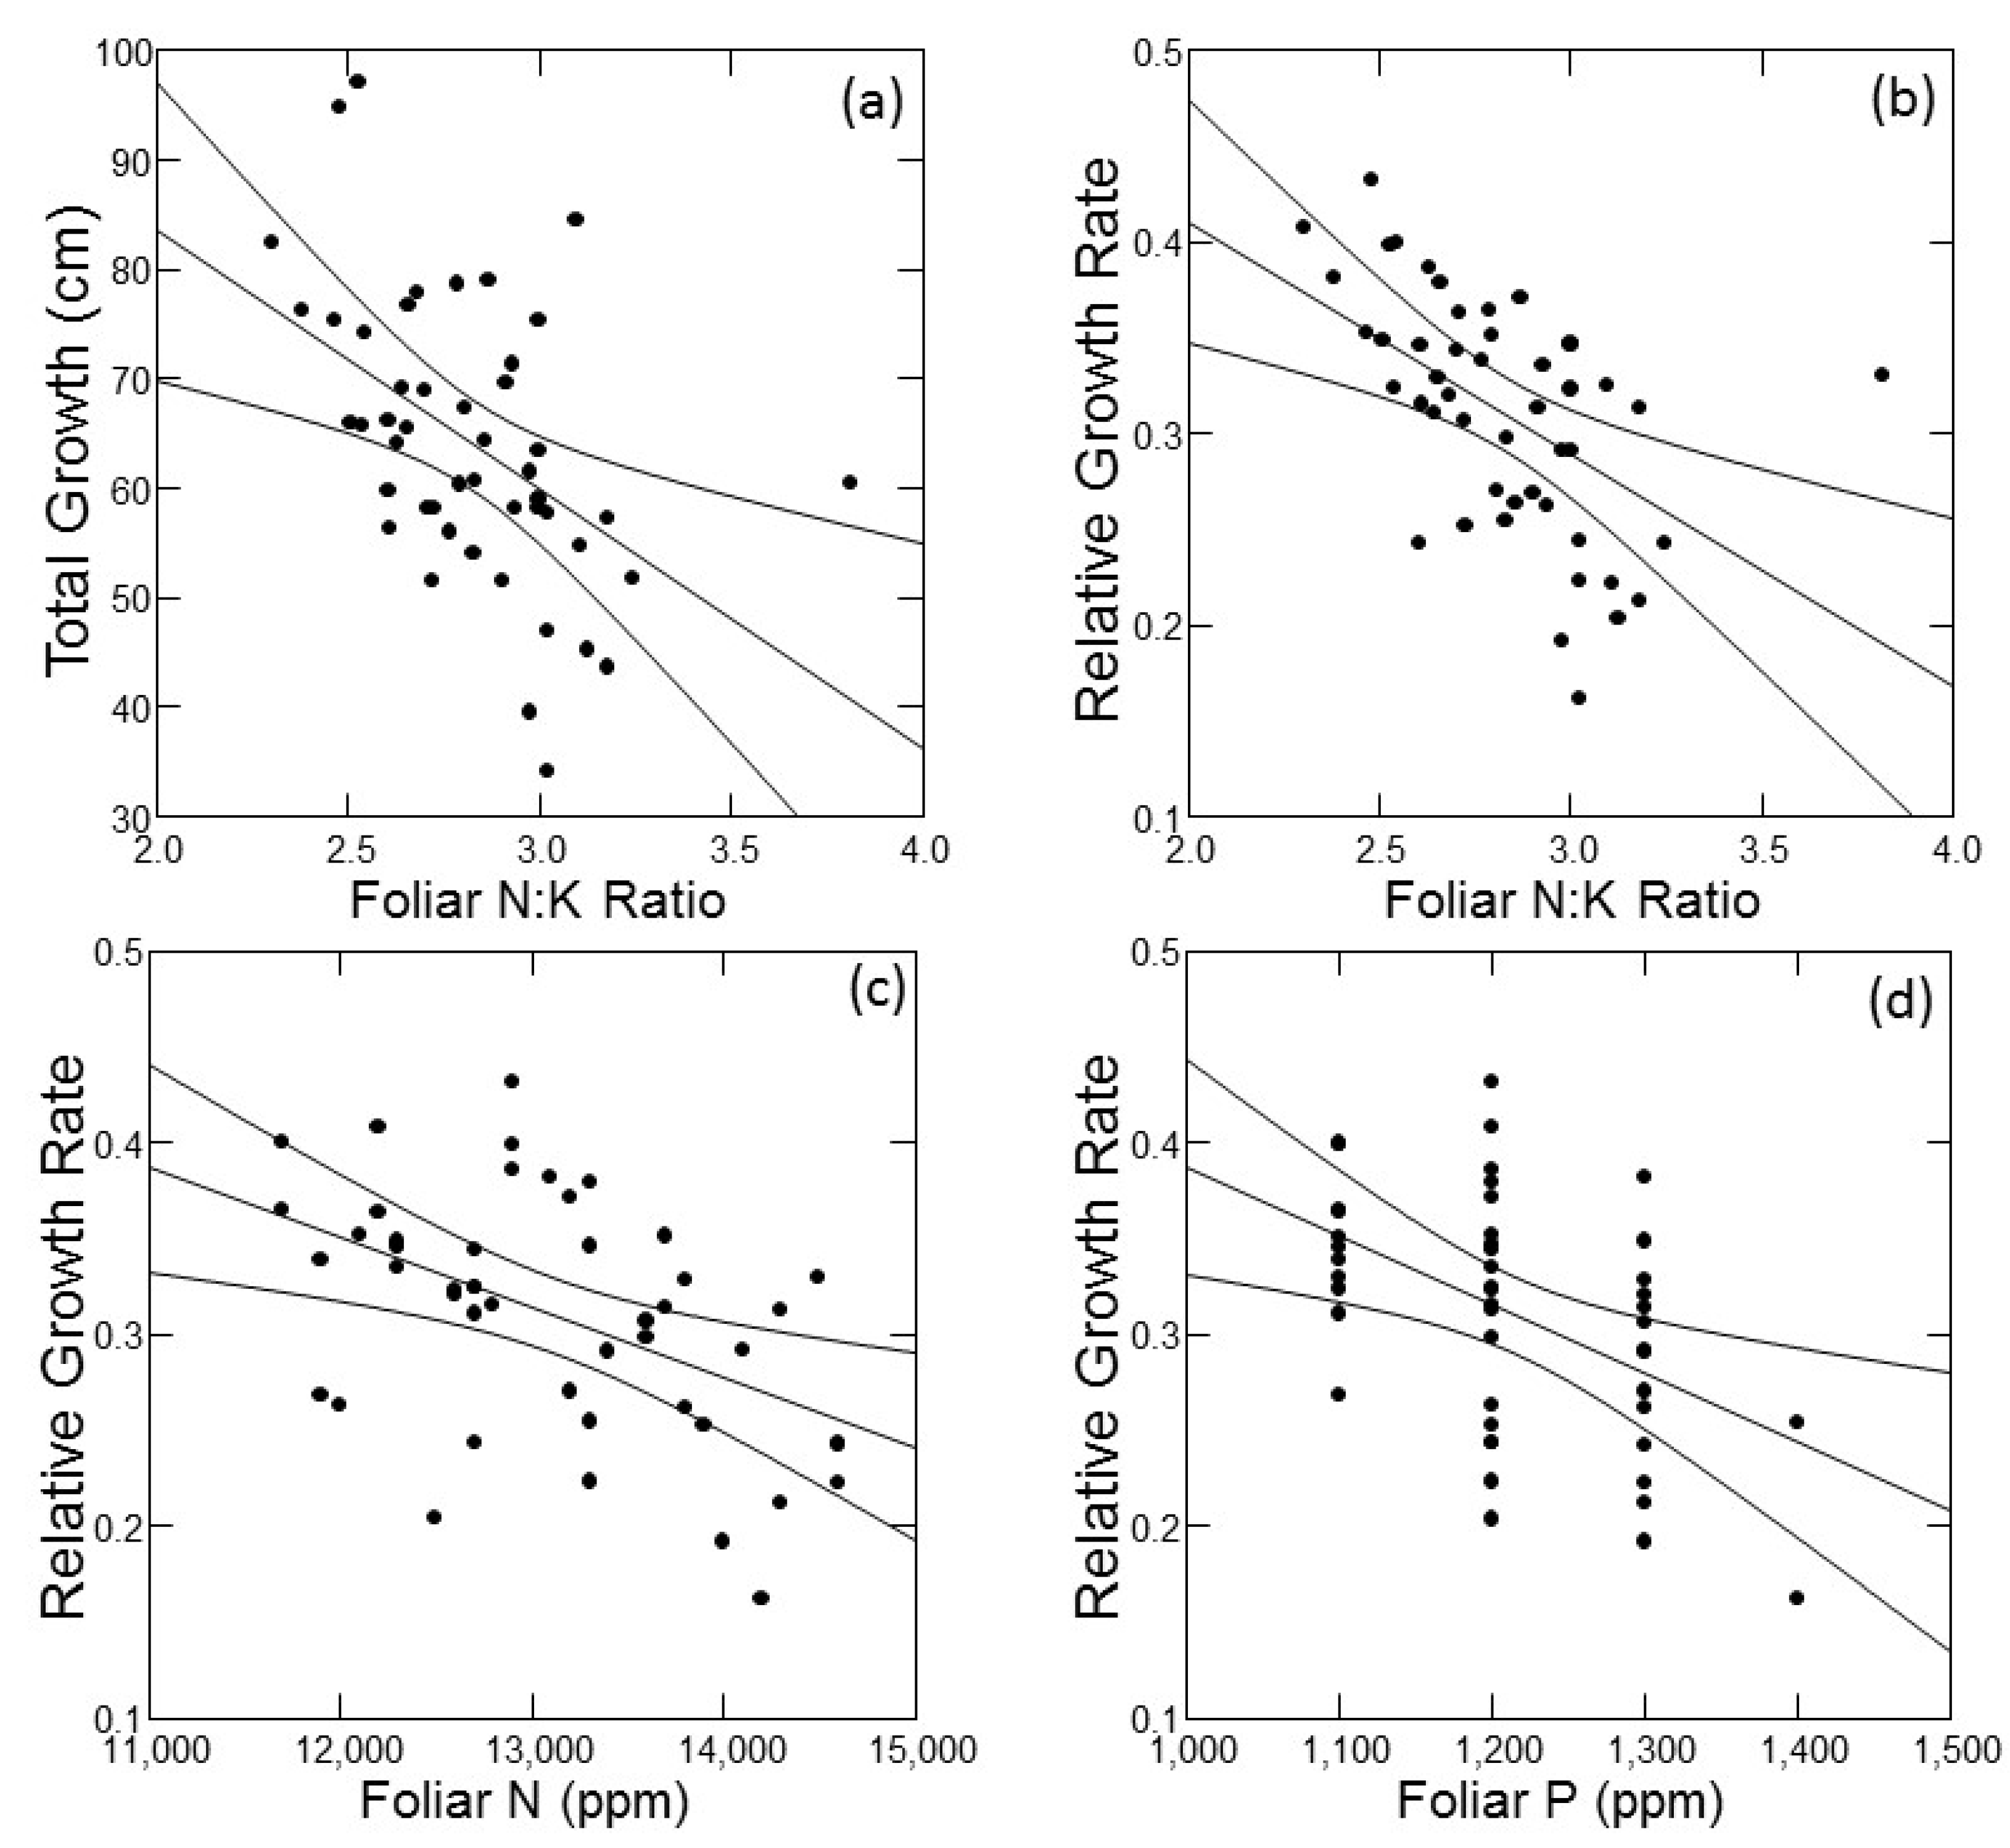
As an exploratory tool to understand factors that may underlie variability in tree growth, I conducted simple linear correlations of absolute growth and RGR against foliar macronutrient concentrations and ratios of foliar N to all other macronutrients (Table 1). The ratio of N:K was the only foliar nutrition parameter that was significantly correlated with absolute growth, and it exhibited the strongest correlation with RGR. Both absolute growth and RGR declined with increasing foliar N:K ratio (Figure 4a,b). Foliar N and foliar P concentrations were significantly correlated with RGR only (Table 1); for both, RGR declined with increasing foliar nutrient concentration (Figure 4c,d). All statistically significant correlations between foliar nutrition parameters and growth are plotted in Figure 5.
3.3. Nutrient Budgets
Results from simple, input-output nutrient budgeting are presented in Table 2. Of the five macronutrients investigated, K stood out as having the greatest imbalance between outputs and inputs. Even under the impossibly optimistic scenario of 100% retention of inputs (zero leaching losses), I estimate that it would take 73 years for weathering and deposition to replace the K removed via WTH. This exceeds the planned harvest rotation for these plantations by 23 years. Under the most “leaky” scenario (only 1/3 of annual inputs retained in the system), this estimate increased to 117 years. Under SOH, replacement times for K ranged from 35 years under the 100% retention scenario to 55 years under the 1/3 retention scenario. In contrast, even under the most pessimistic scenario (WTH, 1/3 retention), N, P and Ca removals were all replaced within the planned 50-year rotation for these plantations. Under SOH, N, P, and Ca, replacement times ranged from 8–12 years under the 100% retention scenario to 15–20 years for the 1/3 retention scenario. Replacement times for Mg were generally longer than for N, P and Ca, but only exceeded the planned harvest rotation by three years under the most pessimistic scenario of WTH with 1/3 retention.
4. Discussion
Contrary to my original expectation, I found no evidence that the availability of macro-nutrients limits the growth of young jack pine plantations on glacial outwash sands in northern Lower Michigan. None of the macronutrients, added singly or in combination, increased growth of jack pine relative to unfertilized controls (Figure 1c). These results are in sharp contrast with results from numerous jack pine fertilization studies in boreal Canada, which consistently demonstrate a strong growth response to added nitrogen, either alone or in combination with P and K (65 fertilization studies of jack pine reviewed by [14]). In contrast, I could only find a single fertilization study on jack pine in the Lake States, in which two young (7 and 11 year old) jack pine stands growing on outwash sands in northwestern Wisconsin showed no growth response to N fertilization [37]. Although data on fertilization response of jack pine in the Lake States are extremely limited, the lack of response in our study and that of McCullough and Kulman [37] is intriguing and consistent with the anecdotal reasoning of regional foresters that extreme drought stress is the overwhelming limiting factor on outwash sands of this region. It may be that the higher growing season temperatures and greater evaporative demand [38] here at the southern limit of jack pine’s range constrain its responsiveness to added nutrients. Lim et al. [26] recently demonstrated that drought stress constrained the responsiveness of Scots pine (Pinus sylvestris L.) to nitrogen fertilization. More experimental data on the responsiveness of jack pine to fertilization across the Lake States, especially across a range of stand ages and site conditions, is needed to better understand constraints to productivity in this region.
Biomass harvesting guidelines developed by state agencies in Wisconsin and Minnesota provide special exemptions allowing for WTH of jack pine on outwash sands [12,13]. The rationale for this exception in both states’ guidelines is that jack pine has a lower demand for nutrients compared to other species; therefore, greater nutrient removals are unlikely to impact future forest productivity. My finding that growth rates of young jack pine plantations do not respond to added macro nutrients is consistent with this reasoning and would seem to support the assertion that greater nutrient removals due to WTH will not result in productivity declines through future rotations. However, my analysis of nutrient input-output budgets, together with data from the fertilization study suggest that this approach may not be sustainable over the long term. Most notably, my estimates of K removals in WTH greatly exceed estimated inputs from atmospheric deposition and weathering; even assuming a perfectly closed system (no K leaching) it would take more than 70 years for deposition and weathering to replace the K removed by WTH (Table 2). Thus, it seems clear that repeated WTH of jack pine on a 50-year rotation will lead to long-term depletion of K in these coarse, sandy soils. This finding is consistent with a recent study of Corsican pine (Pinus nigra Arnold) on sandy soils in Belgium, where weathering and deposition of Ca, K and P were insufficient to replace removals by WTH [39]. This finding is also consistent with increasing recognition of the global significance of K as a limiting nutrient for forest productivity and its potential sensitivity to harvest removals [5,40].
The response of tree growth, mortality and foliar nutrition to factorial fertilization treatments further supports the significance of K removals from these systems, and suggests the potential for limitation by K and other base cations to be exacerbated by N deposition. In this study, I observed a strong negative response to N fertilization, whereby plots with added N had lower rates of tree growth and higher rates of mortality compared to plots without added N (Figure 1a, Figure 2a and Figure 3a). In contrast, plots with added base cations had higher rates of tree growth (Figure 1b and Figure 2b), with no significant effect on mortality. Data on foliar nutrition clearly demonstrate that N additions led to strong reductions in foliar base cation concentrations. This is consistent with a large body of literature on N saturation, which indicates that N additions to forest ecosystems can lead to deficiencies and imbalances of other nutrients, particularly base cations [23,41,42]. For K, Sardans and Peñuelas [5] reviewed 27 studies that documented impacts of N additions on K supply to plants, and consistently found enhanced K leaching, reduced foliar K concentrations and increased foliar N:K ratios. In this study, I found that foliar N:K ratio was the foliar nutrition parameter most strongly correlated with tree growth rates; suggesting that N:K imbalances may explain the reduction in tree growth induced by N fertilization.
Nutrient budget estimates (Table 2), together with N fertilization impacts on tree growth mortality and foliar nutrition (Figure 1, Figure 2, Figure 3 and Figure 4), indicate the potential for long-term declines in soil fertility and forest productivity under the combined effects of WTH and atmospheric N deposition. Potassium depletion appears to be the most likely mechanism by which such a decline could occur; K removals in WTH far exceed inputs and foliar N:K imbalances appear to be an important driver of negative growth response to N additions. Potassium deficiencies and imbalances may be particularly important for jack pine in the Lake States, given the critical role of K in drought tolerance [5]. Because jack pine in the Lake States occurs at the southern limit of the species’ range on excessively drained soils, drought-induced stresses will likely grow in importance as the climate warms [43]. Thus, the combination of WTH removals of K and continued atmospheric deposition of N are likely to decrease the resilience of these ecosystems to a warming climate. Whole-tree harvesting of jack pine became common in this region in the early 1980s when intensive management efforts to create young jack pine stands for the KW began [28]. Therefore, the earliest plantations established for KW will be reaching rotation age in the next 10 years. Because of the high concentrations of K in foliage relative to bolewood [29], transitioning to SOH for the next generation of KW habitat would greatly reduce the amount of K removals associated with harvesting (Table 2).
5. Conclusions
I could find no evidence that growth rates of young jack pine plantations on xeric sands are limited by availability of macronutrients. Instead, I observed a decline in growth rates, and an increase in mortality rates, in trees fertilized with N. Nitrogen-induced deficiencies of K and/or N:K imbalances appear to be the cause of the negative growth response to added N. Together with nutrient budget analysis, which indicates that harvest removals of K greatly exceed inputs over the planned rotation, this suggests that WTH may not be sustainable over multiple rotations. Impacts of WTH on ecosystem K status are likely to be exacerbated over time by anthropogenic N deposition.
Funding
This work was supported by the USDA National Institute of Food and Agriculture (Project MICL08505 and McIntire Stennis Project MICL06006).
Acknowledgments
I thank Michael Cook, Trevor Kubiske and Matthew Gedritis for their assistance with field sample collection, laboratory analysis and data analysis. I thank Kyle MacLean for assistance assembling data for nutrient budgets. I thank Chun-Lung Lee and Daphna Gadoth for assistance with SAS code. Finally, I thank Jason Hartman and Tim Greco from the Michigan Department of Natural Resources for their assistance and support throughout this project.
Conflicts of Interest
The author declares no conflicts of interest.
References
- LeBauer, D.S.; Treseder, K.K. Nitrogen limitation of net primary productivity in terrestrial ecosystems is globally distributed. Ecology 2008, 89, 371–379. [Google Scholar] [CrossRef] [PubMed]
- Schulte-Uebbing, L.; de Vries, W. Global-scale impacts of nitrogen deposition on tree carbon sequestration in tropical, temperate, and boreal forests: A meta-analysis. Glob. Chang. Biol. 2018, 24, e416–e431. [Google Scholar] [CrossRef] [PubMed]
- Elser, J.J.; Bracken, M.E.S.; Cleland, E.E.; Gruner, D.S.; Harpole, W.S.; Hillebrand, H.; Ngai, J.T.; Seabloom, E.W.; Shurin, J.B.; Smith, J.E. Global analysis of nitrogen and phosphorus limitation of primary producers in freshwater, marine and terrestrial ecosystems. Ecol. Lett. 2007, 10, 1135–1142. [Google Scholar] [CrossRef] [PubMed] [Green Version]
- Vitousek, P.M.; Porder, S.; Houlton, B.Z.; Chadwick, O.A. Terrestrial phosphorus limitation: Mechanisms, implications, and nitrogen-phosphorus interactions. Ecol. Appl. 2010, 20, 5–15. [Google Scholar] [CrossRef] [PubMed]
- Sardans, J.; Peñuelas, J. Potassium: A neglected nutrient in global change. Glob. Ecol. Biogeogr. 2015, 24, 261–275. [Google Scholar] [CrossRef]
- Mann, L.K.; Johnson, D.W.; West, D.C.; Cole, D.W.; Hornbeck, J.W.; Martin, C.W.; Riekerk, H.; Smith, C.T.; Swank, W.T.; Tritton, L.M.; et al. Effects of whole-tree and stem-only clearcutting on postharvest hydrologic losses, nutrient capital, and regrowth. For. Sci. 1988, 34, 412–428. [Google Scholar]
- Hendrickson, O.Q.; Chatarpaul, L.; Burgess, D. Nutrient cycling following whole-tree and conventional harvest in northern mixed forest. Can. J. For. Res. 1989, 19, 725–735. [Google Scholar] [CrossRef]
- Thiffault, E.; Hannam, K.D.; Paré, D.; Titus, B.D.; Hazlett, P.W.; Maynard, D.G.; Brais, S. Effects of forest biomass harvesting on soil productivity in boreal and temperate forests—A review. Environ. Rev. 2011, 19, 278–309. [Google Scholar] [CrossRef]
- Achat, D.L.; Deleuze, C.; Landmann, G.; Pousse, N.; Ranger, J.; Augusto, L. Quantifying consequences of removing harvesting residues on forest soils and tree growth—A meta-analysis. For. Ecol. Manag. 2015, 348, 124–141. [Google Scholar] [CrossRef]
- Adams, P.W.; Boyle, J.R. Soil fertility changes following clearcut and whole-tree harvesting and burning in central michigan 1. Soil Sci. Soc. Am. J. 1982, 46, 638–640. [Google Scholar] [CrossRef]
- Silkworth, D.R.; Grigal, D.F. Determining and evaluating nutrient losses following whole-tree harvesting of aspen 1. Soil Sci. Soc. Am. J. 1982, 46, 626–631. [Google Scholar] [CrossRef]
- Herrick, S.; Kovach, J.; Padley, E.; Wagner, C.; Zastrow, D. Wisconsin’s Forestland Woody Biomass Harvesting Guidelines; WI DNR Division of Forestry and Wisconsin Council on Forestry: Madison, WI, USA, 2009.
- Michigan Department of Natural Resources and Environment Forest Management Division. Michigan Woody Biomass Harvesting Guidance. 2010. Available online: https://www.michigan.gov/documents/dnr/WGBH_321271_7.pdf (accessed on 9 July 2018).
- Newton, P.F.; Amponsah, I.G. Systematic review of short-term growth responses of semi-mature black spruce and jack pine stands to nitrogen-based fertilization treatments. For. Ecol. Manag. 2006, 237, 1–14. [Google Scholar] [CrossRef]
- Vitousek, P.M. Beyond global warming: Ecology and global change. Ecology 1994, 75, 1861–1876. [Google Scholar] [CrossRef]
- Galloway, J.N.; Townsend, A.R.; Erisman, J.W.; Bekunda, M.; Cai, Z.; Freney, J.R.; Martinelli, L.A.; Seitzinger, S.P.; Sutton, M.A. Transformation of the nitrogen cycle: Recent trends, questions, and potential solutions. Science 2008, 320, 889–892. [Google Scholar] [CrossRef] [PubMed]
- Magnani, F.; Mencuccini, M.; Borghetti, M.; Berbigier, P.; Berninger, F.; Delzon, S.; Grelle, A.; Hari, P.; Jarvis, P.G.; Kolari, P.; et al. The human footprint in the carbon cycle of temperate and boreal forests. Nature 2007, 447, 849. [Google Scholar] [CrossRef] [PubMed]
- Solberg, S.; Dobbertin, M.; Reinds, G.J.; Lange, H.; Andreassen, K.; Fernandez, P.G.; Hildingsson, A.; de Vries, W. Analyses of the impact of changes in atmospheric deposition and climate on forest growth in European monitoring plots: A stand growth approach. For. Ecol. Manag. 2009, 258, 1735–1750. [Google Scholar] [CrossRef]
- Thomas, R.Q.; Canham, C.D.; Weathers, K.C.; Goodale, C.L. Increased tree carbon storage in response to nitrogen deposition in the US. Nat. Geosci. 2010, 3, 13. [Google Scholar] [CrossRef]
- Nilsen, P. Effect of nitrogen on drought strain and nutrient uptake in Norway spruce (Picea abies (L.) Karst.) trees. Plant Soil 1995, 172, 73–85. [Google Scholar] [CrossRef]
- Weetman, G.F. Canadian fertilization: Some history and basic understandings. In Enhanced Forest Management: Fertilization and Economics; Bamsey, C., Ed.; Clear Lake Ltd.: Edmonton, AB, Canada, 2001; pp. 4–10. [Google Scholar]
- Xia, J.; Wan, S. Global response patterns of terrestrial plant species to nitrogen addition. New Phytol. 2008, 179, 428–439. [Google Scholar] [CrossRef] [PubMed] [Green Version]
- Fenn, M.E.; Poth, M.A.; Aber, J.D.; Baron, J.S.; Bormann, B.T.; Johnson, D.W.; Lemly, A.D.; McNulty, S.G.; Ryan, D.F.; Stottlemyer, R. Nitrogen excess in North American ecosystems: Predisposing factors, ecosystem responses, and management strategies. Ecol. Appl. 1998, 8, 706–733. [Google Scholar] [CrossRef]
- Linder, S.; Benson, M.L.; Myers, B.J.; Raison, R.J. Canopy dynamics and growth of Pinus radiata.: I. Effects of irrigation and fertilization during a drought. Can. J. For. Res. 1987, 17, 1157–1165. [Google Scholar] [CrossRef]
- Tan, W.; Hogan, G.D. Physiological and morphological responses to nitrogen limitation in jack pine seedlings: potential implications for drought tolerance. New For. 1997, 14, 19–31. [Google Scholar] [CrossRef]
- Lim, H.; Oren, R.; Palmroth, S.; Torngern, P.; Mörling, T.; Näsholm, T.; Lundmark, T.; Leppälammi-Kujansuu, J.; Linder, S. Inter-annual variability of precipitation constrains the production response of boreal Pinus sylvestris to nitrogen fertilization. For. Ecol. Manag. 2015, 348, 31–45. [Google Scholar] [CrossRef] [Green Version]
- Albert, D.A. Regional Landscape Ecosystems of Michigan, Minnesota and Wisconsin: A Working Map and Classification; General Technical Report for North Central Forest Experiment Station: Saint Paul, MN, USA, 1995. [Google Scholar]
- Kepler, C.B.; Irvine, G.W.; DeCapita, M.E.; Weinrich, J. The conservation management of Kirtland’s Warbler Dendroica kirtlandii. Bird Conserv. Int. 1996, 6, 11–22. [Google Scholar] [CrossRef]
- Alban, D.H. Nutrient Accumulation in Planted Red and Jack Pine; North Central Forest Experiment Station: Saint Paul, MN, USA, 1988; p. 6. [Google Scholar]
- NADP 2018. Available online: http://nadp.slh.wisc.edu/committees/tdep/tdepmaps/ (accessed on 18 February 2018).
- Schwede, D.B.; Lear, G.G. A novel hybrid approach for estimating total deposition in the United States. Atmos. Environ. 2014, 92, 207–220. [Google Scholar] [CrossRef] [Green Version]
- Koseva, I.S.; Watmough, S.A.; Aherne, J. Estimating base cation weathering rates in Canadian forest soils using a simple texture-based model. Biogeochemistry 2010, 101, 183–196. [Google Scholar] [CrossRef]
- Soil Survey Staff 2018. Natural Resources Conservation Service, United States Department of Agriculture; Web Soil Survey. Available online: https://websoilsurvey.sc.egov.usda.gov/ (accessed on 18 February 2018).
- Rothstein, D.E.; Spaulding, S.E. Replacement of wildfire by whole-tree harvesting in jack pine forests: Effects on soil fertility and tree nutrition. For. Ecol. Manag. 2010, 260, 1164–1174. [Google Scholar] [CrossRef]
- Newman, E.I. Phosphorus inputs to terrestrial ecosystems. J. Ecol. 1995, 83, 713–726. [Google Scholar] [CrossRef]
- Son, Y. Non-symbiotic nitrogen fixation in forest ecosystems. Ecol. Res. 2001, 16, 183–196. [Google Scholar] [CrossRef]
- McCullough, D.G.; Kulman, H.M. Effects of nitrogen fertilization on young jack pine (Pinus banksiana) and on its suitability as a host for jack pine budworm (Choristoneura pinus pinus) (Lepidoptera: Tortricidae). Can. J. For. Res. 1991, 21, 1447–1458. [Google Scholar] [CrossRef]
- Hember, R.A.; Coops, N.C.; Spittlehouse, D.L. Spatial and Temporal Variability of Potential Evaporation across North American Forests. Hydrology 2017, 4, 5. [Google Scholar] [CrossRef]
- Vangansbeke, P.; de Schrijver, A.; de Frenne, P.; Verstraeten, A.; Gorissen, L.; Verheyen, K. Strong negative impacts of whole tree harvesting in pine stands on poor, sandy soils: A long-term nutrient budget modelling approach. For. Ecol. Manag. 2015, 356, 101–111. [Google Scholar] [CrossRef]
- Tripler, C.E.; Kaushal, S.S.; Likens, G.E.; Todd Walter, M. Patterns in potassium dynamics in forest ecosystems. Ecol. Lett. 2006, 9, 451–466. [Google Scholar] [CrossRef] [PubMed] [Green Version]
- Skeffington, R.A.; Wilson, E.J. Excess nitrogen deposition: Issues for consideration. Environ. Pollut. 1988, 54, 159–184. [Google Scholar] [CrossRef]
- Aber, J.D.; Nadelhoffer, K.J.; Steudler, P.; Melillo, J.M. Nitrogen saturation in northern forest ecosystems. BioScience 1989, 39, 378–387. [Google Scholar] [CrossRef]
- Janowiak, M.K.; Iverson, L.R.; Mladenoff, D.J.; Peters, E.; Wythers, K.R.; Xi, W.; Brandt, L.A.; Butler, P.R.; Handler, S.D.; Shannon, P.D.; et al. Forest Ecosystem Vulnerability Assessment and Synthesis for Northern Wisconsin and Western Upper Michigan: A Report from the Northwoods Climate Change Response Framework Project; General Technical Report for Northern Research Station: Newtown Square, PA, USA, 2014. [Google Scholar]
Figure 1.
Absolute growth rates of jack pine (Pinus banksiana Lamb.) in northern Lower Michigan in response to fertilization plotted as main effects (±1 Standard Error (SE)) of N (a) and Base Cations (b) and individual factorial treatments compared to control (c). Data represent mean total height growth in cm from May 2015 through October 2017. For panels (a,b) horizontal axis symbols indicate treatment with (“+”) and without (“0”) added fertilizer. Symbols in (a,b) indicate significance of main effects, symbols in (c) indicate growth significantly different from the control at p < 0.05 (*) and p < 0.001 (***).

Figure 2.
Relative growth rates of jack pine (Pinus banksiana) in northern Lower Michigan in response to fertilization plotted as main effects (±1 SE) of N (a) and Base Cations (b) and individual factorial treatments compared to control (c). For panels (a,b), horizontal axis symbols indicate treatment with (“+”) and without (“0”) added fertilizer. Symbols in (a,b) indicate significance of main effects, symbols in (c) indicate growth significantly different from the control at p < 0.05 (*) and p < 0.01 (**).

Figure 3.
Mortality of jack pine (Pinus banksiana) in northern Lower Michigan in response to fertilization plotted as main effects (±1 SE) of N (a) and individual factorial treatments compared to control (b). Data represent mean cumulative tree mortality occurring between May 2015 and October 2017. In panel (a), horizontal axis symbols indicate treatments with (“+”) and without (“0”) added nitrogen. Symbols in (a) indicate significance of main effects, symbols in (b) indicate growth significantly different from the control at p < 0.05 (*).

Figure 4.
Foliar macronutrient concentrations of jack pine (Pinus banksiana) in northern Lower Michigan in response to main effects of nitrogen (N), phosphorus (P) and base cations (BC). Individual panels present data for N (a), P (b), potassium (c), sulfur (d), calcium (e), and magnesium (f). Values are means (±1 SE) for unfertilized plots (open bars) and fertilized plots (filled bars). Symbols indicate significance of main effects at p < 0.1 (†); p < 0.05 (*); p < 0.01 (**) and p < 0.001 (***).

Figure 5.
Plots of significant correlations (from Table 1) with 95% confidence intervals between foliar nutrition parameters (X axes) and absolute or relative growth rates (Y axes) of jack pine (Pinus banksiana) in northern Lower Michigan. Individual panels present data for absolute growth against foliar N:K (a), and relative growth rate against foliar N:K (b), foliar N (c) and foliar P (d).

Table 1.
Correlation coefficients and probabilities (Bonferonni) for simple linear correlations between absolute and relative tree growth rates and foliar nutrition parameters of jack pine (Pinus banksiana Lamb.) in northern Lower Michigan. Statistically significant correlations are indicated by bold text. Statistically significant correlations are plotted in Figure 5.
| Absolute Growth (cm) | r | p |
|---|---|---|
| Foliar N (ppm) | −0.425 | 0.118 |
| Foliar P (ppm) | −0.351 | 0.647 |
| Foliar K (ppm) | 0.248 | 1.000 |
| Foliar S (ppm) | −0.055 | 1.000 |
| Foliar Ca (ppm) | 0.071 | 1.000 |
| Foliar Mg(ppm) | 0.131 | 1.000 |
| Foliar N:P Ratio | −0.050 | 1.000 |
| Foliar N:K Ratio | −0.490 | 0.018 |
| Foliar N:S Ratio | −0.190 | 0.585 |
| Foliar N:Ca Ratio | −0.216 | 1.000 |
| Foliar N:Mg Ratio | −0.178 | 1.000 |
| Relative Growth Rate | ||
| Foliar N (ppm) | −0.493 | 0.017 |
| Foliar P (ppm) | −0.481 | 0.024 |
| Foliar K (ppm) | 0.240 | 1.000 |
| Foliar S (ppm) | −0.220 | 0.398 |
| Foliar Ca (ppm) | −0.118 | 1.000 |
| Foliar Mg (ppm) | 0.200 | 1.000 |
| Foliar N:P Ratio | 0.021 | 1.000 |
| Foliar N:K Ratio | −0.526 | 0.005 |
| Foliar N:S Ratio | −0.059 | 1.000 |
| Foliar N:Ca Ratio | −0.053 | 1.000 |
| Foliar N:Mg Ratio | −0.248 | 1.000 |
Table 2.
Estimated nutrient budgets for jack pine (Pinus banksiana) plantations on glacial outwash sands in northern Lower Michigan. Data below are the estimate of the number of years required for ecosystems to recover nutrients removed in either whole-tree harvesting or stem-only harvesting under three different scenarios of nutrient leaching: 100% nutrient retention, 2/3 nutrient retention and 1/3 nutrient retention (see Nutrient Budgets in Methods above for details). Scenarios under which nutrient recovery would not be achieved within the planned 50-year rotation are indicated with bold numbers.
| Nutrient Leaching Scenarios | |||
|---|---|---|---|
| Whole-Tree Harvest | 100% Retention | 2/3 Retention | 1/3 Retention |
| Nitrogen | 20 | 28 | 48 |
| Phosphorus | 27 | 33 | 43 |
| Potassium | 73 | 90 | 117 |
| Calcium | 19 | 23 | 31 |
| Magnesium | 25 | 34 | 53 |
| Stem-only Harvest | |||
| Nitrogen | 8 | 11 | 19 |
| Phosphorus | 10 | 12 | 15 |
| Potassium | 35 | 42 | 55 |
| Calcium | 12 | 15 | 20 |
| Magnesium | 14 | 19 | 30 |
© 2018 by the author. Licensee MDPI, Basel, Switzerland. This article is an open access article distributed under the terms and conditions of the Creative Commons Attribution (CC BY) license (http://creativecommons.org/licenses/by/4.0/).
Share and Cite
MDPI and ACS Style
E. Rothstein, D. Effect of Fertilization on Growth and Mortality of Jack Pine Growing on Poor, Sandy Soils in Michigan, USA: Implications for Sustainable Management. Forests 2018, 9, 549. https://doi.org/10.3390/f9090549
AMA Style
E. Rothstein D. Effect of Fertilization on Growth and Mortality of Jack Pine Growing on Poor, Sandy Soils in Michigan, USA: Implications for Sustainable Management. Forests. 2018; 9(9):549. https://doi.org/10.3390/f9090549
Chicago/Turabian StyleE. Rothstein, David. 2018. "Effect of Fertilization on Growth and Mortality of Jack Pine Growing on Poor, Sandy Soils in Michigan, USA: Implications for Sustainable Management" Forests 9, no. 9: 549. https://doi.org/10.3390/f9090549
Note that from the first issue of 2016, this journal uses article numbers instead of page numbers. See further details here.