Forest Carbon Sequestration, Pathogens and the Costs of the EU’s 2050 Climate Targets


Department of Economics, Swedish University of Agricultural Sciences, Box 7013, 75007 Uppsala, Sweden
*
Author to whom correspondence should be addressed.
Forests 2018, 9(9), 542; https://doi.org/10.3390/f9090542
Submission received: 8 August 2018
/
Revised: 30 August 2018
/
Accepted: 31 August 2018
/
Published: 3 September 2018
(This article belongs to the Section Forest Economics, Policy, and Social Science)
Abstract
:Carbon sequestration is suggested as a low-cost option for climate change mitigation, the functioning of which can be threatened by pathogen infestation. This study calculates the effects of infectious pathogens on the cost of achieving the EU’s 2050 climate targets by combining the so-called production function method with the replacement cost method. Pathogens are then assumed to affect carbon sink enhancement through the impact on productivity of forest land, and carbon sequestration is valued as the replacement for costly reductions in emissions from fossil fuels for reaching the EU’s 2050 climate targets. To this end, we have constructed a numerical dynamic optimization model with a logistic forest growth function, a simple allometric representation of the spread of pathogens in forests, and reductions in emissions from fossil fuels. The results show that the annual value of forest carbon sequestration ranges between approximately 6.4 and 14.9 billion Euros, depending on the impact and dispersal of pathogens. Relatively large values are obtained for countries with large emissions from fossil fuels, e.g., Germany, France, Spain and Italy, which also face costs of pathogen together with countries with large forest area, such as Romania.
1. Introduction
Forestry accounts for 33% of the total area in Europe and sequesters approximately 10% of annual greenhouse gas emissions in Europe [1]. Studies have shown that forest carbon sequestration has the potential to reduce the cost of reaching EU’s 2020 and 2050 emission goals [2,3,4]. These studies estimate that the total saving can amount to 30% of the total abatement cost, which corresponds to an annual value of forest as carbon sink ranging between 10–20 billion Euros. This can be compared with the total value added from forestry in the EU, which corresponds to 0.3% of total GDP [5]. The value added would then amount to approximately 42 billion Euros in 2015. Carbon sink can be increased through changes in management practices of existing forests, reforestation and afforestation, where the latter is regarded as a low-cost option [6].
However, the forests, and thereby the contribution to climate policy, are threatened by pathogens, which have been increasing exponentially during the last decades mainly because of increased trade and transports [7,8]. The number of infectious fungi species in plants have increased 13-fold from 1995 to 2010 [9]. Today, Europe is the continent with the highest number of invasive pathogens in forests, which is four to five times higher than the reported number for China and the USA [10]. Forest pathogens, such as the needle disease Dothistroma septosporum spp. in pine Pinus spp. and the Dutch elm disease Ophiostoma ulmi or the fungi Cryphonectria parasitica on American chestnut Castanea dentat [11,12,13] are known to affect the productivity and mortality rate of trees and reduce biomass, carbon storage and biodiversity. Pathogens common in Europe, Ophiostoma ulmi, the fungus-like organisms Phytophtora cinnamomi and Seiridium causing lethal canker diseases on cypresses and conifers are listed as among the ‘100 Worst Invasive Alien Species’ in the DAISIE (Delivering Alien Invasive Species Inventories for Europe).
The impact on productivity, measured as standing volume per area unit, and growth of forest trees will affect not only timber volume, but also carbon sequestration [11]. This generates a cost for climate policy when there is a need to compensate the lower carbon sequestration with increased abatement by reducing the use of fossil fuels, which is costly to society. However, despite the knowledge of incidences and dispersal of forest pathogens, no study has calculated economic implications in terms of increases in costs for climate policy. The purpose of this study is to calculate the costs of pathogens for reaching the EU’s long-term 2050 climate targets when afforestation is used for provision of additional carbon sink. This is done by combining two methods for the valuation of ecosystem services: production function approach and replacement cost method. This implies that we perceive pathogens as a (negative) input for forest carbon sequestration, and the value of carbon sink enhancement is estimated as the avoidance of more expensive abatement measures to meet the EU’s 2050 climate targets. A numerical dynamic optimization model is then constructed where the sum of the costs of reducing CO2 emissions from fossil fuels and enhancement of forest carbon sink are minimized for reaching emission targets. Pathogens are then assumed to reduce the productivity of forests, which decrease the carbon sequestration and thereby the need for further costly reductions in CO2 emissions from fossil fuels.
The study is related to two strands of literature in economics: assessment of economic effects of pathogens and calculation of the value of forest carbon sink in climate management. With respect to the first strand, the social costs of the pathogens occur from the impact on the trees and associated effects on the provision of ecosystem services. The ecosystem services include goods traded on the market, such as timber, and non-marketed goods like carbon sequestration and recreational values. A full-fledged numerical analysis of the costs would thus include modelling of the impacts and dispersal of the pathogen, effects on forest productivity and growth, and the value of changes in ecosystem services in monetary terms. To the best of our knowledge, this has not been done by any study. Instead, the costs of pathogens have been approximated as expenses for stopping entrance and establishment or controlling spread [14,15,16] or by approximation of the effects on the value of timber production [17,18]. Campbell and Schlarbaum [14] calculate cost in terms of tree removal to mitigate damages from Dutch Elm Disease in North America which amounts to 100 million USD per year. The same type of cost in Sweden ranged between 0.4 and 1 million USD [15]. The calculated cost of an oak tree killed by wilt oak (Ceratocystis fagacearum) amounts to 250 USD/tree in the US [16]. Pimentel et al. [17] report in a survey of cost estimates of alien species, that 9% of forest production is lost because of plant pathogen attacks in the US, which correspond to 7 billion USD per year. Soliman et al. [18] develop a partial equilibrium model of the forestry sector in the EU and calculate the costs of the pine wood nematode (Bursaphelenchus xylophilus), which amount to 1.5 billion USD/year on average.
Regarding the literature in economics on the role of forest carbon in climate management, a large body of literature has shown that the cost of reaching climate targets can be reduced considerably when allowing for carbon sink enhancement [2,3,4,19,20,21,22]. Studies on the cost of the EU’s climate targets show that inclusion of afforestation and forest management can reduce the total cost for reaching the EU’s 2020 target by 30% [3], but also that cost saving is reduced when accounting for uncertainty in sink enhancement [2]. Only one study has included forest carbon sink for the attainment of the same target as in this study, i.e., the EU’s 2050 climate targets [4]. The focus of their study is on the optimal use of forests for timber production, bioenergy provision, and carbon sink enhancement, and they show that the inclusion of forest carbon sink can reduce the costs of reaching the EU’s 2050 climate targets by 23%.
2. Structure of the Dynamic Optimization Model
We distinguish between two options for the creation of additional carbon sink, i.e., carbon sequestration above the business as usual level (BAU): changes in forest management of existing deciduous and conifer forests and afforestation, i.e., planting of trees on agricultural land. Carbon sequestration occurs above and below ground, where forest growth constitutes the source of sequestration for above ground sequestration and decomposition of litter and forest residue contribute to the below ground sequestration. The dynamics of these two types of sequestration modes differ, which affect their contribution to climate policy [23]. In this study we consider only above ground sequestration due to our focus on the impact of pathogens, and little is known about their effects in general and particularly on below ground conditions [10]. Carbon sequestration in each EU country i = 1,...,n and type of forest, u, (conifer, deciduous, and afforested land) is then determined by the difference in productivity, defined as forest volume per ha, between two time periods, , written as:
where is the transformation from forest volume into CO2e and is the forest volume per ha.
Pathogens are assumed to affect carbon sequestration through the effect on productivity, where productivity is determined by growth of forests during time, which, in turn, is determined by productivity in prior periods, growth, and harvest:
where is the growth function and is the harvest, assumed to occur at the end of the year.
Pathogens show diverse impacts from the gene to the ecosystem system level, and can affect the growth of trees, mortality rate, and quality of timber [10]. The effects on the trees depend on their resistance, and on the impact on the forest ecosystem. Many pathogen species attack specific tree species such as the O. novo-ulmi on elm trees, Chalara fraxinea, a fungal disease-causing ash dieback, and the nematode Bursapehlenchus xylophilus, targeting pine trees [24]. There is no study on these effects at the European level for deciduous and conifer forests. In modelling the impacts, we therefore make a simplification and follow Macpherson et al. [25,26] who analyze the impacts of forest pathogens on optimal rotation period in an even-aged single stand. We then construct a so-called, effective forest area in time t, which reflects the productivity of an infected forest area in relation to an uninfected. This is made by distinguishing between the area infected by pathogens, and the area not infected, for each of the forest types, assuming that pathogen infections are specific for the tree species. The total forest area is. The biomass production per forest area unit of is defined in terms of equivalent area, which is defined as the productivity of the infected area in relation to the uninfected, where . For example, if the productivity of an infected area is 75% of the level without the infection, we have . The total effective forest area, , is then the weighted average of the infected and the unaffected areas:
where is the share of the infected area of the total area of land, .
However, it is quite likely that the disease spreads over time, which occurs from contact between infected and not infected trees through dispersal of spores or through the root system. When a susceptible tree is affected, the area of infected trees increases, which is written as:
where is the dispersal rate. When there is no dispersal effect. This is similar to frequency-dependent transmission where the annual change in the infected area is increasing as the contact rate with uninfected trees is increasing [27]. The development of can then be written as:
By solving for the integral in (6) and inserting it into (3), we obtain the weighted effective area in time t as:
where is the effective area conversion. Total carbon sink enhancement for a country i in period t is then given by:
Emissions of CO2 from fossil fuels for each country are determined by business as usual (BAU) emissions, , minus abatement, . A simplification is made by assuming that abatement depends on the capital of cleaning technologies, . The capital is subject to depreciation, and abatement and development of capital in cleaning technologies are written as:
where is the depreciation rate and is the annual investment in cleaning technologies. Solving for the integral in Equation (10) gives:
The EU’s 2050 climate target is formulated as the maximum CO2e emissions from all EU countries in the target year T. We include only additional sink, i.e., the total carbon sequestration above the level obtained under business as usual in forestry, SBAU. The emission constraint is then written as:
where is the maximum emissions in period T. Equation (13) shows that an outbreak of pathogens reduces through reduction in as shown in Equations (8) and (9). This implies a greater need for reduction of fossil fuels in order to meet the target.
The cost of carbon sink enhancement in existing forests, deciduous and coniferous, is calculated as the decline in profits under business as usual, according to:
for u = deciduous, coniferous, where is unit profit and is harvest in each period of time, which maximizes total profits under BAU (see more details in the data retrieval Section 3). Simplifications are made by assuming constant net benefits and BAU harvest levels, which are motivated by the lack of data on future net benefits and associated optimal harvests. Cost for afforestation, where f = afforestation, is calculated as the annual opportunity cost of land used in agriculture.
The decision maker is assumed to minimize the costs for achieving the target as expressed in Equation (14), which is written as:
where is the discount factor with the discount rate r, which shows how people value early in relation to late incomes or costs.
It is shown in Appendix A that, in a cost-effective solution to Equations (1)–(16), the value of carbon sequestration as an option in reaching the climate target is determined by:
- The cost of delaying harvest and the opportunity cost of land. Relatively low net benefits from harvest and the opportunity cost of land, give high value of carbon sequestration.
- Costs and depreciation of investments in reductions of fossil fuels. High cost and depreciation give high value.
- Discount rates, which implies lower future costs of all emission mitigation options and thereby delays costly actions. High discount rate generates low abatement cost and value of carbon sequestration.
- Impact of pathogens, where high impacts generate relatively low effective areas, i.e., , which reduces the carbon sink contribution and thereby its value.
- Forest growth, where an increase raises the value of carbon sequestration as higher growth promotes carbon sequestration.
3. Description of Data
In order to solve the model described in Section 2, data are needed on forest carbon sequestration, fossil fuel emissions, the costs of forest management, afforestation, and investments in reductions of emissions from fossil fuels, discount rate, targets, and restrictions. Unless otherwise stated, all data are obtained from Gren et al. [28].
3.1. Forest Carbon Sink and Emissions from Fossil Fuels
Total forest area covers 38% of the total inland area without water in the EU [29]. Calculations of carbon sequestration from actual forest management in the initial year are made by using emission coefficients from United Nations Framework Convention on Climate Change (UNFCCC) [30], and the estimated total forest carbon sink amounts to 401 million tons (Table A1).
Numerical estimates of forest growth functions are obtained from Gren et al. [28] who estimate logistic functions for deciduous and conifer forests by use of the Leslie matrix, which is formulated as:
where is standing volume in period t per area unit, vi,u the intrinsic growth rate, and Yi,u carrying capacity. Necessary information for quantifying the equation (17) is then parameter values on vi,u, Ki,u, and the initial value of , all of which are found in Gren et al. [28].
When converting forest harvest volume into CO2e we use ton 0.912 CO2/m3 harvest for boreal (Sweden, Finland) and 1.459 for temperate (remaining EU countries) forest [4]. Afforestation can be made on cropland and grassland. Carbon sequestration of afforestation is calculated as the difference in carbon sequestration per ha between forest and the two arable land types. The sequestration per unit of agricultural land is calculated as the weighted emission from these two land uses where share of respective land use of total agricultural land is used as weights. Data on emission coefficients for all land uses is obtained from UNFCCC [30] and the estimates are reported in Table A1.
With respect to effects of pathogens on the productivity of infected forests in relation to non-infected, it has not been possible to find any data. Studies exist on the impact on total forest volume [17], but not on our equivalence parameter. Parameter values are therefore obtained from Macpherson et al. [25] who calculated the impact of diseases on optimal rotation rate, where the equivalence coefficient ranges between 0 and 1. We therefore make calculations of costs of the pathogens for values within this range, and assign the average of θ = 0.5 in the reference scenario, which is assumed to be the same for all countries.
Similar to impact on forest productivity, there is a lack of studies on the systematic estimation of area dispersal rates for the EU (and other) countries. There are studies on the spread, measured as distance in kilometer, that a pathogen can move during a certain period of time [31], but not on the rate of annual increases. We therefore assign a rate of spread based on the change in the share of the total infected area of the total forest area in the EU which increased from 0.0235 in 2000 to 0.0753 in 2005 [32]. This gives an annual rate of increase where , which is used in the reference case and assumed to be the same for all countries and forest types. Calculations will be made for δ = 0 and δ = 0.045. Data on initial infested forest area is obtained from European Forest Inventory (EFI) [32], where data is reported for forest area affected by insects and diseases for EU countries. The total infested area corresponds to 2.4% of the total forest area but can exceed 5% for some countries (Table A1).
In the reference case, when θ = 0.5 and δ = 0.03, the calculated effective area conversion (Equation (8)) in the initial year varies between 0.91 and 1.00 for the different countries (Table A2). However, the differences in the level of increase over time because of dispersal rate and ranges between 0.73 and 0.99 in the target year 2050. The is low in countries with large shares of infested area in relation to total forest area (Spain, Portugal and Romania).
Data on emissions from fossil fuel combustion are calculated by converting the reported use of heating oil, coal, gas, diesel, and gasoline for the different countries in 2015 [33]. This gives a total of 3634 million tons of CO2 (Table A1). Five countries, Germany, UK, Italy, France and Poland account for slightly more than 50% of all emissions. As will be seen in the next section, these countries make the largest gains from the introduction of forest carbon sequestration.
3.2. Costs of Carbon Sink and Emission Reduction
When carbon sink is included in the EU’s policy, the costs of changes in forest management are determined by the difference in profits under BAU conditions and profits when included in the system. The profits under BAU conditions are derived from the maximization of net benefits of harvest, written as:
Data on unit net benefits, from each tree type are obtained from Munnich-Vass and Elofsson [4]. Under BAU in the reference case when θ = 0.5 and δ = 0.03, the maximized net value from forest products per year in present value amounts to 38.5 billion Euros. In 2015, the EU’s total GDP amounted to 14,745 billion Euros [34]. The calculated profits from forestry then correspond to 0.27% of GDP, which is close to the average contribution from forestry to GDP in EU countries of 0.31% obtained by Kovalcik [5]. Without any pathogen incidence, annual profits would increase by 4.0% to 40.1 billion. This result can be compared with the profit loss reported for pine wood nematode in EU, which amounted to 1.5 billion Euros or 3.7% of the timber net value in 2015 [18]. On the other hand, it is lower than the estimated losses in forest product of 9% from pathogens in US forest [17].
The cost of afforestation is calculated as the opportunity cost of afforested land. The opportunity cost of land consists of the foregone profits from use of the land for agriculture, which is measured by the rental prices for land in 2015 prices [28]. Data on investment costs and reductions in emissions from fossil fuels are obtained from Gren et al. [28]. The functions include costs of reductions in heating oil, gas, coal, gasoline, and diesel, and are calculated as losses in profits from reductions in these fossil fuels. We assume an economic life length of 0 years, which gives a straight line depreciation rate of 0.1 per year.
3.3. Emission Targets, Constraints and Discount Rate
We calculate the cost of achieving the EU’s 2050 climate target of an 80% reduction in the emissions of green-house gases in 1990 to be achieved by 2050 at the latest. In 2015, total CO2 emissions were reduced to 77% of the total emissions in 1990 [33]. The target for maximum emissions in our study is then 0.25 of the emissions in 2015 to be reached in 2050 in a cost-effective solution.
Carbon sequestration under business as usual conditions, SBAU, depends on the choice of reference value. Only increases in carbon sequestration from the reference level are then credited in the climate program. Pathogens will affect optimal harvest and thereby carbon sequestration when not included in the climate policy. One option is then to choose carbon sequestration under business as usual for different assumptions of pathogen infestations. Another is to select the actual carbon sequestration in the reference year (2015 in this study). We have applied this principle since it follows the approach used by the EU for setting CO2e emission target, where emissions in 1990 provide the reference value. Using this approach and applying 2015 as the year of reference gives SBAU = 401 (Table A1).
The numerical model includes constraints on maximum annual and accumulated reductions in emissions of fossil fuels for each country. It is then assumed that a maximum of 20% in remaining emissions can be reduced each year, and that a maximum of 80% reduction in initial emissions is reached in the target year. Restrictions on accumulated emission reductions are imposed since it is assumed that it will not be possible to achieve a fossil-fuel-free society in 2050. This would require investments in new energy technologies, which are not considered in this numerical model. Annual and accumulated restrictions are also imposed on the maximum agricultural area turned into forest. It is then assumed that from the total agricultural area in the EU, which amounts to 42.7% of the total area in the EU or 1865 thousand km2 [35], a maximum 1% can be afforested each year and that a total of 10% can be converted over the years.
With respect to social discount rate, there is a large body of literature on the appropriate level and development over time. In general, a constant and relatively low discount rate is recommended for time horizons below 50 years [36]. It is quite likely that the discount rate differs for EU countries because of, among other things, different levels of economic development and time preferences. However, there are no data on social discount rates for the different countries for the period used in the study (35 years) and we therefore make the simplifying assumption of a constant rate r = 0.015 which is the same for all countries.
The value of carbon sink is calculated as the impact on the total cost of achieving the EU’s 2050 climate targets with or without the inclusion of this mitigation option. Carbon sink values are calculated for the entire EU, different countries and different levels of available agricultural land. The cost of pathogen incidence is then measured as the decline in the value of carbon sink because of the reduction in carbon sequestration. This is done for different assumptions concerning the impacts of diseases, and on values of other parameters (discount rate, depreciation, costs of afforestation, forest growth). We use General Algebraic Modelling System (GAMS) Conopt solver for all calculations [37].
4. Results: Calculated Value of Carbon Sink and Costs of Pathogens
4.1. Value of Carbon Sink from Forest
The total minimum cost of meeting the EU’s 2050 climate target when carbon sink is not included amounts to 2266 billion Euros in present terms. The average annual cost corresponds to 0.44% of total EU gross domestic product (GDP) in 2015 prices, which is within the range of cost estimates from different models reviewed by Capros et al. [38]. Their estimates range between 0.1% and 0.9% of total EU GDP. The total cost is reduced by 18% to 1850 billion Euros when additional carbon sequestration is created when both management of existing forests and plantation of trees on agriculture land are allowed. The main part of this cost saving, 83%, is caused by afforestation (Table 1).
The average annual value of agricultural land converted into forests amounts to approximately 490 Euros/ha, which can be compared with rents for agricultural land, which varies between 36 and 506 Euros/ha in 2015 value [28]. The relatively low contribution of forest management options to cost savings can be explained by the fact that, in our model, maximization of net benefits under BAU conditions to a large extent coincides with harvesting promoting carbon sequestration by the trees. On the other hand, Munnich-Vass and Elofsson [4] found that total abatement costs decrease by 23% from the introduction of the enhancement of forest carbon sink by management option for reaching the EU 2050 climate targets. One explanation can be that they impose annual targets on emission reductions and do not consider forest pathogens.
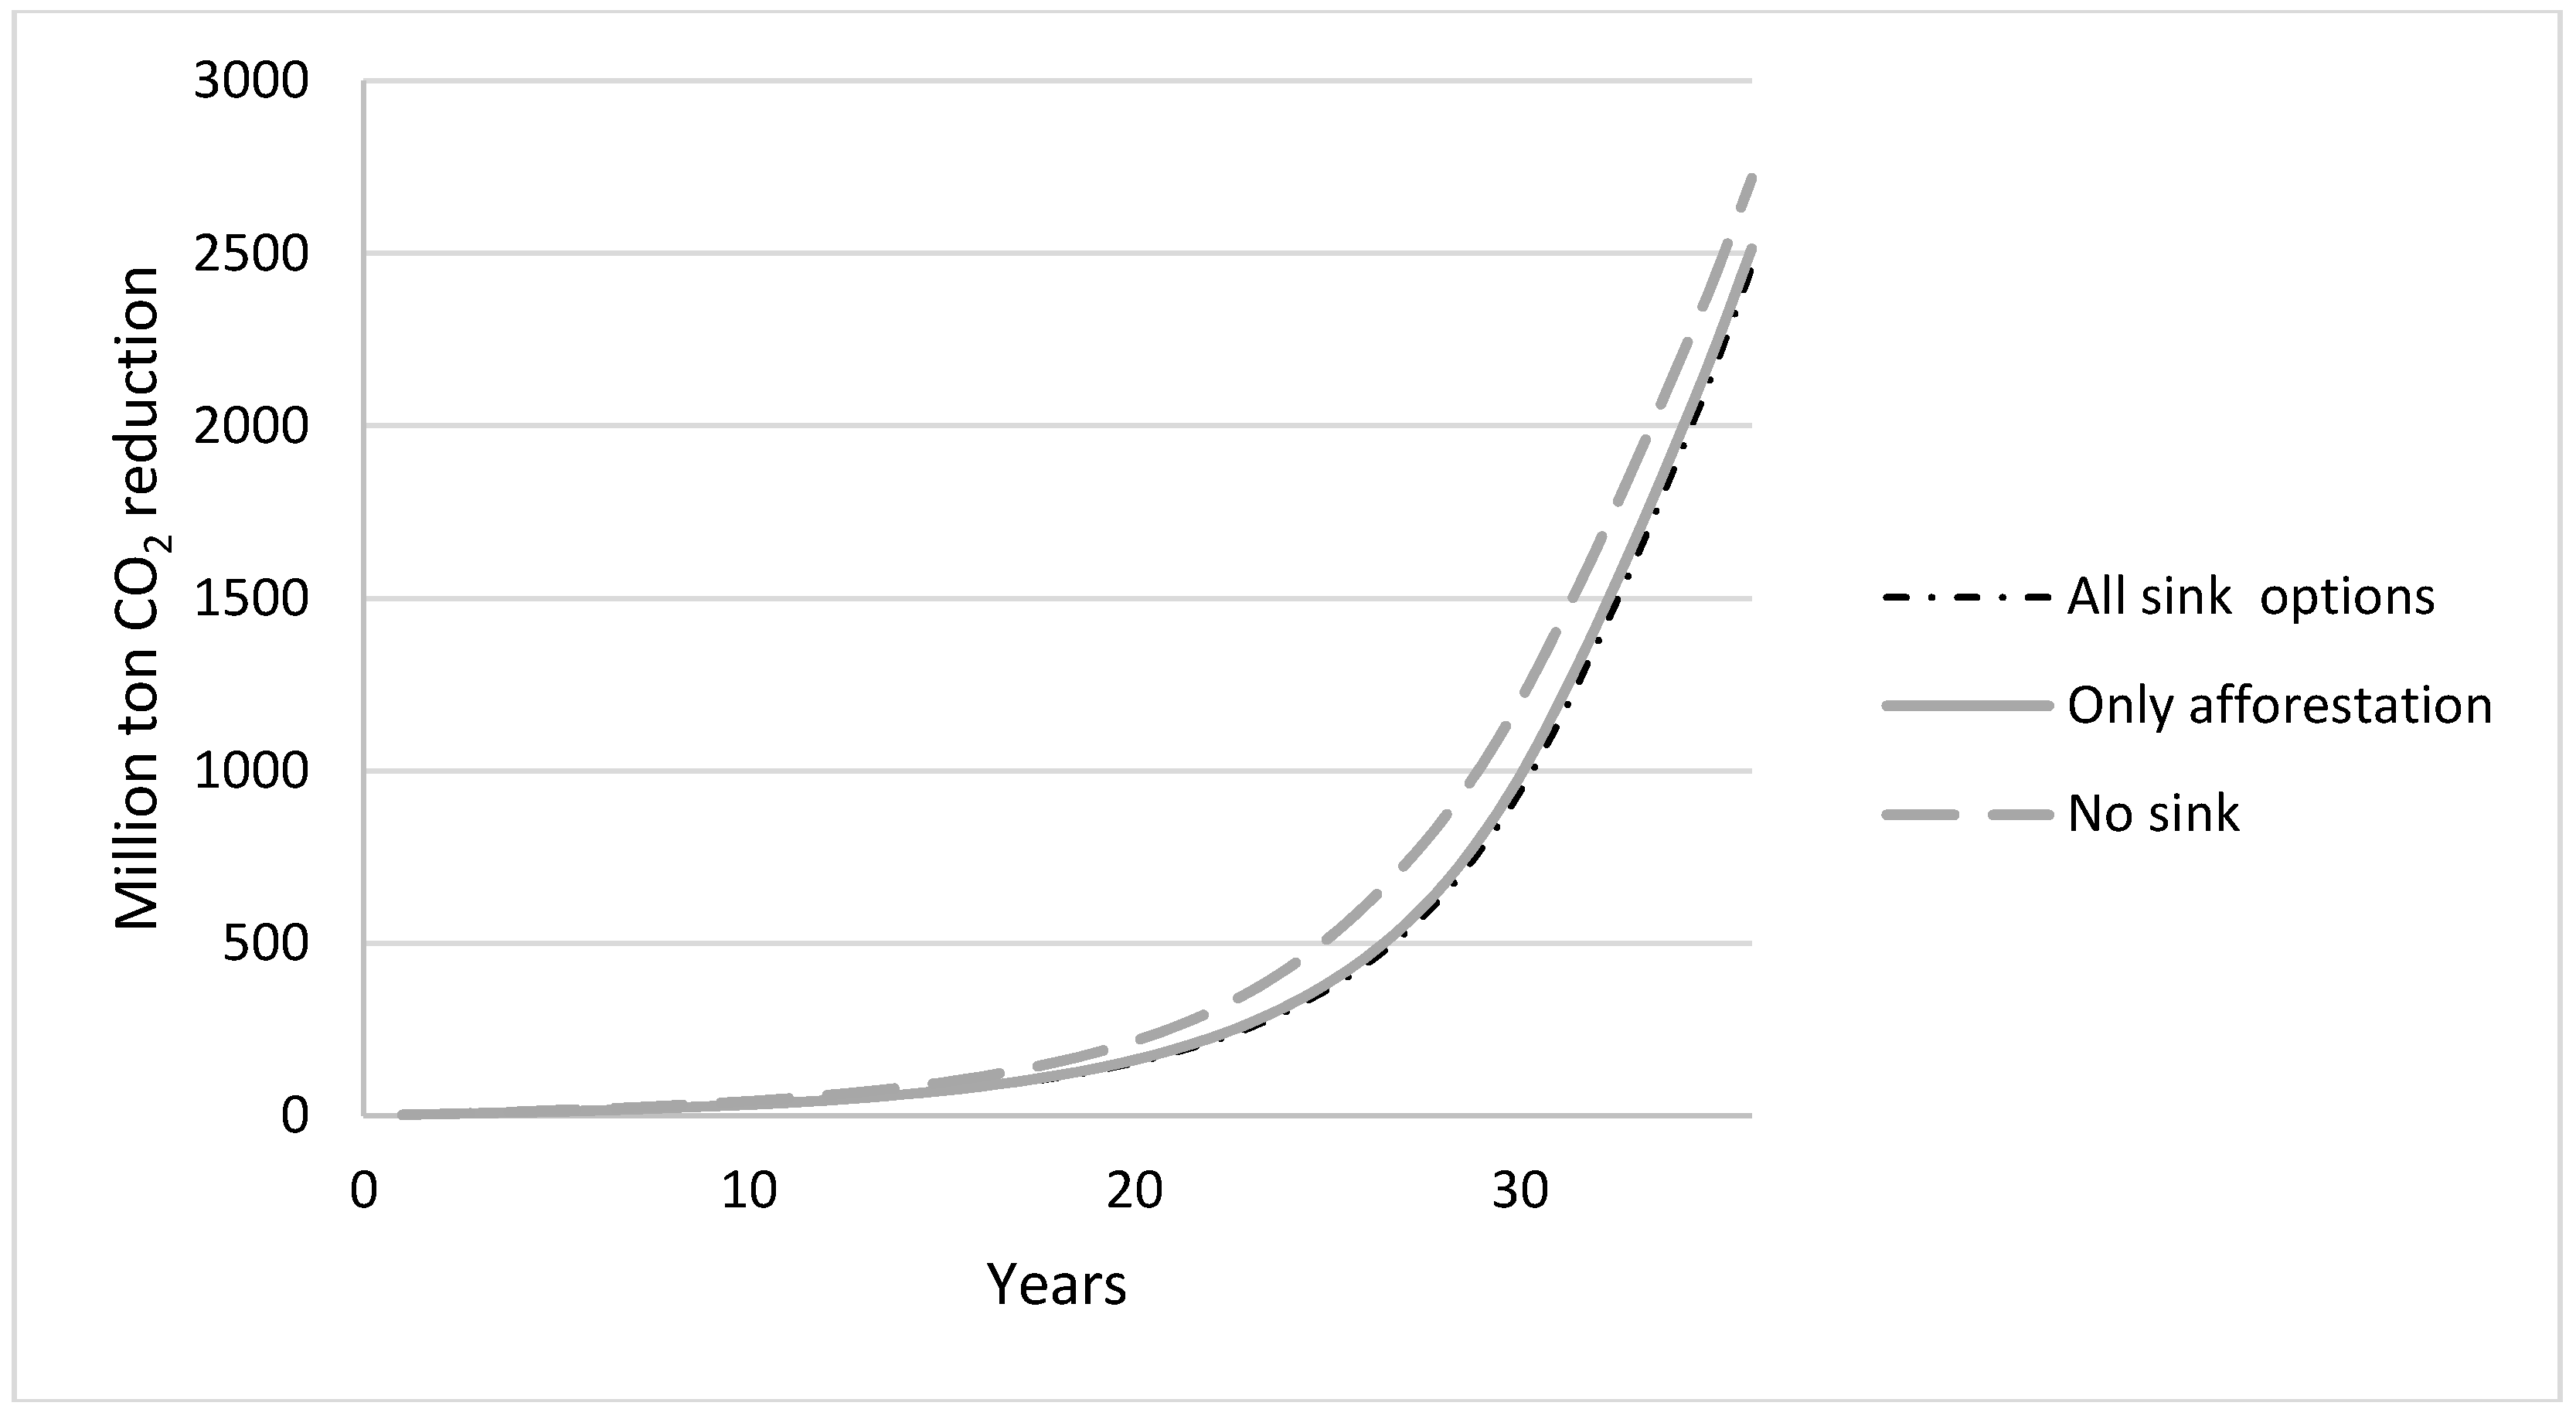
The reason for the lower costs when carbon sequestration is included is the lower requirement of costly reductions in emissions from fossil fuels (Figure 1).
In all cases, emission reduction has increased rapidly over the last 10 years. The reason for the delay is the discount rate, which implies that the cost of future abatement is lower than for current abatement. The cost savings from introducing carbon sink then occur from lower cost for carbon sink in each time period, and from delays in abatement of CO2 emissions from fossil fuels. There are only minor differences in emission reduction between the two carbon sequestration scenarios. In the final target year, this accounts for approximately 10% of total emission reduction for both scenarios.
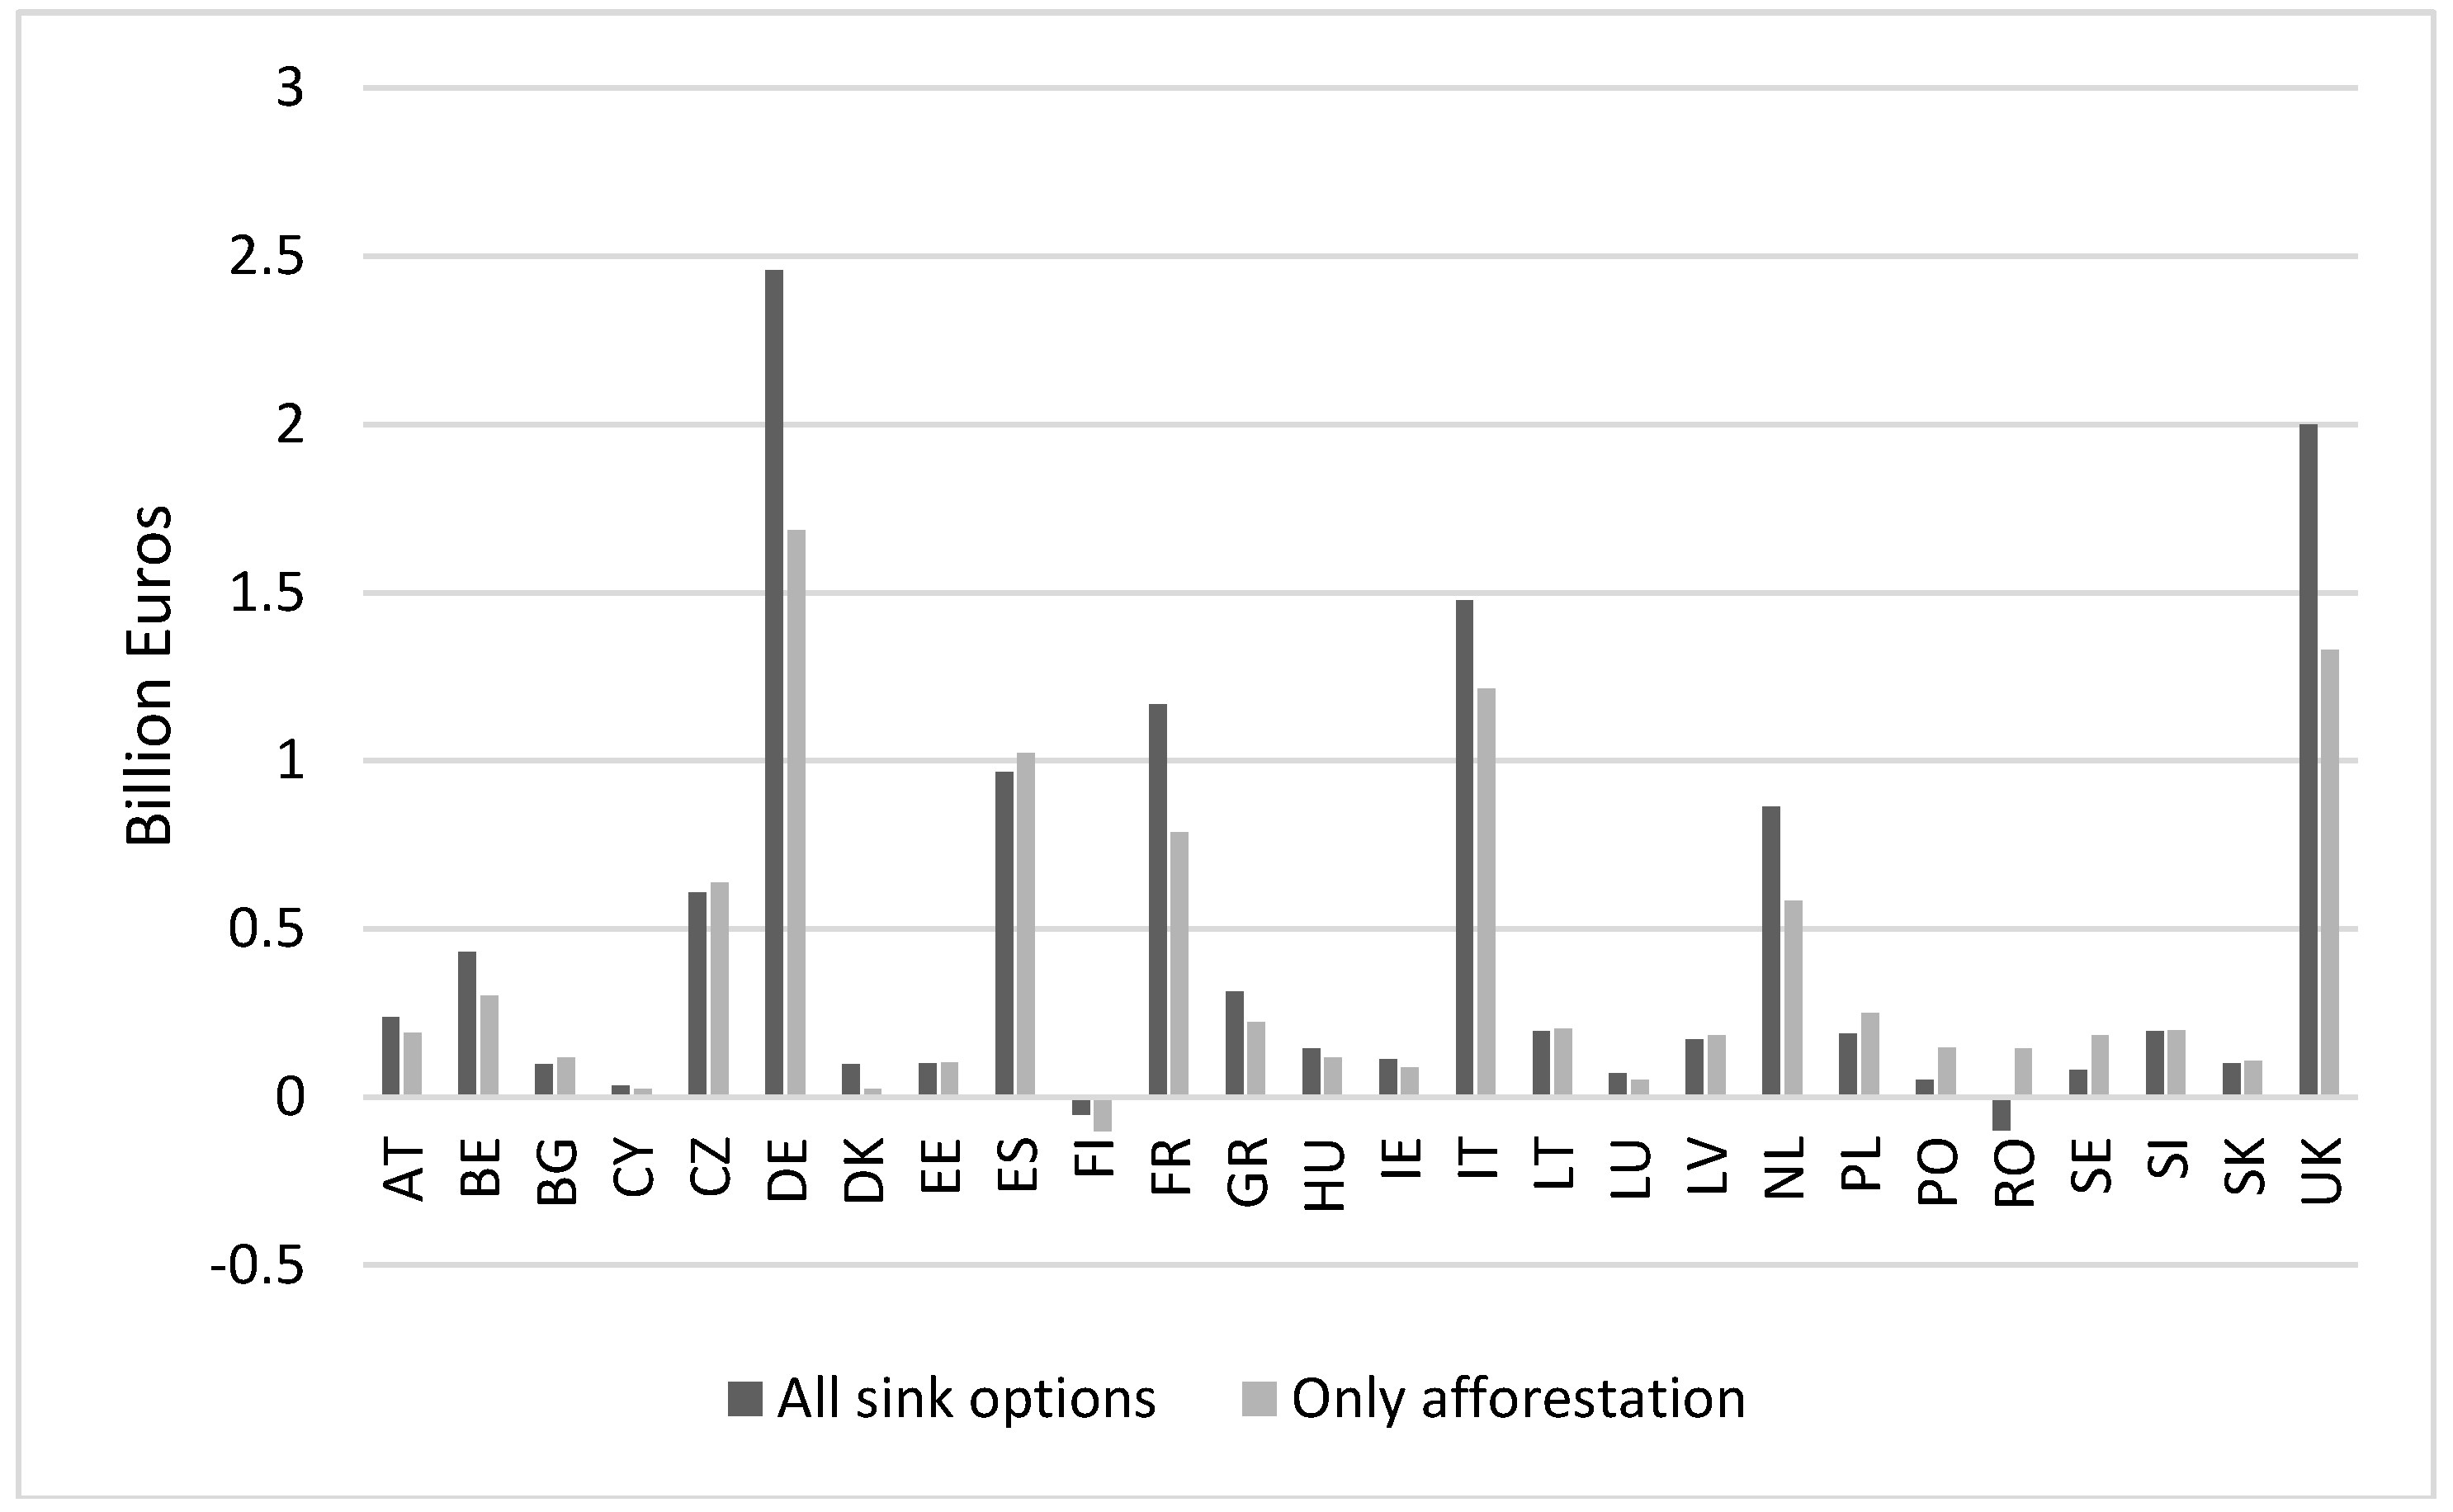
However, although the entire EU makes gains from the introduction of carbon sequestration, not all countries do the same (Figure 2).
The inclusion of carbon sequestration generates a scale and an allocation effect. The scale effect occurs from the lower requirement of emission reductions from fossil fuel. This favors countries with relatively large emission and limited or costly carbon sequestration options, such as Germany which accounts for 19% of the total BAU emission (Table A1). The allocation effect implies that countries with relatively low costs and large amounts of land for carbon sequestration or afforestation, such as Sweden, Finland, and Romania, obtain cost advantages. The minimization of total cost for achieving targets allocates carbon sequestration to these countries, which implies a relatively low value of carbon sequestration for them and can even be negative (Finland and Romania).
Let us recall our assumption of a maximum afforestation area corresponding to 10% of total agricultural land in the EU. This can be too large when considering the need for land to produce food and bioenergy, which can increase in the future due to population changes and climate management. A decrease in the available area to 5% reduces the value to 248 billion Euros (Figure 3).
Figure 3 shows that the value of afforestation is increasing but has a declining rate when the available agricultural area increases from zero to 12.5%. In larger areas, the marginal cost of carbon sequestration by afforestation is higher than that of reduction in emissions from fossil fuels.
4.2. The Cost of Pathogens
In the reference case with θ = 0.5 and δ = 0.03, the value of carbon sink amounted to 416 billion Euros. Without any pathogens, the value would be 521 billion Euros, and the cost of pathogens in the reference case would then amount to 105 billion Euros, or 3 billion Euros/year, which corresponds to 0.02% of total GDP in the EU. However, these costs can increase three times under unfavorable conditions when the biomass production of infested forests is eliminated, and the dispersal rate is doubled (Table 2).
The range in costs of pathogens is in the same order of magnitude for the chosen levels in equivalence area and dispersal rate. The lowest and highest costs are obtained for the combined effects of equivalence area and dispersal rate, and varies between 38 and 297 billion Euros. This range gives a variation in the annual cost of pathogens between 1.1 and 8.5 billion Euros, which corresponds to 0.01% and 0.06% of total GDP in the EU.
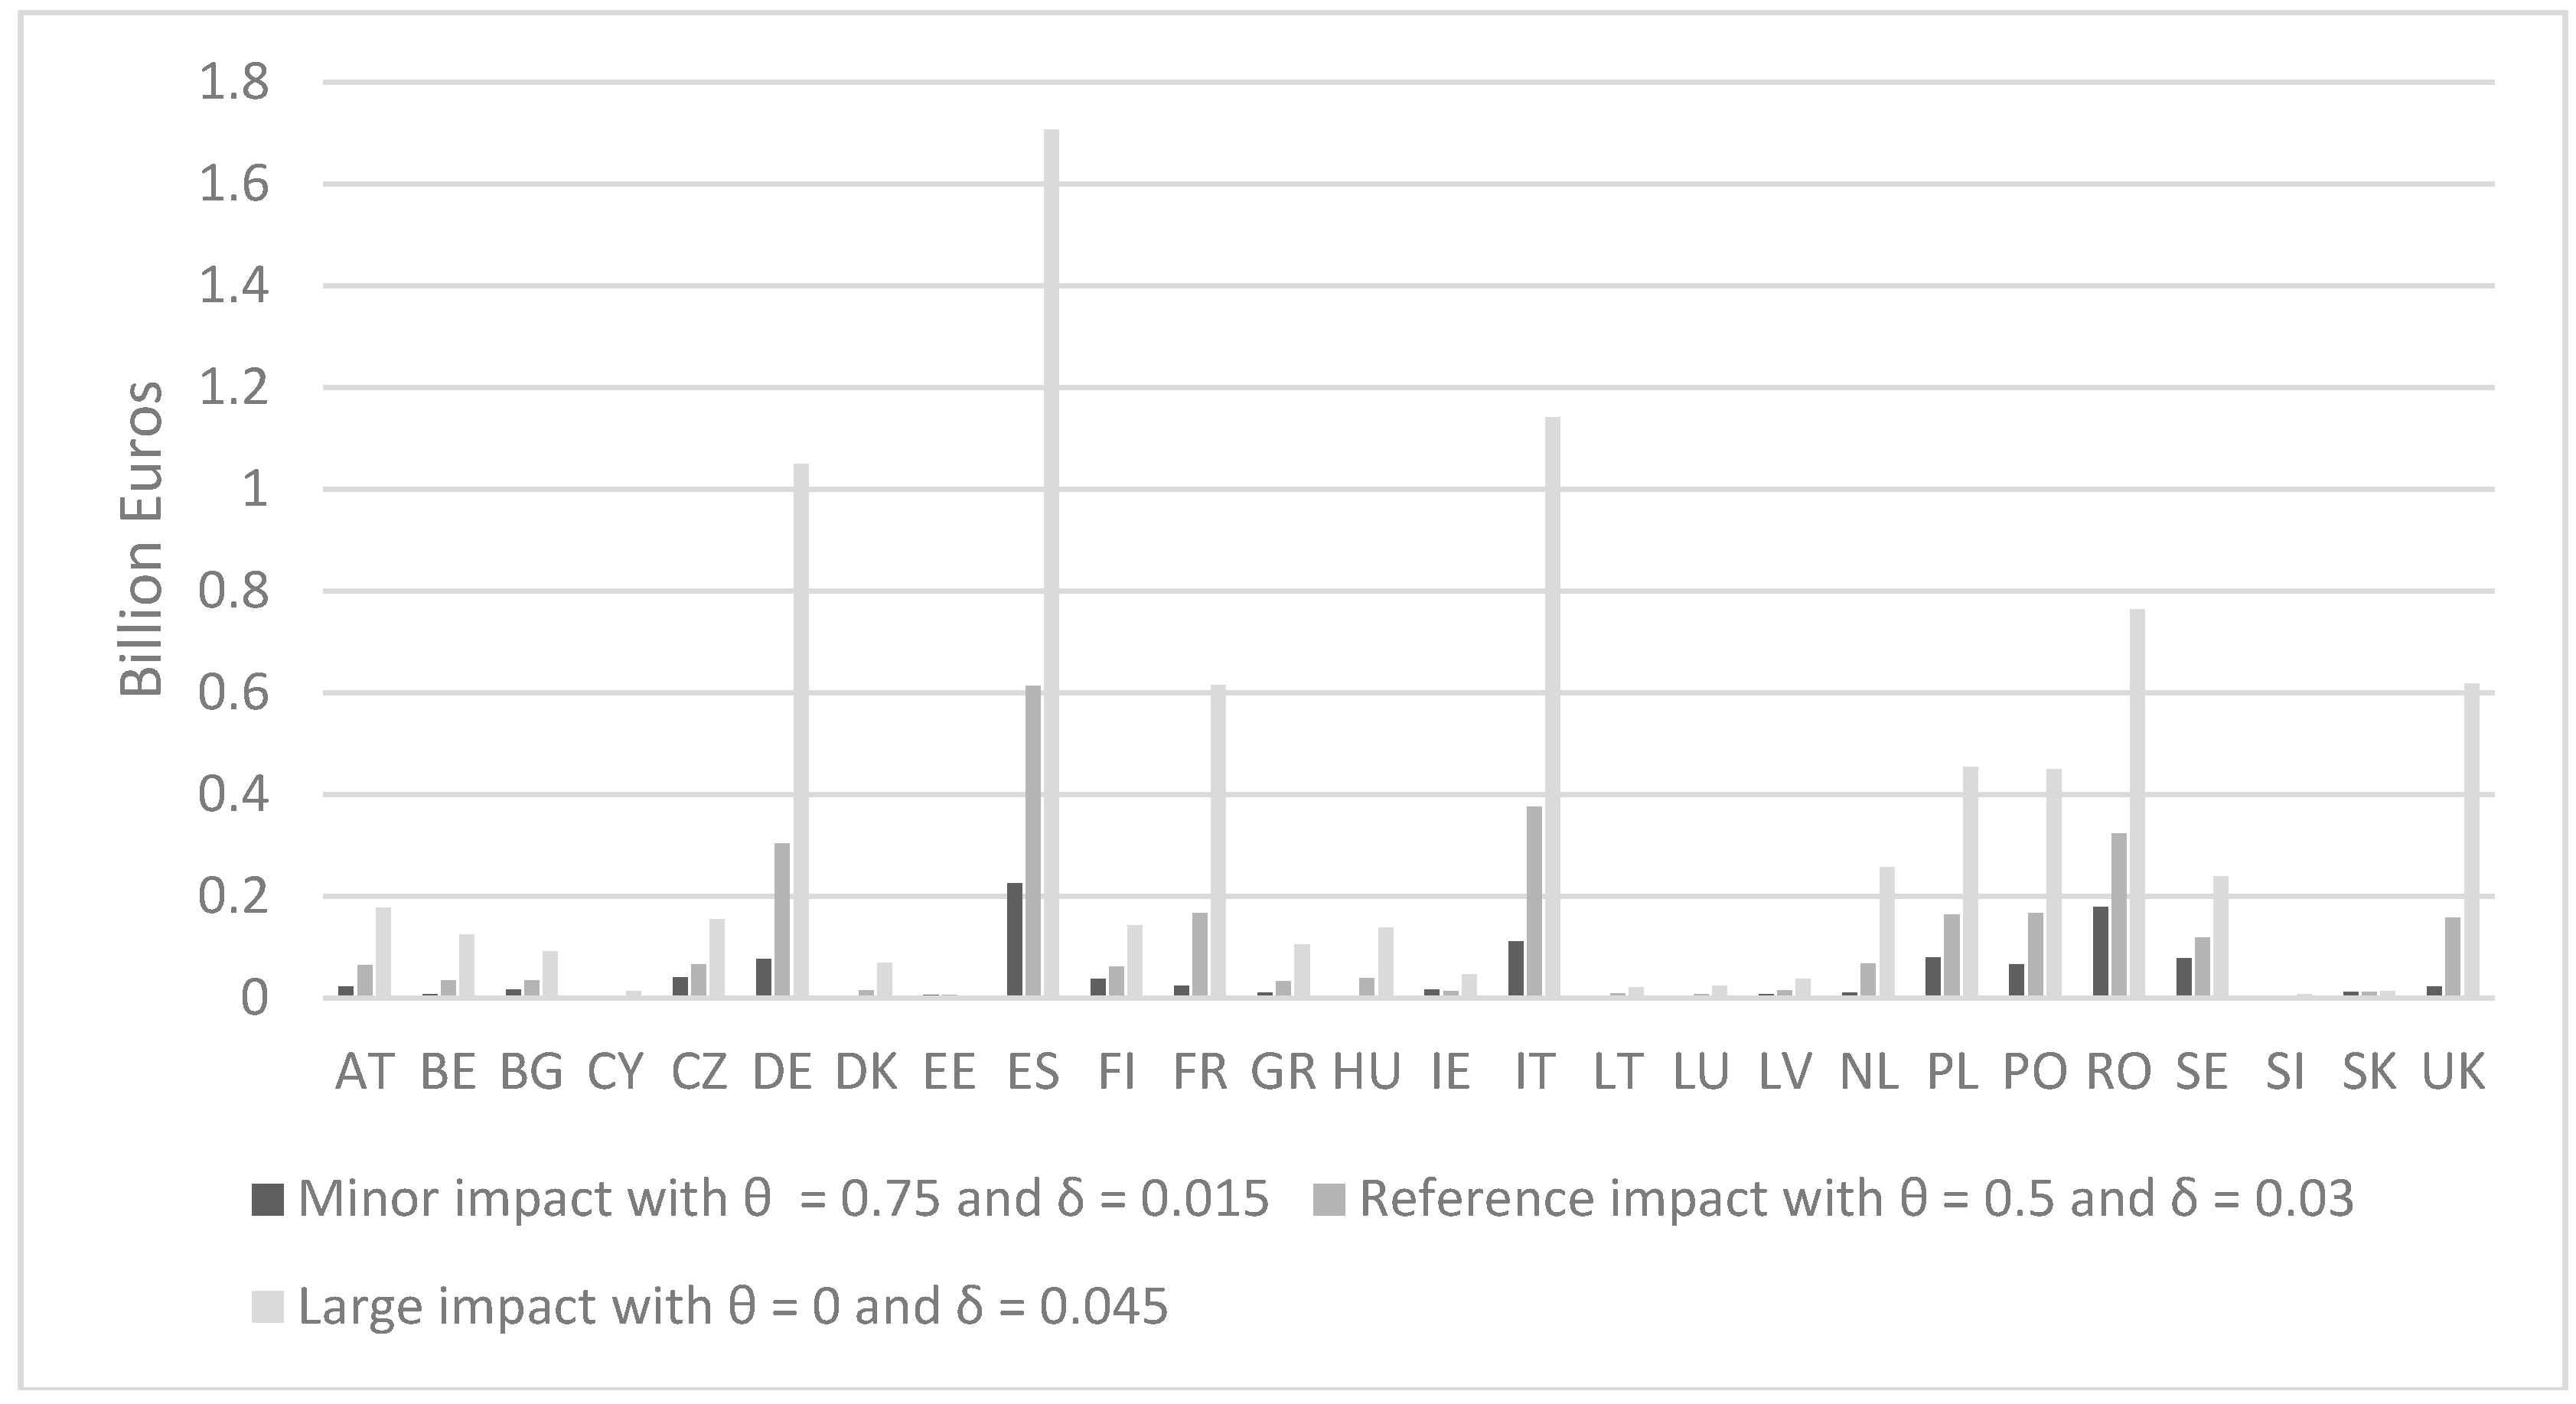
Similar to value of carbon sequestration, the cost of pathogens is unevenly distributed among EU countries (Figure 4).
Countries with large emissions face relatively high costs of pathogens because of the need for higher emission reduction. The allocation effect implies that countries with relatively low costs for carbon sequestration and large areas of infested forest, such as Romania, face high costs of the pathogen. The effective area conversion factor is below 0.90 in the initial year for several countries and is reduced to 0.11 for Romania in the target year (Table A1).
5. Discussion
The value of forest carbon sink and cost of pathogens are affected, not only by assumptions on maximum area of conversion of agricultural land, impact and dispersal rates of pathogens, but also by assumed levels of other parameters. These include choice of discount rate, depreciation of investment in reductions in fossil fuels, costs of afforestation, and intrinsic growth rate and carrying capacity in the forest growth functions. To estimate the sensitivity of our results to the values of these parameters, we have calculated the value of carbon sink and costs of pathogens when the parameter values change with 1/3 of the reference values (Table 3).
As expected, the value of carbon sequestration increases compared with the reference case (416 billion Euros) when the discount rate decreases and forest growth parameters increase. A decrease in the discount rate by 1/3 to 0.01 raises total abatement cost without any carbon sink to 2672 billion Euros, which implies a large value of forest carbon sink, 564 billion Euros, since more costly abatement can be avoided. This effect on the value is larger for increases in forest growth parameters (intrinsic growth rate and carrying capacity) because of the provision of larger amounts of carbon sequestration. The value of forest carbon sequestration is then doubled compared with the reference case.
On the other hand, the value decreases when the depreciation rate of investments in abatement of emissions from fossil fuel is reduced or costs of afforestation are increased. A lower depreciation rate could reflect technological improvement with a higher and longer duration of abatement capacity. If so, the value of carbon sink is lower since the cost of replaced abatement is lower, which implies a lower value of carbon sequestration. A decrease in the depreciation rate from 0.1 to 0.067 reduces the total abatement cost without carbon sink by 35% to 1480 billion Euros, and the value of carbon sink decreases by 64%.
It may seem counterintuitive that the cost of pathogens is relatively high when the value of carbon sequestration is low. The reason is that all possible agricultural land is used for carbon sink when the value is high, which means that changes in pathogen impacts affect only the sequestration at afforested sites. When instead the value is low, pathogen attacks not only impact the sequestration at afforested sites but also reduce the afforested areas because of the lower carbon sequestration effectiveness which makes it more expensive than reductions in emissions from fossil fuels.
The chosen dynamic model with assumptions of logistic forest growth functions could also be subject to discussion. Forecasting forest growth and productivity with the respect to future climate scenarios is usually obtained using process-based models. In this way, forest growth is modelled through eco-physiological processes that depend on environmental variables, e.g., light, temperature, precipitation, nutrients, soil water, competition, etc. [39]. Despite the simplicity, the calculated annual profits from forestry for the entire EU comes close to the average calculated by other studies. It is also interesting to note that the calculated reduction in profits of 4% from the existence of pathogens in EU forests is in the same order of magnitude as the calculations made for nematodes in the EU, where nematode incidences reduce profits with 3.7% [18].
Other assumptions concerned the cost-effective allocation of abatement among EU countries in each time period, which does not hold in practice since the EU emission trading system covers approximately 50% of all emissions, and the remaining abatement requirements are allocated among the countries in the effort sharing burden scheme [40]. The scheme is not based on cost-effectiveness where marginal abatement costs are equal among all countries [38]. Total abatement costs are then higher than in the cost-effective solutions, which is likely to generate higher value of forest carbon sink. Another aspect not considered is the uncertainty in carbon sink enhancement because of changing environmental conditions, which affect the biomass growth and carbon sequestration. In a risk-averse society, such uncertainty reduces the value of forest carbon sink [2] and impacts the cost of pathogens.
6. Conclusions
The calculated annual value of forest carbon sequestration amounted to 11.9 billion Euros, which corresponds to 0.08% of the EU’s total GDP in the reference case with respect to impacts of pathogens. The main part of this value, 83%, was attributed to afforestation and the annual value per ha of afforested land exceeds the rent paid for agricultural land in several countries. Due to the lack of data on impact and dispersal of pathogens, the results rest on strong assumptions on these parameters. The annual value of carbon sequestration ranges between 6.4 and 14.9 billion Euros depending on the assumed impact of pathogens. The results are also sensitive to other parameters than those related to pathogen impact, such as choice of discount rate, costs of reductions in emissions from fossil fuels and afforestation, and parameters in the forest growth functions. In general, factors reducing the cost of abatement of emissions from fossil fuels, increasing the cost of forest carbon sequestration, and/or decreasing forest growth and thereby carbon sequestration reduce the value of carbon sequestration (and vice versa). For example, improved technology for emission reduction reduced the annual value to 4.3 billion Euros but an increase in forest growth by 1/3 would raise the annual value to 23.4 billion Euros.
A robust result is the uneven distribution of the value of forest carbon sequestration and cost of pathogens between countries. Countries with large initial emissions of CO2, such as Germany, Italy and Spain, obtain the largest values because of the replacement of costly abatement of CO2 emissions with less expensive carbon sequestration. These countries also face high costs of pathogens since pathogen incidences reduce carbon sequestration and thereby increases the need for costly CO2 emission reduction. The cost of pathogens are also borne by countries with relatively low costs for carbon sequestration, such as Poland and Romania, since the effectiveness of forest management and afforestation is reduced.
Despite the shortcomings of the model structure and assumptions on parameter values, the calculated annual cost of achieving the EU’s 2050 climate targets without inclusion of carbon sink is close to the costs obtained by other studies [38]. Similarly, the calculated value of forest carbon sink without any pathogen incidences is in the same order of magnitude as the results obtained in the only study with similar calculations [4], but the value decreases by 20% when considering pathogen impact in the reference case. The cost of pathogens on forestry, measured as a percentage reduction in profits without a pathogen incidence, was also close to that obtained by other studies [18].
In the future, our cost estimates for the upper range of the impact and dispersal rate of pathogens may become more relevant when considering climate change. Invasive pathogens are expected to become more aggressive and forests more vulnerable to attacks because of the increased frequency of extreme weather events [41]. If so, the results in this study show that the cost in terms of reductions in carbon sink enhancement can be high, which calls for efficient mitigation measures. The analysis of the cost-effective choice of mitigation measures, such as clear-felling and spraying, and their spatial and dynamic allocation raises the need for improved data, not only on the effects and dispersal of pathogens, but also on the effectiveness and costs of different mitigation measures, which remains an important issue for future research.
Author Contributions
F.-M.G. designed the study, analyzed theoretical and empirical results and wrote the manuscript, A.Z.A. collected data on forest growth, and K.E. provided numerical model codes and contributed to the writing of the manuscript.
Funding
Swedish Formas for the project ‘Responses of European forests and society to invasive pathogens’, grant no. 2013-01880.
Conflicts of Interest
The authors declare no conflict of interest.
Appendix A. Derivation of First-Order Conditions for Cost Minimization
In order to solve the problem described by Equations (1)–(16), we formulate the Lagrangian according to:
where are the co-state variables reflecting the future marginal value of forests through the impact on the forest growth function. The Lagrange multiplier of the CO2e emission constraint denotes the marginal cost of the emission constraint, and show the reduction in total minimum cost for increasing the emission target in (9) by one unit. The associated first-order conditions are:
According to Equation (A2), the cost-effective occurs where the marginal net value, i.e., pi,u, of harvest equals future and current cost of marginal decrease in the value of carbon sink, and in Equation (A2), respectively. The former shows how harvest in one period impacts on forest growth and thereby carbon sequestration in later periods. A marginal change in harvest reduces the productivity and thereby the growth. The current carbon cost of harvest occurs only in the final year because of the emission target only being for this year. Similarly, Equation (A3) shows that optimal takes place where the marginal investment cost equals the value of the marginal impact in period T. Fossil fuel reductions will not take place in time periods when there is no remaining impact in period T. The length of the period between the year of implementation and target year T depends on the depreciation rate βi and abatement cost. A lower rate implies a longer period.
A cost-effective solution requires that the marginal costs of reaching the target, , are equal for all emission reduction options, which implies:
As demonstrated in several studies, Equation (A8) shows that carbon sequestration has a value as an abatement option only if its marginal cost is lower than the marginal cost of emission reduction in fossil fuels [2,3,4]. The higher the marginal cost of emission reduction in fossil fuels, the larger the value of carbon sequestration. In cases of a high depreciation rate of measures reducing fuel emissions, the higher the cost will be. The value is also relatively high for low net benefits from harvest and opportunity cost of afforested land.
Common to all mitigation options is the influence of the discount factor, which affects the timing of the actions. This is shown for afforestation in Equation (A3), from which we have the development of afforestation between any two periods t and t + 1, which is guided by:
The left side of Equation (A9) shows the marginal cost of carbon sequestration with afforestation in period t + 1 and the right side the same for period t. Let us for a moment assume that there is no dispersal in the pathogen and no growth in carbon sequestration, i.e., and . Since , the marginal cost is lower in period t+1 than in period t which gives incentives for delaying carbon sequestration. High discount rate r reduces the cost of future sequestration, which reduces the overall cost of achieving the target. A similar effect is obtained when since carbon sequestration, and therefore lower marginal cost of carbon enhancement, grows over time. On the other hand, an increasing dispersal rate of pathogen implies that (Equation (8)), i.e., that the effective area decreases over time, which raises marginal cost of sequestration over time and creates incentives for early afforestation.
Appendix B

Table A1.
Forest area, % of the total area affected by diseases, forest carbon sink, CO2 emissions from fossil fuels, agricultural area, and carbon sequestration from afforestation in 2015.
Table A1.
Forest area, % of the total area affected by diseases, forest carbon sink, CO2 emissions from fossil fuels, agricultural area, and carbon sequestration from afforestation in 2015.
| Country | Forest Area 1000 ha a | % of Total Forest Area Affected by Pathogen c | Forest Carbon Sink Mill Ton CO2e d | CO2 Emissions from Fossil Fuels j | Agricultural Area, 1000 ha b | Carbon Sequestration from Afforestation, kton/ha j |
|---|---|---|---|---|---|---|
| AT, Austria | 3869 | 2.3 d | 5.14 | 61 | 3358 | 1.57 |
| BE, Belgium | 683 | 0.3 e | 3.65 | 138 | 1828 | 6.34 |
| BG, Bulgaria | 3823 | 3.0 | 10.40 | 49 | 5328 | 2.96 |
| CY, Cyprus | 173 | 3.6 | 0.18 | 8 | 302 | 1.04 |
| CZ, Check | 2667 | 2.3 | 8.76 | 109 | 4283 | 3.20 |
| DE, Germany | 11,419 | 2.4 | 34.95 | 717 | 19,421 | 3.02 |
| DK, Denmark | 544 | 0.6 | 5.90 | 45 | 2939 | 10.69 |
| EE, Estonia | 2232 | 0.2 | 6.34 | 18 | 1333 | 2.52 |
| ES, Spain | 18,418 | 8.4 f | 33.78 | 291 | 20,090 | 1.65 |
| FI, Finland | 22,218 | 0.1 | 35.70 | 57 | 3477 | 2.10 |
| FR, France | 16,989 | 2.4 g | 47.31 | 333 | 30529 | 2.99 |
| GR, Greece | 4054 | 0.02 | 2.52 | 91 | 4577 | 0.54 |
| HU, Hungary | 2069 | 8.2 | 2.97 | 46 | 5916 | 1.26 |
| IE, Ireland | 754 | 0.3 e | 4.30 | 37 | 4384 | 6.42 |
| IT, Italy | 9297 | 8.4 | 30.05 | 392 | 14,100 | 2.90 |
| LT, Lithuania | 2180 | 2.3 | 11.07 | 12 | 3552 | 5.39 |
| LU, Luxembourg | 87 | 0.3 | 0.47 | 11 | 135 | 5.31 |
| LV, Latvia | 3356 | 2.3 h | 16.14 | 8 | 2411 | 5.20 |
| NL, the Netherlands | 376 | 0.3 | 2.42 | 201 | 2288 | 6.27 |
| PL, Poland | 9435 | 1.8 | 30.93 | 303 | 17,513 | 3.45 |
| PT, Portugal | 3182 | 15.2 | 8.18 | 51 | 3136 | 3.75 |
| RO, Romania | 6861 | 19.0 | 23.28 | 80 | 14,177 | 3.22 |
| SE, Sweden | 28,073 | 1.2 | 47.01 | 50 | 4319 | 1.49 |
| SI, Slovenia | 1248 | 0.6 g | 11.96 | 15 | 635 | 11.42 |
| SK, Slovakia | 1940 | 0.6 | 6.53 | 31 | 2260 | 2.89 |
| UK, United Kingdom | 3144 | 0.3 e | 10.47 | 479 | 13,850 | 3.39 |
| Total | 159,091 | 2.4 | 400.91 | 3634 | 186,141 |
Table A2.
Calculations of effective area conversion factors a in EU countries.
| Country | Conversion Factor in the Reference Case When θ = 0.5 and δ = 0.03 | Conversion Factor When θ = 0 and δ = 0.045 | ||
|---|---|---|---|---|
| Initial | In 2050 | Initial | In 2050 | |
| AT, Austria | 0.989 | 0.968 | 0.977 | 0.893 |
| BE, Belgium | 0.999 | 0.996 | 0.997 | 0.986 |
| BG, Bulgaria | 0.985 | 0.958 | 0.970 | 0.860 |
| CY, Cyprus | 0.982 | 0.949 | 0.964 | 0.832 |
| CZ, Czech | 0.989 | 0.968 | 0.977 | 0.893 |
| DE, Germany | 0.988 | 0.966 | 0.976 | 0.888 |
| DK, Denmark | 0.997 | 0.992 | 0.994 | 0.972 |
| EE, Estonia | 0.999 | 0.997 | 0.998 | 0.991 |
| ES, Spain | 0.958 | 0.882 | 0.916 | 0.608 |
| FI, Finland | 1.000 | 0.999 | 0.999 | 0.995 |
| FR, France | 0.988 | 0.966 | 0.976 | 0.888 |
| GR, Greece | 1.000 | 0.999 | 1.000 | 0.999 |
| HU, Hungary | 0.959 | 0.885 | 0.918 | 0.617 |
| IE, Ireland | 0.999 | 0.996 | 0.997 | 0.986 |
| IT, Italy | 0.958 | 0.882 | 0.916 | 0.608 |
| LT, Lithuania | 0.989 | 0.968 | 0.977 | 0.893 |
| LU, Luxembourg | 0.999 | 0.996 | 0.997 | 0.986 |
| LV, Latvia | 0.989 | 0.968 | 0.977 | 0.893 |
| NL, the Netherlands | 0.999 | 0.996 | 0.997 | 0.986 |
| PL, Poland | 0.991 | 0.975 | 0.982 | 0.916 |
| PT, Portugal | 0.924 | 0.786 | 0.848 | 0.291 |
| RO, Romania | 0.905 | 0.733 | 0.810 | 0.113 |
| SE, Sweden | 0.994 | 0.983 | 0.988 | 0.944 |
| SI, Slovenia | 0.997 | 0.992 | 0.994 | 0.972 |
| SK, Slovakia | 0.997 | 0.992 | 0.994 | 0.972 |
| UK, United Kingdom | 0.999 | 0.996 | 0.997 | 0.986 |
a Calculations of based on Equation (8) with share of infested areas from Table A1.
References
- Nabuurs, G.J.; Delacote, P.; Ellison, D.; Hanewinkel, M.; Hetemäki, L.; Lindner, M.; Ollikainen, M. By 2050 the mitigation effects of EU forests could nearly double through climate smart forestry. Forests 2017, 8, 2–14. [Google Scholar] [CrossRef]
- Gren, M.; Carlsson, M.; Elofsson, K.; Munnich, M. Stochastic carbon sinks for combating carbon dioxide emissions in the EU. Energy Econ. 2012, 34, 1523–1531. [Google Scholar] [CrossRef]
- Michetti, M.; Rosa, R. Afforestation and timber management compliance strategies in climate policy. A computable general equilibrium analysis. Ecol. Econ. 2012, 77, 139–148. [Google Scholar] [CrossRef] [Green Version]
- Munnich-Vass, M.; Elofsson, K. Is forest carbon sequestration at the expense of bioenergy and forest products cost-efficient in EU climate policy to 2050? J. For. Econ. 2016, 24, 82–105. [Google Scholar]
- Kovalcík, M. Profitability and competitiveness of forestry in European countries. J. For. Sci. 2011, 57, 369–376. [Google Scholar] [CrossRef] [Green Version]
- van Kooten, G.C.; Laaksonen-Craig, S.; Wang, Y. Carbon offset credits via forestry activities: A meta-regression analysis. Can. J. For. Res. 2009, 39, 2153–2167. [Google Scholar] [CrossRef]
- Ennos, R.A. Resilience of forests to pathogens: An evolutionary ecology perspective. Forests 2015, 88, 41–45. [Google Scholar] [CrossRef]
- Gonthier, P.; Nicolotti, G.; Linzer, R.; Guglielmo, F.; Garbelotto, M. Invasion of European pine stands by a North American forest pathogen and its hybridization with a native interfertile taxon. Mol. Ecol. 2007, 16, 1389–1400. [Google Scholar] [CrossRef] [PubMed]
- Santini, A.; Ghelardini, L.; De Pace, C.; Desprez-Loustau, M.L.; Capretti, P.; Chandelier, A.; Cech, T.; Chira, D.; Diamandis, S.; Gaitniekis, T.; et al. Biogeographical patterns and determinants of invasion by forest pathogens in Europe. N. Phytol. 2013, 197, 238–250. [Google Scholar] [CrossRef] [PubMed]
- Gheraldini, L.; Luchi, N.; Pecori, F.; Pepori, A.; Danti, R.; Rocca, G.; Capretti, P.; Tsopelas, P.; Santini, A. Ecology of invasive forest pathogens. Biol. Invasions 2017, 19, 3183–3200. [Google Scholar]
- Hicke, J.; Allen, C.; Desai, A.; Dietze, M.; Hall, R.; Kashian, D.; Moore, D.; Raffa, K.; Sturrock, R.; Vogelmann, J. Effects of biotic disturbances on forest carbon cycling in the United States and Canada. Glob. Chang. Biol. 2012, 18, 7–34. [Google Scholar] [CrossRef]
- Freer-Smith, H.P.; Webber, F.J. Tree pests and diseases: The threat to biodiversity and the delivery of ecosystem services. Biodivers. Conserv. 2017, 26, 3167–3181. [Google Scholar] [CrossRef]
- Gilligan, C.; Fraser, R.; Godfray, C.; Hanley, N.; Leather, S.; Meagher, T.; Mumford, T.; Petts, J.; Pidgeon, N.; Potter, C. Tree Health and Plant Biosecurity Expert Taskforce; Final Report; Department for the Environment, Food and Rural Affairs: London, UK, 2013.
- Campbell, F.T.; Schlarbaum, S.E. Fading Forests: North American Trees and the Threat of Exotic Pests; Natural Resources Defense Council: New York, NY, USA, 1994; p. 47. [Google Scholar]
- Gren, I.-M.; Isacs, L.; Carlsson, M. Costs of alien invasive species in Sweden. Ambio 2009, 38, 135–141. [Google Scholar] [CrossRef] [PubMed]
- Haight, R.; Homans, F.; Horie, T.; Mehta, S.; Smith, D.; Venette, R. Assessing the cost of an invasive forest pathogen: A case study with oak wilt. Environ. Manag. 2011, 47, 506–517. [Google Scholar] [CrossRef] [PubMed]
- Pimentel, D.; McNair, S.; Janecka, J.; Wightman, J.; Simmonds, C.; O’Connell, C.; Wong, E.; Russel, L.; Zern, J.; Aquino, T.; et al. Economic and environmental threats of alien plant, animal, and microbe invasions. Agric. Ecosyst. Environ. 2001, 84, 1–20. [Google Scholar] [CrossRef]
- Soliman, T.; Mourits, M.C.; Van Der Werf, W.; Hengeveld, G.M.; Robinet, C.; Lansink, A.G.O. Framework for modelling economic impacts of invasive species, applied to pine wood nematode in Europe. PLoS ONE 2012, 7, e45505. [Google Scholar] [CrossRef] [PubMed]
- Jung, M. The role of forestry projects in the clean development mechanism. Environ. Sci. Policy 2005, 8, 87–104. [Google Scholar] [CrossRef]
- Tavoni, M.; Sohngen, B.; Bosetti, V. Forestry and the carbon market response to stabilise climate. Energy Policy 2007, 35, 5346–5353. [Google Scholar] [CrossRef] [Green Version]
- Bosetti, V.; Lubowski, R.; Golub, A.; Markandya, A. Linking reduced deforestation and a global carbon market: Implications for clean energy technology and policy flexibility. Environ. Dev. Econ. 2011, 16, 479–505. [Google Scholar] [CrossRef]
- Gren, I.-M.; Carlsson, M. Economic value of carbon sequestration in forests under multiple sources of uncertainty. J. For. Econ. 2013, 19, 174–189. [Google Scholar] [CrossRef]
- Elofsson, K.; Gren, I.-M. Cost-efficient climate policies for interdependent carbon pools. Environ. Model. Softw. 2018, 101, 86–101. [Google Scholar] [CrossRef]
- Sache, I.; Roy, A.-S.; Suffert, F.; Desprez-Loustau, M.-L. Invasive plant pathogens in Europe. In Biological Invasions: Economic and Environmental Costs of Alien Plant, Animal, and Microbe Species; Pimentel, D., Ed.; CRC Press: Boca Raton, FL, USA, 2011. [Google Scholar]
- Macpherson, M.; Kleczkowski, A.; Healy, J.; Hanley, N. The effects of disease on optimal forest rotation: A generalizable analytical framework. Environ. Resour. Econ. 2018, 70, 565–588. [Google Scholar] [CrossRef]
- Macpherson, M.; Kleczkowski, A.; Healy, J.; Hanley, N. Payment for multiple forest benefits alters the effect of tree disease on optimal forest rotation length. Ecol. Econ. 2017, 134, 82–94. [Google Scholar] [CrossRef] [PubMed]
- McCallum, H.; Barlow, N.; Hone, J. How should pathogen transmission be modelled? Trends Ecol. Evol. 2001, 16, 295–300. [Google Scholar] [CrossRef]
- Gren, I.-M.; Aklilu, A.; Elofsson, K. Forest Pathogens and the Costs of EU 2050 Climate Policy; Working Paper; Department of Economics, Swedish University of Agricultural Sciences: Uppsala, Sweden, 2018. [Google Scholar]
- Eurostat. Forest Statistics. 2018. Available online: http://ec.europa.eu/eurostat/statistics-explained/images/8/80/T1_Forest_area_and_ownership%2C_2010_and_2015.png (accessed on 12 October 2016).
- United Nations Framework Convention on Climate Change (UNFCCC). National Inventory Submission. Available online: https://unfccc.int/process/transparency-and-reporting/reporting-and-review-under-the-convention/greenhouse-gas-inventories/submissions-of-annual-greenhouse-gas-inventories-for-2017/submissions-of-annual-ghg-inventories-2015 (accessed on 16 February 2017).
- Evans, A.M. The speed of invasion: Rates of spread of thirteen exotic forest insects and diseases. Forest 2016, 7, 1–11. [Google Scholar] [CrossRef]
- European Forest Inventory (EFI). Available online: http://www.efi.int/portal/virtual_library/databases/ (accessed on 7 March 2016).
- Eurostat. Greenhouse gas emissions. Available online: http://ec.europa.eu/eurostat/tgm/table.do?tab=table&init=1&language=en&pcode=tsdcc100&plugin=1 (accessed on 9 May 2018).[Green Version]
- World Bank. Available online: https://data.worldbank.org/region/european-union (accessed on 24 April 2018).
- Eurostat. Available online: http://ec.europa.eu/eurostat/statistics-explained/index.php?title=File:Land_cover,_2015.png (accessed on 13 July 2018).
- Boardmann, A.; Greenberg, D.; Vining, A.; Weimer, D. Cost Benefit Analysis, 4th ed.; Cambridge University Press: New York, NY, USA, 2014. [Google Scholar]
- Rosenthal, R. Gams—A User’s Guide; GAMS Development Corporation: Washington, DC, USA, 2008. [Google Scholar]
- Capros, P.; Paroussos, L.; Fragkos, P.; Tsani, S.; Boitier, B.; Wagner, F.; Busch, S.; Resch, G.; Blesl, M.; Bollen, J. European decarbonisation pathways under alternative techno logical and policy choices: A multi-model analysis. Energy Strategy Rev. 2014, 2, 231–245. [Google Scholar] [CrossRef]
- Peters, E.; Wythers, K.; Bradford, J.; Reich, P. Influence of disturbance on temperate forest productivity. Ecosystems 2013, 16, 95–110. [Google Scholar] [CrossRef]
- EC. 2050 Low Carbon Economy. Available online: https://ec.europa.eu/clima/policies/strategies/2050_en (accessed 10 May 2018).
- Early, R.; Bradley, B.A.; Dukes, J.S.; Lawler, J.J.; Olden, J.D.; Blumenthal, D.M.; Gonzalez, P.; Grosholz, E.D.; Ibanez, I.; Miller, LP.; et al. Global threats from invasive alien species in the twenty-first century and national response capacities. Nat. Commun. 2016, 7, 12485. [Google Scholar] [CrossRef] [PubMed] [Green Version]
- European Environment Agency (EEA). European forest types. Available online: http://www.eea.europa.eu/publications/technical_report_2006_9 (assessed on 12 October 2016).
Figure 1.
Cost-effective development of reduction in CO2 from fossil fuel to meet the EU’s 2050 climate target under different carbon sink options in the reference case of forest pest attacks.
Figure 1.
Cost-effective development of reduction in CO2 from fossil fuel to meet the EU’s 2050 climate target under different carbon sink options in the reference case of forest pest attacks.

Figure 2.
Discounted average annual value of carbon sink enhancement with all options and only afforestation in EU countries in the reference case of pathogen disease. (AT, Austria; BE, Belgium; BG, Bulgaria; CY, Cyprus; CZ, Check Republic; DE, Germany; DK, Denmark; FI, Finland; FR, France; GR, Greece; HU, Hungary; IE, Ireland; LT, Lithuania; LU, Luxemburg; LV, Latvia; NL, the Netherlands; PL, Poland; PO, Portugal; SE, Sweden; SI, Slovenia; SK, Slovakia; UK, United Kingdom)

Figure 3.
Discounted total value of carbon sequestration by afforestation on different areas measured as % of total agricultural land in the EU.
Figure 3.
Discounted total value of carbon sequestration by afforestation on different areas measured as % of total agricultural land in the EU.
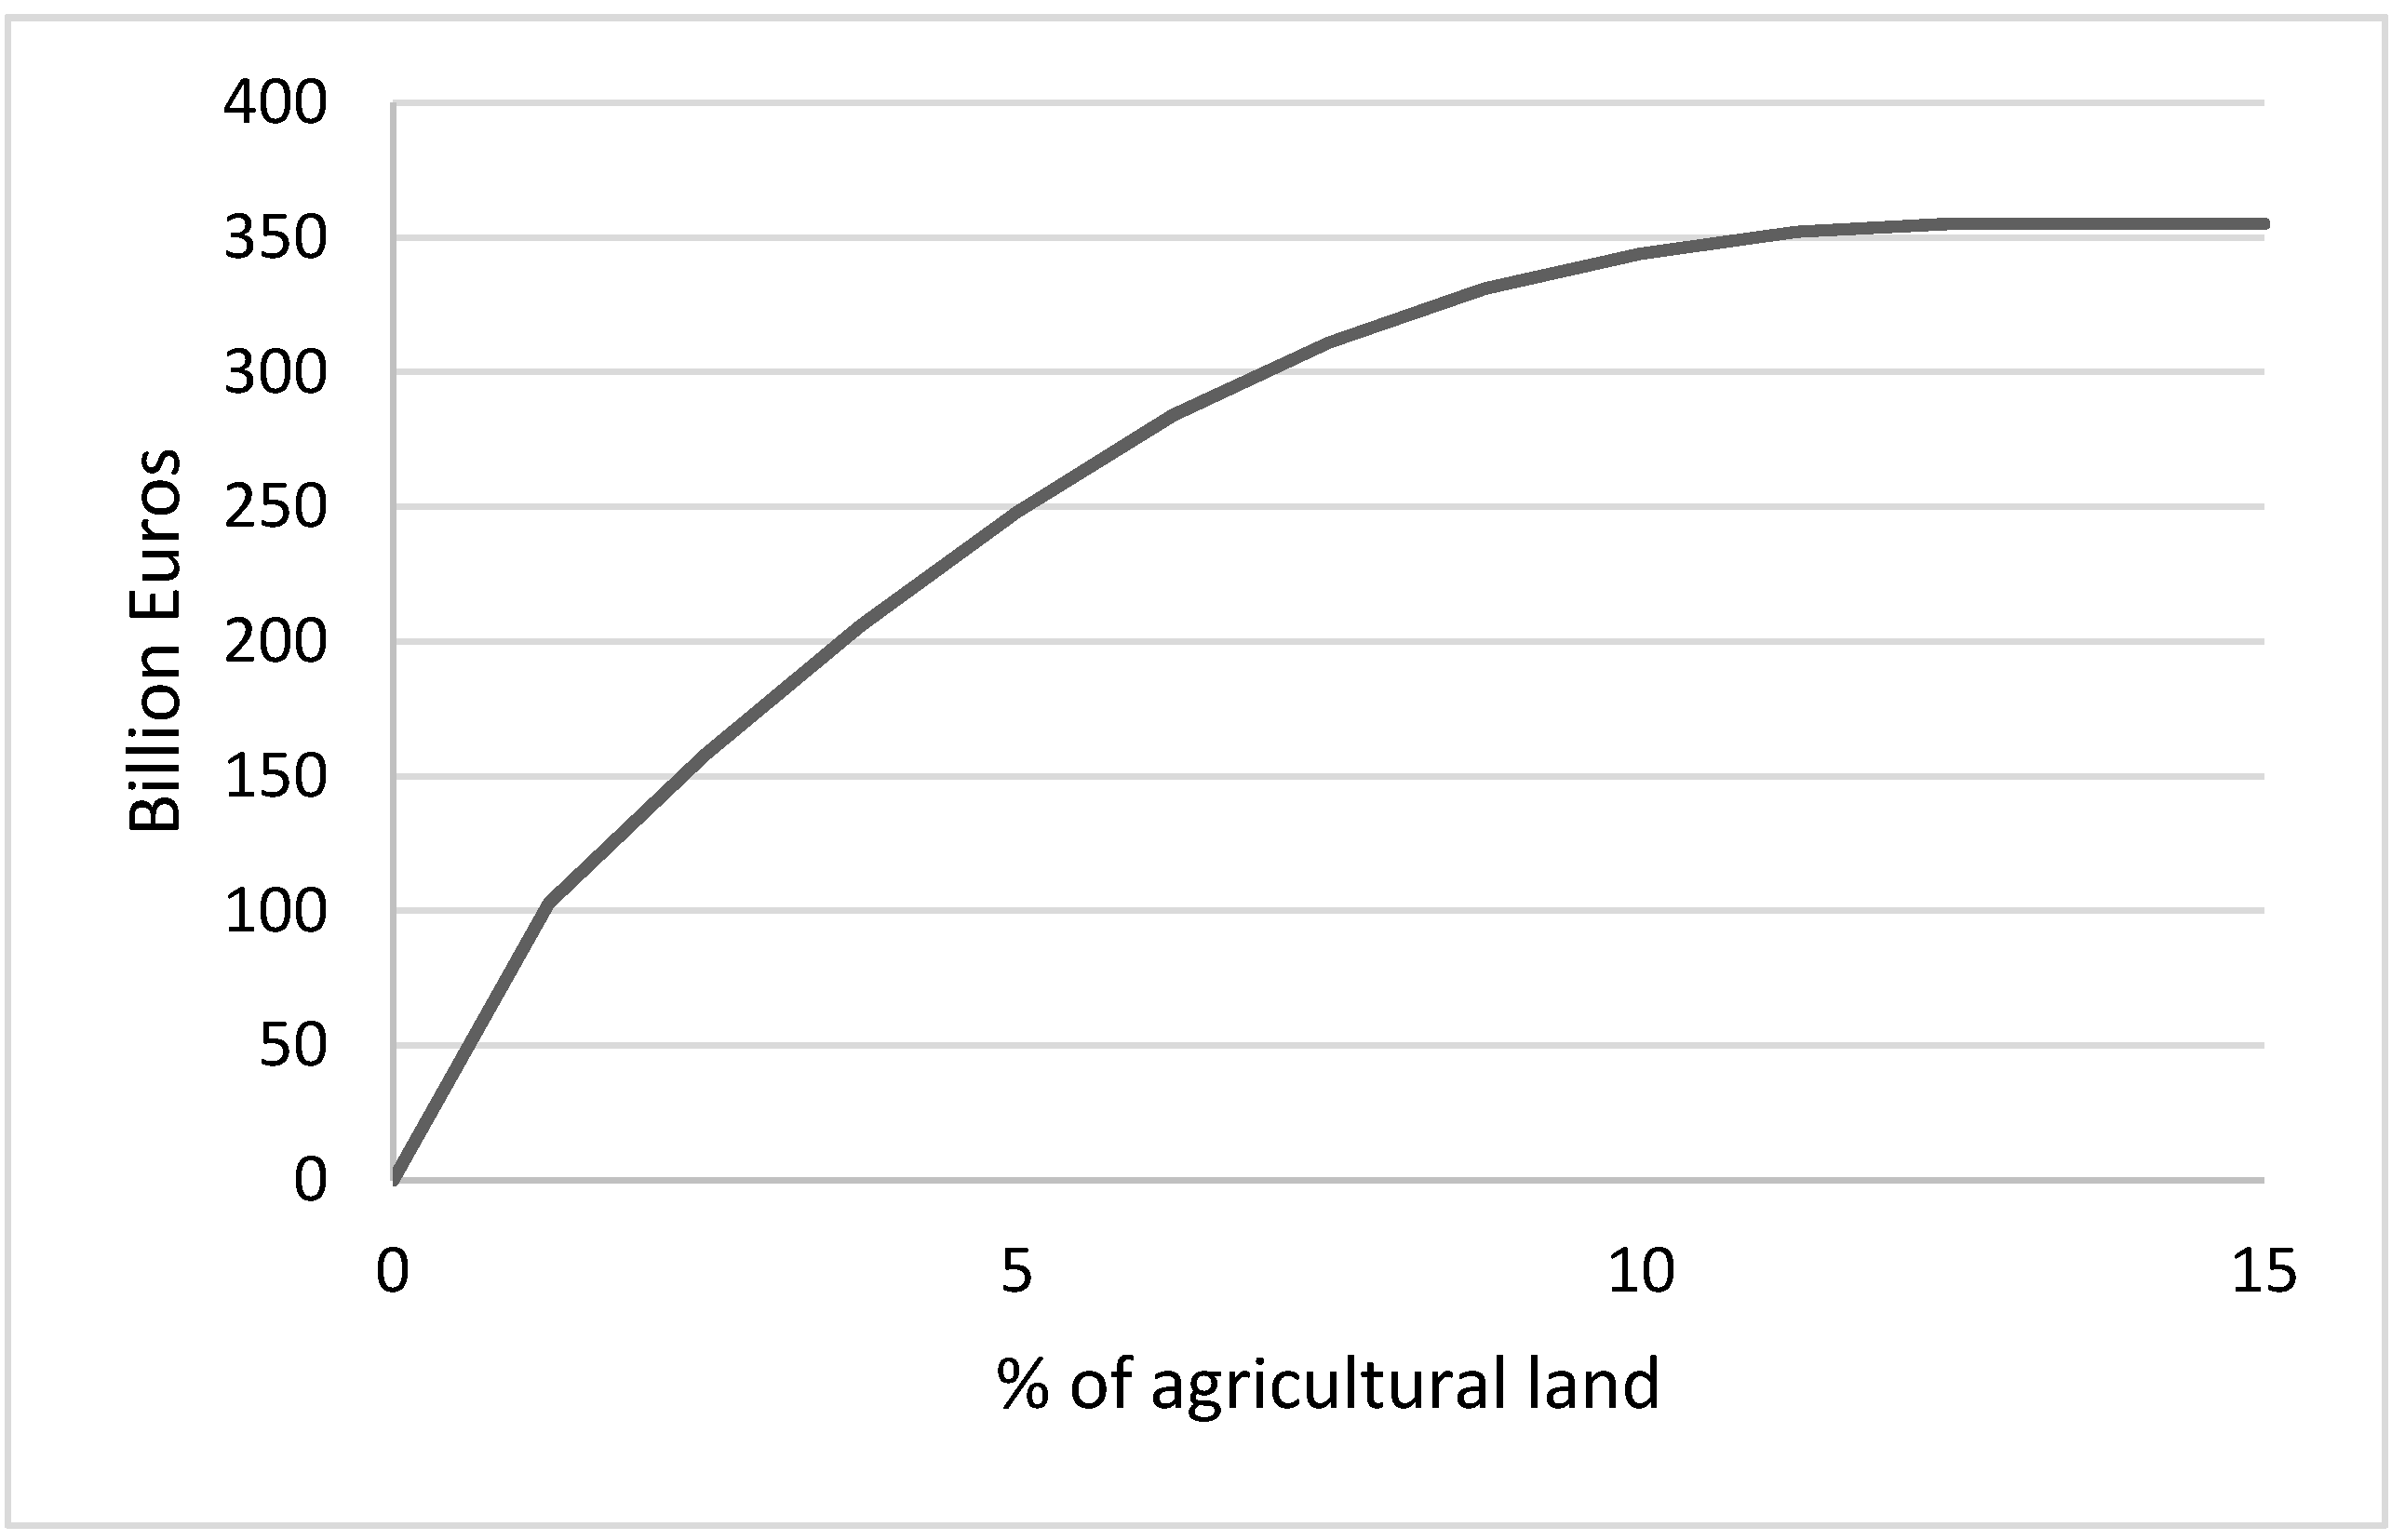
Figure 4.
Discounted average annual costs of pathogens for EU countries under different combinations of equivalence area, θ, and dispersal rate, δ. See Figure 2 for country abbreviations.
Figure 4.
Discounted average annual costs of pathogens for EU countries under different combinations of equivalence area, θ, and dispersal rate, δ. See Figure 2 for country abbreviations.

Table 1.
Minimum cost for reaching EU’s 2050 climate target under different forest carbon sink options, billion Euros.
Table 1.
Minimum cost for reaching EU’s 2050 climate target under different forest carbon sink options, billion Euros.
| No Sink | With Sink | ||
|---|---|---|---|
| All Options | Only Afforestation | ||
| Total Cost | 2266 | 1850 | 1922 |
| Value of Carbon Sink | 416 | 344 | |
Table 2.
Total discounted value of forest carbon sequestration and costs of pathogens under different assumptions of equivalence area of infested forests, θ, and dispersal rate of pathogens, δ, billion Euros.
Table 2.
Total discounted value of forest carbon sequestration and costs of pathogens under different assumptions of equivalence area of infested forests, θ, and dispersal rate of pathogens, δ, billion Euros.
| Equivalence Area | Dispersal Rate | Equivalence and Dispersal Rate | ||||
|---|---|---|---|---|---|---|
| θ = 0.75 | θ = 0 | δ = 0.015 | δ = 0.045 | θ = 0.75 | θ = 0 | |
| δ = 0.015 | δ = 0.045 | |||||
| Value of Carbon Sequestration | 464 | 315 | 446 | 373 | 483 | 224 |
| Cost of Pathogen | 57 | 206 | 75 | 148 | 38 | 297 |
Table 3.
Value of forest carbon sink and cost of pathogens for changes in parameters with 1/3 from the reference case.
Table 3.
Value of forest carbon sink and cost of pathogens for changes in parameters with 1/3 from the reference case.
| Discount Rate Is 0.01 | Depreciation Rate Is 0.067 | 33% Increase in Cost of Afforestation | 33% Increase in Intrinsic Growth Rate and Carrying Capacity | |
|---|---|---|---|---|
| Value of Carbon Sink | 564 | 150 | 387 | 822 |
| Costs of Pathogens | 53 | 80 | 98 | 52 |
© 2018 by the authors. Licensee MDPI, Basel, Switzerland. This article is an open access article distributed under the terms and conditions of the Creative Commons Attribution (CC BY) license (http://creativecommons.org/licenses/by/4.0/).
Share and Cite
MDPI and ACS Style
Gren, I.-M.; Aklilu, A.Z.; Elofsson, K. Forest Carbon Sequestration, Pathogens and the Costs of the EU’s 2050 Climate Targets. Forests 2018, 9, 542. https://doi.org/10.3390/f9090542
AMA Style
Gren I-M, Aklilu AZ, Elofsson K. Forest Carbon Sequestration, Pathogens and the Costs of the EU’s 2050 Climate Targets. Forests. 2018; 9(9):542. https://doi.org/10.3390/f9090542
Chicago/Turabian StyleGren, Ing-Marie, Abenezer Zeleke Aklilu, and Katarina Elofsson. 2018. "Forest Carbon Sequestration, Pathogens and the Costs of the EU’s 2050 Climate Targets" Forests 9, no. 9: 542. https://doi.org/10.3390/f9090542
Note that from the first issue of 2016, this journal uses article numbers instead of page numbers. See further details here.