Detecting the Competition between Moso Bamboos and Broad-Leaved Trees in Mixed Forests Using a Terrestrial Laser Scanner

1
International Center for Bamboo and Rattan, State Forestry Administration Key Laboratory of Bamboo and Rattan, Beijing 100102, China
2
CASIC Intelligence Industry Development Co., Ltd., Beijing 100854, China
*
Author to whom correspondence should be addressed.
Forests 2018, 9(9), 520; https://doi.org/10.3390/f9090520
Submission received: 9 August 2018
/
Revised: 23 August 2018
/
Accepted: 24 August 2018
/
Published: 29 August 2018
(This article belongs to the Special Issue Using LiDAR and Optical Imagery to Map Forest Vegetation for Assessing Wildlife Habitat)
Abstract
:The growth of individual trees in a forest is affected by many factors, a crucial one being the intensity of competition among trees, because it affects the spatial structure of the forest and is in turn influenced by silvicultural practices. In a mixed forest in particular, the growth of trees is affected by multiple interactions. To analyse the competition between moso bamboo (Phyllostachys pubescens (Pradelle) Mazel ex J.Houz.) and broad-leaved trees in a mixed forest, data were extracted by sampling six spots within such a forest using terrestrial laser scanning (TLS). The convex hull algorithm was used for calculating the overlap volume between the crowns of the broad-leaved trees and the bamboo canopy. Bamboos growing at least 3 m away from any of the broad-leaved trees were the most numerous and the diameter at breast height (DBH) is larger than those growing closer than that, which suggests that broad-leaved trees suppressed the growth of bamboo if they are closer but promote it beyond 3 m up to a point at which the distance is too great for any such effect. The modified Hegyi’s competition index was constructed based on the canopy factor, which may better describe the competitive interaction among the trees and bamboos. Using TLS can enhance our understanding of the competition among trees in mixed forests and help in planning the spatial structure of such forests in general and provide a benchmark for choosing planting distances in particular.
1. Introduction
Moso bamboo (Phyllostachys pubescens (Pradelle) Mazel ex J.Houz.) is extensively distributed in south-eastern and southern Asia, important to the global carbon cycle and water conservation, and also an important forest species because it grows fast and has a short life cycle. Bamboo is well known for rapid accumulation of biomass, high annual output of timber, and as a source of food in the form of tender bamboo shoots. Improving the operating efficiency and economic returns from bamboo forests is, therefore, important, which among other things, requires suitable methods to examine and monitor bamboos growing in forests—methods that are efficient, feasible, and accurate. Traditional ways of managing forests of pure bamboo have resulted in the decline of the sites of such forests, lower soil fertility, and increasing damage by pests and diseases, whereas many recent studies have shown that mixed forests comprising bamboo and broad-leaved trees are conducive to maintaining ecosystem balance, improving stand structure, and increasing soil fertility [1]. Studying the relationship between broad-leaved trees and bamboo in such mixed forests will help to manage them efficiently and to obtain higher economic returns.
The growth of individual trees, whether in pure stands or mixed stands, is affected by many factors and by the interactions between those factors, including climate, site conditions, the ontogenetic stage, and competition [2]. The structure of plant communities is shaped by competitive interactions among individual plants [3,4]. In a forest, these interactions determine the size and the position of individual canopies in the overall forest canopy, which affects light interception, photosynthesis, growth, and the survival of individual plants [5]. Thus, competition among canopies of individual trees significantly affects virtually every benefit we derive from forest ecosystems [6].
In establishing new forests, it is easy to choose a pattern in which a few broad-leaved trees are surrounded by bamboo. The canopy of broad-leaved trees is the dominant layer in mixed forests of bamboo and broad-leaved trees, and competition between these two components means that one bamboo or broad-leaved tree affects the viability and growth of another. The shape of the crown and the photosynthetic efficiency of a broad-leaved tree and the space it occupies can change the competitive ability of a bamboo plant. Crown characteristics provide insights into the process of absorption and consumption of nutrients by individual trees, which also affect their competitive ability. An index of competition based on canopy can reflect such competition between trees better than the indexes based on other characteristics [7]. The spatial structures of bamboos and broad-leaved trees in mixed forests are more distinct than those in other types of forest.
Field measurements provide the largest and most important dataset for forest surveys, and the assessment of tree metrics is essential in evaluating forests. However, such measurements require a great deal of time and labour, which is why automated methods of collecting such data are urgently required. One such method, namely terrestrial laser scanning (TLS)—which is efficient, objective, non-destructive, and accurate—has been used extensively. The method also makes it possible to acquire three-dimensional (3D) data, inventories, and data on canopy characteristics [8,9,10,11,12,13]. Many studies show that point clouds obtained from TLS can extract such details as the diameter at breast height (DBH) and at other heights, the positions of individual trees [14,15], and trunk volume [16]. In addition, trunk biomass [12], leaf area index [17], and the surface area and volume of the canopy can also be estimated using TLS [18], which gives results accurate to the nearest millimetre [19]. Compared with the cumbersome traditional forestry surveys, which cannot accurately extract the information of the tree canopy, the application of TLS provides a new option for measuring the size and shape of crown [20]. Compared to the cumbersome traditional forestry surveys, which cannot offer any reliable estimates of the tree canopy, TLS offers an easier way for measuring the size and the shape of a tree crown quickly and accurately.
It is against this background that the present study sought to quantify the crowns of broad-leaved trees in mixed forests and to assess the effect of the canopy on the growth of bamboo [11,13]. More specifically, the study aimed at (1) constructing an index of competition between broad-leaved trees and bamboos based on the canopy characteristics of the broad-leaved trees and (2) analysing this competition relationship between broad-leaved trees and bamboos.
2. Materials and Methods
2.1. Materials
2.1.1. Study Area
The study was conducted in a mixed forest around Yixing city (31°07′–31°37′ N, 119°31′–120°03′ E) in Jiangsu province in southern China. The area has a subtropical monsoon climate, warm and humid throughout the year, with a mean annual temperature of 15.7 °C and mean annual precipitation of 1177 mm. The individual growth period is up to 250 days. The soil at the site is fertile, comprising mostly yellow earth and supporting many plants species including such broad-leaved trees represented by Quercus, Cyclobalanopsis, Castanopsis, Liguistrun, Dalbergia, Rhus, and Celtis and conifers represented by Casuarina and Cunninghamia. Bamboo is widely distributed throughout the sample plots. Six spots, each measuring 20 m × 20 m, were chosen as a sample from the same mixed forest of bamboo and broad-leaved trees, such that no spot was closer than 20 m from any of the other plots. Care was taken to ensure that no sample was affected by any broad-leaved trees outside the sampled area. The forest patches selected in this study had received only low-intensity management and the soil throughout the site was homogeneous.
2.1.2. Terrestrial Laser Scanning (TLS)
A TLS system comprises a laser ranging subsystem and a scanning subsystem, together with a charge-coupled device (CCD) for digital photography and an internal control and correction subsystem, and can acquire complete 3D point-cloud data, simulate a real scene in three dimensions, and construct a virtual 3D model of the observed object. In TLS, distances are measured mainly in two ways, namely a time-of-flight measurement (ToF) and a phase measurement (PS). The first method measures the distance by noting the time taken by an emitted signal pulse to return to the point of its origin after being reflected by the distant object and is based on the speed of light. The method is effective for distances from a few hundred metres to several kilometres but is less accurate for greater distances than for smaller distances. The second method uses continuous high-frequency emissions of laser beams and beam amplitude modulation for measuring distances and is accurate to the nearest millimetre for distances up to 100 m (Table 1).
TLS is a non-contact active measurement system that calculates the distance between the instrument and the target, the horizontal scan angle, and the vertical scan angle by emitting a laser pulse from a laser pulse diode and receiving the reflected laser pulse from the detector. In the present study, we used a Trimble TX8 3D scanner (Trimble, Sunnyvale, CA, USA) mounted on a tripod at a mean height of 1.3 m above the ground, resulting in a 360° horizontal field of view and a 317° vertical field of view, which were scanned at the rate of one million measurements in about a second. The instrument can complete the scans in a short time and is highly accurate within a range of 300 m. The maximum range can be set to 120 m, which corresponds to a scanning time of 2 or 3 or 10 min, or to 340 m, which corresponds to a scanning time of 14 min. Table 2 gives more details about the instrument’s performance.
2.2. Methods
2.2.1. Data Collection and Data Processing
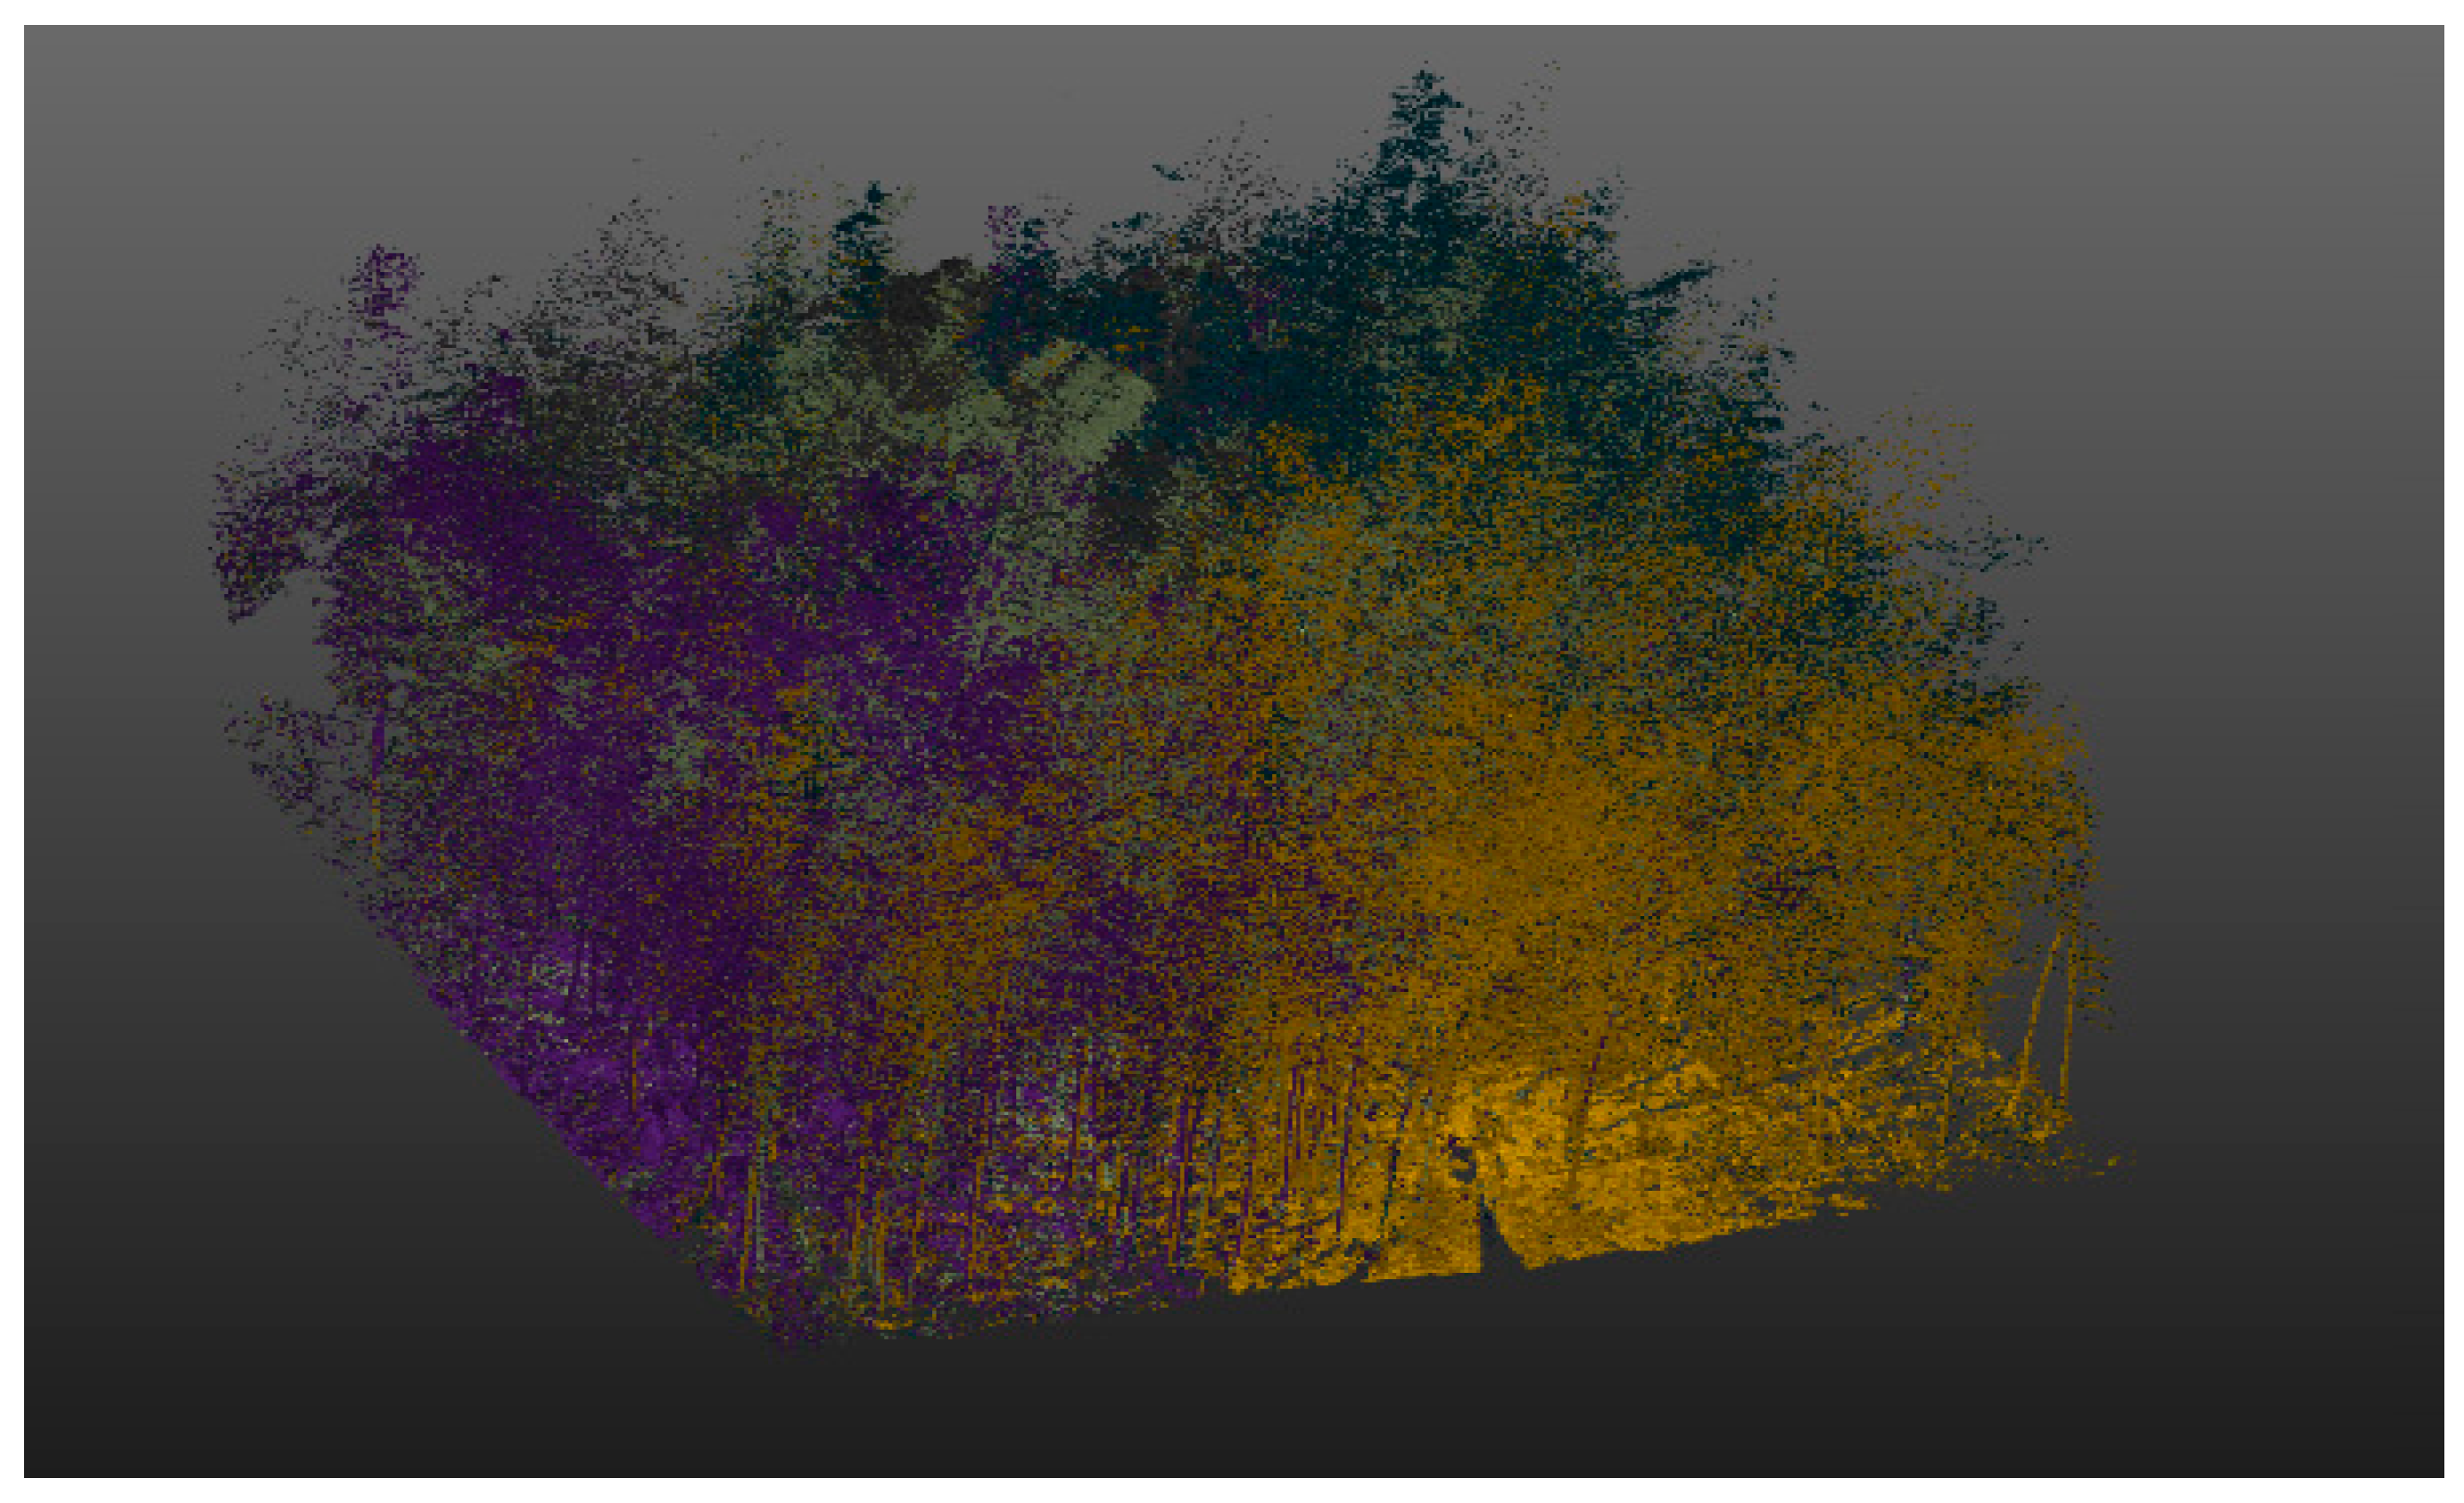
To scan six samples in a multi-scan mode, one station was located at the centre of a given spot and multiple stations were set around the centre. The maximum measurement distance of the scanning station was set to 120 m and the scanning time was set to 3 min. The point-cloud data of the sample were divided with reference to the sample boundary. In all, six samples were measured with 4–6 separate scanning positions. Figure 1 shows a sample, which displays the point cloud extracted by different scanning stations in different colours.
We also placed 5–7 reference balls at different heights for each sample and made sure that at least three reference balls could be scanned from each station. All point-cloud data were imported into Trimble RealWorks ver. 10.1 (Trimble, Sunnyvale, CA, US), which can provide automatic identification of target spheres and registration to obtain complete cloud data by splicing together the point-cloud data acquired by each scanning station. The stitching error for the scanning station and the reference ball in each sample is very small (Table 3).
The laser pulse may reflect some uncertain echo points because of some unavoidable factors such as the shape, texture, and direction of the surface of the target tree, the testing conditions, and the environment around the scanner. Those echo points that did not correspond to any target in the 3D space were filtered out. TLS gives dense point clouds and voluminous data, and it takes a great deal of time and effort to process the data. Therefore, the random sampling feature in Trimble RealWorks ver. 10.1 was used for reducing the point cloud to 10% of its original cloud points.
We used a broad-leaved tree as the centre and counted the number of bamboo within concentric circles of different radii and then determined the number of bamboo per unit area by subtracting the number of bamboo with a radius of n − 1 meters from the number of bamboos within a radius of n meters. The same method was also used to calculate the growth rate. Since occlusion between trees in sample 3 was very high, the difference between the data extracted from that sample and those from the other five samples was also large. Therefore, data from sample 3 were excluded from the analysis.
2.2.2. Parameters
The positions of individual trees and their DBH were fed into a software package, namely Simple Tree, which can build accurate tree cylinders from such data obtained by TLS [21]. We determined the ground and vegetation points from the original point cloud and then built a digital terrain model (DTM, which yields a digital expression of the morphology of terrain surface from data on various attributes of the terrain) along the Z axis [22]. Next, we sliced the vegetation point cloud along the Z axis in threshold of 1 cm; grouped the point clouds separated by 3 cm or less into the same group; and combined the point clouds within each group into a circle by the least squares method. In the third step, we aggregated the fitting circle virtually, which intersected the horizontal and the vertical directions within distances shorter than 50 cm. The penultimate step was to build a skeleton for each virtual part and merge the parts within a horizontal distance less than 50 cm. Finally, we selected the virtual trunk for circle fitting and for calculating the DBH based on the DTM [7].
In matching the shape of an object, the convexity defect of the tree as an object can be established by using the convex hull. A similarity analysis can then be performed on the two intersecting objects [23]. The convex hull algorithm was used in the present study to obtain the crown profile, and the canopy part and the threshold layer (0.5 cm) were then extracted. The projected area of the canopy at each level was calculated based on the formula for calculating the area of a polygon, and each projection area was multiplied by the corresponding height to calculate the volume of the crown.
2.2.3. Crown Competition Index (CCI)
A competition index, which reflects the relationship between the demand of trees for resources and the ratio of trees to resources under realistic circumstances, can be divided into two categories: distance-dependent and distance-independent. The Hegyi competition index is the most commonly used model of a competitive index, and most of the existing competitive index models are derived from this index. The index is calculated by using Equation (1), as follows:
where is the competition index of target tree j, is the DBH of target tree j, is the DBH of competitor i, is the distance between target tree j and competitor i, is the number of competitors, i is the serial number of the competitor, and j is the serial number of the target tree.
The Hegyi competition index uses the ratio of the distance between an object and its competitor and the diameter of the object to reflect the competitive pressure on the individual object (tree). Three features of this competition index make it a good indicator of the intensity or strength of competition: (1) the distance between trees and their diameter at breast height (DBH) can be measured accurately; (2) the ratio of the DBH ratio of the object to that of its competitor can reflect the ratio of the canopy; and (3) the distance between trees can reflect the relative space occupied by individual trees.
Since the DBH in bamboos does not keep increasing throughout the life of the plant, it is difficult to derive a competition index based on such relatively static growth parameters as DBH and base area. Because the canopy size of trees is closely linked to their ability to obtain resources, a competition index that takes into account the characteristics of the crown is more suitable for expressing the competitive pressure on bamboo and was, therefore, selected for the present study.
The commonly used Hegyi competition index cannot represent accurately the ability of a canopy of a broad-leaved tree or that of a bamboo to acquire resources. However, this shortcoming can be overcome by combining that index with canopy characteristics of plants that make up a forest mixed of bamboo and broad-leaved trees. The Hegyi competition index was thus improved upon by incorporating additional data on tree height, crown surface area, crown volume, and canopy overlap to construct a model that represents the canopy pressure found in mixed forests more accurately. The modified model is represented by Equation (2), as follows:
where and are the heights of bamboo and broad-leaved trees, respectively; and are the DBH of bamboo and broad-leaved trees, respectively; is the overlapping volume; is the overlapping volume of the broad-leaved tree canopy and bamboo canopy; n is the number of bamboo overlapping with a broad-leaved tree; i is the serial number of a broad-leaved tree; and j is the serial number of the bamboo plant. It is clear that the greater the overlapping volume of the canopy, the higher the , the greater the competition between a broad-leaved tree and the bamboo.
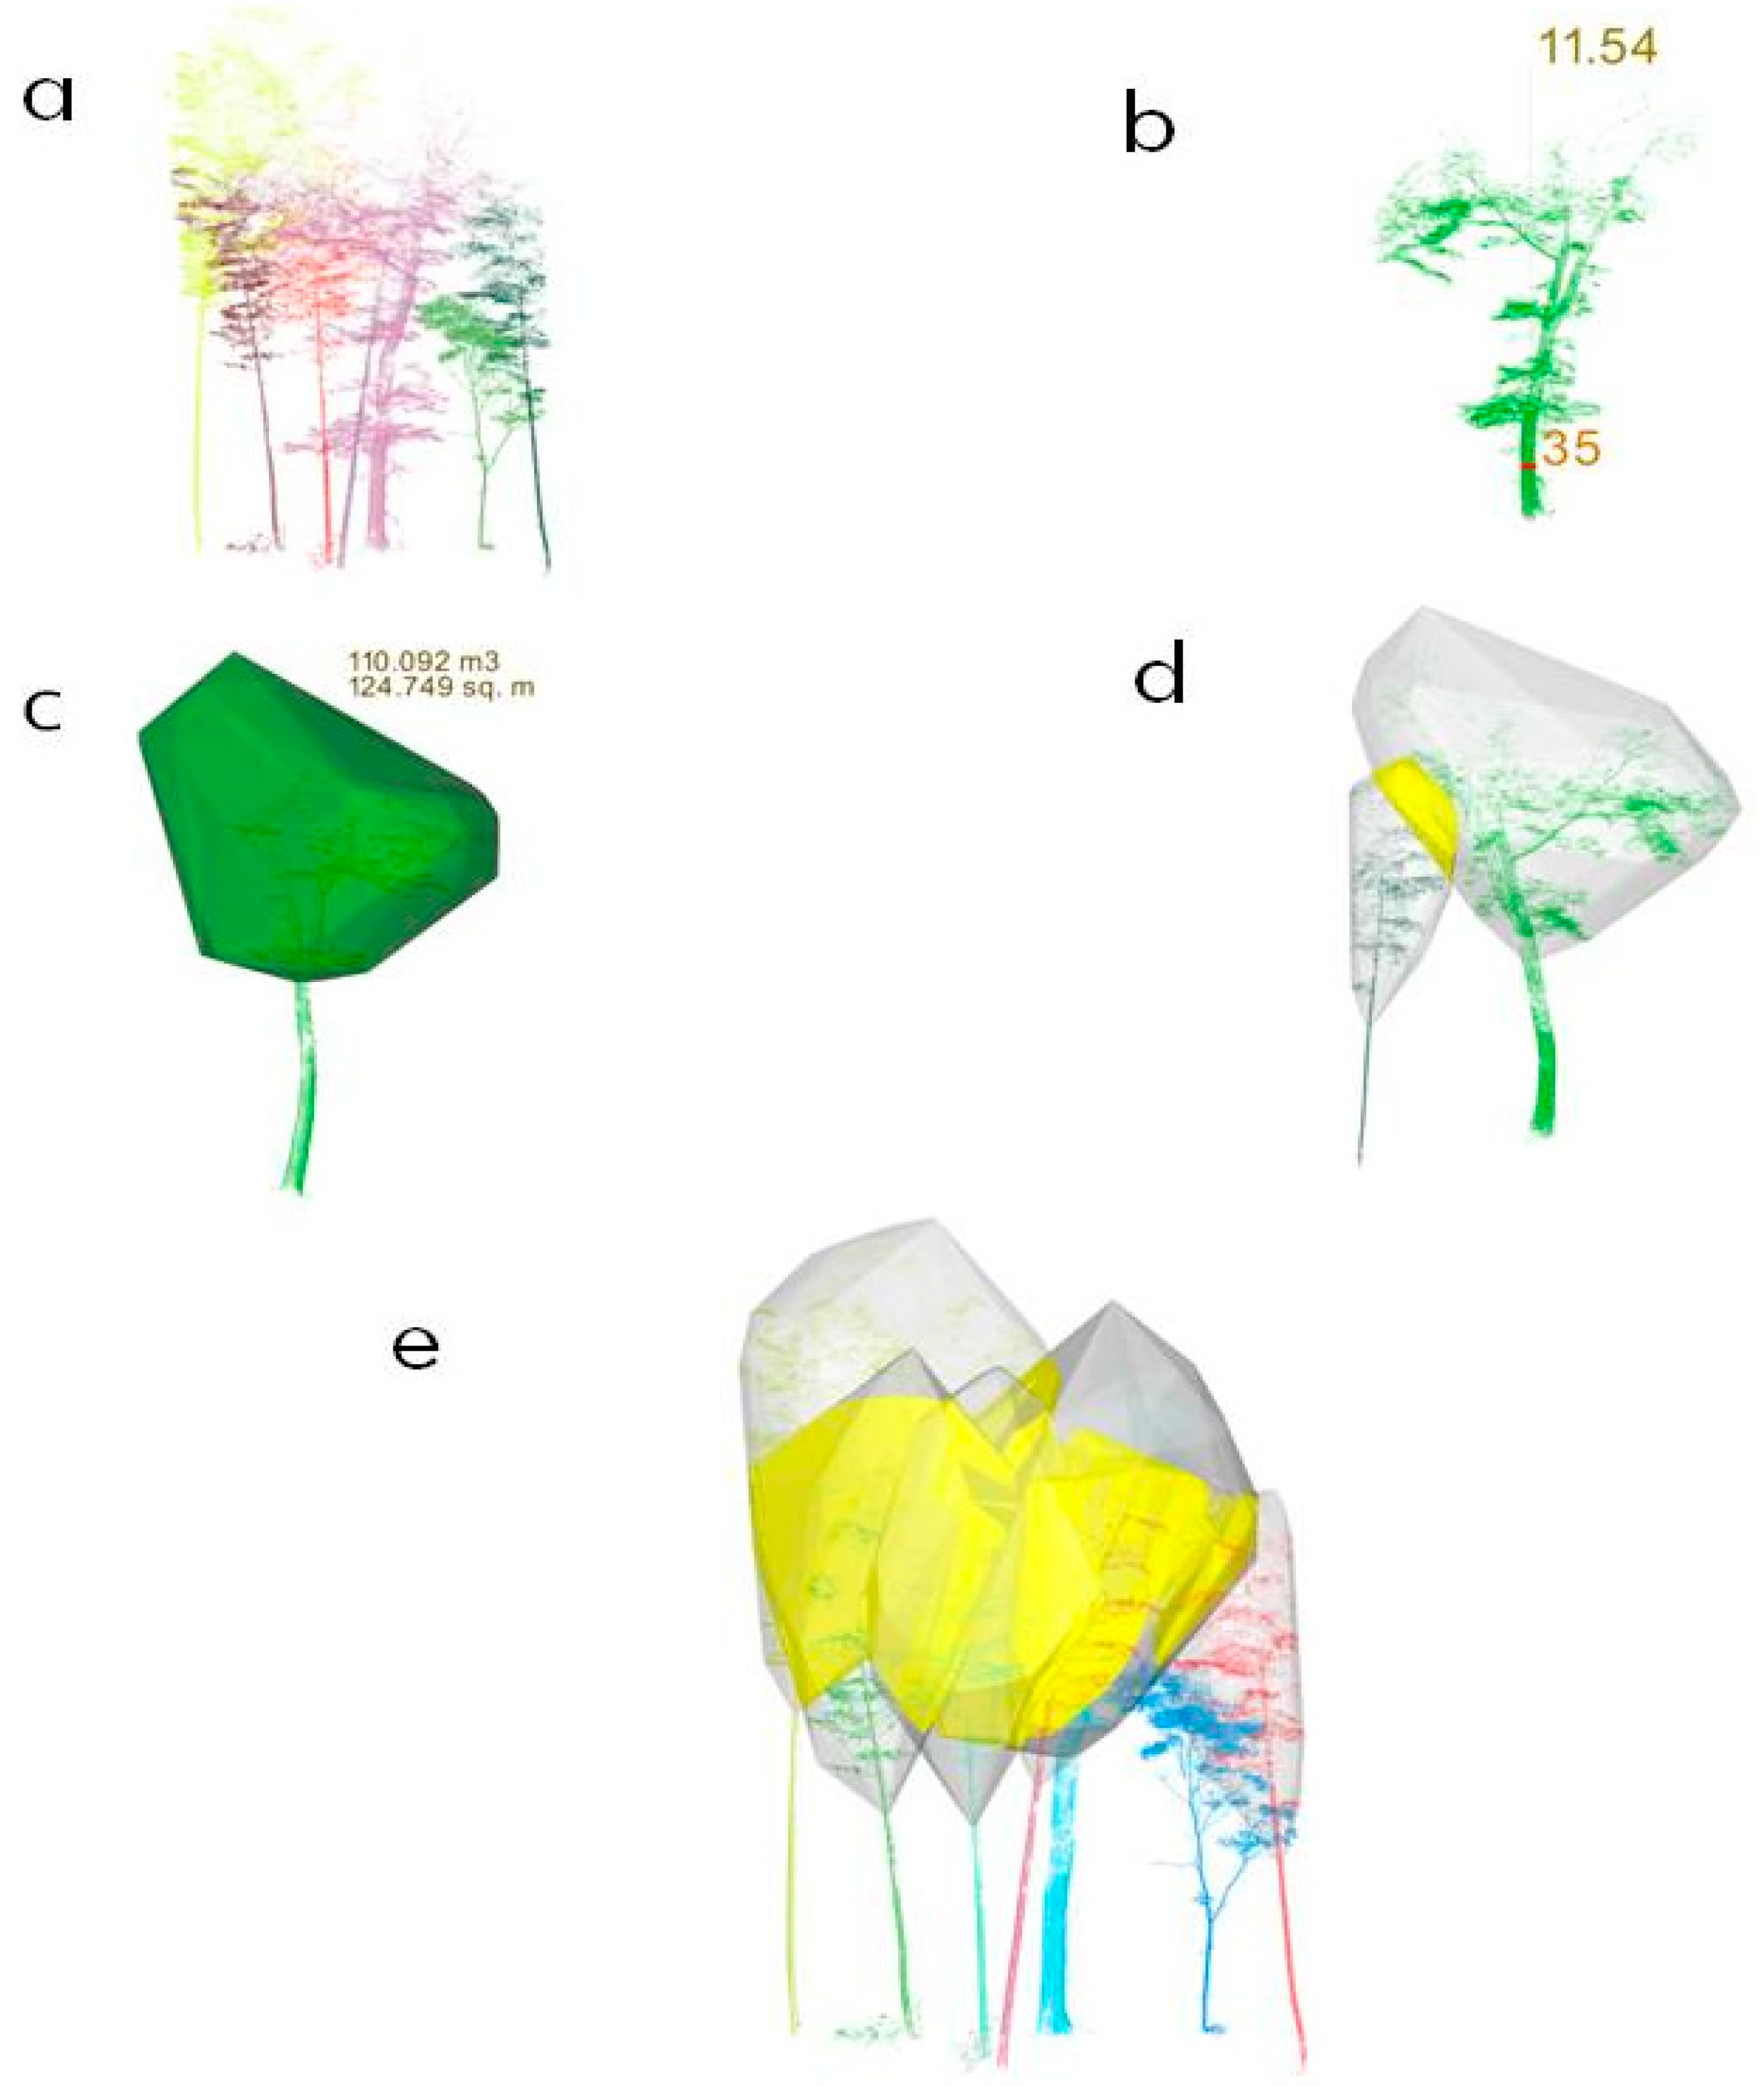
The convex hull algorithm was used for calculating the overlap between the crowns of the broad-leaved trees and the bamboo canopy. Figure 2 is a flow chart of the process of extracting the overlapping volume.
3. Results
Using multi-station scanning to extract the original point-cloud data in the sample plots and splicing the data for each sample gave an overall recognition rate for trees of 97.71%, while the single station recognition rate is 82.56% (Table 4). These results show that the values of the DBH as estimated by TLS were similar to those arrived at through artificial measurement.
3.1. Number of Bamboos in Circles of Different Radii
There were more bamboo at locations farther than 3 m from any broad-leaved tree than at locations up to 3 m from it. In the concentric circles of different radii around a given broad-leaved tree, the number of bamboos increased from 0.9 when the radius was 1 m to 4 when it was 2 m; similarly, the number increased from 9.8 at a radius of 3 m to 37.2 when it was 6 m. The threshold radius appeared to be 3 m: the number of bamboos increased faster when the radius was less than 3 m than when it was more than 3 m (Table 5).
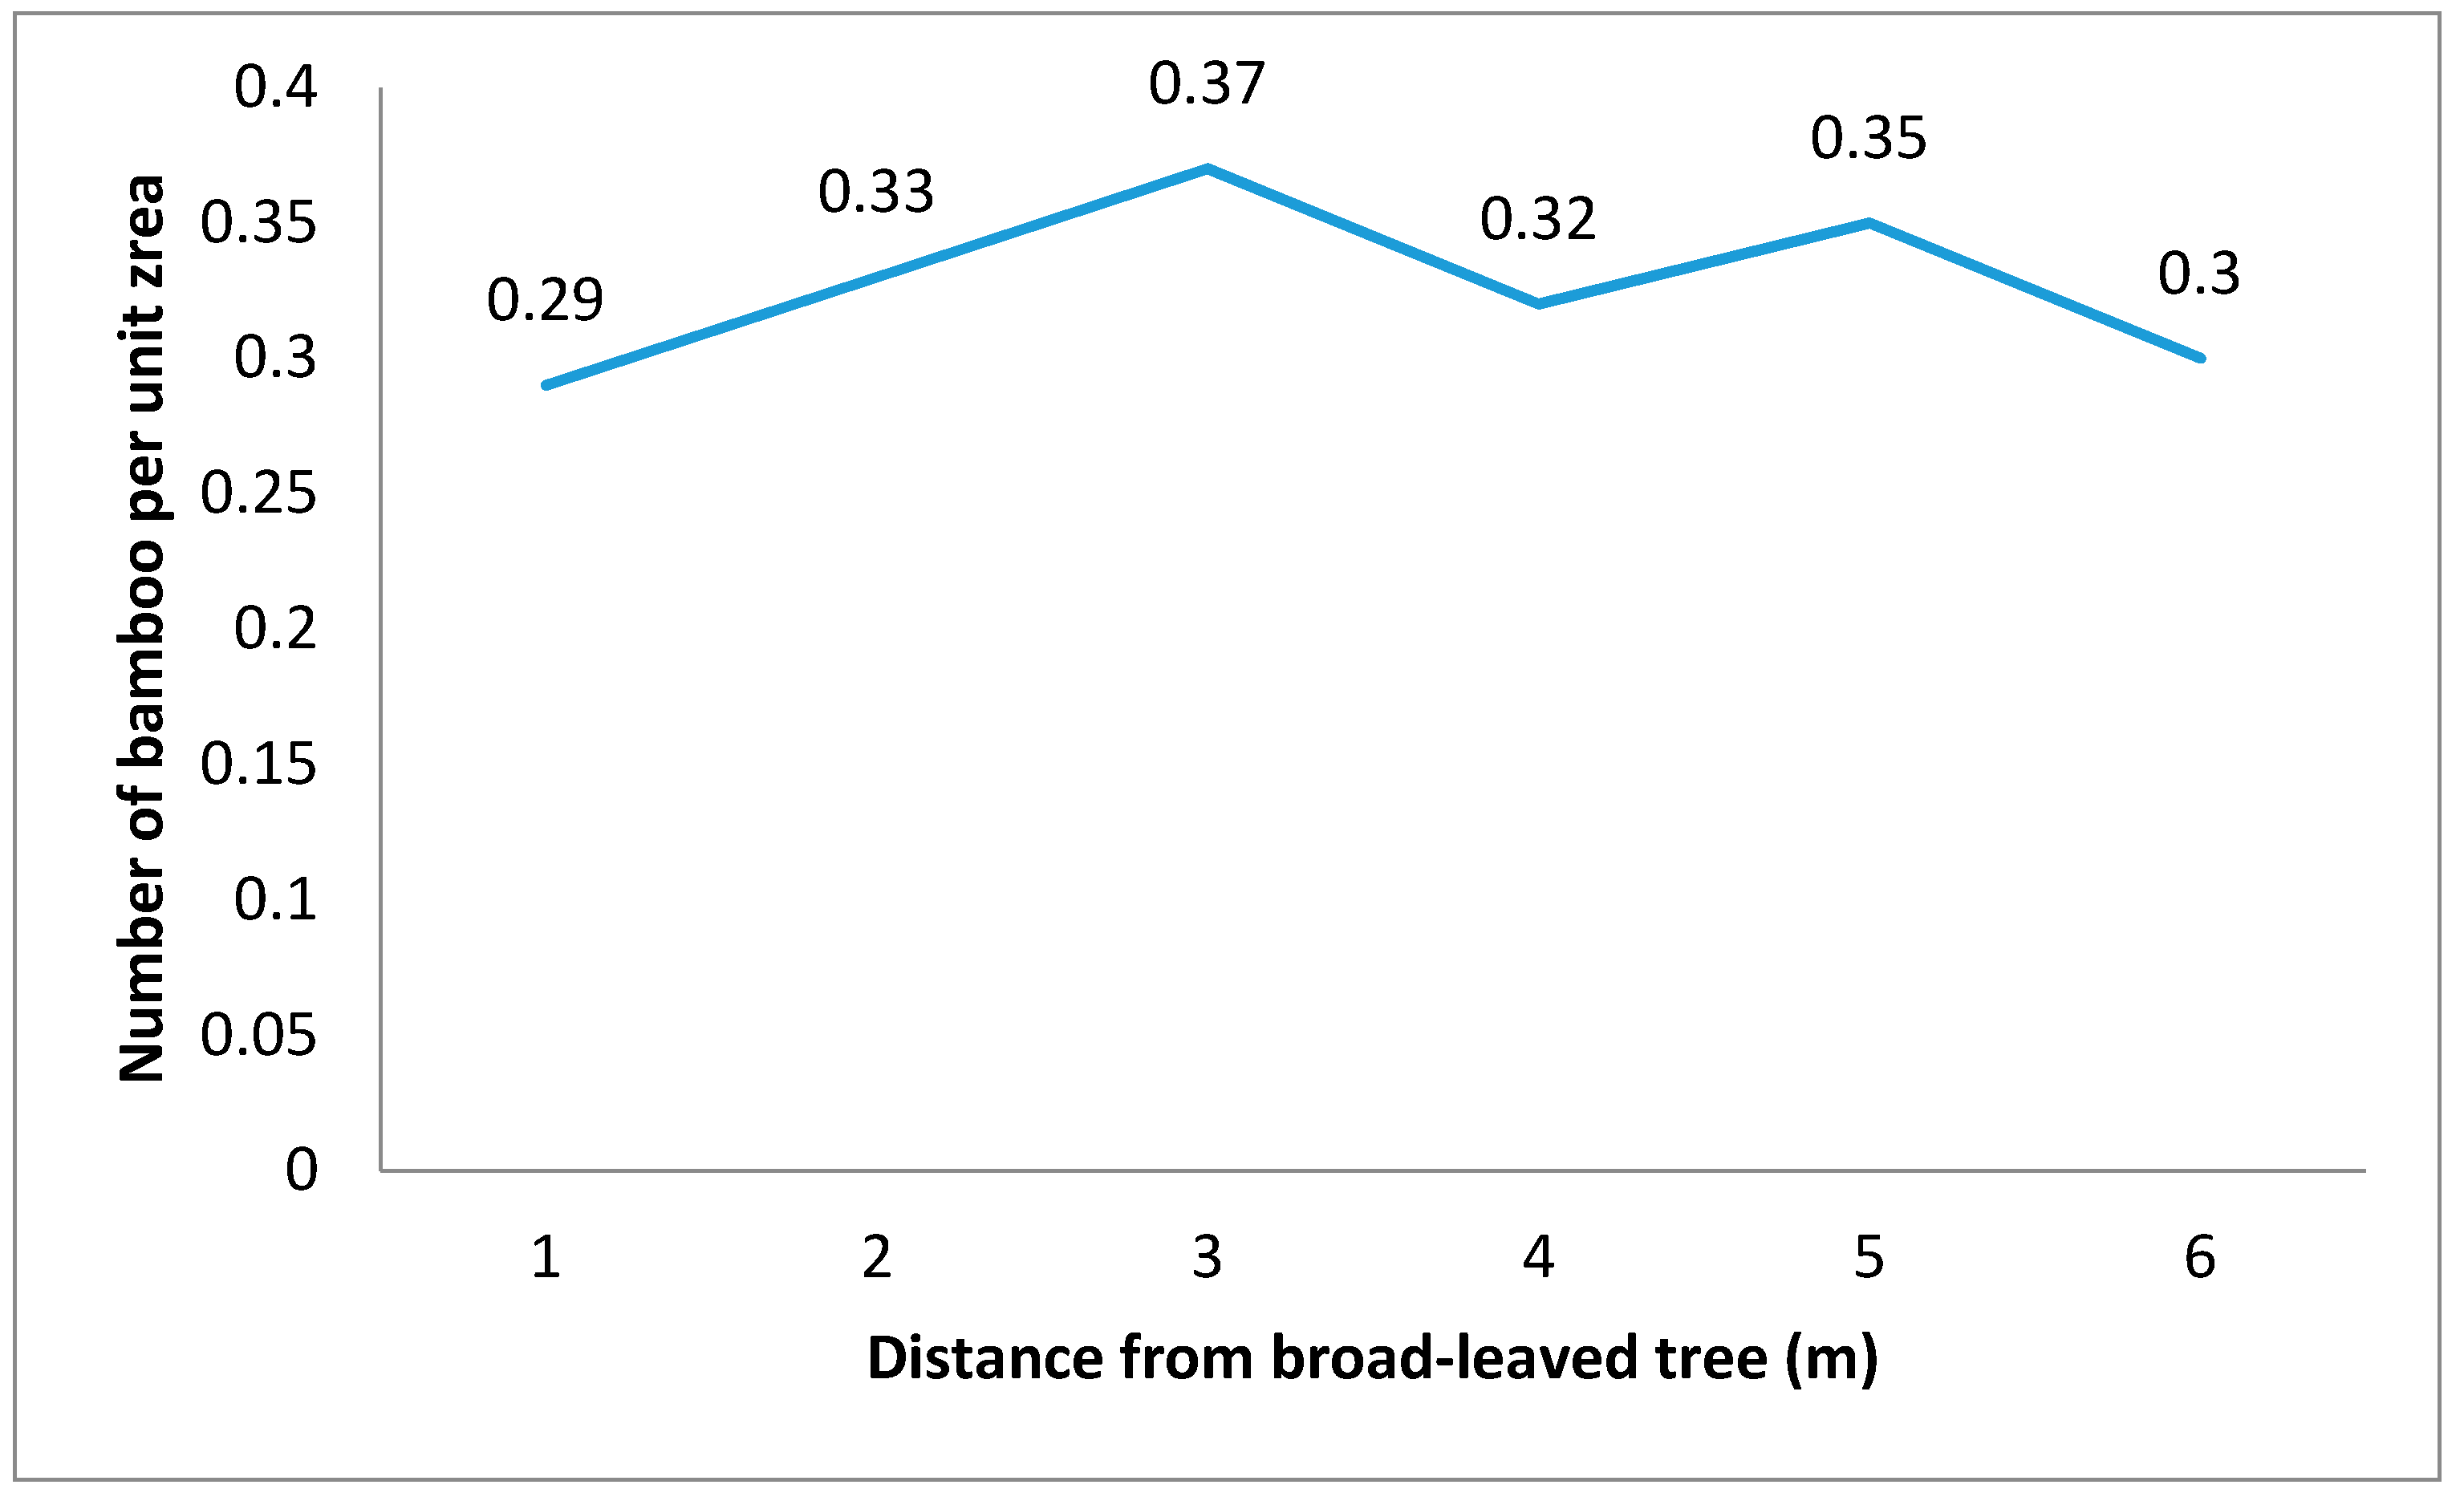
With a broad-leaved tree at the centre of a circle, the number of bamboo per unit area within circles of increasing radii was as follows: 0.29 at a radius of 1 m, 0.33 at 2 m, 0.37 at 3 m, 0.32 at 4 m, 0.35 at 5 m, and 0.30 at 6 m (Figure 3): the number per unit area was the smallest when the radius was 1 m and the largest when it was 3 m; beyond 3 m, the number tended to be stable.
In percentage terms, the number of bamboos per unit area increased steadily at a rate of 13.8% as the radius increased from 1 m to 3 m but began to decline as the radius increased beyond 3 m (Figure 3).
3.2. Diameter at Breast Height (DBH) in Circles of Different Radii
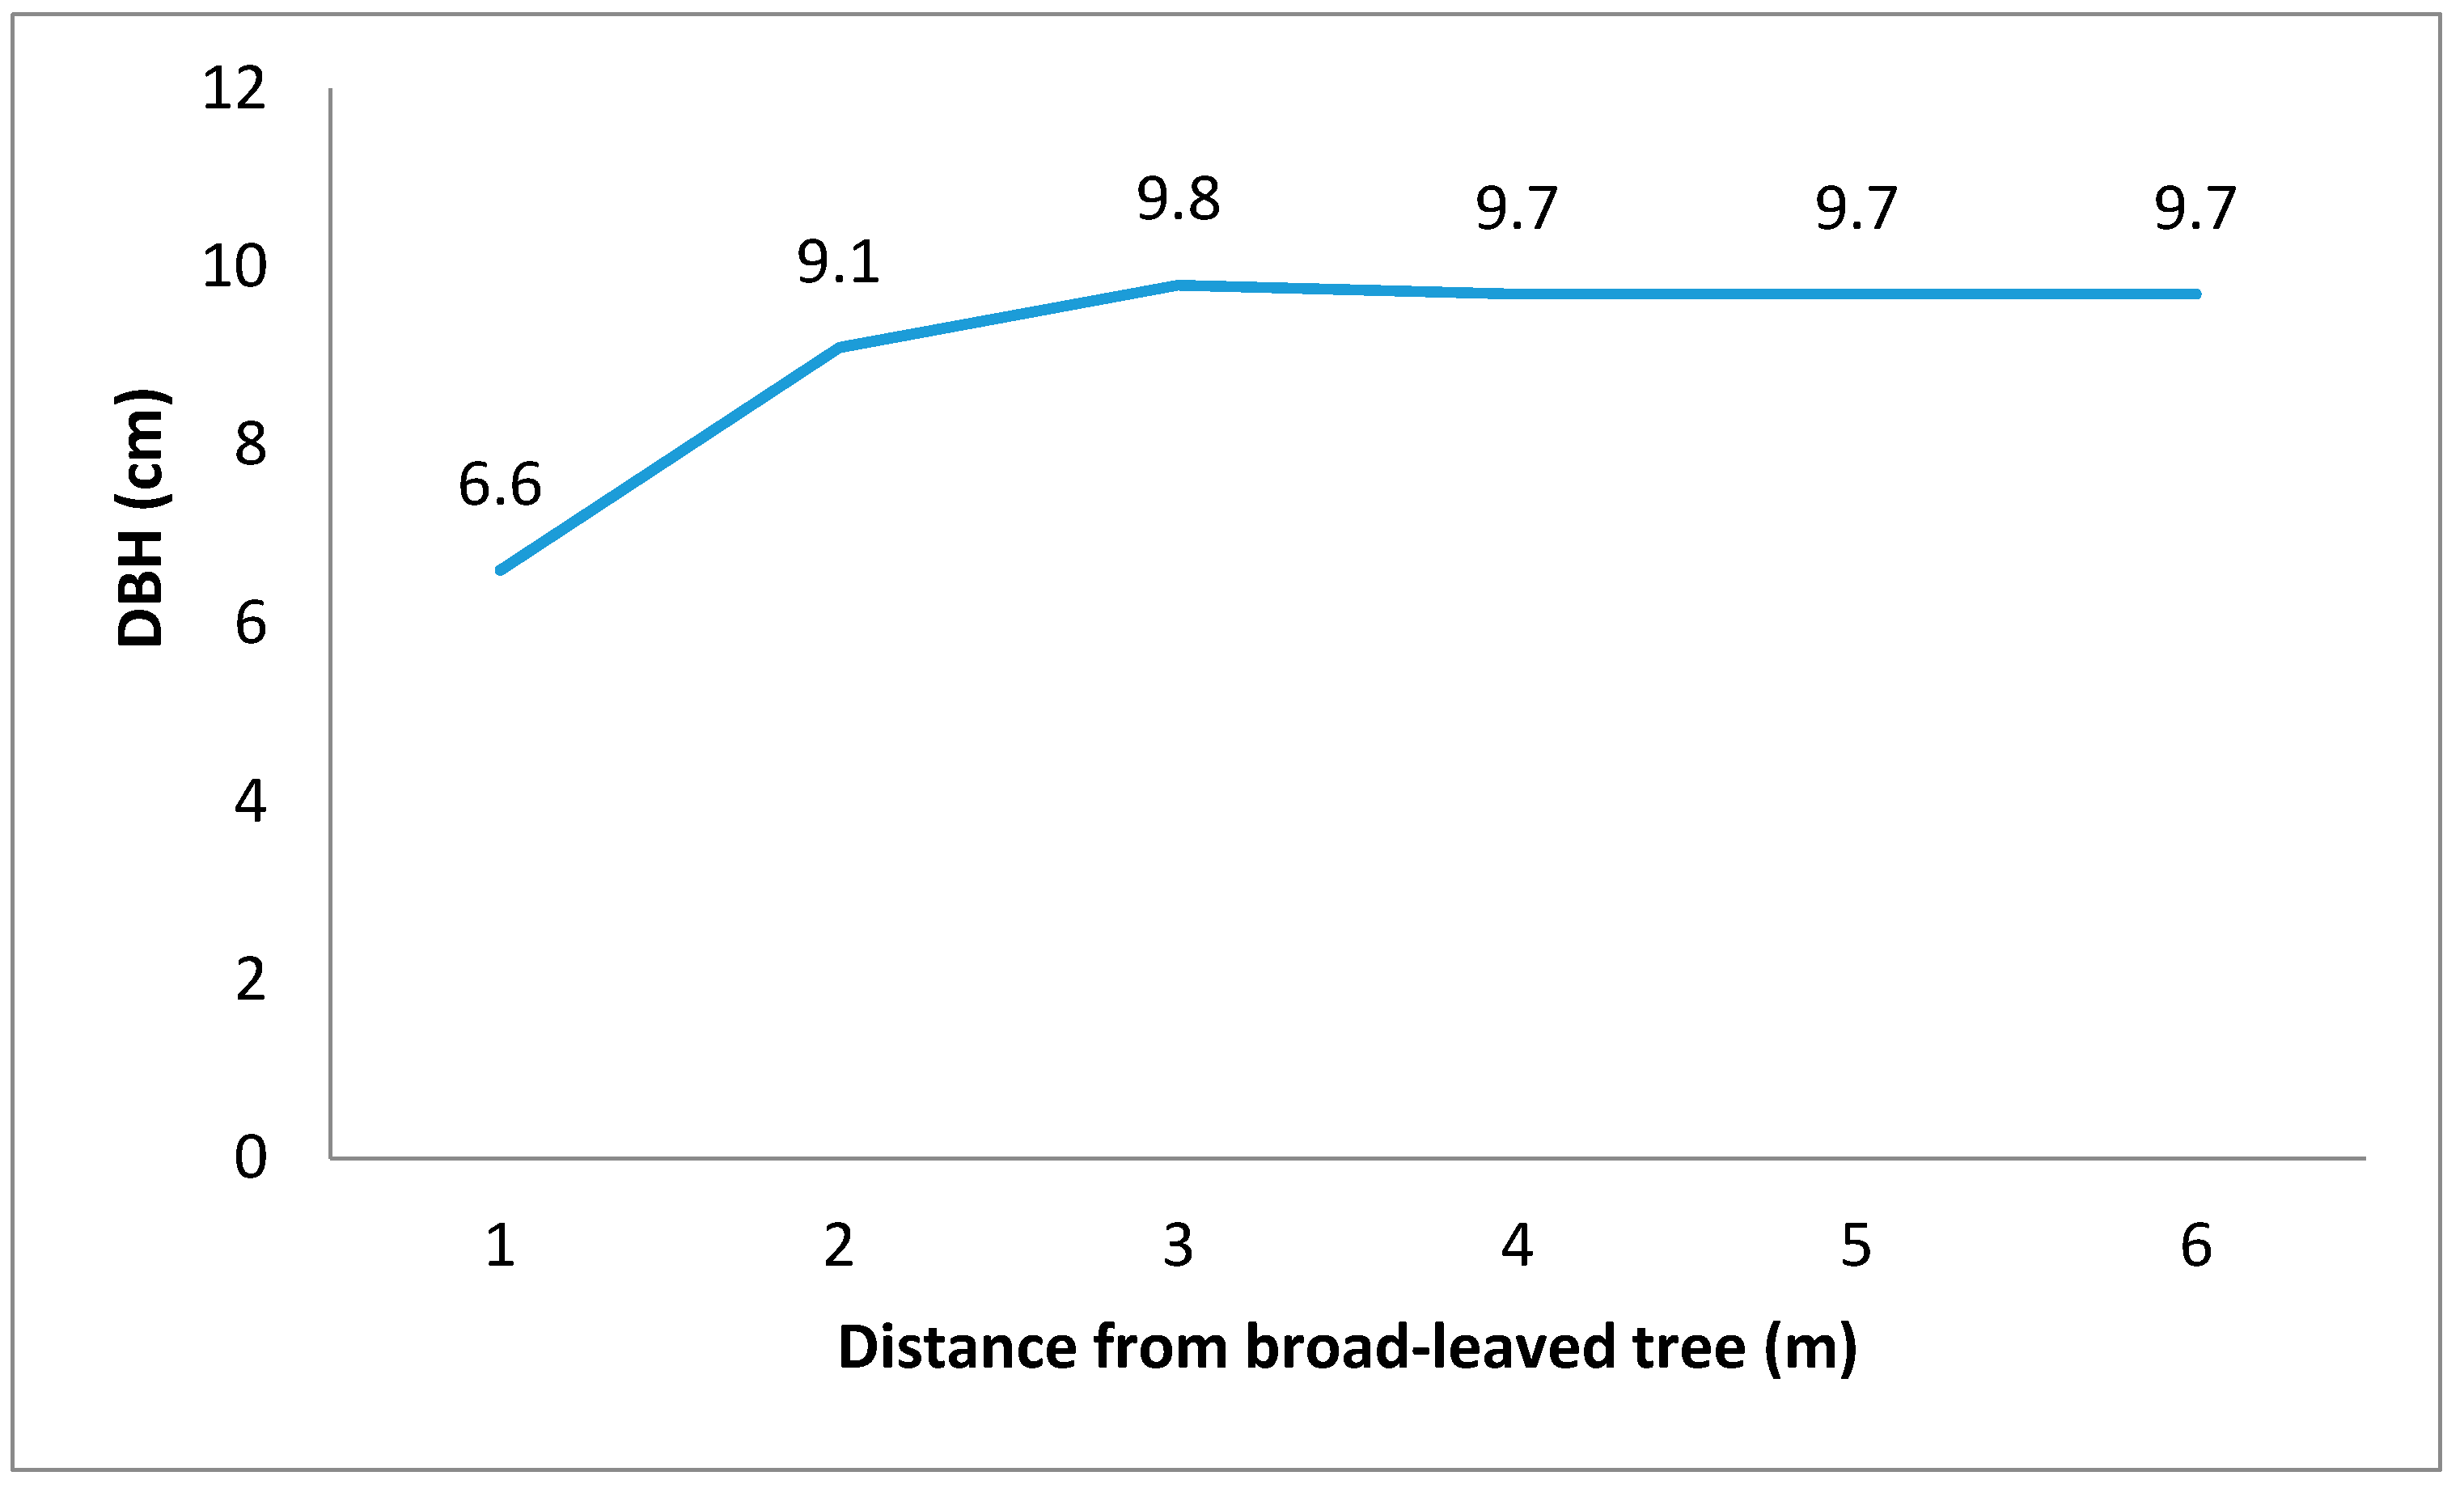
The same pattern was observed with the average DBH: within 3 m, the farther the bamboos were from a given tree, the larger the DBH; however, beyond 3 m the average DBH of the bamboos tended to be stable. The average DBH of bamboo growing within 1 m of a broad-leaved tree was 6.6 cm but the average value increased rapidly to 9.7 cm—a growth rate of 38%—as the distance increased and peaked at 9.8 cm, when the distance was 3 m, only to decrease to 9.7 cm as the distance increased beyond 3 m. A broad-leaved tree seems to have an adverse effect on the growth of bamboo when the distance between the two plants is less than 2 m, a beneficial effect when the distance is 3 m, and almost no effect when the distance exceeds 4 m (Figure 4).
3.3. Crown Overlaps
Data from sample 1 were used for analysing the competition between crowns of adjacent trees. Field investigations showed that broad-leaved tree No. 4 was deadwood whereas No. 5 was young and its canopy level was below that of the bamboo canopy. Therefore, these two trees were excluded while calculating the canopy competition index. The basic situation of broad-leaved trees in sample 1 is given in Table 6.
Results of using the convex hull algorithm to extract information on the overlap between canopies of three broad-leaved trees and the bamboo canopy are shown in Table 7. The crown of tree No. 1 was the smallest, but its overlapping volume and the extent of intersection of its surface with the crown of the bamboo were almost the same as those of trees No. 2 and No. 3, which indicates that the crown of No. 1 was more extensively bifurcated.
3.4. Crown Competition Index (CCI)
As the average competition index of the broad-leaved trees increased, the number of bamboos covered by the projecting canopy decreased significantly. Although the crown volume of tree No. 1 was much smaller than that of tree No. 2 and tree No. 3, the values of their crown competition index (CCI) were very close (Table 8). It can be seen from Table 7 that the volume and surface area of the crowns of the three broad-leaved trees are roughly the same, which is why their CCI values were similar. As the DBH of the broad-leaved trees kept increasing, so did the values of CCI between them and bamboo (Table 8).
4. Discussion
Competition is one of the most basic relationships between individuals [6], and intraspecific competition is normally greater than interspecific competition [24], which suggests that competition between bamboos should be greater than that between bamboos and broad-leaved trees—results from the present study provide an insight into how the latter influenced the growth of bamboo. We found that broad-leaved trees had suppressed the growth of bamboo growing closer than 3 m, but promoted it when the distance was greater than 3 m up to the point at which it exceeded the range of influence of the broad-leaved trees (Figure 3 and Figure 4, Table 5). As we observed, bamboos with the largest DBH were found 3 m away from broad-leaved trees. Due to the cover provided by the canopy of broad-leaved trees, bamboo cannot grow normally with insufficient lighting, when the distance is less than 3 m because it cannot get enough sunlight. The average DBH of bamboo increases initially and then stabilizes at distances farther than 3 m. The amount of photosynthetically active radiation can characterize the intensity of competition well [25]. There is no parameterization for canopy characteristics of broad-leaved trees and bamboo. Therefore, the current study provides new tools to evaluate these effects. Because the broad-leaved trees formed canopies that permitted more sunlight to filter through them, it compensated to some extent for the light blocked by the overlapping canopies and thus promoted the growth of bamboo [26]. These observations suggest that the main factor affecting the growth of broad-leaved trees and bamboo is light. Under the canopy of broad-leaved trees, bamboo showed almost no growth, except under gaps in the canopy. However, when sufficient light was available, the litter of broad-leaved trees serves as a source of nutrients for bamboo growing around the edges of the canopy; as a result, bamboo grows better. Therefore, in analysing the competition between bamboo and broad-leaved trees, we need to take into account not only the spatial structure of the canopy but also the availability of nutrients below the soil surface.
Differences in crown shapes, canopy efficiency, and the extent of space occupied change the intensity of competition among trees [27]. The survival environment and the living space occupied by an individual tree are good indicators of competition. The three most important factors that determine the extent of competitive pressure exerted by the canopy on the nearby trees are (1) canopy size, which determines the size of the overlapping area and the projected area, (2) tree height, which determines whether the canopy can project into the space to cast a shadow over nearby plants, and (3) the distance between adjacent canopies, which directly determines the degree of competition between trees.
The competition index based on features of the canopy correlated better with the crown than the simple model did [26,28]. In many tree species, the DBH is closely correlated to tree height and crown shape [29]. Compared to the DBH, features of the canopy (tree height, projected area, etc.) have less influence on the competition whereas the DBH is often directly related to the competitive ability of a tree. The diameter and distance, which are used by the distance-dependent Hegyi competition index, are easy to measure, and the results are highly reliable. However, the overlap volume between the canopies of broad-leaved trees and of bamboo is also a matter of distance in some sense. Therefore, a competition index that considers the canopy is also a distance-dependent competition index. In the present study, the greater overlapping volume proved better at explaining the degree of competition between broad-leaved tree and bamboo.
Because the sampling spots were selected at random and the sample was small, we could not assess the joint impact of the entire forest. The competition between canopies of a single broad-leaved tree and bamboo has not been studied; therefore, we cannot evaluate the competition between different tree species and bamboo. These two sources of uncertainty have hindered the analysis of the competition between bamboo and broad-leaved trees in mixed forests. Although our data can quantify the effects of broad-leaved trees on the growth of bamboo, their competing relationships cannot be explained at the species level. The effects of different species of broad-leaved trees on bamboo may have superimposed effects. The effects of different species of broad-leaved trees on bamboo may be more complex. Therefore, future research on the competition between bamboo and broad-leaved trees in mixed forests should take into account different tree species to devise better models or at least devise models that are specific to a given tree species and bamboo.
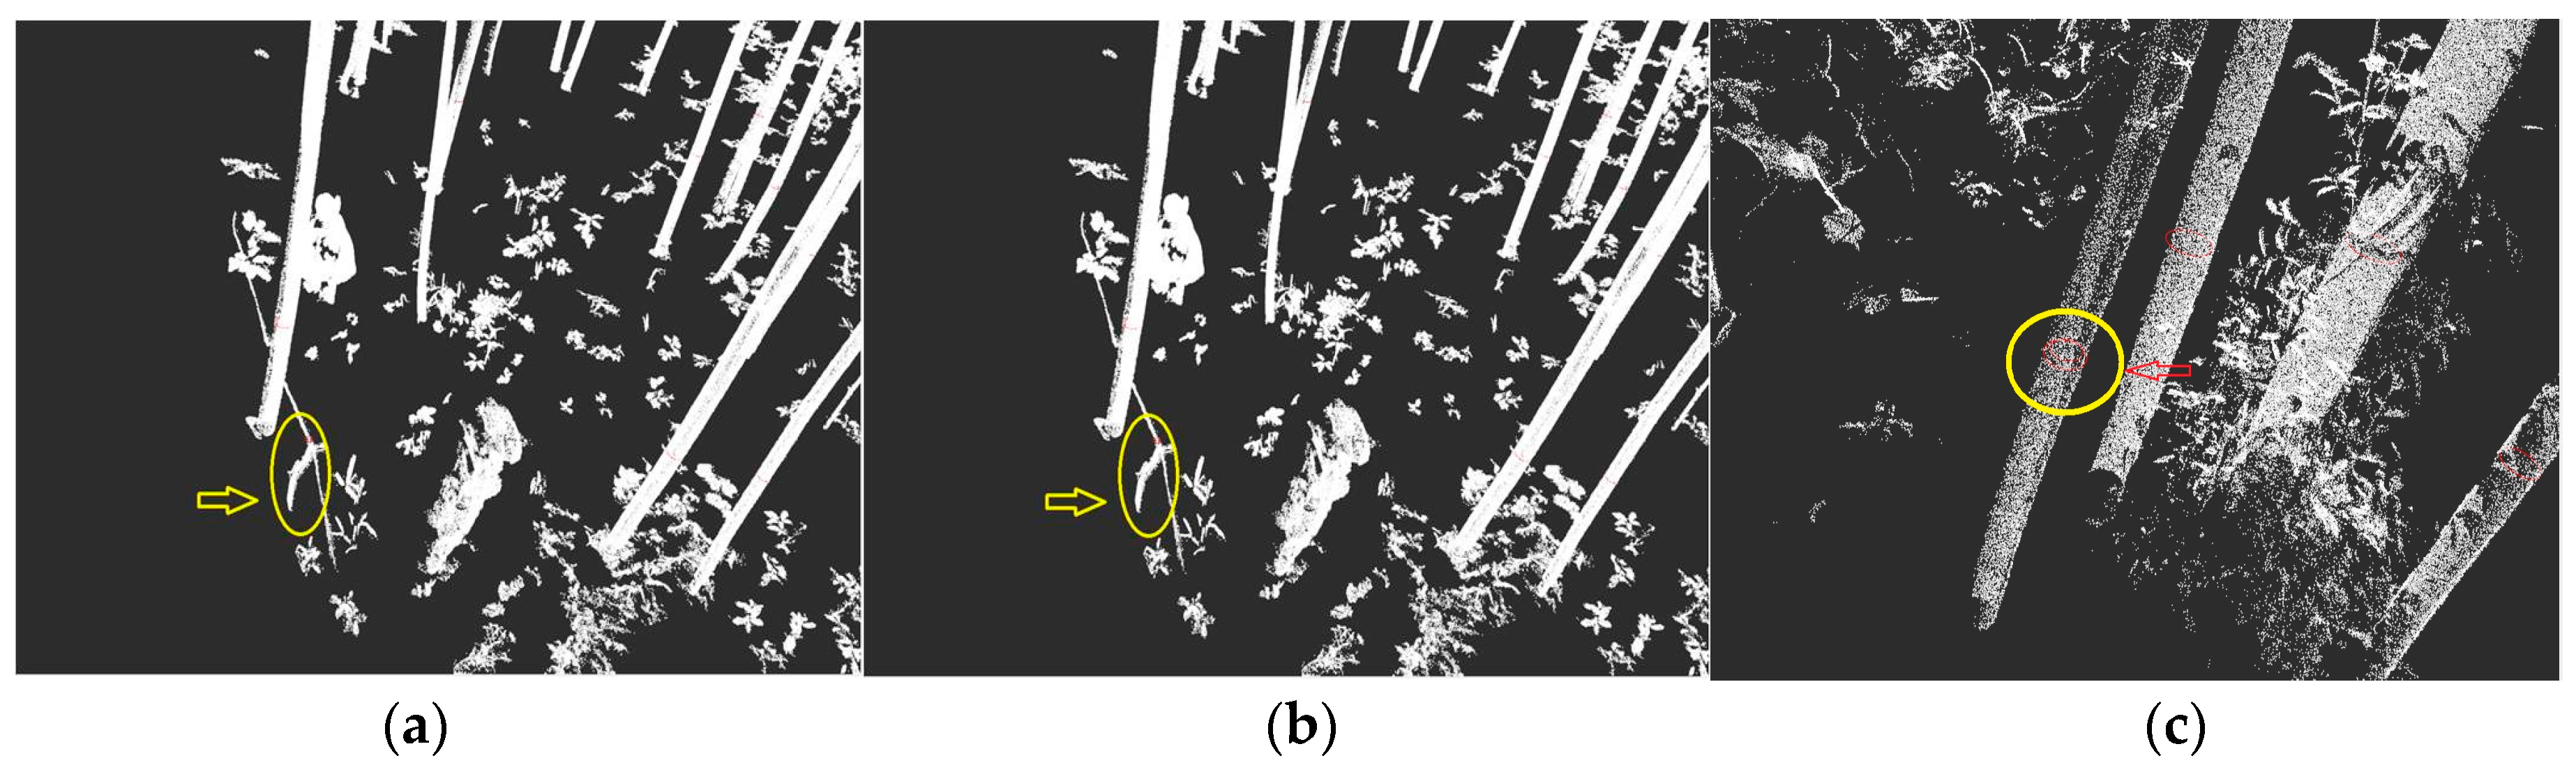
As we found, the complex forest environment led some errors in extraction of TLS point cloud data, which make the average recognition rate of individual bamboo lower than 1, as shown in Figure 5.
A reasonable number and locations of scanning stations will make the forest structure data more accurate than those obtained in earlier studies that used TLS [30]. Although increasing the number of scanning stations can ensure that trees are recognized as such with greater accuracy, the trade-off is that it will take more time to process the data and may lead to redundant data. In the present study, the recognition accuracy of single-station scanning was 82.56% whereas that of multi-station scanning was 97.71%—thus the accuracy of multi-station scanning was much higher. The increasing spatial resolution of laser scanners will also increase the quality of data on structural parameters of forests. Therefore, further research should focus on the development of appropriate methods to assess the quality of such data obtained using TLS.
5. Conclusions
The growth of individual trees is affected by many factors, especially in a mixed forest. Broad-leaved trees in a mixed forest of bamboo can influence the growth of bamboo and the spatial structure of the forest. In the present study, the average recognition rate of individual bamboos was 97.71%. Broad-leaved trees suppressed the growth of bamboo growing within 3 m from them but favoured the growth of bamboo when it was beyond 3 m. The competition index proposed in the present paper added canopy-related factors to the Hegyi competition index to express the competitive relationship between the trees and bamboo fully and also analysed the competitive effect of the canopy. The revised competition index indicated that large neighbours have a greater influence on the target species than small neighbours do, and the effect is also a reflection of canopy cover and lateral extrusion.
By analysing the entire 3D spatial structure obtained using TLS, we determined the degree of competition between bamboo and broad-leaved trees. These results provide a reference for future research on competition between trees in mixed forests and enhance our understanding of the spatial structure of bamboo and broad-leaved trees in mixed forests. The mix of broad-leaved trees and bamboo in the right proportions will increase the yield of bamboo and enhance the comprehensive effect of such mixed forests. Analysing the spatial structure of these forests helps to explore the patterns of growth, optimize management methods, and increase productivity. However, more accurate algorithms are needed for analysing canopy structure to detect convex and concave pockets in the crown to examine the relationship between the 3D structure of a canopy and its effect on the competition between plants for environmental resources.
Author Contributions
Y.Y. and F.G. contributed equally to this work. Conceptualization, F.G. and S.F.; Methodology, Y.Y.; Software, M.X.; Validation, F.G., S.F. and Y.Y.; Formal Analysis, M.X.; Investigation, M.X., M.Z.; Resources, M.X.; Data Curation, M.X.; Writing-Original Draft Preparation, Y.Y.; Writing-Review and Editing, Y.Y.; Visualization, Y.Y.; Supervision, F.G.; Project Administration, F.G.; Funding Acquisition, F.G.
Funding
This research was funded by Bamboo efficient cultivation and monitoring technology for timber (grant number 2018YFD0600103), Study for Population Structure of Naturally Renewed Palmer vine in Hainan (grant number 1632016014) and Research on High-efficiency Cultivation Techniques of Moso Bamboo Based on Growth Characteristic (grant number 1632018003).
Acknowledgments
The authors gratefully acknowledge Xianli Zeng for suggestions on processing data and Lu Yang for revising the structure of this article. The authors are grateful to Xiaolu Tang for his help in revising the article. Finally, we would like to take this opportunity to express our greats thanks to the two anonymous reviewers.
Conflicts of Interest
The authors declare no conflict of interest.
References
- Lin, Z.Q. Studies on bamboo productivity and advantage of mixed forest of bamboo with broad-leaved trees. J. Bamboo Res. 2000, 53, 42–45. [Google Scholar]
- Ledermann, T. Evaluating the performance of semi-distance-independent competition indices in predicting the basal area growth of individual trees. Revue Canadienne De Recherche Forestière 2010, 40, 796–805. [Google Scholar] [CrossRef]
- Harper, J.L. Population Biology of Plants. Academic Press: London, UK, 1977. [Google Scholar]
- Barnes, B.V.; Zak, D.R.; Denton, S.R.; Spurr, S.H. Forest Ecology; John Wiley & Sons, Inc.: New York, NY, USA, 1998. [Google Scholar]
- Pacala, S.W.; Canham, C.D.; Saponara, J.; Silander, J.A.; Kobe, R.K.; Ribbens, E. Forest models defined by field measurements: Estimation, error analysis and dynamics. Ecol. Monogr. 1996, 66, 1–43. [Google Scholar] [CrossRef]
- Thorpe, H.C.; Astrup, R.; Trowbridge, A.; Coates, K.D. Competition and tree crowns: A neighborhood analysis of three boreal tree species. For. Ecol. Manag. 2010, 259, 1586–1596. [Google Scholar] [CrossRef]
- Moravie, M.A.; Durand, M.; Houllier, F. Ecological meaning and predictive ability of social status, vigour and competition indices in a tropical rain forest (India). For. Ecol. Manag. 1999, 117, 221–240. [Google Scholar] [CrossRef]
- Lovell, J.L.; Jupp, D.L.B.; Culvenor, D.S.; Coops, N.C. Using airborne and ground-based ranging lidar to measure canopy structure in Australian forests. Can. J. Remote Sens. 2003, 29, 607–622. [Google Scholar] [CrossRef]
- Hopkinson, C.; Chasmer, L.; Youngpow, C.; Treitz, P. Assessing forest metrics with a ground-based scanning lidar. Can. J. For. Res. 2004, 34, 573–583. [Google Scholar] [CrossRef]
- Thies, M.; Spiecker, H. Evaluation and future prospects of terrestrial laser scanning for standardized forest inventories. In Proceedings of the International Archives of Photogrammetery, Remote Sensing and Spatial Information Sciences, Freiburg, Germany, 3–6 October 2004. [Google Scholar]
- Jupp, D.L.B.; Culvenor, D.S.; Lovell, J.L.; Newnham, G.J.; Strahler, A.H.; Woodcock, C.E. Estimating forest lai profiles and structural parameters using a ground-based laser called ‘Echidna®’. Tree Physiol. 2009, 29, 171–181. [Google Scholar] [CrossRef] [PubMed]
- Calders, K.; Newnham, G.; Burt, A.; Murphy, S.; Raumonen, P.; Herold, M.; Culvenor, D.; Avitabile, V.; Disney, M.; Armston, J. Nondestructive estimates of above-ground biomass using terrestrial laser scanning. Methods Ecol. Evol. 2015, 6, 198–208. [Google Scholar] [CrossRef]
- Newnham, G.J.; Armston, J.D.; Calders, K.; Disney, M.I.; Lovell, J.L.; Schaaf, C.B.; Strahler, A.H.; Danson, F.M. Terrestrial laser scanning for plot-scale forest measurement. Curr. For. Rep. 2015, 1, 239–251. [Google Scholar] [CrossRef]
- Simonse, M.; Aschoff, T.; Spiecker, H.; Thies, M.; Simonse, M.; Aschoff, T.; Spiecker, H.; Thies, M. Automatic determination of forest inventory parameters using terrestrial laser scanning. In Proceedings of the Scandlaser Scientific Workshop on Airborne Laser Scanning of Forests, Umeå, Sweden, 3–4 September 2003. [Google Scholar]
- Aschoff, T.; Thies, M.; Spiecker, H. Describing forest stands using terrestrial laser-scanning. Int. Arch. Photogramm. Remote Sens. Spat. Inf. Sci. 2004, 35, 237–241. [Google Scholar]
- Pueschel, P.; Newnham, G.; Rock, G.; Udelhoven, T.; Werner, W.; Hill, J. The influence of scan mode and circle fitting on tree stem detection, stem diameter and volume extraction from terrestrial laser scans. ISPRS J. Photogramm. Remote Sens. 2013, 77, 44–56. [Google Scholar] [CrossRef]
- Hosoi, F.; Omasa, K. Voxel-based 3-d modeling of individual trees for estimating leaf area density using high-resolution portable scanning lidar. IEEE Trans. Geosci. Remote Sens. 2006, 44, 3610–3618. [Google Scholar] [CrossRef]
- International Society for Photogrammetry and Remote Sensing. Frontiers in Spectral Imaging and 3D Technologies for Geospatial Solutions; International Society for Photogrammetry and Remote Sensing: Jyväskylä, Finland, October 2017. [Google Scholar]
- Liang, X.; Kankare, V.; Hyyppä, J.; Wang, Y.; Kukko, A.; Haggrén, H.; Yu, X.; Kaartinen, H.; Jaakkola, A.; Guan, F. Terrestrial laser scanning in forest inventories. ISPRS J. Photogramm. Remote Sens. 2016, 115, 63–77. [Google Scholar] [CrossRef] [Green Version]
- Henning, J.G. Ground-based laser imaging for assessing three dimensional forest canopy structure. Photogramm. Eng. Remote Sens. 2006, 72, 1349–1358. [Google Scholar] [CrossRef]
- Hackenberg, J.; Spiecker, H.; Calders, K.; Disney, M.; Raumonen, P. Simpletree—An efficient open source tool to build tree models from TLS clouds. Forests 2015, 6, 4245–4294. [Google Scholar] [CrossRef]
- Cabo, C.; Ordóñez, C.; López-Sánchez, C.A.; Armesto, J. Automatic dendrometry: Tree detection, tree height and diameter estimation using terrestrial laser scanning. Int. J. Appl. Earth Obs. Geoinf. 2018, 69, 164–174. [Google Scholar] [CrossRef]
- Hegyi, F. A simulation model for managing jack-pine stands. In Growth Models for Tree and Stand Simulation; Royal College of Forestry: Stockholm, Sweden, 1974; pp. 74–90. [Google Scholar]
- Seidel, D.; Leuschner, C.; Scherber, C.; Beyer, F.; Wommelsdorf, T.; Cashman, M.J.; Fehrmann, L. The relationship between tree species richness, canopy space exploration and productivity in a temperate broad-leaf mixed forest. For. Ecol. Manag. 2013, 310, 366–374. [Google Scholar] [CrossRef]
- Comeau, P.G.; Heineman, J.L. Predicting understory light microclimate from stand parameters in young paper birch (Betula papyrifera marsh.) stands. For. Ecol. Manag. 2003, 180, 303–315. [Google Scholar] [CrossRef]
- Pretzsch, H.; Biber, P.; Ďurský, J. The single tree-based stand simulator silva: Construction, application and evaluation. For. Ecol. Manag. 2002, 162, 3–21. [Google Scholar] [CrossRef]
- Metz, J.; Seidel, D.; Schall, P.; Scheffer, D.; Schulze, E.D.; Ammer, C. Crown modeling by terrestrial laser scanning as an approach to assess the effect of aboveground intra- and interspecific competition on tree growth. For. Ecol. Manag. 2013, 310, 275–288. [Google Scholar] [CrossRef]
- Niklas, K.J. Size-dependent allometry of tree height, diameter and trunk-taper. Ann. Bot. 1995, 75, 217–227. [Google Scholar] [CrossRef]
- Valladares, F.; Gianoli, E.; Gómez, J.M. Ecological limits to plant phenotypic plasticity. New Phytol. 2007, 176, 749–763. [Google Scholar] [CrossRef] [PubMed] [Green Version]
- Hollaus, M.; Wagner, W.; Eberhöfer, C.; Karel, W. Accuracy of large-scale canopy heights derived from lidar data under operational constraints in a complex alpine environment. ISPRS J. Photogramm. Remote Sens. 2006, 60, 323–338. [Google Scholar] [CrossRef]
Figure 1.
Preview of a sample. Different scanning points are indicated with different colors.

Figure 2.
Extracting overlapping crown volume. (a) Overlap (volume) between the canopies of a broad-leaved tree and of bamboo. (b) Condition of the canopy, diameter at breast height, and height of broad-leaved tree. (c) Surface area and volume of canopy of broad-leaved tree. (d) Overlap (volume) between the canopies of a broad-leaved tree and of bamboo. (e) Overlap (volume) between a broad-leaved tree and bamboo surrounding the tree.

Figure 3.
Number of bamboo per unit area at different distances.

Figure 4.
Average diameter at breast height (DBH) at different distances.

Figure 5.
Three types of detection error. (a) The mark shows an existing broad-leaved tree or bamboo but not recognized during the extraction of point-cloud data. (b) The mark shows a ‘false positive’: the scan marked it as a broad-leaved tree or bamboo in the point-cloud data although no such tree or bamboo was present at the location. (c) The mark shows the trunk of a single tree whereas there were two separate trees at the spot.


Table 1.
The classification based on the different distance principle.
| The Principle of Scanning Ranging | Rang (m) | Data Accuracy (mm) | Instrument |
|---|---|---|---|
| Time-of-flight (ToF) | ≈1000 | >10 | Riegl, Leica, Trimble |
| Phase measurement (PS) | <100 | <10 | Zoller + Froehlich, IQSun |
Table 2.
Performance index of the Trimble TX8 terrestrial laser scanning (TLS). Note the value means the numeric value that each scanning parameters can set.
Table 2.
Performance index of the Trimble TX8 terrestrial laser scanning (TLS). Note the value means the numeric value that each scanning parameters can set.
| Scanning Parameters | Value | |||
|---|---|---|---|---|
| Maximum range (meters) | 120 | 340 | ||
| Scan duration (minutes) | 2 | 3 | 10 | 14 |
| Point spacing at 30 (millimeters) | 22.6 | 11.3 | 2.7 | - |
| Mirror rotating speed (rounds per second) | 60 | 60 | 30 | 16 |
| Effective scanning speed (million points per second) | 0.51 | 1.00 | 0.40 | - |
| Number of points (million points) | 34 | 138 | 555 | 312 |
| Laser wavelength (microns) | 1.5 | |||
| Min rang (meters) | 0.8 | |||
| Angle accuracy (seconds) | 8 | |||
Table 3.
Sample registration error.
| Sample | Station (mm) | Reference Ball (mm) | ||
|---|---|---|---|---|
| Average Distance | Maximum Distance | Average Distance | Maximum Distance | |
| 1 | 1.29 | 1.74 | 1.33 | 2.13 |
| 2 | 1.67 | 2.19 | 1.66 | 2.28 |
| 3 | 1.76 | 2.8 | 1.85 | 2.71 |
| 4 | 2.04 | 3.33 | 2.02 | 2.58 |
| 5 | 1.39 | 1.93 | 1.64 | 2.52 |
| 6 | 1.59 | 2.09 | 1.67 | 2.03 |
Table 4.
Recognition rate of terrestrial laser scanning.
| Sample | 1 | 2 | 3 | 4 | 5 | 6 |
|---|---|---|---|---|---|---|
| Single station recognition rate (%) | 89.93 | 75.00 | 89.29 | 84.40 | 77.00 | 79.73 |
| Multi-station recognition rate (%) | 98.56 | 98.61 | 99.86 | 99.92 | 90.00 | 99.32 |
Table 5.
The average number of bamboo in concentric circles of different radii with a broad-leaved tree at the center.
Table 5.
The average number of bamboo in concentric circles of different radii with a broad-leaved tree at the center.
| Sample No. | 1 m | 2 m | 3 m | 4 m | 5 m | 6 m | Total |
|---|---|---|---|---|---|---|---|
| 1 | 1.0 | 3.0 | 10.0 | 16.0 | 27.0 | 39.0 | 96.0 |
| 2 | 0.8 | 4.2 | 11.0 | 19.5 | 30.0 | 40.2 | 105.7 |
| 4 | 0.6 | 2.5 | 6.5 | 12.6 | 21.0 | 27.3 | 70.5 |
| 5 | 1.5 | 6.0 | 12.0 | 21.0 | 33.3 | 49.0 | 122.8 |
| 6 | 0.7 | 4.5 | 9.5 | 15.2 | 22.0 | 30.7 | 82.6 |
| average | 0.9 | 4.0 | 9.8 | 16.9 | 26.7 | 37.2 | 95.5 |
Table 6.
Values of basic parameters of broad-leaved trees in plot 1.
| Number | Broad-Leaved Tree | Age | DBH (cm) | Tree Height (m) | Branch Height (m) | Crown of East-West (m) | Crown of North-South (m) |
|---|---|---|---|---|---|---|---|
| 1 | Quercus | 32 | 23.6 | 12.1 | 4.4 | 2.4 | 4.9 |
| 2 | Quercus | 46 | 31.7 | 13.8 | 7.1 | 8.5 | 6.7 |
| 3 | Quercus | 45 | 35.8 | 15.4 | 4.7 | 6.6 | 9.6 |
| 4 | Quercus | - | 22.7 | 8.7 | 6.1 | 0 | 0 |
| 5 | Quercus | 6 | 7.7 | 5.6 | 3.1 | 1.2 | 1.4 |
Table 7.
Intersection of broad-leaved tree and bamboo crown.
| Tree | DBH (cm) | Tree Height (m) | Canopy Surface Area (m2) | Canopy Volume (m3) | The Canopy Intersection of Broad-Leaved Tree and Bamboo | |
|---|---|---|---|---|---|---|
| Surface (m2) | Volume (m3) | |||||
| Quercus 1 | 24.4 | 8.86 | 92.6 | 62.3 | - | - |
| Bamboo 1 | 7.2 | 8.3 | 17.1 | 5.6 | 15.6 | 3.5 |
| Bamboo 2 | 10.0 | 8.7 | 28.1 | 9.7 | 16.6 | 4.1 |
| Bamboo 3 | 8.4 | 8.7 | 57.9 | 32.8 | 14.1 | 2.5 |
| Bamboo 4 | 11.4 | 7.7 | 15.4 | 4.5 | 8.7 | 1.0 |
| Bamboo 5 | 7.7 | 11.4 | 23.8 | 6.9 | 23.8 | 6.8 |
| Bamboo 6 | 10.4 | 8.3 | 35.0 | 16.0 | 21.6 | 7.3 |
| Bamboo 7 | 10.2 | 10.4 | 40.0 | 18.0 | 21.6 | 7.1 |
| Quercus 2 | 30.6 | 11.37 | 131.9 | 104.5 | - | - |
| Bamboo 1 | 4.2 | 9.39 | 86.8 | 49.5 | 25.9 | 7.5 |
| Bamboo 2 | 10.4 | 8.0 | 27.4 | 11.7 | 22.8 | 8.3 |
| Bamboo 3 | 9.2 | 8.6 | 33 | 14.1 | 32.1 | 13.6 |
| Bamboo 4 | 9.4 | 9.1 | 56.2 | 31.8 | 20.3 | 3.2 |
| Quercus 3 | 35.0 | 11.54 | 124.7 | 110.1 | - | - |
| Bamboo 1 | 8.0 | 8.97 | 43.1 | 18.3 | 15.1 | 2.9 |
| Bamboo 2 | 8.8 | 10.32 | 53.1 | 28.3 | 30.9 | 10.3 |
| Bamboo 3 | 8.4 | 10.65 | 65.6 | 39.6 | 24.3 | 4.5 |
| Bamboo 4 | 11.2 | 9.45 | 35.4 | 15.3 | 24.9 | 6.8 |
| Bamboo 5 | 10.4 | 12.6 | 93.6 | 72.4 | 33.6 | 9.5 |
Table 8.
Crown competition index (CCI) in a mixed forest of bamboo and broad-leaved trees.
| Tree | DBH (cm) | Tree Height (m) | Canopy Volume (m3) | CCI | Average CCI | The Number of Bamboo |
|---|---|---|---|---|---|---|
| Quercus 1 | 24.4 | 8.9 | 62.3 | 35.0 | 5 | 7 |
| Quercus 2 | 30.6 | 11.4 | 104.5 | 33.5 | 8.4 | 4 |
| Quercus 3 | 35 | 11.5 | 110.1 | 35.2 | 7.0 | 5 |
© 2018 by the authors. Licensee MDPI, Basel, Switzerland. This article is an open access article distributed under the terms and conditions of the Creative Commons Attribution (CC BY) license (http://creativecommons.org/licenses/by/4.0/).
Share and Cite
MDPI and ACS Style
Yan, Y.; Xia, M.; Fan, S.; Zhan, M.; Guan, F. Detecting the Competition between Moso Bamboos and Broad-Leaved Trees in Mixed Forests Using a Terrestrial Laser Scanner. Forests 2018, 9, 520. https://doi.org/10.3390/f9090520
AMA Style
Yan Y, Xia M, Fan S, Zhan M, Guan F. Detecting the Competition between Moso Bamboos and Broad-Leaved Trees in Mixed Forests Using a Terrestrial Laser Scanner. Forests. 2018; 9(9):520. https://doi.org/10.3390/f9090520
Chicago/Turabian StyleYan, Yingjie, Mingpeng Xia, Shaohui Fan, Meichun Zhan, and Fengying Guan. 2018. "Detecting the Competition between Moso Bamboos and Broad-Leaved Trees in Mixed Forests Using a Terrestrial Laser Scanner" Forests 9, no. 9: 520. https://doi.org/10.3390/f9090520
Note that from the first issue of 2016, this journal uses article numbers instead of page numbers. See further details here.