Next Article in Journal
First Report on Establishment of Laricobius osakensis (Coleoptera: Derodontidae), a Biological Control Agent for Hemlock Woolly Adelgid, Adelges tsugae (Hemiptera: Adelgidae), in the Eastern U.S.
Next Article in Special Issue
Estimation and Uncertainty of the Mixing Effects on Scots Pine—European Beech Productivity from National Forest Inventories Data
Previous Article in Journal
Evaluation of Composite Burn Index and Land Surface Temperature for Assessing Soil Burn Severity in Mediterranean Fire-Prone Pine Ecosystems
Previous Article in Special Issue
The Contribution of Forest Structure to Complementarity in Mixed Stands of Norway Spruce (Picea abies L. Karst) and European Larch (Larix decidua Mill.)
 
 
Erratum published on 3 September 2018, see Forests 2018, 9(9), 543.
Article

Over- and Underyielding in Time and Space in Experiments with Mixed Stands of Scots Pine and Norway Spruce

1
Institute of Ecology, Ilia State University, Cholokhashvili ave. 3/5, 0162 Tbilisi, Georgia
2
Southern Swedish Forest Research Centre, SLU, Rörsjövägen 1, SE-23053 Alnarp, Sweden
3
Department of Silviculture, Warsaw University of Life Sciences, Nowoursynowska 159, 02-776 Warsaw, Poland
4
Forest Research Institute, Braci Leśnej 3, Sękocin Stary, 05-090 Raszyn, Poland
5
School of Biological Sciences, Royal Holloway University of London, Egham, Surrey TW20 0EX, UK
6
Skogforsk, Ekebo 2250, 268 90 Svalöv, Sweden
7
Forest Research, Northern Research Station, Roslin, Midlothian, Scotland EH25 9SY, UK
8
Chair for Forest Growth and Yield Science, Technische Universität München, Hans-Carl-von-Carlowitz-Platz 2, Freising, D-85354 Bavaria, Germany
9
Natural Resources Institute Finland, P.O. Box 2, FI-00791 Helsinki, Finland
*
Author to whom correspondence should be addressed.
Forests 2018, 9(8), 495; https://doi.org/10.3390/f9080495
Submission received: 7 May 2018 / Revised: 24 July 2018 / Accepted: 31 July 2018 / Published: 13 August 2018
(This article belongs to the Special Issue Competition and Facilitation in Mixed Species Forests)

Abstract

:
Pine-spruce forests are one of the commonest mixed forest types in Europe and both tree species are very important for wood supply. This study summarized nine European studies with Scots pine and Norway spruce where a mixed-species stand and both monocultures were located in an experimental set-up. Overyielding (where growth of a mixed stand was greater than the average of both monocultures) was relatively common and often ranged between 0% and 30%, but could also be negative at individual study sites. Each individual site demonstrated consistent patterns of the mixing effect over different measurement periods. Transgressive overyielding (where the mixed-species stand was more productive than either of the monocultures) was found at three study sites, while a monoculture was more productive on the other sites. Large variation between study sites indicated that the existing experiments do not fully represent the extensive region where this mixed pine-spruce forest can occur. Pooled increment data displayed a negative influence of latitude and stand age on the mixing effect of those tree species in forests younger than 70 years.

1. Introduction

Norway spruce (Picea abies (L.) Karst.) and Scots pine (Pinus sylvestris L.) are among the commonest tree species in northern European forests and together cover more than 150 million hectares [1,2]. Both tree species can co-exist on a wide range of sites, but late-successional Norway spruce prevails under moister conditions while the pioneer Scots pine dominates on drier and more nutrient-poor sites [3,4]. The natural distribution of both species overlaps in Norway, Sweden, Finland, NW Russia, the Baltic countries, Belarus, and NE Poland, as well as in some mountainous areas of central and southern Europe (Figure 1). Both tree species are of major economic importance due to their productivity and the wide range of uses of the timber. The common forest management practice has been to favor single-species stands of either spruce or pine. Nevertheless, mixed stands of both tree species are widespread due to overlapping natural distribution and compatible regeneration and growth patterns.
Recently, there has been increasing interest in tree species mixtures as they seem to provide a more complete suite of forest ecosystem services [6,7]. Felton et al. [8] anticipated biodiversity benefits from the conversion from spruce monocultures to pine and spruce mixtures. In order to quantify the potential impacts on wood production and the trade-offs in ecosystem services, it is important to know how the growth and yield of mixed pine-spruce stands can differ from those of monocultures on similar sites. In addition, as wood production per unit area is relevant to carbon storage and climate change policies, and is a major driver of silvicultural decisions, better knowledge about the comparative growth performance of mixed and monospecific stands on sites that are suitable for both tree species is crucial. Niche complementarity could occur between Scots pine and Norway spruce on the basis of certain traits such as the light-demanding pine versus the shade-tolerant spruce, or because of different rooting depth (Table 1). Furthermore, resistance can increase in these mixtures, for example, a lower incidence of Heterobasidion annosum in mixed stands [9]. This trend is probably not true of all pests; for example, browsing damage was higher or similar in mixed stands [10,11].
Comparisons of productivity between mixed- and single-species stands can refer to the most productive monoculture or the average productivity of the corresponding monocultures. Reports on mixed pine-spruce experiments in Scandinavia [17,18,19] found 7%–26% higher productivity in mixed species forests compared with the average growth of both monocultures (common overyielding). However, growth models widely applied in these regions (e.g., [20,21]) assume no positive interactions between species growing in mixture.
No evidence of transgressive overyielding, i.e., higher productivity in a mixed stand compared to the most productive monoculture, was found in Scandinavia [17,18,19] (although this was found by Pretzsch and Schütze in another study [22]). Lindén and Agestam [18] found temporal changes in the relative yield in mixed stands, which increased considerably during the last measurement periods on two sites while it decreased on another site. By contrast, reports on the first [14] and second rotation [23] of two experiments on the same site in northern England indicated a positive interaction between both tree species, resulting in a transgressive overyielding in the mixture. Similar conclusions were drawn by [24] who analyzed Polish yield data monitored for more than 100 years.
Although mixing effects at single sites (or ages) can represent significant increases in productivity, the mean mixing effect for the same mixture across a wide range of sites (or over a whole rotation) can be smaller and nonsignificant [25]. In order to understand how the mixing of these tree species affects productivity at larger scale, we analyzed the accessible increment data from known Scots pine–Norway spruce mixed forest experiments in Europe. As contrasting effects of mixing on stand growth have been reported for varying climate, soil conditions, and mixture proportions [12,26], we included an evaluation of site factors potentially influencing growth that were available from the experiment description.
We particularly searched for evidence of transgressive overyielding since this aspect is most important for any forest manager who aims to maximize wood production (Question 1 below). However, we also compared stand growth of mixed pine-spruce stands with the average stand growth of both monocultures (over- or underyielding, Question 2). The latter approach corresponds with most of the recently published growth studies in mixed forests regarding biodiversity–productivity relationships, e.g., [27,28]. The main objective of this study was to analyze the effect of species mixing of Scots pine and Norway spruce on forest productivity at a stand level in order to answer the following three research questions:
  • Are Scots pine–Norway spruce mixed stands more productive than the most productive monoculture of either tree species (transgressive overyielding)?
  • Are Scots pine–Norway spruce mixtures more productive than the average of both corresponding monocultures (overyielding)?
  • Does the mixing effect change significantly over stand age or with site conditions?

2. Materials and Methods

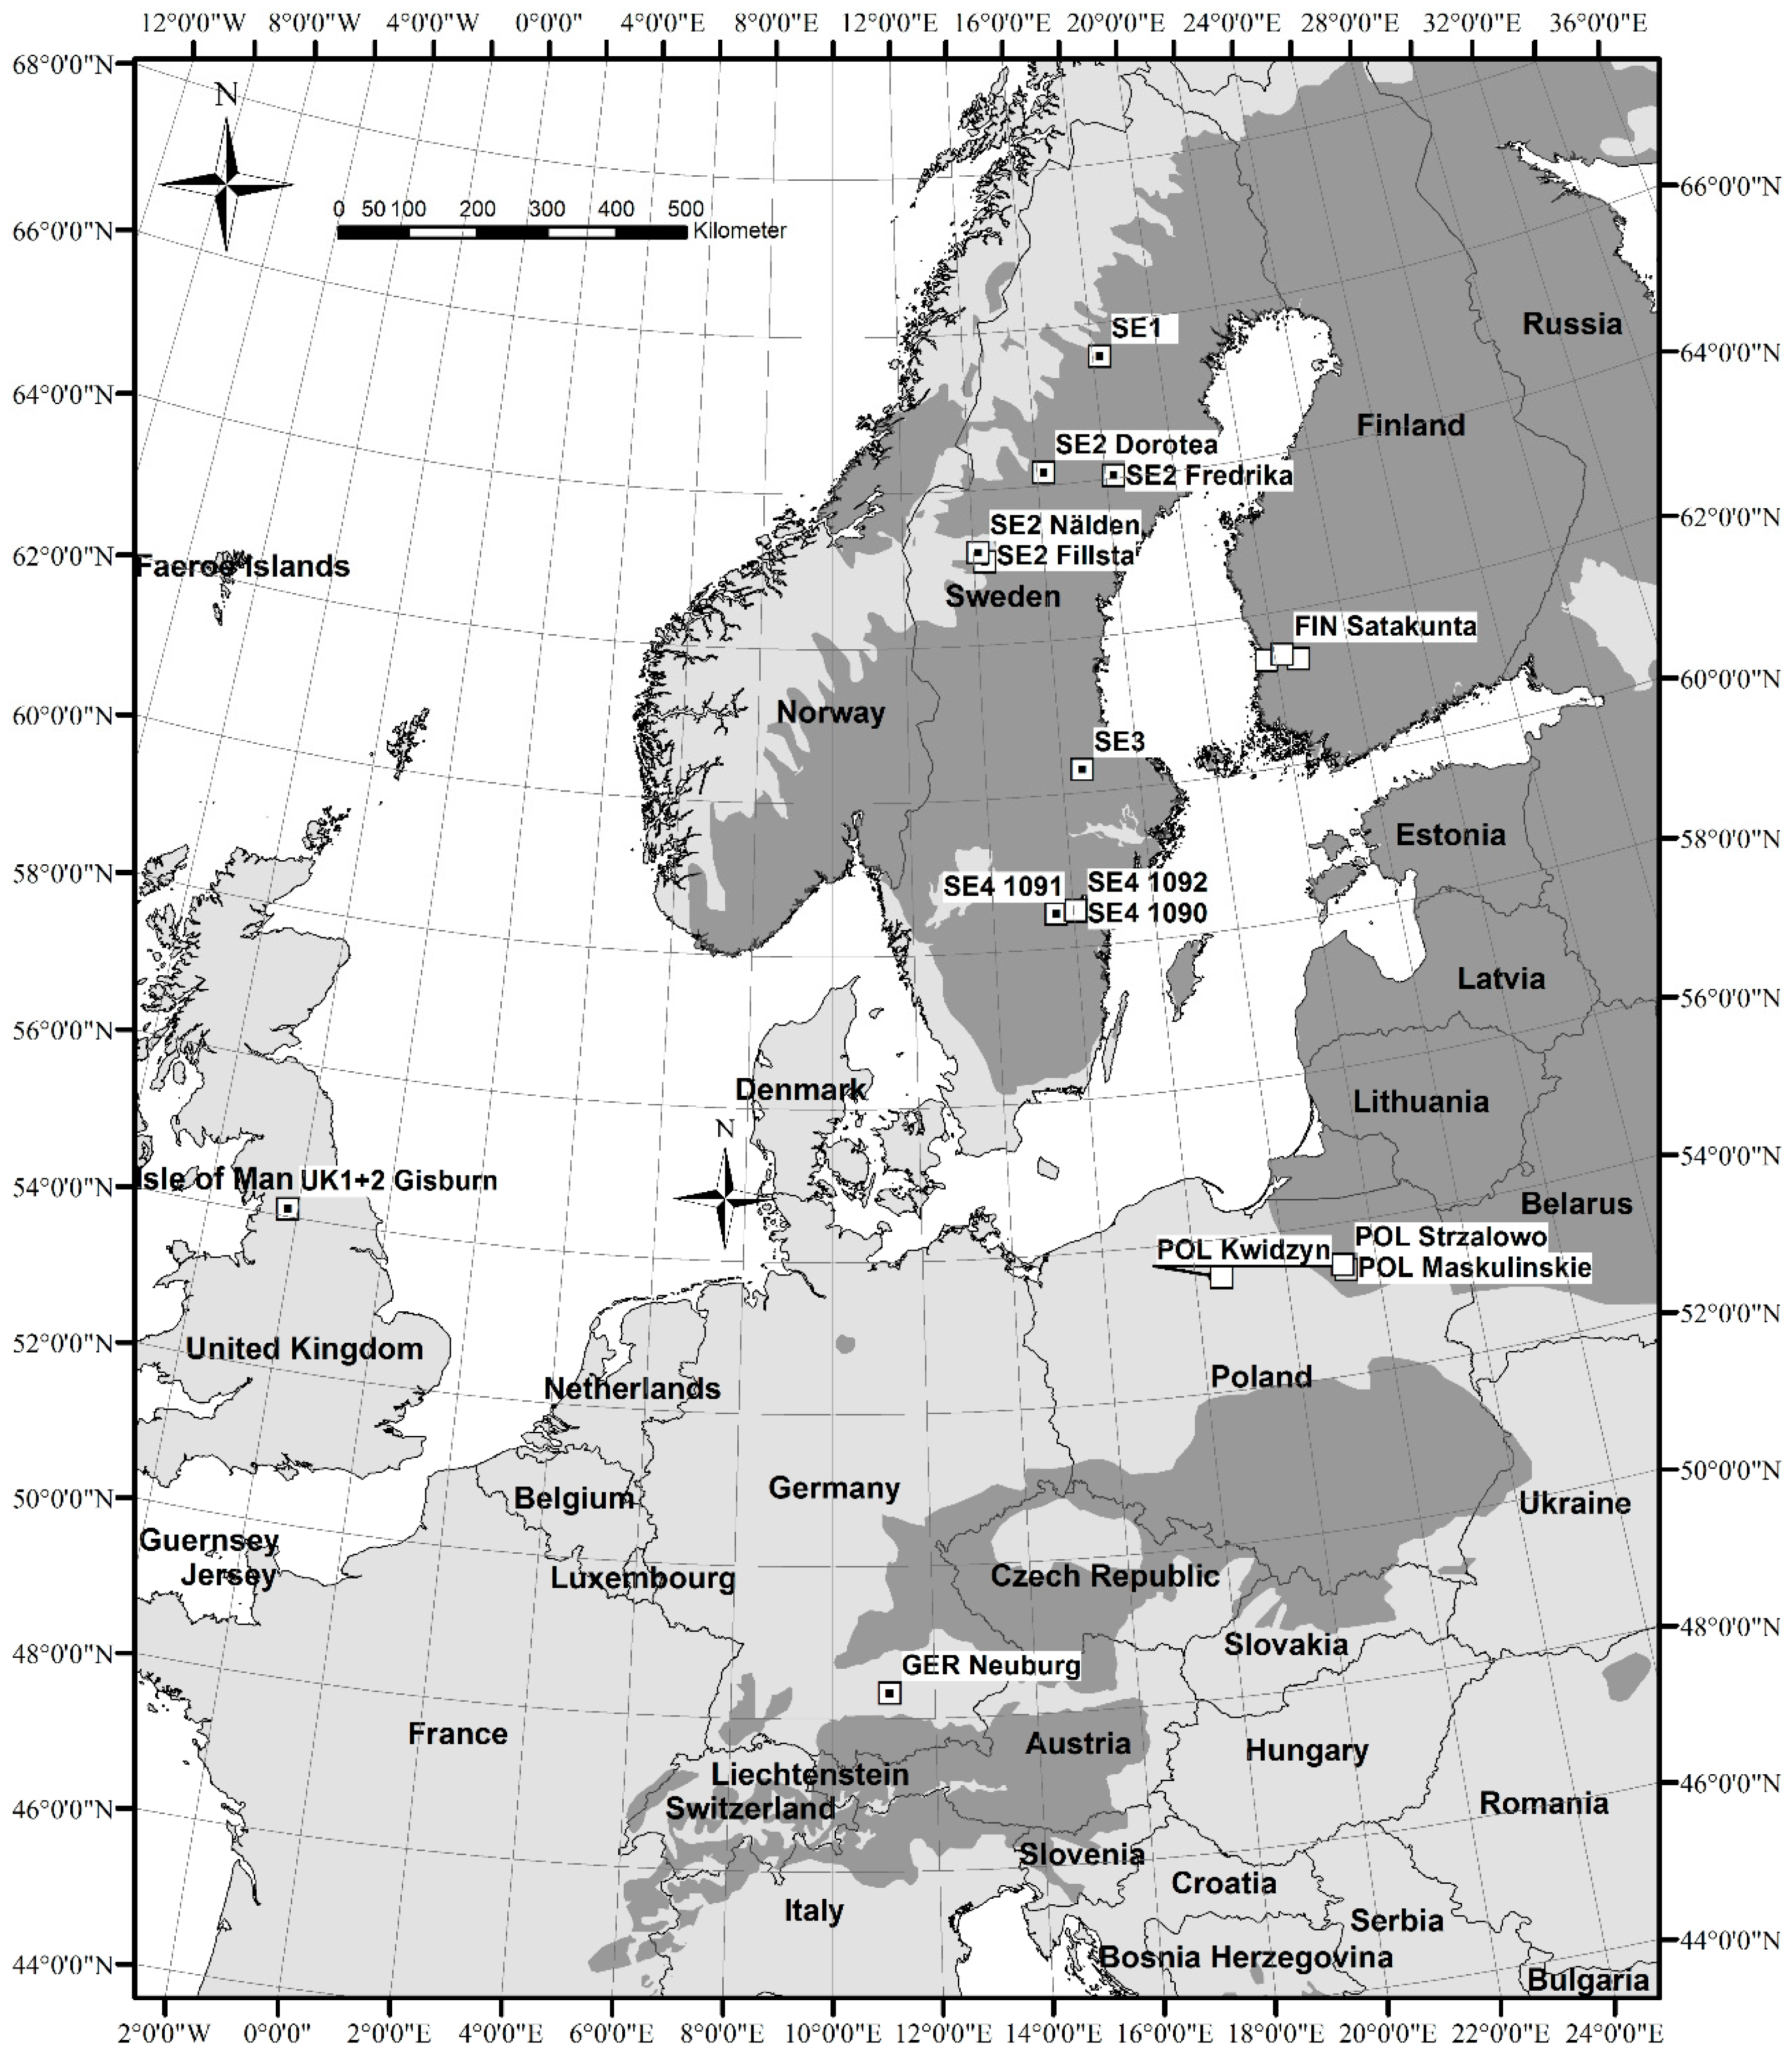
2.1. Material: Study Sites

We collected information about stand growth from nine studies in Northern and Central Europe (Figure 1 and Table 2), most containing the following three treatments: a Scots pine–Norway spruce mixed stand, a pure Scots pine stand, and a pure Norway spruce stand. All treatments within a study were of comparable age and growing in similar site conditions. However, some studies contained several study sites, but not every site contained all treatments (see below). One study was lacking the treatment “pure Norway spruce” [24]. To our knowledge, there are no other long-term experiments containing pure and mixed Scots pine and Norway spruce stands in Europe.
Six of the nine experiments have already been reported: SE1 [18], SE3 [17], SE4 [19], UK1 [14,29], repeated on the same site UK2 [23], and POL [24]. The study SE3 was complemented by additional measurements by the original authors in 2013. The experimental layout for SE2 was described by [30] and for FIN by [31]. The study site GER was named study site SRO in [32].
Four of the nine studies contained replicated treatments on more than one study site. Hence, in total, 18 study sites with rectangular study plots were included in this survey. Growth and mortality of Scots pine and Norway spruce had been monitored for single measurement periods of 3 to 33 years.
On five of the 18 sites, pure Norway spruce stands were not included in the experiment (two sites of SE4 and the three sites of POL). In the study GER, the monospecific Norway spruce plot was only established in 2015. On this plot, former dendrometric measures for each tree were derived by diameter and height reconstruction (according to Pretzsch et al. [26]).
Most of the studied stands were planted (Table 2). One mixed-species stand in POL and all SE3 stands were seeded. In all experiments, the even-aged mixtures contained tree species intermingled either on a tree-by-tree basis or in very small groups. Some spruce trees in the mixed-species plots in Germany and Poland could have originated from natural regeneration and may differ slightly in age. Except SE4, management was excluded or minimized after stand establishment in all experiments. In the British, Swedish, and Finnish experiments, the various treatments in each experiment were established using a common management regime. By contrast, the Polish and German study plots were established in existing mixed- and single-species stands; these plots were on the same sites and of similar age, but stand history before establishment of the study plots is unknown. Thinnings were carried out in SE4, keeping an equal total stem number in all treatments after thinning (Table 2). In POL and GER, only study plots which had been unthinned or very lightly thinned in the past were selected (i.e., A- and B-grade thinning intensities, see Pretzsch [33], pp. 157–158). That means that they grew close to the self-thinning line, and the growth was largely unaffected by thinning.
Table 2 summarizes the experimental design that varied between the studies. The experiments UK1, UK2, SE1, SE2, SE3, SE4, and FIN were designed as randomized block experiments to study the effect of one factor (the forest type—in our case, pine, spruce, and mixed pine-spruce) on stand growth. However, no monospecific spruce forest was included on two of the three sites of SE4, because pure spruce did not occur on these sites. The number of study sites and replicated treatments can be seen in Table 2. In SE1 and SE3, subplots within each 35 × 40 m study plot for the replicated treatments were established [17,18]. UK1, UK2, and FIN contained three replicates of each treatment at each study site. POL included four replicated treatments of monospecific pine and mixed forest on the site Maskulinskie, but there was no replication at other sites in Poland or Germany. Also, the selection of plots for each treatment was not randomized in the studies POL and GER.
We compensated for any shortcomings in different study designs in further statistical analyses by calculating mean growth and yield parameters individually, as well as standard deviations for each of 18 study sites. The studies SE2, SE4, POL, and FIN comprised blocks on three or four separate study sites. While most study plots per study site were located adjacent to each other (with a buffer zone), the largest distances between study plots were 50–800 m on Polish sites and 400 m on the German site.
The size of sample plots was largest in POL and smallest in FIN and SE1–3 (Table 2). In SE1 and SE3, each study plot was measured by 12 sample plots of 28 m2 [17,18]. In most cases, the mixture proportion was equal when the experiment was established, except in POL where spruce represented one-third or less of the total basal area (BA) and in SE2 where it varied from 50% to 90%.
The studies covered a large latitudinal range with growing seasons varying from 130 days per year in Northern Sweden to more than 200 in the U.K. (Table 3). The understorey vegetation was dominated by Vaccinium myrtillus on mainly mesic and moist forest sites. The study site in Table 3 refers to the same site with adjacent study plots. The experimental site in the U.K. differed in vegetation and the soil moisture regime can be characterized as very moist or wet. Podzolic soils were the main soil types present across the sites, but gleys and brown earths were also found. Mean annual temperature ranged from −0.5 °C to +8 °C.
As further notes, the sites Maskulinskie and Strzałowo (POL) were affected by a large Lymantria monacha outbreak that heavily reduced the growth of pine: growth rates more than two times higher were observed in the mixture during the subsequent measurement period due to the response of spruce to the improved light conditions. Wind damage forced the early closure of UK1. Slight single-tree wind damages were also reported from other experiments.

2.2. Methods

To answer our three research questions, we performed two analyses: an analysis (A) of stand growth on each study site showing absolute and relative production values within each experiment (Question 1 and 2), and an analysis (B) of mixing effects combining the ten study sites that contain all three treatments with single measurement periods into one data set (Question 3).

2.2.1. Quantifying of Mixing Effects

For the comparison of stand productivity P of pine and spruce in mixed stands with the most productive monoculture, Equation (1) was used to provide a measure of transgressive overyielding [39].
M E max = P ( P i n e x + S p r u c e x ) ¯ max ( P   P i n e 0 ¯ , P   S p r u c e 0 ¯ )
In the equations, the suffix X indicates a tree species growing in a mixed stand and 0 indicates a tree species growing in a monospecific stand. For the Norway spruce-Scots pine mixture with respect to average productivity of both monocultures of each species, Equation (2) was used to calculate the mixing effect ME which provides a measure of common overyielding [39].
M E = P ( P i n e x + S p r u c e x ) ¯ ( P   P i n e 0 ¯ + P   S p r u c e 0 ¯ 2 )
The ratios MEPine and MESpruce in Equations (3) and (4) were calculated to quantify a tree-species-specific mixing effect for Norway spruce or Scots pine respective to one type of monoculture (Equations (3) and (4)).
M E P i n e = P ( P i n e x + S p r u c e x ) ¯ P   P i n e 0 ¯
M E S p r u c e = P ( P i n e x + S p r u c e x ) ¯ P   S p r u c e 0 ¯

2.2.2. Statistical Analysis and Models

In addition to the productivity ratios observed in single experiments (Analysis A), we studied the influence of the following site and stand variables on the overyielding parameters (Equation 1 and 2) for each measurement period of all experiments in a pooled Analysis B: latitude, length of growing season, mean annual temperature, annual precipitation, the Martonne index of aridity [40], site index for spruce and pine (i.e., dominant height at the reference age of 100 years), vegetation type, soil type, and soil moisture (see Table 3), as well as stand age (6 to 132 years), BA (pine: 0.3 to 46, spruce: 0.1 to 39, and mixture: 0.4 to 47 m2 ha−1), stem number (pine: 181–2640, spruce: 863–3880, mix: 181–2980), Stand density index SDI (pine: 141–1842, spruce: 108–1192, mix: 150–1268; a density measure when comparing stands of different age and site [41]), mean diameter ratio of pine and spruce trees in the mixture (0.86 to 3.04, based on stem diameter at 1.3 m height), and initial mixture proportion of the measurement period (1 to 59% of spruce, based on BA, standing volume, or stem number in descending order of preference). See the supplementary data for more details.
To calculate the stand productivity ratio, stand BA growth (or stand volume growth, in this order of preference) was used. While most results of Analysis B refer to ME without the consideration of tree species proportions, an additional statistical model was tested to compare ME and MEmix%, where ME in Equation (2) was weighted by the tree species proportions mPine and mSpruce. The mixture proportion at the beginning of each measurement period was used (Equation (5)).
M E m i x % = P ( m P i n e P i n e x + m S p r u c e S p r u c e x ) ¯ ( P   P i n e 0 ¯ + P   S p r u c e 0 ¯ 2 )
Given the hierarchical structure of the data, linear mixed models were chosen to account for autocorrelations of measurements within the studies. The following model was used to explore the influence of covariables on a given productivity ratio:
yij = µ + αi + β1xj + … + βnxnj + εij,
where yij is a productivity ratio according to Equations (1), (2), or (5) on the study site i in the observation period j, µ is a general mean, αi is a random effect for the location, x is a tested dependent variable, β1–βn are fixed effect coefficients, and ε is a random error with normal distribution.
When exploring the relationships between mixing effect and the other factors (see the 16 site and stand variables above), observations during stand initiation (defined as the period within 10 years of stand establishment) were excluded to avoid extremely high yield ratios due to small tree sizes (<3 cm mean stem diameter). Thus, the first two measurement periods in UK2 and the young experiment FIN were excluded from pooled analyses. Single measurement periods were analyzed to assess the variation of ME values and the conformity of observed growth trends on individual studies and sites.
When linear mixed models were used to identify statistically significant factors, only growth observations were included in the analysis. Akaike’s Information Criterion modified for small samples (AICc) and the likelihood test were used to compare different models. All statistical calculations were done with the R package ’nlme’ [42].
For the discussion, the analysis was repeated when growth estimates for monospecific spruce on the study sites 1090 and 1092 in SE4 and POL were also included. The estimates were based respectively on the growth simulator for Swedish forests [20] and yield tables for Norway spruce [43] that are widely used in forest practice under Swedish and Polish conditions. The aim of this exercise was to detect signals that could be useful for future mixed forest growth modeling to improve yield predictions in the northern half of Europe.
In addition to linear mixed models, Pearson correlations were used to explore positive or negative relationships between single variables and mixture effects.

3. Results

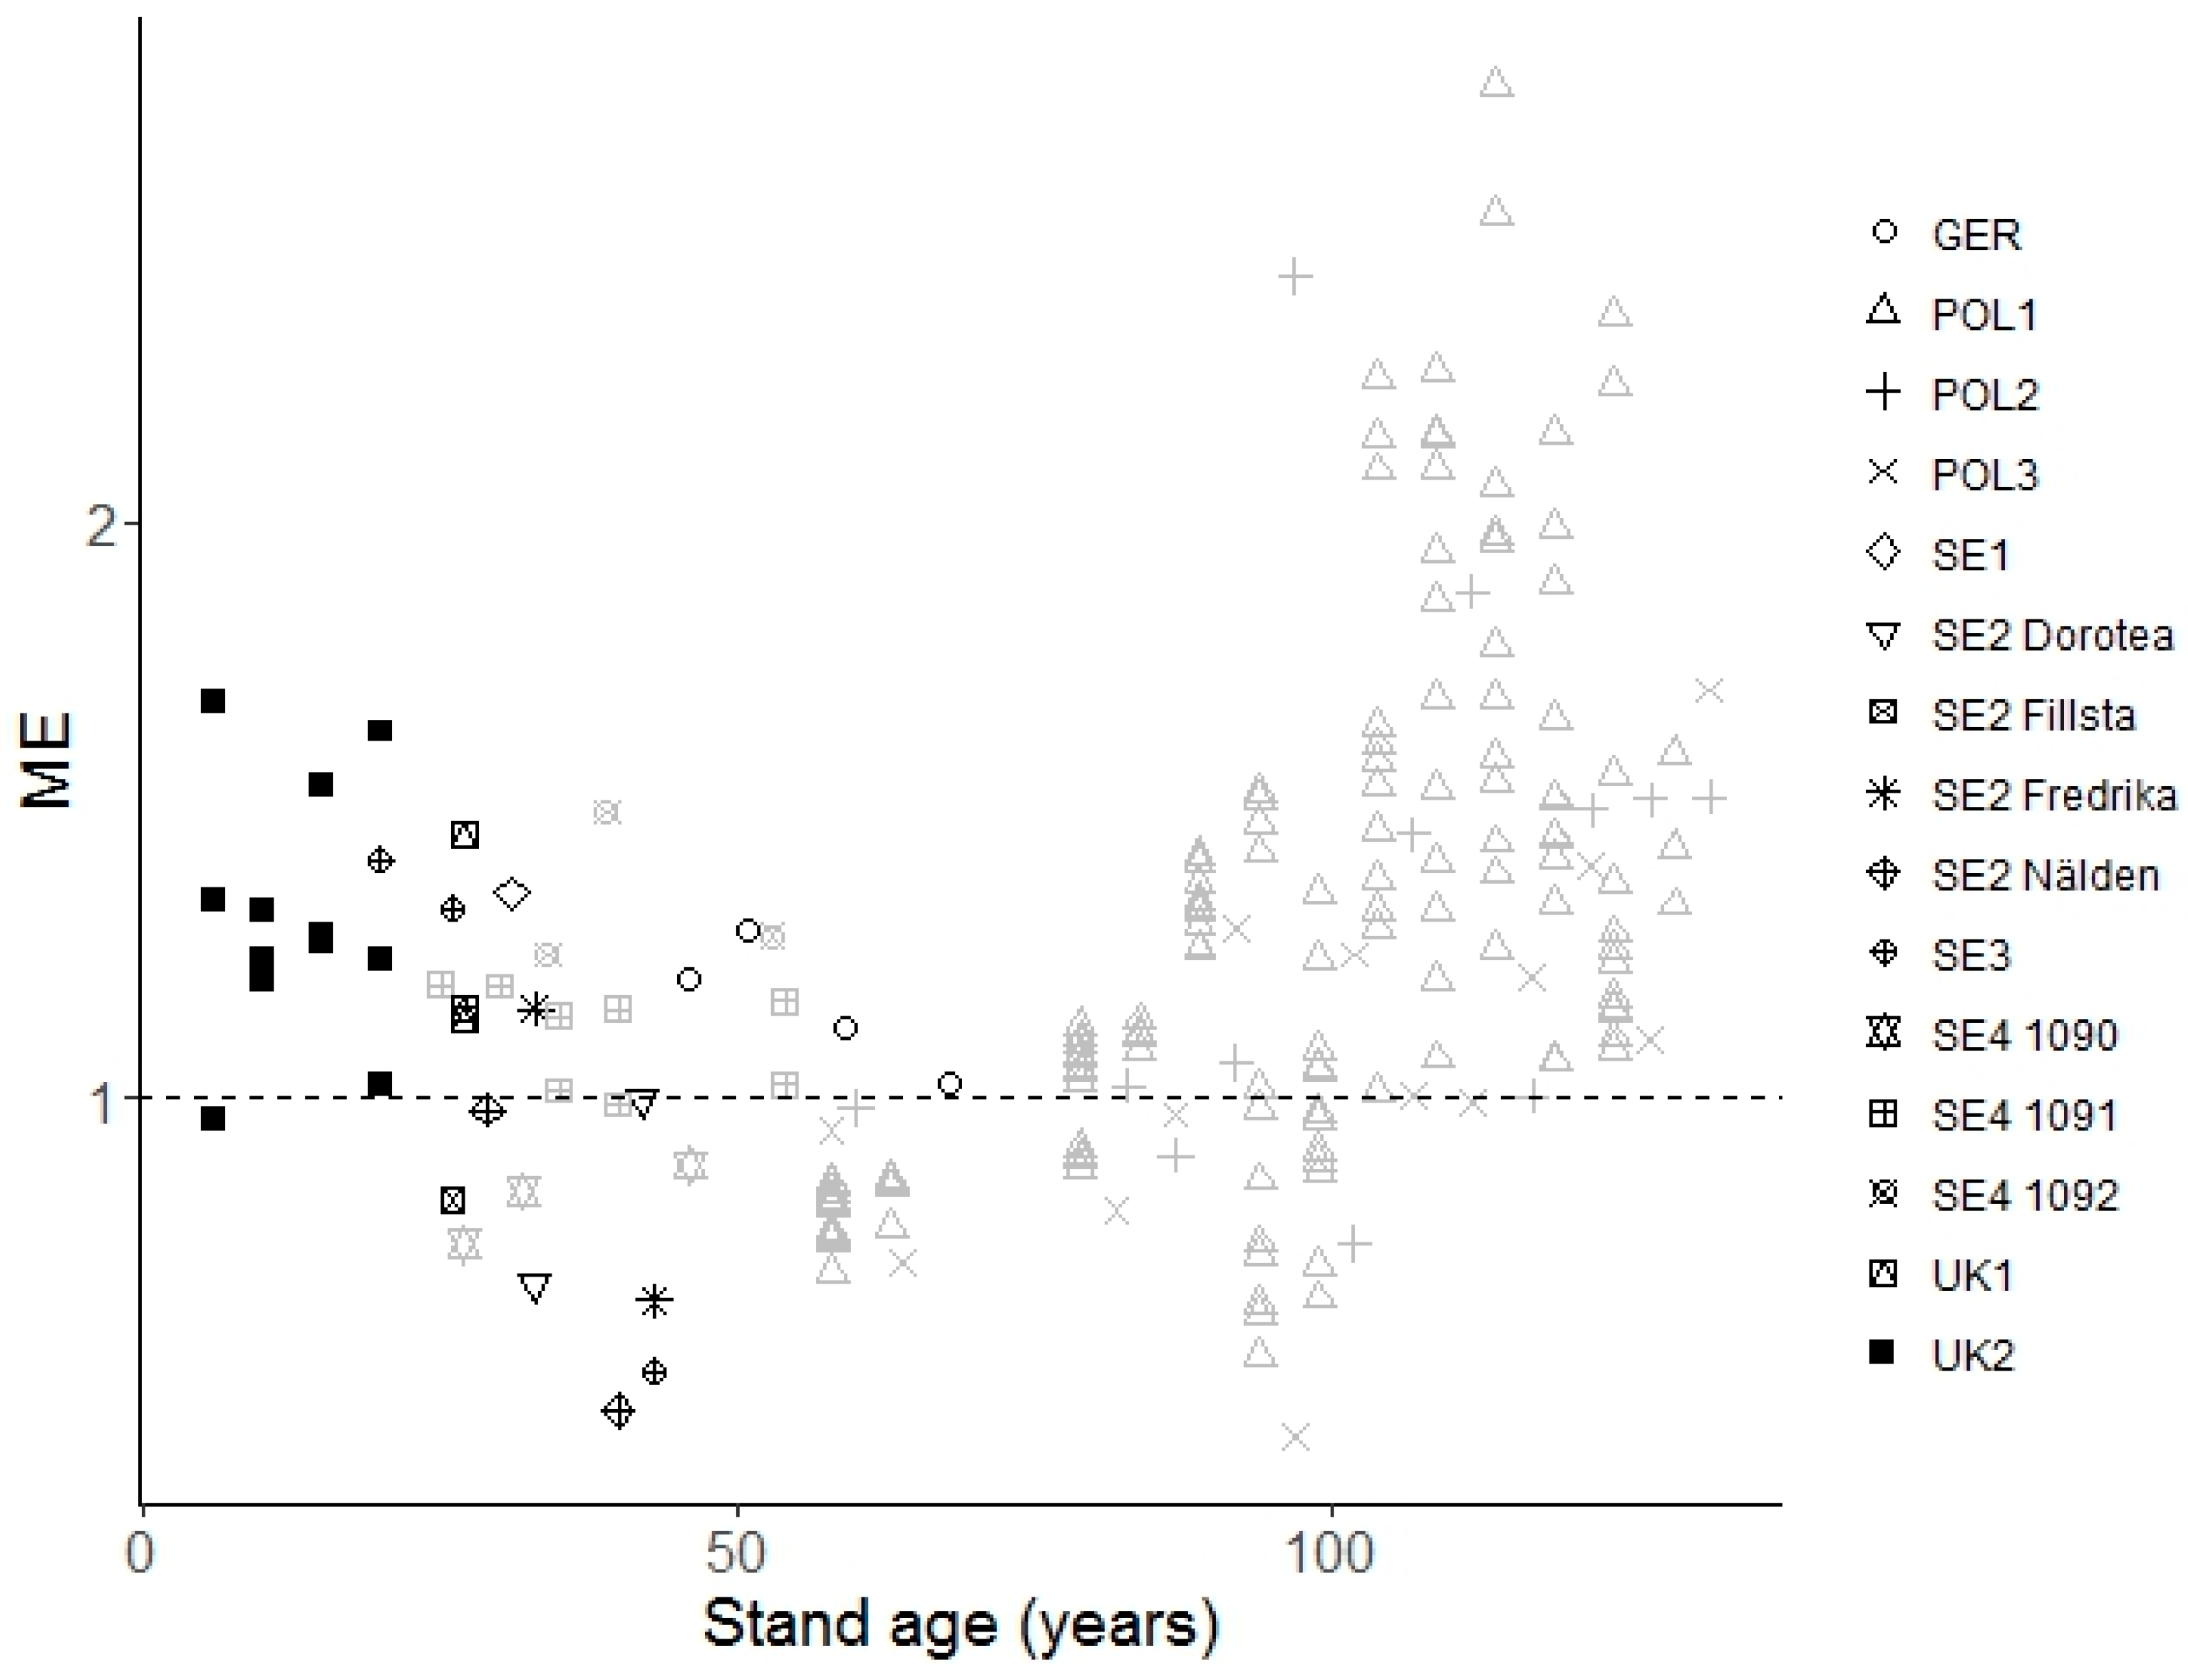
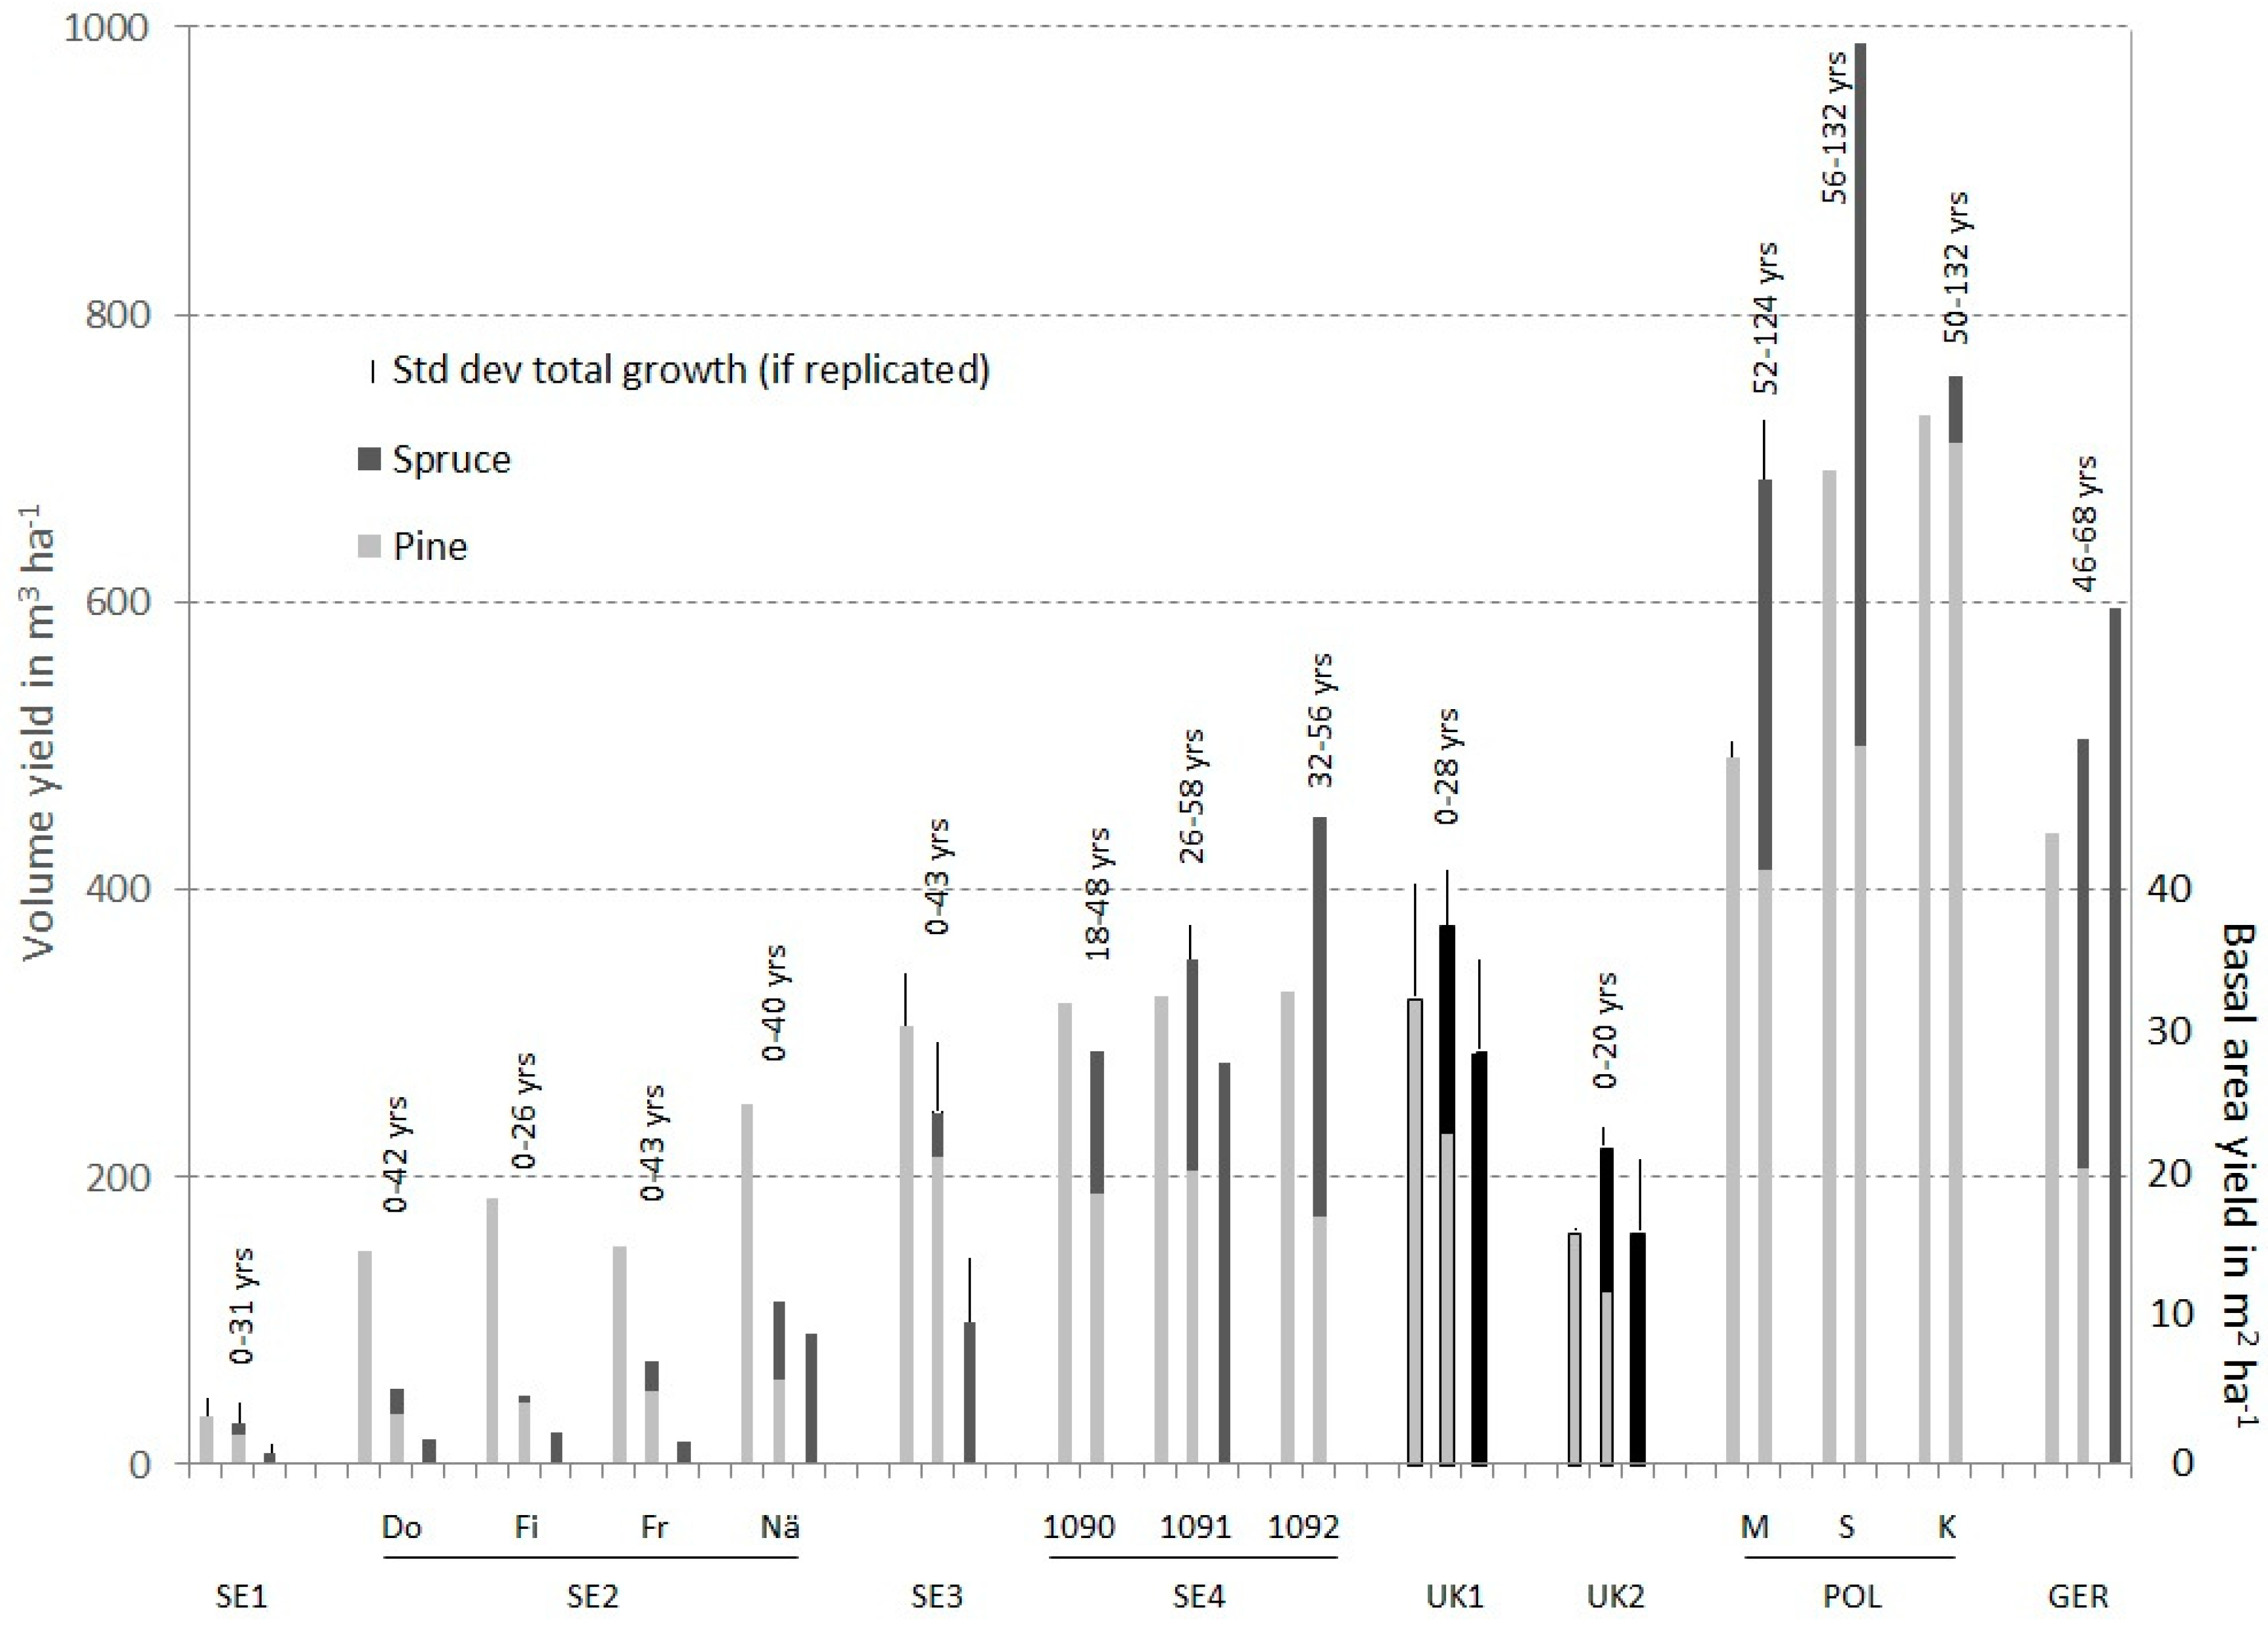
3.1. Over- and Underyielding in Single Experiments (Analysis A)

Different levels of production per treatment on each site are illustrated in Figure 2. Transgressive overyielding was observed in UK1, UK2, and SE4, while common overyielding occurred in five experiments (also described by the ME values in Table 4).
While the stand ages in the studies in northern Europe often covered only the first half of the rotation period, the Polish and German studies contained more mature stands. In the experiments SE1, SE2, and SE3, monospecific pine was the most productive at half rotation age while in SE4, UK1, UK2, and POL, mixed pine-spruce stands were most productive. In contrast, in GER, monospecific spruce was the most productive treatment. In SE1, SE2, and SE3, volume productions of pure pine were 19% (±4% confidence interval), 113–285%, and 25% (±10% CI) higher than in the mixture. In SE4, UK1, UK2, and POL, the productions by the mixture were 12%, 15% (±26% CI), 22% (±11% CI), and 4–41% higher than the most productive monoculture (Table 4). In GER, the monospecific spruce produced 15% more wood than the mixture. The confidence interval was calculated for statistically designed experiments with both treatments replicated.
No information on stand growth was available for the youngest experiment FIN, but mean tree heights of 4.4 m (1.1 m standard deviation) in monospecific pine, 3.8 m (0.6 m) in monospecific spruce, and 4.5 (1.2 m) and 3.4 m (0.4 m) of pine and spruce trees, respectively, in mixture were measured after 12 years.
Table 4 shows the production values per experiment and study site with the corresponding mixing effects calculated according to the Equations (1)–(4). Compared to the most productive monoculture, the mixture effect ME max ranged from 0.3 to 1.2. In three out of ten study sites, transgressive overyielding was observed where the mixture was 8–22% more productive. The lowest ME max was found in experiment SE2 where the mixed stands produced only 40% compared with monospecific pine after 40 years. In other cases, the mixture was 15–20% less productive than the most productive monoculture. Compared with the average productivity of the corresponding monocultures, the mixture effect ME ranged from 0.7 to 1.4 across all experiments.
Concerning the productivity of pine-spruce mixtures relative to pine, the experiments revealed a large range of effects on stand growth: from 0.3 to 1.4 on single sites (MEpine in Table 4). Interestingly, these values ranged between 0.3 and 0.8 on sites north of latitude 60, and between 0.9 and 1.4 in the south. Often, the productivity of mixtures relative to spruce monocultures was more than double on the northern sites (see MEspruce in Table 4).
The ME estimates of single measurement periods vary within single experiments and on individual sites from the reported mean values in Table 4. For example, the ME max values for the first and last measurement period of the experiments SE3, GER, and UK2 equaled 0.97 and 1.05 (5–20 and 26–43 years), 1.18 and 1.1 (46–51 and 68–73 years), and 8 and 1.96 (0–6 and 15–20 years), respectively. Three of four sites in SE2 also allowed such a comparison: 0.3 and 0.5 (0–33 and 33–42 years), 0.4 and 0.8 (0–33 and 33–43 years), and 0.5 and 0.4 (0–29 and 29–40 years). ME ratios for the first and last measurement period were 1.41 and 1.12 in SE3, 0.33 and 1.33 in UK2, and 0.95 and 0.97 in GER.
In Figure 3 we contrast the different periodic annual increments of mixed and pure stands based on basal area or volume growth per measurement period. The increment of BA (as well as stem volume increment) varied considerably between 0.1 and 5 m2 ha−1 a−1 (or 1 and 30 m3 ha−1 a−1). The values above the 1:1 bisector line represent better growth performance of the tree species mixture, while values below the line display a better performance of the monoculture.
Merging the different stands and measurement periods in Figure 3 did not reveal a general pattern of superior stand growth either in the mixed or the monospecific stands. Although the majority of points in Figure 3a,d indicate that the growth between single measurements was somewhat larger for pine-spruce than for pure pine, this was not true in the most northern experiments SE1, SE2, and SE3. The eight observations of BA growth (12 observations of volume growth) from those three experiments lie under the bisector line in Figure 3a,d, while the observations in POL dominate the graph.
As the yield tables used for pure spruce in POL did not provide BA estimates, they are not included in Figure 3b,c. Both figures reveal that most measurement periods indicate better growth in the mixed stands compared with monospecific spruce or the average of both monocultures. Also, both graphs suggest that this is the case on sites with generally higher site productivity. This pattern is not evident for periodic increment of volume during the single measurements in Figure 3e,f. On the contrary, when volume was measured (black dots), monospecific spruce or the average growth of both monocultures performed slightly better than the mixture. In GER, the stem volume productivity of monospecific spruce was significantly and constantly higher than that of the mixed or the monospecific pine. This was not so evident for the periodic annual increment of BA. The pattern would disappear if volume growth estimates (POL and SE4) were included (Figure 3e,f).

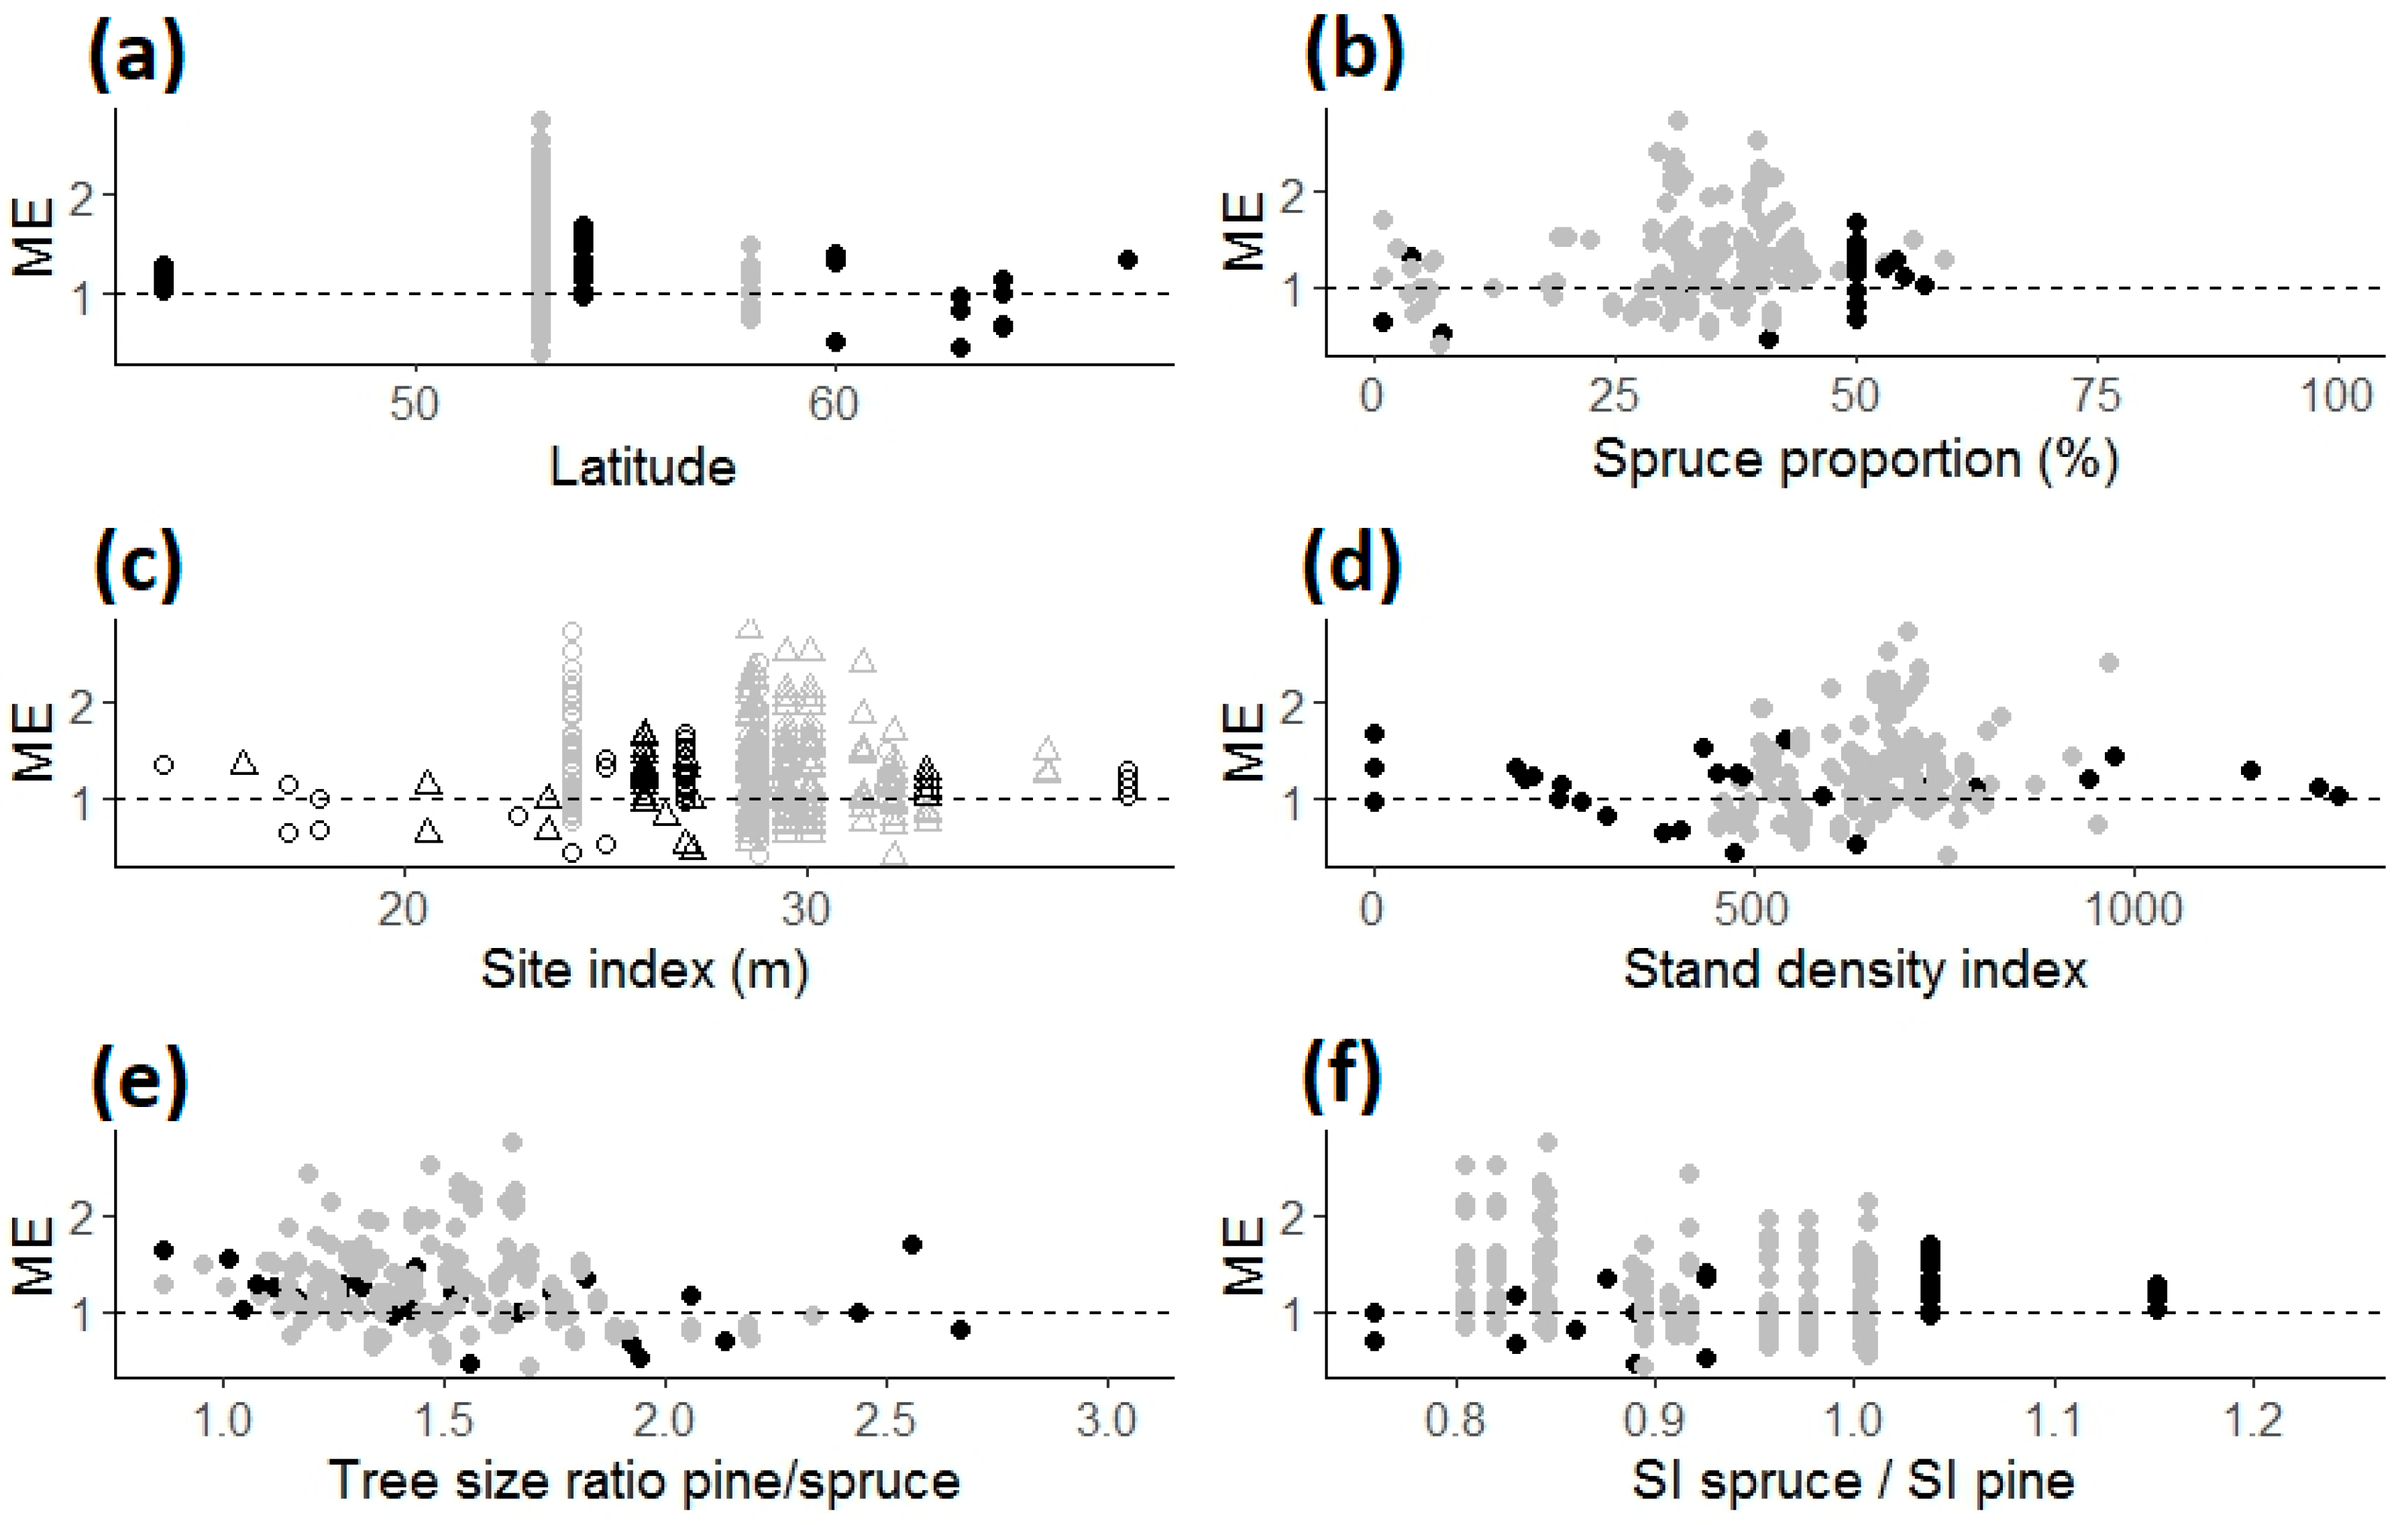
3.2. Influence of Stand Age, Tree Species Proportion, Climate, and Other Factors on the Mixture Effects

Excluding estimated growth values for monospecific spruce (POL, SE4), a statistically significant negative influence of latitude and stand age upon the productivity ratio ME was found using linear mixed-effects models (Table 5). In a similar model with stand age, latitude, and mean tree size ratio between mixed pine and spruce trees as independent variables (data not shown), only a positive effect of stand age was found to be significant (p = 0.026). Tree size ratio was not statistically significant (p = 0.053). The model with all three independent variables was not better than a model with only stand age and tree size ratio in terms of the likelihood ratio test, parsimony, and AICc. Variation between the study sites accounted for ca. 25% of the residuals in the models.
When mixture proportions were included in the calculation of ME (Equation (5)), the model fit did not improve (Table 5). However, the data were dominated by equal tree species proportions (Figure 4d).
Pearson correlations between ME ratios and single explanatory variables were small and nonsignificant (p > 0.05). Site index for spruce and latitude resulted in R2 values of only 0.2 (Figure 4b). Correlations between stand age and ME ratio resulted in R2 = 0.4. This weak indication of a positive relationship between ME and stand age was strongly influenced by the observations from single studies, e.g., POL. When the data were restricted to actual increment measurements and, thereby, to stand ages of <70 years, a negative correlation was found (Figure 5). Again, the correlation did not improve when mixture proportions were included in the calculation of ME.
For further discussion, our Analysis B using linear mixed-effects models restricted to observed growth values was complemented by growth estimates from yield tables and models (thereby including POL and two additional sites of SE4). This indicated a statistically significant positive influence of stand age, precipitation, and mean size ratio between pine and spruce trees (Table 5). There was no improvement from using the Martonne index instead of precipitation (this model ranked lower according to Akaike [43]). If the experiments in UK with high ME and precipitation were excluded from the data set, none of the climate factors would have been statistically significant.

4. Discussion

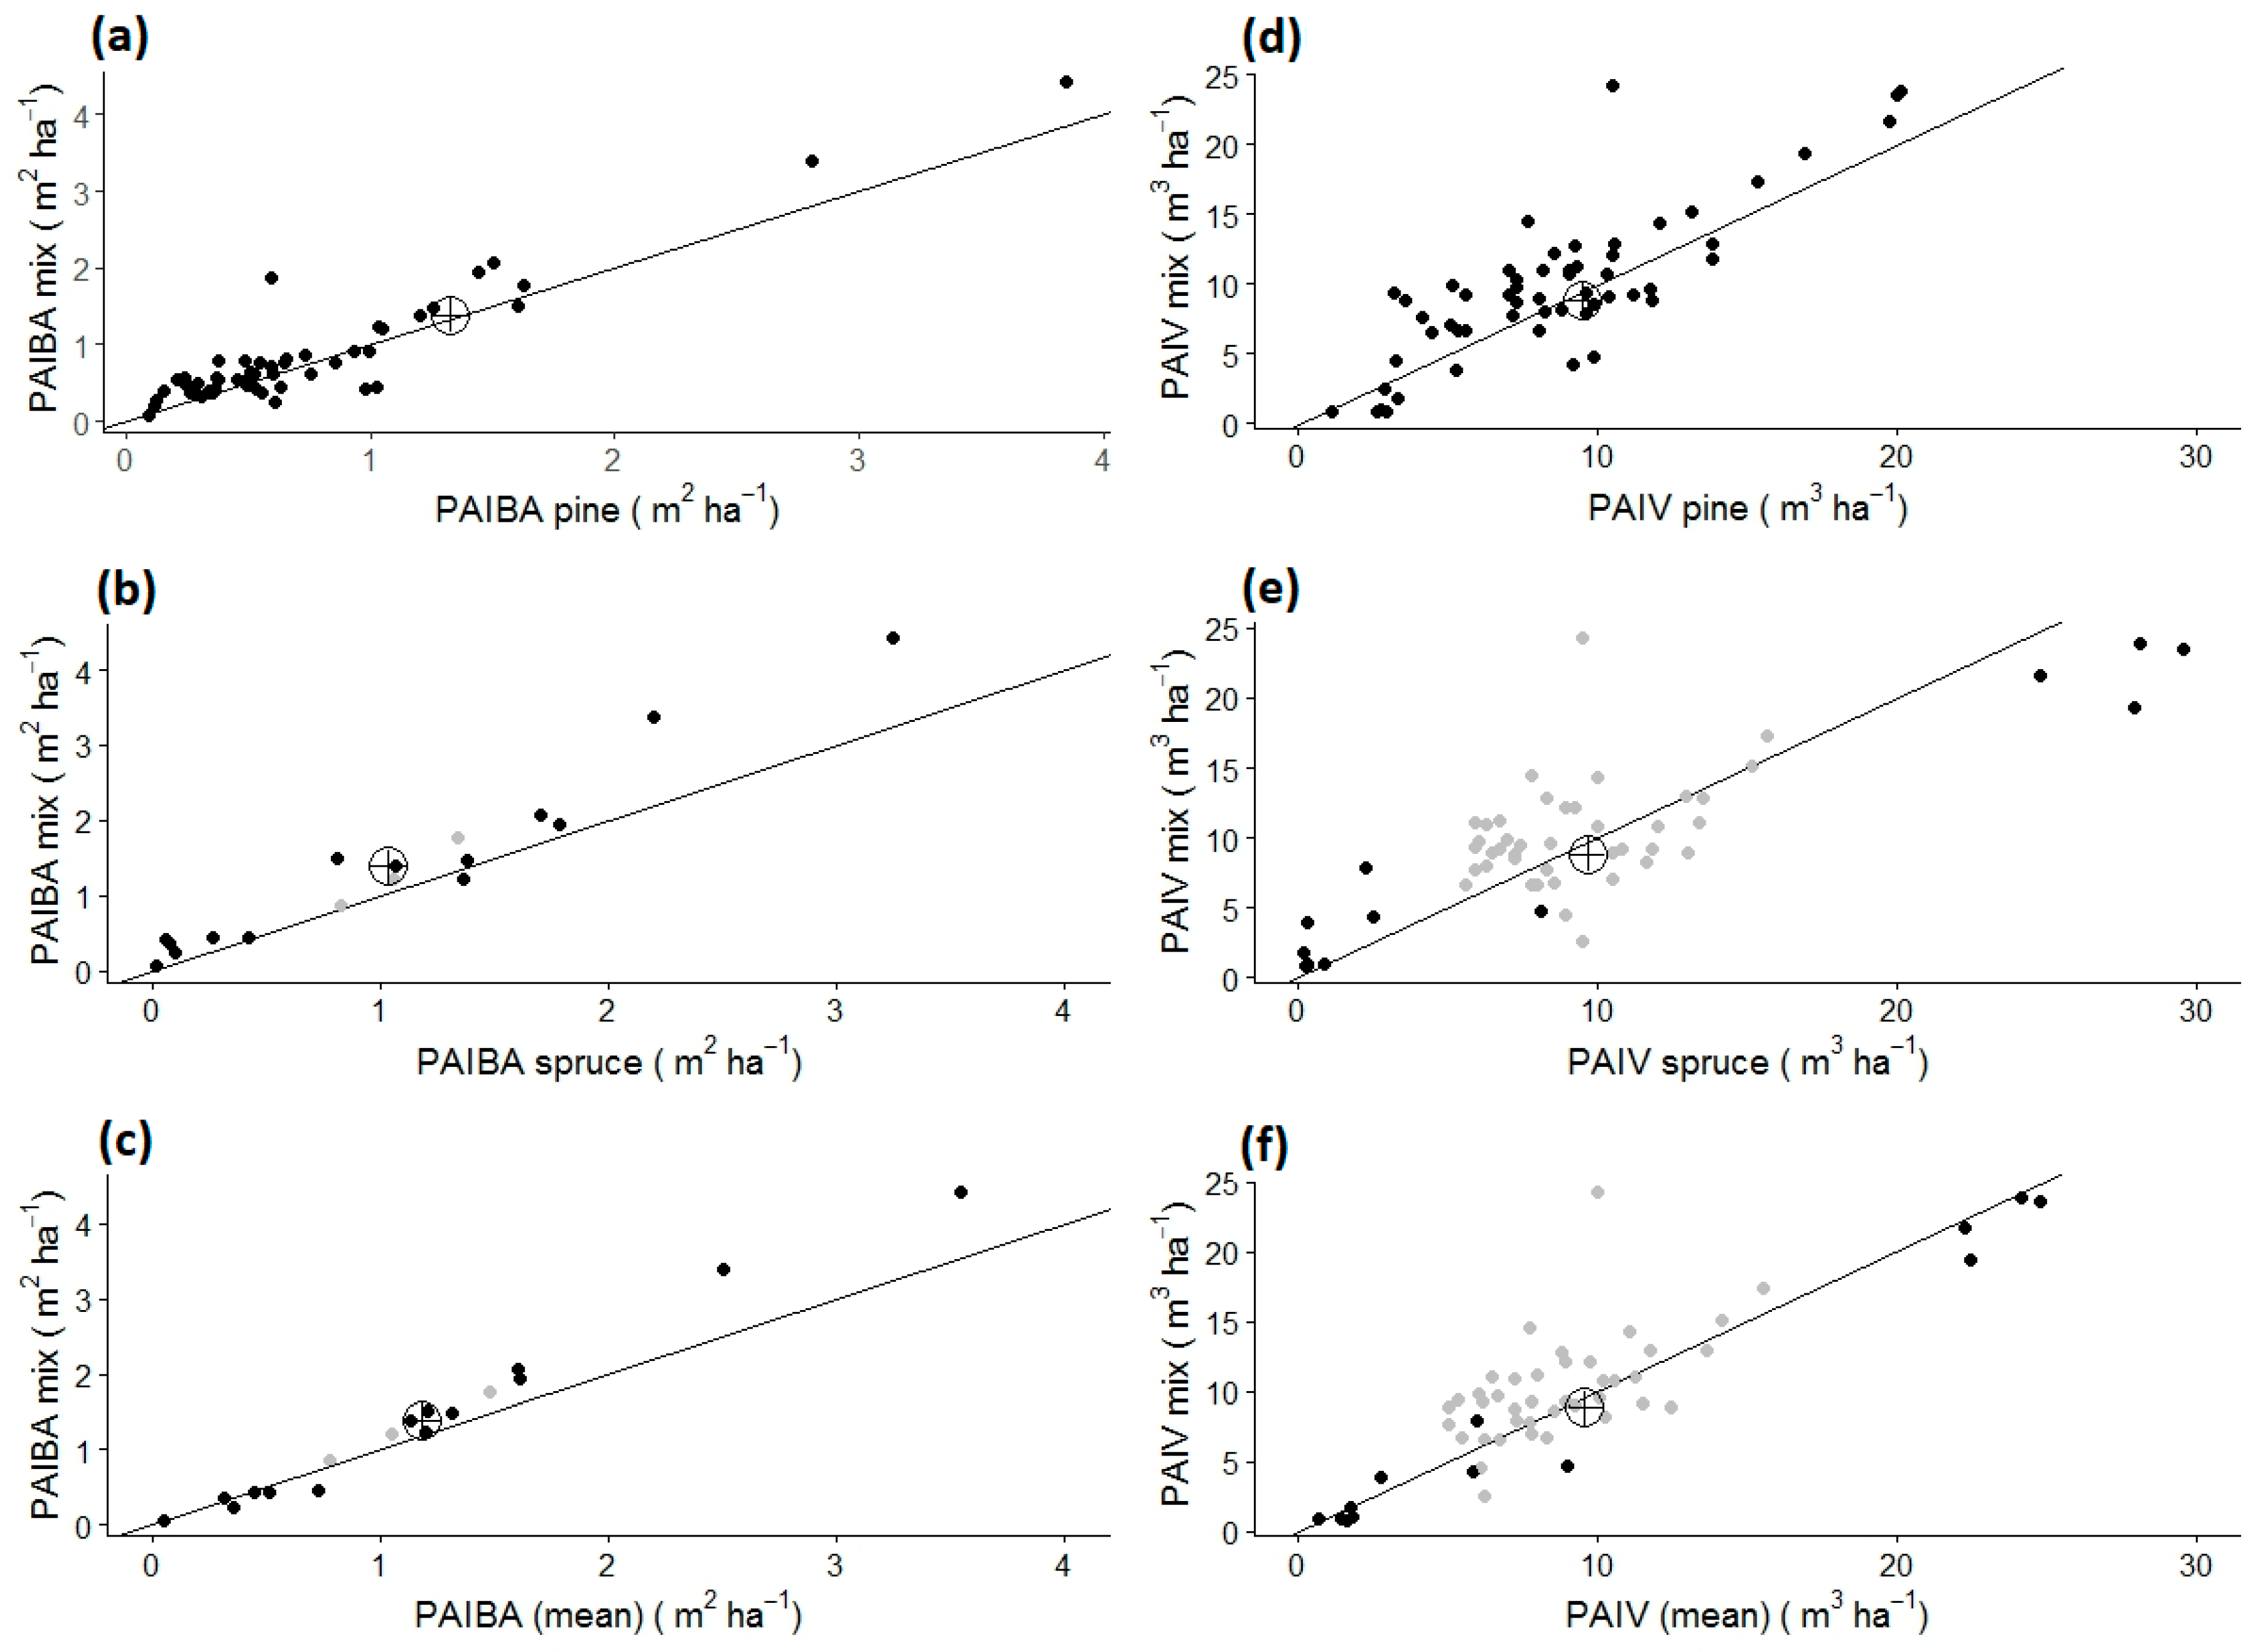
4.1. The Mixing Effect of Observed Increment without Spruce Growth Estimates

Compared with the average production of both monocultures, the majority of studies showed yields of 97–136% in mixed stands. While overyielding was more common, transgressive overyielding was found in three out of ten cases. Two of these three cases (UK1 and UK2) occurred in the repeated experiment at Gisburn [23]. In these three cases, there was up to 20% higher wood production in mixture than in the most productive monoculture.
Our correlations over the study sites indicated decreasing overyielding with higher latitude. Especially on the sites in northern latitudes, monocultures of pine were more productive, while at southern latitudes, spruce monocultures were more productive. Thus, a large range of possible mixing effects could be envisaged for the study region, consistent with [25]. Introducing a spruce admixture to pine in northern latitudes decreased yield, because spruce grew poorly while pine thrived. In study SE2, the most productive monoculture pine yielded two to four times more than the mixture on sites where the site index for spruce was 5–6 m lower than that for pine. It is not surprising that adding spruce on such sites will lower production. By contrast, in Germany, mixing spruce with pine is often expected to lead to an overall higher growth performance [44].
However, generalizations from models with the weak relationships found in this study are difficult and will need to be better informed by both existing and new experiments. The paucity of data from long-term experiments in mixed forests highlights a need for modeling efforts, but experiments will also be needed to validate and develop such models [45]. Therefore, two important conclusions are (1) to maintain the existing experiments for future validation and development of management-related growth models, and (2) to complement the limited number of experiments with new study approaches (e.g., [25,26]).

4.2. The Mixing Effect of Studied Stands When Complemented by Simulated Growth Estimates for Lacking Treatments

To compensate for the lack of spruce monospecific stands in SE4 and POL, we used data derived from a growth simulator [20] and yield tables [43]. It was not possible to examine how well the growth simulator and yield tables applied to these specific sites, and the estimates obtained should be treated with caution.
The mixing effect thus predicted for the two study sites 1090 and 1092 in SE4 fitted well to the purely observed increment and would not change the previous conclusions. When the experiment POL with estimated growth of monospecific spruce was included, stand age, precipitation, and mean size ratio of pine and spruce trees in the mixture were highlighted. All three of them were positively correlated with the mixing effect. However, removing the single study POL from the pooled data resulted in a negative correlation between stand age and mixing effect.
We encountered the following problems when merging observed and simulated increment: There was little variation in some covariates describing site factors (latitude, site index), and the pattern of variation of simulated increment was different from that of observed values (Figure 4). In addition, there was confounding between the use of growth estimates and stand age, since POL was the only study with trees older than 70 years but pure spruce growth was estimated.
Figure 5 illustrates that the mixing effect of the first two measurement periods of all three sites in POL agreed with expectations based on other stands, but the trend changed in subsequent measurements. Lacking other stands older than 70 years, the available data are too few to reach a firm conclusion about the general trend across larger forest regions. Basically, we could alter the results of our analysis by including or excluding the study POL. This modeling exercise only gave a hint on a possible changing mixing effect at the time when both tree species reach approximately the same tree heights. The pattern would remain if a growth underestimation of 20% by the yield table is assumed.
It remains unclear if the mixing effect becomes stronger in mature pine-spruce stands as recently indicated by global forest data [46,47]. To answer this important question, maintenance and future measurements of the existing long-term experiments should be given a very high priority.
In both analyses (restricted to observed increment in the results or including growth estimates for discussion), the influence of the site index on the mixture effect was not clear (Figure 4b), although this is certainly a primary driver over the whole rotation. Only the site index ratio between spruce and pine in Figure 4f indicates a positive, but nonsignificant trend. We conclude that there are several influences driving the “mixing effect”, sometimes inter-correlated (e.g., latitude and site index), but also that there are more factors than the variables used in the limited data set. This resulted in poor modelling performances. Local climate conditions (during single growing seasons and monthly variation) and the differences between mixed and pure plots due to micro-site variation, previous management, and stand structure could have caused additional variability not explained by the models.
The Finnish experiment with early height measurements [48] was too young and not included in any comparison as average tree heights can be driven by species ontogeny and may correspond to a levelling process between species [49]. On medium-fertility sites in North Karelia in Finland, another growth model fitted using data from temporary plots [50] suggested that volume productivity at mid-rotation may be 10–15% greater in mixed compared to monospecific Scots pine and Norway spruce stands of the same stand age and BA. However, this is not in line with the experimental data from the northern sites, but rather with the overall difference across all sites of this study.
The positive influence of mean tree sizes on productivity in Table 5 is in line with the finding by Bielak et al. [24], but we could not detect a relation between site fertility and tree size ratio, unlike Pretzsch and Dieler in mixed spruce-beech stands [51]. Contrary to our results with a limited range of tree species proportions, the mixture proportion is important to estimate the productivity of mixed stands [33]. Eventually, together with stand density, such additional modifiers could be useful in future growth models, calibrated by single observation plots only [21].

Supplementary Materials

The following are available online at https://www.mdpi.com/1999-4907/9/8/495/s1.

Author Contributions

E.A., B.M. and K.W. conceived, designed and performed experiments; E.A., M.D., B.M., K.W. contributed material, M.L. and K.B. contributed analysis tools; L.D. and M.L. analyzed the data; L.D., K.B., M.L., B.M., H.P. and S.V. wrote the paper.

Acknowledgments

First of all, we are grateful to the people who established the experiments and took measurements for many decades. This study has been supported by the COST Action FP1206 EuMIXFOR, the FP7 ERA-NET Sumforest research project REFORM, and the Nordic Forest Research Council. The first author was supported by the Southern Swedish Forest Research Centre.

Conflicts of Interest

The authors declare no conflict of interest.

References

  1. Stokland, J.N.; Eriksen, R.; Stein, M.T.; Korhonen, K.; Tomppo, E.; Rajaniemi, S.; Söderberg, U.; Toet, H.; Riis-Nielsen, T. Forest Biodiversity Indicators in the Nordic Countries; Nordic Council of Ministers: Copenhagen, Denmark, 2003; 108p. [Google Scholar]
  2. Karvinen, S.; Välkky, E.; Torniainen, T.; Gerasimov, Y. Northwest Russian Forestry in a Nutshell; Finnish Forest Research Institute: Helsinki, Finland, 2006; ISBN-13: 978-951-40-2007-0. [Google Scholar]
  3. Engelmark, O.; Hytteborn, H. Coniferous forest. Acta Phytogeogr. Suec. 1999, 84, 55–74. [Google Scholar]
  4. Drozdowski, S.; Andrzejczyk, T.; Bielak, K.; Buraczyk, W.; Gawro, N.L. Silvicultural planning in spruce mire forests by the means of the BDq method. Sylwan 2014, 158, 733–742. [Google Scholar]
  5. EUFORGEN 2013 GIS Database. Available online: http://www.euforgen.org (accessed on 2 May 2018).
  6. Gamfeldt, L.; Snäll, T.; Bagchi, R.; Jonsson, M.; Gustafsson, L.; Kjellander, P.; Ruiz-Jaen, M.C.; Froberg, M.; Stendahl, J.; Philipson, C.D.; et al. Higher levels of multiple ecosystem services are found in forests with more tree species. Nat. Commun. 2013, 4, 1340. [Google Scholar] [CrossRef] [PubMed] [Green Version]
  7. Bravo-Oviedo, A.; Pretzsch, H.; Ammer, C.; Andenmatten, E.; Barbati, A.; Barreiro, S.; Brang, P.; Bravo, F.; Coll, L.; Corona, P.; et al. European Mixed Forests: Definition and research perspectives. For. Syst. 2014, 23, 518–533. [Google Scholar] [CrossRef]
  8. Felton, A.; Felton, A.; Holmström, E.; Laudon, H.; Björkman, C.; Nilsson, U.; Sonesson, J.; Fahlvik, N.; Stens, A.; Keskitalo, C.; et al. Replacing monocultures with mixed-species stands: Ecosystem service implications of two production forest mixture alternatives in Sweden. Ambio 2016, 45, 124–139. [Google Scholar] [CrossRef] [PubMed]
  9. Piri, T.; Korhonen, K.; Sairanen, A. Occurrence of Heterobasidion annosum in monospecific and mixed spruce stands in southern Finland. Scand. J. For. Res. 1990, 5, 113–125. [Google Scholar]
  10. Milligan, H.T.; Koricheva, J. Effects of tree species richness and composition on moose winter browsing damage and foraging selectivity: An experimental study. J. Anim. Ecol. 2013, 82, 739–748. [Google Scholar] [CrossRef] [PubMed]
  11. Björkman, C.; Bylund, H.; Nilsson, U.; Nordlander, G.; Schroeder, M. Forest management to mitigate insect damage in a changing climate: Possibilities and uncertainties. In Climate Change and Insect Pests; Björkman, C., Niemelä, J., Eds.; CABI: New York, NY, USA, 2015. [Google Scholar]
  12. Forrester, D.I. The spatial and temporal dynamics of species interactions in mixed-species forests: From pattern to process. For. Ecol. Manag. 2014, 312, 282–292. [Google Scholar] [CrossRef]
  13. Kalliokoski, T. Root System Traits of Norway Spruce, Scots Pine, and Silver Birch in Mixed Boreal Forests: Analysis of Root Architecture, Morphology and Anatomy. Ph.D. Thesis, University of Helsinki, Helsinki, Finland, 2011. [Google Scholar]
  14. Brown, A.H.F. Functioning of mixed-species stands at Gisburn, N.W. England. In The Ecology of Mixed-Species Stands of Trees; Cannell, M.G.R., Malcolm, D.C., Robertson, P.A., Eds.; Blackwell: Boston, MA, USA, 1992; pp. 125–150. [Google Scholar]
  15. Forrester, D.I.; Bonal, D.; Dawud, S.; Gessler, A.; Granier, A.; Pollastrini, M.; Grossiord, C. Drought responses by individual tree species are not often correlated with tree species diversity in European forests. J. Appl. Ecol. 2016, 53, 1725–1734. [Google Scholar] [CrossRef]
  16. Valinger, E.; Fridman, J. Factors affecting the probability of windthrow at stand level as a result of Gudrun winter storm in southern Sweden. For. Ecol. Manag. 2011, 262, 398–403. [Google Scholar] [CrossRef]
  17. Jonsson, B. Volume Yield to Mid-Rotation in Monospecific and Mixed Sown Stands of Pinus Sylvestris and Picea Abies in Sweden; Studia Forestalia Suecica, Swedish University of Agricultural Sciences: Umea, Sweden, 2001; ISSN 91-576-6137-5. Available online: https://pub.epsilon.slu.se/3336/1/SFS211.pdf (accessed on 1 August 2018).
  18. Jonsson, B. Dynamics of Field-Layer Vegetation and Tree Growth in Young Pinus Sylvestris and Picea Abies Stands on Microsites in Swedish Lapland; Report for Skog & Trä: 2010:5 SLU; Unit for Field-based Forest research, Swedish University of Agricultural Sciences: Vindeln, Sweden, 2010; ISBN 978-91-977896-6-0. [Google Scholar]
  19. Lindén, M.; Agestam, E. Increment and yield in mixed and monoculture stands of Pinus sylvestris and Picea abies based on an experiment in southern Sweden. Scand. J. For. Res. 2003, 17, 155–162. [Google Scholar] [CrossRef]
  20. Ekö, P.M. A Growth Simulator for Swedish Forests, Based on Data from the National Forest Survey; Department of Silviculture, Swedish University of Agriculture Science: Umea, Finland, 1985; 224p., ISBN 91-576-2386-4. (In Swedish with English summary). [Google Scholar]
  21. Hynynen, J.; Ojansuu, R.; Hökkä, H.; Salminen, H.; Siipilehto, J.; Haapala, P. Models for Predicting Stand Development in MELA System; Research Papers; The Institute Finnish Forest Research: Vantaa, Finland, 2002. [Google Scholar]
  22. Pretzsch, H.; Schütze, G. Transgressive overyielding in mixed compared with monospecific stands of Norway spruce and European beech in Central Europe: Evidence on stand level and explanation on individual tree level. Eur. J. For. Res. 2009, 128, 183–204. [Google Scholar] [CrossRef]
  23. Mason, W.; Connolly, T. The development of species mixtures in British spruce forests: Guidance from the Gisburn experiment. Forestry 2014, 87, 1–9. [Google Scholar] [CrossRef]
  24. Bielak, K.; Dudzinska, M.; Pretzsch, H. Mixed stands of Scots pine (Pinus sylvestris L.) and Norway spruce [Picea abies (L.) Karst] can be more productive than monocultures. Evidence from over 100 years of observation of long-term experiments. For. Syst. 2014, 23, 573–589. [Google Scholar] [CrossRef]
  25. Forrester, D.I.; Pretzsch, H. Tamm Review: On the strength of evidence when comparing ecosystem functions of mixtures with monocultures. For. Ecol. Manag. 2015, 356, 41–53. [Google Scholar] [CrossRef]
  26. Pretzsch, H.; del Río, M.; Ammer, C.; Avdagic, A.; Barbeito, I.; Bielak, K.; Brazaitis, G.; Coll, L.; Dirnberger, G.; Drössler, L.; et al. Growth and yield of mixed versus monospecific stands of Scots pine (Pinus sylvestris L.) and European beech (Fagus sylvatica L.) analysed along a productivity gradient through Europe. Eur. J. For. Res. 2015, 134, 927–947. [Google Scholar] [CrossRef] [Green Version]
  27. Toïgo, M.; Vallet, P.; Perot, T.; Bontemps, J.D.; Piedally, C.; Courbaud, B. Overyielding in mixed forests decreases with site productivity. J. Ecol. 2015, 103, 502–512. [Google Scholar] [CrossRef] [Green Version]
  28. Liang, J.; Crowther, T.W.; Picard, N.; Wiser, S.; Zhou, M. Positive biodiversity-productivity relationship predominant in global forests. Science 2016, 354, aaf8957. [Google Scholar] [CrossRef] [PubMed]
  29. Jones, H.E.; McNamara, N.; Mason, W.L. Functioning of mixed species stands: Evidence from a long-term forest experiment. In Ecological Studies 176. Forest Diversity and Function: Temperate and Boreal Systems; Springer: Berlin, Germany, 2005; pp. 111–130. [Google Scholar]
  30. Holm, S.; Jonsson, B.; Kallur, H. Department of Forest Biometry and Management; SLU; Status Report; Umea, Sweden, 1984. [Google Scholar]
  31. Scherer-Lorenzen, M.; Körner, C.; Schulze, E.-D. Forest Diversity and Function: Temperate and Boreal Systems; Ecological Studies, 176; Springer: Berlin, Germany, 2005; pp. 347–376. [Google Scholar]
  32. Wellhausen, K. Produktivitat und Klimasensitivitat von Kiefer (Pinus sylvestris L.) und Fichte (Picea abies (L.) Karst.) im Rein-und Misch bestand-Untersuchungen entlang eines okologischen Gradient en. In Proceedings of the Sektion Ertragskunde DVFFA, Kammerforst, Germany, 2015; Available online: http://sektionertragskunde.fvabw.de/2015/Beitrag_12.pdf (accessed on 4 May 2018). (In German).
  33. Pretzsch, H. Forest Dynamics, Growth and Yield: From Measurement to Model; Springer: Berlin, Germany, 2009. [Google Scholar]
  34. Hägglund, B.; Lundmark, J.-E. Part 2 Diagrams and tables. In Guide for Site Productivity Assessments in Swedish Forests; Skogsstyrelsen: Jönköping, Sweden, 1982; ISBN 91-85748-7. (In Swedish) [Google Scholar]
  35. Edwards, P.N.; Christie, J.M. Yield tables for forest management. In Forestry Commission Booklet 48; HMSO: London, UK, 1981. [Google Scholar]
  36. Assmann, E.; Franz, F. Vorläufige Fichtenertragstafeln für Bayern (Preliminary spruce yield tables for Bavaria). In Bayerisches Staatsministerium für Ernährung; Landwirtschaft, Forsten, Ed.; Hilfstafeln für die Forsteinrichtung, 1963; 334p, Available online: http://www.stmelf.bayern.de/ (accessed on 2 August 2018).
  37. Wiedemann, E. Ertragstafel für die Baumart Kiefer, mäßige Durchforstung (Yield Tables for Pine, Moderate Thinning). In Bayerisches Staatsministerium für Ernährung; Landwirtschaft, Forsten, Ed.; Hilfstafeln für die Forsteinrichtung, 1943; 334p, Available online: http://www.stmelf.bayern.de/ (accessed on 2 August 2018).
  38. Bruchwald, A. Change in top height of pine forest stands with age. Bull. Acad. Pol. Sci. Ser. Biol. 1977, 5, 335–342. [Google Scholar]
  39. Hector, A.; Bazeley-White, E.; Loreau, M.; Otway, S.; Schmid, B. Overyielding in grassland communities: Testing the sampling effect hypothesis with replicated biodiversity experiments. Ecol. Lett. 2002, 5, 502–511. [Google Scholar] [CrossRef]
  40. Martonne, D.E. La Météorologie 21. In Une Nouvelle Fonction Climatologique: L’indice D’aridité; Gauthier-Villars: Paris, France, 1926; pp. 449–458. (In French) [Google Scholar]
  41. Reineke, L.H. Perfecting a stand-density index for even-aged forests. J. Agric. Res. 1933, 46, 627–638. [Google Scholar]
  42. Szymkiewicz, B. Tablice Zasobnosci i Przyrostu Drzewostanów. Polish Yield Tables. Tables for Norway Spruce by Schwappach (1943): I-V Site Classes; PWRiL: Warszawa, Poland, 1966. [Google Scholar]
  43. Pinheiro, J.; Bates, D.; DebRoy, S.; Sarkar, D.; Heisterkamp, S.; Van Willigen, B. Nlme: Linear and Nonlinear Mixed Effects Models. R Package Version 3.1–122. 2015. Available online: http://CRAN.R-project.org/package=nlme (accessed on 2 March 2018).
  44. Spathelf, P.; Ammer, C. Forest management of Scots pine (Pinus sylvestris L.) in northern Germany—A brief review of the history and current trends. Arch. For. Sci. 2015, 86, 59–66. [Google Scholar]
  45. Drössler, L.; Fahlvik, N.; Elfving, B. Application and limitations of growth models for silvicultural purposes in heterogeneously structured forest in Sweden. J. For. Sci. 2013, 59, 458–473. [Google Scholar] [CrossRef] [Green Version]
  46. Zhang, Y.; Chen, H.Y.H.; Reich, P.B. Forest productivity increases with evenness, species richness and trait variation: A global meta-analysis. J. Ecol. 2012, 100, 742–749. [Google Scholar] [CrossRef]
  47. Jactel, H.; Gritti, E.S.; Drössler, L.; Forrester, D.I.; Mason, W.L.; Morin, X.; Pretzsch, H.; Castagneyrol, B. Positive biodiversity-productivity relationships in forests: Climate matters. Biol. Lett. 2018, 14, 20170747. [Google Scholar] [CrossRef] [PubMed]
  48. Haase, J.; Castagneyrol, B.; Cornelissen, J.H.C.; Ghazoul, J.; Kattge, J.; Koricheva, J.; Scherer-Lorenzen, M.; Morath, S.; Jactel, H. Contrasting effects of tree diversity on young tree growth and resistance to insect herbivores across three biodiversity experiments. Oikos 2015, 124, 1674–1685. [Google Scholar] [CrossRef]
  49. Vallet, P.; Perot, T. Tree diversity effect on dominant height in temperate forest. For. Ecol. Manag. 2016, 381, 106–114. [Google Scholar] [CrossRef]
  50. Pretzsch, H.; Dieler, J. The dependency of the size-growth relationship of Norway spruce (Picea abies [L.] Karst.) and European beech (Fagus sylvatica [L.]) in forest stands on long-term site conditions, drought events, and ozone stress. Trees 2011, 25, 355–369. [Google Scholar] [CrossRef]
  51. Pukkala, T.; Vettenranta, J.; Kolström, T.; Miina, J. Productivity of mixed stands of Pinus sylvestris and Picea abies. Scand. J. For. Res. 1994, 9, 143–153. [Google Scholar] [CrossRef]
Figure 1. The overlapping area of the natural distribution of Norway spruce and Scots pine in Northern and Central Europe (dark grey color), and the distribution of study sites: White squares with black dots indicate sites containing all three treatments, white squares indicate sites with age up to 10 years (FIN) or lacking the treatment “Norway spruce monoculture” (POL, SE4 1090, SE4 1092). Source: EUFORGEN 2013 GIS database [5].
Forests 09 00495 g001
Figure 2. Cumulative production from the first to last measurements of the experimental sites (volume growth for SE, POL, GER in grey bar color, or basal area growth in UK with black color or contour). The three bars per study site illustrate the production achieved in the three different treatments: pine (left bar in light grey), tree species mixture (center), and spruce (third bar to the right, if available on the site). The lines above the bars indicate the standard deviation if the treatment was replicated on the site (see number of observations in Table 1). The numbers above the bars show the stand age covered by the observations.
Forests 09 00495 g002
Figure 3. Periodic annual increment of basal area and standing volume (PAIBA and PAIV) in mixed tree species and pure stands of the experiments during different measurement periods: (a,d) mixed stand and pine, (b,e) mixed stand and spruce, and (c,f) mixed stand and the mean of both monocultures. The larger circle with the cross illustrates the mean of all observed increment values. Grey color indicates values where growth of pure spruce was estimated.
Forests 09 00495 g003
Figure 4. Mixing effect ME against different variables during different measurement periods: (a) latitude, (b) site index classes for spruce (circle) and pine (triangle), (c) the ratio of the mean tree size of both tree species in the mixed stand, (d) spruce proportion, (e) stand density index SDI, and (f) the ratio between both site indices (grey color indicates where growth of pure spruce was estimated).
Forests 09 00495 g004
Figure 5. Mixing effect ME against stand age with different symbols that mark the different study sites (grey color indicates where growth of pure spruce was estimated).
Forests 09 00495 g005
Table 1. Possible tree species interactions in mixture according to Forrester [12], and evidence for such interactions from investigations in Scots pine-Norway spruce stands.
Possible Species InteractionsInteractions Found in Mixed Scots Pine–Norway Spruce Forests
With influence on nutrient availabilityMostly overlapping fine-roots [13], increased soil nitrogen when spruce was grown in mixture [14]
With influence on water availabilityOverlapping fine-roots [13], higher water stress in boreal mixed forest, and reduced water stress in hemiboreal mixed forest [15]
Influencing light absorption and use
Temporal effects and interactions between resourcesLower incidence of Heterobasidion annosum [9], higher or similar browsing damage [10]
Stand structureLess storm damage [16]
Table 2. Design of the nine studies of Norway spruce–Scots pine mixed forest included in this survey (A- and B-grade describe light thinning intensities in Germany and Poland).
StudySE1SE2SE3SE4UK1UK2POLGERFIN
Observed stand age [years]0–310–425–4314–460–280–2052–12446–680–10
0–2622–5456–1320–10
0–4329–5350–1320–10
0–40
N of study sites141311313
N of plots with pure pine10410333616
N of plots with pure spruce10410133-16
N of plots with mixture10410433616
Plot size [m2]1200300–220014001000100010002500600400
Initial spruce proportion of trees (or basal area BA) [%]5050–90505050503–33 (BA)47 (BA)50
Stand establishmentplantedplantedseededplantedplantedplantedplanted or seededplantedplanted
Management after establishmentnononoequal tree number after removalsnonoA- and B-grade thinningsA- and B-grade thinningsno
Table 3. Selected site and stand characteristics of the 18 study sites within the nine study areas. The site index SI was calculated specifically describing dominant trees in monospecific stands in each country, using the methods by Hägglund and Lundmark [34] for Swedish sites, by Edwards and Christie [35] for the site in the UK, by Hynynen et al. [21] for the Finnish site, Assmann and Franz [36] and Wiedemann [37] for the German site, and Bruchwald [38] for Polish sites.
StudySE1SE2SE3SE4FINUK1UK2POLGER
Study siteSE1DoroteaFillstaFredrikaNäldenSE3109010911092123UK1UK2MaskulinskieStrzałowoKwidzynGER
Latitude (° N)676463646360585858616161545453535344
Martonne index556459595948444444434343787835363642
Growing season (days)130150150150150175180180180165165165>200>200190190190200
SI (Hdom at age 100) for pine162427212727303236292829262629313233 (Hmean)
SI (Hdom at age 100) for spruce141822172425332932353535272727292938
Vegetation typeThin-leaved grasses/V. myrtillusV. myrtillusLow herbsV. myrtillusV. myrtillusn.s.V. myrtillus/V.vitis-ideaV. myrtillus/V.vitis-ideaV. myrtillus/V.vitis-ideaV. myrtillusV. myrtillusV. myrtillusFestuca-Agrostis before plantingMosses and coarse grassesOxalis acet./Impatiens parvifloraCalama-grostis/V. MyrtillusOxalis acet./Impatiens parvifloraThin-leaved grasses/V. myrtillus
Soil typePodzol on glacial tillPodzolPodzolPodzolPodzoln.s.Podzol on glacial tillPodzol on glacial tillPodzolPodzolPodzolPodzolStagnogley /gley on glayey glacial tillStagnogley /gley on glayey glacial tillCambic arenosols (rusty) Cambic arenosols (rusty) Cambic arenosols (rusty) Brown earth on loamy sand
Soil moisture classMesicMesicMesicMesicMesicn.s.MesicMesicMoistMesic–moistMesic–moistMesic–moistVery moistVery moistMesicMesicMesicMesic–moist
Mean annual temperature (°C)−0.511115666444887888
Mean annual precipitation (mm)52070065065065072570070070060060060014001400600650650760
Table 4. Stand productivity (with standard deviation on site if replicated) and mixture effects ME max, ME, MEpine and MEspruce (with standard deviation if both treatments were replicated) over the entire observation period of the study sites. Grey values indicate estimated growth of pure spruce.
StudySE1SE2SE3SE4UK1UK2POLGER
Growth VariableVolume GrowthVolume GrowthVolume GrowthVolume GrowthBasal Area GrowthBasal Area GrowthVolume GrowthVolume Growth
Unitm3 ha−1m3 ha−1m3 ha−1m3 ha−1m2 ha−1m2 ha−1m3 ha−1m3 ha−1
Site DoroteaFillstaFredrikaNälden 109010911092 MaskulinskieStrzałowoKwidzyn
Period (stand age)0–310–420–260–430–405–4318–4826–5732–560–280–2052–12456–13250–13246–68
Productivity pure pine34.1 (±1.2)148185151251304 (±28)38932632932.5 (±7.9)40.2 (±4.2)476 (±11)608730439
Productivity pure spruce8.1 (± 0.5)1821169098 (±9)34627935128.8 (±6.3)30.6 (±10.4)642710791596
Productivity mixed pine-spruce28.6 (±1.2)524871113244 (±22)350351 (±23)45137.5 (±3.9)45.5 (±1.7)671 (±29)836757504
ME max0.84 (±0.07)0.350.260.470.450.80 (±0.16)0.901.081.281.15 (±0.23)1.13 (±0.10)1.411.381.040.85
ME1.36 (±0.93)0.630.470.850.661.21 (±0.87)0.951.161.331.25 (±0.22)1.29 (±0.22)1.201.271.000.97
MEpine0.84 (±0.07)0.350.260.470.450.80 (±0.16)0.901.081.371.15 (±0.23)1.13 (±0.10)1.41 (±0.03)1.381.041.15
MEspruce3.53 (±0.02)2.892.294.441.262.49 (±0.05)1.011.261.281.30 (±0.19)1.49 (±0.23)1.051.180.960.85
Table 5. Three linear mixed-effects models that related different site variables (e.g., annual precipitation) and stand characteristics (e.g., stand age, ratio of mean diameter of pine to spruce trees in the mixture) of each measurement period and site to the productivity ratio ME between mixed stands and the average of the corresponding monocultures. While Model 1 excludes study sites without monospecific spruce, others include estimated growth of spruce based on yield tables. Model 3 included the initial mixture proportion of spruce at the beginning of the measurement period.
ModelParameterValueStd. ErrorDFt-Valuep-Value
1(Intercept)3.07200.5999185.12090.0001
Latitude−0.03070.01029−2.99770.0150
Stand age−0.00740.003018−2.42730.0259
2(Intercept)−1.55030.5442184−2.84860.0049
Stand age0.01470.00171848.4765<0.0001
Precipitation0.00150.00042435.4890.0016
Tree size ratio0.37400.137318427.2380.0071
3(Intercept)−1.37320.6573181−2.08910.0381
Stand age0.01480.00201817.2532<0.0001
Precipitation0.00130.0006222.16920.0412
Tree size ratio0.35840.16261812.20460.0287

