Preferences of Tourists for the Service Quality of Taichung Calligraphy Greenway in Taiwan


1
Department of Forestry, National Chung Hsing University, Taichung 402, Taiwan
2
Innovation and Development Center of Sustainable Agriculture, National Chung Hsing University, Taichung 402, Taiwan
*
Authors to whom correspondence should be addressed.
Forests 2018, 9(8), 462; https://doi.org/10.3390/f9080462
Submission received: 12 July 2018
/
Revised: 24 July 2018
/
Accepted: 25 July 2018
/
Published: 30 July 2018
(This article belongs to the Special Issue Growth and Ecosystem Services of Urban Trees)
Abstract
:This study explores preferences for a set of attributes that characterize the recreational value of Calligraphy Greenway, the most notable greenbelt in Taichung City, Taiwan. As an urban green space, the Calligraphy Greenway has its own recreational attributes and visitors’ preferences. This study uses the choice experiment method to determine visitors’ preference levels for five major attributes to improve the recreational quality. On average, each visitor visited there 9.15 times in the past year and spent 2.37 h per visit. Of the five recreational attributes, satisfaction with recreational activity opportunities had the highest score and satisfaction with cultural landscape resources had the lowest score. The importance is ranked in the order of recreational service quality, total recreational cost, environmental landscape resources, cultural landscape resources and recreational activity opportunities. Considering difference of groups, female visitors were more concerned with cost and activities but male visitors were more concerned with service quality and natural/cultural landscape resources. Local visitors were more concerned with cost and activities but non-local visitors were more concerned with environmental/cultural landscape resources. Both were concerned with service quality. Based on the results, this study makes the following recommendations: cultural landscape resources and quality of recreational services and facilities should be improved and more complete interpretative educational guidance should be provided to increase visitors’ willingness to visit. Additionally, it is suggested to set up various districts to cater for preferences of different visitor groups.
1. Introduction
The advancement of human civilization means the development of urban functions and the need for a better balance between work and recreation. Therefore, recreation now occupies an increasingly larger proportion of daily life. This has led to a greater demand for recreation, which drives urban planning and puts a greater value on urban forests and green space. Urban forests and green spaces are critical for social, environmental and economic benefits, along with green infrastructure. They are increasingly considered to be an important part of a city’s image [1,2,3]. Gobster and Westphal [2] investigated how people perceived and used greenways for recreation and experiences of relaxation and their results accounted for the importance of greenways by using six human dimensions in Chicago, USA. Weber et al. [3] stated that urban greenways would have impacts on the residents in various perspectives, including property values, social and recreation spaces and so on. They surveyed 381 adjacent residents in BeltLine, Atlanta, USA to investigate the factors and preferences for planning urban greenways. The green space in cities provides citizens with a space that is suited for moderate exercise to relieve the stresses of daily life and to enjoy the beauty of a forest. Previous studies have shown that leisure activities are an essential part of modern life [4,5].
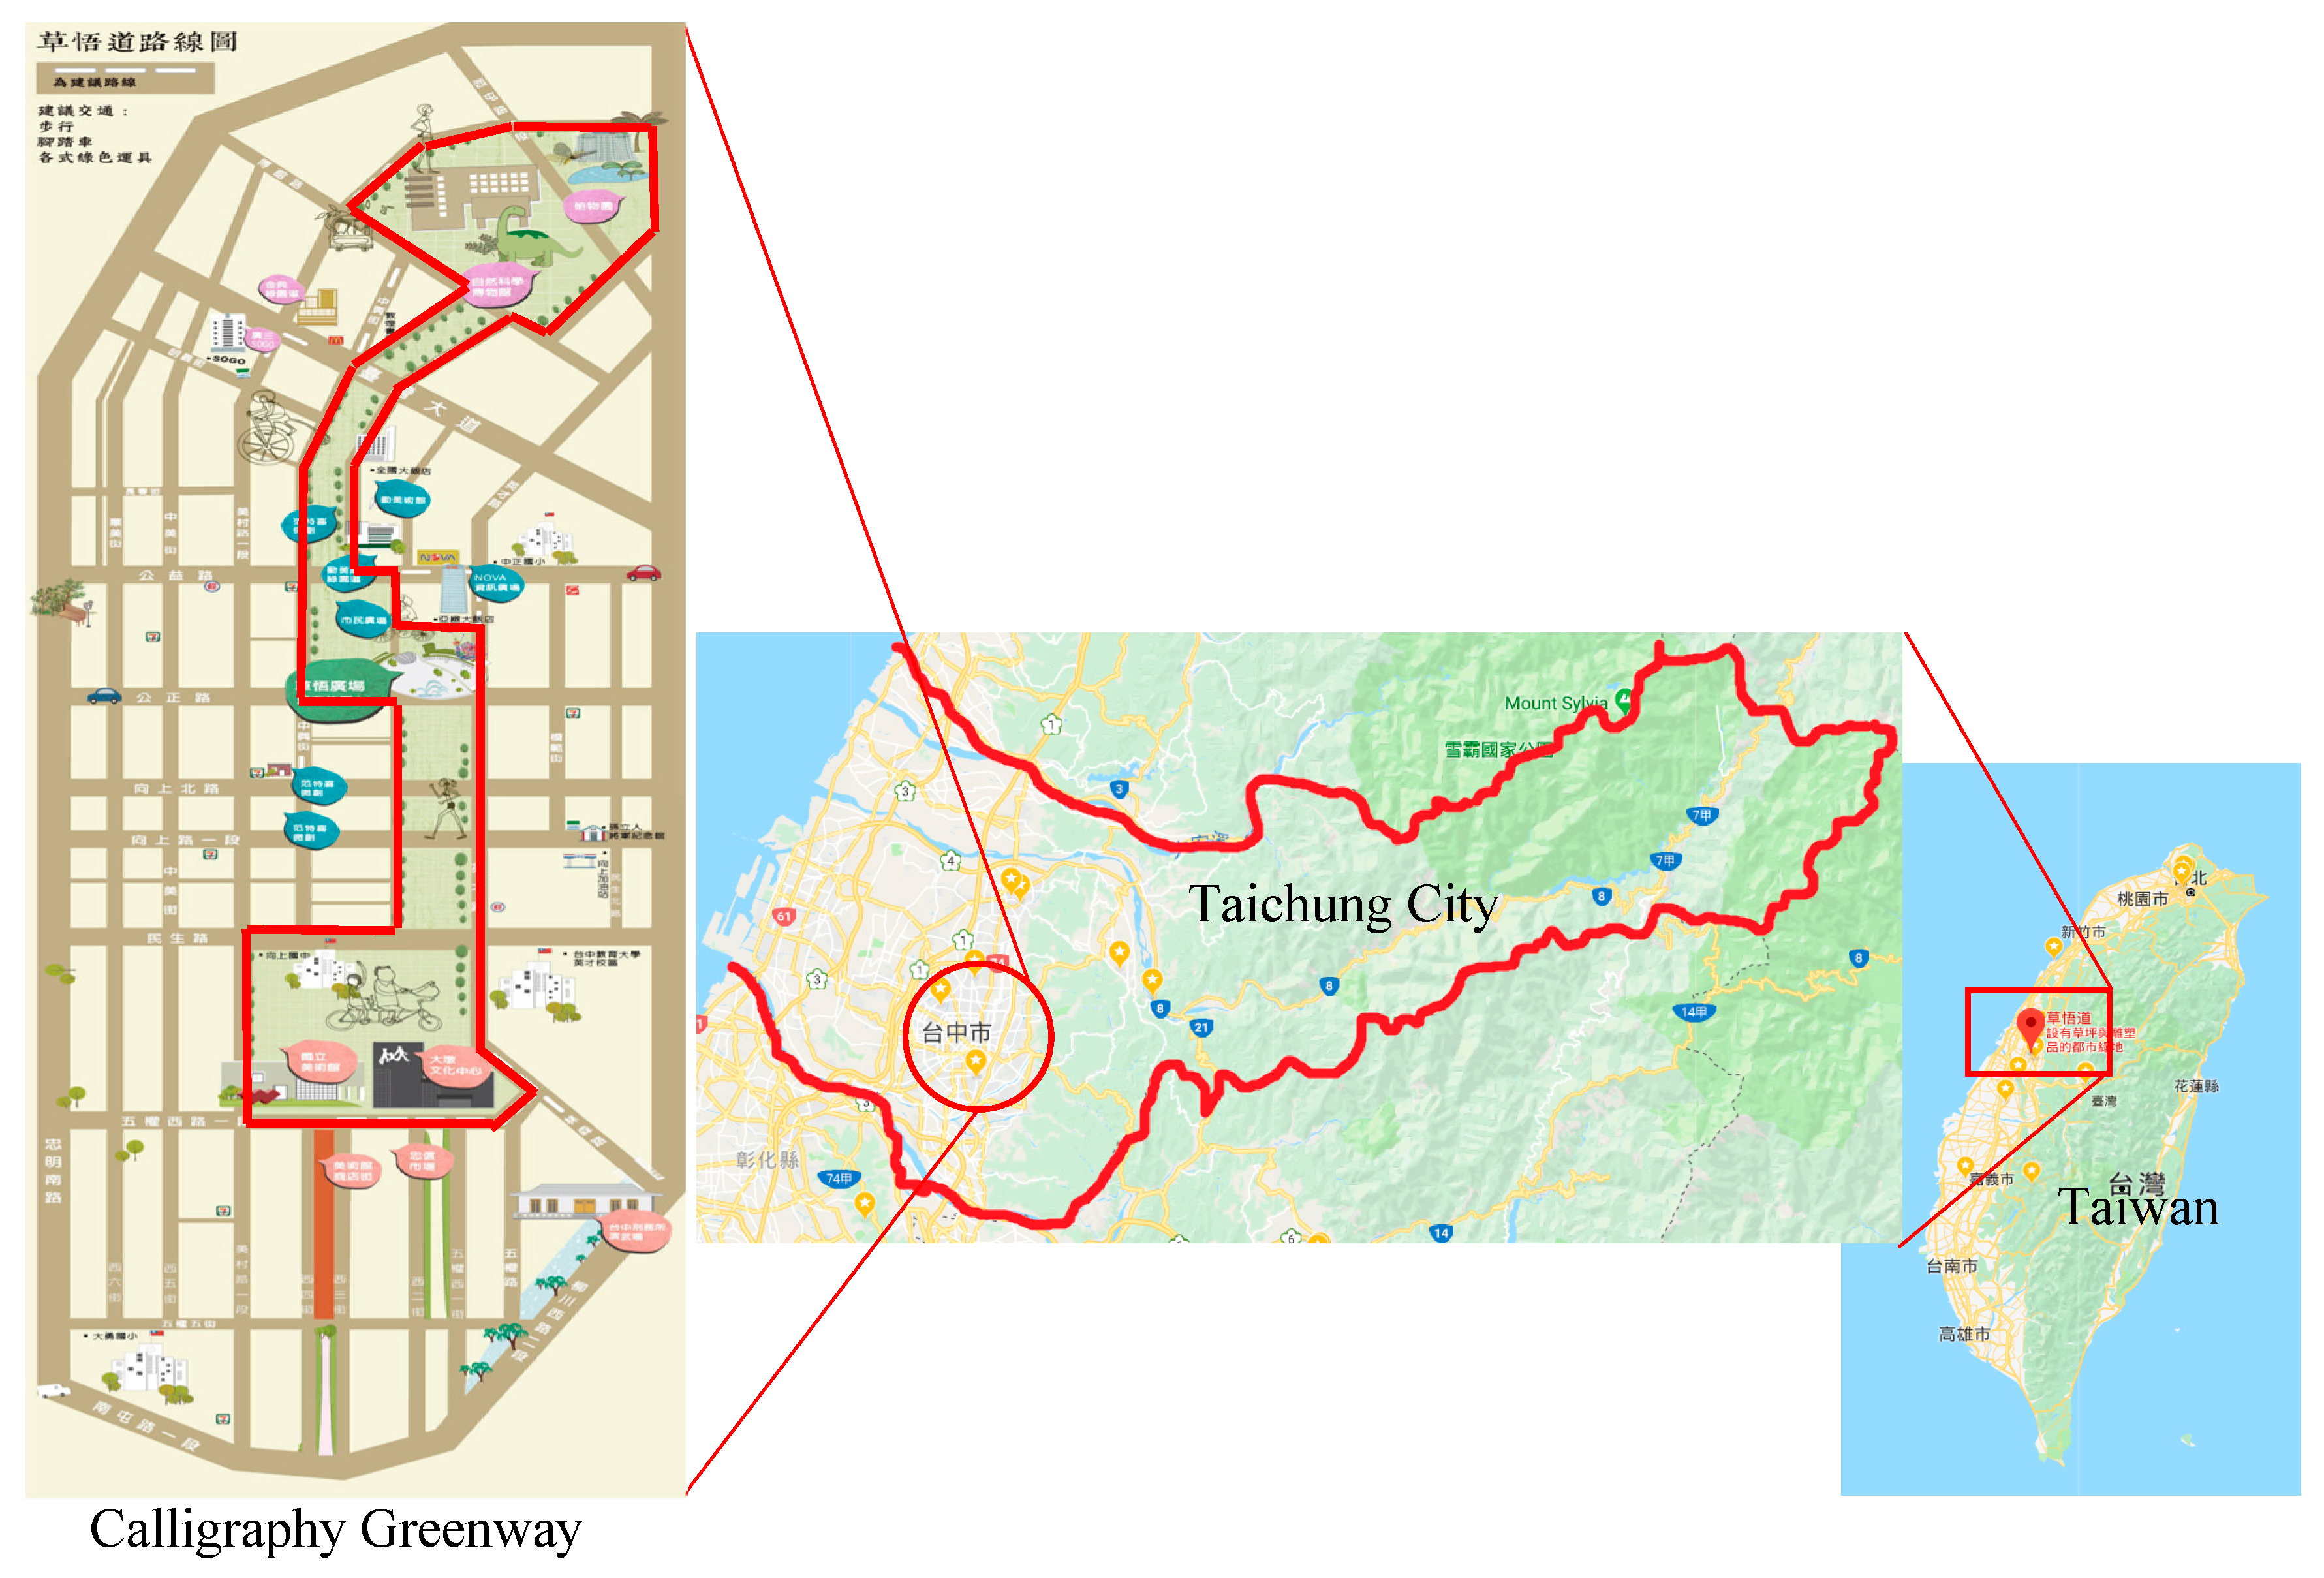
In Taiwan, a city’s degree of greenery is a factor in evaluating a city’s level of development. Taichung’s post amalgamation green coverage exceeds 57.7%, with a total of 9.62 m2 of parks, green areas, squares and playgrounds per person, which ranks first among Taiwan’s five municipalities (Taipei, Xinbei, Taichung, Tainan and Kaohsiung). Taichung has made its greenway plan since 1931 [6]. As the city grew, the original design changed with the times and the functions of greenways shifted. The greenways in Taiwanese were originally geared towards facilitating liaison and gradually became to include more recreational and artistic functions. In 2008, Taichung featured a total of 13 greenways, as shown in Figure 1. In recent years, Taichung’s city government has implemented a series of greenway plans and the “Calligraphy Greenway Plan” is the most important one [7,8].
Taiwan has a subtropical monsoon climate [9]. With such a geographical location and a colonial history, the population composition in Taiwan is multicultural. Taichung is located in the middle of the Taiwan island and is the transportation hub between Southern and Northern Taiwan. Hence, this study provides a valuable reference for designing and maintaining urban green space and forests in the similar climate zones and multicultural cities. Because the preferences of urban residents are associated with the whole residents’ diversity of cultural backgrounds and the environments of subtropical climate, they not only provide policy and management considerations to local governments but also provide a reference of parameter values for management design of urban forests.
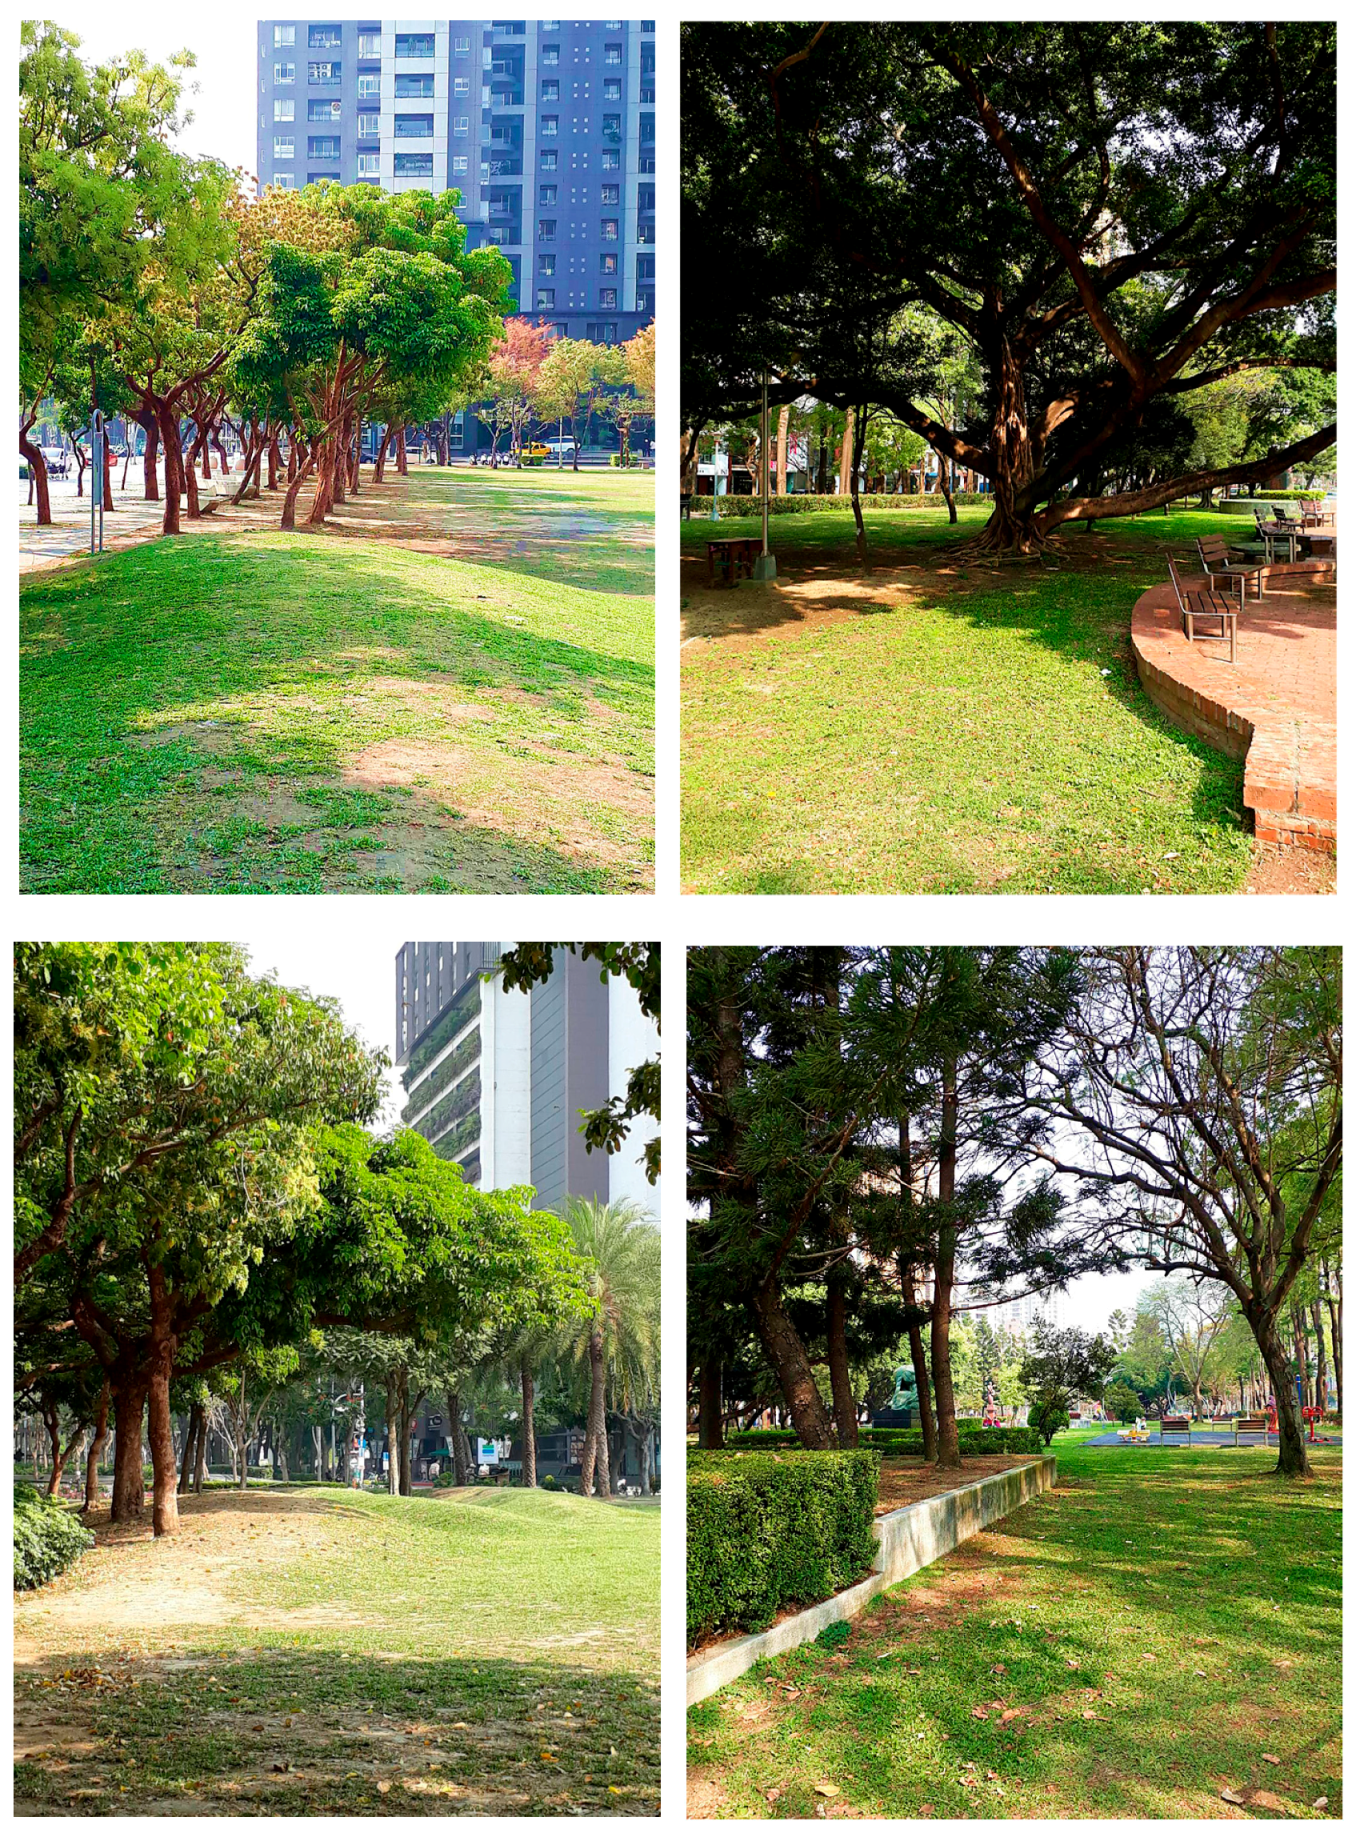
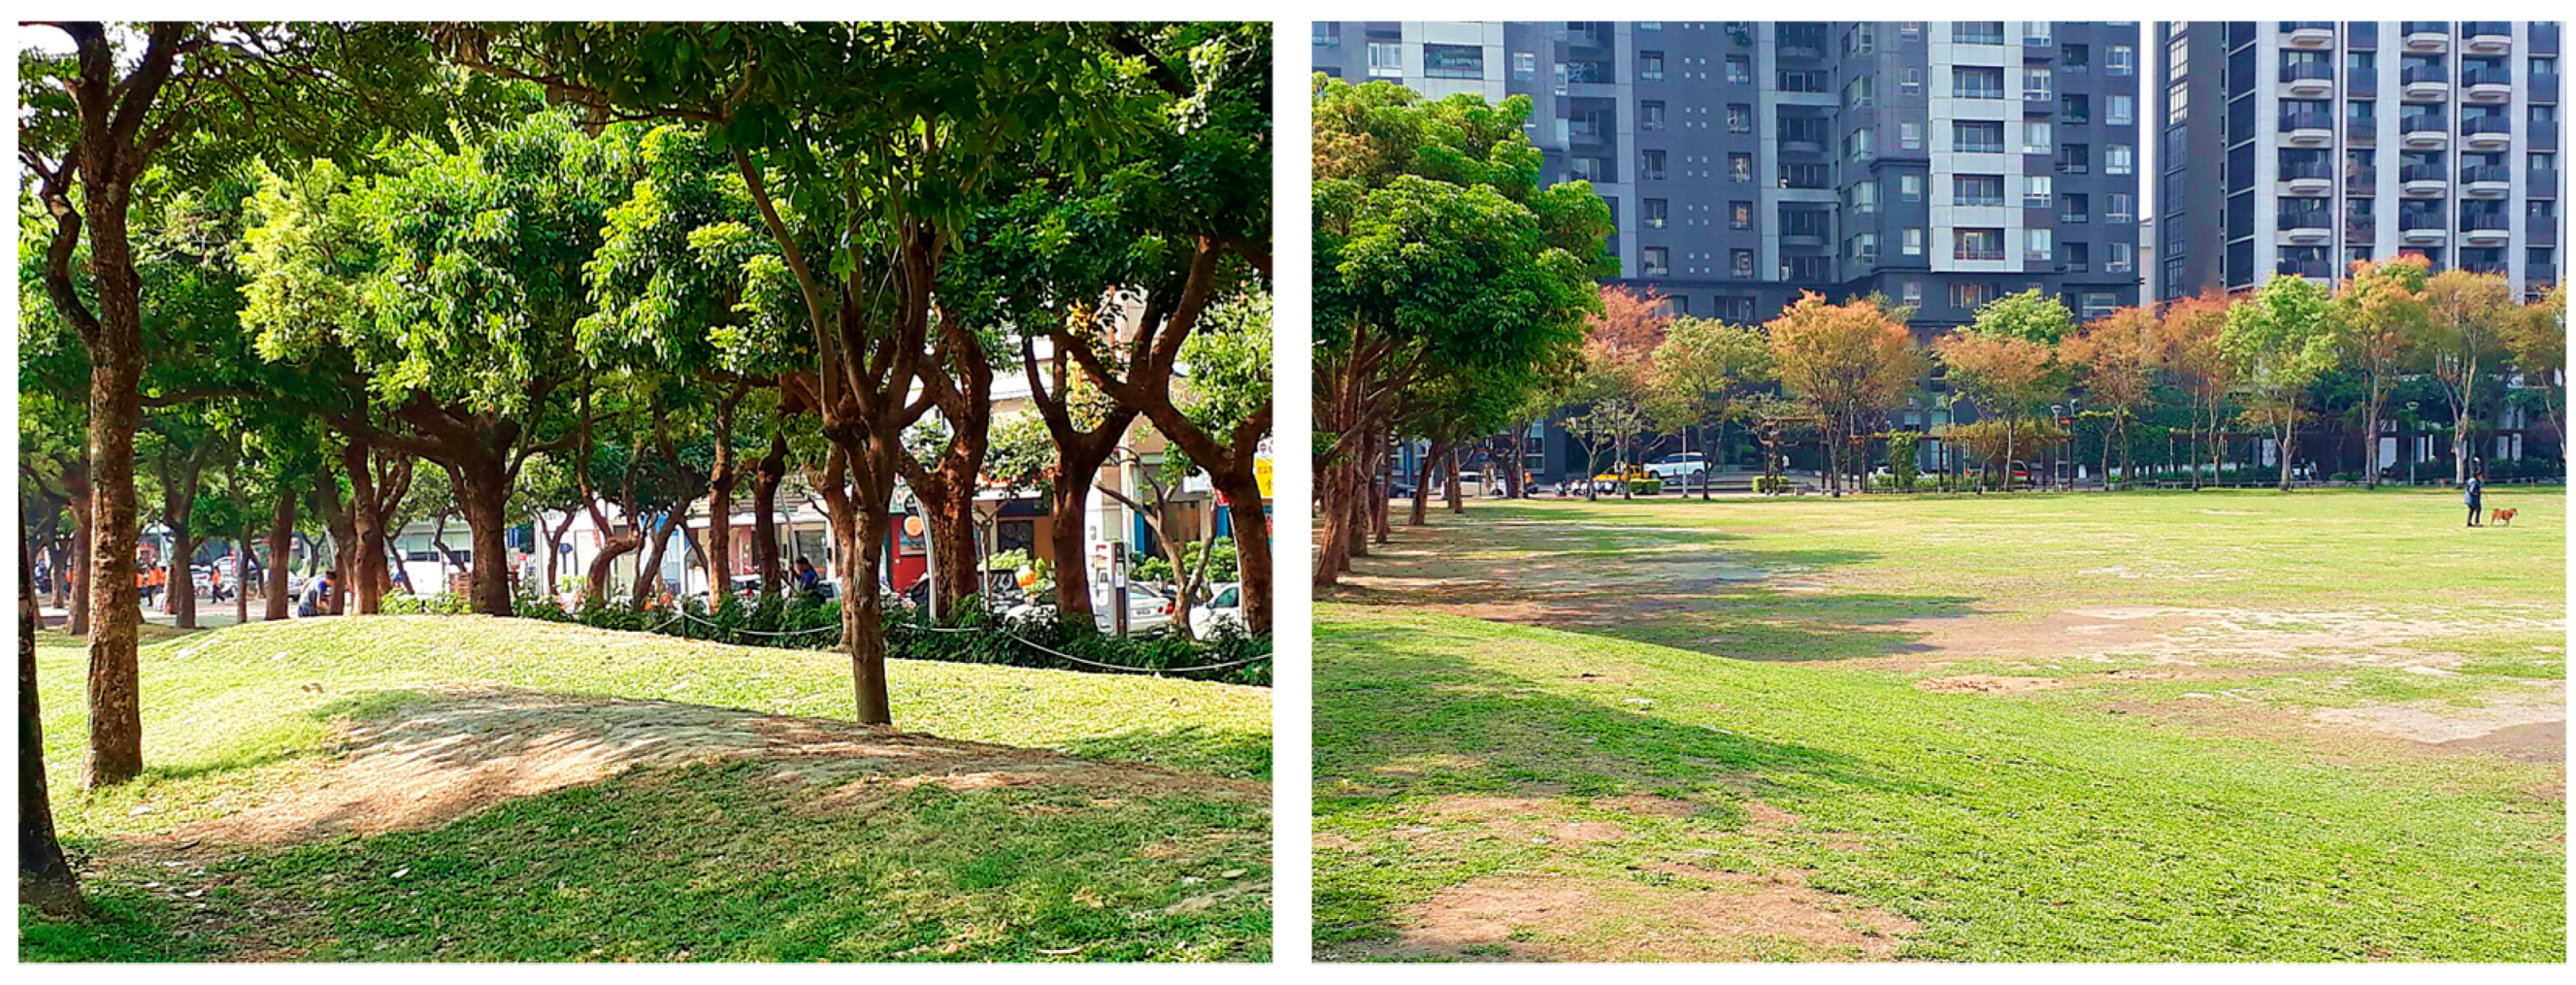
When constructing the Taichung Calligraphy Greenway, the government adopted eco-friendly materials and took the whole area into consideration [10]. For instance, the major shopping mall in the Calligraphy Greenway area is covered by a vertical garden composed of hundreds of thousands of plants, which is known as the largest green wall in Asia. The building received the 2010 FIABCI Prix d'Excellence Awards [11]. The Taichung Calligraphy Greenway also includes a bicycle lane with YouBike (the largest public bicycle sharing system in Taiwan) stations for renting shared bicycles. When designing the Calligraphy Greenway, the goal was to provide a low-carbon recreational environment and to enhance the city’s image [8]. In order to reduce the carbon emissions, the Taichung government reshaped the living space and negotiated with the neighboring private industries.
Taichung Calligraphy Greenway is a significant attraction in Taichung. It not only provides a recreation area to adjacent residents but also appeals visitors from other places. Therefore, the Taichung government eagers to gather more information for improving the quality of the Taichung Calligraphy Greenway in order to provide the residents a better recreation area and to promote the eco-friendly urban recreation via the greenway. Thus, investigating the visitors’ latent preferences could assist the government to establish better management and planning. In order to investigate the visitors’ preferences, previous studies showed that combinations of recreational attributes and choices impacted tourists’ decisions [12] and affected various attributes of recreational zone installations. Among several methods, the method based on economic evaluation treated the abstract value of each attribute as a monetary value and a change in the levels of these attributes showed the recreational preferences [4]. Various factors (such as the region, culture, social demographic structure, economic background and recreational habits) have been studied [5].
This study uses choice experiment (CE) to determine Taichung citizens’ preferences in terms of the Calligraphy Greenway’s attributes. CE have been widely used in economic evaluations of forest recreation [13,14]. When testing CE, the respondent chooses an alternative group, which actually represents a product or a service change value. The respondent’s choice reflects preferences [15]. The CE was proved effective especially for the recreational evaluation of urban forests or green zones [4]. The goal of this study is to analyze (1) the effect of visitors’ preference levels to Taichung Calligraphy Greenway on different recreational attributes and (2) the effect of preference levels of visitors with different socioeconomic backgrounds on different recreational attributes. The results could provide a valuable reference for planning other city greenways.
2. Material and Methods
2.1. Theoretical Model
CE is originated from Lancaster’s consumer theory, which states that the utility of a commodity is the total sum of utilities of all its attributes [16]. In the theory, each attribute of a commodity affects consumer choice. Therefore, in a CE test, a combination of multiple attributes of a commodity constitute a bundle of attributes.
According to the Random Utility Model theory (RUM) [17], the utility Uij of a product is a random variable determined by a deterministic component Vij (representing the product’s attributes that can be directly observed) and a random component εij. In general, because there are too many combinations of all levels of attributes, only a part of these combinations is provided to respondents in the survey. Then, the utility Uij that respondent i obtains from selecting alternative j is represented as follows:
where i indicates the index of a respondent; j indicates the index of the alternative that the respondent chooses from the given choice set; Vij is the component that can be directly observed when respondent i chooses alternative j, also being expressed as βi xij, in which βi is a coefficient vector and xij is a vector of attribute values of alternative j chosen by respondent i [17,18]; and εij indicates unobservable attributes.
This model is based on the assumption that all respondents share common likes. However, this study aims to set group tests and different alternatives to infer preferences of the respondents. Therefore, this study uses the latent-class model (LCM) to verify the accuracy of the original hypothesis. The LCM supposes that the respondents are divided into C classes. Conditional Class-Membership Probabilities are not restricted to estimating coefficients but can also be used to define marginal values of attributes. Change of different levels of attributes determines “Willingness to Pay” (WTP). According to [18], the WTP of respondent i in class c is expressed as follows:
where I denotes the set of indices of all the given alternatives; and represent vectors of attribute values of alternative k chosen by respondent i before and after change, respectively; is the coefficient vector for class c; and βpayment,c is the payment coefficient for class c. This equation shows that the attribute bundles are swapped to calculate the possible marginal utility following the exchange, demonstrating the importance of attributes to the respondent.
To determine the utility of attributes, this study uses the stated preference method (a.k.a, laboratory simulation method or scenario-based method), in which real conditions are simulated by experimental designs and then the respondent makes a policy via a cognitive process [6]. The method has the following characteristics: (1) each hypothetical alternative is demonstrated to respondents through a description; (2) the description of each alternative is interpreted using a portion of the attributes of known or existing products or services; (3) each attribute has different levels and each alternative consists of a combination of attribute levels; (4) alternatives consisting of levels of attributes are designed by experimental designs; and (5) respondents use different methods to express their preferences for alternatives.
The information that influences respondents’ choices can be ascertained using the stated preference method and hence alternatives are considered according to respondents’ different backgrounds in the descriptive preference mode. Given a choice set of 2–5 alternatives, each respondent selects the preferred alternative from the set. Attributes are chosen to be independent of each other, to avoid structural mode failure because of linear relationships between attributes [4,15].
The alternatives in the stated preference method are described using the following three ways: textual description, paragraph description and graphic expression. Textual description uses texts to state attributes of each alternative and their levels and is simple, concise and highly efficient. Paragraph description describes hypothetical stimuli in a paragraph, so the entire circumstances are described to respondents. However, it can only be used to describe a limited number of stimuli. Graphic expression is the truest among the three methods but is costlier in terms of time and money. In order to maximize the questionnaire benefits under the limited resources, this study adopts textual description. The questionnaire given to respondents presented corresponding textual descriptions, to give respondents a basic understanding of the questionnaire’s response method and alternative selection when completing the questionnaire.
Most of the studies on preference measurement used different measurement methods for different attributes, respondents, or experimental goals. Preference measurement methods are generally categorized as first preference method, ranking method, or rating methods. For the first preference method, each respondent chooses an alternative to replace the current alternative from all the simulated alternatives and the chosen alternative is regarded as the respondent’s first preference. For the ranking method, each respondent ranks all alternatives according to the respondent’s preference. For the rating method, each respondent sets a rate for each alternative, in which a higher rate indicates a greater preference for the alternative. Most European and US studies that applied conjoint analysis were based upon ranking or rating methods [19]. Previous studies to determine the validity of the two methods did not reach a uniform conclusion. Therefore, this study uses the most commonly used method: the rating method.
2.2. Determining Attributes that Impact Preferences and Their Levels
There are many ways to determine recreational attributes that influence preferences, such as the researcher’s professional judgment [20], investigations by a group of professionals [21], or in-depth interviews with tourists [22]. The first part of is study refers to the analysis of the socio demographic data in order to categorize the demographic background of the visitors to the Calligraphy Greenway.
This study refers previous studies on Taichung Calligraphy Greenway [23] to organize the attributes that influence preferences, as shown in Table 1, in which the levels of each attribute are obtained by referring to previous studies and our discussions. Among the five attributes that influence recreational preference in Table 1, “total recreational cost” is regarded as an interval scale variable, which is a kind of statistic scale in which the value between the scale points is measurable (i.e., it has a linear decreasing relationship with the utility function so the higher the cost is, the lower the utility is). All the other four attributes are regarded as discrete variables. The “recreational service quality” (including quality of facilities), “environmental landscape resources” and “cultural landscape resources” are considered as ordinal scale variables. The higher the “recreational service quality” is, the higher the utility is. The more abundant the “environmental landscape resources” and “cultural landscape resources” are, the greater the utility is.
2.3. Determining Alternatives
After the five attributes and their levels are determined, there are a total of 33 × 22 = 108 different alternatives if a complete factorial design is applied. If the questionnaire required respondents to conduct preference evaluations for these 108 alternatives, the questionnaire’s evaluation tasks would be overly complicated, which could influence accuracy of the results. The number of alternatives can be reduced by using an orthogonal fractional factorial design (i.e., without considering the interaction between factors). The alternative sets were then determined by the statistic software and the experts [20]. By conducting SPSS (version 20.0, IBM, Armonk, NY, USA) statistical analysis and expert discussion, 18 alternatives were selected to provide the calibration model and two additional alternatives were used to validate the accuracy of the calibration model (i.e., alternatives 19 and 20), as detailed in Table 2.
2.4. Study Area
The Calligraphy Greenway is in Taichung City, the second largest city in Taiwan. It has been one of the most significant attractions of Taichung. It is located in the Western district in Taichung, as shown in Figure 2. The Western district includes the National Museum of National Science, which is located at the north part of the Calligraphy Greenway and National Taiwan Museum of Fine Arts, which is located at the south part of the Calligraphy Greenway. By combining these special meaningful Taichung sights together, the Calligraphy Greenway is not only a park area in Taichung but also a designing commercial area for the tourism.
2.5. Questionnaire Design
The respondents of the questionnaire are the visitors to the Taichung Calligraphy Greenway. The rating method and the ranking method are used to investigate visitors’ preferences for various alternatives. Visitors’ characteristics in the survey include visitors’ social background: gender, age, educational level, occupation, income and place of residence. Past recreational experiences in the survey include whether visitors have visited the Calligraphy Greenway to participate in recreational activities in the recent year, frequency of their visits, number of hours of each visit and average travel expenses per person per visit. Evaluating the preference of each alternative is conducted by asking the visitors to give their preferences for 20 alternatives in a random sequence.
This study used the rating method, in which visitors considered five attributes for each of the 20 alternatives and then scored each alternative according to their respective preferences, with 100 representing the highest preference and 1 representing absolute dislike. The questionnaire in this study was designed to realize visitors’ preference levels for the “space” of the Taichung Calligraphy Greenway. The respondents surveyed in this study include not only the visitors to the Taichung Calligraphy Greenway for recreation but also the residents that went for exercises.
There are two parts of the questionnaire. The first part is the choice experiment questions. The score that the respondents gave would be used to analyze the preference and the utility of the recreational settings. For example, one of the scenarios was that the visitor would spend less than 16.35 USD and enjoy a service with a low quality recreational setting, few cultural landscape designs and abundant environmental landscape designs. The visitors would give a score to represent how much he or she liked the scenario. The second part of the questionnaire is about the socio-demographic characteristic survey. In this part, the visitors were asked to fill up their gender, age, income, occupation, education level, residence, the motivation of visiting the Calligraphy Greenway, the frequency of visiting the Calligraphy Greenway, how long on average they spent at the Calligraphy greenway and how much they spent during the visit. This study also used five Likert scale to exam satisfaction with the Calligraphy Greenway among the visitors.
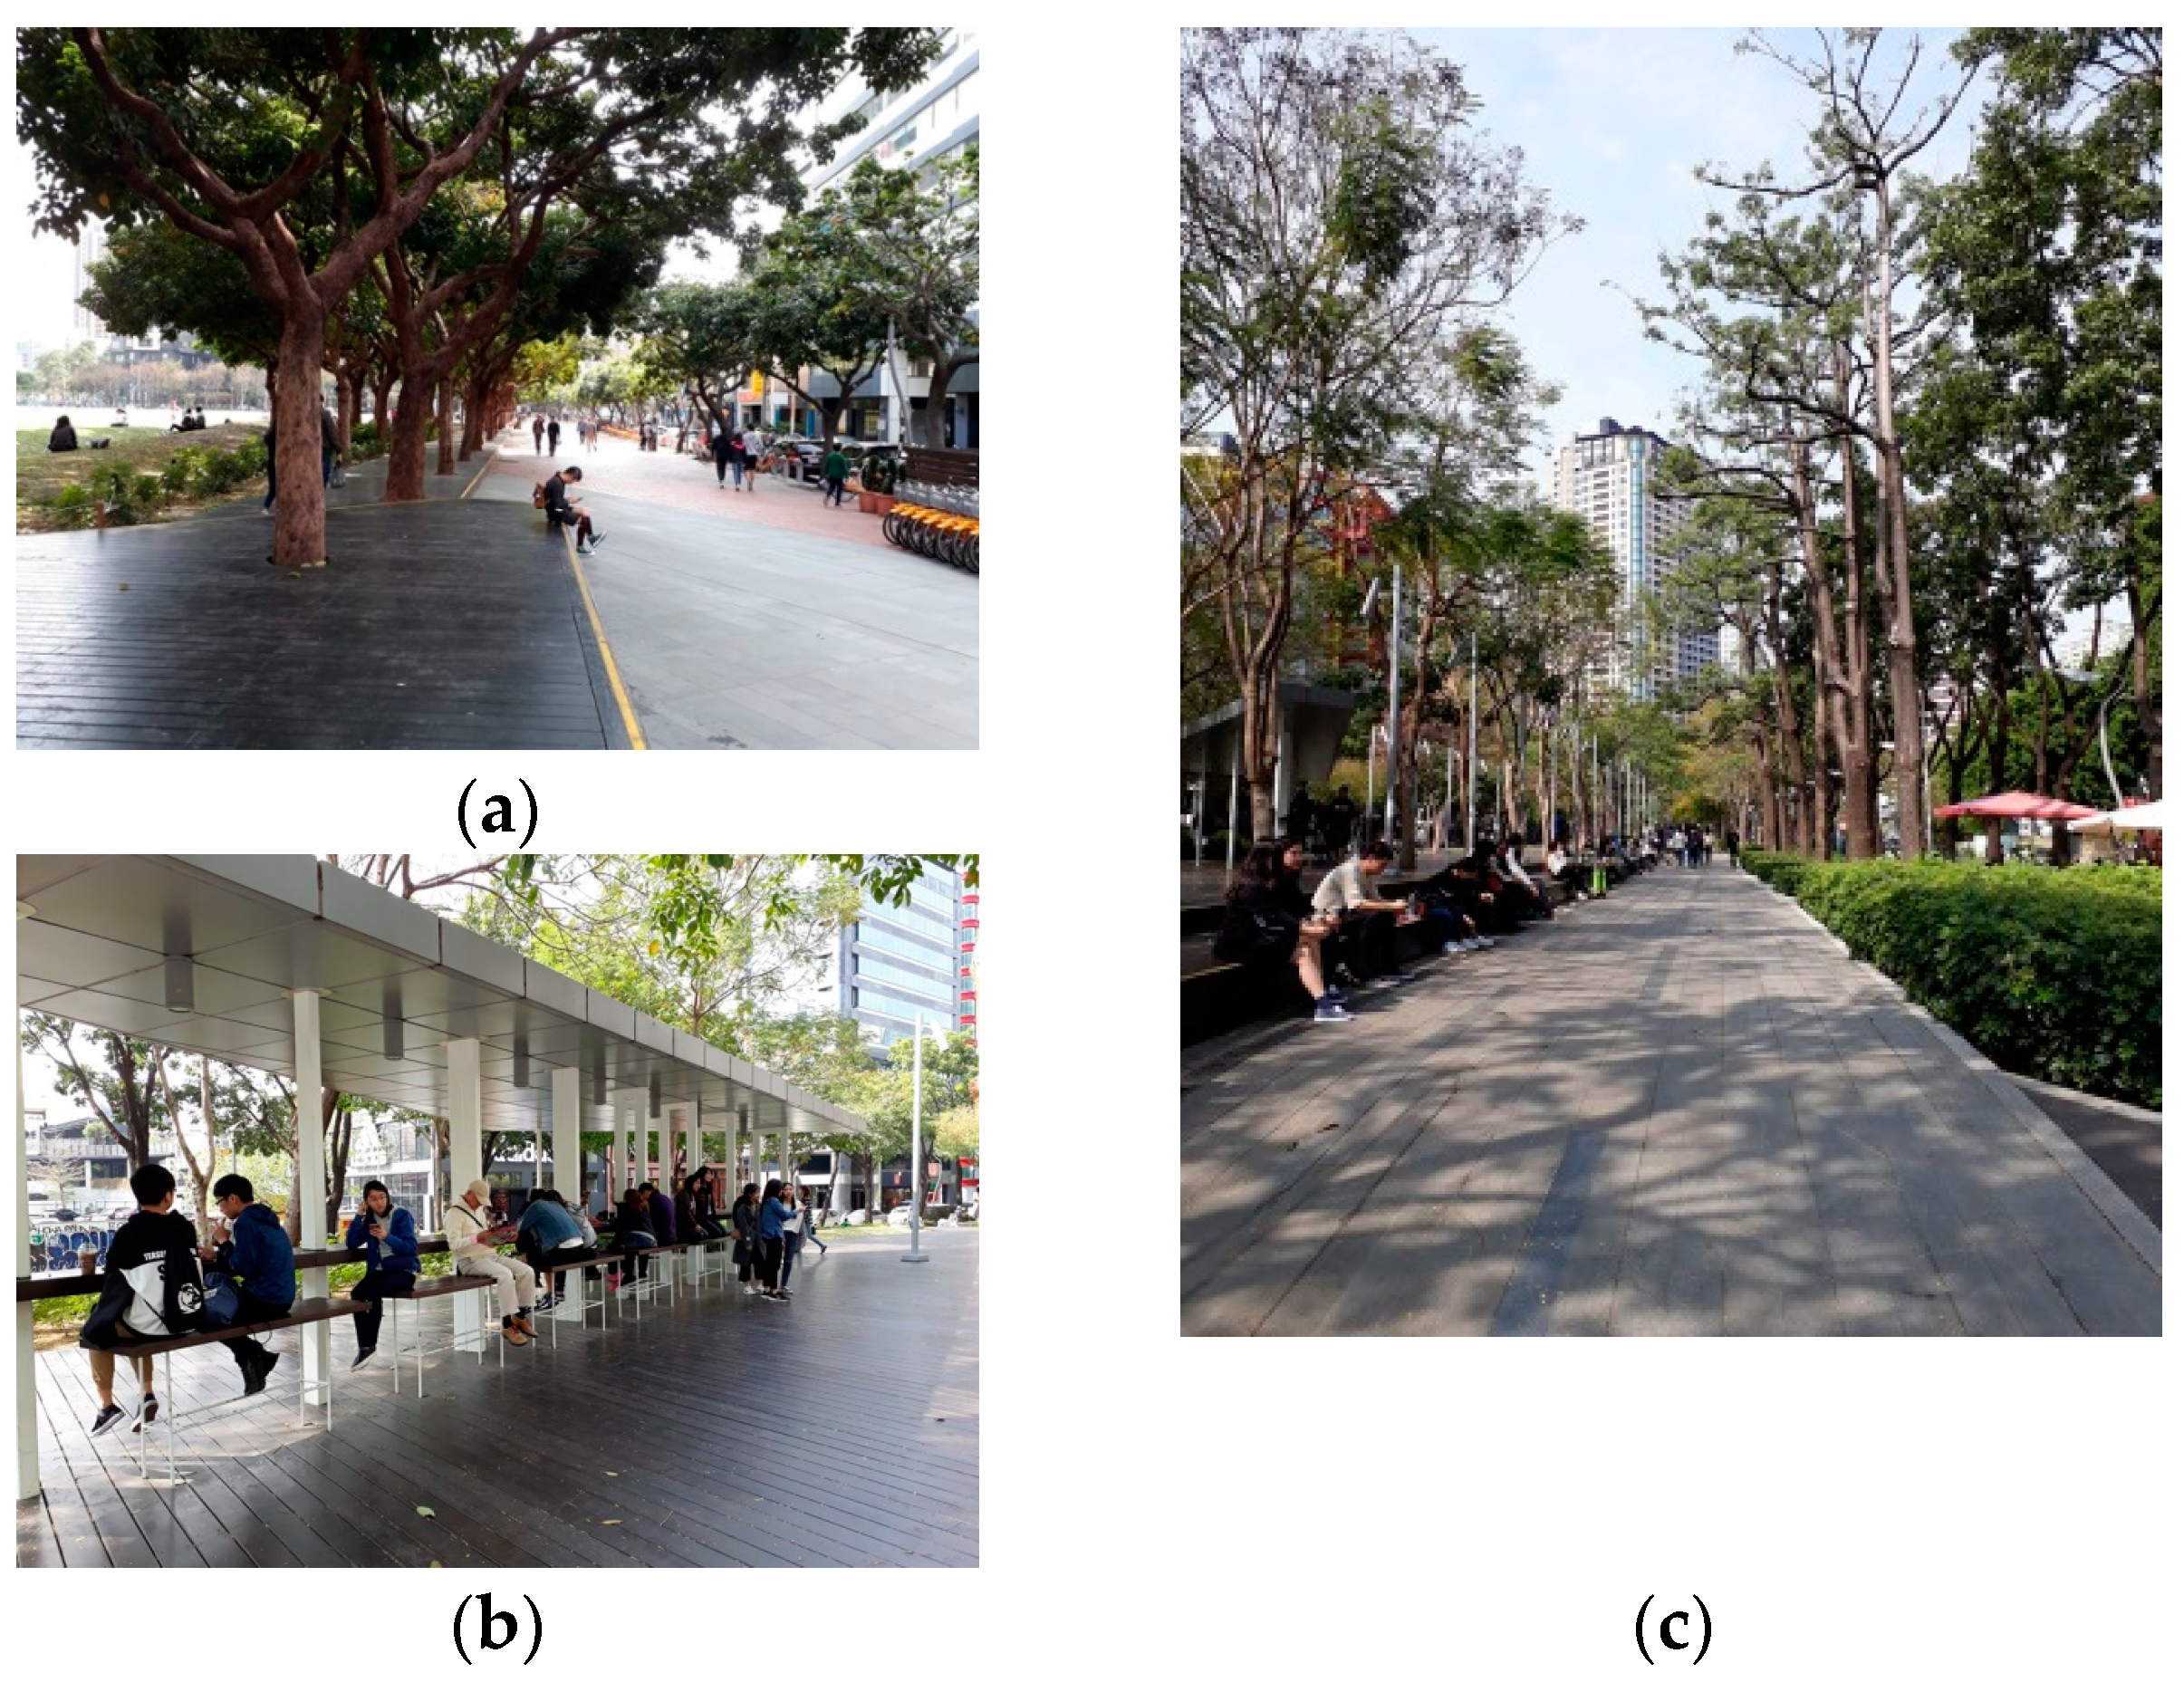
The questionnaires were distributed during July to September of 2016. It was conducted by random sampling. Respondents were surveyed at the major squares and entrances of the Calligraphy Greenway (see Figure 3). The visitors received a simple explanation of the questionnaire’s purpose and instructions first. The total number of the visitors that were asked to respond is 500 but only 250 visitors were willing to respond. Some respondents did not finish all the questions in this survey because of personal reasons and hence they were not regarded as valid samples. The total number of questionnaires received was 228. After removing these invalid samples, the number of valid questionnaires is 203 [23,25]. Note that invalid questionnaires were defined as those in which responses of all questions were similar or in which some questions were not responded.
2.6. Questionnaire Analysis Method
According to [26], reliability analysis measures the internal consistency of the questionnaire. Cronbach alpha is one of the value measurement in reliability analysis. The value of the Cronbach alpha depends on the items been examined. A high Cronbach alpha value indicates that the questionnaire or the survey has internal consistency. Additionally, Pearson’s coefficient analysis investigates the relationship between two variables. It measures the strength of the association between the two variables. If the coefficient is positive, the two variables would increase or decrease simultaneously; otherwise, one of the variables would increase (respectively, decrease) while the other variable decreases (respectively, increase) [27].
Multilinear regression method has been widely used as a technique for decision making [27]. It investigates the relationship between independent variables and the dependent variables. The results of the multilinear regression method could indicate how the independent variables influence the dependent variable. In addition, it could be used to explain how much the independent variables could explain the dependent variables, which this study is interested in. In this study, the relative importance method is also used to evaluate the importance of attributes [20]. It uses different alternative sets to weight the importance of attributes, which could show the preference of the respondents toward these attributes [20].
3. Results and Discussion
3.1. Questionnaire Reliability Analysis
This study conducted reliability analyses on valid questionnaires. The Cronbach’s α value of this questionnaire exceeds 0.7. Considering this study had 20 items, 0.7 in the Cronbach value states that the questionnaire (which is tested by the reliability test) is internally consistent.
3.2. Analysis of Descriptive Statistics
3.2.1. Analyzing Frequency of Visitors’ Basic Attributes
As shown in Table 3, the data analysis for the visitor sample surveyed in this study shows a greater number of female visitors, with a total of 114, or 56.2%. 171 visitors, or 84.2% identified themselves as “unmarried.” The majority of visitors, a total of 144, or 70.9%, reported a “college” level of education. A total of 89 visitors, or 43.8%, reported their occupation as “student.” The second most common occupation was “service industry,” with a total of 21 persons, or 10.4%. 17 visitors, or 8.4% identified themselves as “self-employed.” The reason why the number of student visitors is large may be that the questionnaire was distributed from July to September of 2016, which was the summer break of students in Taiwan.
In the section concerning the recreational motivation for visiting the Calligraphy Greenway, a total of 137, or 67.5% of visitors reported “taking a walk” as their motivation. Because the Calligraphy Greenway is an urban green space located in the midst of a bustling urban residential area, visitors chose this location for brief periods of relaxation. Most visitors were “nearby local residents,” with a total of 152 visitors, or 75.9%. It is also possible that the lack of large exhibitions or special events (e.g., Taichung Jazz Fest) might account for the low volume of non-local visitors, as the distance to visit the Calligraphy Greenway might be too far for the non-local visitors. The previous study also showed that the distance to the recreation location would have negative influence on the visitors’ intension [28,29].
3.2.2. Analysis of the Descriptive Statistics for Visitors’ Attributes
As shown in Table 4, the average age of visitors is 27.08 years. Visitors’ average annual salary was 8993.73 USD, which is lower than Taiwan’s current average annual salary of 20,383.04 USD [30], which may result from the greater number of students. In the past year, the overall average number of visits to the Calligraphy Greenway was 9.15, most of which were local visitors. This is consistent with studies for urban forests [28], in which the visitors who live closer to the recreation area would tend to visit the area more frequently.
As an urban green space, the Calligraphy Greenway’s ensures that it can be easily accessed. The average length of a visit to the Calligraphy Greenway was 2.37 h. Statistical analysis indicates that the majority of visitors traveled to the Calligraphy Greenway for the purpose of leisure recreation. They viewed it as a place to take breaks during the workday. The visitors were satisfied with the recreational attributes. People were most satisfied with “recreational activity opportunities,” assigning it an average score of 3.85 points, then “environmental landscape resources,” with an average satisfaction score of 3.83 points. There is relatively lower satisfaction with design of the cultural landscape and planning.
Note that the total satisfaction is higher than the single satisfaction because we asked the respondents to give a score for each satisfaction but the four aspects that we asked did not cover all aspects that influence satisfaction.
3.3. Analysis of the Descriptive Statistics for Preferences in Terms of Attributes
As shown in Table 5, of the 20 alternative cases, Alternative 9 (with recreational cost between 16.35–32.69 USD, high quality of recreational services, availability of only participation-based recreational activities, abundant environmental landscape resources and abundant cultural landscape resources) scores the highest preference, at 86.79 points.
The second highest score is for Alternative 14 (with recreational cost of 16.35 USD or lower, high quality of recreational services, availability of both participation and observation-based activities, abundant environmental landscape resources and few cultural landscape resources), with an average score of 78.57 points. The alternative with the lowest score is Alternative 2 (with recreational cost between 16.35–32.69 USD, low quality of recreational services, availability of only observational activities, abundant environmental landscape resources and few cultural landscape resources), with an average score of 56.06 points. Of the 20 alternatives, only Alternative 9 (with recreational cost between 16.35–32.69 USD, high quality of recreational services, availability of only participation-based recreational activities, abundant environmental landscape resources and abundant cultural landscape resources) scores an average score of more than 80 points. Alternative 1 (with recreational cost of 32.69 USD or more, high quality of recreational services, availability of only participation activities, abundant environmental landscape resources and abundant cultural landscape resources), Alternative 2 (with recreational cost between 16.35–32.69 USD, low quality of recreational services, availability of only observational activities, abundant environmental landscape resources and few cultural landscape resources) and Alternative 12 (with recreational cost of 32.69 USD or more, high quality of recreational services, availability of only observational recreational activities, few environmental landscape resources and few cultural landscape resources) score less than 60 points. Other alternatives average between 60–80 points.
3.4. Analyzing Preferences for the Calligraphy Greenway by the Rating Method
3.4.1. Analyzing Preferences for the Recreational Attributes
The evaluation results using the rating method for the Calligraphy Greenway are shown in Table 6, in which the attribute utility value indicates the utility of an attribute level chosen by visitors. The total recreational cost of more than 16.35 USD has a negative attribute utility for each alternative. Total recreational cost of 16.35 USD or less has a positive attribute utility value. This shows that an increase in total recreational cost reduces the attribute utility of visitors, which is consistent with the results of previous studies [13,20]. The amount of total recreational cost affects the utility of the alternative choice. The results show that the greater the overall recreational cost for visiting the Calligraphy Greenway, the lower the visitor utility and the lower the preference.
In terms of the “recreational service quality” attribute, high and medium quality of recreational services are all positive and the attribute utility value for high quality of recreational services is greater for visitors. Low recreational service quality results in a negative attribute utility value. For visitors to the Calligraphy Greenway, a quality of service facility that is too low leads to an extremely negative recreational experience. This result shows that the higher the recreational service quality, the greater the utility value [28,31].
The results show that abundant environmental landscape resources and cultural landscape resources have a positive effect on the attribute utility values of visitors, so both environmental and cultural landscape resources influence recreational utility for visitors. The result is consistent with the results of previous studies. For example, the environmental landscape [20,32] and cultural landscape [20] have a positive influence on the visitors’ preferences. The statistics show that abundant environmental landscape resources have a greater utility value than abundant cultural landscape resources. This shows that increasing environmental landscape resources has a greater impact on increasing visitors’ recreational utility than increasing cultural resources. Overall, an increase in either environmental landscape resources or cultural landscape resources increases the recreational utility for visitors.
For visitors who visited the Calligraphy Greenway, the attribute with the greatest utility was the recreational service quality (34.08%), so visitors considered the recreational service quality to be the most important factor, which is in agreement with the results of previous studies [28,31]. The recreational facilities that visitors considered to be most important include walking paths, street lamps, public restrooms and trash bins. It may be inferred that the recreational service quality exerted the most direct impact on visitors’ recreational experience because visitors regarded these recreational facilities as the most significant [28,31]. Bertram et al. [28] indicated that cleanliness and maintenance are important preferences for visitors. The cleanliness, for instance, is measured by the setting of garbage cans, which is regarded as recreation services in our study. In addition, Lin [20] found that recreation services are also the most significant attribute among all.
The recreational attribute that was regarded as the second most important was the cost of travel to reach the Calligraphy Greenway (22.55%). It can be inferred that, because the Calligraphy Greenway is located in the center of the city and the recreational group consists mostly of local residents, the recreational cost exerted a certain degree of influence on visitors’ recreational preferences [5].
The next most important attribute is the abundance of environmental landscape resources and cultural landscape resources, the relative importance of which are 17.79% and 14.14%, respectively. In terms of the greater perceived importance of environmental landscape resources compared to cultural landscape resources, previous studies also showed that visitors were willing to spend a greater amount of money to visit areas in which nature has been more fully preserved [33]. The utility values for this attribute showed that increasing the abundance of natural environment would result in a higher utility value.
Finally, the least important attribute was the recreational activity opportunities that the Calligraphy Greenway provides (11.44%). This analysis of basic attributes shows that the majority of visitors (a total of 67.5%) visited to take walks leisurely. An analysis of these utility values for attributes shows that providing only observational activities results in a greater utility value than providing only participation activities, which further shows that visitors were not particularly interested in actively participating in the events held at the Calligraphy Greenway. This infers that opportunities for recreational activities constitute a recreational attribute that is of lesser importance. Note that the categories of recreation activities are designed especially for the Calligraphy Greenway. Most of the previous studies used positive or negative recreation activities as their categories. For example, Brey and Lehto [34] categorized recreation activities into a positive class, a nondescript class and a negative class. However, it is difficult for the visitors to distinguish between positive and negative activity categories. Therefore, this study classifies the recreational activity opportunities into observational activities and participation activities. Our study is a pioneer for the new classification for recreational activities.
3.4.2. Gender Analysis for Preferences for Recreational Attributes
Previous studies have determined the effect of gender on participation. It has also been shown that gender can influence recreational preferences [35]. Hence, this study analyzes whether gender affects the degree of preference for different forms of recreation. The visitors are divided into two groups according to gender, with a total of 114 females and 89 males (Table 7). A comparison of the rating values for preferences shows that males and females displayed similar trends in terms of the effect of attributes. Females attached a greater importance than males to the amount of total recreational cost and the availability of recreational opportunities. By contrast, males placed a greater emphasis than females on the recreational service quality, environmental landscape resources and cultural landscape resources. While these preferences are not particularly obvious, it is inferred that these results show that females attached greater importance to abstract social contact [35], interpersonal interactions and feelings than do males; and that males attached greater emphasis to concrete and practical applications of facilities and hardware.
The most important attribute was the recreational service quality. The greater the recreational service quality, the higher the utility value. This value was similar for both males and females. Males attached a slightly greater importance to recreational service quality (34.17%) than do females (34.01%). The greater the total recreational cost, the lower the attribute utility. This shows that visitors had a greater preference for lower total recreational cost, which is consistent with the results of previous studies. The statistics also show that females attached greater importance to total recreational cost (22.66%) than did males (22.81%), which shows that females had higher requirements in terms of total recreational cost than did males.
There is no significant difference between males and females in terms of preferences for environmental and cultural landscape resources. Males awarded environmental landscape resources an importance of 18.17% and females awarded it an importance of 17.77%. Males awarded cultural landscape resources an importance of 14.14% and females awarded it an importance of 14.11%. Only these two attributes show no significant differences but environmental landscape resources and cultural landscape resources exerted a slightly greater influence on males. Finally, both males and females attached least importance to the opportunities of recreational activities held at the Calligraphy Greenway. Females preferred observational activities to participation activities; and men preferred participation activities.
3.4.3. Analyzing Residents’ Preferences in Terms of Recreational Attributes
Questionnaire visitors were divided in terms of their place of residence. 153 visitors live in Taichung city and 50 are non-residents (also called non-locals), which is consistent with the results of previous studies [28].
The results for preference evaluation is shown in Table 8, in which locals attach greater importance to total recreational cost and recreational activity opportunities than did non-locals. Non-locals attach greater importance to environmental landscape resources and cultural landscape resources. Both groups, to some extent, attached a similar level of importance to the recreational service quality.
The statistics for total recreational cost show that the relative importance of this attribute was slightly greater for locals (22.61%) than for non-locals (22.37%), which shows that locals might attach slightly more importance to total recreational cost than did non-locals. On the reason for which locals attached greater importance to total recreational cost, it is inferred that the most visits to the Calligraphy Greenway aimed to take a leisurely walk and the visitors did not deliberately plan their trips. Previous studies also showed that locals were less flexible in terms of their willingness to change the environment than were outsiders [28], so there was less overall willingness among locals to spend a greater sum of money on recreation.
Environmental landscape resources might have a greater importance for non-locals (17.93%) than for locals (17.75%). In terms of cultural landscape resources, non-locals awarded this attribute an importance of 14.23% and locals awarded it an importance of 14.10%, which is an insignificant difference. However, environmental landscape resources exerted a slightly greater influence on non-locals than did cultural landscape resources. It is inferred that, because non-locals traveled to Taichung from outside areas, their first impression of the recreational area was visual, so non-locals were likely to have a more significant reaction to landscape installations, so they awarded greater levels of importance to these two attributes.
Finally, locals and non-locals regarded the recreational activity opportunities provided by the Calligraphy Greenway as least important. This factor might have a greater level of importance for locals (11.46%) than for non-locals (11.39%). A detailed comparison shows that, for both locals and non-locals, only providing observational activities resulted in a greater utility than only providing participation activities, which shows that visitors preferred that the Calligraphy Greenway provides observational activities to participation activities.
3.5. A Multilinear Regression Analysis of the Results
This study investigated which aspects of visitor background affected the frequency, the length of stay and the overall satisfaction of visitors to the Calligraphy Greenway. These three items constitute the independent variables for a multilinear regression analysis and the analysis results are given in Table 9. “Number of visits to the Calligraphy Greenway in the past year” and “age” show a clear positive correlation (β = 0.186 **), indicating elder people visited the Calligraphy Greenway more frequently. This result is in agreement with those for previous studies [28,35,36]. Previous studies also noted that visitors to urban forests or green spaces tended to be elder. For example, the result in [35] showed that the elder would tend to be living in walkable neighborhoods. The walking friendly environment, such as urban forests or city greenways, would encourage elder visitors to visit the area [35,36]. The advantageous location of the urban forest and green space plays a role in this trend.
There is a negative correlation with “educational level” (β = −3.547 ***). Those with higher levels of education were less likely to come to Calligraphy greenway.
There is a negative correlation with “place of residence” (β = −3.123 ***). A previous study by Bertram and Larondelleb [5] showed that the distance between home and a recreation area impacts the frequency with which people participate in recreation. An analysis of the results shows that visitors who reside closer to the Calligraphy Greenway visited the site more frequently. It is inferred that because they live closer to the park, reaching the recreation area is easier, so visitors were more willing to participate in recreational activities in this place. These results are consistent with those of previous studies [37]. There is a positive correlation with “time of stay at the Calligraphy Greenway” (β = 1.313 ***), so the more frequently visitors make visits, the longer are their stays, because a greater frequency of visits indicates that a visitor already relies heavily on recreation at the Calligraphy Greenway, so he or she prioritizes this area when considering recreational options.
There is a positive correlation between “time of stay at the Calligraphy Greenway” and “educational level” (β = 0.183 *), so the higher a visitor’s level of education, the longer the stay at the Calligraphy Greenway, which is consistent with the results of previous studies [4,37]. The time of stay has a positive correlation (β = 0.015 ***) with “number of visits to the Calligraphy Greenway over the past year,” so the more regularly a person visited the Calligraphy Greenway, the more likely they were to linger at the Calligraphy Greenway. This may be because those who visited the Calligraphy Greenway more frequently lived in close vicinity to the park, so they were willing to spend longer time at the Calligraphy Greenway. The time of stay has a negative correlation (β = −0.319 *) with “satisfaction with environmental landscape resources,” so those with lower levels of satisfaction with the environmental landscape resources spent longer time at the Calligraphy Greenway. This may be due to the fact that the environmental landscape of the Calligraphy Greenway was not a primary motivation for people who spent longer time at the Calligraphy Greenway. Motivational reasons for this group tend to be activities (such as picnicking, soccer, or flying kites). Previous studies also showed that visitors’ recreational experience varies for different modes of recreation [38]. Visitors to the Calligraphy Greenway also had varying recreational experiences and levels of satisfaction, depending on the different activities in which they participated.
The “overall satisfaction with the Calligraphy Greenway” has a positive correlation with “satisfaction with the recreation and service quality of the Calligraphy Greenway” (β = 0.177 ***) and “satisfaction with cultural landscape resources” (β = 0.284 ***). Each of these four items is used to evaluate satisfaction with the Calligraphy Greenway, so each item has a high positive correlation with the overall satisfaction.
3.6. Correlation Analysis of the Results
This study analyzed the interactive relationship between pairs of visitors’ social background. Multilinear Regression Analysis was used to analyze the frequency with which visitors visited the Calligraphy Greenway for recreation, their stay time and their satisfaction levels. A Pearson correlation analysis is used to analyze the correlation between variable pairs, as shown in Table 10.
Age and marital status show a positive correlation with gender (r = 0.629). A greater proportion of male visitors to the Calligraphy Greenway were married than were female visitors. These results correspond with the marital status statistics of Taichung City. The total population of married males in Taichung City is greater than the total population of married females [30,39]. Age and income show a positive correlation (r = 0.566) for visitors to the Calligraphy Greenway, so older people had a higher income level. Marital status and income show a positive correlation (r = 0.490). Visitors who were married had higher incomes than visitors who were not married, which corresponds with marital status and income data from Taichung City Government [39].
“Satisfaction with the recreational service quality” and “satisfaction with the recreational activity opportunities” show a positive correlation (r = 0.459), so visitors with a higher degree of satisfaction with the recreational service quality also have a higher degree of satisfaction with the recreational activity opportunities. “Satisfaction with the recreational service quality” has a positive correlation with the “satisfaction with environmental landscape resources” (r = 0.518), so visitors who had a higher degree of satisfaction with the recreational service quality also had a higher degree of satisfaction with the environmental landscape resources. “Satisfaction with the recreational service quality” has a positive correlation with the “satisfaction with cultural landscape resources” (r = 0.518), so visitors who had a higher degree of satisfaction with the recreational service quality also had a higher degree of satisfaction with the cultural landscape resources. “Satisfaction with the recreational service quality” had a positive correlation with the “overall satisfaction” (r = 0.544), so visitors who exhibited a greater degree of satisfaction with the recreational service quality had a greater overall satisfaction.
“Satisfaction with the recreational activity opportunities” and the “overall satisfaction” shows a positive correlation (r = 0.475), so visitors who had a greater degree of satisfaction with the recreational activity opportunities had a greater degree of the overall satisfaction. “Satisfaction with environmental landscape resources” and “satisfaction with cultural landscape resources” shows a positive correlation (r = 0.434), so visitors who had a greater degree of satisfaction with environmental landscape resources had a greater degree of satisfaction with cultural landscape resources. “Satisfaction with environmental landscape resources” and “the overall satisfaction” shows a positive correlation (r = 0.496), so visitors who had a greater degree of satisfaction with environmental landscape resources had a greater degree of overall satisfaction. “Satisfaction with the cultural landscape resources” and “the overall satisfaction” show a positive correlation (r = 0.599), so the greater a visitor’s degree of satisfaction with the cultural landscape resources, the greater their overall satisfaction.
This study has the following two hypotheses: (1) the visitors to the Calligraphy Greenway had different preference levels for recreational attributes and (2) the visitors with different socioeconomic backgrounds had different preference levels for recreational attributes. The results for hypothesis (1) show that the visitors had the highest preference for service quality of recreational facilities but attached the lowest importance to cultural landscape resources. The results for hypothesis (2) show that the female visitors attached greater importance to the total recreational cost than the male; local visitors were more concerned about the total recreational cost than non-local visitors; and all visitors attached the greatest importance to the service quality of recreational facilities.
4. Conclusions and Recommendations
This study analyzes citizens’ preferences for recreational facilities and determines ways in which facilities and landscape of the Calligraphy Greenway in Taichung in Taiwan can be improved and provides a valuable reference for future city greenway planning. The goal of this study is to analyze (1) the effect of visitors’ preference levels to the Calligraphy Greenway on different recreational attributes and (2) the effect of preference levels of visitors with different socioeconomic backgrounds on different recreational attributes. This study has used a CE method to evaluate the preferences of visitors to the Calligraphy Greenway in terms of five attributes: total recreational cost, recreational service quality, recreational activity opportunities, environmental landscape resources and cultural landscape resources.
Correlation analysis, relative importance method and multilinear regression analysis are applied in this study. The visitors’ levels of preference for various recreational attributes were explored and the resulting data was used to improve the current recreational quality. The significance of attributes was ranked from high to low, in terms of recreational service quality, total recreational cost, environmental landscape resources, cultural landscape resources and recreational activity opportunities. That is, the recreational service quality is the most important attribute for the respondents, whereas the cultural landscape resources are the less one. Results for attribute levels show that as total recreational cost increased, visitors’ utility decreased; as the recreational service quality increases, visitors’ utility increased. The results for recreational activity opportunities show that observational activities had a high utility for visitors and that both environmental and cultural landscape resources had a positive utility for visitors. The results of this study show that the visitors to the Calligraphy Greenway tended to prefer the recreational types with low consumption. Karanikola et al. [40] suggested that more attention should be paid to the groups with a low income and limited recreation, because they accounted for about 60% of all visitors. They also mentioned that visitors had higher preference levels (expectation) for recreational facilities. Therefore, their results are consistent with ours.
This study also uses multilinear regression analysis to investigate the effect of preference levels of visitors with different socioeconomic backgrounds on different recreational attributes. The statistical data was divided into male and female groups for comparison. Females attached greater importance to total recreational cost and recreational activity opportunities than did males; and males attached greater importance to recreational facility quality, environmental landscape resources and cultural landscape resources than did females. In addition, the data was divided into local and non-local residents. Locals attached greater importance to total recreational cost and recreational activity opportunities than did non-locals; and non-locals attached greater importance to environmental and cultural landscape resources than did locals. Both groups attached a similar degree of importance to the recreational service quality. Although the result does not show statistical significance, the trend still shows a slight difference due to the effects of different social demographic characteristics.
In terms of the patterns for “number of visits to Calligraphy Greenway over the past year,” the result shows that the older the visitor, the greater the frequency of visits to the Calligraphy Greenway; and the longer the stay at the Calligraphy Greenway is, the more frequently a visitor comes to Calligraphy Greenway for recreation. The visitors with lower educational levels visited more frequently. The nearer local residents lived, the more frequently did they visit. In the research to “time of stay at the Calligraphy Greenway,” the visitors with higher levels of education stayed for longer and the greater the frequency of visits, the longer is the stay. The analysis result of “overall satisfaction with the Calligraphy Greenway” shows that, the greater the degree of satisfaction with each item, the greater the overall satisfaction. In addition, the results of this study show that most visitors went for a walk in the Taichung Calligraphy Greenway and the majority of visitors were Taichung residents. The result shows that most of the visitors to an urban forest/greenway would be those who lived closer to it [40,41]. The function of urban green space and forests tended to provide an area for relaxation, going for a walk and doing exercises. Hence, from recreational attributes of visitors, it was observed that most visitors were the residents in the neighborhood. The results of this study show that most visitors visited there ten times per year on average, which is more frequent than found in the study conducted by Sreethran [41]. Most of the visitors to the Calligraphy Greenway paid more attention to environmental landscape resources than cultural landscape resources. This result is consistent with the results of previous studies for preferences on urban forests or green space, in which most visitors preferred to enjoy the feeling of being close to the nature [40,41].
Based on these results, recommendations for the improvement of the recreational quality for the Calligraphy Greenway were made as follows:
- The government should improve the design for the cultural landscape and increase the quality of cultural landscape resources and recreational value, in order to encourage visitors to visit. It was found that the greenway area has more resources that can be applied and managed, as compared with other recreational areas. Hence, the authorities should make use of these resources to promote integration of recreation and cultural landscape resources.
- The authorities should make more efforts to improve integration of recreation and cultural landscape resources. For instance, from the viewpoint of tour guide, more information boards should be set up to provide visitors the historical backgrounds of the Calligraphy Greenway. Interpretation boards for art installations of humanistic landscape should also be set up to enhance the benefits of integrating recreation and cultural landscape.
- The government should improve the Calligraphy Greenway’s facility to provide visitors with better recreational service quality, in order to encourage visitors to participate in recreation and to increase their willingness to visit. From the results of this study, the attribute with the greatest utility was the service quality of recreational facilities. That is, if recreational service quality could be promoted, the most benefit could be obtained. Therefore, this study suggests that the government should first conduct an overall inspection on recreational service facilities, including the uneven parts of walkways and unpaired fences in public areas. The first priority is to ensure safe travel routes.
- The government should create customized plans for different visitor groups to accommodate varying preferences for recreational attributes, in order to improve recreational experiences for various recreational groups.
Author Contributions
Investigation, C.C.; Supervision and Funding Acquisition, W.-Y.L.; Writing-original draft, W.-Y.L. and C.C.
Funding
This research was funded in part by the Ministry of Science and Technology, Taiwan, and the Council of Agricultural, Taiwan.
Acknowledgments
The authors thank the anonymous referees for comments that improved the content as well as the presentation of this paper.
Conflicts of Interest
The authors declare no conflict of interest.
References
- European Commission. Environment: Green Infrastructure. 2016. Available online: http://ec.europa.eu/environment/nature/ecosystems/index_en.htm (accessed on 20 May 2018).
- Gobster, P.H.; Westphal, L.M. The human dimensions of urban greenways: Planning for recreation and related experiences. Landsc. Urban Plan. 2004, 68, 147–165. [Google Scholar] [CrossRef]
- Weber, S.; Boley, B.B.; Palardy, N.; Gaither, C.J. The impact of urban greenways on residential concerns: Findings from the Atlanta BeltLine Trail. Landsc. Urban Plan. 2017, 167, 147–156. [Google Scholar] [CrossRef]
- Japelja, A.; Mavsarb, R.; Hodgesc, D.; Kovačd, M.; Juvančiče, L. Latent preferences of residents regarding an urban forest recreation setting in Ljubljana, Slovenia. For. Policy Econ. 2015, 71, 71–79. [Google Scholar] [CrossRef]
- Bertram, C.; Larondelleb, N. Going to the woods is going home: Recreational benefits of a larger urban forest site—A travel cost analysis for Berlin, Germany. Ecol. Econ. 2017, 132, 255–263. [Google Scholar] [CrossRef]
- Lin, Y.-X. An Examination of Urban Greenway Development in Taichung City. Master’s Thesis, Feng Chia University, Taichung, Taiwan, 2008. [Google Scholar]
- Taichung City Government. Taichung City Geographic Information System Map. 2018. Available online: http://gismap.taichung.gov.tw/address/index.cfm (accessed on 20 May 2018). (In Chinese)
- Taichung City Government Tourism Office. Taichung Travel Net: Calligraphy Greenway. Taichung City: Taichung City Government Tourism Office. 2018. Available online: https://travel.taichung.gov.tw/en-us/Attractions/Intro/1050/Calligraphy-Greenway (accessed on 20 May 2018).
- FAO, Food and Agriculture Organization of the United Nation. Global Ecological Zones (Second Edition) Map. 2018. Available online: http://ref.data.fao.org/map?entryId=2fb209d0-fd34-4e5e-a3d8-a13c241eb61b&tab=about (accessed on 20 May 2018).
- Wu, K.P. A Study of Visitors’ Satisfaction with Urban Parkway Facilities—A Case Study on Ching-Kuo Parkway in Taichung City. Master’s Thesis, Feng Chia University, Taichung, Taiwan, 2002. [Google Scholar]
- FIABCI World Prix d’ Excellence Awards, Past Winners, Winners of Prix d’ Excellence Awards 2010. Available online: http://fiabciprix.com/2010-winners/ (accessed on 20 May 2018).
- Dehez, J.; Lyser, S. Combining multivariate analysis and cost analysis in outdoor recreation planning. J. Outdoor Recreat. Tour. 2014, 7–8, 75–88. [Google Scholar] [CrossRef]
- Campbell, D.; Vedel, S.E.; Thorsen, B.J.; Jacobsen, B.J. Heterogeneity in the WTP for recreational access: Distributional aspects. J. Environ. Plan. Manag. 2014, 57, 1200–1219. [Google Scholar]
- Tu, G.; Abildtrupa, J.; Garciaa, S. Preferences for urban green spaces and peri-urban forests: An analysis of stated residential choices. For. Policy Econ. 2016, 70, 56–66. [Google Scholar] [CrossRef]
- Louviere, J.J.; Hensher, D.A.; Swait, J. Stated Choice Methods: Analysis and Application; Cambridge University Press: Cambridge, UK, 2000. [Google Scholar]
- Lancaster, K.J. A new approach to consumer theory. J. Political Econ. 1966, 2, 132–157. [Google Scholar] [CrossRef]
- McFadden, D. Conditional logit analysis of qualitative choice behavior. In Frontiers in Econometrics; Zarembka, P., Ed.; Academic Press: New York, NY, USA, 1973; pp. 105–142. [Google Scholar]
- Boxall, P.C.; Adamowicz, W.L. Understanding heterogeneous preferences in random utility models: A latent class approach. Environ. Resour. Econ. 2002, 23, 421–446. [Google Scholar] [CrossRef]
- Darmon, R.Y.; Rouzies, D. Internal validity of conjoint analysis under alternative measurement produces. J. Bus. Res. 1999, 46, 67–81. [Google Scholar] [CrossRef]
- Lin, Y.-J. Study on Recreation Site Choice Behavior: Application of Stated Preference Model. J. Outdoor Recreat. Res. 2000, 13, 63–86. [Google Scholar]
- Lin, P.-Y.; Liaw, S.-C. Applying the Fuzzy Delphi Method to analyze the greenway functions of Lover River in Kaohsiung city. J. Exp. For. Natl. Taiwan Univ. 2008, 22, 89–106. [Google Scholar]
- Yuan, Y.-L.; Lue, C.-C. Understanding the relationships between recreation experience and perception to management actions in forestry settings using qualitative approach. Q. J. Chin. For. 2007, 40, 55–68. [Google Scholar]
- Bai, H.-Z. Exploring the Charms of Taichung Calligraphy Greenway. Master’s Thesis, Tunghai University, Taichung, Taiwan, 2014. [Google Scholar]
- Sardana, K.; Bergstrom, J.C.; Bowker, J.M. Valuing setting-based recreation for selected visitors to national forests in the southern United States. J. Environ. Manag. 2016, 183, 972–979. [Google Scholar] [CrossRef] [PubMed]
- Wann, J.-W.; Yang, Y.-C.; Huang, W.-S.; Lin, Y.-F. An empirical analysis of consumer’s willingness to pay for attributes of domestic banana: A study in metropolitan areas in Taiwan. J. Agric. For. 2013, 62, 249–265. [Google Scholar]
- Babbie, E. The Practice of Social Research, 14th ed.; Change Learning Press: Boston, MA, USA, 2016. [Google Scholar]
- Hair, J.F., Jr.; Black, W.C.; Babin, B.J.; Anderson, R.E. Multivariate Data Analysis, 7th ed.; Pearson Education Press: London, UK, 2010. [Google Scholar]
- Bertram, C.; Meyerhoff, J.; Rehdanz, K.; Wüstemann, H. Differences in the recreational value of urban parks between weekdays and weekends: A discrete choice analysis. Landsc. Urban Plan. 2017, 159, 5–14. [Google Scholar] [CrossRef]
- Schipperijn, J.; Ekholm, O.; Stigsdotter, U.K.; Toftager, M.; Bentsen, P.; Kamper-Jørgensen, F.; Randrup, T.B. Factors influencing the use of green space: Results from a Danish national representative survey. Landsc. Urban Plan. 2010, 95, 130–137. [Google Scholar] [CrossRef]
- Executive Yuan Budget, Accounting and Statistics Office. Taiwan. 2018. Available online: https://www.dgbas.gov.tw/ct.asp?xItem=33338&ctNode=3099&mp=1 (accessed on 20 May 2018).
- Andkjær, S.; Arvidsen, J. Places for active outdoor recreation—A scoping review. J. Outdoor Recreat. Tour. 2015, 12, 25–46. [Google Scholar] [CrossRef]
- Whiting, J.W.; Larson, L.R.; Green, G.T.; Kralowec, C. Outdoor recreation motivation and site preferences across diverse racial/ethnic groups: A case study of Georgia state parks. J. Outdoor Recreat. Tour. 2017, 18, 10–21. [Google Scholar] [CrossRef]
- Sulaiman, F.C.; Hasan, R.; Jamaluddin, E.R. The mature trees in recreation areas and its role in enhancing quality of life. Soc. Behav. Sci. 2016, 234, 289–298. [Google Scholar] [CrossRef]
- Brey, E.T.; Lehto, X. The relationship between daily and vacation activities. Ann. Tour. Res. 2007, 34, 160–180. [Google Scholar] [CrossRef]
- Ghania, F.; Rachelea, J.N.; Washingtonc, S.; Turrella, G. Gender and age differences in walking for transport and recreation: Are the relationships the same in all neighborhoods? Prev. Med. Rep. 2016, 4, 75–80. [Google Scholar] [CrossRef] [PubMed]
- Kerr, J.; Emond, J.A.; Badland, H.; Reis, R.; Sarmiento, O.; Carlson, J.; Sallis, J.F.; Cerin, E.; Cain, K.; Conway, T.; et al. Perceived neighborhood environmental attributes associated with walking and cycling for transport among adult residents of 17 cities in 12 countries: The IPEN study. Environ. Health Perspect. 2016, 124, 290–298. [Google Scholar] [CrossRef] [PubMed] [Green Version]
- Lee, K.H.; Schuett, M.A. Exploring spatial variations in the relationships between residents’ recreation demand and associated factors: A case study in Texas. Appl. Geogr. 2014, 53, 213–222. [Google Scholar] [CrossRef]
- Prayaga, P. Estimating the value of beach recreation for locals in the Great Barrier Reef Marine Park, Australia. Econ. Anal. Policy 2017, 53, 9–18. [Google Scholar] [CrossRef]
- Budget, Accounting and Statistics Office, Taichung City Government. Taichung City Region 2011–2015: Comparison of Marital Status Ratio among Males and Females. Taichung City Regional Income Differences; Budget, Accounting and Statistics Office, Taichung City Government: Taichung, Taiwan, 2016. Available online: http://www.dbas.taichung.gov.tw (accessed on 20 May 2018).
- Karanikola, P.; Panagopoulos, T.; Tampakis, S. Weekend visitors’ views and perceptions at an urban national forest park of Cyprus during summertime. J. Outdoor Recreat. Tour. 2017, 17, 112–121. [Google Scholar] [CrossRef]
- Sreethran, M. Exploring the urban use, preference and behaviors among the residents of Kuala Lumper: Malaysia. Urban For. Urban Green. 2017, 25, 85–93. [Google Scholar] [CrossRef]
Figure 1.
Taichung Greenways.


Figure 2.
Geographic location of the Calligraphy Greenway.

Figure 3.
Major squares and entrances of the Taichung Calligraphy Greenway.


Table 1.
The attributes that influence the preferences on selecting recreational areas and their levels.
Table 1.
The attributes that influence the preferences on selecting recreational areas and their levels.
| Attribute | Description | Level |
|---|---|---|
| Total recreational cost | Transportation, accommodation, entertainment, souvenirs and opportunity costs that are associated with traveling to a recreational area [5,13,20]. | 1. 16.35 USD or lower 2. 16.35 USD or higher, 32.69 USD or lower 3. 32.69 USD and above |
| Recreational service quality | Recreational service facilities include paths, rest tables and chairs, lighting, pavilions, bike racks and garbage cans [13,23]. | 1. High quality 2. Medium quality 3. Low quality |
| Recreational activity opportunities | Opportunities of providing the ways in which tourists participate in activities, including observational activities (including jazz music, street art performances and activities that audiences passively observe) and participation activities (including live interactive games and green experiences) [8,23]. | 1. Only observational activities are provided 2. Only participation activities are provided 3. Both observational and participation activities are provided |
| Environmental landscape resources | Flora, including tall trees, shrubs and sod, in which tree species are primarily large-leaf mahogany, blackboard trees, Bauhinia Japonica, Royal Poinciana, Madagascar Almond and the floss-silk tree [23,24]. | 1. Abundant 2. Few |
| Cultural landscape resources | Landscapes or facilities that are related to culture, including public art and information signs [23]. | 1. Abundant 2. Few |
Resource from: [20]; Conducted by this study.
Table 2.
Attribute levels of the 20 alternatives of visits to Calligraphy Greenway.
| Alternative | Total Recreational Cost (USD) | Recreational Service Quality | Recreational Activity Opportunities | Environmental Landscape Resources | Cultural Landscape Resources |
|---|---|---|---|---|---|
| 1 | ≥32.69 | Low | Participation activities only | Abundant | Abundant |
| 2 | 16.35–32.69 | Low | Observational activities only | Abundant | Few |
| 3 | ≤16.35 | Medium | Both participation and observational | Few | Abundant |
| 4 | 16.35–32.69 | High | Both participation and observational | Few | Abundant |
| 5 | ≤16.35 | Medium | Participation activities only | Abundant | Abundant |
| 6 | 16.35–32.69 | Low | Both participation and observational | Abundant | Abundant |
| 7 | ≥32.69 | Medium | Both participation and observational | Abundant | Few |
| 8 | ≥32.69 | Medium | Observational activities only | Abundant | Abundant |
| 9 | 16.35–32.69 | High | Participation activities only | Abundant | Abundant |
| 10 | ≤16.35 | Low | Observational activities only | Few | Abundant |
| 11 | 16.35–32.69 | Medium | Observational activities only | Abundant | Abundant |
| 12 | ≥32.69 | High | Observational activities only | Few | Few |
| 13 | ≤16.35 | High | Observational activities only | Abundant | Abundant |
| 14 | ≤16.35 | High | Both participation and observational | Abundant | Few |
| 15 | ≥32.69 | Low | Both participation and observational | Abundant | Abundant |
| 16 | 16.35–32.69 | Medium | Participation activities only | Few | Few |
| 17 | ≤16.35 | Low | Participation activities only | Abundant | Few |
| 18 | ≥32.69 | High | Participation activities only | Abundant | Abundant |
| 19 | 16.35–32.69 | High | Both participation and observational | Few | Few |
| 20 | ≤16.35 | Low | Both participation and observational | Abundant | Few |
Resource from: [20]; Conducted by this study.
Table 3.
Demographic statistics of the visitor sample in this study.
| Dimension | Variable | Quantity (People) | Percentage (%) |
|---|---|---|---|
| Gender | Male | 89 | 43.8 |
| Female | 114 | 56.2 | |
| Marital Status | Unmarried | 171 | 84.2 |
| Married | 32 | 15.8 | |
| Educational Level | Middle school | 2 | 1.0 |
| High school/vocational school | 23 | 11.4 | |
| University/trade school | 144 | 70.9 | |
| PhD | 34 | 16.7 | |
| Employment Status | Compulsory military service | 8 | 3.9 |
| Finance | 12 | 5.9 | |
| Trade/commerce | 7 | 3.4 | |
| Service Industry | 21 | 10.4 | |
| Agriculture (forestry, aquaculture, animal husbandry) | 2 | 1.0 | |
| Traditional manufacturing | 10 | 4.9 | |
| Electronics, tech, or information industry | 12 | 5.9 | |
| Research or educational institution | 3 | 1.5 | |
| Student | 89 | 43.8 | |
| Seeking employment | 11 | 5.4 | |
| Housekeeper | 4 | 2.0 | |
| Retired | 3 | 1.5 | |
| Self-employed | 17 | 8.4 | |
| Other | 4 | 2.0 | |
| Motivation | Exercise | 14 | 6.9 |
| Taking a walk | 137 | 67.5 | |
| Shopping | 9 | 4.4 | |
| Visiting | 19 | 9.4 | |
| Passing by | 21 | 10.3 | |
| Participating in a Calligraphy Greenway activity | 3 | 1.5 | |
| Residence | Nearby resident | 152 | 75.9 |
| Non-local (Taiwanese) | 48 | 23.6 | |
| Other countries | 1 | 0.5 |
Note: Conducted by this study.
Table 4.
Analysis of the descriptive statistics for basic visitor attributes.
| Variable | Average | Standard Deviation | Rank | |
|---|---|---|---|---|
| Age (year) | 27.08 | 9.84 | ||
| Annual income (326.93 USD) | 27.51 | 25.80 | ||
| Number of visits to the greenway over the past year | 9.15 | 7.44 | ||
| Time spent at the Calligraphy Greenway (hour) | 2.37 | 1.41 | ||
| Satisfaction | Recreational service quality | 3.71 | 80 | 3 |
| Recreational activity opportunities | 3.85 | 72 | 1 | |
| Environmental landscape resources | 3.83 | 75 | 2 | |
| Cultural landscape resources | 3.64 | 77 | 4 | |
| Overall satisfaction | 3.90 | 56 | ||
Note: Conducted by this study; ranks for the level of satisfaction with the Calligraphy Greenway: 1 (very unsatisfied), 2 (unsatisfied), 3 (no opinion), 4 (satisfied), 5 (very satisfied).
Table 5.
An overall statistical analysis of the Calligraphy Greenway.
| Alternative | Total Recreational Cost (USD) | Recreational Service Quality | Recreational Activity Opportunities (Participation, Observational) | Environmental Landscape Resources | Cultural Landscape Resources | Average | Rank |
|---|---|---|---|---|---|---|---|
| 1 | ≥32.69 | Low | Participation only | Abundant | Abundant | 56.80 | 19 |
| 2 | 16.35–32.69 | Low | Observational only | Abundant | Few | 56.06 | 20 |
| 3 | ≤16.35 | Medium | Both | Few | Abundant | 68.64 | 8 |
| 4 | 16.35–32.69 | High | Both | Few | Abundant | 71.85 | 5 |
| 5 | ≤16.35 | Medium | Participation only | Abundant | Abundant | 72.64 | 4 |
| 6 | 16.35–32.69 | Low | Both | Abundant | Abundant | 64.30 | 12 |
| 7 | ≥32.69 | Medium | Both | Abundant | Few | 64.79 | 11 |
| 8 | ≥32.69 | Medium | Observational only | Abundant | Abundant | 68.36 | 9 |
| 9 | 16.35–32.69 | High | Participation only | Abundant | Abundant | 86.79 | 1 |
| 10 | ≤16.35 | Low | Observational only | Few | Abundant | 62.68 | 15 |
| 11 | 16.35–32.69 | Medium | Observational only | Abundant | Abundant | 69.67 | 7 |
| 12 | ≥32.69 | High | Observational only | Few | Few | 58.91 | 18 |
| 13 | ≤16.35 | High | Observational only | Abundant | Abundant | 77.96 | 3 |
| 14 | ≤16.35 | High | Both | Abundant | Few | 78.57 | 2 |
| 15 | ≥32.69 | Low | Both | Abundant | Abundant | 62.68 | 16 |
| 16 | 16.35–32.69 | Medium | Participation only | Few | Few | 63.20 | 13 |
| 17 | ≤16.35 | Low | Participation only | Abundant | Few | 61.16 | 17 |
| 18 | ≥32.69 | High | Participation only | Abundant | Abundant | 70.76 | 6 |
| 19 | 16.35–32.69 | High | Both | Few | Few | 63.16 | 14 |
| 20 | ≤16.35 | Low | Both | Abundant | Few | 64.83 | 10 |
Note: Conducted by this study; evaluation scores range from 1–100.
Table 6.
Evaluation results for the Calligraphy Greenway using the rating method.
| Attribute | Preference Using the Rating Method (N = 203) | ||
|---|---|---|---|
| Coefficient | Attribute Utility Value | Attribute Relative Importance | |
| Total recreational cost | −0.007 | 22.55% | |
| ≥32.69 USD | −0.811 | ||
| 16.35–32.69 USD | −0.465 | ||
| ≤16.35 USD | 1.276 | ||
| Recreational service quality | 34.08% | ||
| High quality | 1.257 | ||
| Medium quality | 0.674 | ||
| Low quality | −1.931 | ||
| Recreational activity opportunities | 11.44% | ||
| Only participation activities | −0.325 | ||
| Only observational activities | −0.298 | ||
| Both participation and observational activities | 0.623 | ||
| Environmental landscape resources | 17.79% | ||
| Abundant | 0.676 | ||
| Few | −0.676 | ||
| Cultural landscape resources | 14.14% | ||
| Abundant | 0.537 | ||
| Few | −0.537 | ||
| Cox & Snell R2 | 0.123 | ||
| Nagelkerke R2 | 0.123 | ||
| McFadden R2 | 0.024 | ||
Table 7.
Comparison of the results for the preferences of male and female visitors to the Calligraphy Greenway.
Table 7.
Comparison of the results for the preferences of male and female visitors to the Calligraphy Greenway.
| Attribute | Female (N = 114) | Male (N = 89) | ||
|---|---|---|---|---|
| Attribute Utility Value | Relative Importanceof Attribute | Attribute Utility Value | Relative Importance of Attribute | |
| Total recreational cost | 22.66% | 22.81% | ||
| ≥32.69 USD | −0.798 | −0.838 | ||
| 16.35–32.69 USD | −0.548 | −0.366 | ||
| ≤16.35 USD | 1.346 | 1.204 | ||
| Recreational service quality | 34.01% | 34.17% | ||
| High quality | 1.256 | 1.267 | ||
| Medium quality | 0.758 | 0.576 | ||
| Low quality | −1.306 | −1.843 | ||
| Recreational activity opportunities | 11.45% | 11.43% | ||
| Participation activities only | −0.359 | −0.286 | ||
| Observational activities only | −0.279 | −0.322 | ||
| Both participation and observational activities | 0.683 | 0.608 | ||
| Environmental landscape resources | 17.77% | 18.17% | ||
| Abundant | 0.729 | 0.610 | ||
| Few | −0.729 | −0.610 | ||
| Cultural landscape resources | 14.11% | 14.14% | ||
| Abundant | 0.439 | 0.661 | ||
| Few | −0.439 | −0.661 | ||
| Cox & Snell R2 | 0.121 | 0.130 | ||
| Nagelkerke R2 | 0.122 | 0.131 | ||
| McFadden R2 | 0.023 | 0.026 | ||
| Pearson’s R | 0.606 *** (p ≤ 0.0001) | 0.026 *** (p ≤ 0.0001) | ||
Note: Conducted by this study; *** p < 0.001.
Table 8.
Comparison of the results for the preferences of local and non-local visitors to the Calligraphy Greenway.
Table 8.
Comparison of the results for the preferences of local and non-local visitors to the Calligraphy Greenway.
| Attribute | Locals (N = 153) | Non-locals (N = 50) | ||
|---|---|---|---|---|
| Attribute Utility Value | Relative Importance of Attribute | Attribute Utility Value | Relative Importance of Attribute | |
| Total recreational cost | 22.61% | 22.37% | ||
| ≥32.69 USD | −0.835 | −0.750 | ||
| 16.35–32.69 USD | −0.482 | −0.412 | ||
| ≤16.35 USD | 1.317 | 1.162 | ||
| Recreational service quality | 34.08% | 34.08% | ||
| High quality | 1.201 | 1.437 | ||
| Medium quality | 0.640 | 0.780 | ||
| Low quality | −1.841 | −2.217 | ||
| Recreation activity opportunities | 11.46% | 11.39% | ||
| Participation activities only | −0.346 | −0.277 | ||
| Observation activities only | −0.314 | −0.265 | ||
| Both participation and observation activities | 0.660 | 0.542 | ||
| Environmental landscape resources | 17.75% | 17.93% | ||
| Abundant | 0.609 | 0.885 | ||
| Few | −0.609 | −0.885 | ||
| Cultural landscape resources | 14.10% | 14.23% | ||
| Abundant | 0.532 | 0.562 | ||
| Few | −0.532 | −0.562 | ||
| Cox & Snell R2 | 0.117 | 0.146 | ||
| Nagelkerke R2 | 0.118 | 0.147 | ||
| McFadden R2 | 0.023 | 0.028 | ||
| Pearson’s R | 0.606 *** (p ≤ 0.001) | 0.726 *** (p ≤ 0.000) | ||
Note: Conducted by this study; *** p < 0.001.
Table 9.
Multilinear regression analysis of the data.
| Dimension | Number of Visits to the Calligraphy Greenway Over the Past Year | Time of Stay at the Calligraphy Greenway | Overall Satisfaction with the Calligraphy Greenway | |
|---|---|---|---|---|
| Constant | 13.190 * | 1.436 | 1.460 *** | |
| Gender | −0.437 | −0.391 | −0.062 | |
| Age | 0.186 ** | −0.012 | −0.002 | |
| Marital status | 0.413 | −0.317 | −0.110 | |
| Educational level | −3.547 *** | 0.183 * | −0.027 | |
| Annual income | 0.050 * | −0.003 | −6.185 × 10⁻⁵ | |
| Residence location | −3.123 *** | 0.086 | 0.077 | |
| Number of visits to the Calligraphy Greenway over the past year | − | 0.015 *** | 0.007 | |
| Length of visit to the Calligraphy Greenway | 1.313 *** | − | 0.023 | |
| Amount of money spent at the Calligraphy Greenway | 0.000 | 6.253 × 10⁻⁵ | −2.678 × 10⁻⁵ | |
| Satisfaction with the recreational attributes | Recreational service quality | −1.028 | 0.032 | 0.177 *** |
| Recreational activity opportunities | 1.217 | 0.072 | 0.095 * | |
| Environmental landscape resources | 0.688 | −0.319 * | 0.117 * | |
| Cultural landscape resources | −1.185 | −0.127 | 0.284 *** | |
| Overall satisfaction | 1.630 | 0.268 | − | |
| R2 | 0.336 | 0.178 | 0.555 | |
| Adjusted R2 | 0.336 | 0.112 | 0.519 | |
| Significance | 0.000 *** | 0.001 *** | 0.000 *** | |
| Durbin-Watson Test | 1.805 | 2.260 | 2.134 | |
Note: Conducted by this study; * p < 0.05, ** p < 0.01, *** p < 0.001.
Table 10.
Correlation analysis between variable pairs.
| Gender. | Age | Marital Status | Income | Residential Location | Number of Visits | Time of Stay | Total Costs | Service Quality | Activity Opportunities | Environmental Landscape | Cultural Landscape | Overall Satisfaction | |
|---|---|---|---|---|---|---|---|---|---|---|---|---|---|
| Gender | 1 | ||||||||||||
| Age | 0.175 * | 1 | |||||||||||
| Marital status | 0.054 | 0.629 *** | 1 | ||||||||||
| Income | 0.209 ** | 0.566 *** | 0.490 *** | 1 | |||||||||
| Residential location | 0.016 | 0.006 | −0.042 | 0.002 | 1 | ||||||||
| Number of visits | −0.029 | 0.332 *** | 0.260 *** | 0.268 *** | −0.302 *** | 1 | |||||||
| Length of stay | −0.177 * | −0.071 | −0.081 | −0.038 | −0.059 | 0.249 *** | 1 | ||||||
| Total costs | 0.067 | −0.053 | −0.023 | 0.035 | −0.012 | −0.077 | 0.023 | 1 | |||||
| Service quality | −0.052 | −0.065 | −0.012 | −0.089 | 0.069 | −0.004 | −0.024 | −0.063 | 1 | ||||
| Activity opportunities | −0.094 | −0.105 | 0.014 | 0.001 | −0.126 | 0.127 | 0.064 | −0.109 | 0.459 *** | 1 | |||
| Environmental landscape | 0.031 | −0.038 | 0.027 | −0.016 | −0.031 | 0.037 | −0.114 | 0.019 | 0.518 *** | 0.389 *** | 1 | ||
| Cultural landscape | 0.031 | −0.200 ** | −0.093 | −0.135 | −0.059 | −0.091 | −0.063 | −0.087 | 0.350 *** | 0.390 *** | 0.434 *** | 1 | |
| Overall satisfaction | −0.092 | −0.183 ** | −0.117 | −0.140 * | 0.007 | 0.056 | 0.059 | −0.137 | 0.544 *** | 0.475 *** | 0.496 *** | 0.599 *** | 1 |
Note: Conducted by this study; * p < 0.05, ** p <0.01, *** p < 0.001.
© 2018 by the authors. Licensee MDPI, Basel, Switzerland. This article is an open access article distributed under the terms and conditions of the Creative Commons Attribution (CC BY) license (http://creativecommons.org/licenses/by/4.0/).
Share and Cite
MDPI and ACS Style
Liu, W.-Y.; Chuang, C. Preferences of Tourists for the Service Quality of Taichung Calligraphy Greenway in Taiwan. Forests 2018, 9, 462. https://doi.org/10.3390/f9080462
AMA Style
Liu W-Y, Chuang C. Preferences of Tourists for the Service Quality of Taichung Calligraphy Greenway in Taiwan. Forests. 2018; 9(8):462. https://doi.org/10.3390/f9080462
Chicago/Turabian StyleLiu, Wan-Yu, and Ching Chuang. 2018. "Preferences of Tourists for the Service Quality of Taichung Calligraphy Greenway in Taiwan" Forests 9, no. 8: 462. https://doi.org/10.3390/f9080462
Note that from the first issue of 2016, this journal uses article numbers instead of page numbers. See further details here.