Thinning Treatments Reduce Deep Soil Carbon and Nitrogen Stocks in a Coastal Pacific Northwest Forest †


1
Department of Renewable Resources, University of Alberta, 442 Earth Sciences Building, Edmonton, AB T6G 2E3, Canada
2
School of Environmental and Forest Sciences, University of Washington, Box 352100, Seattle, WA 98195-2100, USA
*
Author to whom correspondence should be addressed.
†
This paper is included as a chapter of the Master Degree Thesis of the first author entitled Soil Carbon and Nitrogen Stocks: Underestimation with Common Sampling Methods, and Effects of Thinning and Fertilization Treatments in a Coastal Pacific Northwest Forest published by the University of Washington in 2017.
Forests 2018, 9(5), 238; https://doi.org/10.3390/f9050238
Submission received: 4 April 2018
/
Revised: 27 April 2018
/
Accepted: 28 April 2018
/
Published: 1 May 2018
(This article belongs to the Special Issue Carbon and Nitrogen in Forest Ecosystems—Series I)
Abstract
:Forests provide valuable ecosystem and societal services, including the sequestration of carbon (C) from the atmosphere. Management practices can impact both soil C and nitrogen (N) cycling. This study examines soil organic C (SOC) and N responses to thinning and fertilization treatments. Soil was sampled at an intensively managed Douglas-fir (Pseudotsuga menziesii (Mirb.) Franco) plantation in north-western Oregon, USA. Management regimes—thinning, fertilization plus thinning, and no (control) treatment—were randomly assigned to nine 0.2-ha plots established in 1989 in a juvenile stand. Prior to harvest, forest floor and soil bulk density and chemical analysis samples were collected by depth to 150 cm. During a single rotation of ~40 years, thinning treatments significantly reduced SOC and N stocks by 25% and 27%, respectively, compared to no treatment. Most of this loss occurred in deeper soil layers (below ~20 cm). Fertilization plus thinning treatments also reduced SOC and N stocks, but not significantly. Across all management regimes, deeper soil layers comprised the majority of SOC and N stocks. This study shows that: (1) accurately quantifying and comparing SOC and N stocks requires sampling deep soil; and (2) forest management can substantially impact both surface and deep SOC and N stocks on decadal timescales.

1. Introduction
The world’s forests are an important terrestrial carbon (C) sink, sequestering as much as 30% (~2 Pg C y−1) of annual global anthropogenic CO2 emissions between 1990 and 2007 [1,2]. In addition to their importance in the global C cycle, forests provide many other valuable ecosystem and societal services. Forest-management practices can enhance or reduce the ability of a given forest stand to act as a C sink and provide these services [3,4]. Since approximately two-thirds of forests are managed [1], understanding how forest-management practices affect the global C cycle and the capacity to sustainably produce natural resources is a high priority.
While much research has been conducted regarding the aboveground effects of forest management, comparably little is known about the effects belowground [5]. Soils comprise the majority of the terrestrial C stock [6] and account for ~85%, 60%, and 50% of the total C stock in boreal forest, temperate forest, and tropical rainforest ecosystems, respectively [3,7]. Therefore, determining the fate of forest soil organic C (SOC) in response to management is an essential part of understanding climate-carbon feedbacks and changes in forest ecosystem C budgets. Gains or losses in SOC affect numerous soil properties essential to maintaining beneficial ecosystem services and productive forest stands, including the water- and nutrient-holding capacity of the soil [8].
In Pacific Northwest forest ecosystems, nitrogen (N) is often the primary limiting nutrient [9,10,11]. The fate of soil N in response to forest management is thus a key concern in this region. In general, N fertilization stimulates biomass production, but the effects on SOC and other soil-nutrient dynamics are variable and highly site dependent due to complex interactions between soil properties, microorganisms and vegetation [12]. Increases in soil N have the potential to enhance aboveground biomass growth and forest productivity, as well as to increase SOC and the retention of other nutrients in the soil through a combination of increased belowground biomass and delayed root decomposition [13].
In a recent meta-analysis, James and Harrison [14] found that harvesting reduced soil C by an average of ~11% globally. Significant losses in both the litter layer (O horizon) and the mineral soil were observed, with particularly large losses in very deep soil (60–100+ cm in depth) compared to more superficial soil. Interestingly, thinning treatments resulted in greater losses of mineral soil C than clear-cut harvesting by a difference of ~9% [14]. Although this may seem counterintuitive, thinning treatments can lead to less SOC accumulation over time due to reduced root C inputs (from reduced root biomass) [15], and they can also affect numerous soil properties that enhance microbial metabolic activity or encourage increased leaching and export of SOC and other soil nutrients. Mechanisms that can lead to SOC and N losses due to thinning include: (1) increased soil temperature; (2) microbial stimulation or priming; (3) nitrate leaching; and (4) groundwater-level rise.
1.1. Increased Soil Temperature
Decreased radiation interception by trees due to thinning treatments can result in soil temperature increases [16]. Several studies examining the upper 10 cm of soil have shown post-thinning increases in soil temperature ranging from 1–6 °C when compared to reference stands [16,17,18]. Soil temperature also tends to increase with thinning intensity [16,17]. Along with increases in soil temperature, Cheng et al. [17] measured an increase in soil respiration ranging from ~8% to 20% and increasing with thinning intensity. Hicks Pries et al. [19] found that mineral soil respiration in a temperate forest ecosystem increased by 34–37% to a depth of 100 cm when subjected to 4 °C warming, with soil below 15 cm contributing to ~50% of the total respiration. Forest harvest has been observed to increase mean soil temperature and mean daily soil temperature flux by ~3 °C and 5 °C, respectively, at 10 cm in depth and by ~2 °C and 3 °C, respectively, at 100 cm in depth [20]. Any increase in SOC decomposition rates also increases microbial demand for N, as microorganisms require about a 24:1 C:N ratio during organic matter decomposition [21]. Competition for available N in the soil environment is increased in particular during the decomposition of organic matter with a higher C:N ratio, such as coarse woody debris left as slash on the forest floor post-thinning, and can lead to N scavenging as plants and microorganisms compete for this essential nutrient [21,22].
1.2. Microbial Priming
Microbial priming is a mechanism by which potential energetic barriers to SOC decomposition are alleviated by the introduction of fresh C compounds [23]. Similarly, higher rates of nitrification and additional nitrate can result in increased SOC decomposition and dissolved organic carbon (DOC) production by alleviating microbial nutrient limitations [24,25]. The priming phenomenon is particularly relevant in deeper soil layers where SOC is often thousands to tens of thousands of years old [23,26]. When the environmental conditions under which deep SOC accumulated change, such as through the addition of fresh C compounds, this SOC is vulnerable to decomposition [19,23,26,27,28]. Removing trees results in decreased transpiration and rain interception, and in turn can lead to increased DOC flux and transport to deeper soil layers, which is driven largely by rain events and new inputs of organic matter [29,30]. Organic matter left on-site post-thinning (e.g., roots and slash) substantially increases soil C inputs and the potential for priming effects. While forest floor fresh C inputs are often mineralized in the litter layer [26,30], C inputs due to the mineralization of root biomass can persist for many years following the harvest of trees [31]. Post-thinning increases in channels of decaying roots, particularly coarse roots, could also create preferential flow paths for DOC transport. Along these pathways, DOC has fewer opportunities for abiotic and biotic interactions, potentially introducing large amounts of fresh DOC to deeper soil layers [32]. As preferential pathways have been shown to have greater SOC concentrations and microbial biomass than the surrounding bulk soil [33], mineralization rates in these pathways are likely enhanced [34], which may lead to increased SOC and N losses from the adjacent bulk soil.
1.3. Nitrate Leaching
Several studies have observed increased leaching or export of nitrate (and other forms of N) following forest harvest under logging residues [35,36,37,38,39]. Rosen and Lundmark-Thelin [39] attributed this phenomenon to a combination of reduced N uptake by roots and increased mineralization of the litter layer. Fertilized forest stands may be particularly vulnerable to nitrate leaching under slash left on the forest floor post-thinning due to increased N availability. High rates of nitrification, nitrate leaching, and increased soil acidity due to fertilization can negatively affect soil quality through the priming of SOC and through the co-leaching of other nutrients such as calcium and magnesium [40].
1.4. Groundwater-Level Rise
The removal of trees via thinning treatments or harvest reduces transpiration, which can result in groundwater-level rise and potential increases in the export of DOC and various forms of N [37,41]. Laudon et al. [41] observed a >70% increase in DOC export from harvested compared to unharvested sites one year post-harvest. They attributed this increase in DOC export primarily to a raised groundwater level contacting more superficial soil layers that have higher DOC (and N) concentrations. Depending on the original height of the water table prior to the removal of trees, substantial portions of deeper SOC and N could be especially vulnerable to export and loss via this mechanism.
1.5. Summary and Objectives
Jandl et al. [12] concluded that, in general, forest thinning increases the stability of a stand at the expense of SOC stocks. However, other studies have found no difference in SOC stocks post-thinning [5]. In a long-term reforestation study in the subtropical south-eastern USA. Mobley et al. [42] found that thinning treatments reduced SOC and N stocks in particular in deeper soil layers where losses exceeded new inputs. Although deeper soil is often ignored in short- and even long-term studies, the observation of deep SOC losses on decadal timescales due to management or land-use change is not uncommon [42,43,44]. Considering that most SOC is contained in deeper soil layers (below ~20 cm) [6,45,46], and most trees root deeper than 100 cm [47], studying deep-soil nutrient dynamics is essential to understanding forest-management effects on SOC stocks. Unfortunately, soils are often sampled to 20 cm or less and are rarely sampled below 100 cm [4,6,14,27,42,45,48].
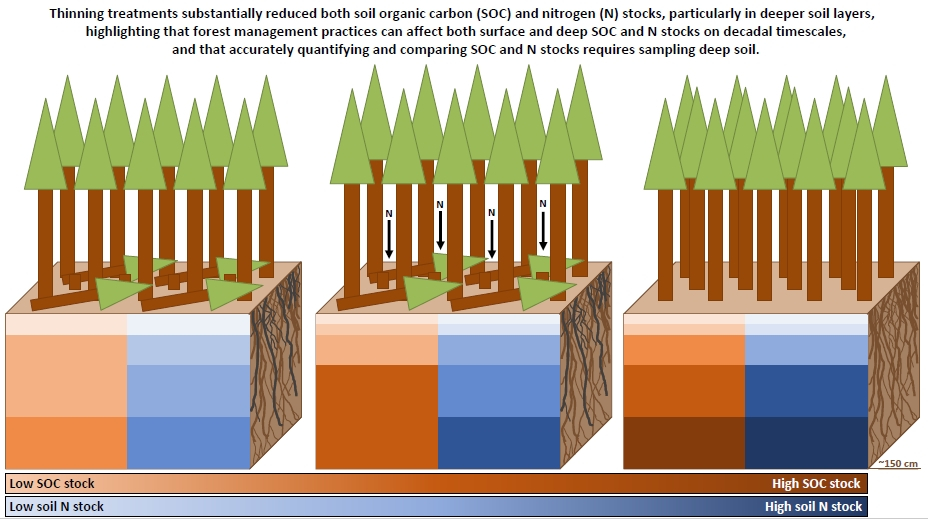
The objective of this study was to determine the responses of SOC and N to thinning and fertilization plus thinning treatments of varying intensity, and to understand how any observed response differed vertically in the soil profile to a depth of more than 100 cm. Both the fixed-depth and mass-based approaches were used to quantify and compare SOC and N stocks. We found that thinning treatments substantially reduced both SOC and N stocks, particularly in deeper soil layers, highlighting that forest-management practices can affect both surface and deep SOC and N stocks on decadal timescales, and that accurately quantifying and comparing SOC and N stocks requires sampling deep soil.
2. Materials and Methods
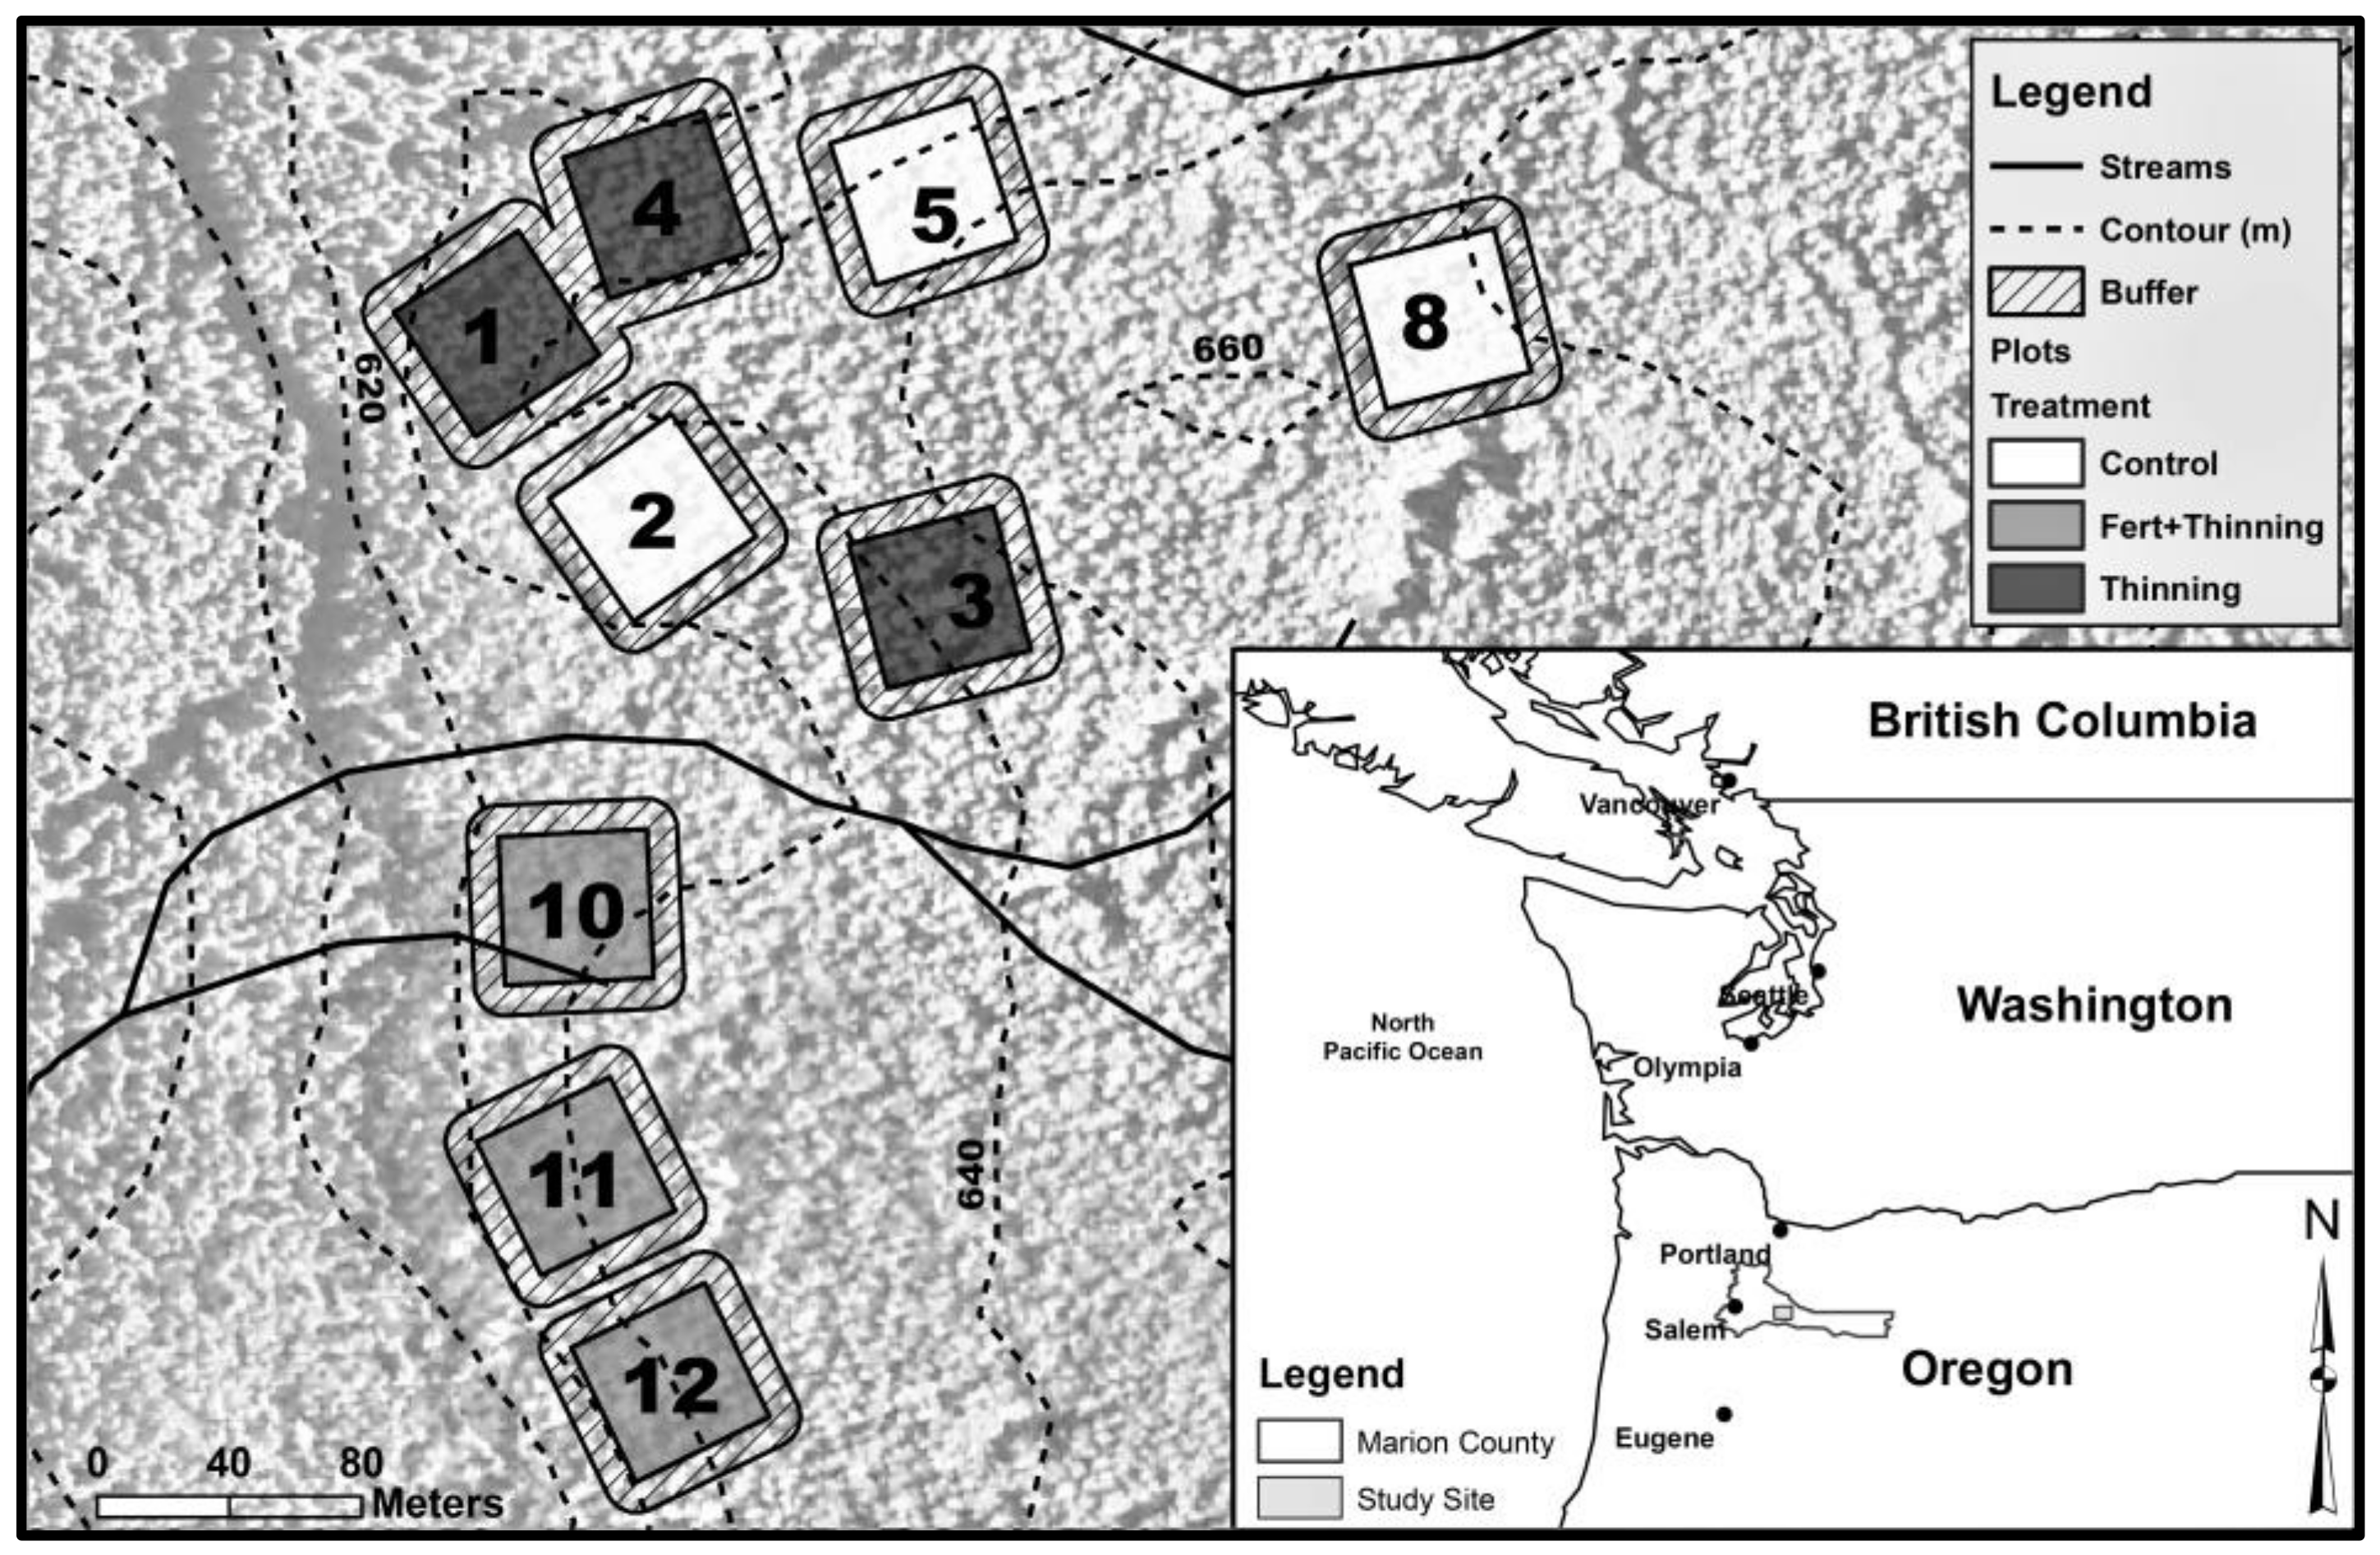
Soil was sampled at an intensively managed Douglas-fir (Pseudotsuga menziesii (Mirb.) Franco) plantation in north-western Oregon, USA (Figure 1, inset). The plantation was planted on commercial forest land in 1977 with 2-year-old Douglas-fir seedlings and was ≥90% Douglas-fir throughout the ~40-year rotation. The previous plantation, also Douglas-fir, underwent uniform treatment and harvest. Square plots were established in 1989, the boundaries of which were designed to maximize uniformity within and between plots. Management regimes—thinning (Ttrt), fertilization plus thinning (FTtrt), and no (control) treatment (Ctrt)—were randomly assigned to nine 0.2-ha plots spanning a total area of ~5 ha (Figure 1). Three plots received thinning treatments; three plots received fertilization plus thinning treatments of varying intensity; and three plots received no (control) treatment. Additionally, the initial trees per hectare were systematically reduced to one-half or one-fourth on randomly assigned plots (Table 1). The removed trees were left on the forest floor. Fertilized plots received 224 kg N ha−1 as urea every 4 years starting in 1989 for a total of 1120 kg N ha−1 over 16 years. Thinning treatments were based on Curtis’ [49] relative stand density. The stems of thinned trees were either removed or left on the forest floor, depending on the size of the trees at the time of treatment. Slash from trees was consistently left on the forest floor, even when stems were removed. Landform across all plots was nearly level to gently sloping, with an average slope of 10% and a maximum slope of <30%. The climate is characterized by cool, wet winters and warm, dry summers. Mean annual precipitation from 1981 to 2010 was ~220 cm, and mean annual temperature was 9 °C, with an annual maximum and minimum temperature of 14 °C and 4 °C, respectively [50]. Elevation ranged from 620 m to 660 m above sea level. Soil was moderately well drained with a low mean rock fragment content by sample weight (<2% fine to medium gravel). The soil sampled was an older, clayey soil (a Palehumult, closely resembling the Cumley series), making it reasonably uniform and an ideal soil for sampling to compare forest-management treatments.
Three soil pits per plot were excavated with a shovel to 100 cm or 150 cm. Major genetic horizons, soil colors, textures and structures were identified, and roots and stone content were recorded (Table 2). Soil bulk density and chemical analysis samples were collected in the late summer and early fall of 2015, immediately preceding harvest. Soil was collected from all nine plots over (three) two-week time periods to minimize any differences in weather conditions between plots during the sampling timeframe. Samples were collected randomly from within the middle of soil depth layers 0–10, 10–20, 20–50, 50–100, and 100–150 cm. One forest floor sample was collected from a randomly placed 20 × 30 cm quadrat nearby each soil pit. All soil samples were analyzed separately, and repeated measurements within a plot and soil depth layer were subsequently averaged to account for within-plot variation. Soil bulk density and chemical analysis samples were collected using a 5.4-cm diameter hammer-core, as well as using clod and excavation (irregular hole, water replacement) methods. Repeated measurements within the same plot and soil depth layer across methods were analyzed separately to adjust for differences between the methods using regression (wherein the excavation method was used as the standard). A detailed description of soil-sampling techniques, laboratory methods, and regression equations is found in Gross and Harrison [51]. All soil samples collected in the field were sealed in plastic bags, returned to the laboratory within 48 h, and stored at 3 °C until analysis.
Soil subsamples used in elemental analysis were taken from bulk density samples to avoid potential biases, as SOC concentrations and bulk density are not independent variables [52]. Air-dried samples were sieved to <4.75 mm (rather than to <2 mm) to avoid discarding a meaningful portion of SOC [53,54]. The >4.75 mm fraction was weighed and the volume determined by displacement of water in a graduated cylinder. Litter layer samples were weighed, air-dried to a constant weight, reweighed, and ground to less than ~0.5 mm. Representative subsamples of litter layer and <4.75 mm mineral soil fractions were ground with a mortar and pestle and analyzed for total C and N concentrations (g kg−1) using an automated elemental analyzer (Perkin-Elmer 2400, PerkinElmer, Waltham, MA, USA). Approximately 20% of the samples were run twice to verify the precision of the analysis, and quality control samples of known C concentration were run every 10 samples. The average of samples run twice was used for analysis. Due to a lack of carbonates measured in the region [55] and strongly acid soils (pH < 6), total C concentrations are equated to organic C [56].
Soil pH was measured in a 1:1 (deionized H2O, mL; soil, g) mix for mineral soil and a 4:1 mix for the litter layer with a digital pH meter (Model PC-700, Oakton Inst., Vernon Hills, IL, USA). Soil mixtures were stirred and left to stand undisturbed for at least 30 min to allow homogenization before pH was measured. The volume of field-moist clods [57] was determined by the paraffin wax method and displacement of water. Oven-dry weights for the clod method were determined by drying the clods in the oven at 105 °C for at least 48 h. Subsamples of each core and excavation sample were dried for at least 48 h at 105 °C, and oven-dry weights were determined by applying conversions to the air-dried weights. Bulk density was calculated according to:
Soil organic C and N stocks were determined using the fixed-depth equations:
and,
where mg SOC g soil−1 is SOC concentration, mg N g soil−1 is N concentration, g soil cm soil−3 is bulk density, and cm is soil layer thickness. The mass-based approach according to the procedure of Wendt and Hauser [58] was also used to estimate SOC and N stocks. For this approach, soil-sample mass for each depth layer (MSAMPLE(DL), g) and method was calculated according to:
where 5.4 cm is the inside diameter of the core. Soil-sample masses, SOC and N concentrations, the inside diameter of the core, and the number of cores per sample were subsequently input into the web-accessible spreadsheet [59] created by Wendt and Hauser [58], which fits a cubic spline function to model the relationship between cumulative areal soil mass and cumulative SOC mass. Reference mass layers were set using the lowest mean soil mass across treatments for each soil depth layer as recommended by Lee et al. [60] for systems in which the initial conditions (e.g., SOC or bulk density) are not available.
In this study, both the fixed-depth and mass-based approaches used to calculate SOC and N stocks replace the volume of the >4.75 mm fraction with fine soil (<4.75 mm). Multiple studies have found that this method has the potential to overestimate [61] or underestimate [27,54,62,63,64] SOC and N stocks. However, these errors appear to be limited to rocky soils [54,61,62,64]. Because the soil sampled in the current study was generally non-rocky (<2% fine to medium gravel content by weight), this method is unlikely to cause substantial biases in SOC and N stock estimates.
Sampling in the middle of a soil depth layer likely underestimates SOC and N concentrations and overestimates the bulk density of soil above the sample, while resulting in errors in the opposite direction concerning soil below the sample (i.e., overestimating SOC and N concentrations and underestimating bulk density). An assumption of this sampling method is that the errors tend to have a canceling effect, giving an accurate estimate of SOC and N stocks in the given layer. This assumption applies to all calculations of mineral SOC and N stocks in this study. As the entire depth of the litter layer was sampled, this assumption does not apply to the litter layer. Additionally, litter layer SOC and N stocks were only determined using Equations (2) and (3).
Total aboveground and root C sequestration were determined using the biomass ratio equation and parameters provided by Table 6 in Jenkins et al. [65]. For a given plot, the quadratic mean diameter (QMD) was substituted for diameter at breast height (DBH). Total aboveground biomass (TAB) for each plot was calculated according to:
where 450 kg m−3 is the density of Douglas-fir [66], and the denominator is the biomass ratio equation for softwood-stem wood. The sum of the removed and final aboveground biomass was used for TAB for thinned plots to represent total aboveground and root C sequestration. A ratio of 0.512, which is the average C concentration (g C g−1) for Douglas-fir trees in the Pacific Coast and Rocky Mountain regions [67], was used to convert total mass to C mass. Belowground C stocks were determined by summing the SOC stock (calculated using the mass-based approach) for a given plot with total root C for the same plot. Total C stocks were determined by summing the above- and belowground C stocks for a given plot. Merchantable volume for thinned plots was calculated by including removed volume only if the given volume was commercially thinned.
Analysis of variance (ANOVA) was used to determine whether treatment affected various soil properties and SOC and N stocks. When significant differences were detected at p < 0.1, Tukey’s honest significant difference (HSD) post-hoc tests were conducted to compare the means. A significance level of 0.1 was chosen (rather than 0.05, for example) to reduce the chance of false negatives [68], as forest-management effects on soil properties or nutrient stocks can have lasting impacts on soil health and future productivity. Relationships between numerical variables such as SOC and N concentrations were determined using linear regression. Data met the assumptions of the analyses performed and no data transformations were necessary. Data were analyzed using R studio [69].
3. Results
3.1. Soil Bulk Density and Organic Carbon Concentrations
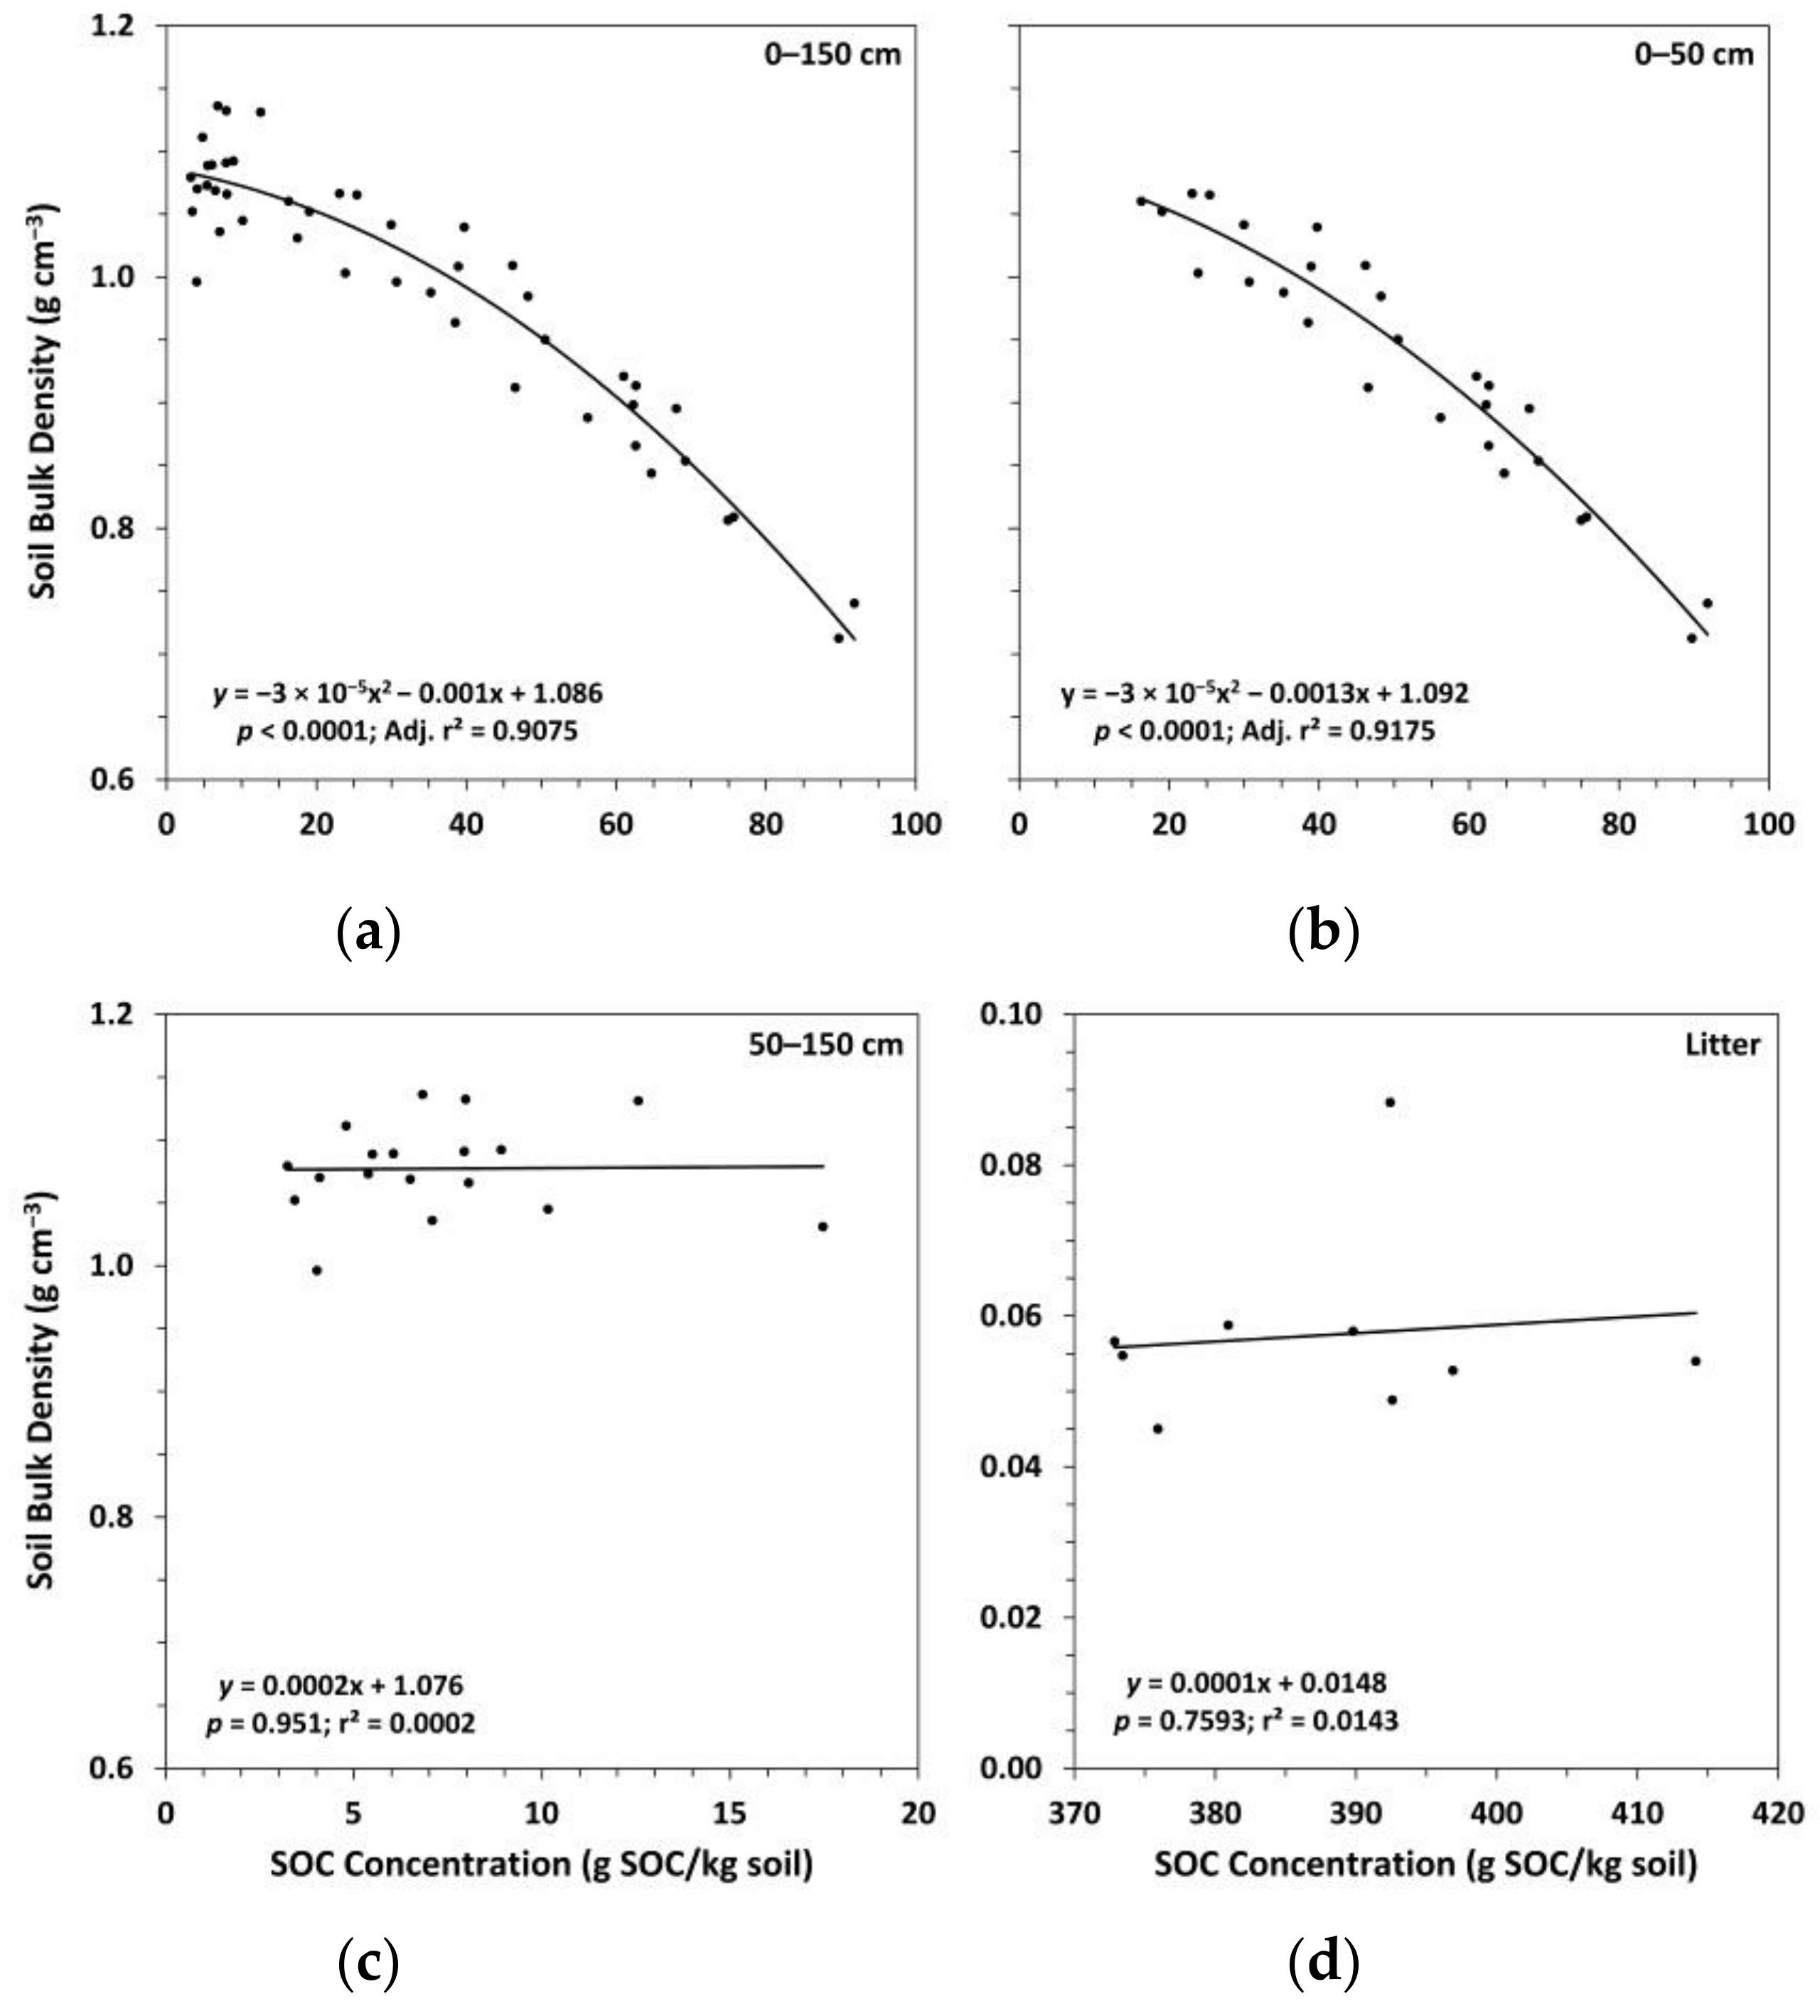
In the mineral soil layers, bulk density was consistently highest for Ttrt at all depths and lowest for Ctrt to a depth of 100 cm (Figure 2). In the upper 50 cm, this pattern was inversely related to SOC concentrations, with Ctrt having the highest SOC concentrations and Ttrt having the lowest (Figure 2). Soil organic C concentration was a significant (p < 0.1) predictor of bulk density in the mineral soil, the two variables following a quadratic relationship (Figure 3). However, a large amount of variation occurred where SOC concentrations were below ~15 g SOC/kg soil, which corresponded to depths below 50 cm. When the relationship between SOC concentration and bulk density was analyzed by depths 0–50 cm and 50–150 cm, the former explained slightly more of the variation in bulk density values than the whole mineral soil (i.e., 0–150 cm in depth), while the latter was not significant (Figure 3). Soil organic C concentration and bulk density were not significantly related in the litter layer (Figure 3). Bulk density for Ttrt was significantly (Tukey’s HSD, α = 0.1) higher than Ctrt in the upper 20 cm of mineral soil and significantly higher than FTtrt in the 10–20 cm depth layer. Ctrt had a significantly higher SOC concentration compared to both Ttrt and FTtrt in the upper 20 cm of mineral soil, as well as in the 100–150 cm depth layer compared to FTtrt. No significant differences between treatment means were observed for bulk density or SOC concentration in the litter layer.
3.2. Soil Nitrogen Concentrations, Carbon to Nitrogen Ratios, and pH
Trends in soil N concentrations between treatments in the mineral soil followed a similar pattern as for SOC concentrations, although a few additional means were found to be significantly different (Figure 4). Ctrt had a significantly higher soil N concentration compared to Ttrt at all depths except the 50–100 cm depth layer. FTtrt also had a significantly higher soil N concentration compared to Ttrt in the 0–10 cm depth layer. Compared to FTtrt, Ctrt had a significantly higher soil N concentration in the upper 20 cm of mineral soil and in the 100–150 cm depth layer. Notably, in the litter layer, Ttrt had a significantly lower soil N concentration compared to the other two treatments. No significant differences in the C:N ratio (SOC concentration/N concentration) in the mineral soil were observed (Figure 4). In the litter layer, Ttrt had a significantly higher C:N ratio compared to Ctrt and FTtrt (39, 32, and 33, respectively). Surface soil layers (0–20 cm in depth) had a mean C:N ratio of ~24 across all treatments, while deeper soil layers had normalized mean C:N ratios of 18, 19, and 17 for Ttrt, FTtrt, and Ctrt, respectively. Soil organic C concentration was a significant predictor of N concentration in the mineral soil, the two variables being positively related, and explained much of the variation in N concentration (r2 = 0.9886) (Figure 5). These two variables were not significantly related in the litter layer (Figure 5).
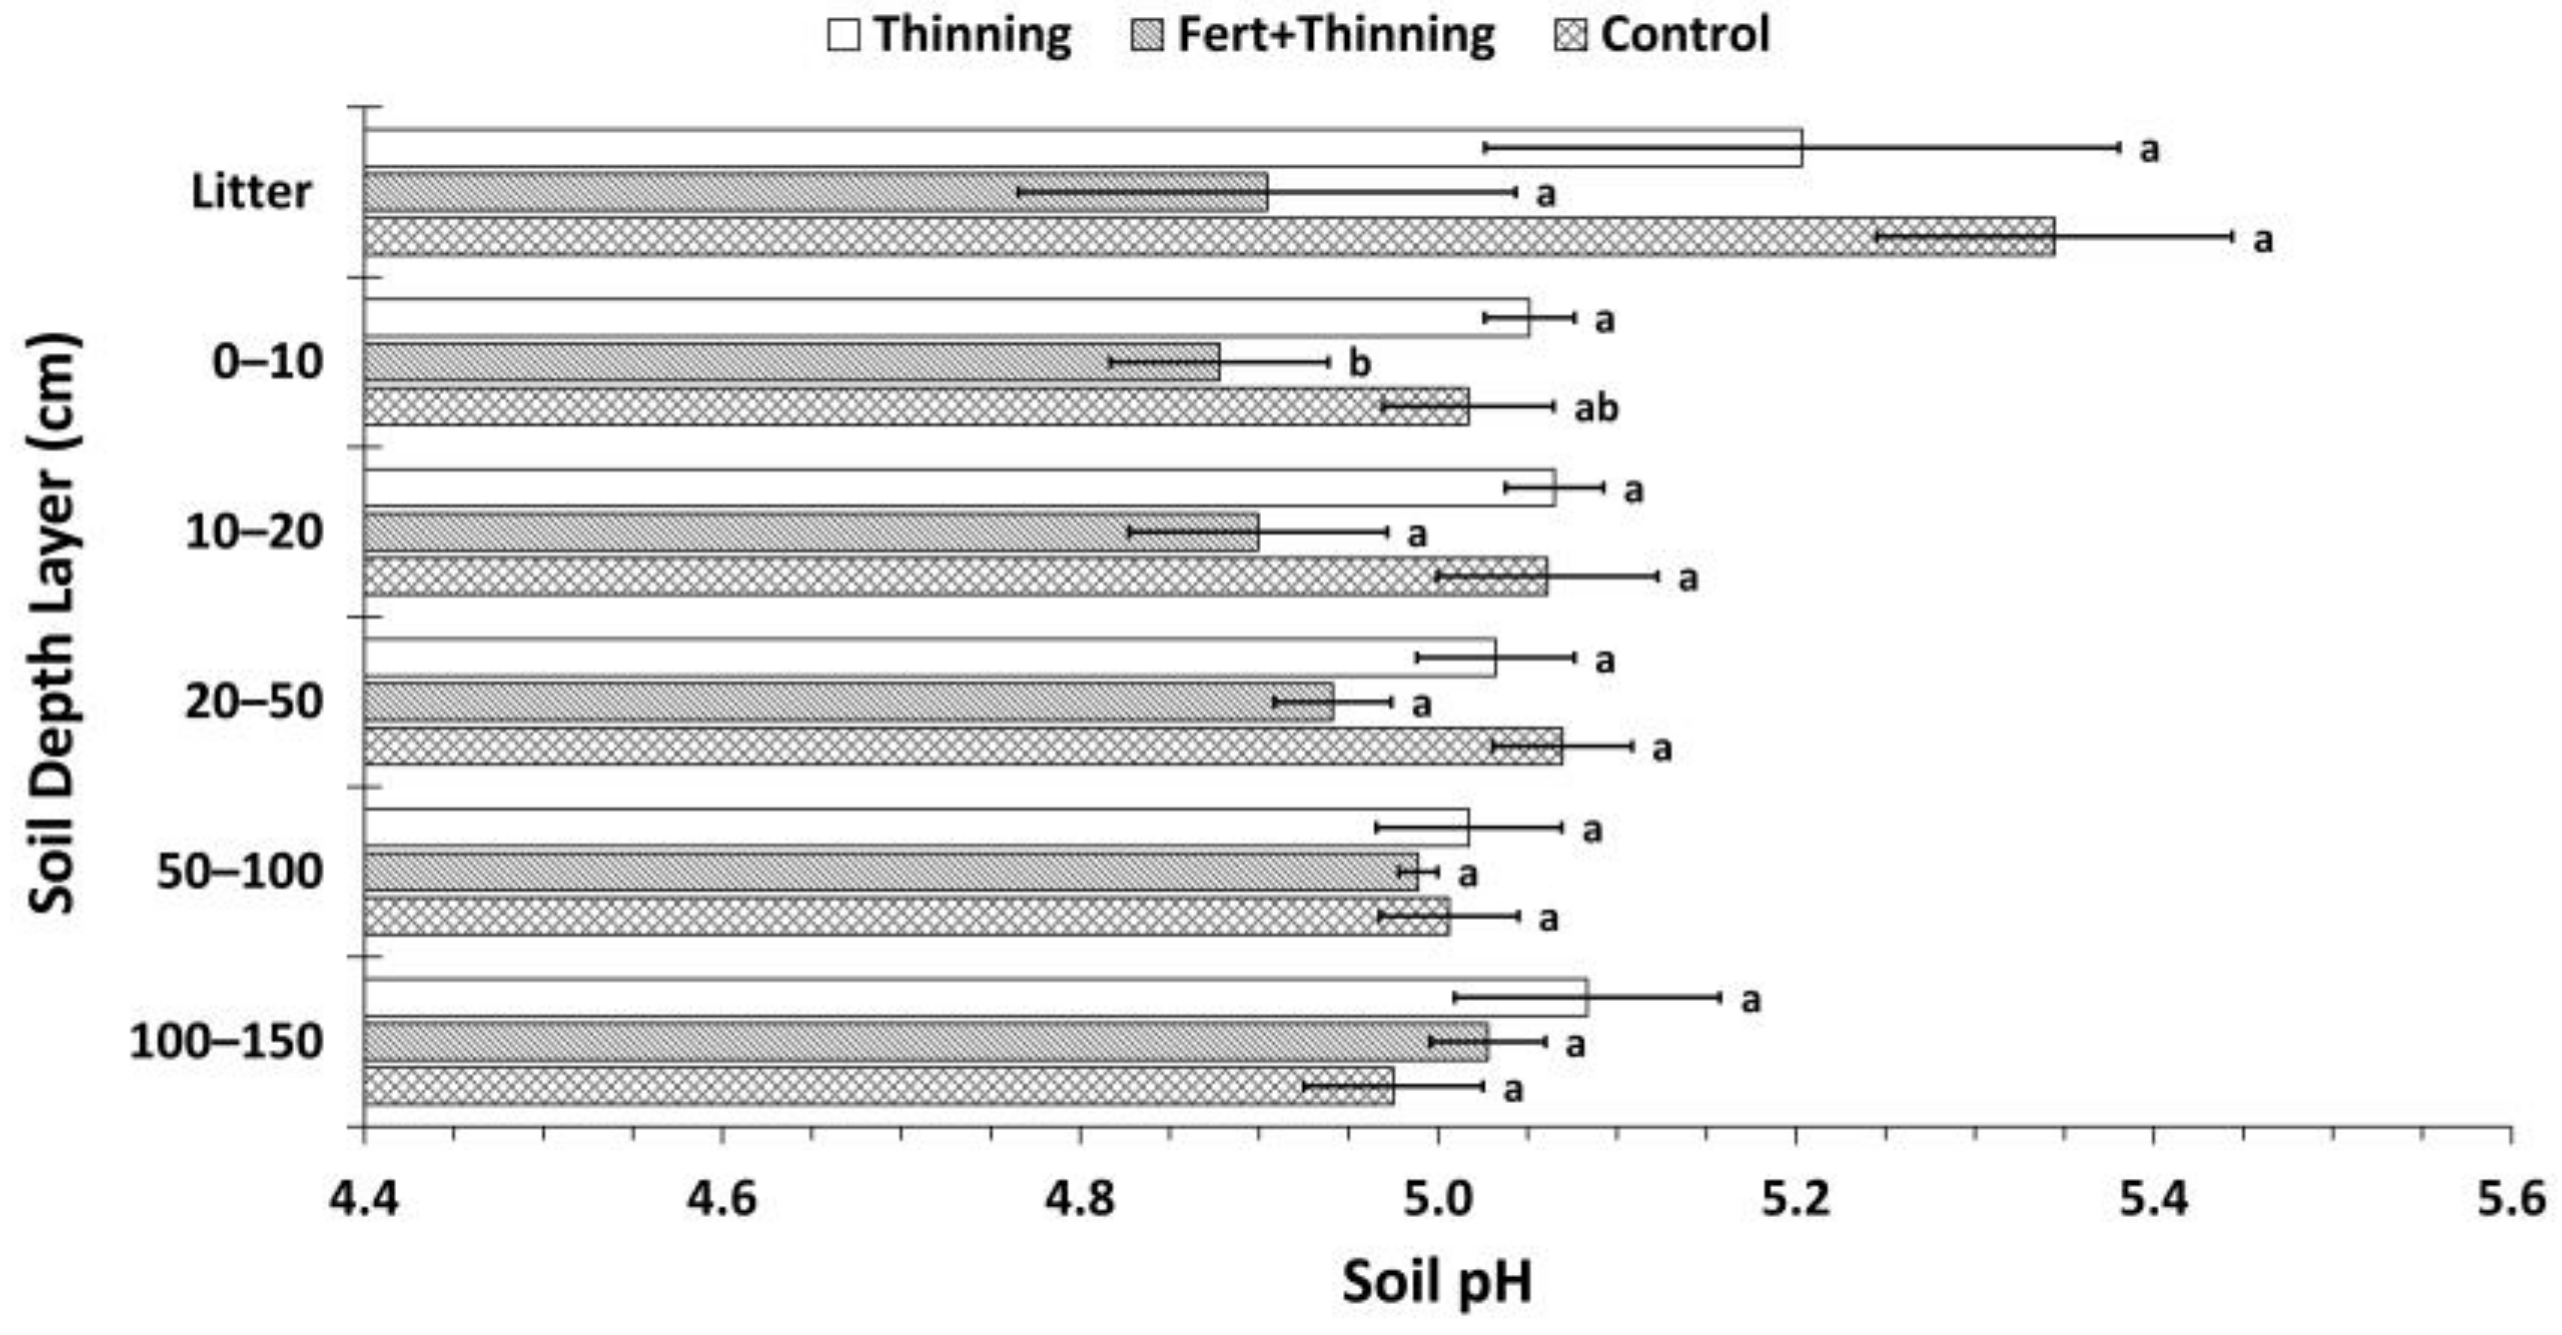
Soil was strongly acid across all treatments. Normalized by depth, mean soil pH values for the mineral soil for Ttrt, FTtrt, and Ctrt were 5.05, 4.98, and 5.01, respectively. In the litter layer and upper 100 cm of mineral soil, FTtrt had consistently lower pH values than the other two treatments (Figure 6). However, this difference was significant only in the 0–10 cm depth layer between FTtrt and Ttrt.
3.3. Soil Organic Carbon and Nitrogen Stocks
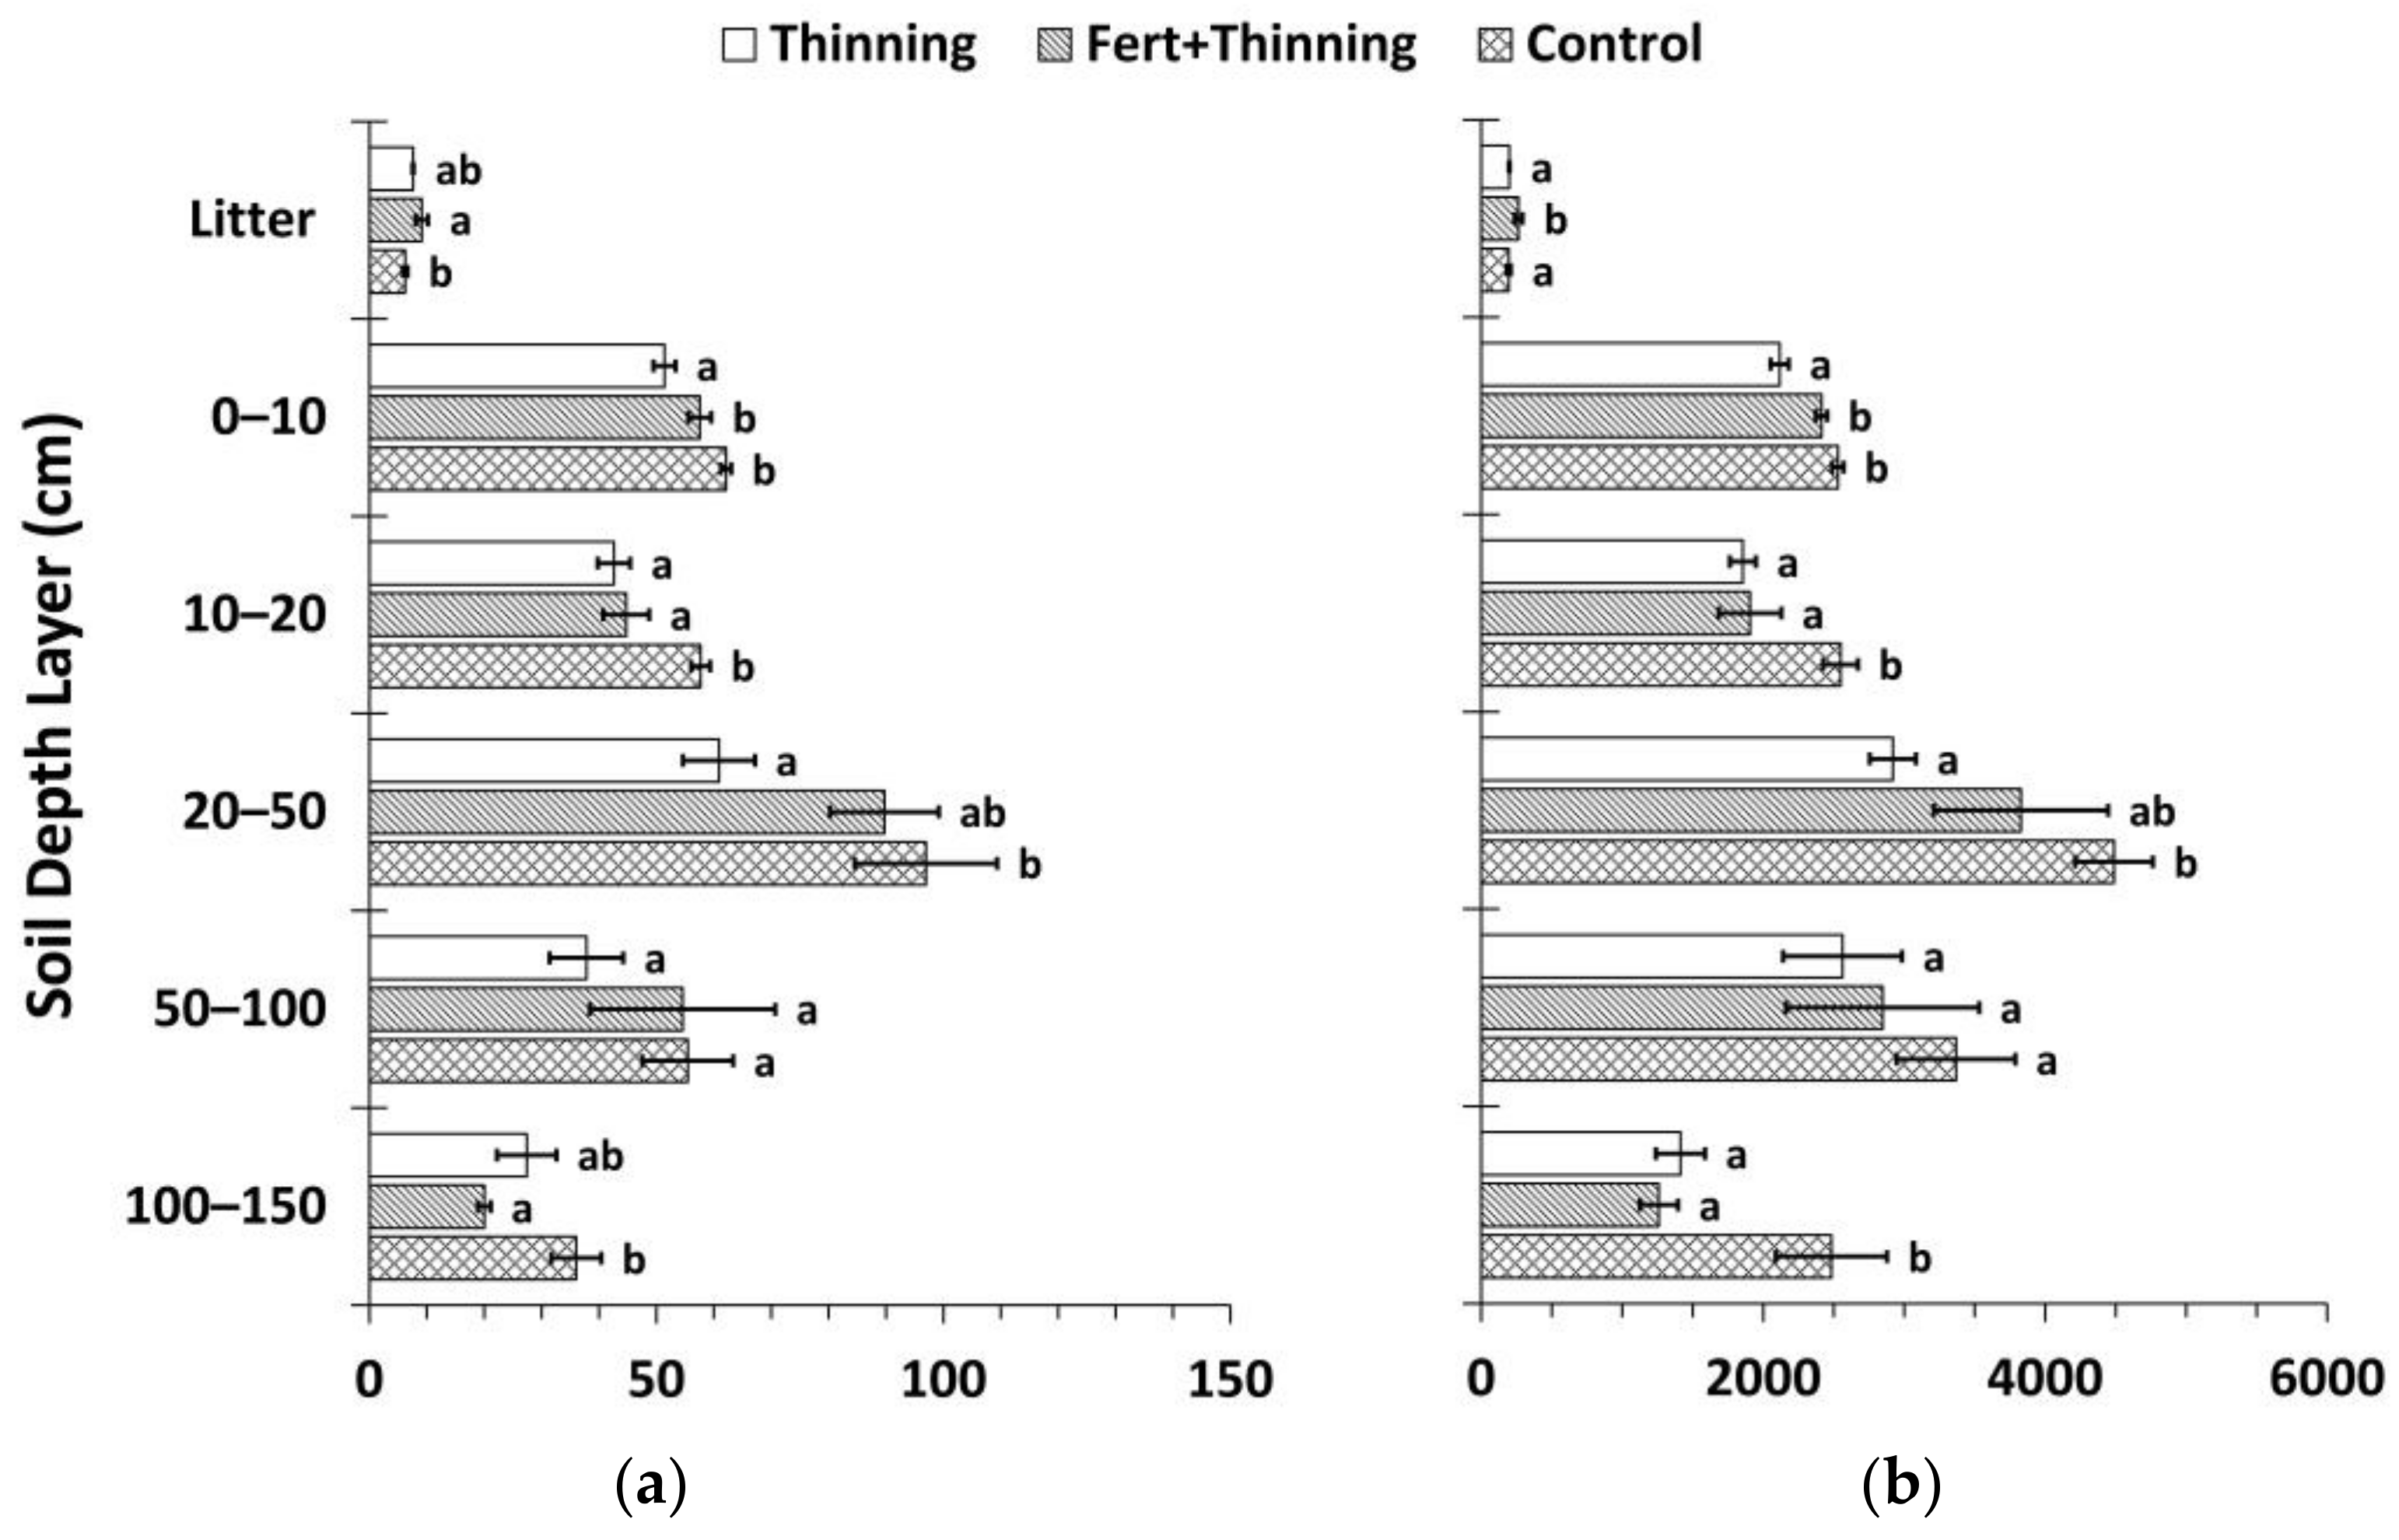
Calculated using the fixed-depth approach, SOC and N stocks in the mineral soil were consistently highest for Ctrt at all depths (Figure 7). Compared to Ttrt, these differences were significant above 50 cm for SOC stocks and at all depths except the 50–100 cm soil depth layer for soil N stocks. These differences were significant in the 10–20 and 100–150 cm soil depth layers for both SOC and N stocks compared to FTtrt. Across all treatments, the majority of SOC and N stocks were below 20 cm (≥55% and >60%, respectively) to a depth of 150 cm. FTtrt had a significantly greater litter layer mean SOC stock compared to Ctrt and a significantly greater litter layer mean N stock compared to both Ctrt and Ttrt. Mean litter layer thickness was similar for FTtrt and Ttrt (4.0 ± 0.3 and 3.8 ± 0.1 cm, respectively) and was considerably (though not significantly) thicker for these two treatments than for Ctrt (3.1 ± 0.6 cm). Cumulative SOC stocks were significantly less at all depths below the litter layer for Ttrt compared to Ctrt, with a difference of 28% to a depth of 150 cm (Figure 7). The portion of this difference that occurred below 20 cm was 72%. FTtrt SOC stock to 150 cm in depth approximated the average of the other two treatments and was not significantly different from either. Cumulative N stocks followed similar trends (Figure 7). Ttrt had 29% less soil N than Ctrt to a depth of 150 cm, with 76% of this difference occurring below 20 cm.
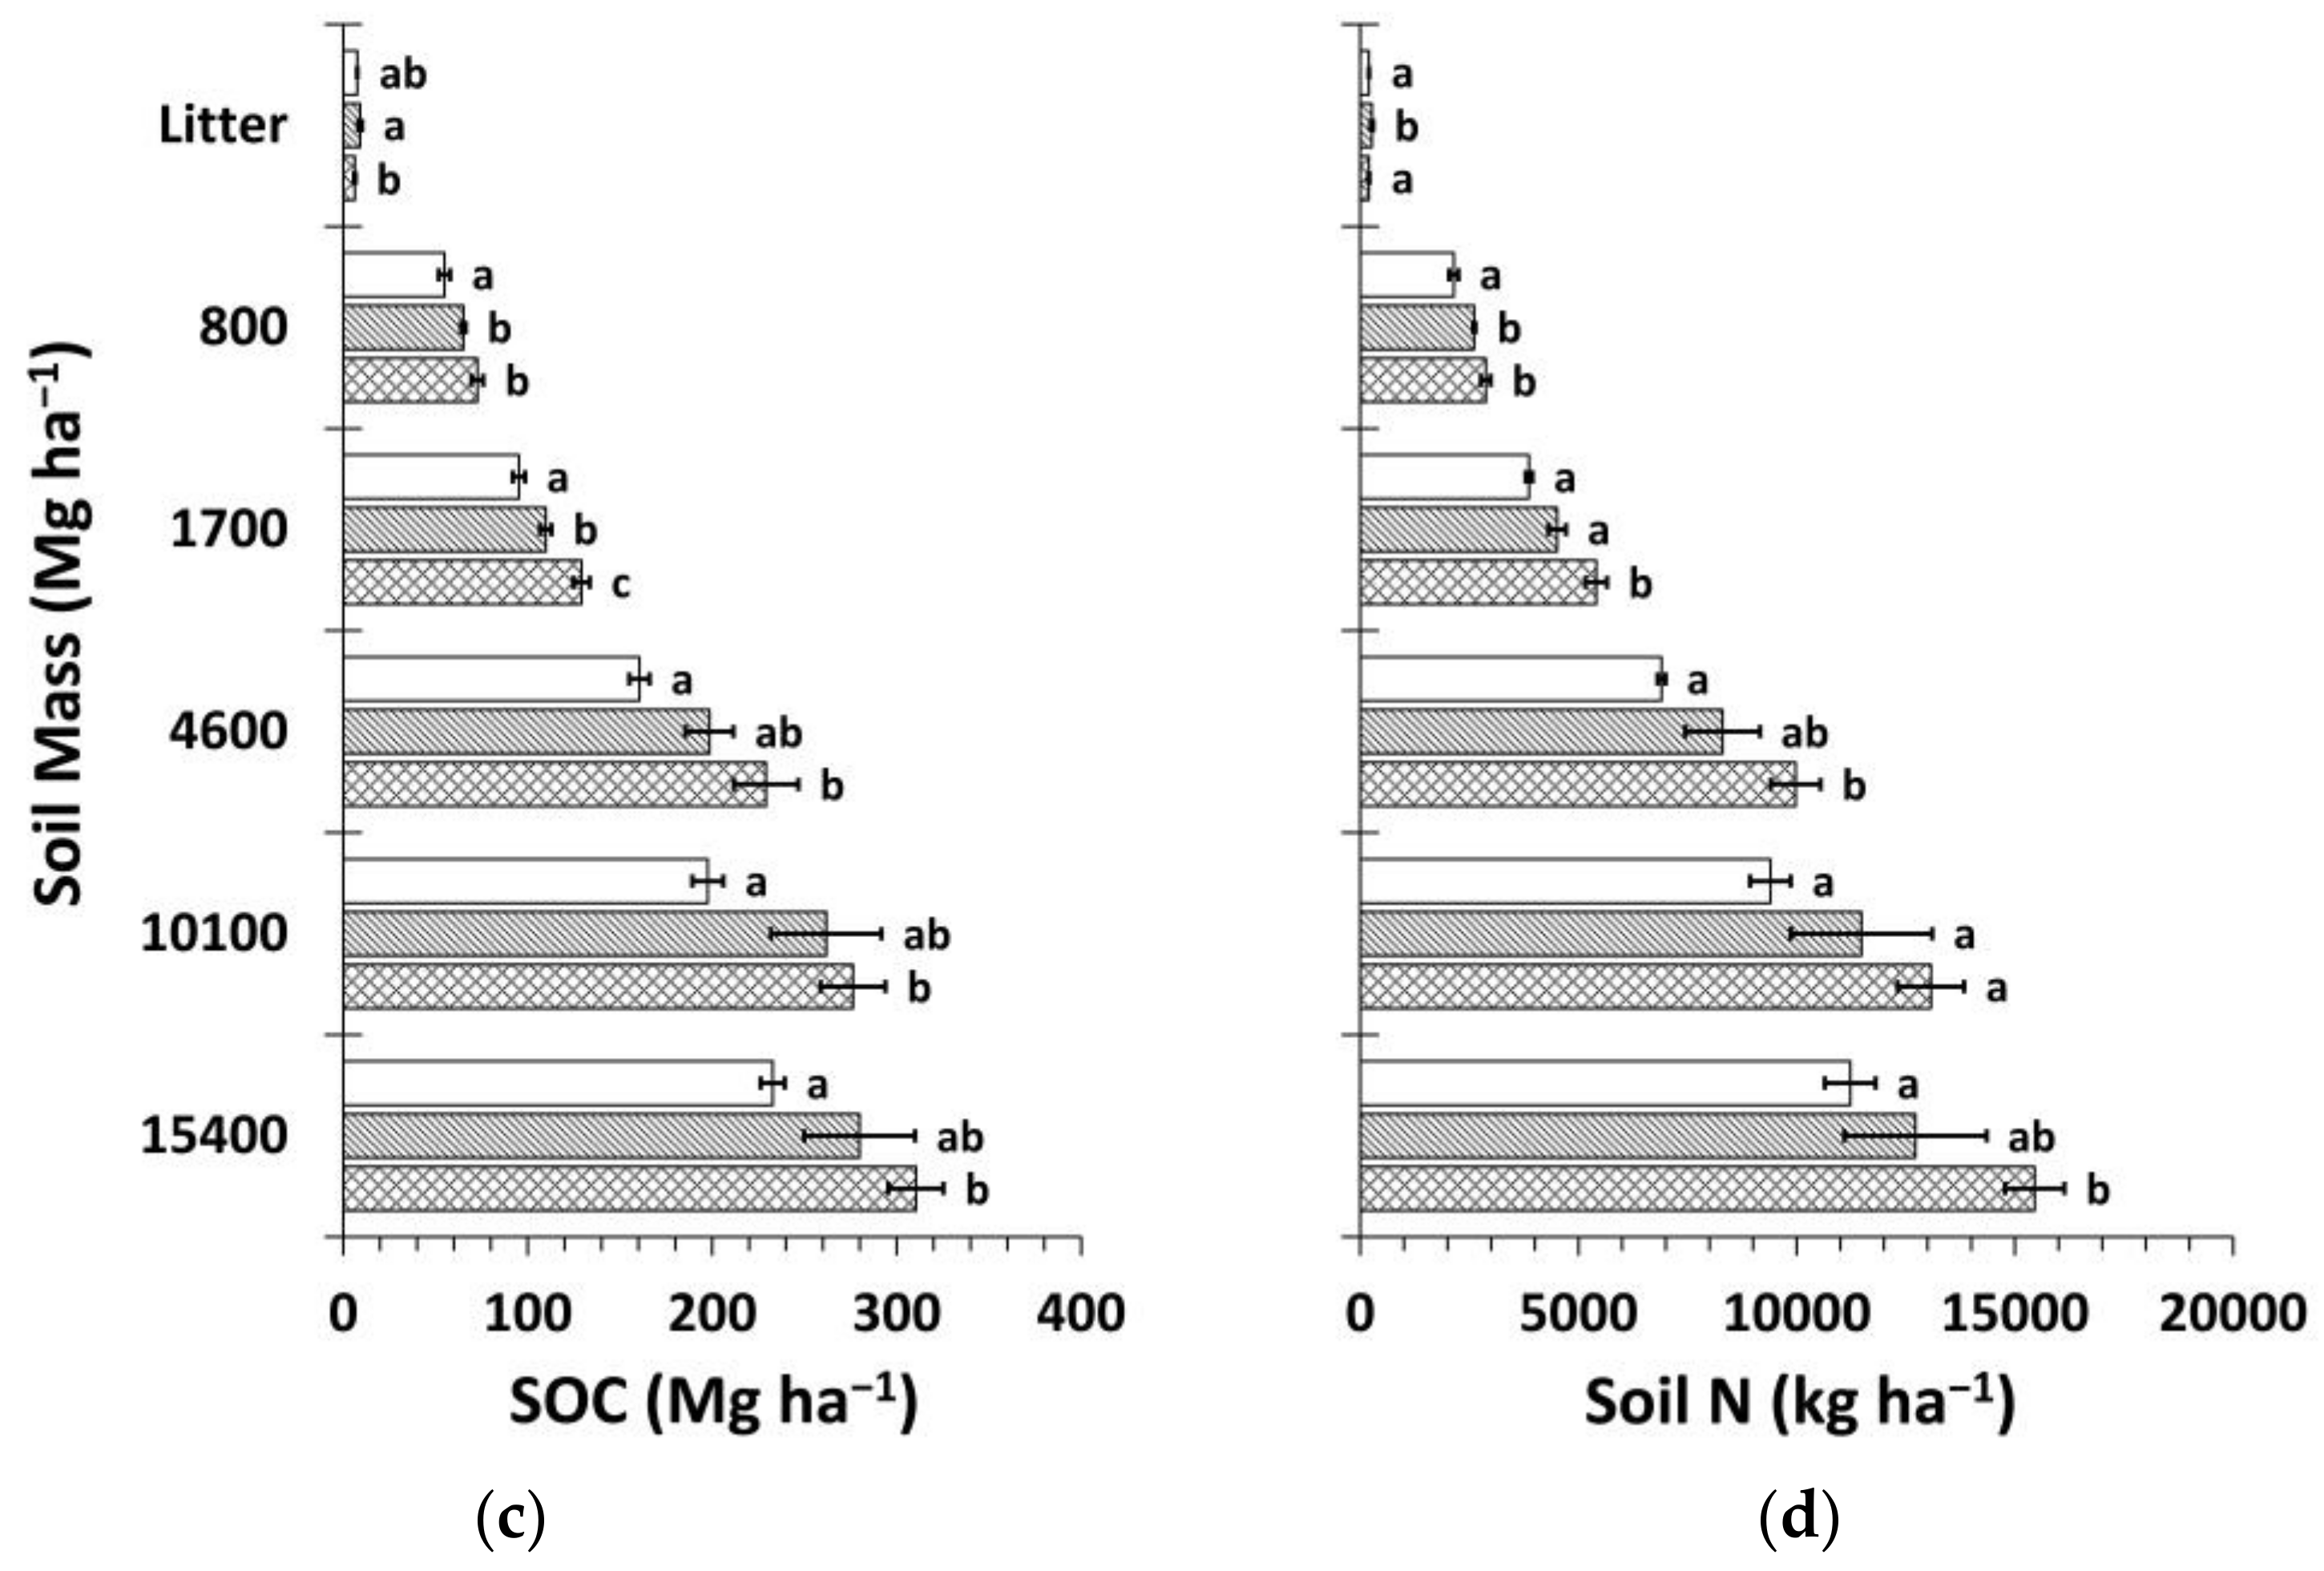
The mass-based estimation of SOC and N stocks yielded similar results to the fixed-depth approach (Figure 8). Total differences in SOC and N stocks between Ctrt and Ttrt were 25% and 27%, respectively, slightly less than for the fixed-depth approach. The portion of these differences that occurred in deeper soil below ~20 cm was 56% and 64%, respectively.
3.4. Carbon Stocks and Sequestration
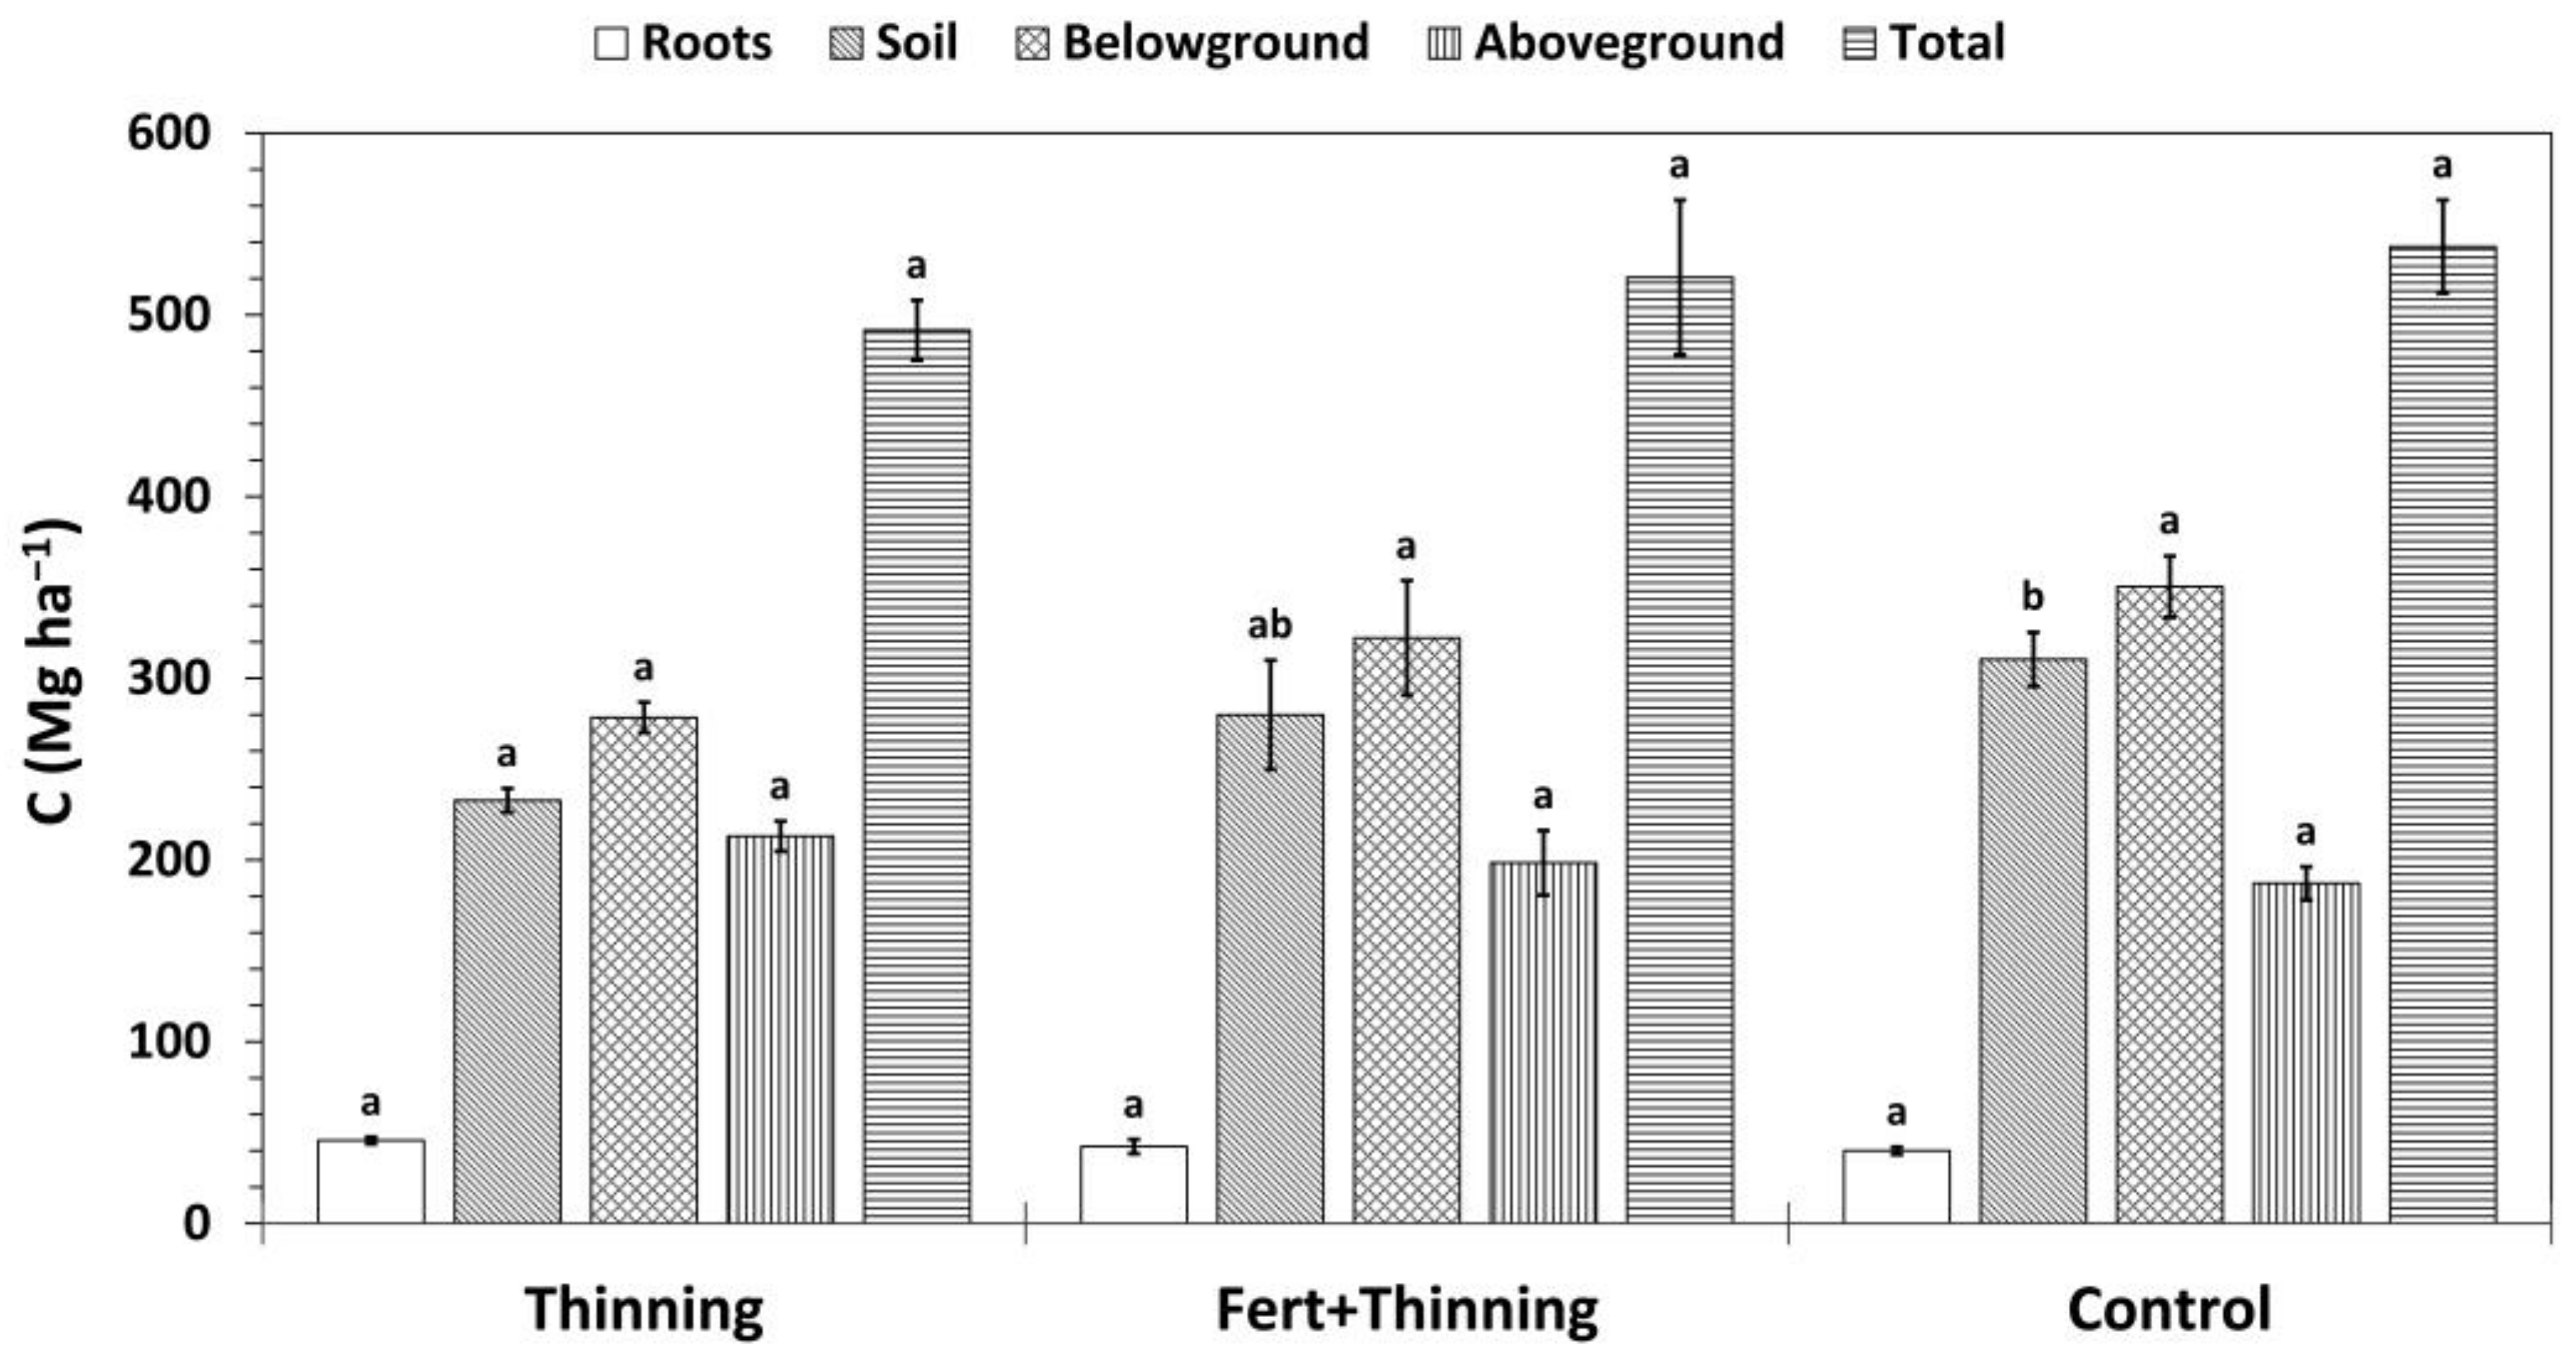
Total and belowground C stocks followed the same pattern as SOC stocks, with Ctrt and Ttrt having the highest and lowest C stocks, respectively (Figure 9). Trends in aboveground and root C sequestration were the opposite, with Ctrt and Ttrt having the lowest and highest C stocks, respectively. However, none of these differences were significant. Approximately half or more of total C stocks were contained in the soil across treatments (47%, 54%, and 58% for Ttrt, FTtrt, and Ctrt, respectively). Initial trees per hectare was a significant predictor of aboveground (p = 0.0031; r2 = 0.7363), root (p = 0.0026; r2 = 0.7477), and total C stocks (p = 0.0479; r2 = 0.4503) and was positively related to these three variables. There was no relationship between initial trees per hectare and SOC stock (p = 0.5513; r2 = 0.053). Soil organic C stock was a significant predictor of total C stock, the two variables being positively related, and explained more of the variation in total C stock than initial trees per hectare (p = 0.0041; r2 = 0.7143).
3.5. Merchantable Volume
Merchantable volume, calculated in thousands of board-feet per acre (as 9.8-m long logs to a 15-cm top diameter), was significantly greater for FTtrt than Ttrt, a difference of ~11% (41.1 ± 0.4, 45.6 ± 1.3, and 43.0 ± 1.2 for Ttrt, FTtrt, and Ctrt, respectively). No other variable (e.g., SOC or N stock, initial trees per hectare, and DBH) was significantly related to merchantable volume. Final mean DBH (cm) was greatest for FTtrt and lowest for Ttrt, but these differences were not significant (13.0 ± 0.9, 16.2 ± 1.4, and 14.0 ± 1.6 for Ttrt, FTtrt, and Ctrt, respectively). Initial trees per hectare was a significant predictor of DBH, the two variables being negatively related (p = 0.0024; r2 = 0.7529).
4. Discussion
It is important to first determine which approach, fixed-depth or mass-based, provided a more accurate quantification and comparison of SOC and N stocks. While the fixed-depth and mass-based approaches resulted in similar conclusions overall, the mass-based approach appears to have better represented the degree of change along the vertical soil profile by comparing equal soil masses and eliminating bulk density as a factor. Because bulk density was significantly higher for Ttrt than Ctrt above 20 cm, the mass-based approach resulted in greater SOC and N stock differences between these two treatments in the surface soil layers compared to the fixed-depth approach. Significant differences in bulk density observed between treatments were most likely the result of changes in SOC concentrations. This conclusion is supported by the lack of heavy equipment used during thinning treatments (i.e., a lack of soil-compacting operations), as well as the fact that significant differences in bulk density between treatments coincided with significant differences in SOC concentrations and occurred in soil layers where SOC concentration was a significant predictor of bulk density. In order to account and correct for changes in bulk density with time (that have not resulted from soil erosion or deposition), the mass-based approach is increasingly recommended for SOC and other soil-nutrient inventories [58,60,70,71,72,73]. Soil organic C and N stocks quantified using the mass-based approach and compared among equal soil masses will be considered the more accurate account in the current study, as this process removed changes in bulk density as a confounding variable. Further discussion will refer to the mass-based approach and mass-based calculations of SOC and N stocks.
Litter layer SOC and N stock differences between FTtrt and Ctrt primarily resulted from the greater thickness of FTtrt litter layer compared to Ctrt, rather than from differences in SOC and N concentrations. This greater litter layer thickness may have been due to increased N availability post-fertilization treatments and thus increased understory biomass and turnover [12]. The significantly lower litter layer soil N concentration of Ttrt compared to the other two treatments likely resulted from forest floor organic matter additions with high C:N ratios (such as coarse woody debris left as slash on the forest floor) and subsequent microbial N scavenging in this layer [21,22]. High microbial demand for N during organic-matter decomposition for FTtrt post-thinning was likely compensated for by the addition of N via fertilization treatments.
In the mineral soil, SOC and N stock differences between the treatments were due to differences in SOC and N concentrations. Cumulatively, Ttrt and FTtrt contained 77.6 and 30.5 Mg ha−1 less SOC, respectively, than Ctrt to a depth of ~150 cm. The difference between Ttrt and Ctrt SOC stocks was significant and occurred over a shorter post-treatment timeframe (~11 years) than the difference observed between FTtrt and Ctrt. Assuming equivalent SOC stocks pre-treatment, the rate of post-treatment SOC loss for Ttrt was ~700 g C m−2 y−1 compared to Ctrt. The typical range of SOC accumulation rates in temperate forest soils is ~2 to 70 g C m−2 y−1 [74], with an average rate of 34 g C m−2 y−1. Raich and Schlesinger [75] reported a mean soil respiration rate for temperate coniferous forests of 681 g C m−2 y−1. However, rates ranging between ~950 and 1750 g C m−2 y−1 have been measured [19,20,76]. Using average C flux rates, we estimate a potential Ttrt post-treatment respiration rate of ~1350 g C m−2 y−1, which falls within the published range of soil respiration rates for temperate coniferous forests. Of course, other mechanisms of SOC (and N) loss, such as increased leaching and export, could also help explain observed differences in SOC and N stocks between treatments.
Decreased radiation interception by trees post-thinning could have increased soil temperatures, enhancing microbial metabolic activity and potentially accounting for some of the loss of SOC and N from Ttrt compared to Ctrt [16,17,18,19,20]. Additionally, greater bulk density in the surface soil layers of Ttrt compared to Ctrt could have increased heat-transfer rates to deeper soil layers [20,21] where the majority of the SOC stock was contained and also lost. Fresh C inputs and the creation of preferential flow paths due to the mineralization of root biomass, which can persist for many years following the harvest of trees [31], and increases in DOC flux due to additional organic matter inputs and decreased transpiration and rain interception [29,30] could have increased SOC decomposition via priming post-thinning [23,24,25,32,33,34]. The soil sampled in the current study may be particularly vulnerable to rapid SOC decomposition when subjected to changing environmental conditions and potential priming effects, as it is an older soil that likely developed and accrued SOC over hundreds of thousands to millions of years under relatively stable conditions [19,23,24,25,26,27,28,77].
In the surface soil layers (0–20 cm in depth), which contain the majority of root [78] and microbial [79] biomass, the mean C:N ratio across treatments was ~24, suggesting tight N cycling and the potential for N scavenging, particularly after the addition of high C:N slash to the forest floor post-thinning [21,22]. However, nitrate leaching, which has been observed to increase under slash left on the forest floor [35,36,37,38,39], is also a possible mechanism of N loss and SOC loss via priming [24,25]. FTtrt may have been particularly vulnerable to nitrate leaching post-thinning treatments due to reduced N uptake by roots coinciding with N fertilization. The lower pH in the upper 100 cm of mineral soil and litter layer of FTtrt compared to the other two treatments indicates that a considerable portion of nitrate resulting from the nitrification of urea potentially was not taken up by plants, causing the net addition of one proton (H+) to the soil solution per urea compound [80]. Nitrate leaching would have been generally promoted by the high precipitation in the region studied. Notably, several of the excavated pits had redoximorphic features as high as 75 cm in depth, indicating a relatively high or perched water table. A previous study conducted at the same site identified soil features (massive, clay cemented) below 3 m that could result in a perched water table [81]. As Douglas-fir roots commonly extend to at least 3 m in depth [47], thinning treatments may have sufficiently reduced transpiration to allow a local rise in groundwater level, particularly during the wet season. This rise would have enabled the groundwater to contact more superficial soil layers that have higher DOC and N concentrations, potentially increasing the export of DOC and various forms of N [37,41].
Although SOC stocks were significantly greater for Ctrt than Ttrt, differences in belowground and total C stocks between these two treatments were diluted due to Ttrt having greater aboveground and root C stocks, which increased with initial trees per hectare. On average, Ttrt had substantially higher initial trees per hectare than Ctrt (952 and 682 trees ha−1, respectively). Interestingly, there was no relationship between SOC stock and initial trees per hectare. This is somewhat counterintuitive when thinning treatments, which did affect SOC stocks, were carried out similarly within about a decade of the reductions in initial trees per hectare. However, several key differences may explain this phenomenon. While thinning treatments occurred after crown closure, thus exposing previously shaded and covered areas, reductions in initial trees per hectare occurred prior to crown closure and would not have drastically changed soil conditions. More substantial understory cover prior to crown closure likely insulated the soil from significant temperature changes and increased N uptake following reductions in initial trees per hectare, decreasing nitrate leaching and helping to retain N on-site [82,83]. At this early stage in stand and plant development, leaves and roots would have had a lower C:N ratio [84], reducing the potential for N scavenging during the decomposition of organic matter left on-site. Additionally, roots would have been less dense and rooted less deeply in the soil, likely decreasing DOC flux and the potential for priming effects compared to thinning treatments implemented years later. Differences in soil microbial communities can also lead to differences in SOC and nutrient dynamics. Smith et al. [85] found that soil microbial communities differed between younger and older forests in a study examining forests aged 20 years and older. Although initial trees per hectare were reduced at the site in the current study when the stand was aged <15 years, differences in ground and soil conditions—and thus differences in microbial communities—would likely be greater between juvenile and adult stands than between younger and older adult stands. The lack of relationship between SOC stock and initial trees per hectare suggests that potentially lower SOC accumulation over time due to reduced root C inputs (from reduced root biomass) post-thinning did not play a substantial role in decreasing the SOC stock of Ttrt compared to Ctrt.
Despite greater merchantable volume for FTtrt compared to Ctrt, any net monetary gains would have been minimal due to the additional expenses of fertilization and thinning treatments. Ttrt resulted in the least financial gain over the length of the rotation (i.e., it had the lowest merchantable volume in addition to incurring thinning expenses) and reduced soil quality and nutrient stocks for the succeeding rotation. On the other hand, reducing the initial trees per hectare prior to crown closure did not affect SOC and N stocks and the variation in total C stock was explained more by SOC stock (71%) than by initial trees per hectare (45%). Therefore, the typically low-cost practice of reducing initial trees per hectare could provide benefits such as increased stand stability, health, and DBH, while potentially avoiding negative effects such as reducing SOC and N stocks.
5. Conclusions
This long-term study shows that forest-management practices can affect both surface and deep SOC and N stocks on decadal timescales. Thinning treatments reduced SOC and N stocks by 25% and 27%, respectively, with most of this loss occurring below ~20 cm to a depth of ~150 cm. Changing the soil environment by affecting the ecosystem, C inputs, roots, and soil properties can increase SOC decomposition, N mineralization, and SOC and N export. In this study, a combination of these factors and their complex interactions likely resulted in the observed decreases in SOC and N stocks post-thinning. Although thinning treatments had a negative effect on SOC and N stocks, reducing the initial trees per hectare prior to crown closure is a low-cost alternative practice that could provide the stand benefits associated with thinning a more mature stand without decreasing soil fertility and, potentially, the productivity of future stands. Additional field studies should examine the mechanisms behind SOC and N losses post-thinning (particularly in deeper soil layers) and the effects on stand and soil dynamics of reducing the initial trees per hectare at various intensities and stages prior to crown closure. As the majority of SOC and N stocks are contained in deeper soil layers, accurately assessing SOC and N budgets and comparing changes over time requires sampling soil deeper than 20 cm.
Author Contributions
C.D.G., R.B.H., and E.C.T. conceived and designed the experiment; C.D.G. collected and analyzed the samples with assistance and feedback from J.N.J.; C.D.G. analyzed the data with feedback from E.C.T., J.N.J., and R.B.H.; R.B.H. contributed reagents/materials/analysis tools; C.D.G. wrote the paper.
Funding
This research was funded by the Stand Management Cooperative, School of Environmental and Forest Sciences, University of Washington, Seattle, Washington.
Acknowledgments
We thank the members and staff of the University of Washington Stand Management Cooperative for funding this research and providing valuable feedback, as well as for establishing and maintaining the study site and for providing technical support and assistance. Thanks also go to Dongsen Xue, Hanzhang Ding “Chris,” and Tony Scigliano for assistance in the laboratory, and to Patrick Tobin and Darlene Zabowski for their feedback. Finally, we thank the three anonymous reviewers whose constructive comments helped improve the quality of this paper.
Conflicts of Interest
The authors declare no conflict of interest.
References
- Bellassen, V.; Luyssaert, S. Carbon sequestration: Managing forests in uncertain times. Nature 2014, 506, 153–155. [Google Scholar] [CrossRef] [PubMed]
- Pan, Y.; Birdsey, R.A.; Fang, J.; Houghton, R.; Kauppi, P.E.; Kurz, W.A.; Phillips, O.L.; Shvidenko, A.; Lewis, S.L.; Canadell, J.G.; et al. A large and persistent carbon sink in the world’s forests. Science 2011, 333, 988–993. [Google Scholar] [CrossRef] [PubMed]
- Lal, R. Forest soils and carbon sequestration. For. Ecol. Manag. 2005, 220, 242–258. [Google Scholar] [CrossRef]
- Stockmann, U.; Adams, M.A.; Crawford, J.W.; Field, D.J.; Henakaarchchi, N.; Jenkins, M.; Minasny, B.; McBratney, A.B.; de Courcelles, V.D.R.; Singh, K.; et al. The knowns, known unknowns and unknowns of sequestration of soil organic carbon. Agric. Ecosyst. Environ. 2013, 164, 80–99. [Google Scholar] [CrossRef]
- Clarke, N.; Gundersen, P.; Jönsson-Belyazid, U.; Kjønaas, O.J.; Persson, T.; Sigurdsson, B.D.; Stupak, I.; Vesterdal, L. Influence of different tree-harvesting intensities on forest soil carbon stocks in boreal and northern temperate forest ecosystems. For. Ecol. Manag. 2015, 351, 9–19. [Google Scholar] [CrossRef]
- Jobbágy, E.G.; Jackson, R.B. The vertical distribution of soil organic carbon and its relation to climate and vegetation. Ecol. Appl. 2000, 10, 423–436. [Google Scholar] [CrossRef]
- Dixon, R.K.; Brown, S.; Houghton, R.A.; Solomon, A.M.; Trexler, M.C.; Wisniewski, J. Carbon pools and flux of global forest ecosystems. Science 1994, 263, 185–190. [Google Scholar] [CrossRef] [PubMed]
- Milne, E.; Banwart, S.A.; Noellemeyer, E.; Abson, D.J.; Ballabio, C.; Bampa, F.; Bationo, A.; Batjes, N.H.; Bernoux, M.; Bhattacharyya, T.; et al. Soil carbon, multiple benefits. Environ. Dev. 2015, 13, 33–38. [Google Scholar] [CrossRef]
- Carter, R.E.; Klinka, K. Relationships between growing-season soil water-deficit, mineralizable soil nitrogen and site index of coastal Douglas fir. For. Ecol. Manag. 1990, 30, 301–311. [Google Scholar] [CrossRef]
- Blake, J.I.; Chappell, H.N.; Bennett, W.S.; Gessel, S.P.; Webster, S.R. Douglas fir growth and foliar nutrient responses to nitrogen and sulfur fertilization. Soil Sci. Soc. Am. J. 1990, 54, 257. [Google Scholar] [CrossRef]
- Chappell, H.N.; Cole, D.W.; Gessel, S.P.; Walker, R.B. Forest fertilization research and practice in the Pacific Northwest. Fertil. Res. 1991, 27, 129–140. [Google Scholar] [CrossRef]
- Jandl, R.; Lindner, M.; Vesterdal, L.; Bauwens, B.; Baritz, R.; Hagedorn, F.; Johnson, D.W.; Minkkinen, K.; Byrne, K.A. How strongly can forest management influence soil carbon sequestration? Geoderma 2007, 137, 253–268. [Google Scholar] [CrossRef]
- Li, W.; Jin, C.; Guan, D.; Wang, Q.; Wang, A.; Yuan, F.; Wu, J. The effects of simulated nitrogen deposition on plant root traits: A meta-analysis. Soil Biol. Biochem. 2015, 82, 112–118. [Google Scholar] [CrossRef]
- James, J.; Harrison, R. The effect of harvest on forest soil carbon: A meta-analysis. Forests 2016, 7, 308. [Google Scholar] [CrossRef]
- Bird, J.A.; Kleber, M.; Torn, M.S. 13C and 15N stabilization dynamics in soil organic matter fractions during needle and fine root decomposition. Org. Geochem. 2008, 39, 465–477. [Google Scholar] [CrossRef]
- Chase, C.W.; Kimsey, M.J.; Shaw, T.M.; Coleman, M.D. The response of light, water, and nutrient availability to pre-commercial thinning in dry inland Douglas-fir forests. For. Ecol. Manag. 2016, 363, 98–109. [Google Scholar] [CrossRef]
- Cheng, X.; Han, H.; Kang, F.; Liu, K.; Song, Y.; Zhou, B.; Li, Y. Short-term effects of thinning on soil respiration in a pine (Pinus tabulaeformis) plantation. Biol. Fertil. Soils 2014, 50, 357–367. [Google Scholar] [CrossRef]
- Thibodeau, L.; Raymond, P.; Camiré, C.; Munson, A.D. Impact of precommercial thinning in balsam fir stands on soil nitrogen dynamics, microbial biomass, decomposition, and foliar nutrition. Can. J. For. Res. 2000, 30, 229–238. [Google Scholar] [CrossRef]
- Hicks Pries, C.E.; Castanha, C.; Porras, R.; Torn, M.S. The whole-soil carbon flux in response to warming. Science 2017, 355, 1420–1423. [Google Scholar] [CrossRef] [PubMed]
- Gallo, A.C. Response of Soil Temperature, Moisture, and Respiration Two Years Following Intensive Organic Matter and Compaction Manipulations in Oregon Cascade Forests. MS Thesis, Oregon State University, Corvallis, OR, USA, 2016. [Google Scholar]
- Brady, N.C.; Weil, R.R. The Nature and Properties of Soils, 14th ed.; Pearson: Upper Saddle River, NJ, USA, 2008. [Google Scholar]
- Staaf, H.; Berg, B. Accumulation and release of plant nutrients in decomposing Scots pine needle litter. Long-term decomposition in a Scots pine forest II. Can. J. Bot. 1982, 60, 1561–1568. [Google Scholar] [CrossRef]
- Fontaine, S.; Barot, S.; Barré, P.; Bdioui, N.; Mary, B.; Rumpel, C. Stability of organic carbon in deep soil layers controlled by fresh carbon supply. Nature 2007, 450, 277–280. [Google Scholar] [CrossRef] [PubMed]
- Carrillo, Y.; Bell, C.; Koyama, A.; Canarini, A.; Boot, C.M.; Wallenstein, M.; Pendall, E. Plant traits, stoichiometry and microbes as drivers of decomposition in the rhizosphere in a temperate grassland. J. Ecol. 2017, 105, 1750–1765. [Google Scholar] [CrossRef]
- Kalbitz, K.; Solinger, S.; Park, J.-H.; Michalzik, B.; Matzner, E. Controls on the dynamics of dissolved organic matter in soils: A review. Soil Sci. 2000, 165, 277–304. [Google Scholar] [CrossRef]
- Schmidt, M.W.I.; Torn, M.S.; Abiven, S.; Dittmar, T.; Guggenberger, G.; Janssens, I.A.; Kleber, M.; Kögel-Knabner, I.; Lehmann, J.; Manning, D.A.; et al. Persistence of soil organic matter as an ecosystem property. Nature 2011, 478, 49–56. [Google Scholar] [CrossRef] [PubMed]
- Harrison, R.B.; Footen, P.W.; Strahm, B.D. Deep soil horizons: Contribution and importance to soil carbon pools and in assessing whole-ecosystem response to management and global change. For. Sci. 2011, 57, 67–76. [Google Scholar]
- Hicks Pries, C.E.; Schuur, E.A.G.; Natali, S.M.; Crummer, K.G. Old soil carbon losses increase with ecosystem respiration in experimentally thawed tundra. Nat. Clim. Chang. 2016, 6, 214–218. [Google Scholar] [CrossRef]
- Neff, J.C.; Asner, G.P. Dissolved organic carbon in terrestrial ecosystems: Synthesis and a model. Ecosystems 2001, 4, 29–48. [Google Scholar] [CrossRef]
- Sanderman, J.; Baldock, J.A.; Amundson, R.; Baldock, J.A. Dissolved organic carbon chemistry and dynamics in contrasting forest and grassland soils. Biogeochemistry 2008, 89, 181–198. [Google Scholar] [CrossRef]
- Strahm, B.D.; Harrison, R.B.; Terry, T.A.; Harrington, T.B.; Adams, A.B.; Footen, P.W. Changes in dissolved organic matter with depth suggest the potential for postharvest organic matter retention to increase subsurface soil carbon pools. For. Ecol. Manag. 2009, 258, 2347–2352. [Google Scholar] [CrossRef]
- Deb, S.K.; Shukla, M.K. A review of dissolved organic matter transport processes affecting soil and environmental quality. J. Environ. Anal. Toxicol. 2011, 1. [Google Scholar] [CrossRef]
- Bundt, M.; Widmer, F.; Pesaro, M.; Zeyer, J.; Blaser, P. Preferential flow paths: Biological “hot spots” in soils. Soil Biol. Biochem. 2001, 33, 729–738. [Google Scholar] [CrossRef]
- Hagedorn, F.; Bundt, M. The age of preferential flow paths. Geoderma 2002, 108, 119–132. [Google Scholar] [CrossRef]
- Strahm, B.D.; Harrison, R.B.; Terry, T.A.; Flaming, B.L.; Licata, C.W.; Petersen, K.S. Soil solution nitrogen concentrations and leaching rates as influenced by organic matter retention on a highly productive Douglas-fir site. For. Ecol. Manag. 2005, 218, 74–88. [Google Scholar] [CrossRef]
- Emmett, B.A.; Anderson, J.M.; Hornung, M. The controls on dissolved nitrogen losses following two intensities of harvesting in a Sitka spruce forest (N. Wales). For. Ecol. Manag. 1991, 41, 65–80. [Google Scholar] [CrossRef]
- Nieminen, M. Export of dissolved organic carbon, nitrogen and phosphorus following clear-cutting of three Norway spruce forests growing on drained peatlands in southern Finland. Silva Fenn. 2004, 38, 123–132. [Google Scholar] [CrossRef]
- Staaf, H.; Olsson, B.A. Effects of slash removal and stump harvesting on soil water chemistry in a clearcutting in SW Sweden. Scand. J. For. Res. 1994, 9, 305–310. [Google Scholar] [CrossRef]
- Rosén, K.; Lundmark-Thelin, A. Increased nitrogen leaching under piles of slash—A consequence of modern forest harvesting techniques. Scand. J. For. Res. 1987, 2, 21–29. [Google Scholar] [CrossRef]
- Fox, T.R. Nitrogen mineralization following fertilization of Douglas-fir forests with urea in western Washington. Soil Sci. Soc. Am. J. 2004, 68, 1720–1728. [Google Scholar] [CrossRef]
- Laudon, H.; Hedtjärn, J.; Schelker, J.; Bishop, K.; Sørensen, R.; Agren, A. Response of dissolved organic carbon following forest harvesting in a boreal forest. Ambio 2009, 38, 381–386. [Google Scholar] [CrossRef] [PubMed]
- Mobley, M.L.; Lajtha, K.; Kramer, M.G.; Bacon, A.R.; Heine, P.R.; Richter, D.D. Surficial gains and subsoil losses of soil carbon and nitrogen during secondary forest development. Glob. Chang. Biol. 2015, 21, 986–996. [Google Scholar] [CrossRef] [PubMed]
- Diochon, A.C.; Kellman, L. Physical fractionation of soil organic matter: Destabilization of deep soil carbon following harvesting of a temperate coniferous forest. J. Geophys. Res. Biogeosci. 2009, 114, 1–9. [Google Scholar] [CrossRef]
- Richter, D.D.; Markewitz, D.; Trumbore, S.E.; Wells, C.G. Rapid accumulation and turnover of soil carbon in a re-establishing forest. Nature 1999, 400, 56–58. [Google Scholar] [CrossRef]
- Batjes, N.H. Total carbon and nitrogen in the soils of the world. Eur. J. Soil Sci. 1996, 47, 151–163. [Google Scholar] [CrossRef]
- Tarnocai, C.; Canadell, J.G.; Schuur, E.A.G.; Kuhry, P.; Mazhitova, G.; Zimov, S. Soil organic carbon pools in the northern circumpolar permafrost region. Glob. Biogeochem. Cycles 2009, 23. [Google Scholar] [CrossRef]
- Stone, E.L.; Kalisz, P.J. On the maximum extent of tree roots. For. Ecol. Manag. 1991, 46, 59–102. [Google Scholar] [CrossRef]
- Jandl, R.; Rodeghiero, M.; Martinez, C.; Cotrufo, M.F.; Bampa, F.; van Wesemael, B.; Harrison, R.B.; Guerrini, I.A.; deB Richter, D., Jr.; Rustad, L.; et al. Current status, uncertainty and future needs in soil organic carbon monitoring. Sci. Total Environ. 2014, 468–469, 376–383. [Google Scholar] [CrossRef] [PubMed]
- Curtis, R.O. A simple index of stand density for Douglas-fir. For. Sci. 1982, 28, 92–94. [Google Scholar]
- PRISM Climate Group. Oregon State University, Corvallis, OR, USA, created 4 Feb 2004. Available online: http://prism.oregonstate.edu (accessed on 17 February 2017).
- Gross, C.D.; Harrison, R.B. Quantifying and comparing soil carbon stocks: Underestimation with the core sampling method. Soil Sci. Soc. Am. J. 2018. [Google Scholar] [CrossRef]
- Hamburg, S.P. Simple rules for measuring changes in ecosystem carbon in forestry-offset projects. Mitag. Adapt. Strateg. Glob. Chang. 2000, 5, 25–37. [Google Scholar] [CrossRef]
- Holub, S.M. Soil Carbon Change in Pacific Northwest Coastal Douglas-Fir Forests: Change Detection Following Harvest—Soils Establishment Report; Weyerhaeuser NR, Timberlands Technology, Production Forestry West: Albany, OR, USA, 2011. [Google Scholar]
- Harrison, R.B.; Adams, A.B.; Licata, C.; Flaming, B.; Wagoner, G.L.; Carpenter, P.; Vance, E.D. Quantifying deep-soil and coarse-soil fractions: Avoiding sampling bias. Soil Sci. Soc. Am. J. 2003, 67, 1602–1606. [Google Scholar] [CrossRef]
- Soil Survey Staff, Natural Resources Conservation Service, United States Department of Agriculture. Web Soil Survey. Available online: https://websoilsurvey.sc.egov.usda.gov/ (accessed on 5 July 2017).
- Walthert, L.; Graf, U.; Kammer, A.; Luster, J.; Pezzotta, D.; Zimmermann, S.; Hagedorn, F. Determination of organic and inorganic carbon, δ13C, and nitrogen in soils containing carbonates after acid fumigation with HCl. J. Plant Nutr. Soil Sci. 2010, 173, 207–216. [Google Scholar] [CrossRef]
- Tisdall, A.L. Comparison of methods of determining apparent density of soils. Aust. J. Agric. Res. 1951, 2, 349–354. [Google Scholar] [CrossRef]
- Wendt, J.W.; Hauser, S. An equivalent soil mass procedure for monitoring soil organic carbon in multiple soil layers. Eur. J. Soil Sci. 2013, 64, 58–65. [Google Scholar] [CrossRef]
- Wendt, J.W. ESM Sample Spreadsheets, 2012. Available online: https://drive.google.com/file/d/0BzxNFfzLbFxjSG9RWlpwQ0FXc0k/view?usp=sharing (accessed on 16 May 2017).
- Lee, J.; Hopmans, J.W.; Rolston, D.E.; Baer, S.G.; Six, J. Determining soil carbon stock changes: Simple bulk density corrections fail. Agric. Ecosyst. Environ. 2009, 134, 251–256. [Google Scholar] [CrossRef]
- Throop, H.L.; Archer, S.R.; Monger, H.C.; Waltman, S. When bulk density methods matter: Implications for estimating soil organic carbon pools in rocky soils. J. Arid Environ. 2012, 77, 66–71. [Google Scholar] [CrossRef]
- Zabowski, D.; Whitney, N.; Gurung, J.; Hatten, J. Total soil carbon in the coarse fraction and at depth. For. Sci. 2011, 57, 11–18. [Google Scholar] [CrossRef]
- Corti, G.; Ugolini, F.C.; Agnelli, A.; Certini, G.; Cuniglio, R.; Berna, F.; Fernández Sanjurjo, M.J. The soil skeleton, a forgotten pool of carbon and nitrogen in soil. Eur. J. Soil Sci. 2002, 53, 283–298. [Google Scholar] [CrossRef]
- Whitney, N.; Zabowski, D. Soil total nitrogen in the coarse fraction and at depth. Soil Sci. Soc. Am. J. 2004, 68, 612–619. [Google Scholar] [CrossRef]
- Jenkins, J.C.; Chojnacky, D.C.; Heath, L.S.; Birdsey, R.A. National-scale biomass estimators for United States tree species. For. Sci. 2003, 49, 12–35. [Google Scholar]
- Miles, P.D.; Smith, W.B. Specific Gravity and Other Properties of Wood and Bark for 156 Tree Species Found in North America; US Department of Agriculture, Forest Service, Northern Research Station: Newtown Square, PA, USA, 2009.
- Birdsey, R.A. Carbon Storage and Accumulation in United States Forest Ecosystems; United States Department of Agriculture, Forest Service, Northeastern Forest Experiment Station: Radnor, PA, USA, 1992.
- Zar, J.H. Biostatistical Analysis, 5th ed.; Prentice-Hall/Pearson: Upper Saddle River, NJ, USA, 2010. [Google Scholar]
- RStudio Team. RStudio: Integrated Development for R; RStudio Inc.: Boston, MA, USA, 2016. [Google Scholar]
- Schrumpf, M.; Schulze, E.D.; Kaiser, K.; Schumacher, J. How accurately can soil organic carbon stocks and stock changes be quantified by soil inventories? Biogeosciences 2011, 8, 1193–1212. [Google Scholar] [CrossRef]
- Wuest, S.B. Correction of bulk density and sampling method biases using soil mass per unit area. Soil Sci. Soc. Am. J. 2009, 73, 312. [Google Scholar] [CrossRef]
- Mikha, M.M.; Benjamin, J.G.; Halvorson, A.D.; Nielsen, D.C. Soil carbon changes influenced by soil management and calculation method. Open J. Soil Sci. 2013, 3, 123–131. [Google Scholar] [CrossRef]
- Ellert, B.H.; Bettany, J.R. Calculation of organic matter and nutrients stored in soils under contrasting management regimes. Can. J. Soil Sci. 1995, 75, 529–538. [Google Scholar] [CrossRef]
- Post, W.M.; Kwon, K.C.A. Soil carbon sequestration and land-use change: Processes and potential. Glob. Chang. Biol. 2000, 6, 317–327. [Google Scholar] [CrossRef]
- Raich, J.W.; Schlesinger, W.H. The global carbon dioxide flux in soil respiration and its relationship to vegetation and climate. Tellus B 1992, 44, 81–99. [Google Scholar] [CrossRef]
- Tang, J.; Qi, Y.; Xu, M.; Misson, L.; Goldstein, A.H. Forest thinning and soil respiration in a ponderosa pine plantation in the Sierra Nevada. Tree Physiol. 2005, 25, 57–66. [Google Scholar] [CrossRef] [PubMed]
- Lin, H. Three principles of soil change and pedogenesis in time and space. Soil Sci. Soc. Am. J. 2011, 75, 2049. [Google Scholar] [CrossRef]
- Jackson, R.B.; Canadell, J.; Ehleringer, J.R.; Mooney, H.A.; Sala, O.E.; Schulze, E.D. A global analysis of root distributions for terrestrial biomes. Oecologia 1996, 108, 389–411. [Google Scholar] [CrossRef] [PubMed]
- Fierer, N.; Schimel, J.P.; Holden, P.A. Variations in microbial community composition through two soil depth profiles. Soil Biol. Biochem. 2003, 35, 167–176. [Google Scholar] [CrossRef]
- Davidson, S. Combating soil acidity: Three approaches. Rural Res. 1987, 134, 4–10. [Google Scholar]
- James, J.N.; Dietzen, C.; Furches, J.C.; Harrison, R.B. Lessons on buried horizons and pedogenesis from deep forest soils. Soil Horizons 2015, 56. [Google Scholar] [CrossRef]
- Chang, S.X.; Preston, C.M. Understorey competition affects tree growth and fate of fertilizer-applied 15N in a coastal British Columbia plantation forest: 6-year results. Can. J. For. Res. 2000, 30, 1379–1388. [Google Scholar] [CrossRef]
- Footen, P.W.; Harrison, R.B.; Strahm, B.D. Long-term effects of nitrogen fertilization on the productivity of subsequent stands of Douglas-fir in the Pacific Northwest. For. Ecol. Manag. 2009, 258, 2194–2198. [Google Scholar] [CrossRef]
- Zhang, H.; Wu, H.; Yu, Q.; Wang, Z.; Wei, C.; Long, M.; Kattge, J.; Smith, M.; Han, X. Sampling date, leaf age and root size: Implications for the study of plant C:N:P stoichiometry. PLoS ONE 2013, 8. [Google Scholar] [CrossRef] [PubMed]
- Smith, A.P.; Marín-Spiotta, E.; Balser, T. Successional and seasonal variations in soil and litter microbial community structure and function during tropical postagricultural forest regeneration: A multiyear study. Glob. Chang. Biol. 2015, 21, 3532–3547. [Google Scholar] [CrossRef] [PubMed]
Figure 1.
Location of study site (inset) and layout of treatment plots. The site coordinates are 44.87417, −122.566 (Latitude/Longitude decimal degrees). Fert, fertilized.
Figure 1.
Location of study site (inset) and layout of treatment plots. The site coordinates are 44.87417, −122.566 (Latitude/Longitude decimal degrees). Fert, fertilized.

Figure 2.
(a) Mean soil bulk density by treatment; (b) mean soil organic carbon (SOC) concentration by treatment. Sample size for all treatments and soil depth layers is three. Error bars represent ± one standard error. Means within each soil depth layer accompanied by the same letter (i.e., “a” or “b”) are not significantly different (Tukey’s honest significant difference (HSD), α = 0.1). Fert, fertilized.
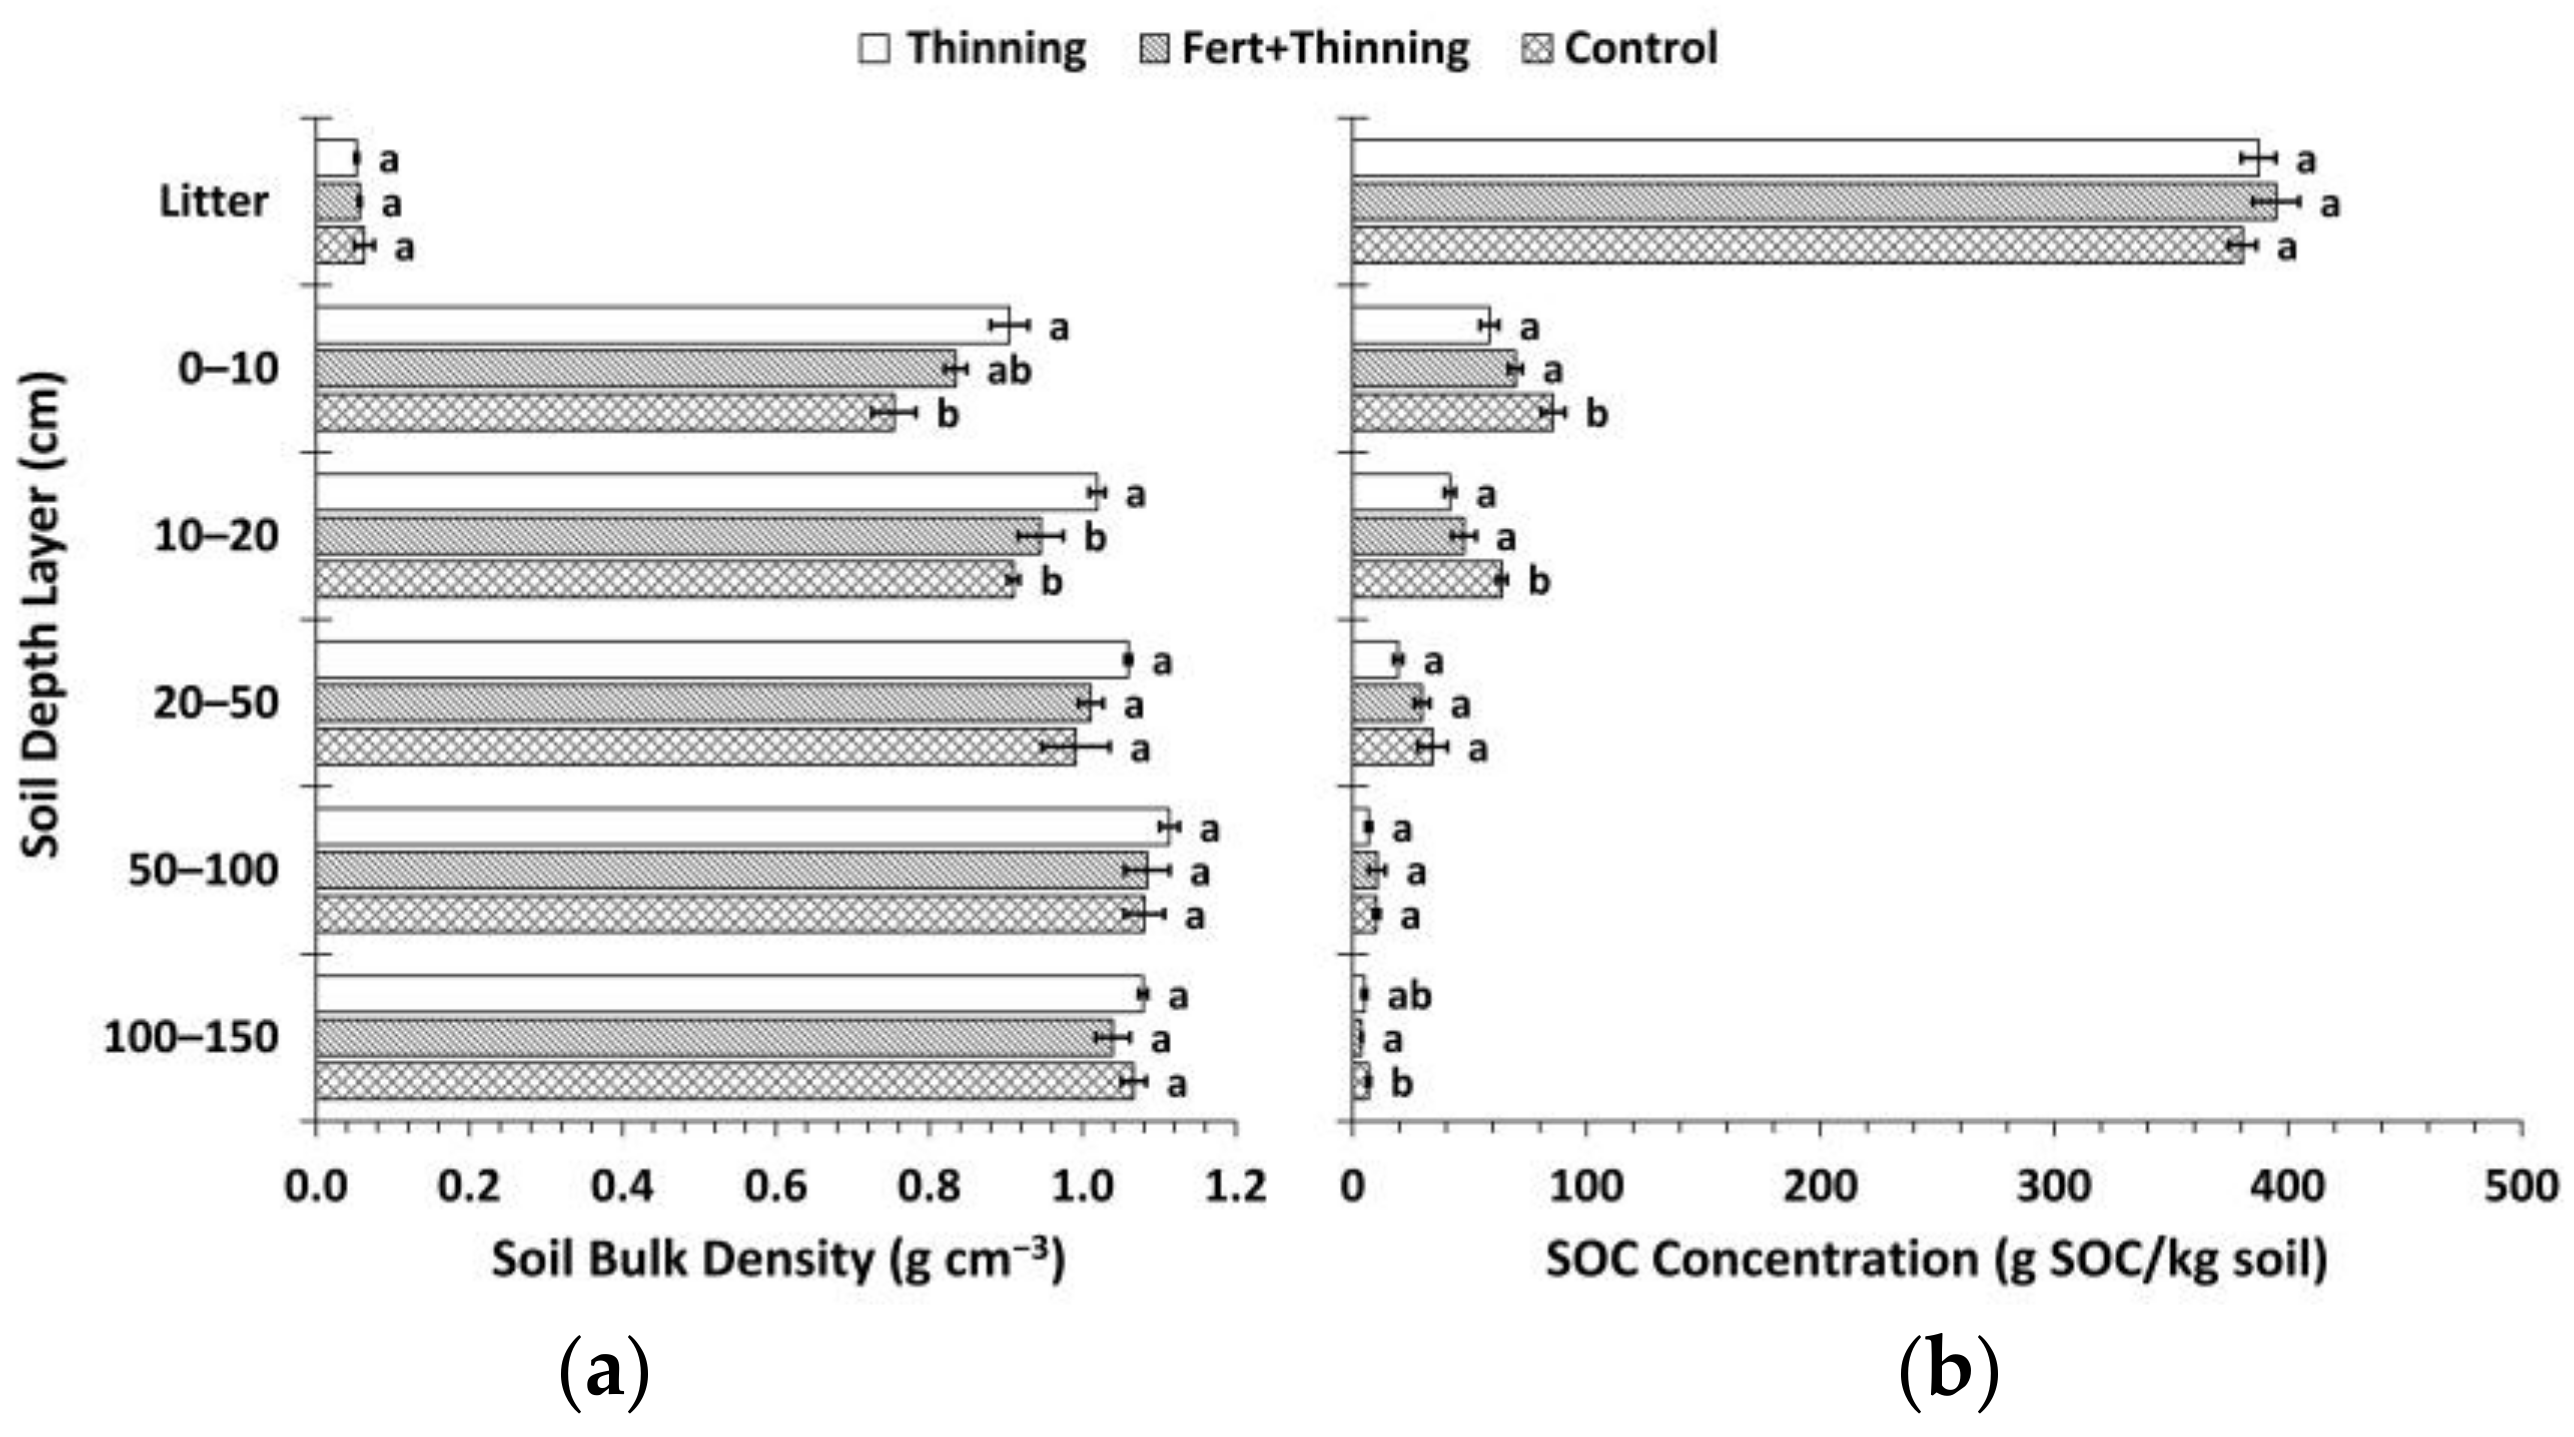
Figure 3.
Soil bulk density versus soil organic carbon (SOC) concentration for: (a) the whole mineral soil (n = 45); (b) the 0–50 cm soil depth layers (n = 27); (c) the 50–150 cm soil depth layers (n = 18); (d) the litter layer (n = 9).
Figure 3.
Soil bulk density versus soil organic carbon (SOC) concentration for: (a) the whole mineral soil (n = 45); (b) the 0–50 cm soil depth layers (n = 27); (c) the 50–150 cm soil depth layers (n = 18); (d) the litter layer (n = 9).

Figure 4.
(a) Mean soil nitrogen (N) concentration by treatment; (b) mean soil organic carbon (SOC) concentration to N concentration by treatment. Sample size for all treatments and soil depth layers is three. Error bars represent ± one standard error. Means within each soil depth layer accompanied by the same letter (i.e., “a” or “b”) are not significantly different (Tukey’s HSD, α = 0.1). Fert, fertilized.
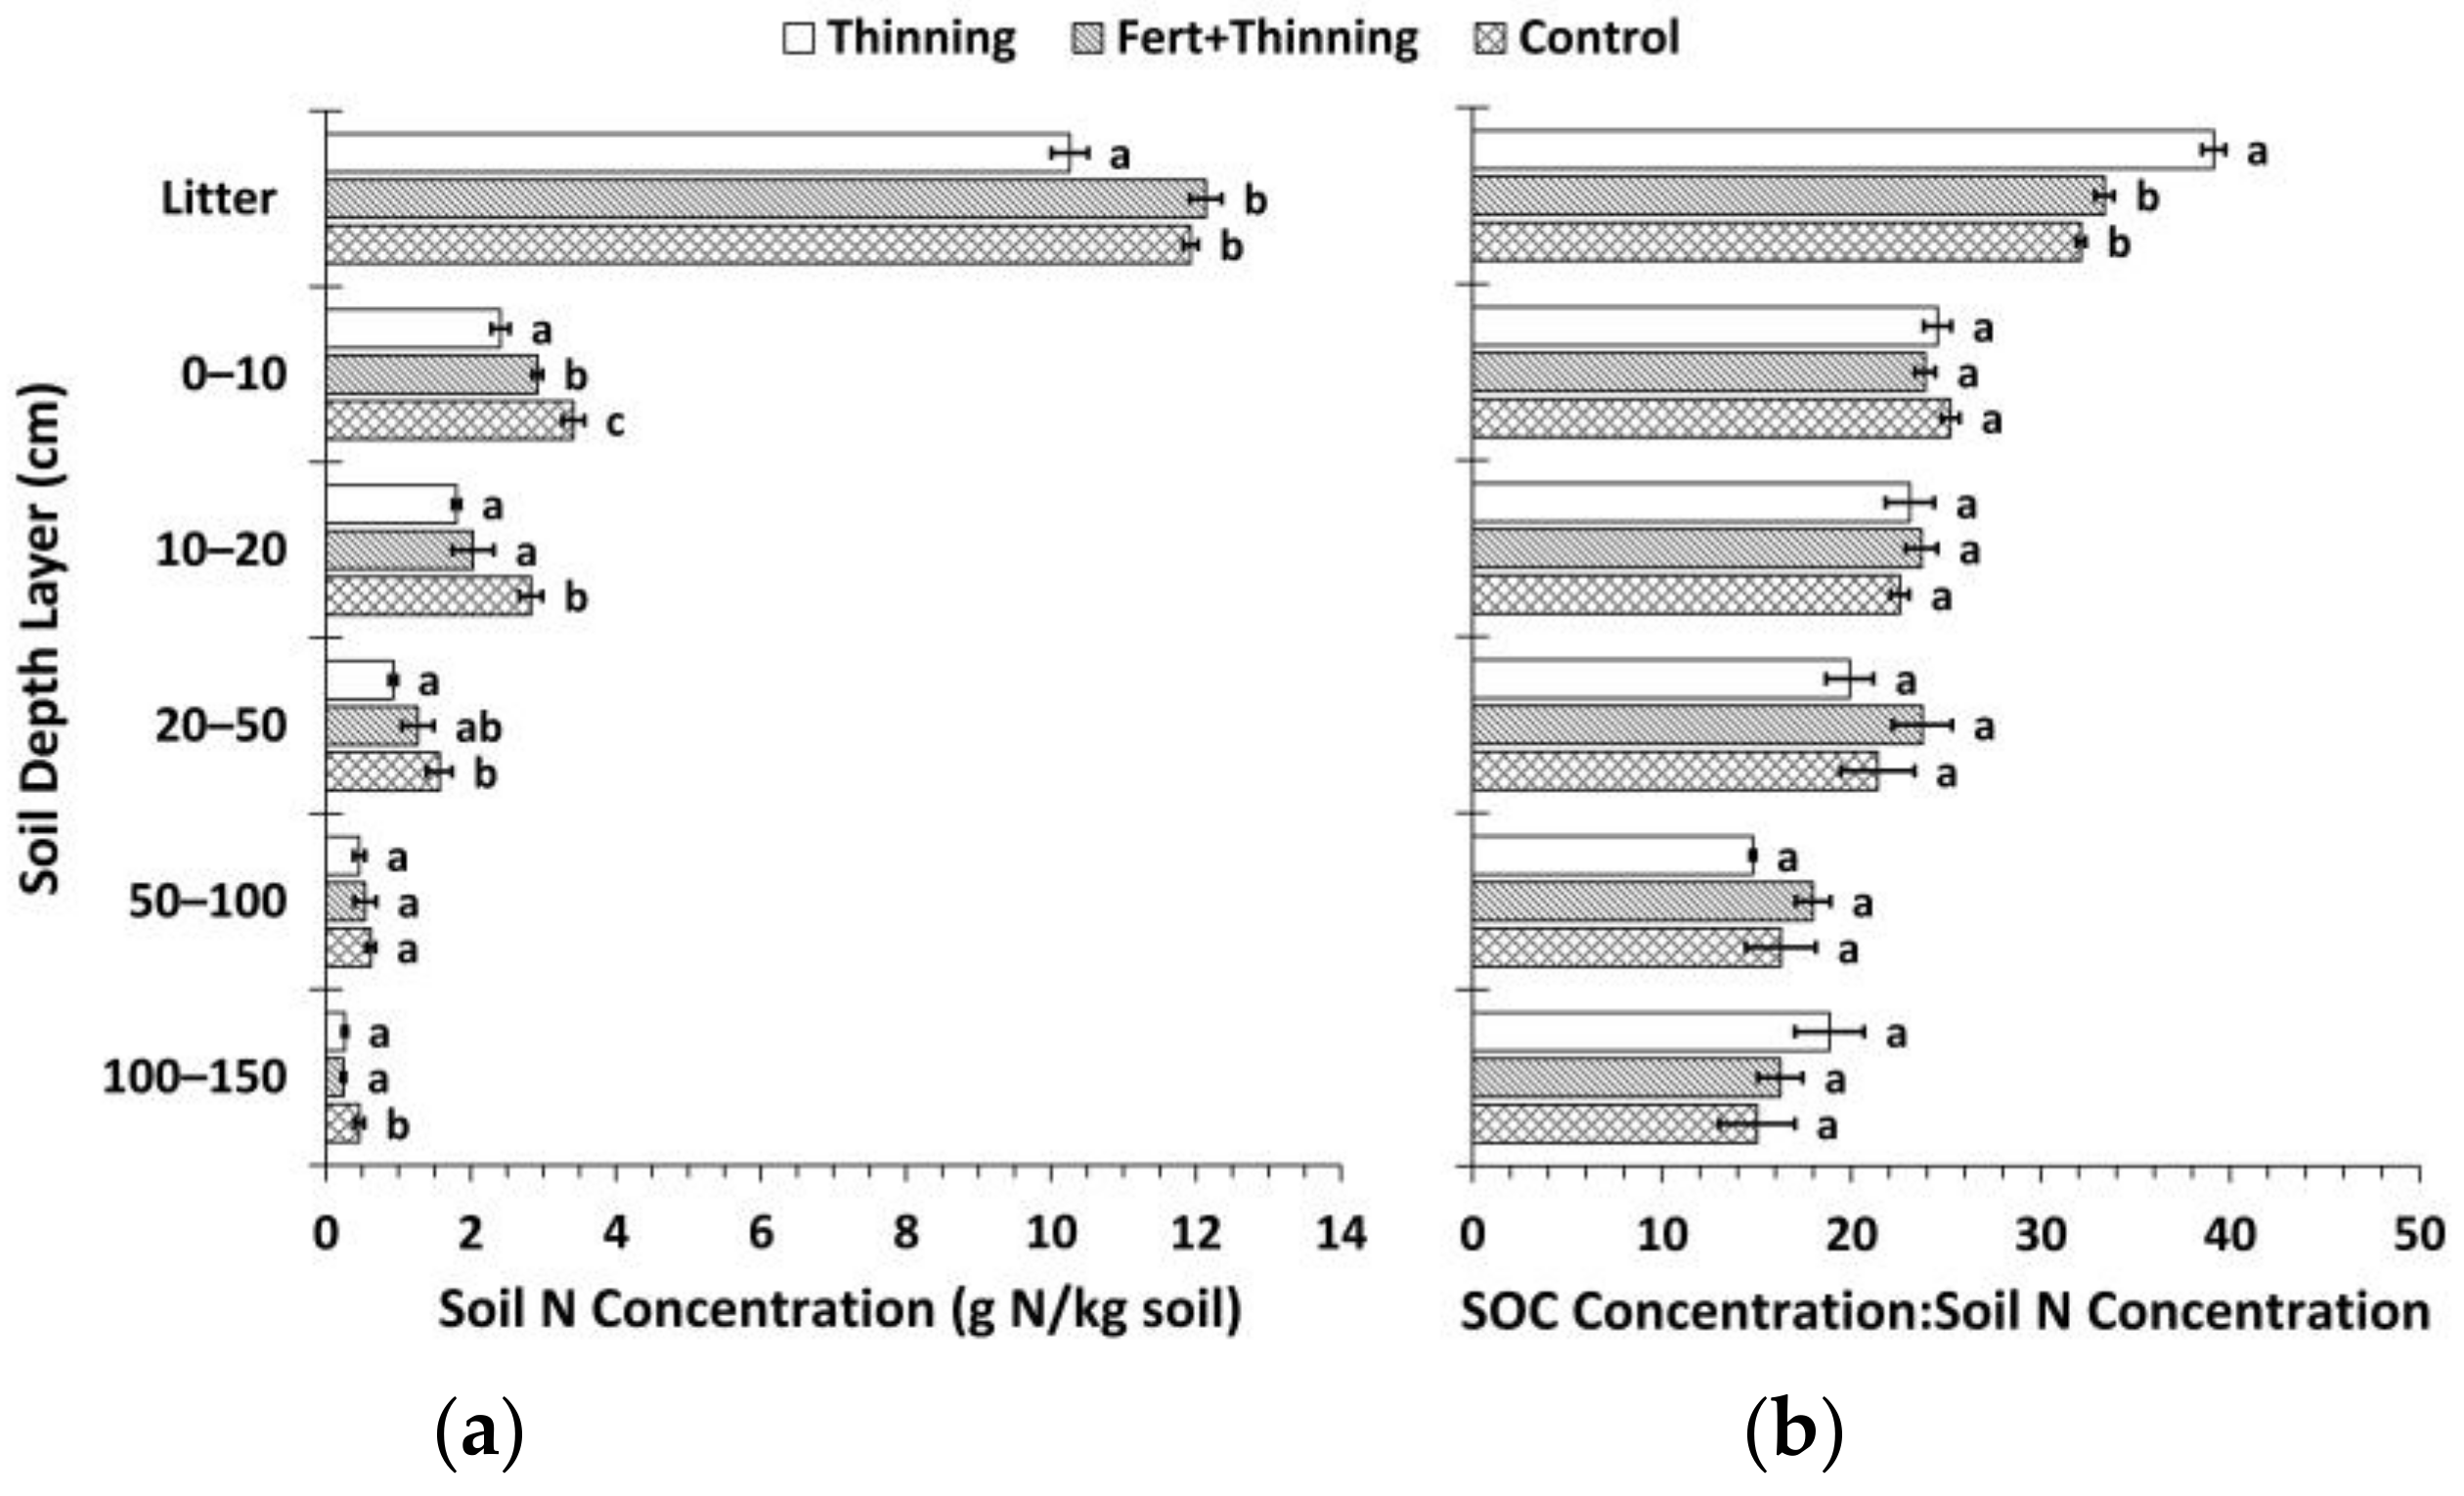
Figure 5.
Soil nitrogen (N) concentration versus soil organic carbon (SOC) concentration for: (a) the whole mineral soil (n = 45); (b) the litter layer (n = 9). Dashed 25:1 line added to provide a reference for the C:N ratio for the whole mineral soil.
Figure 5.
Soil nitrogen (N) concentration versus soil organic carbon (SOC) concentration for: (a) the whole mineral soil (n = 45); (b) the litter layer (n = 9). Dashed 25:1 line added to provide a reference for the C:N ratio for the whole mineral soil.
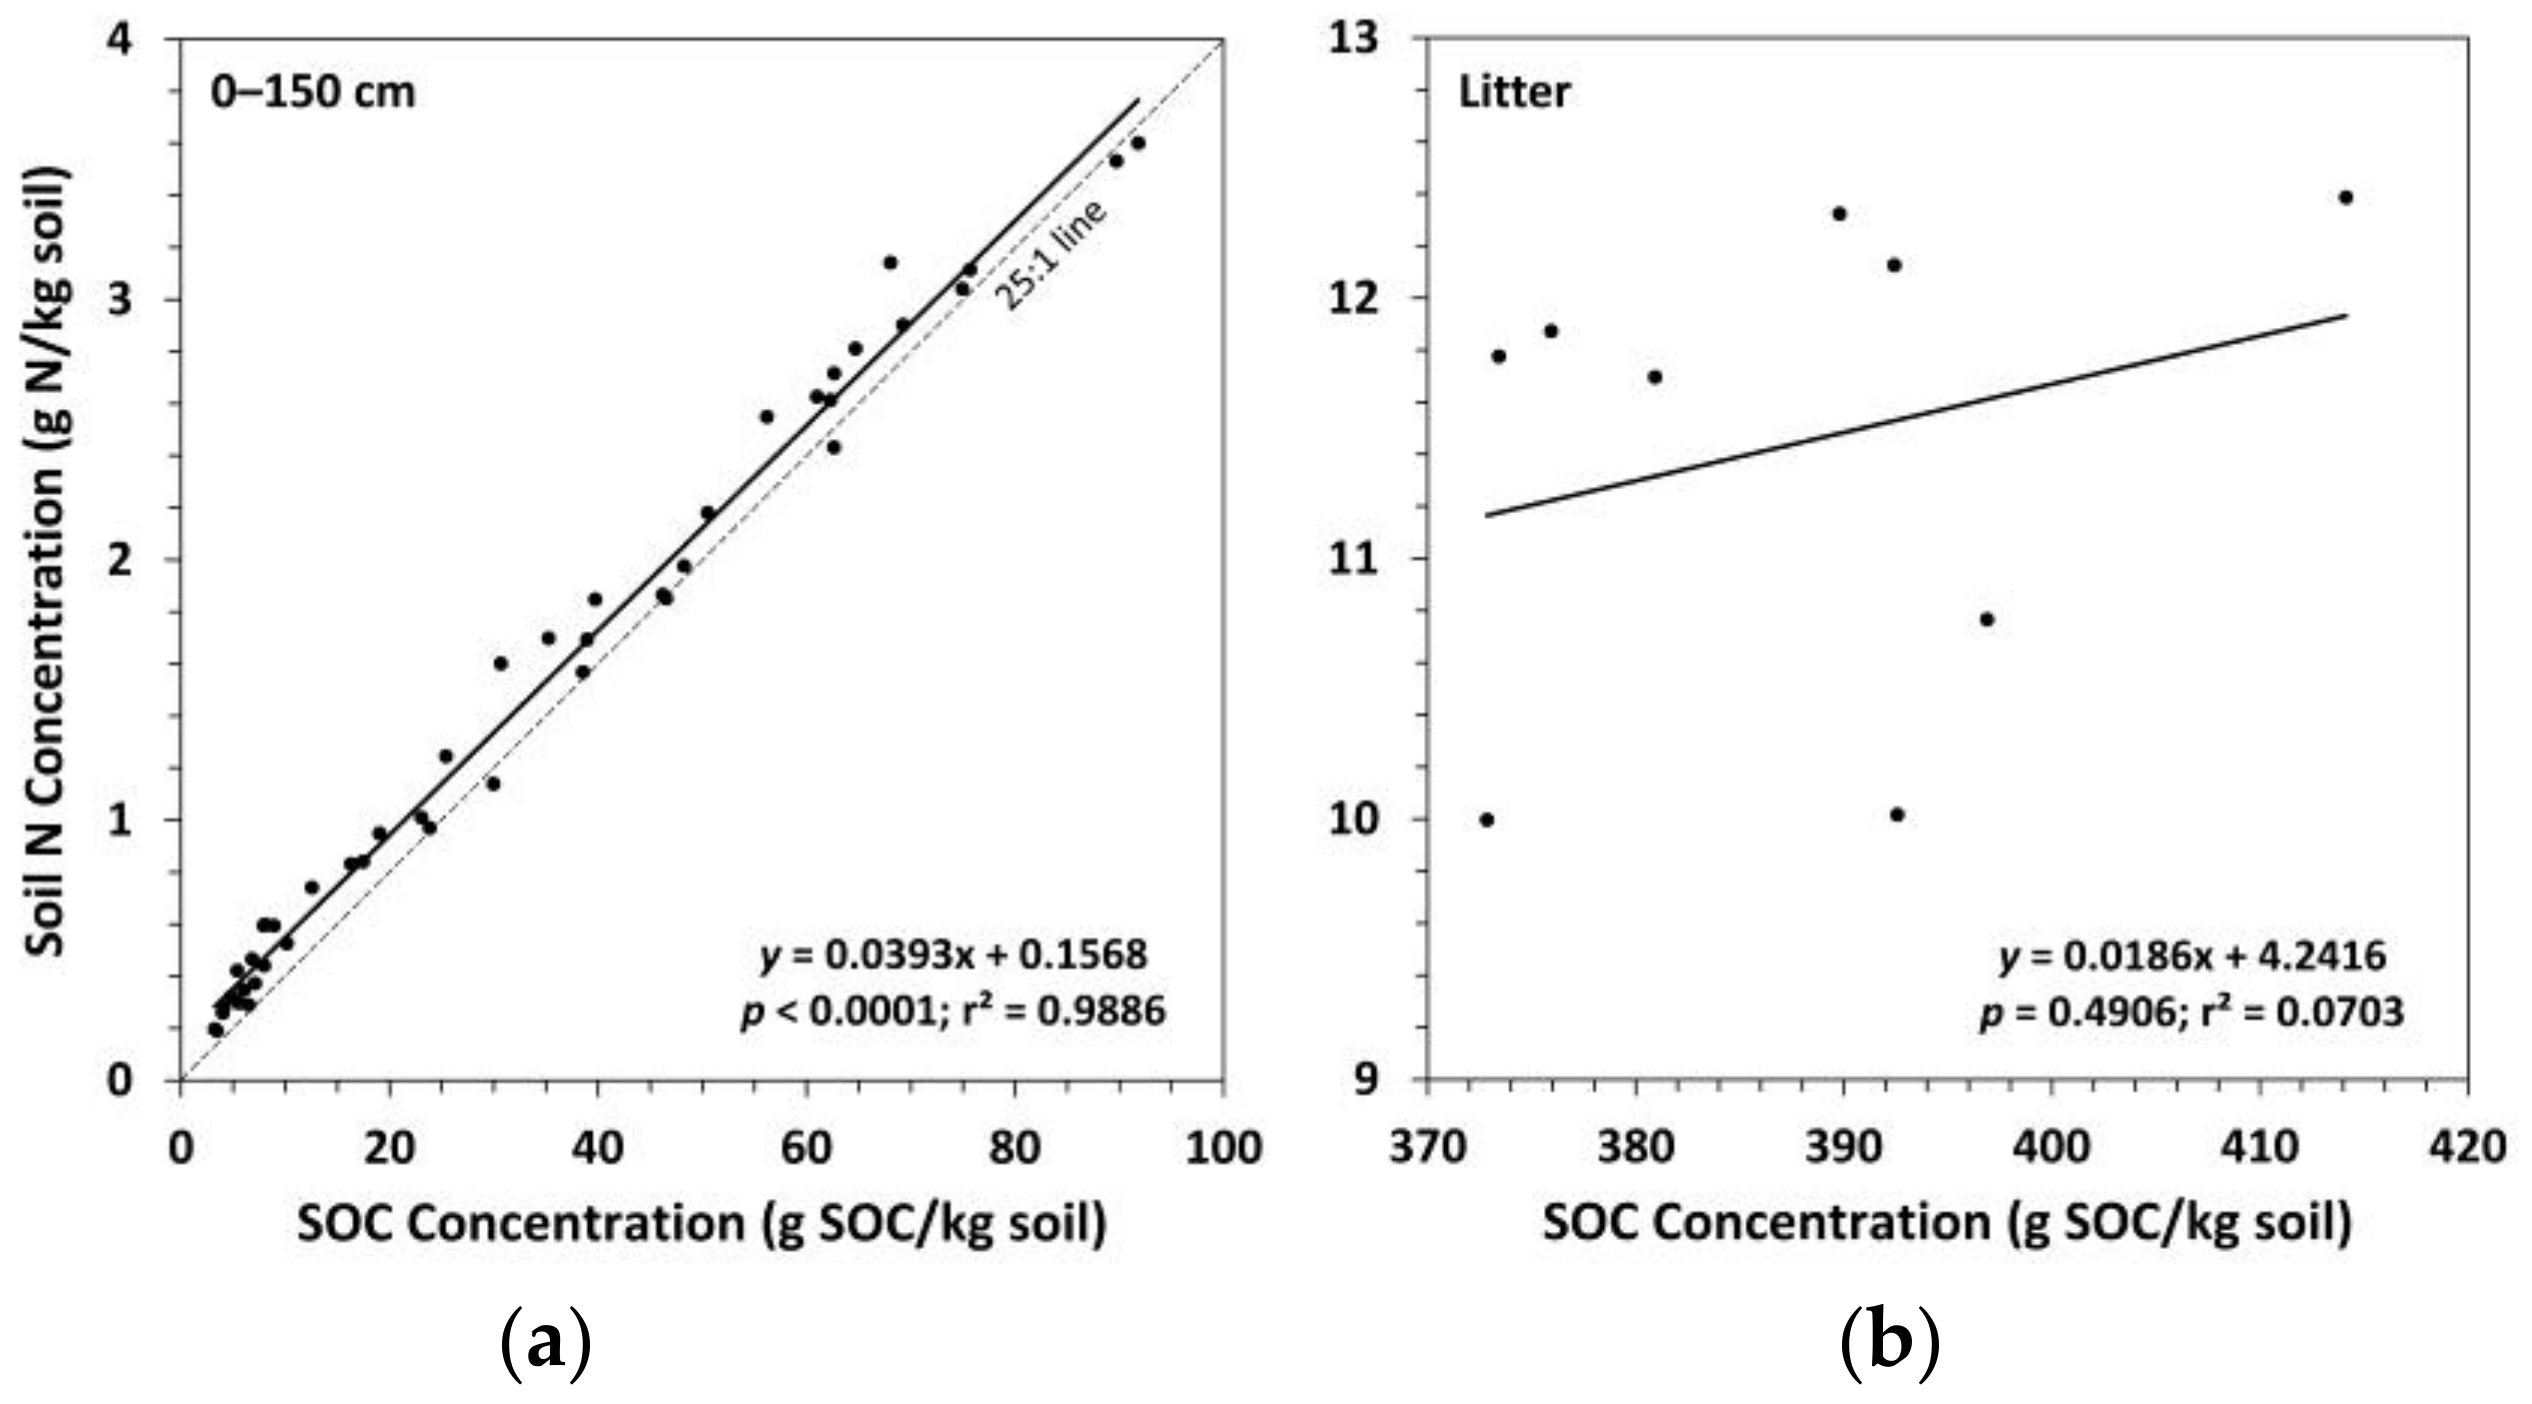
Figure 6.
Mean soil pH by treatment. Sample size for all treatments and soil depth layers is three. Error bars represent ± one standard error. Means within each soil depth layer accompanied by the same letter (i.e., “a” or “b”) are not significantly different (Tukey’s HSD, α = 0.1). Fert, fertilized.

Figure 7.
Mean soil organic carbon (SOC) and nitrogen (N) stocks by treatment calculated using the fixed-depth approach (Equations (2) and (3)). (a) Mean SOC stock by soil depth layer; (b) mean soil N stock by soil depth layer; (c) cumulative mean SOC stock; (d) cumulative mean soil N stock. Sample size for all treatments and soil depth layers is three. Error bars represent ± one standard error. Means within each soil depth layer accompanied by the same letter (i.e., “a” or “b”) are not significantly different (Tukey’s HSD, α = 0.1). Fert, fertilized.

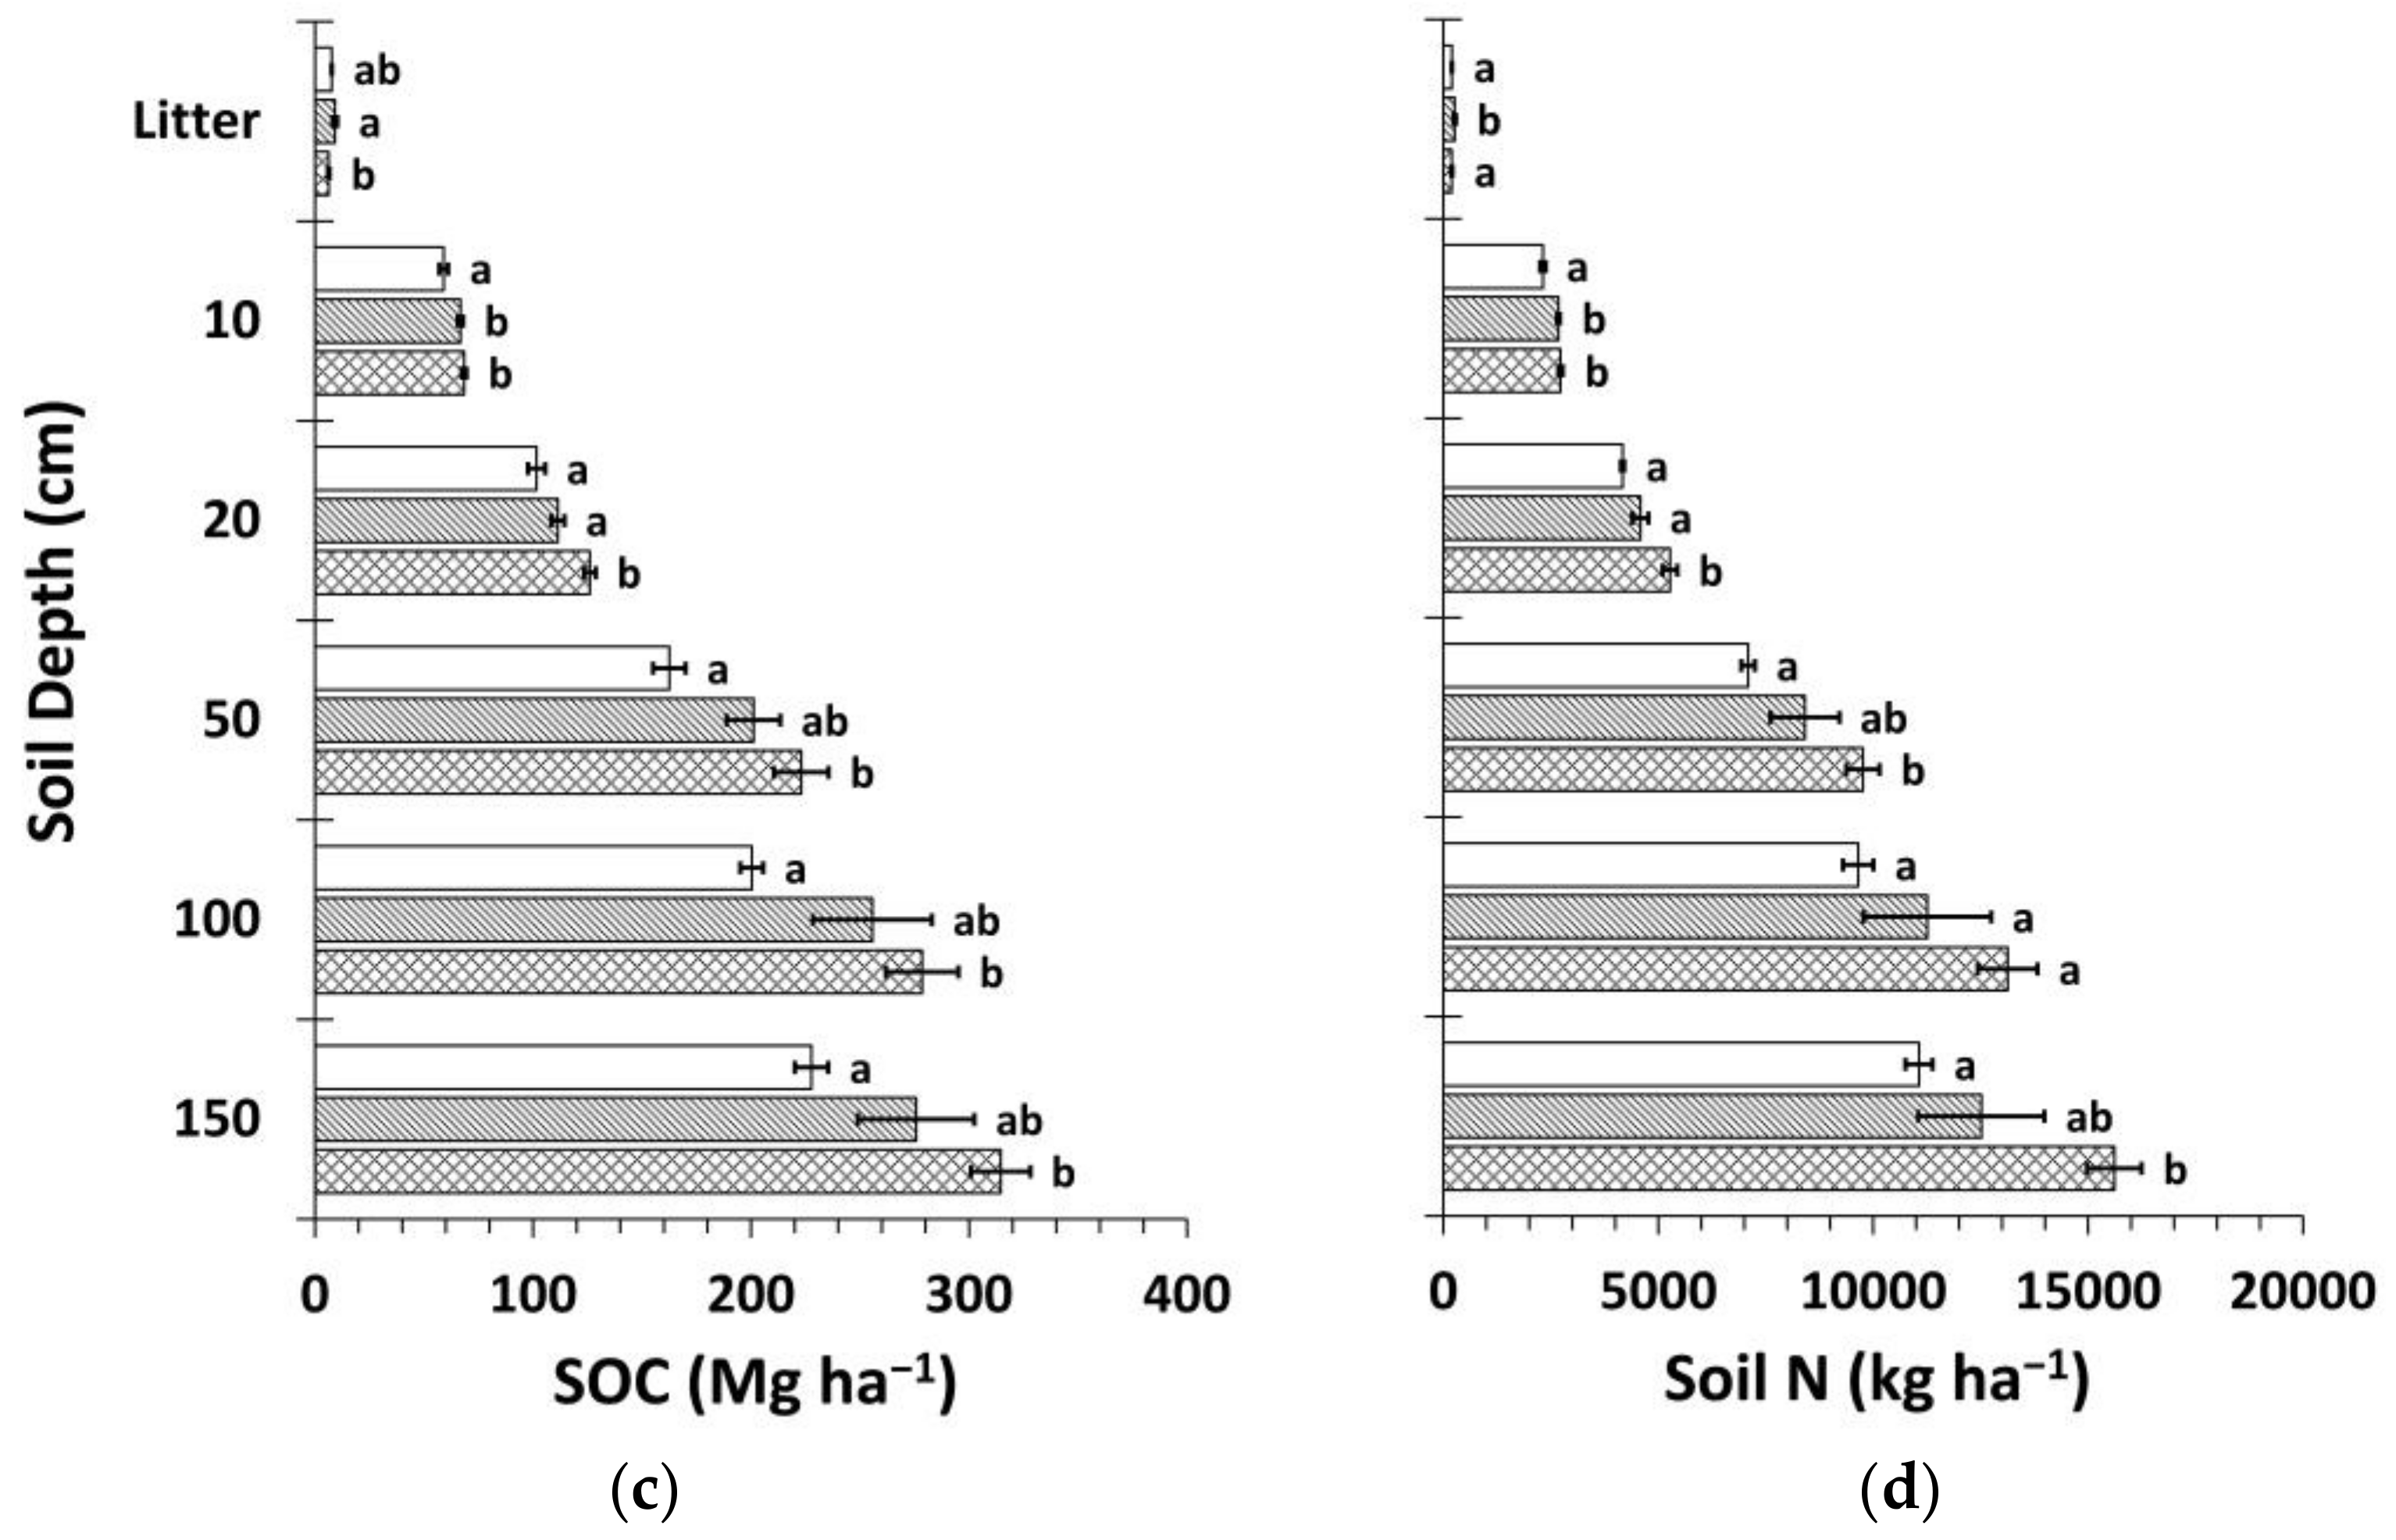
Figure 8.
Mean soil organic carbon (SOC) and nitrogen (N) stocks by treatment calculated using the mass-based approach (Equation (4) and web-accessible spreadsheet [59] created by Wendt and Hauser [58]). (a) Mean SOC stock by soil depth layer; (b) mean soil N stock by soil depth layer; (c) cumulative mean SOC stock; (d) cumulative mean soil N stock. Sample size for all treatments and soil depth layers is three. Error bars represent ± one standard error. Means within each soil depth layer accompanied by the same letter (i.e., “a” or “b”) are not significantly different (Tukey’s HSD, α = 0.1). Fert, fertilized.
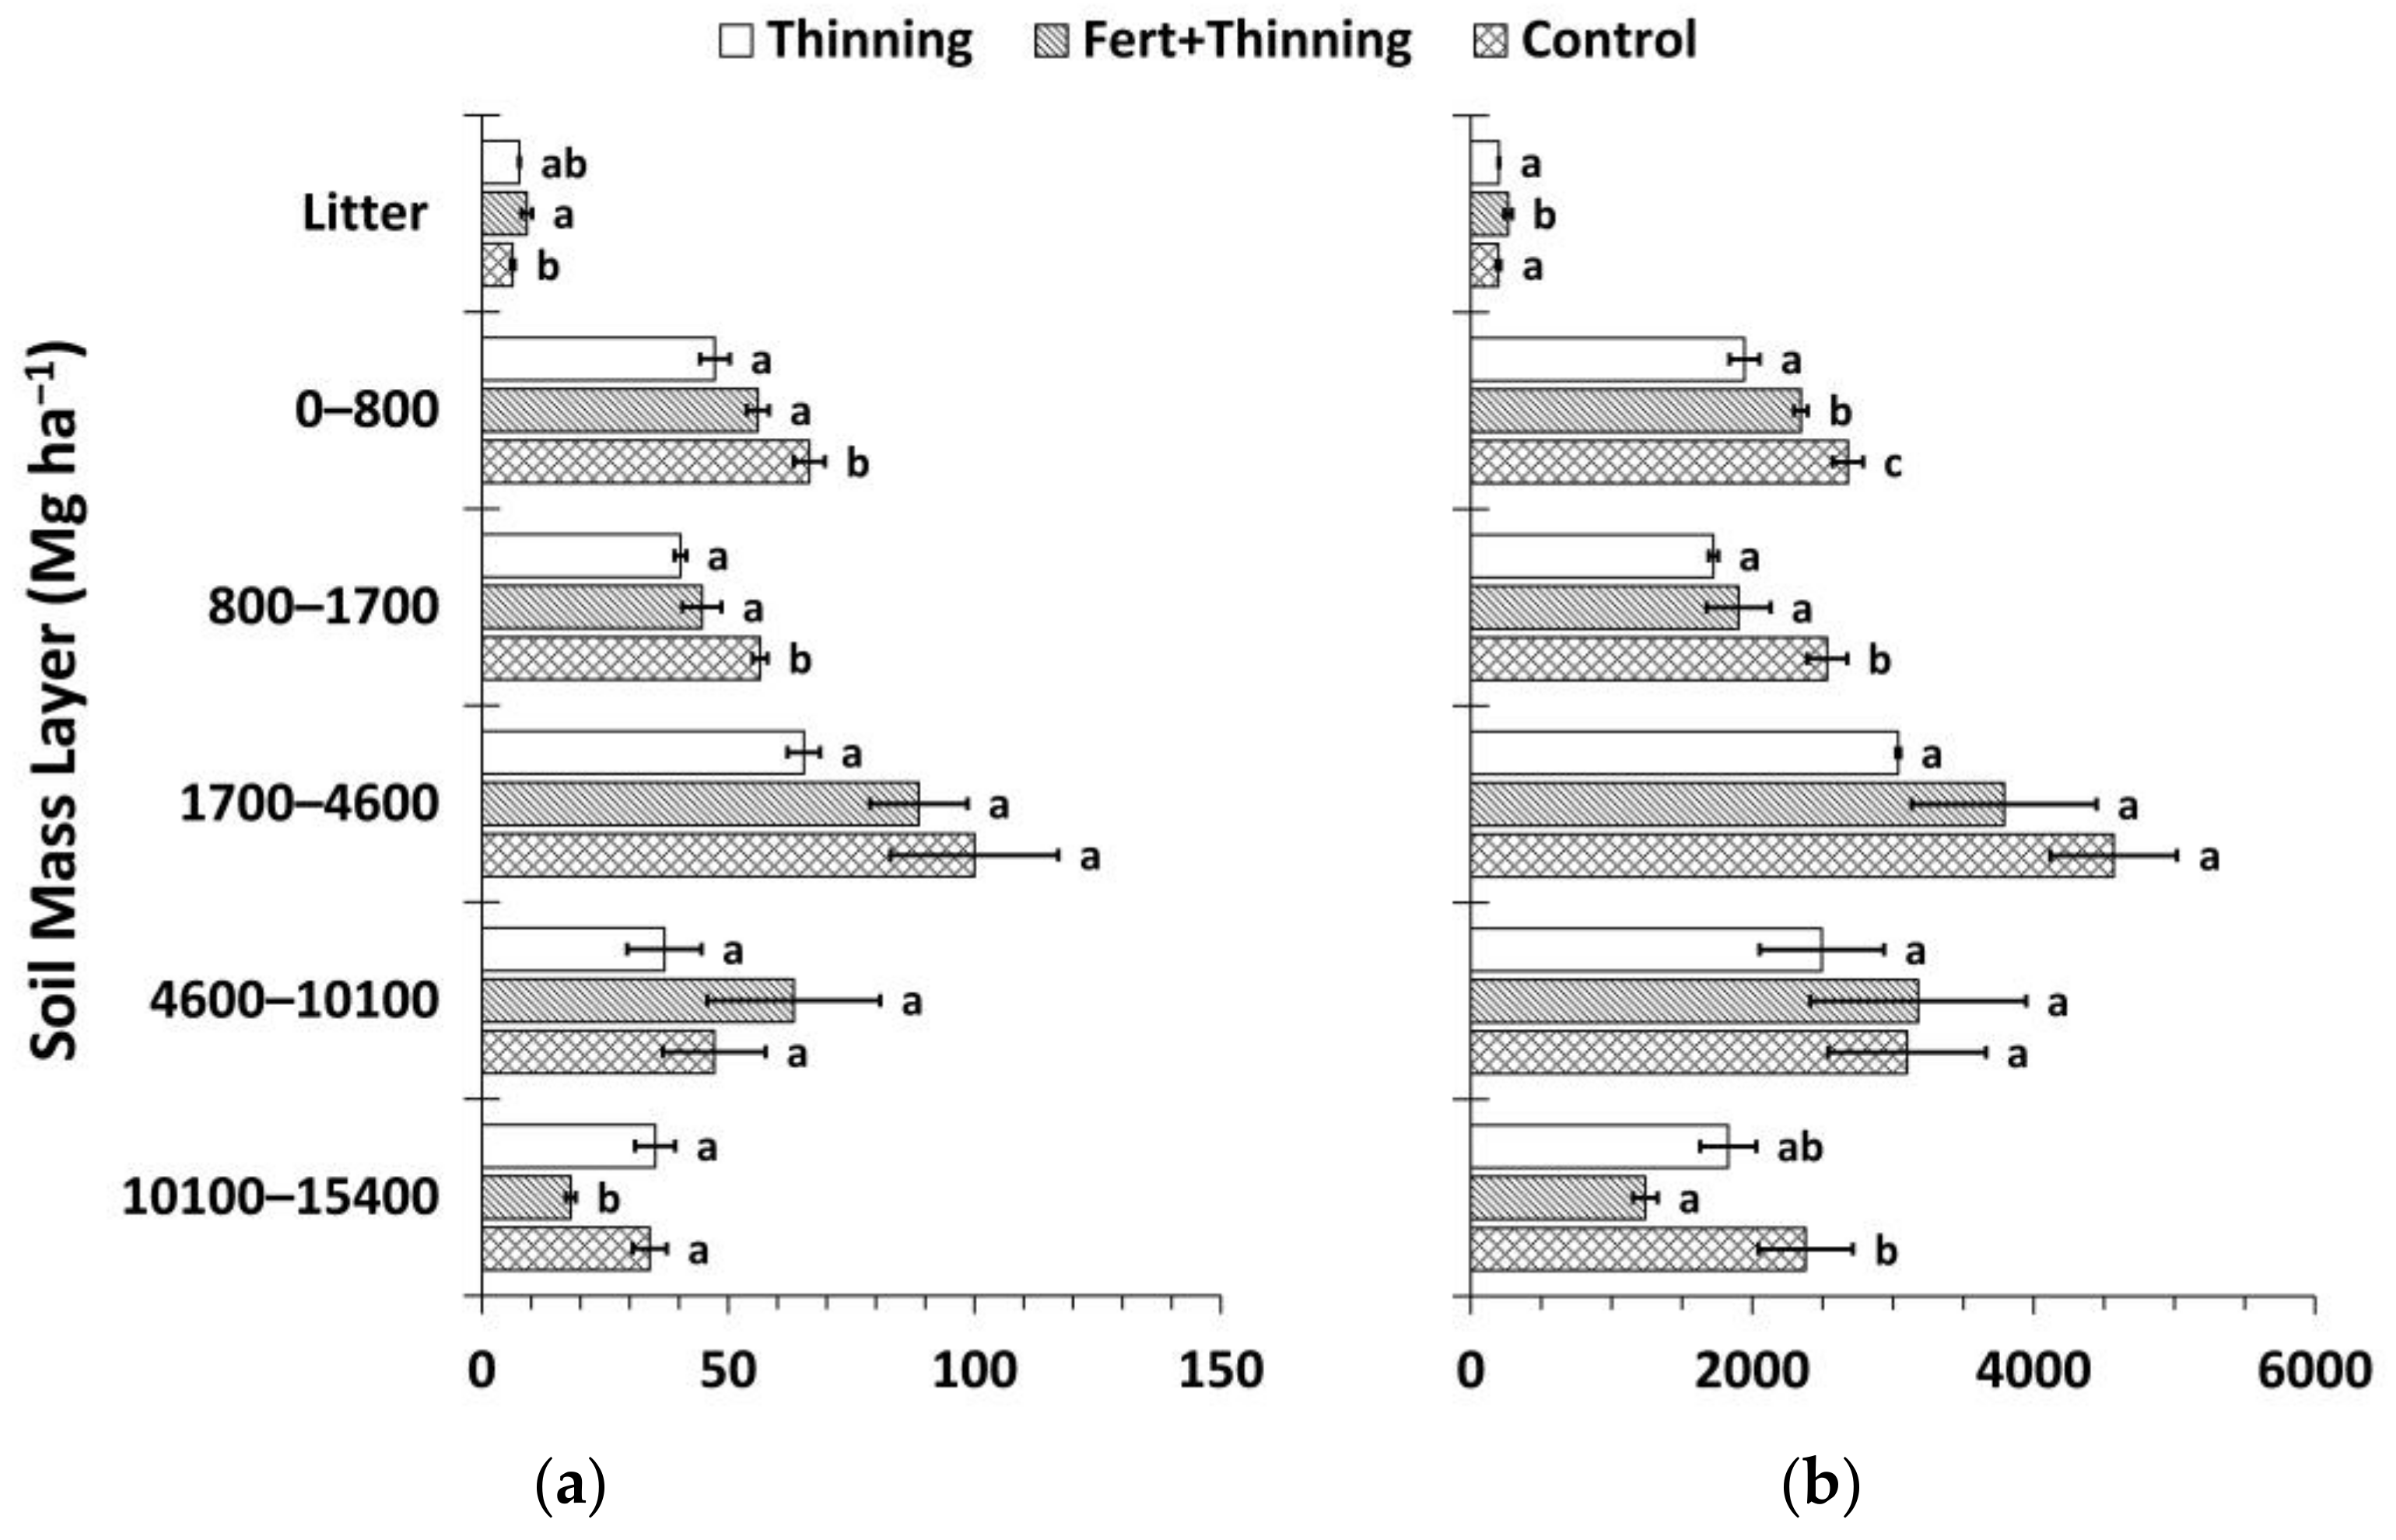

Figure 9.
Mean carbon (C) stocks by treatment. Total C stocks are the sum of above- and belowground C stocks, where aboveground and root C stocks include the biomass of thinned trees, and belowground C stocks are the sum of root C and soil organic C (calculated using the mass-based approach). Sample size for all treatment groups and categories is three. Error bars represent ± one standard error. Means within each category accompanied by the same letter (i.e., “a” or “b”) are not significantly different (Tukey’s HSD, α = 0.1). Fert, fertilized.


Table 1.
Summary of plot treatments. The plantation was planted in 1977 with 2-year-old Douglas-fir seedlings. Plots are each 0.2-ha and span a total area of ~5 ha. Fert, fertilized.
Table 1.
Summary of plot treatments. The plantation was planted in 1977 with 2-year-old Douglas-fir seedlings. Plots are each 0.2-ha and span a total area of ~5 ha. Fert, fertilized.
| Plot | Initial Trees (ha−1) | Treatment Group | Fertilized § | Thinning Treatment | Thinning Year | Stems Left on Forest Floor # |
|---|---|---|---|---|---|---|
| 1 | 1117 | Thinning | No | RD55→RD35 | 2001 | Yes |
| 2 | 297 † | Control | No | None | - | - |
| 3 | 558 ‡ | Thinning | No | RD55→RD35 | 2011 | No |
| 4 | 1181 | Thinning | No | RD55→RD35 | 1999 | Yes |
| 5 | 1196 | Control | No | None | - | - |
| 8 | 554 ‡ | Control | No | None | - | - |
| 10 | 1240 | Fert + Thinning | Yes | RD55→RD35 | 1997 | Yes |
| RD55→RD40 | 2005 | No | ||||
| 11 | 558 ‡ | Fert + Thinning | Yes | RD55→RD35 | 2009 | No |
| 12 | 311 † | Fert + Thinning | Yes | None | - | - |
† initial trees per hectare were reduced to one-fourth in 1989; stems and slash left on forest floor. ‡ initial trees per hectare were reduced to one-half in 1989; stems and slash left on forest floor. § fertilized plots received 224 kg N ha−1 as urea every four years starting in 1989 for a total of 1120 kg N ha−1 over 16 years. RD = Curtis’s [49] relative density. # slash consistently left on forest floor, even when tree stems were removed.
Table 2.
Typical soil profile description. Resembles Cumley series (a Palehumult). Average slope of 10%. Mean elevation ~640 m above sea level. Gr, gravel (0.2–7.5 cm); Cb, cobbles (7.5–25 cm); St, stones (>25 cm); YR, yellow-red.
Table 2.
Typical soil profile description. Resembles Cumley series (a Palehumult). Average slope of 10%. Mean elevation ~640 m above sea level. Gr, gravel (0.2–7.5 cm); Cb, cobbles (7.5–25 cm); St, stones (>25 cm); YR, yellow-red.
| Horizons | Depth (cm) | Color (moist) | Texture | Structure | Roots | Rock (%) |
|---|---|---|---|---|---|---|
| Oi | 3.5–0 | Gr < 2% | ||||
| Cb < 5% | ||||||
| St < 5% | ||||||
| A | 0–15 | 10 YR 3/3 dark brown | Sandy clay loam | Medium to coarse granular, weak to moderate | Many fine, medium, and coarse | Gr < 2% |
| Cb < 5% | ||||||
| St < 5% | ||||||
| BA | 15–30 | 10YR 3/4 dark yellowish brown | Sandy clay | Medium to coarse subangular blocky, moderate | Many fine and medium; few coarse | Gr < 2% |
| Cb < 5% | ||||||
| St < 5% | ||||||
| Bt1 | 30–80 | 5YR 4/4 reddish brown | Sandy clay to clay | Coarse to very coarse subangular blocky, moderate to strong | Common fine, few medium; very few coarse | Gr < 2% |
| Cb < 5% | ||||||
| St < 5% | ||||||
| Bt2 | 80–150+ | 10YR 4/4 dark yellowish brown | Sandy clay | Coarse subangular blocky, moderate | Few fine and medium; very few coarse | Gr < 2% |
| Cb < 5% | ||||||
| St < 5% |
© 2018 by the authors. Licensee MDPI, Basel, Switzerland. This article is an open access article distributed under the terms and conditions of the Creative Commons Attribution (CC BY) license (http://creativecommons.org/licenses/by/4.0/).
Share and Cite
MDPI and ACS Style
Gross, C.D.; James, J.N.; Turnblom, E.C.; Harrison, R.B. Thinning Treatments Reduce Deep Soil Carbon and Nitrogen Stocks in a Coastal Pacific Northwest Forest. Forests 2018, 9, 238. https://doi.org/10.3390/f9050238
AMA Style
Gross CD, James JN, Turnblom EC, Harrison RB. Thinning Treatments Reduce Deep Soil Carbon and Nitrogen Stocks in a Coastal Pacific Northwest Forest. Forests. 2018; 9(5):238. https://doi.org/10.3390/f9050238
Chicago/Turabian StyleGross, Cole D., Jason N. James, Eric C. Turnblom, and Robert B. Harrison. 2018. "Thinning Treatments Reduce Deep Soil Carbon and Nitrogen Stocks in a Coastal Pacific Northwest Forest" Forests 9, no. 5: 238. https://doi.org/10.3390/f9050238
Note that from the first issue of 2016, this journal uses article numbers instead of page numbers. See further details here.