Article

Fine Scale Determinants of Soil Litter Fauna on a Mediterranean Mixed Oak Forest Invaded by the Exotic Soil-Borne Pathogen Phytophthora cinnamomi

by
Alejandro Jiménez-Chacón
1,
Pablo Homet
2,
Luis Matías
2,3,
Lorena Gómez-Aparicio
2 and
Oscar Godoy
2,*
1
Advanced Biology Research and Application, Edificio Verde, Universidad de Sevilla, Calle Profesor García González s/n, 41012 Sevilla, Spain
2
Instituto de Recursos Naturales y Agrobiología de Sevilla, Consejo Superior de Investigaciones Científicas (IRNAS-CSIC), Avenida Reina Mercedes, 10, 41012 Sevilla, Spain
3
Departamento de Biología Animal, Biología Vegetal y Ecología, Facultad de Ciencias Experimentales, Universidad de Jaén, Campus Las Lagunillas SN, 23009 Jaén, Spain
*
Author to whom correspondence should be addressed.
Forests 2018, 9(4), 218; https://doi.org/10.3390/f9040218
Submission received: 24 February 2018 / Revised: 16 April 2018 / Accepted: 17 April 2018 / Published: 19 April 2018
(This article belongs to the Special Issue Ecology and Management of Invasive Species in Forest Ecosystems)

Abstract

:
There is growing recognition of the importance of soil fauna for modulating nutrient cycling processes such as litter decomposition. However, little is known about the drivers promoting changes in soil fauna abundance on a local scale. We explored this gap of knowledge in a mixed oak forest of Southern Spain, which is under decline due to the invasion of the exotic soil-borne pathogen Phytophthora cinnamomi. Meso-invertebrate abundance found in soil litter was estimated at the suborder level. We then explored their statistical correlations with respect to light availability, tree and litter characteristics, and P. cinnamomi abundance. Oribatida and Entomobryomporpha were the most abundant groups of Acari and Collembola, respectively. According to their trophic level, predator and detritivore abundances were positively correlated while detritivores were, in turn, positively correlated with pathogen abundance and negatively influenced by light availability and tree defoliation. These overall trends differed between groups. Among detritivores, Diplopoda preferred highly decomposed litter while Oribatida and Psocoptera preferred darker environments and Poduromorpha were selected for environments with lower tree defoliation. Our results show the predominant role of light availability in influencing litter fauna abundances at local scales and suggest that the invasive soil-borne pathogen P. cinnamomi is integrated in these complex relationships.

1. Introduction

There is growing recognition that soil fauna plays a major role in litter decomposition [1,2]. The way soil fauna mediates litter decomposition involves several simultaneous processes. As soon as leaf litter falls from trees, invertebrate detritivores start feeding and breaking litter down into small pieces. This fragmentation process increases the litter surface area by accelerating the inoculation and activity of bacteria and fungi that transform these smaller pieces into inorganic molecules such as phosphate, water, carbon dioxide, or ammonium [3,4,5]. Parallel to this herbivory process, soil litter contains different groups of predators by controlling the abundance of these invertebrate detritivores through a diverse range of feeding strategies [6]. These multi-trophic interactions result in complex processes that are responsible for creating soil fertility, maintaining soil health [7], and determining carbon budgets [8]. Despite the importance of soil fauna providing ecosystem services and economic profit [9,10,11] through their role in nutrient cycling, the drivers of soil fauna distribution and abundances at regional and local scales are still poorly understood [7]. Obtaining such knowledge is a critical first step in evaluating the contribution of soil fauna to forest functions and for making informed decisions in land forest management while preserving its biodiversity [12].
Mediterranean forests are relatively rich in soil litter fauna groups and the determinants of their abundances have been studied on a local scale. A recent experiment manipulating the amount of rainfall according to future climate change scenarios found that rainfall reduction influences the distribution and abundance of litter detritivores. Additionally, these invertebrates are less abundant in dry microsites [13]. However, forests are inherently complex ecosystems and a wide variety of factors besides precipitation can, in principle, generate different microhabitats by supporting different species and food webs. As previous knowledge of these relationships was relatively scarce, the first steps of research in this regard selected as many variables as possible. For instance, Reference [12] considered 125 potential drivers of soil invertebrate diversity at local scales within temperate forests in Poland. However, the possibility to evaluate such a high number of predictors is often limited in many cases, which calls for an alternative approach to come up with specific hypotheses in order to narrow the number of predictors down. Therefore, we devote the rest of the introduction to explain our main predictions of the abiotic and biotic determinants of soil litter invertebrate abundances within a Mediterranean mixed oak forest in Southern Spain, which is under decline due to the invasion of the exotic soil-borne pathogen Phytophthora cinnamomi [14] (see Figure 1).
Given that Mediterranean forests have a limited amount of rain throughout most of the year and that litter humidity strongly influences invertebrate diversity [12,13], it seems reasonable to start disentangling this complexity by studying those abiotic drivers leading to fine-scale variation in soil litter moisture. Light availability, which is heterogeneous in space and time in Mediterranean forests [15], can strongly reduce litter moisture [16]. It has also been shown that litter moisture suffers less fluctuations with litter depth and deeper layers retain higher levels of moisture for longer [17]. Several biotic drivers can simultaneously influence or be correlated with the depth of the litter layer. Tree size and their associated litter pools are the two most clearly biotic determinants of litter depth. Bigger trees are expected to create greater litter pools within the tree neighborhood as well as create deeper litter layers. Finally, mixed litter coming from different tree species at different decomposition stages increases the availability of different soil litter fauna niches [13].
Most forests within the Mediterranean basin are far from pristine due to their history of human use. In particular, they are affected by the unintentional introduction of exotic pests and pathogens, which can fundamentally change the forest composition and structure [18,19]. Exotic soil-borne pathogens, for example, are behind some of the most aggressive plant diseases on earth, which cause severe damages in plant tissues and eventually lead to the death of whole individuals [14,20,21,22]. Such negative effects directly influence the biotic determinants of soil litter fauna through changes in the litter fall amount and chemistry and indirectly influence the biotic determinants of soil litter fauna by modifying physical factors such as temperature, soil moisture, and light interception [23,24,25,26]. Which drivers are more strongly modified by soil-borne pathogens and by the particular effect of P. cinnamomi depends on the stage of the tree disease. At earlier stages, tree defoliation increases litter fall and soil litter pools. As a result of this initial defoliation, litter layers tend to be deeper and soils receive higher pulses of organic matter, but, as the disease progresses, defoliated trees contribute less to the litter pools and lead to an increase in light availability. This in turn can raise soil temperature and reduce litter humidity.
The main aim of our study is to understand the abiotic and biotic determinants of fine scale distribution and the abundances of soil fauna associated with forest litter within a forest decline context. To reach this goal, we conducted an observational study in the Alcornocales Natural Park (Southern Spain). This park contains the largest and best conserved forests of cork oak (Quercus suber) in Europe. However, since the early 1990s, a severe decline affecting the Quercus species has been reported in the park and throughout the Mediterranean Basin largely due to the exotic soil-borne pathogen Phytophthora cinnamomi Rands [27,28,29,30]. The introduction and spread of this pathogen from its native range in the New Guinea-Celebes region is presumed to be due to human activity and now it is considered a major ecological and economic problem [31,32,33]. The P. cinnamomi disease causes a series of symptoms ranging from progressive defoliation and loss of vigor to death [34]. Its dispersal is strongly determined by soil water availability [35]. Moreover, prior work within an area close to this study has shown that the pathogen has the potential to attain high densities at local scales [14].
We specifically conducted a structural equation modeling approach to determine which abiotic and biotic drivers determine the observed variation in the abundance of soil fauna invertebrates found in forest litter and the differences between major trophic groups (detritivores versus predators [11]). The final model selected goodness of fit requirements that departed from our theoretical expectations of the direct and indirect paths by which abiotic and biotic forest drivers modify litter mesofauna abundances (see Figure 1). Complementarily, we also conducted multivariate analyses to explore the major axes of local environmental variation separating differences in abundances within the major groups of detritivores and predators.

2. Material and Methods
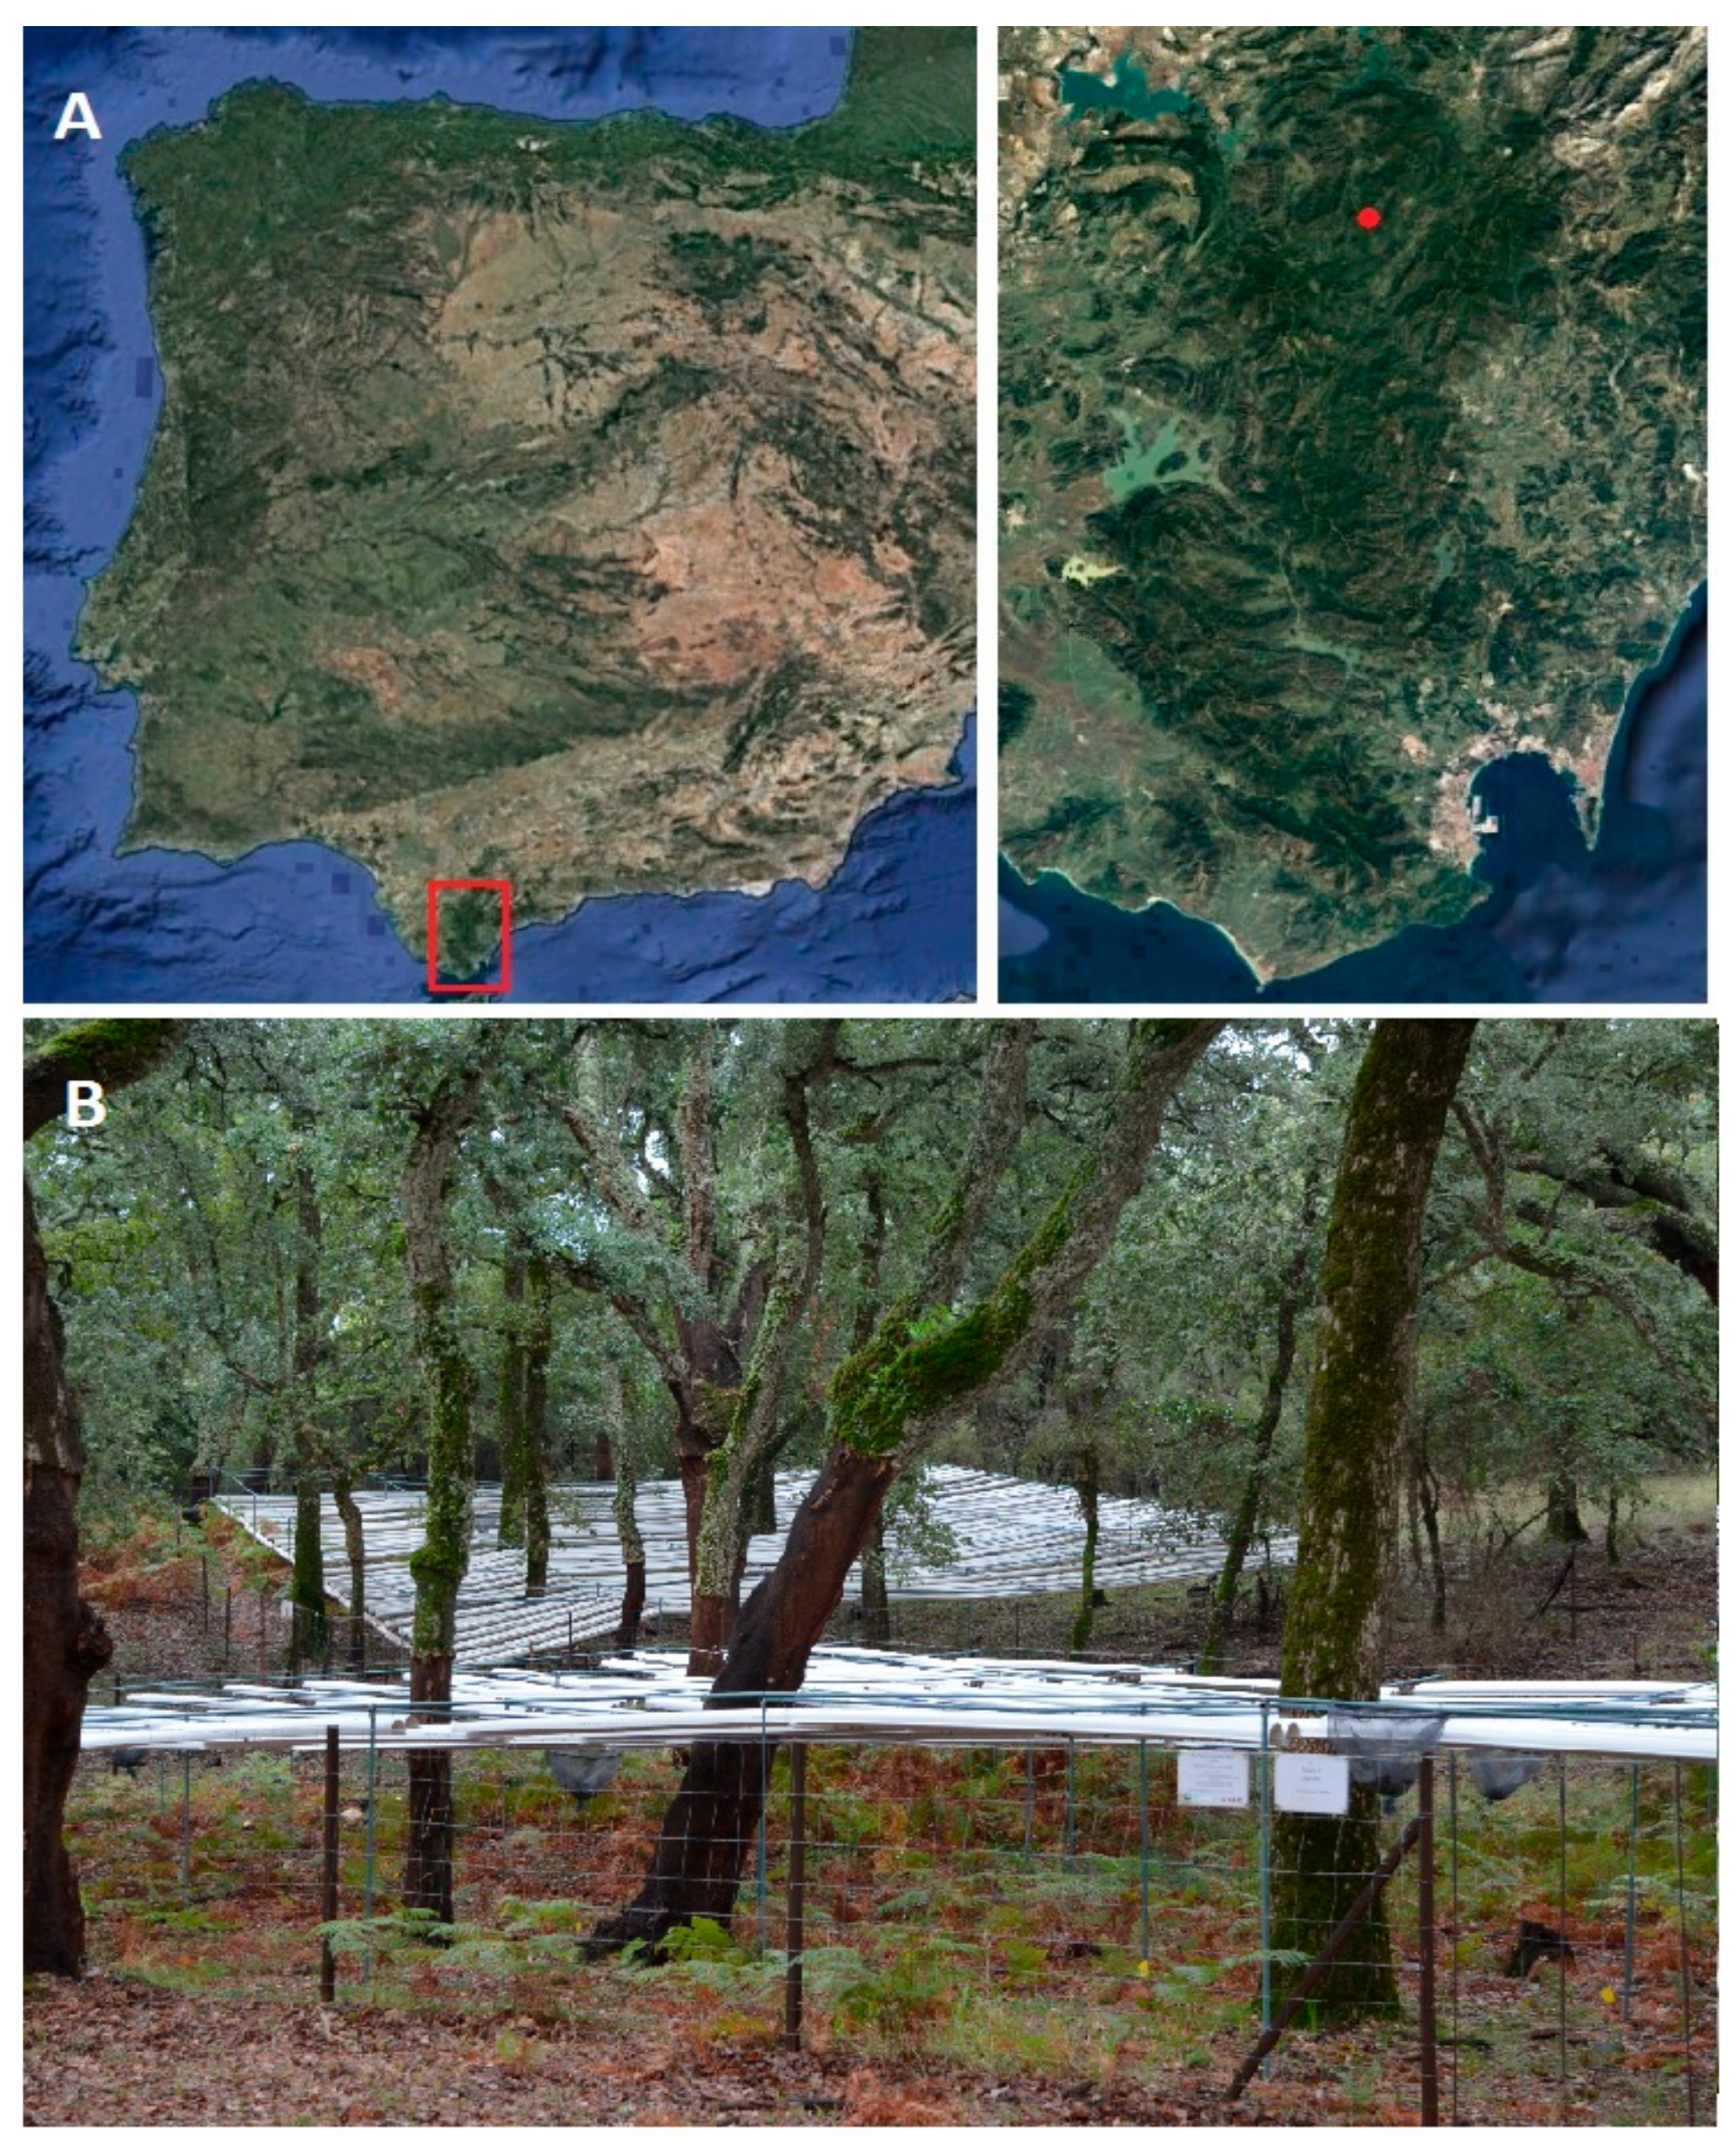
2.1. Study Site

The study was conducted in the Alcornocales Natural Park (see Figure 1), which is a hotspot of biodiversity in Southern Spain [36]. The climate is sub humid Mediterranean. The annual mean temperature is 16.3 °C and the annual mean precipitation is 748 mm (50-year average, Instituto Andaluz de Investigación y Formación Agraria, Pesquera, Alimentaria y de la Producción Ecológica. (IFAPA)). Ninety-five percent of precipitation occurs from October to May. Soils are sandy, acidic, and nutrient-poor. The soils are also derived from bedrock dominated by Oligo-Miocene sandstones. The area of our study is a mixed forest where Q. suber coexists with the deciduous shade-tolerant Q. canariensis. A closed canopy characterizes this forest with little understory shrub vegetation composed of isolated individuals of Erica ssp.

2.2. Experimental Setup

This observational study was conducted within the frame of a recently built long-term research infrastructure and was aimed at evaluating the combined effect of climate change and the exotic soil-borne pathogen P. cinnamomi on forest dynamics and functioning. In more detail, we established six plots of 20 m × 15 m at Gamir (Cádiz, Spain, 36°34′07.5′′ N 5°32′08.3′′ W) during early spring 2016 (see Figure 2A). These plots were specifically built to reduce the amount of rainfall by 30%. This percentage corresponds to the average reduction of rainfall according to a restrictive future climate change scenario for Southern Spain (model CMIP5 (Coupled Model Intercomparison Project Phase 5) for the scenario RCP (Representative Concentration Pathways) 8.5 for the period of 2081–2100 in comparison with the period of 1986–2005, [37]). Three of these plots had a structure of rain exclusion while the other three were assigned to control (see Figure 2B). The rainfall exclusion treatment was formed by a metal structure supporting plastic Polyvinyl chloride (PVC) gutters that covered 30% of the plot area in order to exclude a similar amount of natural precipitation [38]. On the control plots, identical gutters were placed upside down to ensure that the albedo and the understory microclimate was as similar as possible in both treatments following previous experiences with this type of rainfall exclusion infrastructure [39]. For both types of plots, we also considered an edge effect of 1 m in which no measurements were taken of the tree standing at the edge [38]. Finally, all plots were selected to have similar conditions in terms of slope, aspect, and number of trees. We decided to perform our experiment within this research infrastructure for two main reasons. First, the rainfall structure treatment has the potential to create differences in litter humidity between treatment plots and control plots. Second, we have readily available information of spatial variation at local scales of several abiotic and biotic variables that could influence litter mesofauna abundances, which was explained in the introduction (see Figure 1).

2.3. Collection of Soil Fauna Invertebrates and Characterization of Litter Properties

We collected litter samples from the forest floor in early March 2017 in order to capture the largest amount of litter at the end of the leaf shedding process in Q. canariensis. Litter samples were collected directly from the ground and underneath the canopy of individual trees in order to relate mesofauna abundances to the micro-environmental conditions associated with each tree. We selected three to four trees of Q. canariensis per plot with a total of 22 trees. Some of these trees had no symptoms of P. cinnamomi infection while others showed minor to moderate leaf defoliation. We defined the forest litter as any type of organic material coming directly from tree individuals that were not decomposed and showed partial signs of decomposition. This definition includes both leaf and wood material. Following this definition, we collected all organic material under the canopy of each tree within an area of 20 cm × 20 cm from the top of the litter layer down to the top of the mineral soil layer. At the time of collection, we estimated litter depth as the average value of three measurements using a ruler. Litter samples were stored in hermetic plastic bags and put in a cooler with ice for transporting to the lab in order to minimize water and mesofauna losses.
Immediately after litter samples were brought to the lab, we weighed the litter sample and then used the Tullgren funnel method [39] over the next 10 days to obtain mesofauna associated with fresh litter. We dried an aliquot of the initial fresh litter sample at 40 °C over three days. Then, the dried aliquot was weighed to estimate the percentage of water in the sample. With the dry litter, we estimated the proportion of the total sample in terms of weight belonging to different tree species and to different decomposition stages. For the classification according to different tree species, we distinguished between three categories including litter coming from Q. suber, Q. canariensis, and other tree species. For the classification according to the litter decomposition stage, we separated each litter sample into three different categories. Level 1 involved low decomposition in which litter leaves were undamaged or unbroken. Level 2 included medium decomposition in which litter leaves were broken in smaller pieces, and level 3 consisted of high decomposition in which litter leaves were broken in very small pieces and it was impossible to distinguish parts of litter leaves in the sample.
Arthropods were stored in 70% ethanol and separated in different groups with a binocular scope. We focused on several groups of mesofauna found in the litter samples. Specifically, these groups were Acari (separated in three different suborders: Oribatida, Mesostigmata, and Prostigmata), Collembola (separated in four different morphological groups: Sympleona, Entomobryomorpha, Poduromorpha and Neelipleona), Araneae, Pseudoscorpionida, Isopoda, Thysanoptera, Myriapoda, Lepidoptero, Psocoptera, and Diptera. In the last step of the analysis, we assigned each group a trophic role involving either detritivores or predators, according to previous studies [6,13,40,41,42] (see Figure 3). Diptera were classified as detritivores since all individuals found were larvae. Likewise, Myriapoda individuals were classified as detritivores since they belong to Diplopoda. Enchytraeidae individuals were not included in the analyses because the method used to estimate mesofauna abundance (i.e., a dry extraction) does not serve well for an accurate estimation of individual abundances of this particular group. Finally, our expertise did not allow us to estimate Astigmata abundances separate from Oribatida abundances. Astigmata mature individuals are very similar in their morphology to immature individuals of Oribatida. They have been classified together in the recent past. We acknowledge that this is a limitation of our study when addressing the determinants of different group of detritivores. However, we believe this is a minor limitation since Astigmata tends to be much less frequent than Oribatida [43]. In addition, both groups are detritivores, which means that this misclassification does not alter the total estimates of detritivore versus predator abundances in our samples.

2.4. Characterization of Fine-Scale Variation in Abiotic and Biotic Determinants of Soil Fauna under Field Conditions

At the time of litter collection, we measured several abiotic and biotic micro-environmental conditions in the field in order to explore the determinants of the soil litter fauna composition and abundance at local scales (see Table 1). Soil humidity in the top 10 cm of the soil was measured with a PR2 Profile Probe (Delta-T Devices Ltd., Cambridge, UK). Light availability was measured by hemispherical photography [44]. Photographs were taken at ground level using a horizontally levelled digital camera (Nikon, Tokyo, Japan) and aimed at the zenith by using a fish-eye lens of a 180° field of view (FCE8, Nikon, Tokyo, Japan). The images were analyzed using Hemiview software (1999, delta-T Devices, Cambridge, UK) to calculate the global site factor (GSF), which integrates the total amount of light over the whole year and ranges from 0 (light absence) to 1 (100% light availability).
Regarding the biotic microenvironment, we measured the size and degree of defoliation of the canopy tree right above each of the litter samples collected as well as the amount of P. cinnamomi in its soil. Tree size was quantified using the standard diameter at breast height (DBH) method using a measuring tape. Defoliation was visually characterized using a semi-quantitative scale ranging from 0 (no defoliation) to 3 (high defoliation). The abundance of the soil-borne pathogen P. cinnamomi was measured in soil aliquots of 10 g as described in Reference [30]. Briefly, we prepared soil suspensions in 100 mL of water-agar 0.2%. Afterward, aliquots of 1 mL taken from the soil suspensions were plated onto NARPH agar Petri dishes (20 dishes per sample). Colonies growing on the plates were morphologically identified and counted. Since soil samples had been dried previously, it was assumed that each colony resulted from the germination of at least one resistant spore (oospore or chlamydospore). Results were expressed as colony-forming units per gram of dry soil (CFU g−1). Finally, we measured soil respiration with an IRGA (Infrared gas analyzer, Li-6400XT, LI-COR Inc, Lincoln, NE, USA) on 10-cm pipe sections installed in the field [45].

2.5. Data Analysis

We first performed pairwise correlation to make sure that the environmental predictors selected were not highly correlated (Pearson-r > 0.8) (Figure A1 in Appendix A). Then we transformed several environmental variables for further analysis following standard procedures [13]. Specifically, we transformed light availability using arcsine square root transformation and log-transformed the soil density of P. cinnamomi, the invertebrate’s abundances, and litter mass. In addition, the matrix containing abundances for the different groups identified across all sites was squared-root transformed and then standardized using a Wisconsin double standardization following Reference [13].
To understand the direct and indirect effects of litter properties and environmental predictors on the abundance of the forest litter mesofauna, we conducted structural equation modeling (SEM) techniques by using the “lavaan” package [46]. From the initial path diagram built according to our a priori expectations (see Figure 1), we finally selected one that had an optimal fit according to several statistical indices recommended [47]. The set of indices selected to test the goodness of statistical fit were the root mean square error of approximation (RMSEA), the comparative fit index (CFI), and the standardized root mean square residual (SRMR). According to previous research [47,48], the criteria for selecting the best-fit model were the following: RMSEA < 0.05, CFI > 0.90, and SRMR < 0.10. If two models successfully accomplished these criteria, we selected the one that minimized towards zero RMSEA and SRMR values but maximized towards CFI values.
For the second set of statistical analyses, we were looking to explore the abiotic and biotic determinants of the composition of the detritivore and predatory mesofauna found in our litter samples. Accordingly, we performed non-metric multidimensional scaling (NMDS) analyses using the package “vegan” [49], which contain a version of Clarke and Ainsworth BIOENV analysis [50] that compares distance/similarity matrices with environmental variables for potentially explaining differences in soil litter fauna composition. To conduct the NMDS analysis, we first calculated distances between groups using the Bray-Curtis distance index, which ranges between 0 and 1 [51]. Afterward, we used the function “bioenv” to determine which abiotic and biotic drivers determine variation in litter mesofauna. Finally, we used the function “bvstep” to know which groups of soil litter mesofauna were more responsive to the selected environmental variables. We used a stress level ≤ 0.2 to account for the goodness of fit in the NMDS analysis. All statistical analyses were conducted with R software (R version 3.3.2, R Foundation for Statistical Computing, Vienna, Austria).

3. Results

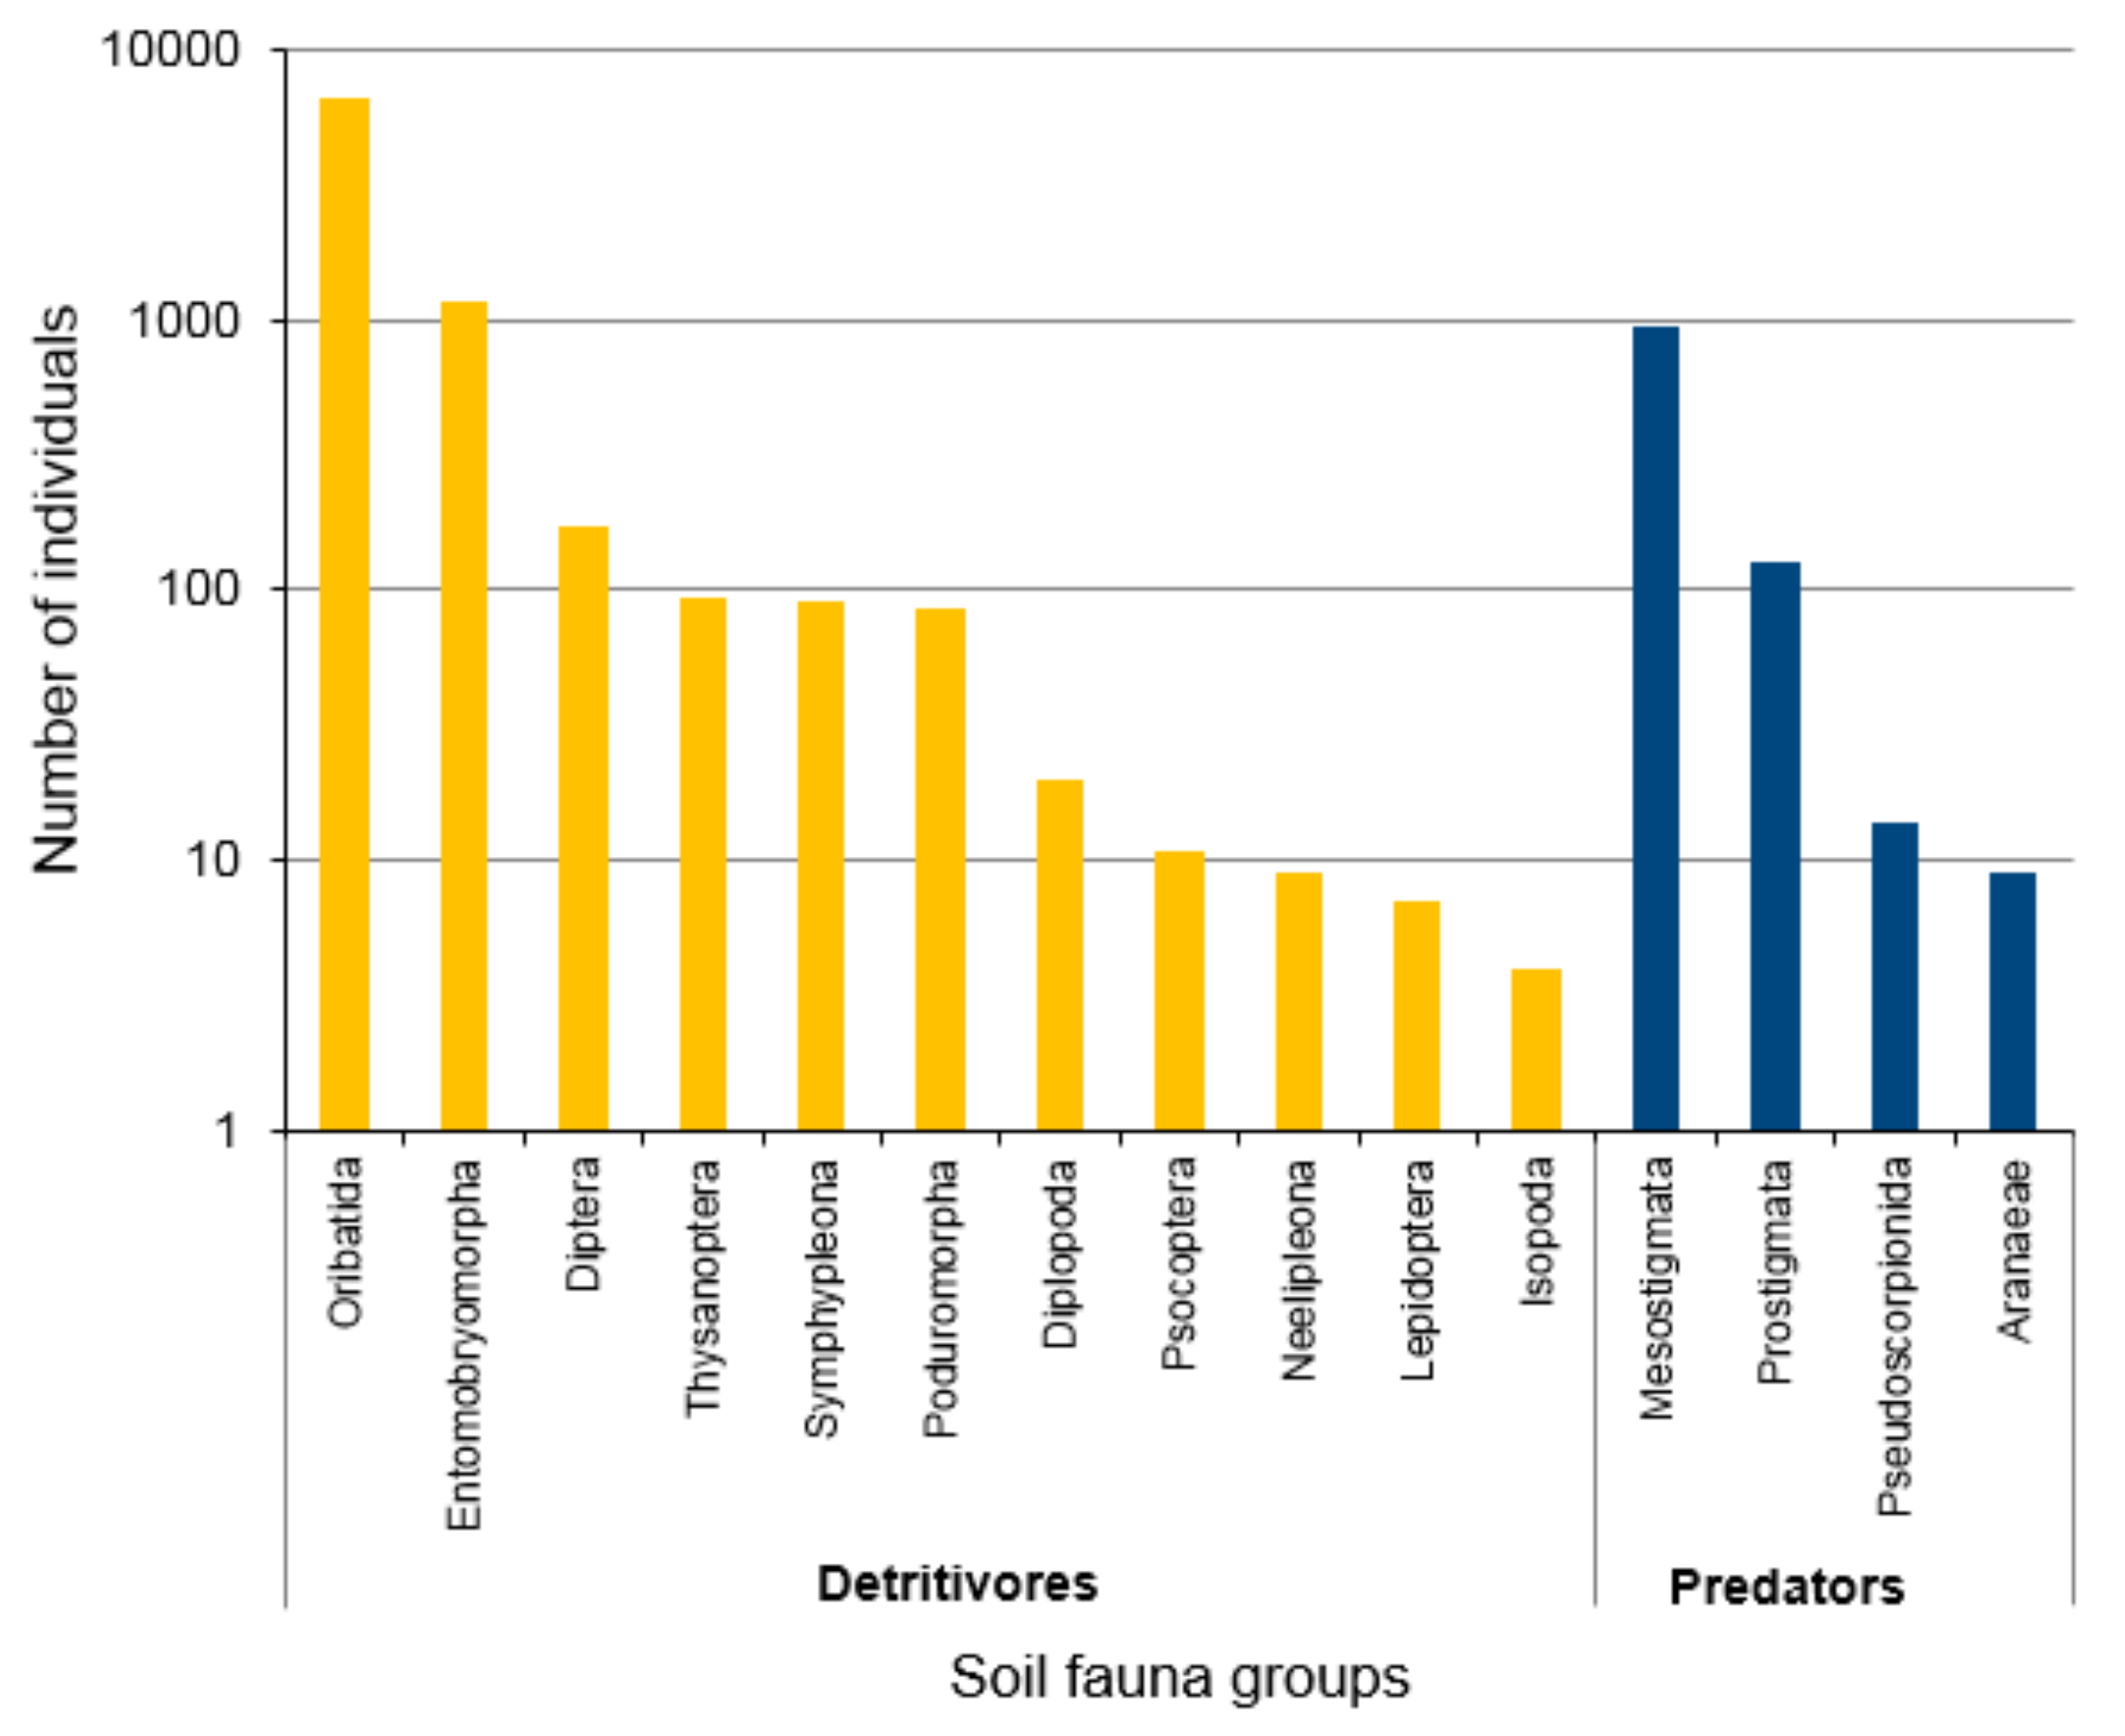
3.1. Abundance of Litter Mesofauna

We collected a total of 9324 arthropods in our litter samples. The most abundant group was Acari, which represented 81.81% of the total number of individuals collected, while Collembola represented only 14.63%. Among mites, Oribatida (detritivores) was the most common group, followed by Mesostigmata and Prostigmata (predators). Entomobryomorpha was the most frequent group within Collembola (86.52%), followed by Symphypleona (6.59%), Poduromorpha (6.23%), and Neelipleona (0.65%) (see Figure 3).

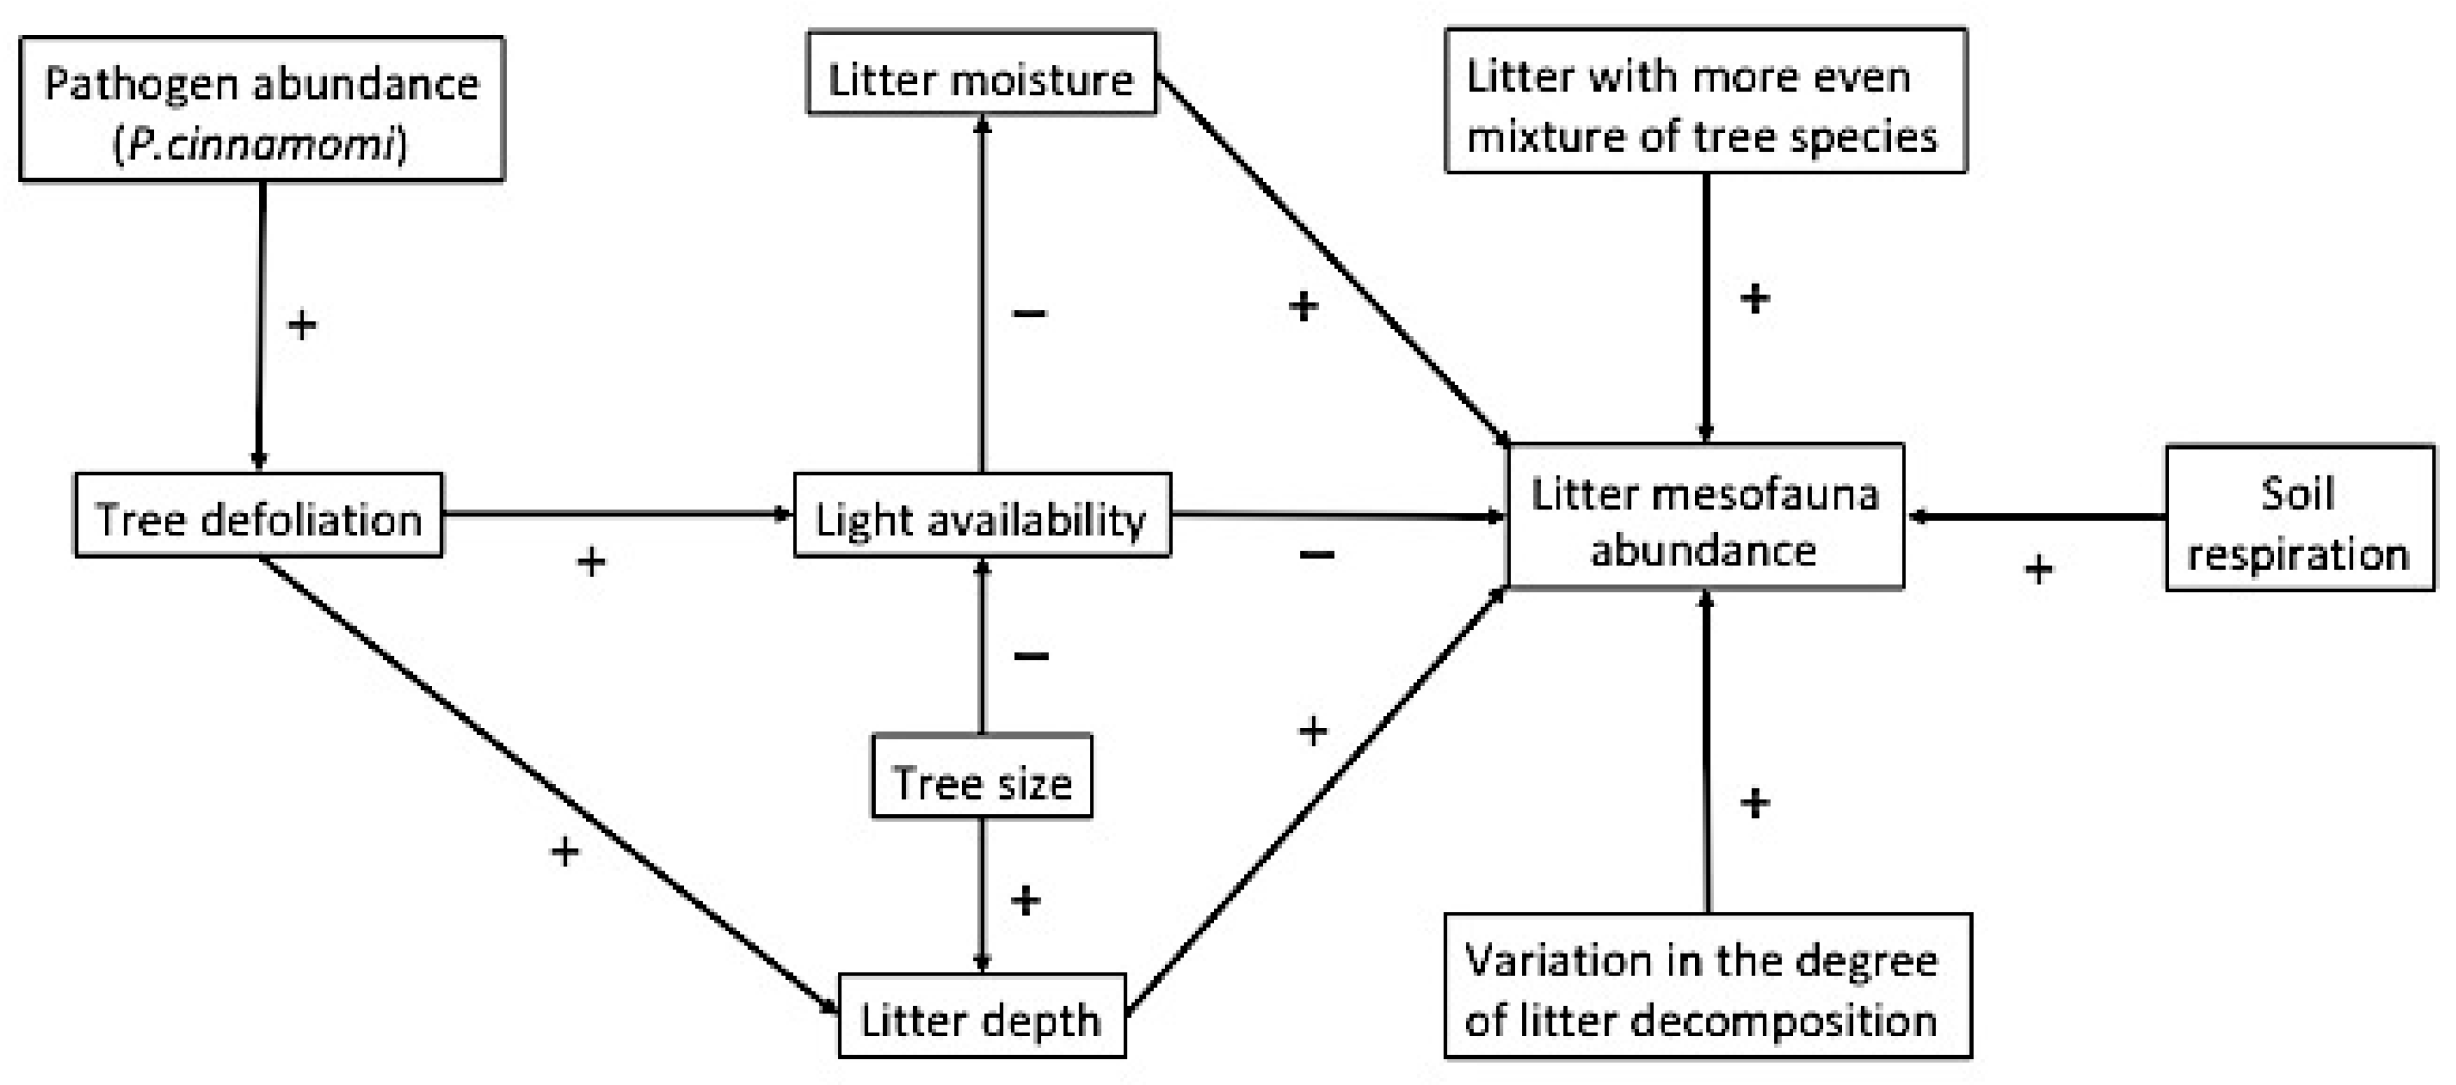
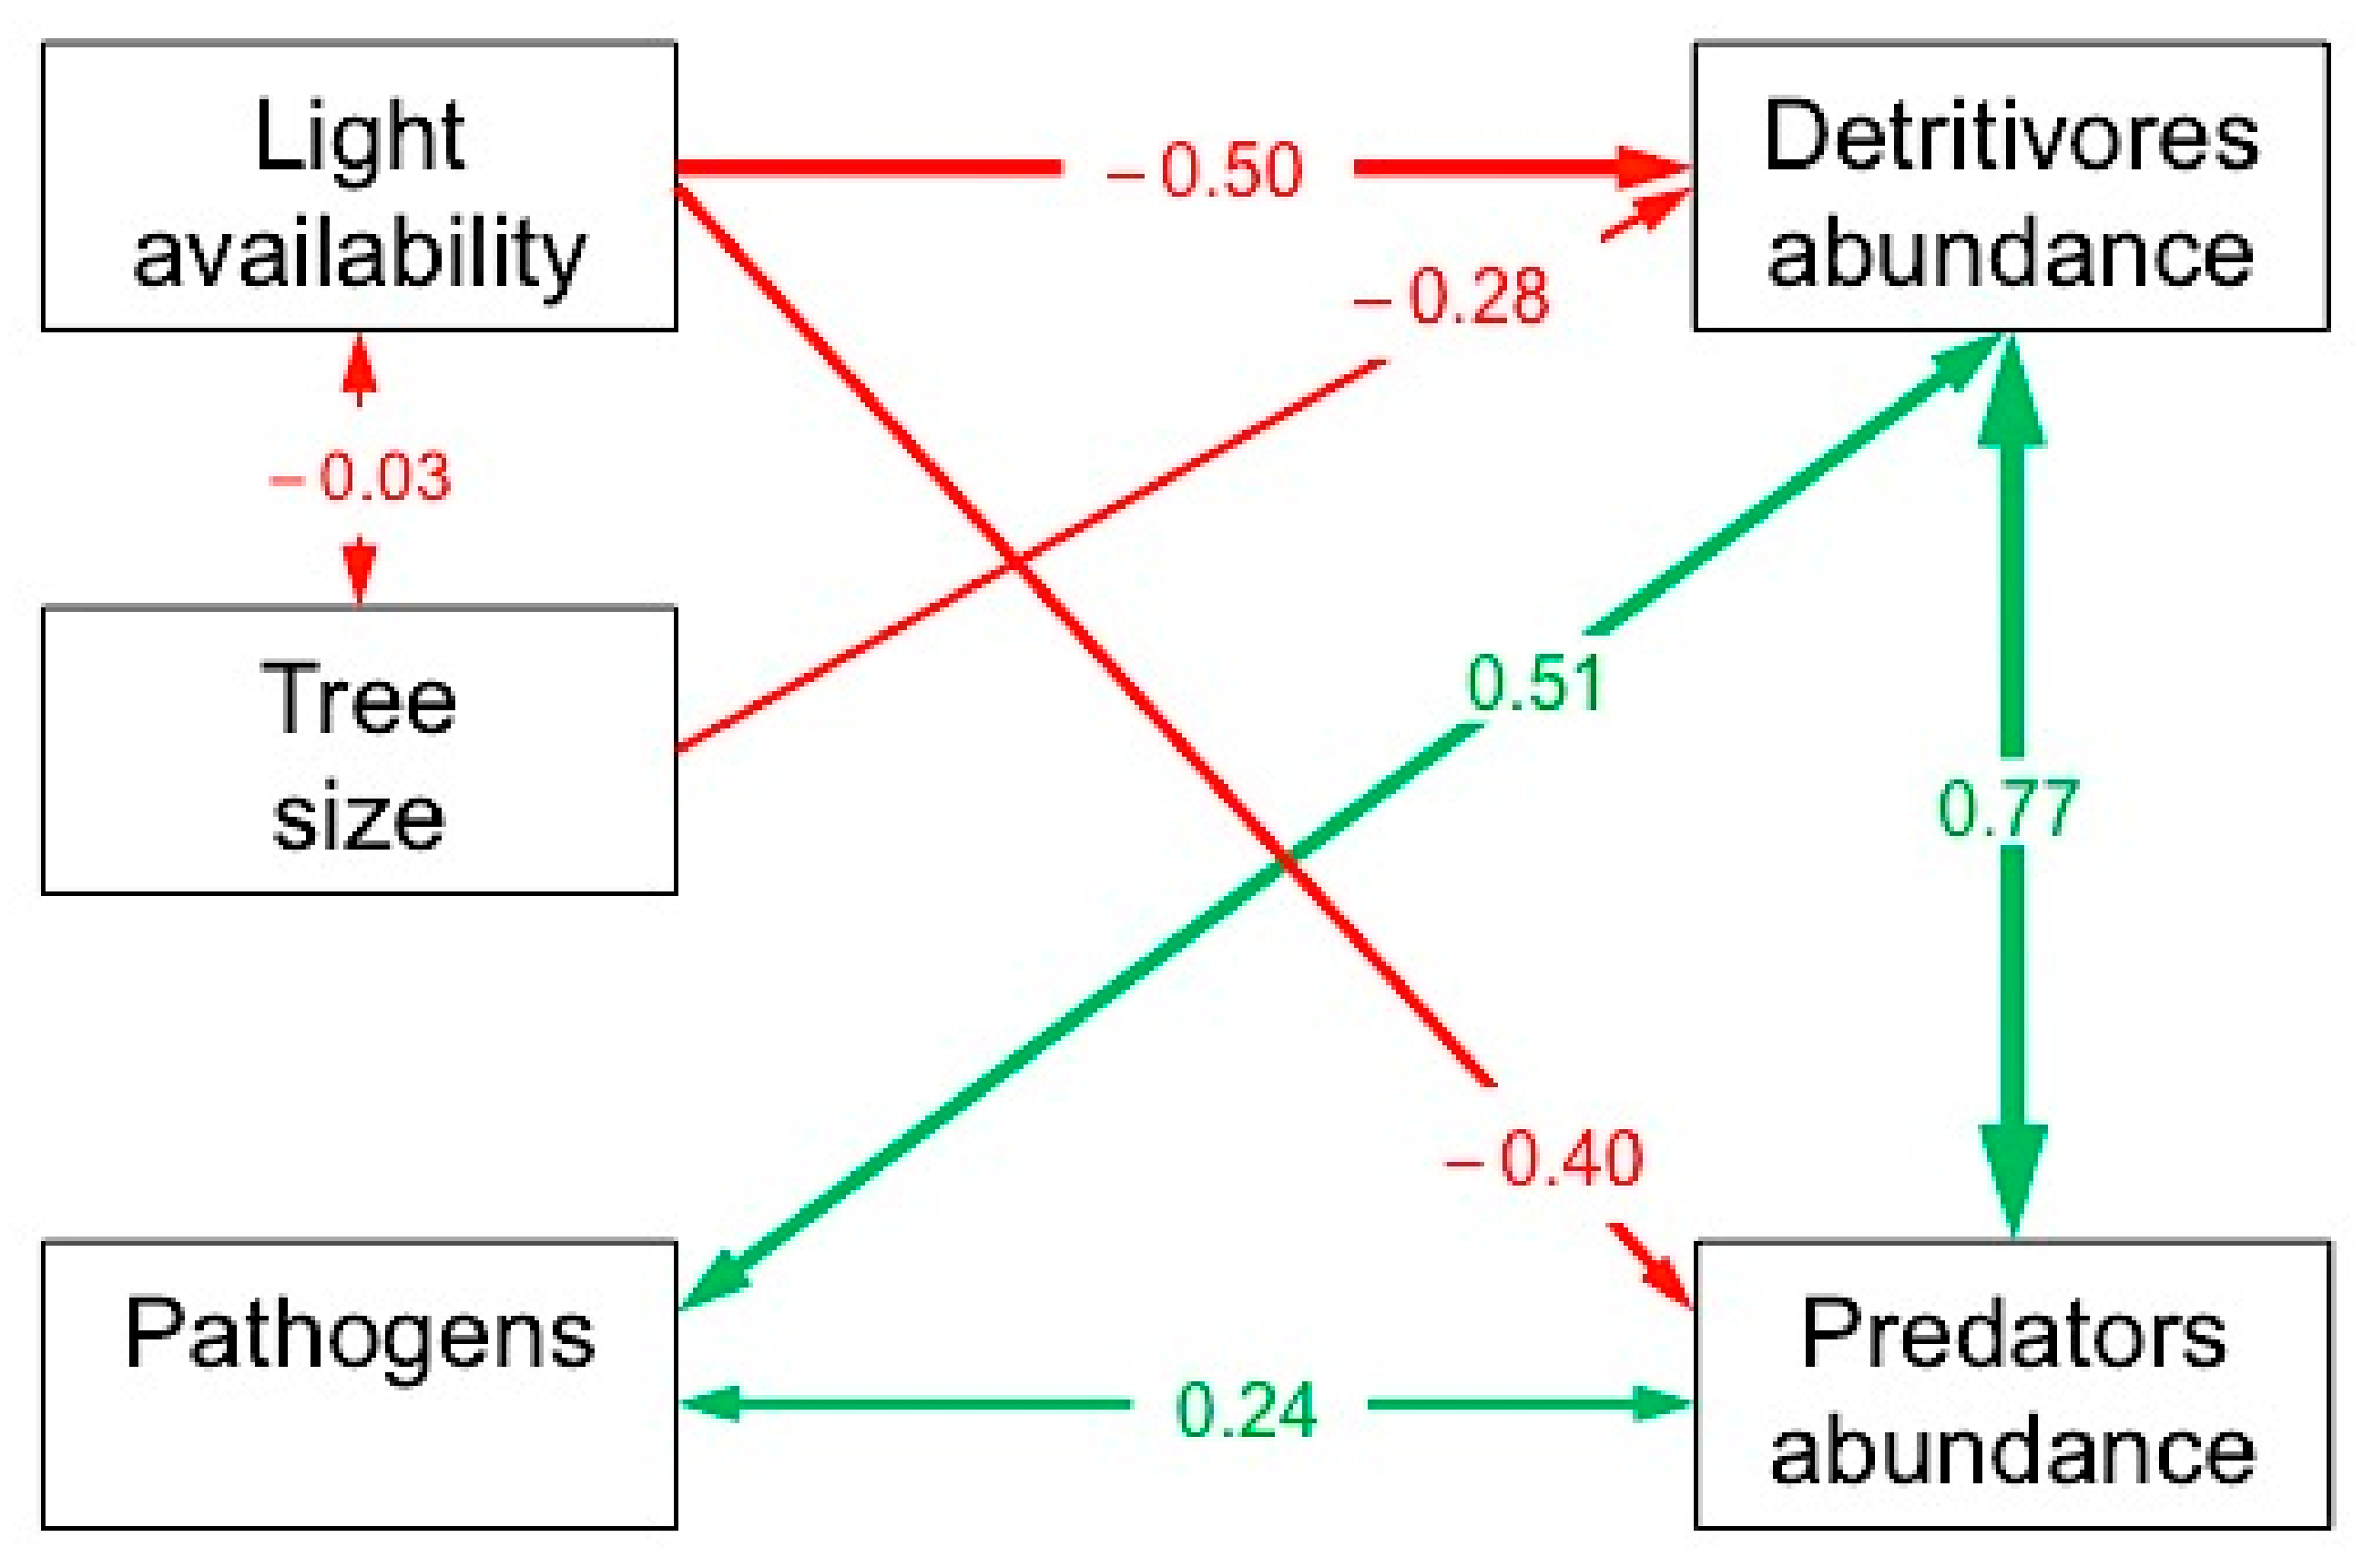
3.2. Direct and Indirect Determinants of the Abundance of Detritivore and Predatory Mesofauna

The path diagram selected to explain the abundance of detritivore and predatory mesofauna in forest litter showed that the presence of both groups was strongly correlated (0.77), which supports the idea that predators are intimately linked to prey abundances (see Figure 4). The main environmental variable directly influencing detritivore and predator abundance was light through a negative effect (−0.50 and −0.40, respectively). P. cinnamomi density was positively correlated with detritivore abundances (0.51) and to a lesser extent with predators (0.24). Tree size negatively influenced detritivores abundance (−0.28), and tree size was weakly correlated with light availability (–0.03) (see Figure 4).
Surprisingly, litter moisture was not selected for the final path diagram with the best fit. This result is probably due to the fact that the rainfall exclusion did not create enough variation across samples. We only found a marginally significant difference in litter moisture between control and treatment plots (litter moisture values 37.1 ± 3.0 and 35.9 ± 2.3 for control and treatment plots, respectively, and Analysis of covariance (ANCOVA) using litter depth as a covariable, F = 2.97 and p = 0.076).

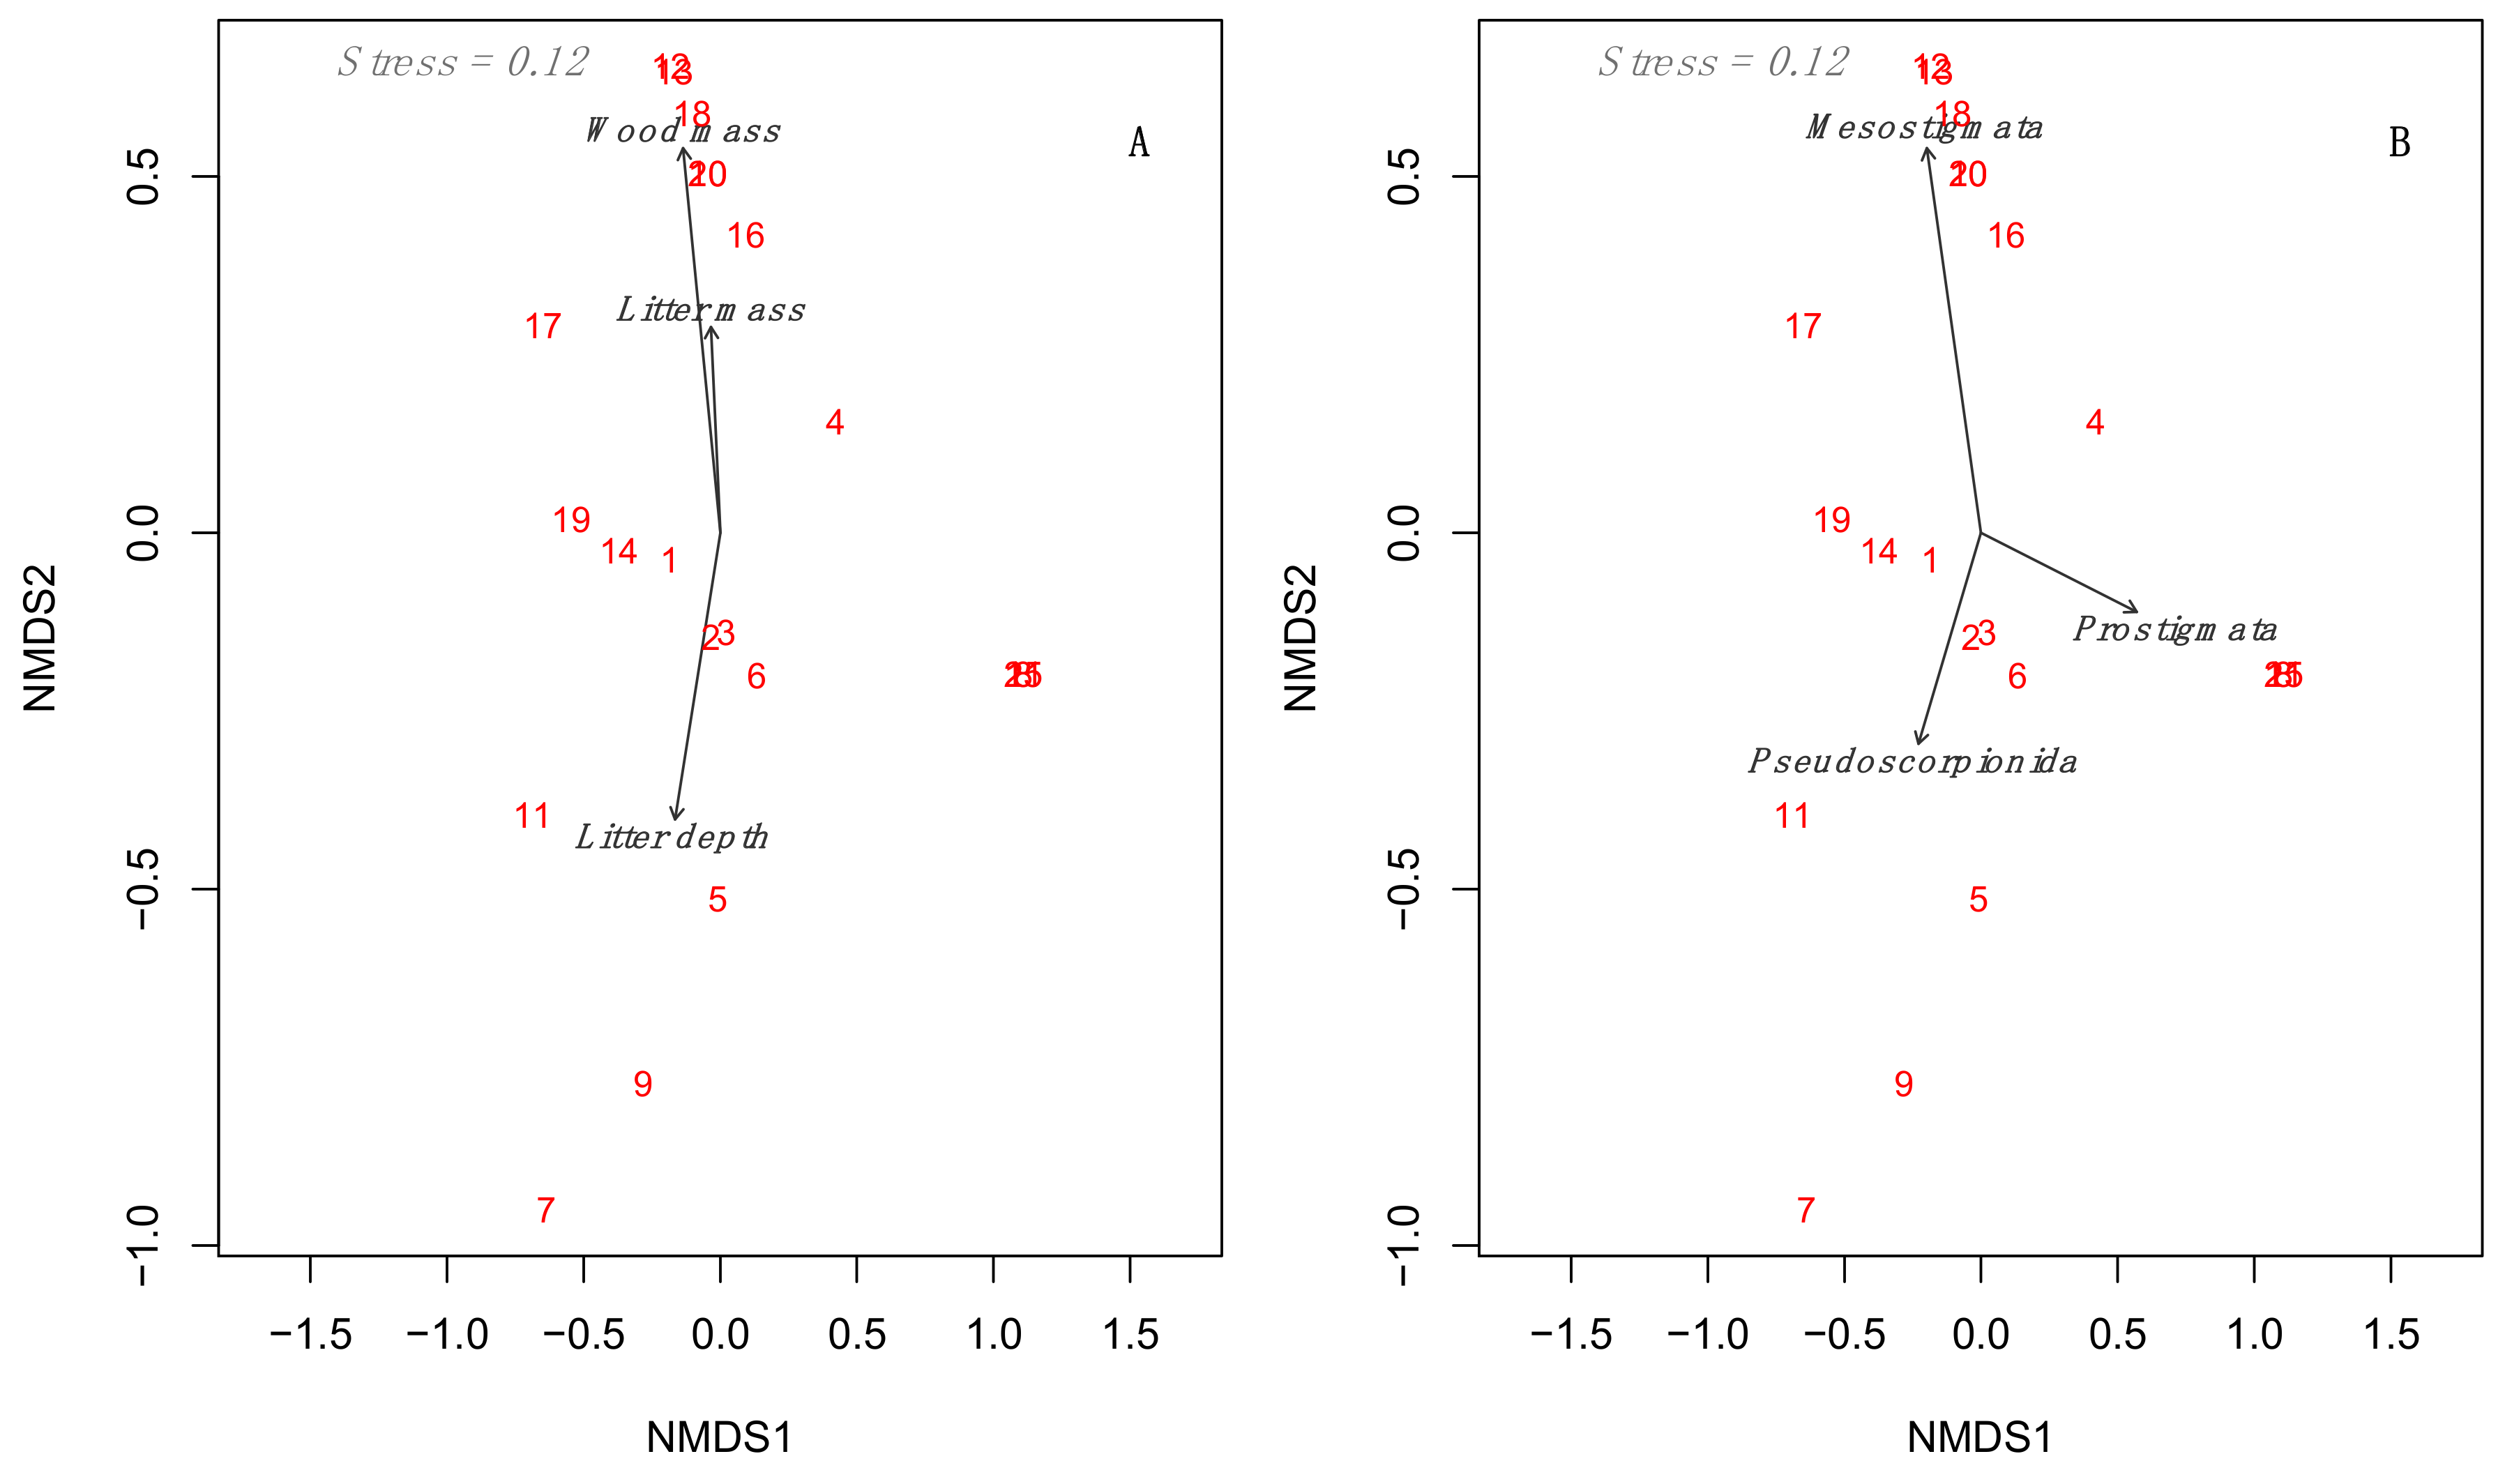
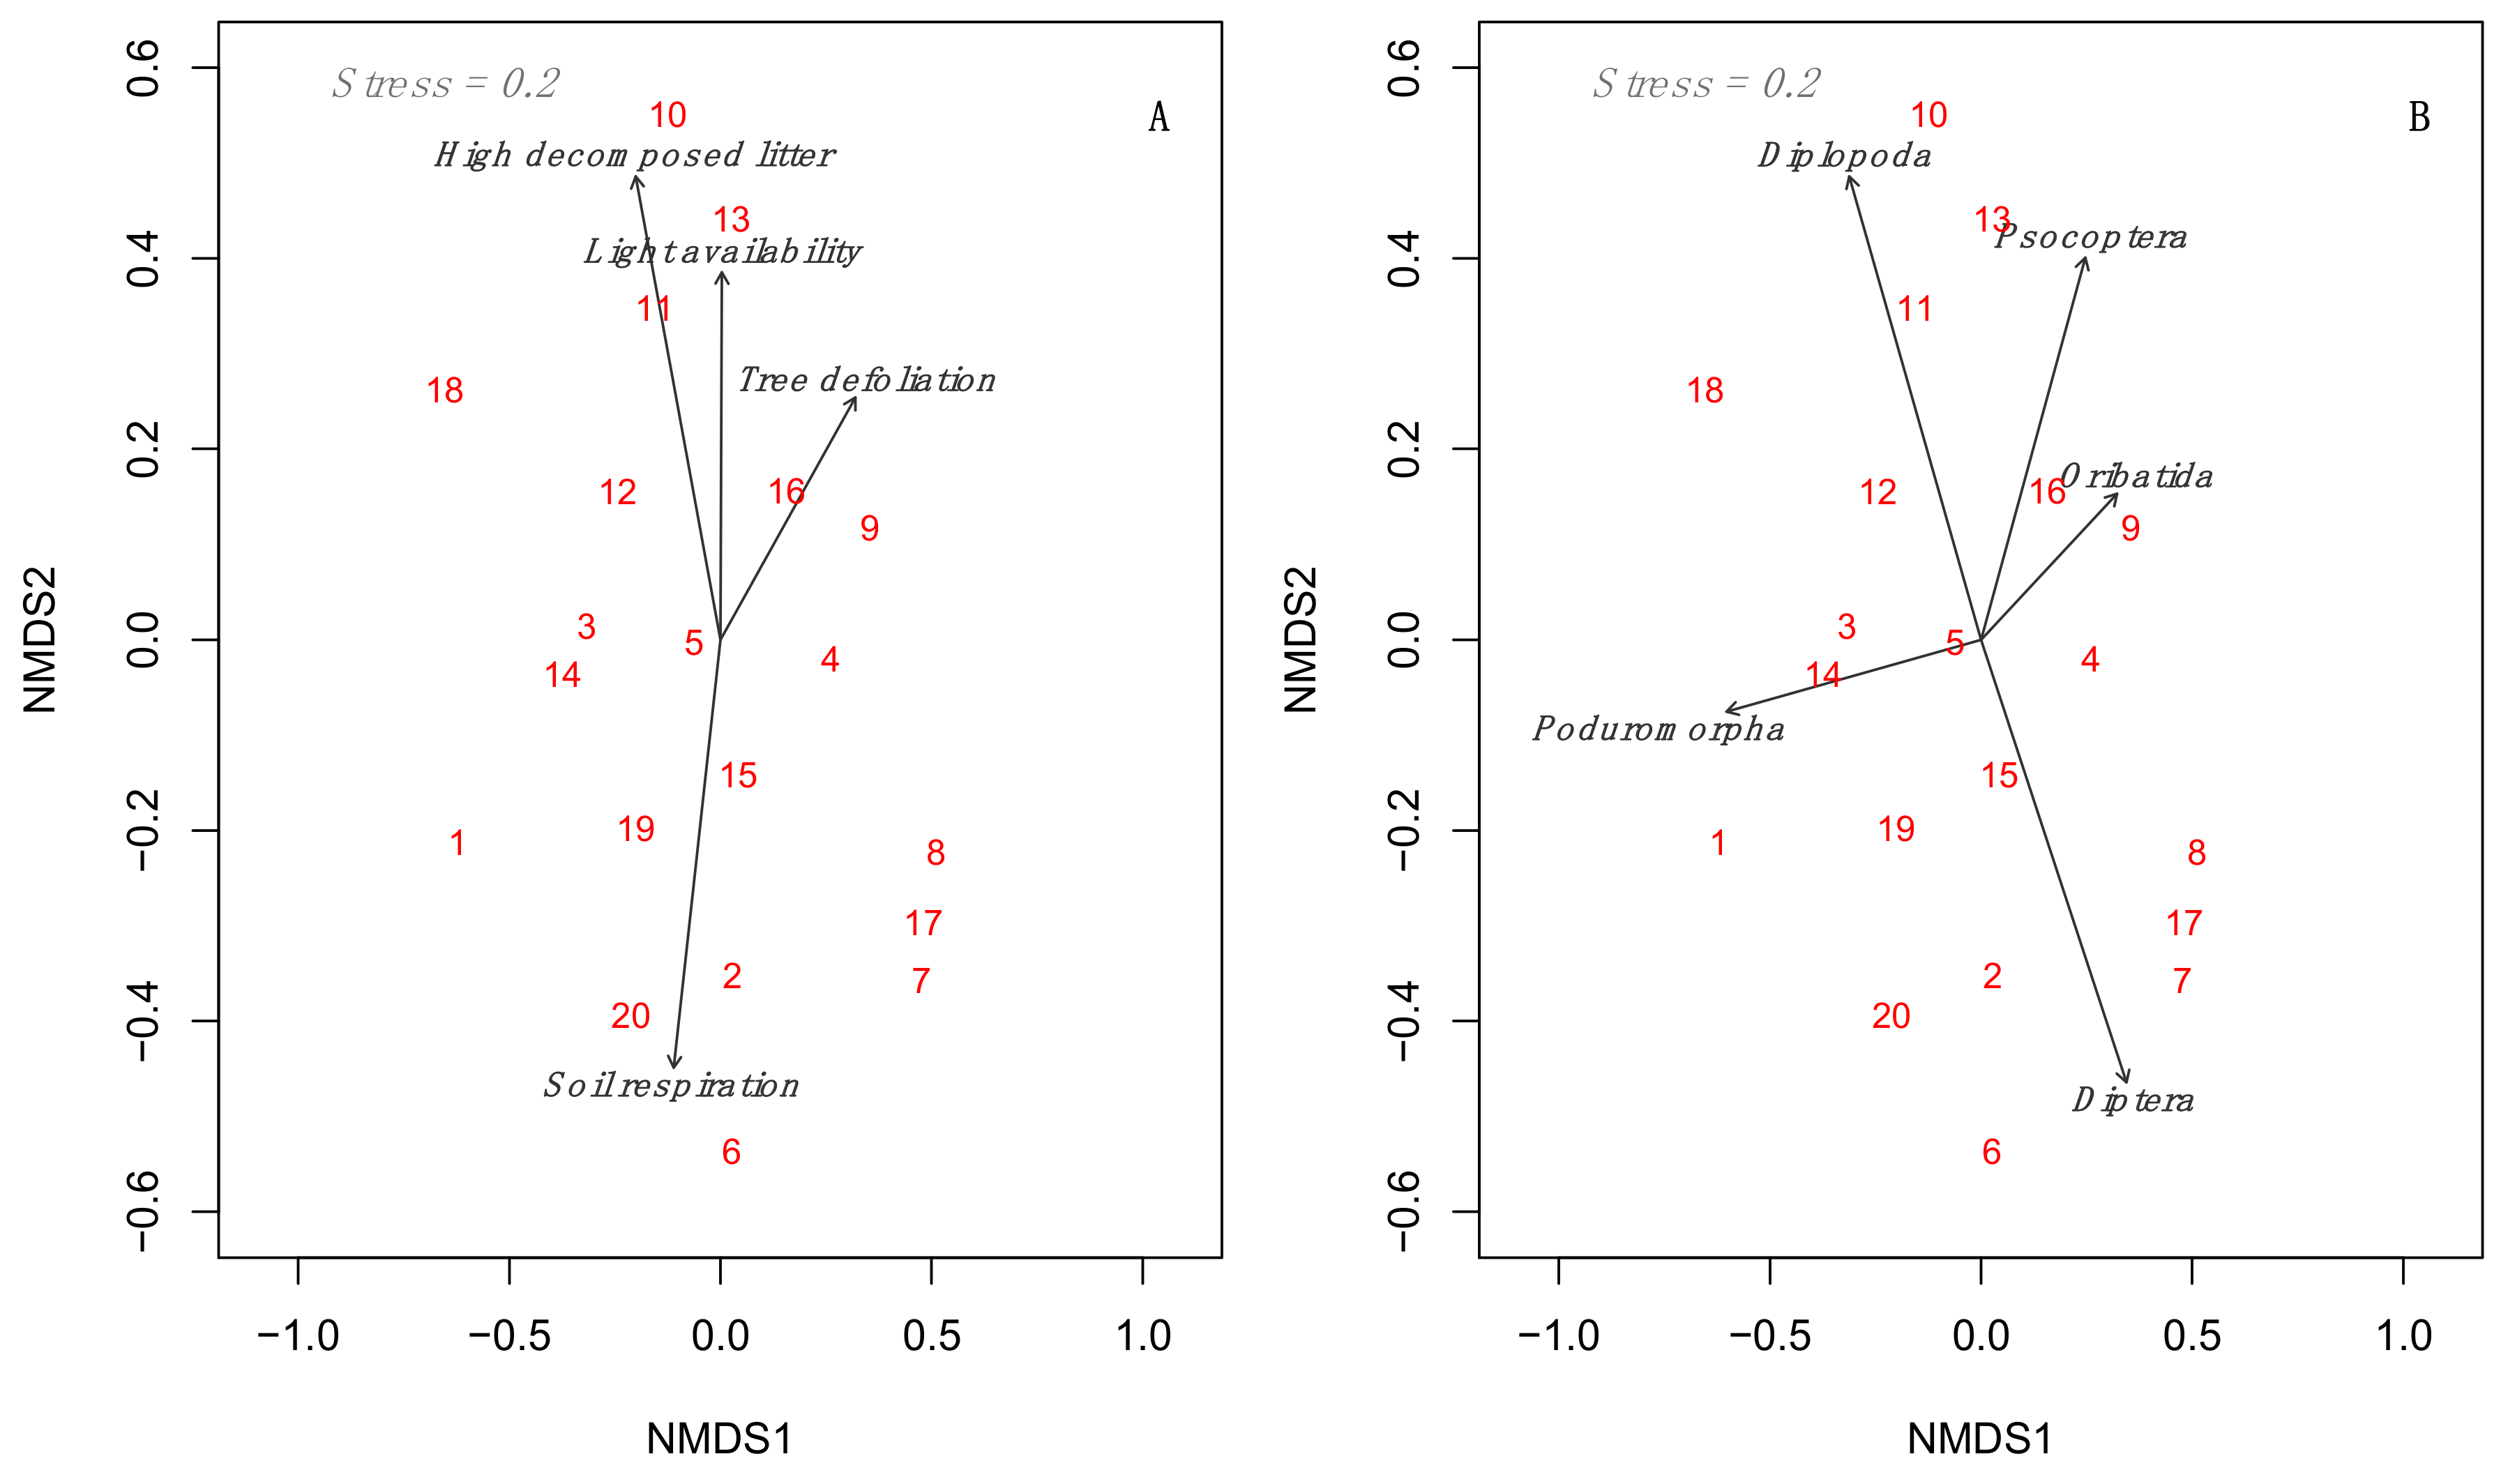
3.3. Multidimensional Analyses Relating to Environmental Predictors to Mesofauna Composition

The results of the NMDS analyses showed that including light availability, tree defoliation, high decomposed litter, and soil respiration explained the highest amount of variation for detritivore mesofauna across samples (rho index = 0.27). These environmental predictors accounted mostly for variation in the abundance of Diplopoda, Pscoptera, Oribatida, Diptera, and Poduromorpha (rho index = 0.86). Specifically, Diplopoda was positively associated with highly decomposed litter and Psocoptera and Oribatida were positively associated with higher levels of tree defoliation. In contrast, Poduromorpha avoided places with high tree defoliation and light availability. Larvae of Diptera were positively associated with the amount of soil respiration (see Figure 5).
NMDS analysis also showed that the best set of environmental predictors explaining the variation in predator mesofauna consisted of wood mass and litter mass and depth (rho index = 0.30). This is a similar value of explained variance compared with that obtained for detritivores, which suggests that we captured the variation in abundances of detritivores and predators, although the specific determinants were different (see Figure 5 and Figure 6). Among the four different predator groups, wood and litter characteristics significantly captured variation for all groups except Araneae (rho index = 0.94). In particular, Mesostigmata individuals tended to prefer areas with a greater amount of wood and litter, while Prostigmata and Pseudoscorpionida tended to prefer areas with deeper litter layers (see Figure 6).

4. Discussion

Understanding basic forest ecosystem processes such as litter decomposition and nutrient cycling would strongly benefit from characterizing the abundance and composition of mesofauna associated with forest litter. This is an especially urgent need for Mediterranean forests since many of these forests are currently being affected by several global change drivers such as climate change and the invasion of exotic species [14,52,53].
In our study, the estimated abundance of the different groups of soil litter mesofauna is comparable to what has been observed in other forests with similar (e.g., France [18]) and different climatic conditions (e.g., Wales [54] and Sweden [55]). In all of these forest systems, there was a much higher abundance of detritivores Acari and Collembola than of predators. Acari Oribatida was by far the main detritivore group and Acari Mesostigmata was the most frequent group of predators (see Figure 3). Both Acari and Collembola have been extensively studied as environmental indicators of soil quality [56,57], and our analyses clearly selected light availability as the most important predictor of their abundances (see Figure 4). This result agrees with previous studies pointing to light availability as a main determinant of soil fauna [12], although the sign of the light effect varied among studies. In our system, detritivores preferred darker microsites (see Figure 4), while in previous studies conducted in cool temperate forests, light had a positive effect on mesofauna abundance [12]. These discrepancies between studies could be related to differences in the identity of the main limiting factors of mesofauna abundance and activity. In cool temperate forests, low temperatures could strongly limit mesofauna activity, which would benefit from the higher temperatures of lighter microsites [12,58,59]. However, in water-limited Mediterranean forests, mesofauna benefit from the higher moisture found in darker microsites [60]. Given these differences, future work should address how the signs and strength of the local determinants of soil fauna abundances change across continental gradients.
The complexity of the litter structure is often a good predictor of the abundance and diversity of soil litter fauna. Soils with more litter biomass and even mixtures of litter from different tree species are expected to have a higher diversity and abundance of different soil fauna groups because they allow for higher numbers of microhabitats and therefore increase niche differentiation between groups [13,17,61]. In our study, litter characteristics play a less important role compared to light availability. None of them were included in the structural equation model (see Figure 4), yet they had a significant association with the abundances of particular groups of detritivores and predators (see Figure 5 and Figure 6). For instance, Diplopoda and Psocoptera, two detritivore groups, were positively associated with the decomposition state of the litter, whereas Mesostigmata and Prostigmata, two groups of predators, were positively associated with the amount of litter mass and depth, respectively. This highlights that soil litter mesofauna cannot be seen as a group of generalist fauna and different taxa within and between trophic groups clearly selected for different microenvironments.
It is still poorly understood how soil-borne pathogens causing forest decline affect the abundance and distribution of the invertebrate mesofauna associated with forest litter. Therefore, we were particularly interested in understanding these relationships given the unique study location of our experiment. Because the abundance of P. cinnamomi in the soil of Mediterranean forests shows a predictable spatial structure associated to highly defoliated oak trees [14], we expected that the loss of tree vigor and biomass caused by P. cinnamomi infection would modify soil mesofauna communities indirectly through changes in the local abiotic and biotic environments. Specifically, our expectations were that, at early stages of pathogen infection, these indirect effects might occur because tree defoliation increases the litter depth, while at the final stages the lack of tree crown would increase light availability in the forest understory and reduce soil and litter moisture. In our study, the path model selected did not support the notion that these indirect effects are important for determining soil litter fauna abundances. In fact, such a model did not support our original hypothesis that P. cinnamomi indirectly influences mesofauna abundances by increasing light availability due to tree defoliation (see Figure 1). It was included as an indirect path connecting P. cinnamomi abundances with litter depth. Instead, we found an unexpected correlation between P. cinnamomi with detritivores and predator abundances. With the information collected in this study, the main mechanisms behind this association cannot be isolated, but can be proposed. The direct feeding effects of detritivores on P. cinnamomi are unlikely unless they occurs accidentally due to enormous differences in size. However, they could potentially disperse its chlamydospores. A more plausible explanation would be that both groups share niche characteristics by inhabiting soils under defoliated trees enriched in organic matter from dead roots and leaves. For instance, prior work has independently shown that both detritivores and P. cinnamomi are selected for higher organic matter and soil nutrient availability [62,63].
Regarding the effect of tree size on mesofauna abundances, the structural equation analysis showed a negative effect of this biotic variable on detritivore abundances but not on predator abundances. To our knowledge, there is only one other study evaluating the role of tree size on soil invertebrate groups. Specifically, Reference [12] found that the tree basal area, which is a variable related to tree size, had a positive effect on the abundance of some groups (e.g., Collembola) but negative effects on ants. Why tree size produces these opposing effects on the abundance of different groups of invertebrates was unclear in that study. The same situation happens in our case. We originally hypothesized that bigger trees are taller and this correlation would translate into lower light availability (see Figure 1), but our model did not support this possibility (tree size and light availability were weakly correlated, Figure 4). Another potential explanation could be that soil fauna prefers moderate levels of litter humidity. Therefore, bigger trees would accumulate more litter by maintaining high levels of humid litter that are not selected by detritivores. Unfortunately, our results did not support such a relationship either.
Our study is limited by its relatively low sample size. The 22 litter samples taken are a consequence of the strong effort we put in characterizing the local condition as exhaustively as possible. This sample size seems to capture relatively well one third (~30%) of the variance in abundances across locations of the different groups of detritivores and predators (see Figure 5 and Figure 6). However, two thirds of variance were not properly explained by our NMDS models. Additionally, sampling more trees at different times and more local environmental variables such as soil fertility and the abundances and composition of soil fungi is desired [64]. This procedure could serve to better understand the mechanisms behind the unexpected negative direct relationship between tree size and the overall abundance of detritivores and predators, or perhaps provide novel explanatory paths (see Figure 4). It also might help to clearly distinguish the role of litter moisture in determining soil litter fauna abundances. In this regard, we had little variation in the percentage of litter humidity between control and rainfall-exclusion plots.
Overall, we found that light availability is the main determinant of soil fauna negatively influencing the most common groups of detritivores (Acari and Collembola) found in the litter of mixed oak forest in Southern Spain. This effect is likely due to the negative effect of light availability on soil and litter humidity. Nevertheless, different litter characteristics such as litter mass, depth, and degree of decomposition, and—to a lesser extent—other local biotic variables such as tree defoliation and soil respiration, were the main predictors of the abundance of specific groups of detritivores and predators. The abundance of the invasive soil-borne pathogen P. cinnamomi was not related to any indirect path determining the abundance of soil litter mesofauna through their effects on tree defoliation. However, it was directly and positively correlated with the abundances of both detritivores and predators. These results suggest that this invasive pathogen species is integrated in the multitrophic interactions occurring between soil litter mesofauna guilds.

Acknowledgments

We are deeply grateful to the Jaime González Gordon Foundation for providing permission to build the rainfall exclusion infrastructure on their property as well as constant for the support throughout the experiment. We thank Rafael Caballero for his help with taxonomic identification. O.G. acknowledges postdoctoral financial support provided by the European Union Horizon research and innovation program under the Marie Sklodowska-Curie grant agreement No 661118-BioFUNC. O. G. also thanks research support from the Spanish Ministry of Economy and Competitiveness through the IMPLANTIN project (CGL2015-65346-R). L.G.A. acknowledges support from the MICINN project INTERCAPA (CGL-2014-56739-R). Finally, we thank Seville University Master Degree Program: Advanced Biology.

Author Contributions

O.G., L.G.-A. and L.M. conceived and designed the experiments; A.J.-C. and P.H. performed the experiments; A.J.-C. and O.G. analyzed the data; A.J.-C. and O.G wrote the paper with substantial contributions from the rest of the authors.

Conflicts of Interest

The authors declare no conflicts of interest.

Appendix A

Correlogram between the variables considered in our study (Table 1) for determining soil mesofauna abundances associated with forest litter.
Figure A1. Correlogram between the abiotic and biotic determinants of soil mesofauna abundance included in this study. The upper triangle shows the scatterplot between pairs of variables. The lower triangle shows Pearson’s r values.
Forests 09 00218 g0a1

References

  1. García-Palacios, P.; Maestre, F.T.; Kattge, J.; Wall, D.H. Climate and litter quality differently modulate the effects of soil fauna on litter decomposition across biomes. Ecol. Lett. 2013, 16, 1045–1053. [Google Scholar] [CrossRef] [PubMed]
  2. Soong, J.L.; Nielsen, U.N. The role of microarthropods in emerging models of soil organic matter. Soil Biol. Biochem. 2016, 102, 37–39. [Google Scholar] [CrossRef]
  3. Swift, M.J.; Heal, O.W.; Anderson, J.M. Decomposition in Terrestrial Ecosystems; University of California Press: Berkely, CA, USA, 1979; Volume 5. [Google Scholar]
  4. Aerts, R. The freezer defrosting: Global warming and litter decomposition rates in cold biomes. J. Ecol. 2006, 94, 713–724. [Google Scholar] [CrossRef]
  5. Cadisch, G.G. Driven by Natureplant Litter Quality and Decomposition; CAB International: Wallingford, UK, 1997. [Google Scholar]
  6. Eisenbeis, G. Biology of soil invertebrates. In Intestinal Microorganisms of Termites and Other Invertebrates; Springer: Berlin, Germany, 2006; pp. 3–53. [Google Scholar]
  7. Bardgett, R.D.; van der Putten, W.H. Belowground biodiversity and ecosystem functioning. Nature 2014, 515, 505. [Google Scholar] [CrossRef] [PubMed]
  8. Tan, B.; Wu, F.; Yang, W.; Xu, Z.; Zhang, L.; Liu, Y. Soil fauna significantly contributes to litter decomposition at low temperatures in the alpine/subalpine forests. Pol. J. Ecol. 2015, 63, 377–386. [Google Scholar] [CrossRef]
  9. Brussaard, L.; Pulleman, M.M.; Ouédraogo, É.; Mando, A.; Six, J. Soil fauna and soil function in the fabric of the food web. Pedobiologia 2007, 50, 447–462. [Google Scholar] [CrossRef]
  10. Pauli, N.; Abbott, L.; Negrete-Yankelevich, S.; Andrés, P. Farmers’ knowledge and use of soil fauna in agriculture: A worldwide review. Ecol. Soc. 2016, 21, 1–21. [Google Scholar] [CrossRef]
  11. Coyle, D.R.; Nagendra, U.J.; Taylor, M.K.; Campbell, J.H.; Cunard, C.E.; Joslin, A.H.; Mundepi, A.; Phillips, C.A.; Callaham, M.A. Soil fauna responses to natural disturbances, invasive species, and global climate change: Current state of the science and a call to action. Soil Biol. Biochem. 2017, 110, 116–133. [Google Scholar] [CrossRef]
  12. Mueller, K.E.; Eisenhauer, N.; Reich, P.B.; Hobbie, S.E.; Chadwick, O.A.; Chorover, J.; Dobies, T.; Hale, C.M.; Jagodziński, A.M.; Kałucka, I. Light, earthworms, and soil resources as predictors of diversity of 10 soil invertebrate groups across monocultures of 14 tree species. Soil Biol. Biochem. 2016, 92, 184–198. [Google Scholar] [CrossRef]
  13. Santonja, M.; Fernandez, C.; Proffit, M.; Gers, C.; Gauquelin, T.; Reiter, I.M.; Cramer, W.; Baldy, V. Plant litter mixture partly mitigates the negative effects of extended drought on soil biota and litter decomposition in a mediterranean oak forest. J. Ecol. 2017, 105, 801–815. [Google Scholar] [CrossRef]
  14. Gómez-Aparicio, L.; Ibánez, B.; Serrano, M.S.; De Vita, P.; Avila, J.M.; Pérez-Ramos, I.M.; García, L.V.; Esperanza Sánchez, M.; Maranón, T. Spatial patterns of soil pathogens in declining mediterranean forests: Implications for tree species regeneration. New Phytol. 2012, 194, 1014–1024. [Google Scholar] [CrossRef] [PubMed] [Green Version]
  15. Valladares, F. Light heterogeneity and plants: From ecophysiology to species coexistence and biodiversity. In Progress in Botany; Springer: Berlin, Germany, 2003; pp. 439–471. [Google Scholar]
  16. Ma, Z.; Yang, W.; Wu, F.; Tan, B. Effects of light intensity on litter decomposition in a subtropical region. Ecosphere 2017, 8, e01770. [Google Scholar] [CrossRef]
  17. Pande, Y.; Berthet, P. Observations on the vertical distribution of soil oribatei in a woodland soil. Ecol. Entomol. 1975, 127, 259–275. [Google Scholar] [CrossRef]
  18. Boyd, I.; Freer-Smith, P.; Gilligan, C.; Godfray, H. The consequence of tree pests and diseases for ecosystem services. Science 2013, 342, 1235773. [Google Scholar] [CrossRef] [PubMed]
  19. Lovett, G.M.; Weiss, M.; Liebhold, A.M.; Holmes, T.P.; Leung, B.; Lambert, K.F.; Orwig, D.A.; Campbell, F.T.; Rosenthal, J.; McCullough, D.G.; et al. Nonnative forest insects and pathogens in the united states: Impacts and policy options. Ecol. Appl. 2016, 26, 1437–1455. [Google Scholar] [CrossRef] [PubMed]
  20. Preston, D.L.; Mischler, J.A.; Townsend, A.R.; Johnson, P.T. Disease ecology meets ecosystem science. Ecosystems 2016, 19, 737–748. [Google Scholar] [CrossRef]
  21. Desprez-Loustau, M.-L.; Robin, C.; Buée, M.; Courtecuisse, R.; Garbaye, J.; Suffert, F.; Sache, I.; Rizzo, D.M. The fungal dimension of biological invasions. Trends Ecol. Evol. 2007, 22, 472–480. [Google Scholar] [CrossRef] [PubMed]
  22. Hansen, E.M. Phytophthora species emerging as pathogens of forest trees. Curr. For. Rep. 2015, 1, 16–24. [Google Scholar] [CrossRef]
  23. Cobb, R.C.; Rizzo, D.M. Litter chemistry, community shift, and non-additive effects drive litter decomposition changes following invasion by a generalist pathogen. Ecosystems 2016, 19, 1478–1490. [Google Scholar] [CrossRef]
  24. Ruess, R.W.; McFarland, J.M.; Trummer, L.M.; Rohrs-Richey, J.K. Disease-mediated declines in N-fixation inputs by alnus tenuifolia to early-successional floodplains in interior and south-central alaska. Ecosystems 2009, 12, 489–502. [Google Scholar] [CrossRef]
  25. Lovett, G.M.; Arthur, M.A.; Weathers, K.C.; Griffin, J.M. Long-term changes in forest carbon and nitrogen cycling caused by an introduced pest/pathogen complex. Ecosystems 2010, 13, 1188–1200. [Google Scholar] [CrossRef]
  26. Cobb, R.C.; Eviner, V.T.; Rizzo, D.M. Mortality and community changes drive sudden oak death impacts on litterfall and soil nitrogen cycling. New Phytol. 2013, 200, 422–431. [Google Scholar] [CrossRef] [PubMed]
  27. Brasier, C.M. Phytophthora cinnamomi and oak decline in southern europe. Environmental constraints including climate change. In Annales des Sciences Forestieres; EDP Sciences: Ray Ulysse, France, 1996; pp. 347–358. [Google Scholar]
  28. Sánchez, M.; Caetano, P.; Ferraz, J.; Trapero, A. Phytophthora disease of quercus ilex in south-western Spain. For. Pathol. 2002, 32, 5–18. [Google Scholar] [CrossRef]
  29. Sánchez, M.; Caetano, P.; Romero, M.; Navarro, R.; Trapero, A. Phytophthora root rot as the main factor of oak decline in southern Spain. In Progress in Research on Phytophthora Diseases of Forest Trees; Forest Research: Farnham, UK, 2006; pp. 149–154. [Google Scholar]
  30. Romero, M.; Sánchez, J.; Jiménez, J.; Belbahri, L.; Trapero, A.; Lefort, F.; Sánchez, M. New pythium taxa causing root rot on mediterranean quercus species in South-west Spain and Portugal. J. Phytopathol. 2007, 155, 289–295. [Google Scholar] [CrossRef]
  31. Zentmyer, G.A. Phytophthora Cinnamomi and the Diseases It Causes; American Phytopathological Society: Saint Paul, MN, USA, 1980. [Google Scholar]
  32. Zentmyer, G. Origin and distribution of four species of Phytophthora. Trans. Br. Mycol. Soc. 1988, 91, 367–378. [Google Scholar] [CrossRef]
  33. Da Clara, M.I.; de Almeida Ribeiro, N.M. Decline of Mediterranean oak trees and its association with Phytophthora cinnamomi: A review. Eur. J. For. Res. 2013, 132, 411–432. [Google Scholar]
  34. Weste, G.; Marks, G.C. The biology of Phytophthora cinnamomi in Australasian forests. Annu. Rev. Phytopathol. 1987, 25, 207–229. [Google Scholar] [CrossRef]
  35. Shearer, B.; Crane, C.; Barrett, S.; Cochrane, A. Phytophthora cinnamomi invasion, a major threatening process to conservation of flora diversity in the South-west botanical province of western Australia. Aust. J. Bot. 2007, 55, 225–238. [Google Scholar] [CrossRef]
  36. Medail, F.; Quezel, P. Biodiversity hotspots in the Mediterranean basin: Setting global conservation priorities. Conserv. Biol. 1999, 13, 1510–1513. [Google Scholar] [CrossRef]
  37. Stocker, T. Climate change 2013: The Physical Science Basis: Working Group i Contribution to the Fifth Assessment Report of the Intergovernmental Panel on Climate Change; Cambridge University Press: Cambridge, UK, 2014. [Google Scholar]
  38. Limousin, J.-M.; Rambal, S.; Ourcival, J.-M.; Joffre, R. Modelling rainfall interception in a Mediterranean quercus ilex ecosystem: Lesson from a throughfall exclusion experiment. J. Hydrol. 2008, 357, 57–66. [Google Scholar] [CrossRef]
  39. Berlese, A. Apparecchio per Raccogliere Presto ed in Gran Numero piccoli Arthropodi. J. Hydrol. 1905, 2, 85–89. [Google Scholar]
  40. Barrientos, J.A. Curso Práctico de Entomología; Universitat Autònoma de Barcelona: Bellaterra, Spain, 2004; Volume 41. [Google Scholar]
  41. Gullan, P.J.; Cranston, P.S. The Insects: An Outline of Entomology; John Wiley & Sons: Hoboken, NJ, USA, 2014. [Google Scholar]
  42. Scoble, M.J. The Lepidoptera. Form, Function and Diversity; Oxford University Press: Oxford, UK, 1992. [Google Scholar]
  43. Alatalo, J.M.; Jägerbrand, A.K.; Juhanson, J.; Michelsen, A.; Ľuptáčik, P. Impacts of twenty years of experimental warming on soil carbon, nitrogen, moisture and soil mites across alpine/subarctic tundra communities. Sci. Rep. 2017, 7, 44489. [Google Scholar] [CrossRef] [PubMed]
  44. Valladares, F.; Guzmán, B. Canopy structure and spatial heterogeneity of understory light in an abandoned holm oak woodland. Ann. For. Sci. 2006, 63, 749–761. [Google Scholar] [CrossRef]
  45. Bekku, Y.; Koizumi, H.; Nakadai, T.; Iwaki, H. Measurement of soil respiration using closed chamber method: An IRGA technique. Ecol. Res. 1995, 10, 369–373. [Google Scholar] [CrossRef]
  46. Rosseel, Y. Lavaan: An R Package for Structural Equation Modeling and More Version 0.4-9 (Beta); Ghent University: Ghent, Belgium, 2011. [Google Scholar]
  47. Kline, R.B. Principles and Practice of Structural Equation Modeling; Guilford Publications: New York, NY, USA, 2015. [Google Scholar]
  48. Grace, J.B. Structural Equation Modeling and Natural Systems; Cambridge University Press: Cambridge, UK, 2006. [Google Scholar]
  49. Oksanen, J.; Blanchet, F.G.; Kindt, R.; Legendre, P.; Minchin, P.R.; O’hara, R.; Simpson, G.L.; Solymos, P.; Stevens, M.H.H.; Wagner, H. Package “vegan”. Community Ecology Package, Version 2.5-1; 2013. Available online: https://CRAN.R-project.org/package=vegan (accessed on 15 February 2018).
  50. Clarke, K.; Ainsworth, M. A method of linking multivariate community structure to environmental variables. Mar. Ecol. Prog. Ser. 1993, 92, 205–219. [Google Scholar] [CrossRef]
  51. Bray, J.R.; Curtis, J.T. An ordination of the upland forest communities of Southern Wisconsin. Ecol. Monogr. 1957, 27, 325–349. [Google Scholar] [CrossRef]
  52. Allen, C.D.; Macalady, A.K.; Chenchouni, H.; Bachelet, D.; McDowell, N.; Vennetier, M.; Kitzberger, T.; Rigling, A.; Breshears, D.D.; Hogg, E.H.; et al. A global overview of drought and heat-induced tree mortality reveals emerging climate change risks for forests. For. Ecol. Manag. 2010, 259, 660–684. [Google Scholar] [CrossRef]
  53. Lindner, M.; Maroschek, M.; Netherer, S.; Kremer, A.; Barbati, A.; Garcia-Gonzalo, J.; Seidl, R.; Delzon, S.; Corona, P.; Kolström, M.; et al. Climate change impacts, adaptive capacity, and vulnerability of European forest ecosystems. For. Ecol. Manag. 2010, 259, 698–709. [Google Scholar] [CrossRef]
  54. George, P.B.; Keith, A.M.; Creer, S.; Barrett, G.L.; Lebron, I.; Emmett, B.A.; Robinson, D.A.; Jones, D.L. Evaluation of mesofauna communities as soil quality indicators in a national-level monitoring programme. Soil Biol. Biochem. 2017, 115, 537–546. [Google Scholar] [CrossRef]
  55. Lindberg, N.; Engtsson, J.B.; Persson, T. Effects of experimental irrigation and drought on the composition and diversity of soil fauna in a coniferous stand. J. Appl. Ecol. 2002, 39, 924–936. [Google Scholar] [CrossRef]
  56. O’Neill, K.P.; Godwin, H.W.; Jiménez-Esquilín, A.E.; Battigelli, J.P. Reducing the dimensionality of soil microinvertebrate community datasets using indicator species analysis: Implications for ecosystem monitoring and soil management. Soil Biol. Biochem. 2010, 42, 145–154. [Google Scholar] [CrossRef]
  57. Gerlach, J.; Samways, M.; Pryke, J. Terrestrial invertebrates as bioindicators: An overview of available taxonomic groups. J. Insect Conserv. 2013, 17, 831–850. [Google Scholar] [CrossRef]
  58. Ritter, E.; Dalsgaard, L.; Einhorn, K.S. Light, temperature and soil moisture regimes following gap formation in a semi-natural beech-dominated forest in Denmark. For. Ecol. Manag. 2005, 206, 15–33. [Google Scholar] [CrossRef]
  59. Prévost, M.; Raymond, P. Effect of gap size, aspect and slope on available light and soil temperature after patch-selection cutting in yellow birch–conifer stands, Quebec, Canada. For. Ecol. Manag. 2012, 274, 210–221. [Google Scholar] [CrossRef]
  60. Dhooria, M.S. Fundamentals of Applied Acarology; Springer: Berlin, Germany, 2016. [Google Scholar]
  61. Hansen, R.A.; Coleman, D.C. Litter complexity and composition are determinants of the diversity and species composition of oribatid mites (Acari: Oribatida) in litterbags. Appl. Soil Ecol. 1998, 9, 17–23. [Google Scholar] [CrossRef]
  62. Anderson, J.; Ineson, P.; Huish, S. Nitrogen and cation mobilization by soil fauna feeding on leaf litter and soil organic matter from deciduous woodlands. Soil Biol. Biochem. 1983, 15, 463–467. [Google Scholar] [CrossRef]
  63. Shearer, B. Time course studies of temperature and soil depth mediated sporangium production by phytophthora cinnamomi. Australas. Plant Pathol. 2014, 43, 235–244. [Google Scholar] [CrossRef]
  64. Birkhofer, K.; Schöning, I.; Alt, F.; Herold, N.; Klarner, B.; Maraun, M.; Marhan, S.; Oelmann, Y.; Wubet, T.; Yurkov, A. General relationships between abiotic soil properties and soil biota across spatial scales and different land-use types. PLoS ONE 2012, 7, e43292. [Google Scholar] [CrossRef] [PubMed]
Figure 1. Conceptual diagram outlining general direct and indirect effects of light availability, litter, tree, and soil properties, and the abundance of the pathogen P. cinnamomi on litter mesofauna abundances. This conceptual diagram served as a starting point to finally select the best-supported diagram by the structural equation analyses presented in Figure 4.
Forests 09 00218 g001
Figure 2. (A) Location of “Los Alcornocales Natural Park” in South Spain. Our observational study took place within a long-term research infrastructure. This infrastructure aims to study the interactive effects of climate change and the invasion of the exotic oomycete P. cinnamomi on forest dynamics; (B) Photograph illustrating the structure of rainfall exclusion. Note that to exclude water, shelters were placed upwards. We used this infrastructure to promote differences in soil litter humidity between climate control and drought-induced plots.
Forests 09 00218 g002
Figure 3. Histogram of the accumulated number of individuals (in logarithmic scale) estimated across all litter samples for each soil litter fauna group. Soil litter fauna were further classified into detritivores (yellow) or predators (blue).
Forests 09 00218 g003
Figure 4. From the theoretical expectations of the relationships between environmental predictors and mesofauna abundances presented in Figure 1, this is the path diagram selected that met the statistical requirements to conduct a structural equation model. Lines in green correspond to a positive effect or correlation between variables whereas lines in red correspond to a negative effect or correlation. Color intensity is positively related to the significant relationship between two variables. Single-head arrows indicate that one variable exerts an effect on another variable, whereas double-head arrows indicate mutual interference. In this structural equation model (SEM), the minimum function test statistic was 0.144, with 3 degrees of freedom, p = 0.986, and the residual was approximately 1. RMSEA = 0.000, CFI = 1.000, and SRMR = 0.030, (RMSEA: root mean square error of approximation; CFI: comparative fit index; SRMR: standardized root mean square residual).
Forests 09 00218 g004
Figure 5. Non-metric multidimensional analyses (NMDS) exploring which abiotic and biotic drivers (A) explain variation in detritivores composition (B) across samples (red numbers). One sample in these analyses was considered an outlier and therefore removed because its soil humidity was twice the standard deviation of the average soil humidity across all of the samples (NMDS 1: NMDS x-axis, NMDS 2: NMDS y-axis).
Forests 09 00218 g005
Figure 6. Non-metric multidimensional analyses (NMDS) exploring which abiotic and biotic drivers (A) explain variation in predator composition (B) across samples (red numbers). As in Figure 5, one sample was considered an outlier and therefore removed (NMDS 1: NMDS x-axis, NMDS 2: NMDS y-axis).
Forests 09 00218 g006
Table 1. Abiotic and biotic drivers included in this study to assess variation in soil litter fauna abundance and composition. Units are specified.
VariableUnitsMean ± Standard Error
AbioticLight availabilityGlare Spread Function values (GSF)0.336 ± 0.016
Soil humidity % volumetric water content20.618 ± 1.022
WoodGrams (g)13.997 ± 1.682
Litter depthCentimeters (cm)4.268 ± 0.235
Litter moisture% water in mass36.586 ± 1.956
BioticSoil respirationµmol CO2 m−2 s−15.685 ± 0.358
Tree sizeDiameter at breast height (DBH) in cm37.455 ± 3.624
Tree defoliationFrom 0 (no defoliation) to 3 (full defoliation)0.636 ± 0.151
Litter Q. canariensisGrams (g)9.724 ± 0.930
Litter Q. suberGrams (g)7.941 ± 0.683
Litter other speciesGrams (g)0.088 ± 0.086
Litter nonidentifiableGrams (g)41.355 ± 5.299
Decomposition level 1Grams (g), litter low decomposed11.028 ± 1.084
Decomposition level 2Grams (g), litter medium decomposed6.725 ± 0.601
Decomposition level 3Grams (g), litter highly decomposed41.355 ± 10.270
Pathogen (Phytophthora cinnamomi)Colony Forming Units/Grams (CFU g−1)105.636 ± 23.707

