Article

Drought Decreases Growth and Increases Mortality of Coexisting Native and Introduced Tree Species in a Temperate Floodplain Forest

by
Michele Colangelo
1,2,
Jesús J. Camarero
2,*,
Francesco Ripullone
1,
Antonio Gazol
2,
Raúl Sánchez-Salguero
3,
Jonàs Oliva
4,5 and
Miguel A. Redondo
5
1
School of Agricultural, Forest, Food and Environmental Sciences, University of Basilicata, 85100 Potenza, Italy
2
Instituto Pirenaico de Ecología (IPE-CSIC), Avda. Montañana 1005, 50192 Zaragoza, Spain
3
Departamento Sistemas Físicos, Químicos y Naturales, University Pablo de Olavide, 41013 Sevilla, Spain
4
Departament de Producció Vegetal i Ciència Forestal, Universitat de Lleida, 25003 Lleida, Spain
5
Department of Forest Mycology and Plant Pathology, Swedish University of Agricultural Sciences, 75007 Uppsala, Sweden
*
Author to whom correspondence should be addressed.
Forests 2018, 9(4), 205; https://doi.org/10.3390/f9040205
Submission received: 9 March 2018 / Revised: 2 April 2018 / Accepted: 11 April 2018 / Published: 13 April 2018
(This article belongs to the Special Issue Tree-Ring Records of Climatic Impacts on Forests)

Abstract

:
Forest dieback and mortality events induced by drought stress are widely reported. However, few studies have jointly examined the role played by drought on growth and mortality in tree species inhabiting floodplain forests. Here, we focused on mortality events occurring since the early 2000s on large areas in a floodplain forest located within the Ticino regional park in Northwest Italy, where affected native (pedunculate oak, Quercus robur L.) and introduced tree species (black locust, Robinia pseudoacacia L.) coexist. We related growth with climate data and drought severity to discern if these species were similarly affected by drought. Then, we: (i) evaluated the presence of pathogens of the genus Phytophthora in recently dead oak trees since this was the most affected species and pathogens are often associated with oak decline cases; and (ii) compared xylem vessel diameter and tree-ring C isotope discrimination (δ13C) to highlight differences in water-use strategies between living and dead trees in both species. The radial growth of living and dead trees started diverging in the 1970s, although only after warm-drought periods occurred during 1990s did this divergence become significant. Growth of trees that died responded more negatively to drought than in the case of living trees. Moreover, trees that died formed smaller xylem vessels in the past than living trees and also showed more negative δ13C values in both tree species, indicating a higher intrinsic water-use efficiency in living than in dead trees. The pathogen Phytophthora cinnamomi Rands was only detected in one recently dead tree, suggesting that it is unlikely that dead oaks were predisposed to drought damage by the pathogen. We conclude that a climate shift from wet to warm-dry summer conditions in the early 1990s triggered forest dieback and induced mortality in both tree species. Temperate floodplain forests are susceptible to drought-induced dieback. The drought-sensitivity of both species could lead to successional shifts driven by a reduction of N inputs through N-fixing by black locust and the replacement of oak by drought-tolerant species.

1. Introduction

One major question is to forecast how forests will respond to Anthropocene conditions, including how native and tree invasive will coexist [1]. These will include a sustained rise in temperatures, more severe droughts, more widespread invasive tree species, and extensive incidence of pests and diseases (e.g., fungal pathogens), which have been identified as major drivers of tree mortality worldwide [2]. Such mortality events are often accompanied by growth decline, canopy dieback, drops in productivity, and other effects which alter the ecosystem services provided by forests [3].
Drought-induced mortality has been observed in many forest biomes across the world including temperate floodplain forests [4]. Floodplain forests are among the most threatened ecosystems because of their extensive conversion into agricultural or urban lands [5]. These forests reflect the human footprint on hydroecological dynamics including the modification of river dynamics through dam building [6]. In floodplain forests, dieback and tree mortality episodes have been attributed to sudden hydrological deteriorations caused by soil water drainages [4]. Nevertheless, studies of growth decline and mortality in floodplain forests are scarce despite their particular conditions (water-saturated soils and high air humidity), which may explain why drought is not always considered a major driver of dieback there (but see [7,8]), as compared with other sites with a lower soil water availability [9,10,11].
Radial growth is enhanced by warmer conditions during the growing season in floodplain forests, whereas drought and water shortage may also negatively impact growth [12]. Tree growth in floodplain forests also decreases when the underground water level is reduced through water pumping [13] or due to rising groundwater table and waterlogging [14,15]. These growth responses have been extensively studied in native species such as the pedunculate oak (Quercus robur L.; hereafter oak) [12,16,17], but retrospective information regarding the responses of introduced species to drought is scarce in their invaded areas. It could be argued that native species will be less vulnerable to drought-induced growth decline and mortality than introduced tree species which may not have developed tolerance strategies to local conditions. To answer that question, we compare the responses to drought of the native oak and the introduced N-fixing black locust (Robinia pseudoacacia L.) since both tree species coexist, but the introduced species may show a wider ecological niche and higher phenotypic plasticity, explaining its invasiveness [18].
Trees stressed by drought are likely to be more susceptible to disease [19]. Stressors such as fungal pathogens have been described in many cases of oak dieback associated with wet places such as floodplain forests (e.g., Phytophthora species), but their presence has not always been tested [20,21,22]. Thus, it remains to be answered if oak mortality is mostly caused by fungal pathogens that successfully colonize trees previously weakened by drought [23]. Here, we address the role played by drought and fungal pathogens in oak dieback and mortality, since this is a major native species in floodplain forests, as has been done in other species showing dieback [24].
In this study, we characterize the soil features, radial growth, wood anatomy, and tree-ring C isotope discrimination (δ13C) in living and recently dead trees of a native (oak) and an introduced (black locust) species coexisting in the same floodplain forest within the Ticino regional park in Northwest Italy. Since the early 2000s, large areas (ca. 9000 ha) of this area have been affected by dieback and mortality events, with oak individuals showing a high rate of annual mortality (5 to 10%), especially between 2004 and 2006 [25]. We aim to discern if native and introduced tree species are similarly affected by drought. We also assess the presence of Phytophthora species in oak individuals (declining or recently dead vs. asymptomatic trees), because these pathogen species have often been associated with oak decline and mortality across Europe [20]. We hypothesize that drought caused recent growth decline and mortality in both tree species, but impacted the introduced species more than the native species, whilst the pathogen Phytophthora contributed to worsen oak health. We expect that synergistic interactions between drought stress and Phytophthora would contribute to reducing tree vigor and amplifying dieback. Trees that died could also be predisposed to drought-induced mortality because they form a xylem prone to cavitation (large lumen area) and may be poorly adapted for withstanding a water shortage [8]. We hypothesize that dead trees will show a less conservative use of water characterized by larger vessel diameters and lower δ13C (i.e., lower intrinsic water-use efficiency, iWUE hereafter) than living trees. Lastly, we expect that drought will also negatively affect the ability of black locust to fix N and therefore recently dead trees of this species will have lower N soil concentrations than living trees.

2. Material and Methods

2.1. Study Area and Tree Species

The study site is a mixed floodplain forest (La Fagiana), occupying an area of ca. 500 ha, situated in the “Parco Lombardo della Valle del Ticino” (Lonate-Pozzolo basin), in a flat area close to the Ticino river (8°49′ E, 45°26′ N, 115 m a.s.l.) located about 30 km west of Milan city in Northwest Italy. The main tree species in the study forest are: oak (Quercus robur), ash (Fraxinus excelsior L.), black alder (Alnus glutinosa (L.) Gaertn.), elm (Ulmus minor Mill.), and hornbeam (Carpinus betulus L.). These species are replaced, mainly in gaps and open areas created by clear-felling, by introduced tree species such as black locust (Robinia pseudoacacia), American cherry (Prunus serotina Ehrh.), tree of heaven (Ailanthus altissima (Mill.) Swingle), and red oak (Quercus rubra L.). In this area, mean oak density and basal area are 40 individuals ha−1 and 12.0 m2 ha−1, respectively, whereas black locust density and basal area are 251 individuals ha−1 and 14.3 m2 ha−1, respectively [26].
According to climate data from the nearby Abbiategrasso station (8°55′ E, 45°24′ N, 122 m a.s.l.), climate in the study area is temperate and humid with a mean annual temperature of 12.6 °C and annual total precipitation of 1030 mm. Months with the highest and lowest precipitations are October (122 mm) and January (59 mm), respectively. Coldest and warmest months are January (0.8 °C) and July (24.6 °C), respectively. The study area is characterized by the presence of the highly-permeable Upper Po Plain shallow aquifer, which is constituted by gravel and sand deposits over discontinuous clay layers located at least 50 m below the land surface [27]. Substrate is dominated by sandy loam soils.
Oak is a deciduous, flood-tolerant species which can endure high ground-water levels due to a high density of intercellular spaces, and the capacity to form shallow adventitious roots and hypertrophied lenticels [28,29], but it also tolerates waterlogging by maintaining relatively constant soluble carbohydrate concentrations in the roots [30]. Oak is one of the European tree species more sensitive to drought [31]. According to local reports, annual oak mortality in the study area shifted from 5 to 10% from 2004 to 2006 [25]. In the most affected stands, 90% of mature specimens (ca. 50 years old trees) showed decline symptoms (crown dieback and thinning, epicormics shoots, leaf yellowing, etc.) and at least 30% of them were dead [32]. The black locust is a deciduous, shade-intolerant tree species native to the eastern USA but naturalized in Europe. It is a pioneer species forming a shallow root system which is able to fix N, but it does not tolerate compact or water-logged soils [33,34]. Both study species form ring-porous and dense wood and are considered anisohydric [35].

2.2. Climate, Drought, and Hydrology Data

Monthly climate data (mean temperature, precipitation) for the period 1950–2015 were obtained from the 0.5°-gridded CRU TS ver. 4.01 climate dataset which has been subjected to previous quality-check and homogeneity tests [36]. Monthly climate data were converted into seasonal values (December, January and February, winter; March, April and May, spring; June, July and August, summer; September, October and November, autumn) either by averaging (temperature) or summing (precipitation). The changes in drought severity were assessed by downloading the Standardized Precipitation Evapotranspiration Index (SPEI) from the Global Drought Monitor webpage (http://spei.csic.es/index.html). The SPEI is a multiscalar drought index which accounts for the effect of temperature and evapotranspiration on water availability and shows negative and positive values indicating dry and wet conditions, respectively [37]. We calculated six-month long summer and spring SPEI values since they overlapped with most of the oak growing season. In both 0.5°-gridded climate and SPEI datasets, we used data corresponding to the grid delimited by coordinates 8.0–8.5° E and 45.0–45.5° N. Shifts in the SPEI were calculated to detect changes in drought severity significant at the 0.05 level. These significant shifts were detected using a robust shift detection technique and considering cut-off segments lengths of 10 years [38].
Since 1980, water table depth has been measured in Abbiategrasso (located at 5 km from the sampling site) using a piezometer drilled up to a depth of 50 m and these data were provided by the Ticino Water Consortium.

2.3. Field Sampling and Tree-Ring Data (Growth and Wood Anatomy)

In the field, we randomly sampled 15 pairs of living-dead and dominant trees for both tree species. Recently dead trees were identified by having stem bark and preserving fine branches and shoots, but being completely defoliated. We measured the diameter at breast height (Dbh, measured at 1.3 m) and tree height of all trees using tapes and an electronic Vertex hypsometer (Vertex IV/360°, Haglöf Sweden AB, Långsele, Västernorrland, Sverige), respectively. We took two cores per tree using Pressler increment borers.
Radial growth is driven by the carbon use of cambial sinks and reflects the changes in tree vitality and primary productivity [39]. Therefore, dendroecological analyses allow researchers to link past stress conditions and growth reductions prior to tree death [40]. To assess changes in radial growth and wood anatomy, we used dendrochronology [41]. Wood samples were air–dried and the surface of the cores was transversally cut using a sledge core microtome [42]. Tree rings were visually cross-dated and measured with a precision of 0.01 mm using a binocular microscope and the semiautomatic LINTAB software (version 5, Rinntech, Heidelberg, Germany). The COFECHA program [43] was used to evaluate the visual cross-dating of the tree-ring series. To quantify growth variability, we transformed the tree-ring widths into annual basal area increment (BAIt) using the following formula:
BAIt = π (Rt2Rt−12)
where Rt is the radius of the tree and t is the year of tree–ring formation. Mean BAI values and mean first-order autocorrelation (AR1) values were calculated at decadal scales (1980–1989, 1990–1999, 2000–2009) to use them as predictive variables in mortality models fitted to oak and black locust data. It is expected that trees that died show a more serially-correlated growth than surviving trees prior to the dieback onset [40]. The final period 2010–2015, prior to tree death, was also considered to calculate mean BAI values for living and dead trees. To estimate tree age at 1.3 m, when a core did not reach the pith, the number of missing rings was estimated by interpolating the distance to the pith using the curvature of the innermost rings of the core.
Earlywood hydraulic diameters (Dh) were obtained for living (n = 5) and recently dead (n = 5) trees of both species which showed the highest correlations with the mean growth series of each group to maximize their common signal. These wood-anatomy data were obtained for the 2006–2015 period, when we assumed living and recently dead trees would show clearly divergent growth trends. Semi-thin transversal sections (20-µm thick) were obtained from one core per tree by dividing it into pieces of approximately 2 cm in length. Sections were cut using a sliding microtome (Microm HM 400, Thermo Sci., Walldorf, Germany) and stained with safranin (1%) and astrablue (2%), dehydrated with ethanol (70%, 95% and 100%) and xylol, and mounted on microscope slides using Eukitt® (Sigma-Aldrich, Saint Louis, MO, USA). Images were captured at 40 × magnification using a transmitted light microscope (Zeiss Microscopy, Jena, Germany). Vessels were analyzed in a tangential window and were defined as those with lumen diameters larger than 50 µm and located in the first half of the ring. Vessel lumen diameter was measured along the radial direction using the ImageJ software [44]. Based on a previous study [45], we focused on comparing the earlywood Dh between living and dead oaks, and Dh was calculated as follows:
Dh = 2 (Σr5r4)
where r is the conduit radius [46].

2.4. Carbon Isotopes in Wood

Since carbon isotopic discrimination (δ13C) is a result of the preferential use of 12CO2 over 13CO2 during photosynthesis in C3 plants as oaks [47], we use its values in tree-ring wood as a proxy of changes in iWUE. The same five living and five dead oaks used for wood-anatomy analyses were selected to measure C isotope discrimination. The whole tree-ring latewood was carefully separated from one core of each selected tree using scalpels and considering again the 2006–2015 period, which was included in the sapwood. The resulting wood samples were milled to a fine powder using a ball mill (Retsch ZM1, Haan, Germany). We used intact wood tissue for isotope analyses since it accurately reflects iWUE in hardwood tree species, as well as α-cellulose [48]. For δ13C, milled wood samples were weighed into tin foil capsules and combusted using a Flash EA-1112 elemental analyser interfaced with a Finnigan MAT Delta C isotope ratio mass spectrometer (Thermo Fisher Scientific Inc., Waltham, MA, USA). For δ13C analyses, precision was better than 1.5%. Isotope ratios were expressed as per mil deviations using the δ notation. All isotopic analyses were carried out at the Stable Isotope Facility (Univ. California, Davis, CA, USA).

2.5. Comparing Living and Recently Dead Trees: Features, Mortality, and Growth Models

Tree characteristics of both species were compared using t tests. We used the Wilcoxon rank-sum test to check if BAI differed between living and trees that died because this non-parametric test is robust against deviations from normal distributions and the presence of temporal autocorrelation [49].
Logistic regression models were used to study the influence of intrinsic (Dbh, height, age, mean decadal BAI and AR1—first-order autocorrelation—values) and climate variables on tree death. In previous studies, we have shown that taller oaks were more prone to survive after drought than smaller oaks [50]. We applied Firth’s bias-Reduced penalized-likelihood logistic regression [51,52]. Forward selection based on a penalized likelihood ratio test was applied to select the best subset of predictors. For the final selected model, we calculated the Area Under the Curve (AUC) of the Receiver Operator Characteristic, a statistic assessing the classification ability of the model, and the McFadden pseudo-R2, which is a measure of the predictive strength of the model.
Generalized additive Mixed Effect Models (GAMM) [53] were used to describe the variation in radial growth of the two tree species. Specifically, we modelled how BAI varies with the additive increase of time. GAMM has been applied in similar studies to test for the differences in growth trends between healthy and declining or recently dead trees of the same tree species [40]. To test for the differences in growth between living and trees that died and for the influence of different variables, we created a GAMMs that contained the following predictors: year, Dbh, summer (June to August) mean temperature and total precipitation. We included an interaction between year and tree status (dead vs. living) to detect differences in growth trends between dead and living trees. We did not consider predictor tree age because it was collinear with Dbh, and radial-growth rates are usually more dependent on Dbh [40]. We included an AR1 structure to account for the serial dependency of BAI values. We also included tree identity as a random factor since tree-ring width measurements represent repeated measures done across time along the same individual. BAI was log-transformed (log x+1) prior to the analyses.
To quantify climate-growth associations, we focused on summer conditions since drought during that season has been shown to adversely affect oak growth in floodplain forests (e.g., [12]). We used BAI and calculated a corrected significance level (Pcorr) to account for the presence of autocorrelation [54]. Water table depth was not considered since it was available since 1980 and it contained many missing data. All statistical analyses were done using the R statistical software [55].

2.6. Detection of Phytophthora Presence and Soil Features

We focused on the detection of Phytophthora root rot since this aggressive pathogen has often been associated with decline and mortality problems in oak forests across Europe [56,57]. To evaluate whether dieback was associated with soilborne Phytophthora infection, we sampled the rhizosphere of all symptomatic or recently dead oak trees (n = 10) and of coexisting but asymptomatic oak trees (n = 10). Approximately 400 g of shallow soil was collected after removing the organic layer from three points situated below the crown of each oak taken at a mean 25 cm depth in the A horizon. These samples were pooled for each tree. Soil baiting was carried out following [58] using fresh leaves of beech (Fagus sylvatica L.), oak, and cork oak (Quercus suber L.) as baits. Baits were inspected regularly over two weeks, and necrotic spots were plated on CMA-PARPBH medium [59] and then incubated at 20 °C in dark conditions. Within two to four days, Phytophthora-like colonies were transferred onto V8 agar media [60], and stored at 20 °C.
Soils below dead (n = 10) and asymptomatic (n = 10) black locust trees were sampled as explained before in the case of oaks. The C and N concentrations, the texture (sand and loam percentages), the pH, and the electrical conductivity of soil samples were also assessed to test if they differ between living and dead trees. Soil texture was determined with the laser diffraction method in a Coulter Mastersizer 2000 and clay content was corrected [61]. Soil C and N concentrations and the C/N ratio were determined with an elemental analyzer (Elementar VarioMAX N/CM, Hanau, Germany).

3. Results

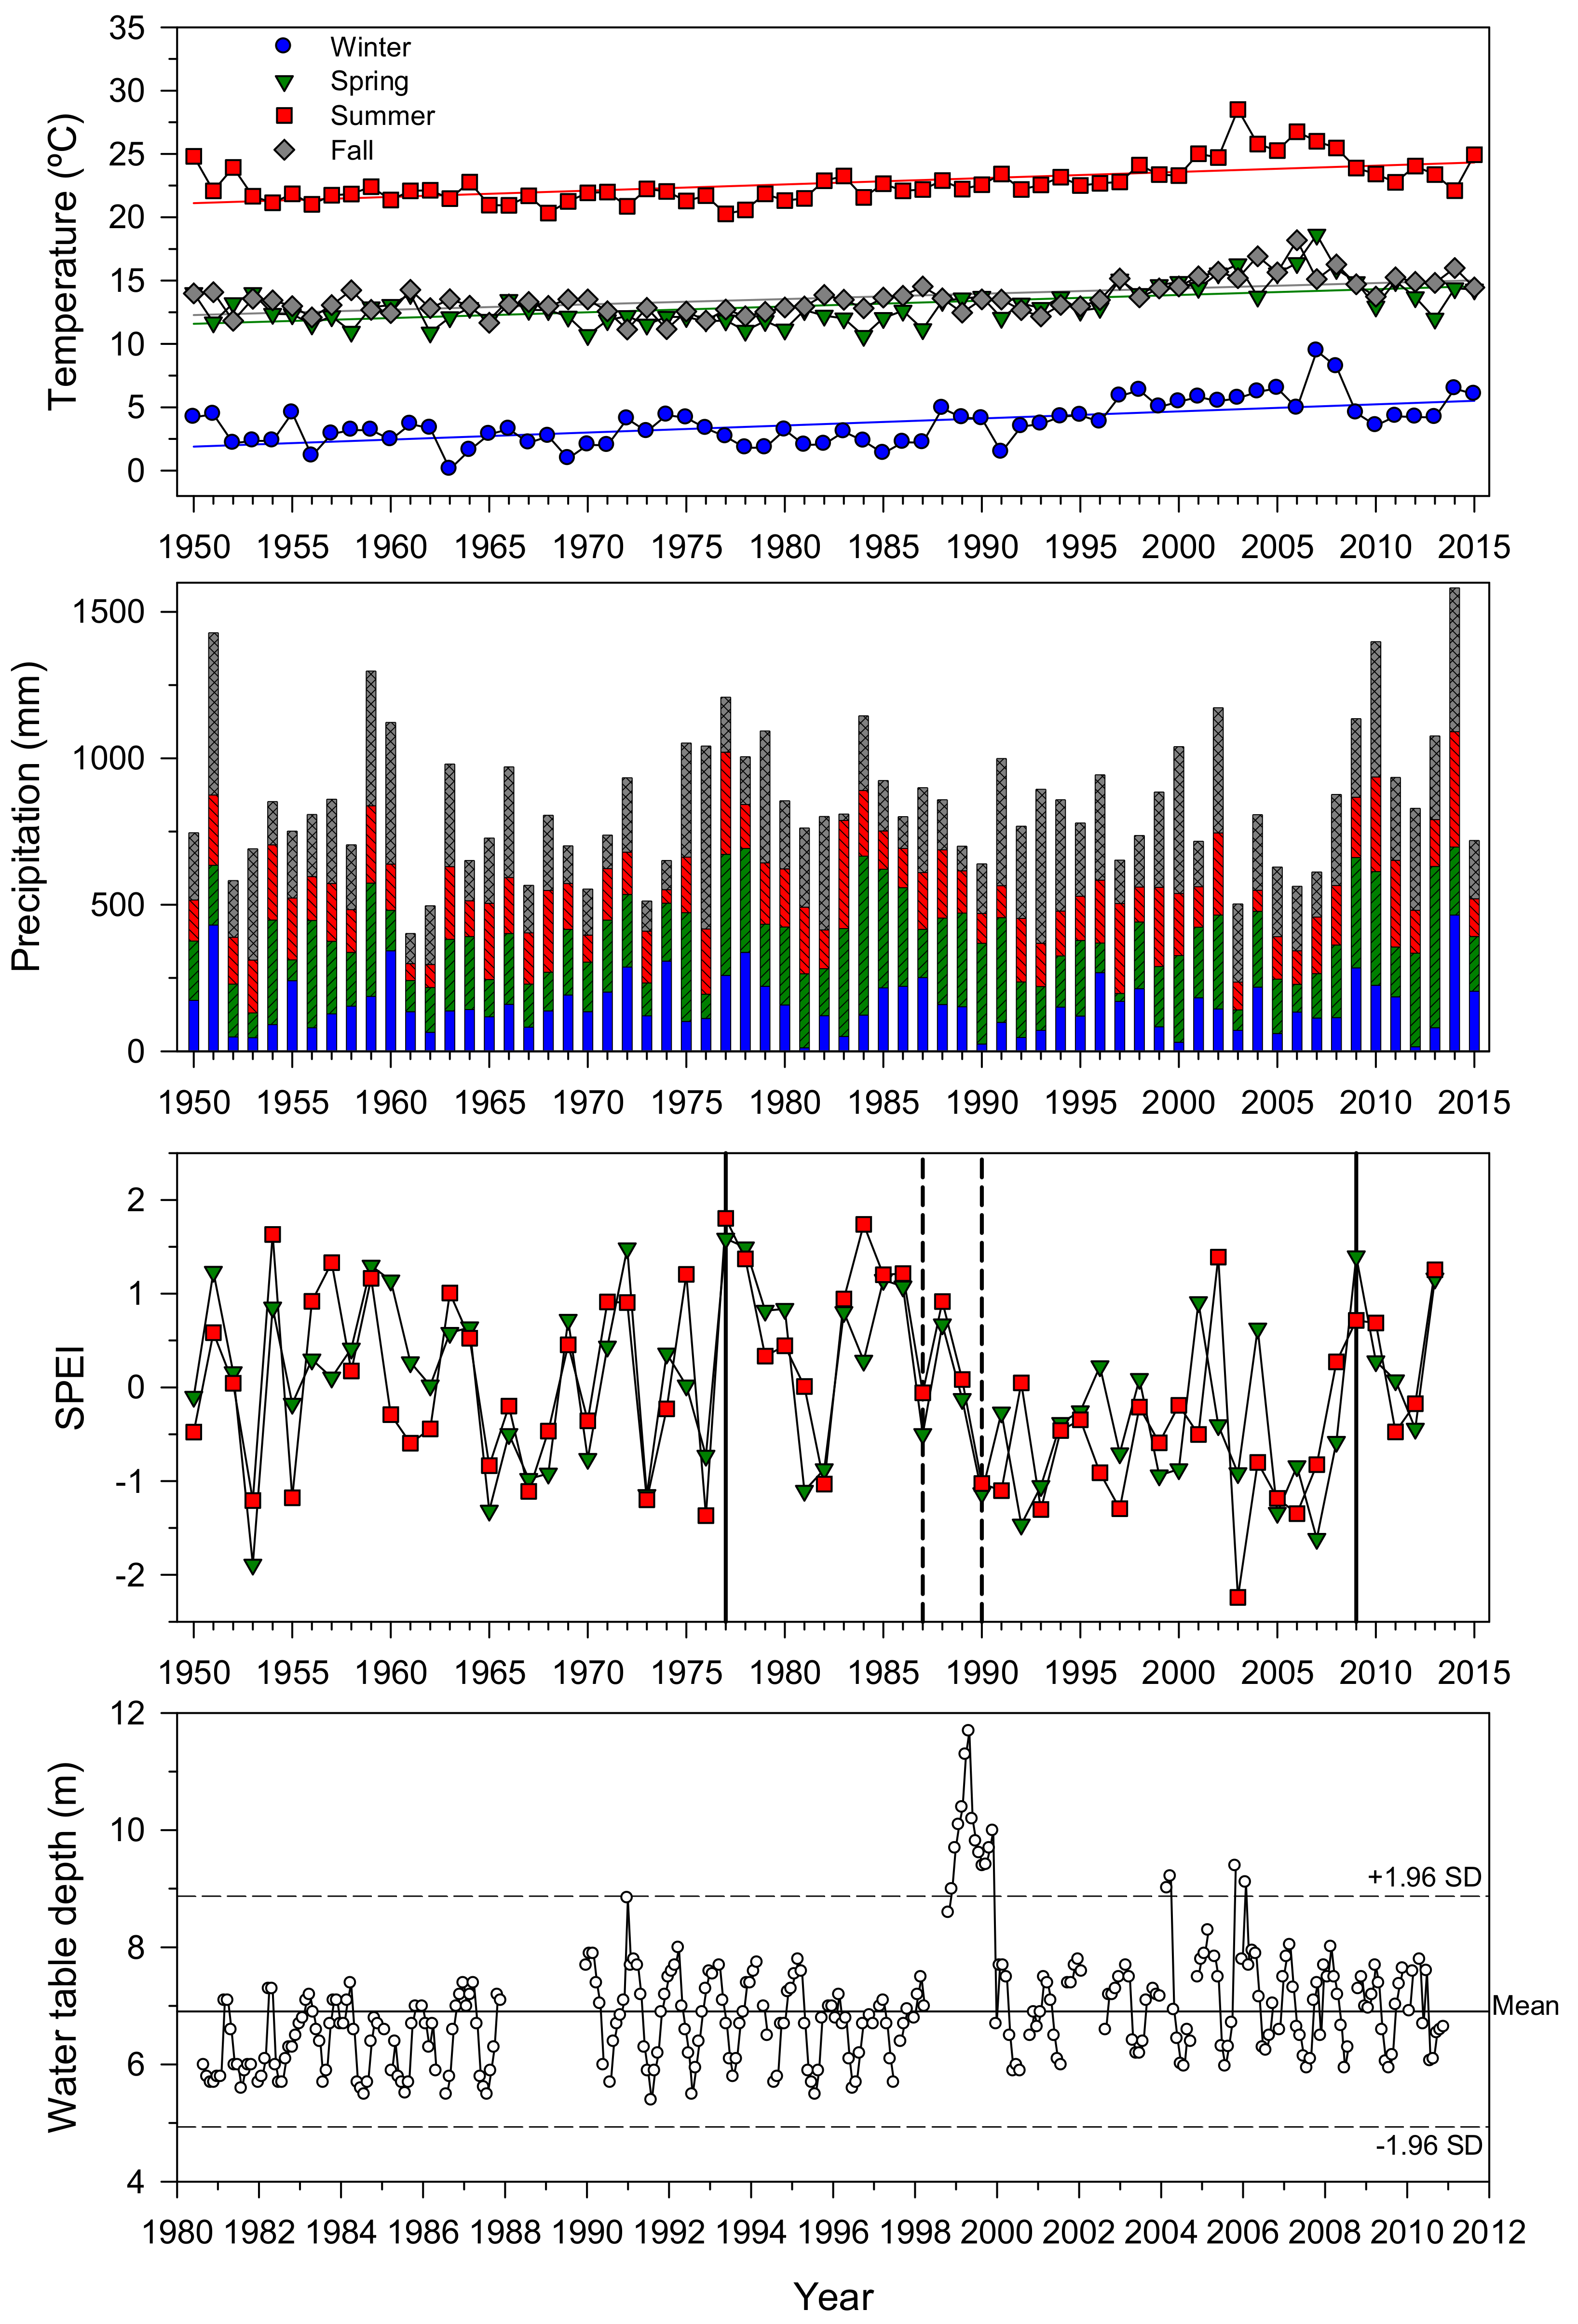
3.1. Climate, Drought, and Water Table Depth: Trends and Temporal Variability

In the study area, seasonal temperatures have been increasing since the 1950s, whereas precipitation did not present any clear trend (Figure 1). According to six-month long summer and spring SPEI values, the most severe droughts occurred in the 1950s (1953) and 2000s (2003). We detected positive SPEI shifts in 1977 and 2009 showing transitions to wet periods, but the negative SPEI shifts detected in 1987 and 1990 emphasized the beginning of the longest dry period since 1950 (1990–2008). Lastly, we detected a major increase in the water table depth in 1999 followed by minor increases in 2004 and 2005 (Figure 1).

3.2. Characteristics of Living and Recently Dead Trees

Living oaks were taller than dead oaks (Table 1). The last ring of half dead oaks was formed in 2015, whereas the other half formed it in 2014. In black locust, all trees that died except one formed the last ring in 2015. The basal area increment (BAI) reached the stable mature phase (Figure 2) earlier (1960s) in oak (mean age of 82 years) than in black locust (1980s), which were younger (mean age of 53 years) (Table 1). BAI started diverging between living and trees that died of both species in the mid-1970s, after the 1976 drought, but this divergence became significant in the early 1990s (oak in 1991 and black locust in 1992, Figure 2) when severe droughts occurred from 1990 to 1993. During 1992–2015, mean BAI (±SE) of living oaks was 24.9 ± 1.1 cm2 year−1, whereas BAI of dead oaks was 13.6 ± 1.0 cm2 year−1. In black locust, mean BAI values of living and recently dead trees were 6.4 ± 0.3 and 2.9 ± 0.2 cm2 year−1, respectively. These recent BAI declines corresponded to an average growth loss of 45% (oak) to 55% (black locust) (Figure 2).

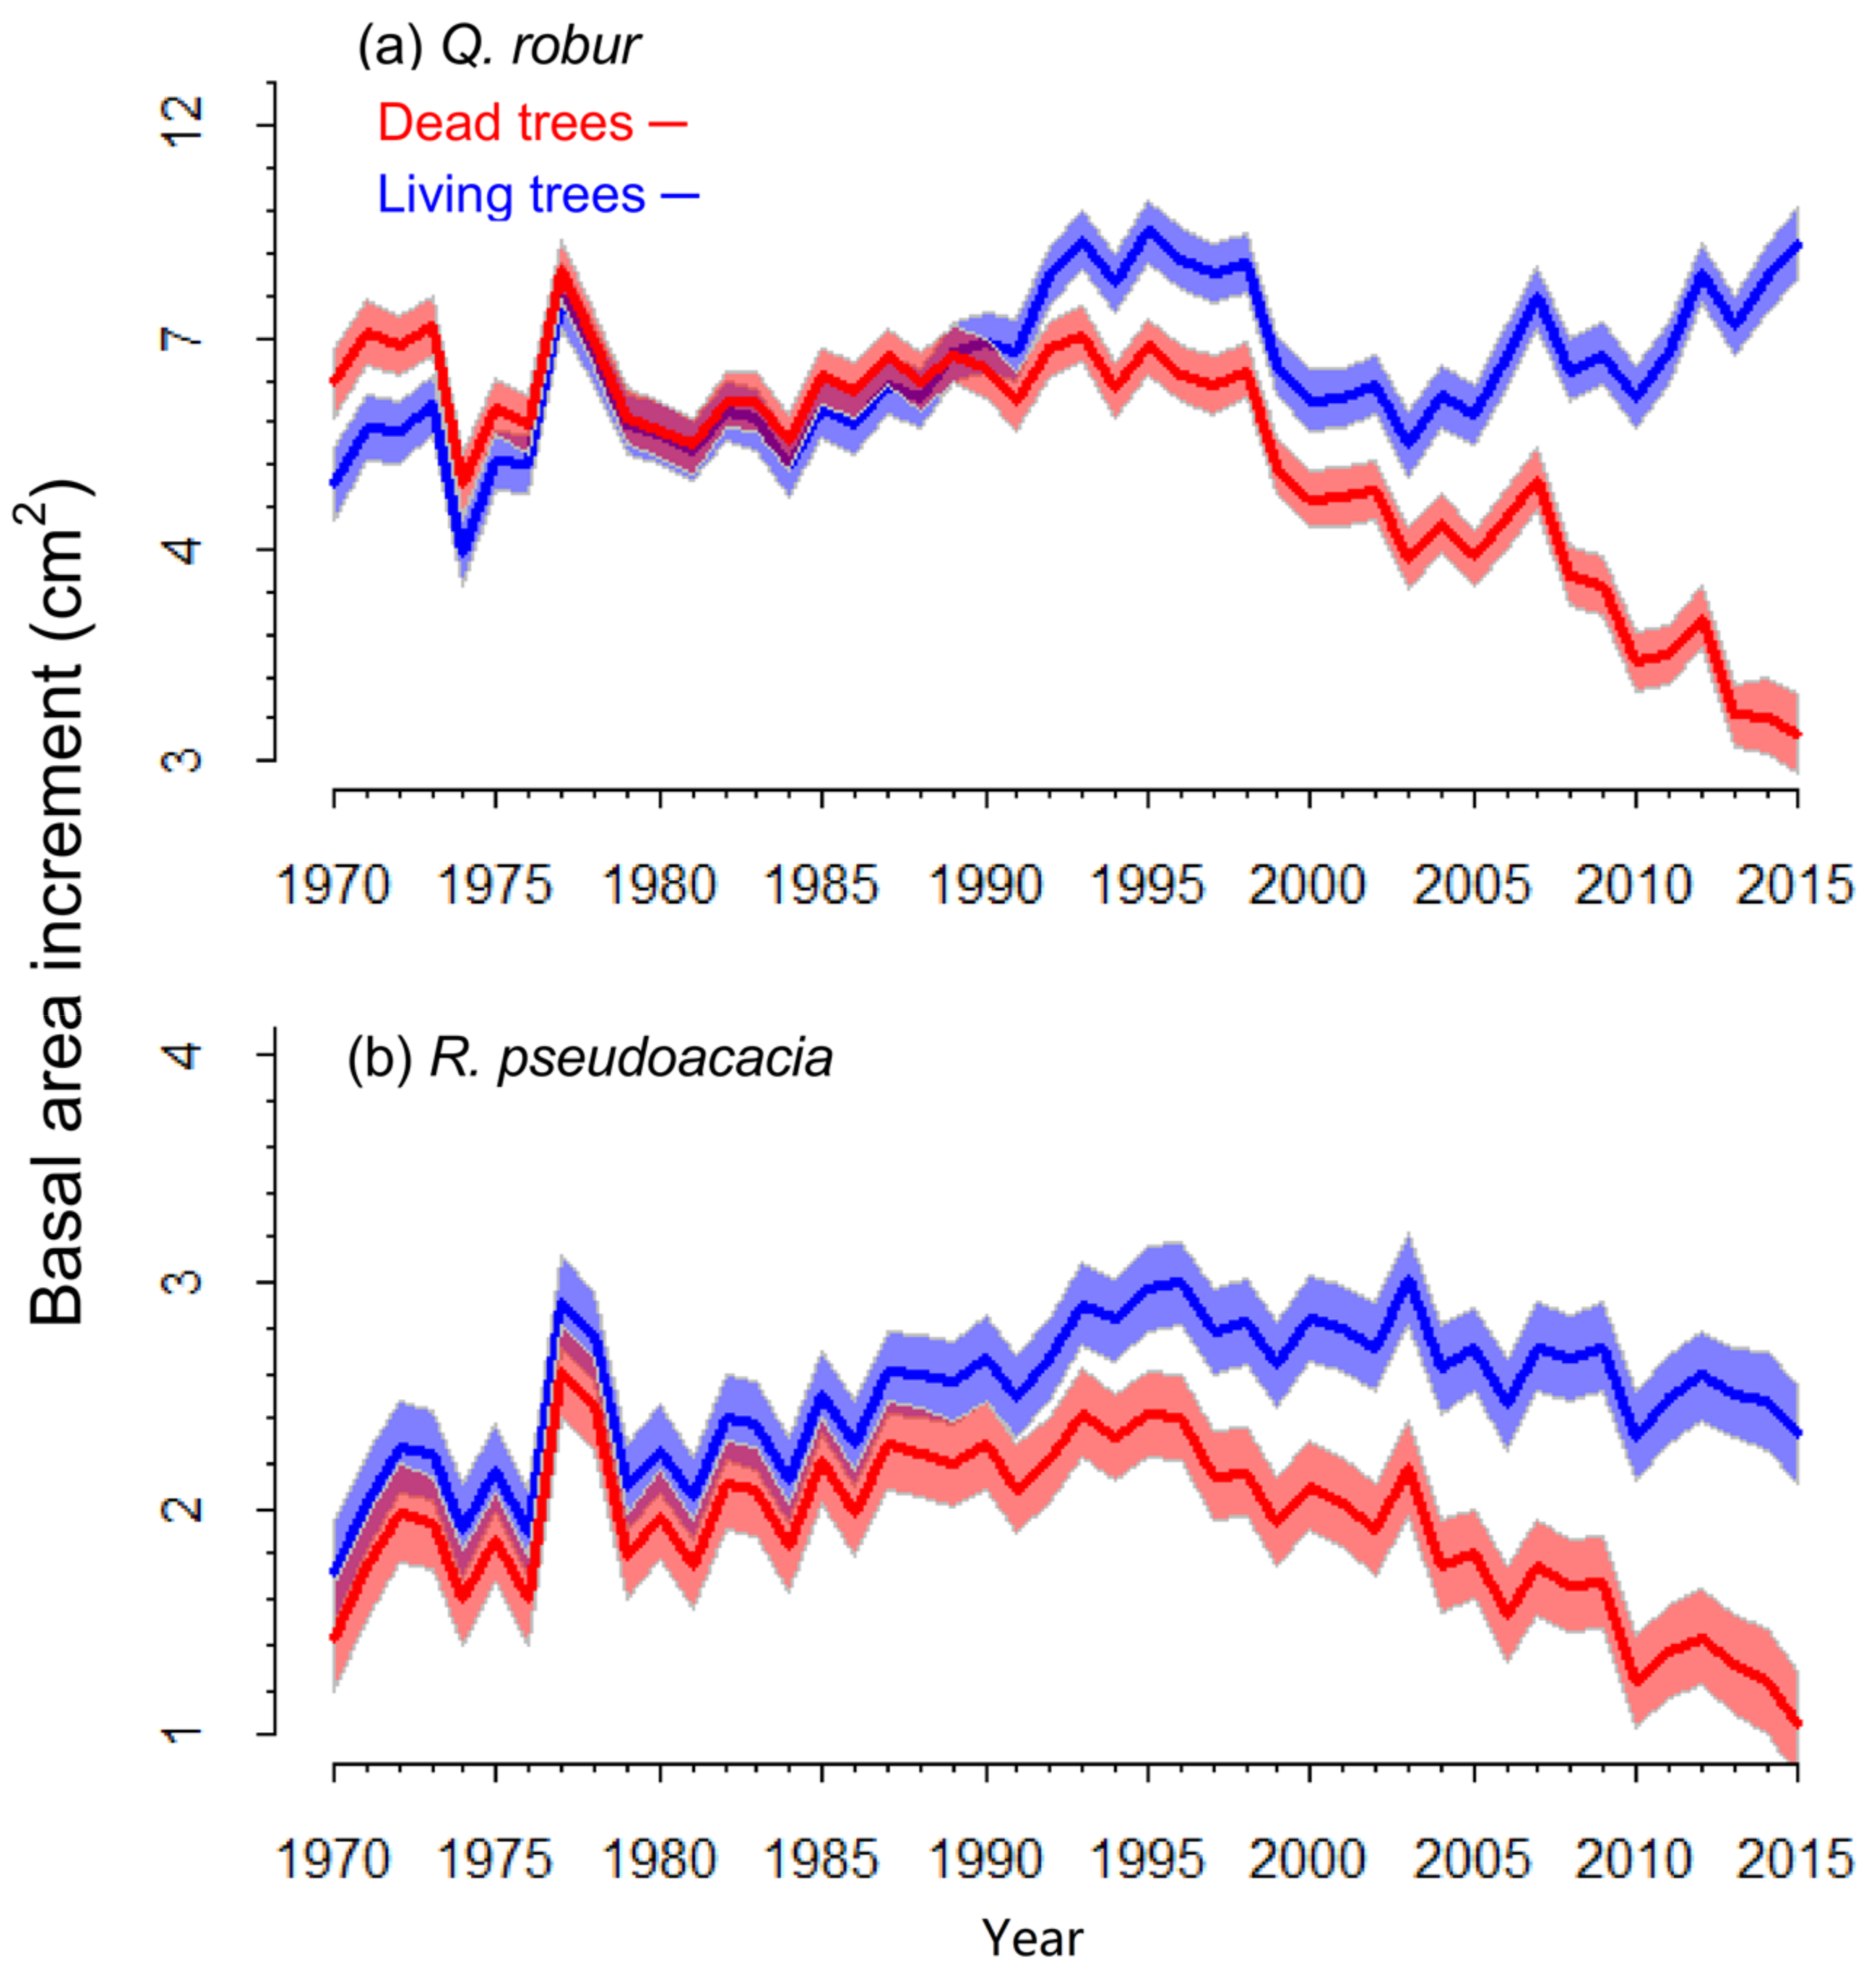
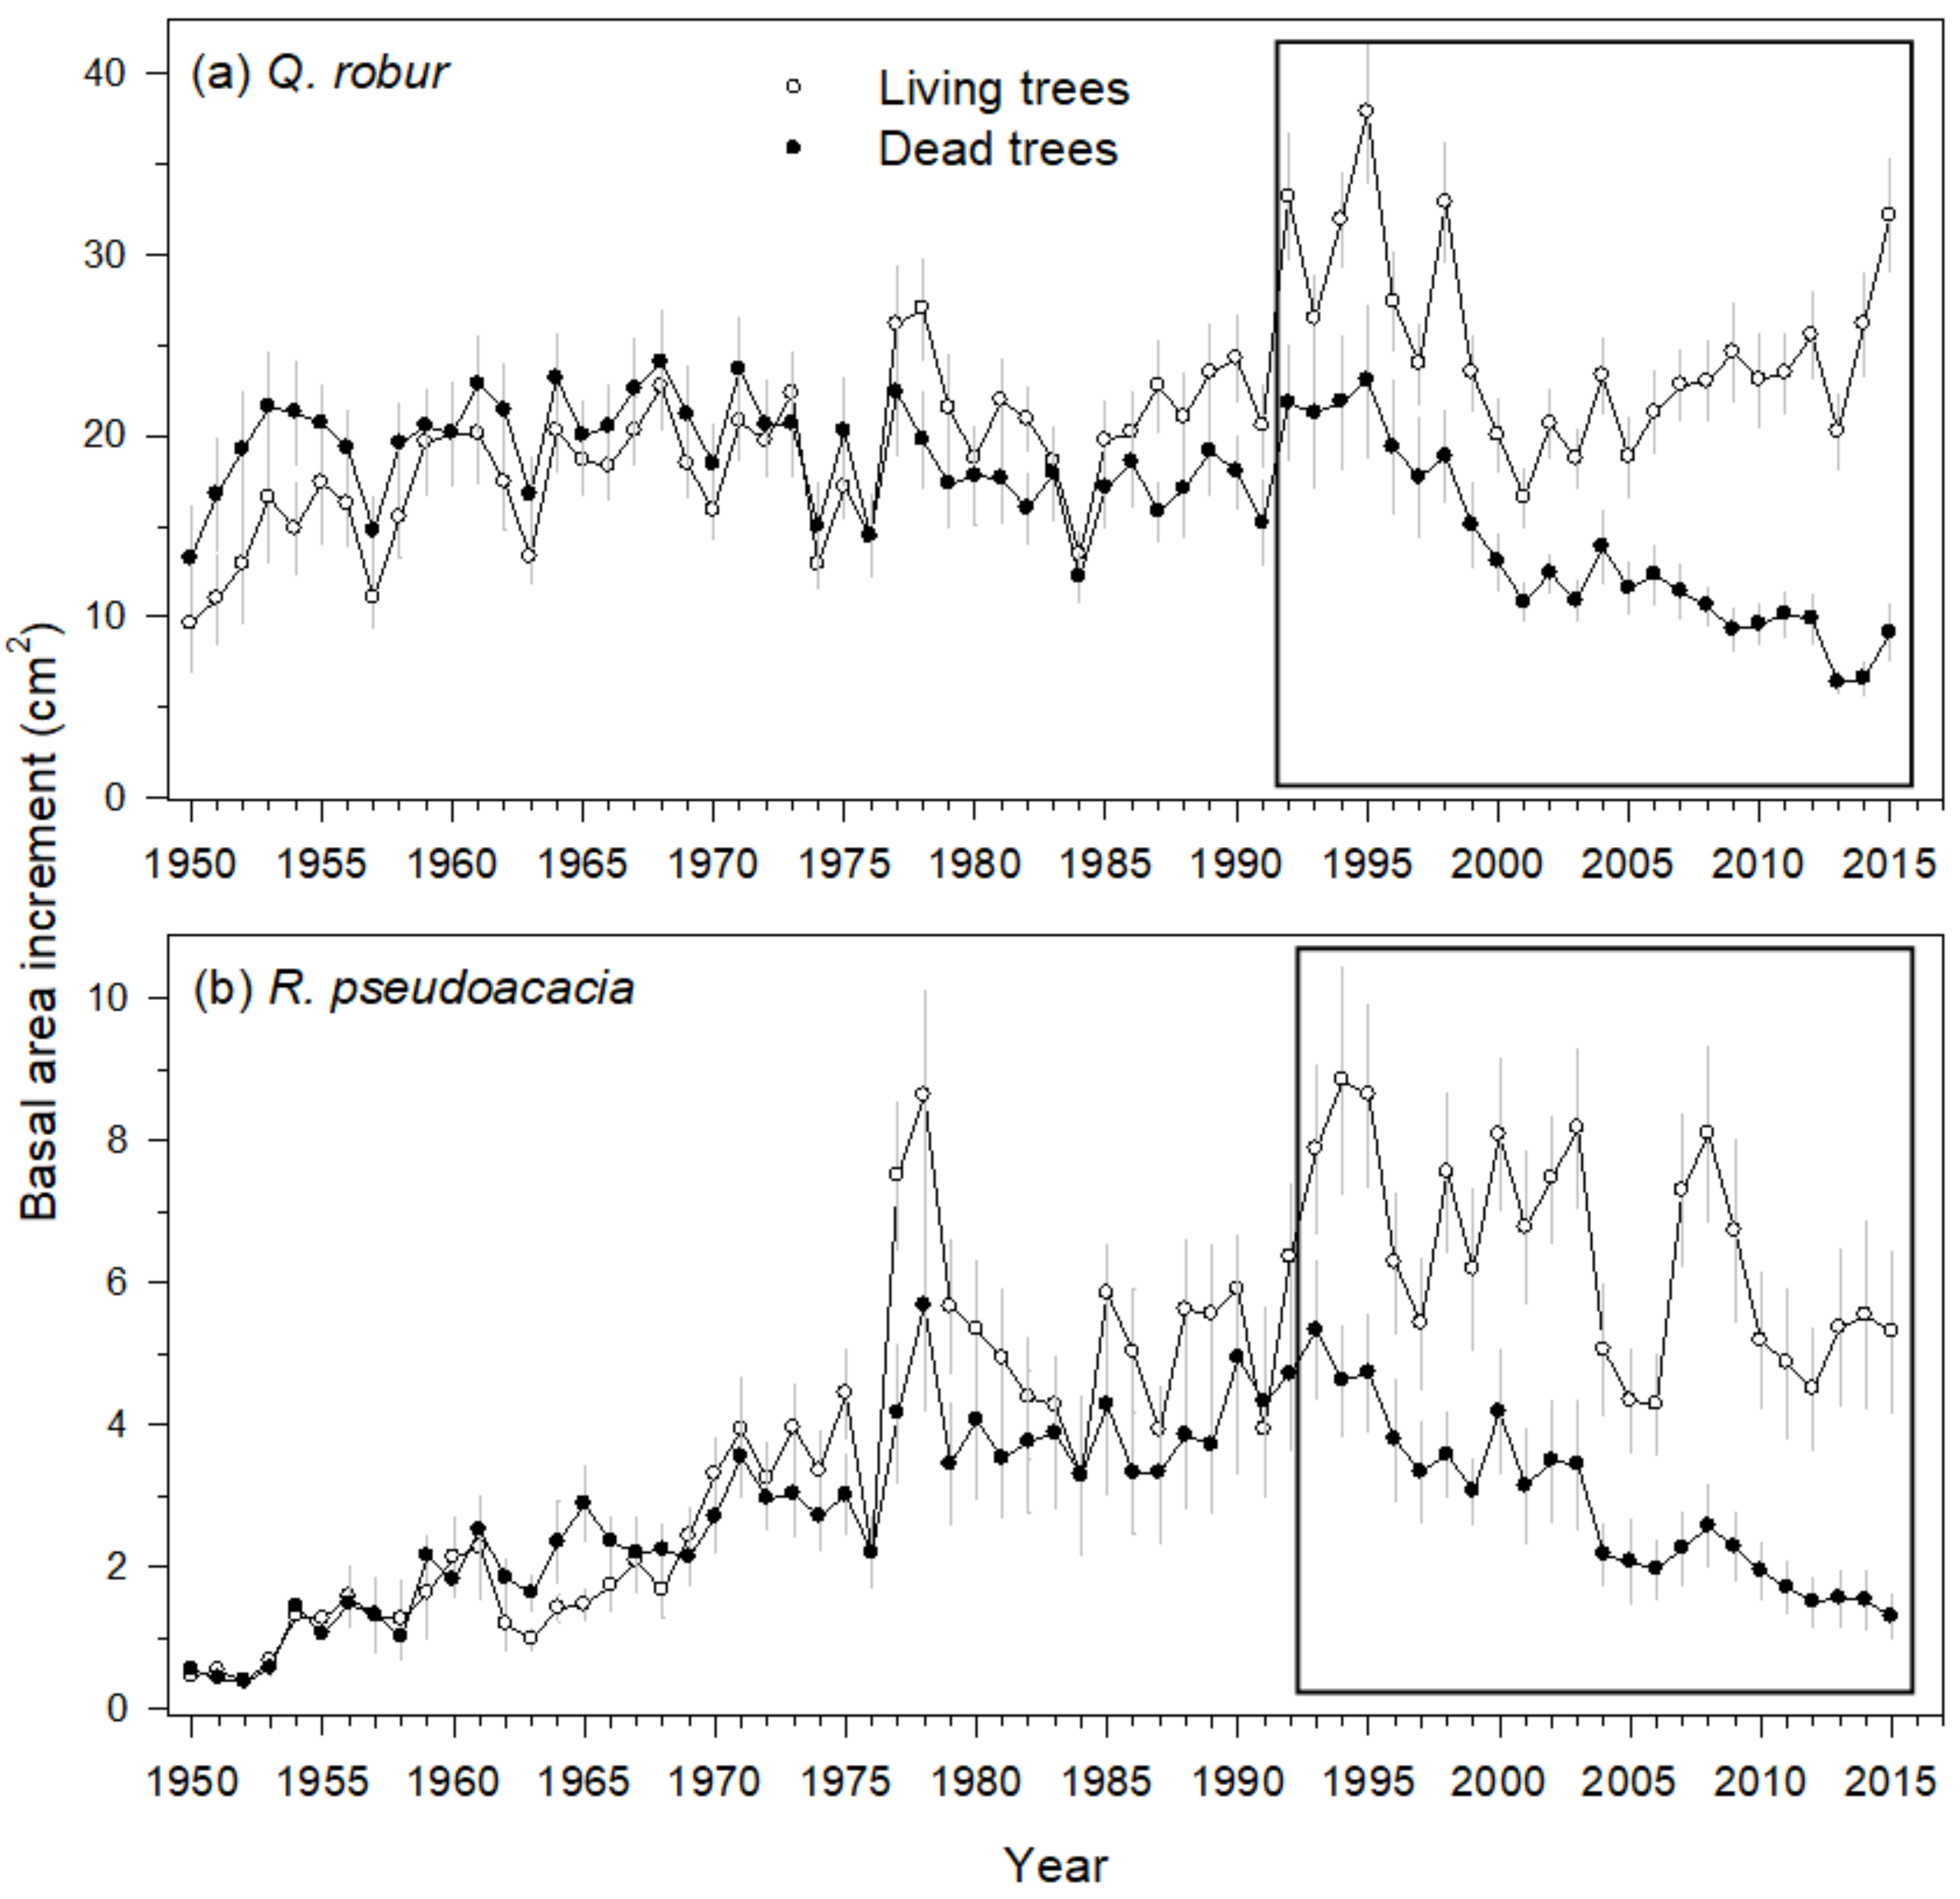
3.3. Mortality and Growth Models

The logistic regression model for oak was fitted including age (estimated coefficients ± SE 0.27 ± 0.14; χ2 = 3.67; p = 0.06) and mean BAI for the period 2010–2015 (−0.65 ± 0.28; χ2 = 5.53; p = 0.02). The AUC of the final model was 0.99 with a McFadden pseudo-R2 of 0.91. The model for black locust was created using the mean BAI for the period 2010–2015 (−0.80 ± 0.36; χ2 = 10.79; p < 0.01) and the AR1 for the period 1990–1999 (6.63 ± 3.37; χ2 = 7.98; p < 0.01). The AUC of the model was 0.99 and the McFadden pseudo-R2 was 0.57. The GAMMs selected as the main driver of recent BAI variability the status of trees and summer temperature (Table 2). In oak, tree status (living vs. dead tree) and size (Dbh, height) were the main factors explaining BAI variability, whereas in black locust, tree status, Dbh, and summer temperature explained BAI variability. The R2 values associated with these models were 0.49 and 0.43 in the case of oak and black locust, respectively.
The correlation between BAI of dead oaks and summer temperatures was negative and significant (r = −0.58, p < 0.01), whereas it was not in living oaks (r = 0.18, p = 0.14). Regarding precipitation, only BAI of dead oaks responded positively to wet June conditions (r = 0.36, p < 0.01). In black locust, both living (r = 0.48, p < 0.001) and trees that died (r = 0.25, p = 0.05) showed positive BAI responses to August temperatures. The predicted BAI values for living and trees that died of both species started diverging significantly in the early 1990s, and slightly in the 1980s in the case of black locust (Figure 3), in agreement with the observed differences in BAI (Figure 2).

3.4. Wood Anatomy and Isotope Discrimination in Living and Dead Oaks

Regarding the hydraulic diameter (Dh) of earlywood vessels measured for the 2006–2015 period, it was significantly (p < 0.05) smaller in dead than in living trees of both species (Table 3). Living trees also showed significantly higher δ13C values than dead trees in both species.

3.5. Phytophthora Presence and Soil Characteristics

We found Phytophthora-like isolates in one dead oak, which were identified as P. cinnamomi based on distinct morphology (clusters of globoid hyphal swellings, thin walled chlamydospores, and faint stellate pattern of growth on V8 agar). Soils of living and dead trees were similar regarding their physical and chemical characteristics (Table 4), except in the case of black locust dead trees, which showed a lower soil N concentration than living trees of the same species. Oak soils showed a significantly higher electrical conductivity than black-locust soils (t = 3.20, p = 0.03).

4. Discussion

The climate shift from wet to dry conditions in the early 1990s triggered the oak dieback and mortality event here characterized as we hypothesized. The elevation in the late 1990s of the groundwater table depth did not affect tree growth (Figure 1), and drought seems to be the most plausible trigger of the dieback. The 1990s drying was linked to warmer conditions and a decrease in precipitation during the growing season. The radial growth of living and trees that died started diverging in the mid-1970s and the divergence amplified and become significant in the early 1990s in response to this severe drought (Figure 2). This growth divergence was driven by tree vigour and summer temperatures since warmer conditions enhanced evapotranspiration rates and amplified drought stress (Table 2, Figure 1 and Figure 3). This was further confirmed by the climate-BAI correlations since recently dead trees, particularly oaks, were very sensitive to warmer summer conditions. Summer temperature and drought have been shown to constrain the radial growth of several ring-porous oak species [62,63], albeit in wet sites summer temperature may favor growth [64]. Oak trees prone to death have also been characterized to be particularly sensitive to drought stress on shallow soils [65]. The higher sensitivity of dead oaks to summer warm and dry conditions as compared with living oaks may be explained by the fact that the former developed a shallower or less efficient root system or had a lower sapwood hydraulic capacitance than surviving trees. Black locust is also sensitive to successive droughts which trigger growth cessation and reduce carbon uptake [66]. This species may also grow less and be more drought-stressed, showing higher iWUE values in mixed than in pure stands [35], which could explain its current decline in the study floodplain forest. We acknowledge that the growth divergence between living and trees that died was a long process and trees that died in the early 21st century may have been already weakened by competition for water or nutrients, making them less competitive to withstand water shortage. However, we expect this complex response was partially solved by our effort to only sample dominant trees.
Our findings do not support the idea that the pathogen Phytophthora cinnamomi contributed to worsening tree health, since we only found it in one recently dead oak and soil features were similar between dead and living trees (Table 4). In other studies on drought-induced oak dieback [8], the presence of Phytophthora was discarded albeit no explicit analysis was performed as we conducted here. Nevertheless, it is also possible that Phytophthora spp. infected some trees previously and it could not be detected later because it was displaced by other microorganisms.
Soilborne Phytophthora species are water mold fungi abundant in wet and moist sites or where soil water infiltration is low, such as the study floodplain site [57]. However, we were only able to detect P. cinnamomi in one of the twenty studied trees and this infected tree corresponded to the symptomatic or declining class. Thus, the role played by pathogens in this mortality process differs from other oak canker diseases caused by Phytophthora ramorum and reaching epidemic proportions in California [67]. Phytophthora species may remain undetected [56] or only be associated with some trees causing their growth decline, whilst other declining trees are only affected by drought stress. Infection by Phytophthora leading to epidemic and widespread mortality rates such as those characterizing the Californian sudden oak death seems to be associated with exotic pathogens such as P. ramorum affecting cool and moist areas [67].
We found a lower N concentration in soils below dead than below living black locust trees, indicating that the dieback negatively affected the ability of this tree species to fix N [68]. In black locust, reductions in soil water availability decrease growth and photosynthate availability, promote leaf shedding, and negatively affect N-fixing bacteria by reducing nodule biomass, leading to tree death in some cases [69,70,71]. Nevertheless, greenhouse experiments based on seedlings have showed that moderate droughts exacerbate soil N deficiency but increase the biomass of nodules, thus benefitting the black locust over non-fixing tree species [72]. Therefore, it remains an open question to know the effects of recurrent and severe drought on the N-fixing ability of black locust and its persistence, given that this species often improves soil N availability in diverse temperate forest types even several decades after the removal of black locust [73]. The similar N soil concentrations found below oak and living black locust suggest they shared comparable soil nutrient availability. The high electrical conductivity of soils below oaks which could indicate mobility of N compounds as nitrate due to flooding events is also remarkable, explaining the similar N soil data observed in both tree species, or increased salinity and reduced availability for some important nutrients such as P (Table 4). In sites with nutrient-poor or shallow soils, oaks with canopy dieback (defoliation above 60%) show low growth rates and reach a threshold in their ability to recover after drought [65,74,75,76].
Recent growth (mean BAI for the period 2010–2015, i.e., five years prior to tree death) was the main predictor of the probability of tree death, whilst age also influenced tree mortality in oak and height differed between living and dead oaks (Table 2). Such growth patterns are within the temporal range of years showing a growth reduction prior to tree death (5–25 years) observed in other temperate Quercus species [77]. Oak dieback and death can be a long-lasting process and tree mortality has been shown to lag behind the timing of the growth-decline onset [17,75,78]. For instance, it has been observed that the pre-mortem growth reduction of dead oaks occurred about ten years before most trees died [76]. Despite previous BAI trends or AR1 not being selected by the logistic models, except for the AR1 for the period 1990–1999 in black locust, the GAMMs clearly illustrated that the growth of dead and living trees diverged up to 25 years prior to their death in both tree species.
We found that dead oaks were characterized as smaller than surviving oaks, as previously reported [17,50]. This suggests that a smaller size predisposes to drought-induced dieback and death through a lower capacity to buffer the negative effects of soil water deficit by increasing hydraulic capacitance [79]. The higher vulnerability of anisohydric oak species may be explained because they rely on hydraulic capacitance to mitigate the risk of hydraulic failure associated with maintaining high transpiration rates during drought [80]. However, we did not detect such a difference in black locust, despite it also being considered anisohydric [35], which suggests other factors may be involved (root depth, different size, and hydraulic architecture).
In contrast with other studies based on oak [8] and pine species [81,82], trees that died neither produced xylem vessels with a larger diameter nor showed higher iWUE. Recently, dead trees formed smaller earlywood vessels than living trees and this reduction in lumen area was paralleled by more negative δ13C values in both species (Table 3). This seems contradictory since a reduction in vessel area should decrease the hydraulic conductivity and lead to higher δ13C values (improved iWUE) in species with a stomatal conductance very sensitive to drought such as oak. However, we found a lower iWUE in dead trees, as hypothesized, indicating a lower water use and suggesting either a reduction in photosynthesis rates or a poor regulation of stomatal conductance, as found in drought-prone Mediterranean oak forests experiencing dieback [45]. Determining if the iWUE decline of dead trees was due to a lower photosynthesis rate or to a higher stomatal conductance rate, or to the combined effects of both, would require analyses of tree-ring oxygen (δ18O) data [83]. The higher iWUE of surviving trees suggests they displayed higher photosynthesis rates or adopted a more conservative strategy of water use during drought, in agreement with what was found in other species such as Pinus nigra [84].
The hypothesis on vessel diameter was refuted. Similar wood-anatomical differences were observed between declining and non-declining Quercus frainetto Ten. trees after a severe drought, with healthy trees forming wider vessels [45]. Others have reported declines in vessel diameter of other ring-porous oak species in response to severe droughts [85], which can be caused by a reduced turgor during vessel enlargement. In floodplain forests, altered hydrology leading to a reduction in water supply also causing a reduction in radial growth and vessel area has been shown in poplar [86]. In general, water shortage during the growing season might increase oak susceptibility to further water deficit if some earlywood vessels lose functionality through xylem cavitation and the formation of tyloses [87]. Overall, wood anatomy and C isotope discrimination indicate that dead trees were prone to die because they were less efficient in their water use than surviving trees, but not because they produced wider vessels with a greater vulnerability to implosion.
Finally, the regeneration of light-demanding species like oak and black locust is favored by disturbances creating large openings, but drought-induced dieback mainly generates small gaps due to the death of single trees or small patches of trees, thus favoring hornbeam or elm and resulting in forests with mixed broadleaved species but a lower abundance of oak [26]. If climate continues warming and drying we expect higher mortality rates in black locust and oak based on previous studies carried out in mixed hardwood forests [69] and according to the findings reported here. This should be tested in future studies to ascertain if such changes would diminish N inputs via N2 fixation in similar floodplains or wet forests.

5. Conclusions

Drought was the main triggering factor of the dieback and mortality episodes we detected in two species, the native oak and the introduced black locust, inhabiting a temperate floodplain forest. Drought and warmer summer conditions in the early 1990s preceded tree death, which peaked about 25 years later. Phytophthora was only found in one dead oak, so its role as a mortality driver is uncertain. Trees that died formed smaller vessels and showed lower tree-ring δ13C than living trees. This indicates that dead trees were not hydraulically predisposed to drought-induced xylem cavitation but were characterized by a less efficient use of water than surviving trees.

Acknowledgments

This research was funded by the projects “Convenzione Rotondella” (Rotondella Administration, Basilicata Region, Italy) and CGL2015-69186-C2-1-R project (Spanish Ministry of Economy). M.C. was supported by the PhD program from the course of Agricultural, Forest and Food Science at the University of Basilicata (Italy).

Author Contributions

M.C. and R.S.-S. performed field sampling and tree-ring measurements; F.R. and M.C. designed the field procedures; A.G. performed most statistical analyses; J.O. and M.A.R. did the Phythopthora analyses; M.C., J.J.C., and F.R. lead the writing of the paper and authors discussed it and contributed to data interpretation.

Conflicts of Interest

The authors declare no conflict of interest.

References

  1. Lugo, A.E. Forestry in the Anthropocene. Science 2015, 349, 771. [Google Scholar] [CrossRef] [PubMed]
  2. Allen, C.D.; Macalady, A.K.; Chenchouni, H.; Bachelet, D.; McDowell, N.; Vennetier, M.; Kitzberger, T.; Rigling, A.; Breshears, D.D.; Hogg, E.H.; et al. A global overview of drought and heat-induced tree mortality reveals emerging climate change risks for forests. For. Ecol. Manag. 2010, 259, 660–684. [Google Scholar] [CrossRef]
  3. Anderegg, W.R.L.; Kane, J.M.; Anderegg, L.D.L. Consequences of widespread tree mortality triggered by drought and temperature stress. Nat. Clim. Chang. 2012, 3, 30–36. [Google Scholar] [CrossRef]
  4. Stojanović, D.B.; Levanič, T.; Matović, B.; Orlovic, S. Growth decrease and mortality of oak floodplain forests as a response to change of water regime and climate. Eur. J. For. Res. 2015, 134, 555–567. [Google Scholar] [CrossRef]
  5. Lockaby, B.G. Floodplain ecosystems of the Southeast: Linkages between forest and people. Wetlands 2009, 29, 407–412. [Google Scholar] [CrossRef]
  6. Lageard, J.G.A.; Drew, I.B. Hydrogeomorphic control on tree growth responses in the Elton area of the Cheshire Saltfield, UK. Geomorphology 2008, 95, 158–171. [Google Scholar] [CrossRef]
  7. Horáček, P.; Šlezingerová, J.; Gandelová, L. Analysis of cambial activity and formation of wood in Quercus robur L. under conditions of a floodplain forest. J. For. Sci. 2003, 49, 412–418. [Google Scholar] [CrossRef]
  8. Levanič, T.; Čater, M.; McDowell, N.G. Associations between growth, wood anatomy, carbon isotope discrimination and mortality in a Quercus robur forest. Tree Physiol. 2011, 31, 298–308. [Google Scholar] [CrossRef] [PubMed]
  9. Tessier, L.; Nola, P.; Serre-Bachet, F. Deciduous Quercus in the Mediterranean region–tree-ring/climate relationships. New Phytol. 1994, 126, 355–367. [Google Scholar] [CrossRef]
  10. Bréda, N.; Badeau, V. Forest tree responses to extreme drought and some biotic events: Towards a selection according to hazard tolerance? Comp. Rend. Geosci. 2008, 340, 651–662. [Google Scholar] [CrossRef]
  11. Friedrichs, D.A.; Büntgen, U.; Frank, D.C.; Esper, J.; Neuwirth, B.; Löffler, J. Complex climate controls on 20th century oak growth in Central-West Germany. Tree Physiol. 2009, 29, 39–51. [Google Scholar] [CrossRef] [PubMed]
  12. Tumajer, J.; Treml, V. Response of floodplain pedunculate oak (Quercus robur L.) tree ring width and vessel anatomy to climatic trends and extreme hydroclimatic events. For. Ecol. Manag. 2016, 379, 185–194. [Google Scholar] [CrossRef]
  13. Čejková, A.; Poláková, S. Growth responses of sessile oak to climate and hydrological regime in the Zbytka Nature Reserve, Czech Republic. Geochronometria 2012, 39, 285–294. [Google Scholar] [CrossRef]
  14. Rozas, V.; García-González, I. Too wet for oaks? Inter-tree competition and recent persistent wetness predispose oaks to rainfall-induced dieback in Atlantic rainy forest. Glob. Planet. Chang. 2012, 94, 62–71. [Google Scholar] [CrossRef] [Green Version]
  15. Scharnweber, T.; Couwenberg, J.; Heinrich, I.; Wilmking, M. New insights for the interpretation of ancient bog oak chronologies? Reactions of oak (Quercus robur L.) to a sudden peatland rewetting. Palaeogeogr. Palaeoclim. Paleoecol. 2015, 417, 534–543. [Google Scholar] [CrossRef]
  16. Drobyshev, I.; Niklasson, M.; Eggertsson, O.; Linderson, H. and Sonesson, K. Influence of annual weather on growth of pedunculate oak in southern Sweden. Ann. For. Sci. 2008, 65, 512. [Google Scholar] [CrossRef]
  17. Andersson, M.; Milberg, P.; Bergman, K.-O. Low pre-death growth rates of oak (Quercus robur L.)—Is oak death a long-term process induced by dry years? Ann. For. Sci. 2011, 68, 159–168. [Google Scholar] [CrossRef]
  18. Walther, G.R.; Roques, A.; Hulme, P.E.; Sykes, M.T.; Pyšek, P.; Kühn, I.; Zobel, M.; Bacher, S.; Botta-Dukát, Z.; Bugmann, H.; et al. Alien species in a warmer world: Risks and opportunities. Trends Ecol. Evol. 2009, 24, 686–693. [Google Scholar] [CrossRef] [PubMed]
  19. Thomas, F.M.; Blank, R.; Hartmann, G. Abiotic and biotic factors and their interactions as causes of oak decline in Central Europe. For. Pathol. 2002, 32, 277–307. [Google Scholar] [CrossRef]
  20. Brasier, C.M. Phytophthora cinnamomi and oak decline in southern Europe. Environmental constraints including climate change. Ann. Sci. For. 1996, 53, 347–358. [Google Scholar] [CrossRef]
  21. Führer, E. Oak decline in central Europe: A synopsis of hypotheses. In Proceedings: Population Dynamics, Impacts, and Integrated Management of Forest Defoliating Insects; USDA Forestry Service, General Technical Report NE-247; U.S. Department of Agriculture, Forest Service, Northeastern Research Station: Radnor, PA, USA, 1998; pp. 7–24. [Google Scholar]
  22. Helama, S.; Sohar, K.; Läänelaid, A.; Mäkelä, H.M.; Raisio, J. Oak decline as illustrated through plant-climate interactions near the northern edge of species range. Bot. Rev. 2016, 82, 1–23. [Google Scholar] [CrossRef]
  23. Wargo, P.M. Consequences of environmental stress on oak: Predisposition to pathogens. Ann. For. Sci. 1996, 53, 359–368. [Google Scholar] [CrossRef]
  24. Sangüesa-Barreda, G.; Camarero, J.J.; Oliva, J.; Montes, F.; Gazol, A. Past logging, drought and pathogens interact and contribute to forest dieback. Agric. For. Meteorol. 2015, 208, 85–94. [Google Scholar] [CrossRef]
  25. DEPFAR Project. Indagini Diagnostiche sul Deperimento Della Farina nei Boschi Della Valle del Ticino; Consorzio Parco Lombardo della Valle del Ticino: Pontevecchio di Magenta, Italy, 2006. [Google Scholar]
  26. Motta, R.; Nola, P.; Berretti, R. The rise and fall of the black locust (Robinia pseudoacacia L.) in the “Siro Negri” Forest Reserve (Lombardy, Italy): Lessons learned and future uncertainties. Ann. For. Sci. 2009, 66, 410. [Google Scholar] [CrossRef]
  27. Stefanelli, S.; Della Rocca, F.; Bogliani, G. Saproxylic beetles of the Po plain woodlands, Italy. Biodivers. Data J. 2014, 2, e1106. [Google Scholar] [CrossRef] [PubMed]
  28. Schmull, M.; Thomas, M.F. Morphological and physiological reactions of young deciduous trees (Quercus robur L., Q. petraea [Matt.] Liebl., Fagus sylvatica L.) to waterlogging. Plant Soil 2000, 225, 227–242. [Google Scholar] [CrossRef]
  29. Glenz, C.; Schlaepfer, R.; Iorgulescu, I.; Kienast, F. Flooding tolerance of Central European tree and shrub species. For. Ecol. Manag. 2006, 235, 1–13. [Google Scholar] [CrossRef]
  30. Ferner, E.; Rennenberg, H.; Kreuzwieser, J. Effect of flooding on C metabolism of flood tolerant (Quercus robur) and non-tolerant (Fagus sylvatica) tree species. Tree Physiol. 2012, 32, 135–145. [Google Scholar] [CrossRef] [PubMed]
  31. Dreyer, E.; Bousquet, F.; Ducrey, M. Use of pressure volume curves in water relation analysis on woody shoots: Influence of rehydration and comparison in four European oak species. Ann. For. Sci. 1990, 47, 285–297. [Google Scholar] [CrossRef]
  32. Saracchi, M.; Bottigiola, C.; Lanticina, M.; Vailati, A.M.; Parco, V.; Caronni, F. Further studies on oak decline distribution in Lombardy. J. Plant Pathol. 2005, 87, 305. [Google Scholar]
  33. Huntley, J.C. Robinia pseudoacacia. In Hardwoods: Silvics of North America; Burns, R.M., Honkala, B.H., Eds.; USDA: Washington, DC, USA, 1990; pp. 755–761. [Google Scholar]
  34. Vítková, M.; Tonika, J.; Müllerová, J. Black locust–successful invader of a wide range of soil conditions. Sci. Total Environ. 2015, 505, 315–328. [Google Scholar] [CrossRef] [PubMed]
  35. Wang, L.; Dai, Y.; Sun, J.; Wan, X. Differential hydric deficit responses of Robinia pseudoacacia and Platycladus orientalis in pure and mixed stands in northern China and the species interactions under drought. Trees 2017, 31, 2011–2021. [Google Scholar] [CrossRef]
  36. Harris, I.; Jones, P.D.; Osborn, T.J.; Lister, D.H. Updated high-resolution grids of monthly climatic observations–the CRU TS3.10 Dataset. Int. J. Climatol. 2014, 34, 623–642. [Google Scholar] [CrossRef] [Green Version]
  37. Vicente-Serrano, S.M.; Beguería, S.; López-Moreno, J.I. A multi-scalar drought index sensitive to global warming: The Standardized Precipitation Evapotranspiration Index-SPEI. J. Clim. 2010, 23, 1696–1718. [Google Scholar] [CrossRef]
  38. Rodionov, S.N. A sequential algorithm for testing climate regime shifts. Geophys. Res. Lett. 2004, 31, L09204. [Google Scholar] [CrossRef]
  39. Dobbertin, M. Tree growth as indicator of tree vitality and of tree reaction to environmental stress: A review. Eur. J. For. Res. 2005, 124, 319–333. [Google Scholar] [CrossRef]
  40. Camarero, J.J.; Gazol, A.; Sangüesa-Barreda, G.; Oliva, J.; Vicente-Serrano, S.M. To die or not to die: Early-warning signals of dieback in response to a severe drought. J. Ecol. 2015, 103, 44–57. [Google Scholar] [CrossRef]
  41. Fritts, H.C. Tree Rings and Climate; Academic Press: New York, NY, USA, 1976. [Google Scholar]
  42. Gärtner, H.; Nievergelt, D. The core-microtome: A new tool for surface preparation on cores and time series analysis of varying cell parameters. Dendrochronologia 2010, 28, 85–92. [Google Scholar] [CrossRef]
  43. Holmes, R.L. Computer—Assisted quality control in tree—Ring dating and measurement. Tree-Ring Res. 1983, 43, 69–78. [Google Scholar]
  44. Schneider, C.A.; Rasband, W.S.; Eliceiri, K.W. NIH Image to ImageJ: 25 years of image analysis. Nat. Methods 2012, 9, 671–675. [Google Scholar] [CrossRef] [PubMed]
  45. Colangelo, M.; Camarero, J.J.; Battipaglia, G.; Borghetti, M.; De Micco, V.; Gentilesca, T.; Ripullone, F. A multi-proxy assessment of dieback causes in a Mediterranean oak species. Tree Physiol. 2017, 37, 617–631. [Google Scholar] [CrossRef] [PubMed]
  46. Sperry, J.S.; Nichols, K.L.; Sullivan, J.E.M.; Eastlack, S.E. Xylem embolism in ring-porous, diffuse-porous, and coniferous trees of Northern Utah and Interior Alaska. Ecology 1994, 75, 1736–1752. [Google Scholar] [CrossRef]
  47. Farquhar, G.D.; Richards, R.A. Isotopic composition of plant carbon correlates with water-use efficiency of wheat genotypes. Aust. J. Plant Physiol. 1984, 11, 539–552. [Google Scholar] [CrossRef]
  48. Borella, S.; Leuenberger, M.; Saurer, M.; Siegwolf, R. Reducing uncertainties in δ13C analysis of tree rings: Pooling, milling, and cellulose extraction. J. Geophys. Res. 1998, 103, 19519–19526. [Google Scholar] [CrossRef]
  49. Gibbons, J.D.; Chakraborti, S. Nonparametric Statistical Inference; CRC Press: New York, NY, USA, 2011. [Google Scholar]
  50. Colangelo, M.; Camarero, J.J.; Borghetti, M.; Gazol, A.; Gentilesca, T.; Ripullone, F. Size matters a lot: Drought-affected Italian oaks are smaller and show lower growth prior to tree death. Front. Plant Sci. 2017, 8, 135. [Google Scholar] [CrossRef] [PubMed]
  51. Firth, D. Bias reduction of maximum likelihood estimates. Biometrika 1993, 80, 27–38. [Google Scholar] [CrossRef]
  52. Heinze, G. A comparative investigation of methods for logistic regression with separated or nearly separated data. Stat. Med. 2006, 25, 4216–4226. [Google Scholar] [CrossRef] [PubMed]
  53. Wood, S.N. Generalized Additive Models: An Introduction with R; Chapman and Hall/CRC Press: Boca Raton, FL, USA, 2006. [Google Scholar]
  54. Mudelsee, M. Climate Time Series Analysis: Classical Statistical and Bootstrap Methods; Springer: Dordrecht, The Netherlands, 2010. [Google Scholar]
  55. R Development Core Team. R: A Language and Environment for Statistical Computing; R Foundation for Statistical Computing: Vienna, Austria, 2017. [Google Scholar]
  56. Jung, T.; Cooke, D.E. L.; Blaschke, H.; Duncan, J.M.; Oßwald, W. Phytophthora quercina sp. nov., causing root rot of European oaks. Mycol. Res. 1999, 103, 785–798. [Google Scholar] [CrossRef]
  57. Jung, T.; Blaschke, H.; Oßwald, W. Involvement of soilborne Phytophthora species in Central European oak decline and the effect of site factors on the disease. Plant Pathol. 2000, 49, 706–718. [Google Scholar] [CrossRef]
  58. Jung, T. Beech decline in Central Europe driven by the interaction between Phytophthora infections and climatic extremes. For. Pathol. 2009, 39, 73–94. [Google Scholar] [CrossRef]
  59. Jeffers, S.N.; Martin, S.B. Comparison of two media selective for Phytophthora and Pythium species. Plant Dis. 1986, 70, 1038–1043. [Google Scholar] [CrossRef]
  60. Erwin, D.C.; Ribeiro, O.K. Phytophthora Diseases Worldwide; The American Phytopathological Society: St. Paul, MN, USA, 1996. [Google Scholar]
  61. Taubner, H.; Roth, B.; Tippkotter, R. Determination of soil texture: Comparison of the sedimentation method and the laser-diffraction analysis. J. Plant Nutr. Soil Sci. 2009, 172, 161–171. [Google Scholar] [CrossRef]
  62. Rozas, V. Dendrochronology of pedunculate oak (Quercus robur L.) in an old-growth pollarded woodland in northern Spain: Tree-ring growth responses to climate. Ann. For. Sci. 2005, 62, 209–218. [Google Scholar] [CrossRef]
  63. Alla, A.Q.; Camarero, J.J. Contrasting responses of radial growth and wood anatomy to climate in a Mediterranean ring-porous oak: Implications for its future persistence or why the variance matters more than the mean. Eur. J. For. Res. 2012, 131, 1537–1550. [Google Scholar] [CrossRef]
  64. Pilcher, J.R.; Gray, B. The relationships between oak tree growth and climate in Britain. J. Ecol. 1982, 70, 297–304. [Google Scholar] [CrossRef]
  65. Helama, S.; Läänelaid, A.; Raisio, J.; Tuomenvirta, H. Oak decline in Helsinki portrayed by tree-rings, climate and soil data. Plant Soil 2009, 319, 163–174. [Google Scholar] [CrossRef]
  66. Yan, W.; Zhong, Y.; Shangguan, Z. Rapid response of the carbon balance strategy in Robinia pseudoacacia and Amorpha fruticosa to recurrent drought. Environ. Exp. Bot. 2017, 138, 46–56. [Google Scholar] [CrossRef]
  67. Rizzo, D.M.; Garbelotto, M.; Davidson, J.M.; Slaughter, G.W.; Koike, S.T. Phytopththora ramorum as the cause of extensive mortality of Quercus spp. and Lithocarpus densiflorus in California. Plant Dis. 2002, 86, 205–214. [Google Scholar] [CrossRef]
  68. Rice, S.K.; Westerman, B.; Federici, R. Impacts of the exotic, nitrogen-fixing black locust (Robinia pseudoacacia) on nitrogen-cycling in a pine-oak ecosystem. Plant Ecol. 2004, 174, 97–107. [Google Scholar] [CrossRef]
  69. Elliott, K.J.; Swank, W.T. Impacts of drought on tree mortality and growth in a mixed hardwood forest. J. Veg. Sci. 1994, 5, 229–236. [Google Scholar] [CrossRef]
  70. Mantovani, D.; Veste, M.; Boldt-Burisch, K.; Fritsch, S.; Koning, L.A.; Freese, D. Carbon allocation, nodulation, and biological nitrogen fixation of black locust (Robinia pseudoacacia L.) under soil water limitation. Ann. For. Res. 2015, 58, 259–274. [Google Scholar] [CrossRef]
  71. Mantovani, D.; Veste, M.; Böhm, C.; Vignudelli, M.; Freese, D. Spatial and temporal variation of drought impact on black locust (Robinia pseudoacacia L.) water status and growth. iForest Biogeosci. For. 2015, 8, 743–747. [Google Scholar] [CrossRef]
  72. Wurzburger, N.; Miniat, C.F. Drought enhances symbiotic dinitrogen fixation and competitive ability of a temperate forest tree. Oecologia 2014, 174, 1117–1126. [Google Scholar] [CrossRef] [PubMed]
  73. Von Holle, B.; Neill, C.; Largay, E.F.; Budreski, K.A.; Ozimec, B.; Clark, S.A.; Lee, K. Ecosystem legacy of the introduced N2-fixing tree Robinia pseudoacacia in a coastal forest. Oecologia 2013, 172, 915–924. [Google Scholar] [CrossRef] [PubMed]
  74. Tainter, F.H.; Retzlaff, W.A.; Starkey, D.A.; Oak, S.W. Decline of radial growth in red oaks is associated with short-term changes in climate. Eur. J. For. Pathol. 1990, 20, 95–105. [Google Scholar] [CrossRef]
  75. Drobyshev, I.; Linderson, H.; Sonesson, K. Relationship between crown condition and tree diameter growth in southern Swedish oaks. Environ. Monit. Assess. 2007, 128, 61–73. [Google Scholar] [CrossRef] [PubMed]
  76. Sohar, K.; Helama, S.; Läänelaid, A.; Raisio, J.; Tuomenvirta, H. Oak decline in a southern Finnish forest as affected by a drought sequence. Geochronometria 2014, 41, 92–103. [Google Scholar] [CrossRef] [Green Version]
  77. Cailleret, M.; Jansen, S.; Robert, E.M.R.; Desoto, L.; Aakala, T.; Antos, J.A.; Beikircher, B.; Bigler, C.; Bugmann, H.; Caccianiga, M.; et al. A synthesis of radial growth patterns preceding tree mortality. Glob. Chang. Biol. 2017, 23, 1675–1690. [Google Scholar] [CrossRef] [PubMed]
  78. Pedersen, B.S. The role of stress in the mortality of Midwestern oaks as indicated by growth prior to death. Ecology 1998, 79, 79–93. [Google Scholar] [CrossRef]
  79. Zhang, Y.J.; Meinzer, F.C.; Hao, G.Y.; Scholz, F.G.; Bucci, S.J.; Takahashi, F.S.C.; Villalobos-Vega, R.; Giraldo, J.P.; Cao, K.F.; Hoffmann, W.A.; et al. Size-dependent mortality in a Neotropical savanna tree: The role of height-related adjustments in hydraulic architecture and carbon allocation. Plant Cell Environ. 2009, 32, 1456–1466. [Google Scholar] [CrossRef] [PubMed]
  80. Yi, K.; Dragoni, D.; Phillips, R.P.; Roman, D.T.; Novick, K.A. Dynamics of stem water uptake among isohydric and anisohydric species experiencing a severe drought. Tree Physiol. 2017, 37, 1379–1392. [Google Scholar] [CrossRef] [PubMed]
  81. Voltas, J.; Camarero, J.J.; Carulla, D.; Aguilera, M.; Oriz, A.; Ferrio, J.P. A retrospective, dual-isotope approach reveals individual predispositions to winter-drought induced tree dieback in the southernmost distribution limit of Scots pine. Plant Cell Environ. 2013, 36, 1435–1448. [Google Scholar] [CrossRef] [PubMed]
  82. Gaylord, M.L.; Kolb, T.E.; McDowell, N.G. Mechanisms of piñon pine mortality after severe drought: A retrospective study of mature trees. Tree Physiol. 2015, 35, 806–816. [Google Scholar] [CrossRef] [PubMed]
  83. Granda, E.; Alla, A.Q.; Laskurain, N.A.; Loidi, J.; Sánchez-Lorenzo, A.; Camarero, J.J. Coexisting oak species, including rear-edge populations, buffer climate stress through xylem adjustments. Tree Physiol. 2018, 38, 159–172. [Google Scholar] [CrossRef] [PubMed]
  84. Petrucco, L.; Nardini, A.; Von Arx, G.; Saurer, M.; Cherubini, P. Isotope signals and anatomical features in tree rings suggest a role for hydraulic strategies in diffuse drought-induced die-back of Pinus nigra. Tree Physiol. 2017, 37, 523–535. [Google Scholar] [PubMed]
  85. Corcuera, L.; Camarero, J.J.; Gil-Pelegrín, E. Effects of a severe drought on growth and wood-anatomical properties of Quercus faginea. IAWA J. 2004, 25, 185–204. [Google Scholar] [CrossRef]
  86. Schume, H.; Grabner, M.; Eckmüllner, O. The influence of an altered groundwater regime on vessel properties of hybrid poplar. Trees 2004, 18, 184–194. [Google Scholar] [CrossRef]
  87. Corcuera, L.; Camarero, J.J.; Sisó, S.; Gil-Pelegrín, E. Radial-growth and wood-anatomical changes in overaged Quercus pyrenaica coppice stands: Functional responses in a new Mediterranean landscape. Trees 2006, 20, 91–98. [Google Scholar] [CrossRef]
Figure 1. Climate trends in the study area (mean temperature with corresponding trend lines, seasonal precipitation) and drought severity for the 1950–2015 period (red and green symbols correspond to six-month long summer and spring SPEI values—the SPEI is the Standardized Precipitation Evapotranspiration Index), and monthly water-table depth (1980–2011 period) near the Ticino sampling site (continuous and dashed lines show the mean and the means ± 1.96 SD, respectively, corresponding to the 95% significance level). In the SPEI plot, continuous and dashed vertical lines show positive and negative shifts, respectively.
Forests 09 00205 g001
Figure 2. Patterns of basal area increment since 1950 of living (empty symbols) and dead (filled symbols) trees of (a) oak (Quercus robur) and (b) black locust (Robinia pseudoacacia). Values are means ± standard errors (SE). The boxes indicate the periods when basal area increment of living and recently dead trees significantly (p < 0.05) differed.
Forests 09 00205 g002
Figure 3. Predicted basal-area increment (log x+1 transformed data) for living (blue lines and areas) and recently dead trees (red lines and areas) of (a) oak (Quercus robur) and (b) black locust (Robinia pseudoacacia). Predictions are based on Generalized Additive Mixed Models (see Table 2). Lines and areas represent the predicted means and their standard errors, respectively.
Forests 09 00205 g003
Table 1. Main features of the sampled living and dead trees. Values are means ± SE. Different letters indicate significant (p < 0.05) differences based on t tests.
Tree SpeciesType of TreeDbh (cm)Height (m)Age at 1.3 m (Years)
Oak (Quercus robur)Living tree52.0 ± 2.425.9 ± 1.1b80 ± 4
Dead tree51.0 ± 3.120.7 ± 0.8a85 ± 4
Black locust (Robinia pseudoacacia)Living tree25.9 ± 2.013.0 ± 0.653 ± 2
Dead tree23.8 ± 1.612.2 ± 0.556 ± 2
Table 2. Parameters of the Generalized Additive Mixed Models (GAMMs) fitted to basal-area increment data of living and recently dead trees in oak (Quercus robur) and black locust (Robinia pseudoacacia) as a function of tree size (Dbh, diameter at breast height), tree status (living vs. dead tree), and summer climate (Tsum, mean summer temperature; Psum, total summer precipitation). The effective degrees of freedom (edf) of the smoothing terms are also shown. All statistics (t or F) are significant at the 0.05 level.
Tree SpeciesVariableCoefficientedfStatistic (t or F)
Quercus roburDbh0.02 ± 0.01 4.37
Height0.03 ± 0.01 2.70
Living tree 7.238.15
Dead tree 4.9232.32
Tsum 8.7818.42
Psum 5.6314.84
Robinia pseudoacaciaDbh0.05 ± 0.01 4.66
Living tree 3.287.19
Dead tree 3.2311.31
Tsum 8.3010.59
Psum 6.376.25
Table 3. Earlywood hydraulic diameters (Dh) and values of tree-ring carbon isotope discrimination (δ13C) obtained for living (n = 5) and recently dead (n = 5) trees in both study species. Data correspond to the 2006–2015 period. Values are means ± SE. Different letters indicate significant (p < 0.05) differences between the two tree types based on t tests.
Tree SpeciesType of TreeEarlywood Dh (µm)δ13C (‰)
Quercus roburLiving tree400 ± 5 b−25.3 ± 0.3 b
Dead tree320 ± 6 a−26.5 ± 0.1 a
Robinia pseudoacaciaLiving tree375 ± 8 b−25.4 ± 0.4 b
Dead tree337 ± 7 a−27.6 ± 0.5 a
Table 4. Features of soil samples taken below living and recently dead trees of both study species. Dead oak (Quercus robur) trees were those used for detecting Phytophthora root rot. Different letters indicate significant (p < 0.05) differences between the two tree types based on t tests.
Tree SpeciesType of TreeSoil pHSoil C (%)Soil N (%)Sand (%)Loam (%)Soil Electrical Conductivity (µS cm−1)
Quercus roburLiving tree3.9 ± 0.17.77 ± 1.910.37 ± 0.1178.0 ± 1.821.8 ± 1.888.7 ± 5.3
Dead tree4.0 ± 0.17.81 ± 1.190.36 ± 0.0680.8 ± 1.619.1 ± 1.585.9 ± 4.0
Robinia pseudoacaciaLiving tree4.1 ± 0.15.37 ± 0.670.36 ± 0.04b81.6 ± 1.119.8 ± 0.872.2 ± 3.6
Dead tree4.2 ± 0.14.19 ± 0.420.25 ± 0.02a81.6 ± 2.319.9 ± 1.765.6 ± 5.3

