Susceptibility of Trees to Windthrow Storm Damage in Partially Harvested Complex-Structured Multi-Species Forests

1
Ministry of Forests, Lands and Natural Resource Operations, Skeena Region, Bag 6000, Smithers, BC V0J 2N0, Canada
2
Cary Institute of Ecosystem Studies, Box AB, Millbrook, NY 12545, USA
*
Author to whom correspondence should be addressed.
Forests 2018, 9(4), 199; https://doi.org/10.3390/f9040199
Submission received: 23 March 2018
/
Revised: 4 April 2018
/
Accepted: 5 April 2018
/
Published: 11 April 2018
(This article belongs to the Section Forest Ecology and Management)
Abstract
:In Canada and elsewhere, logging practices in natural-origin forests have shifted toward retention systems where variable levels of mature trees are retained post-logging to promote a diversity of values. We examine multiple sites that experienced a wide range of prior harvest regimes (0–76% basal area removal) to evaluate how harvest intensity and proximity to a logging-created edge affects susceptibility to windthrow for a suite of tree species in complex-structured mature and old-growth mixed-species stand types in British Columbia. We found no increased susceptibility to windthrow as a function of the level of partial harvesting. We observed a reduced susceptibility to windthrow of smaller trees after partial harvesting. There were clear differences in susceptibility to windthrow among different tree species close to the edge of gaps and small openings (<1 ha in size) created by partial harvesting. Hemlock and redcedar, the two most common trees species, were unaffected by edge environments, whereas the less common conifers and deciduous species were more susceptible to windthrow along partial harvest edges. This suggests tree-marking guidelines should remove the species most prone to windthrow from edges around small openings in these forest types. Our study and others suggest use of retention systems in structurally diverse, multi-species forests does not lead to elevated risk of windthrow, especially if retention levels exceed 20–30%.
1. Introduction
Retention forestry, where variable levels of mature trees are retained after logging, is becoming a more common practice in boreal and temperate forests [1]. Globally, retention forestry is part of a more widespread shift in the management of natural-origin and managed forests toward approaches that aim to promote long-term productivity, self-organization and adaptability [2,3]. The risk of damage by wind (windthrow) after retention-forestry practices, or more generally after any type of silvicultural or logging entry that removes standing trees, is a widespread concern among forest practitioners.
Stand, site and storm conditions can influence windthrow risk in many ways [4,5]. Windthrow is generally thought to be affected by stand structure and composition (tree height, age, species, presence of pathogens), site conditions such as soil moisture and depth, landscape configuration (including local topography and location of adjacent clearings), silvicultural interventions (e.g., % basal area removal and spatial pattern of tree removal), and storm characteristics (season, wind direction, average and maximum gust wind speed). For example, windthrow in small wildlife tree patches retained after harvest (such as is commonly done in the retention system, [1]) was primarily caused by exposure to strong winds with site and stand factors playing little role [6]. An earlier review [7] found that detailed studies of how windthrow risk is influenced by different levels of removal or by the spatial pattern of tree removal are few. Albrecht et al. [4] indicated that the relative importance of interventions (e.g., thinnings or partial harvests) compared to other known factors influencing windthrow risk remains unclear. Recent empirical and modelling efforts are attempting to address these shortfalls [8,9,10].
Designed experiments provide tests of only a limited set of possible retention levels, patterns and site conditions, and the results are contingent on the properties of any windstorms that follow logging (e.g., [11]). In our current study, we used a comparative approach introduced by [12,13] that relies on easily collectable field data to determine the functional relationships between storm severity and the susceptibility of trees to windthrow. Their approach took advantage of the inherent variability in storm intensity across an affected area to simultaneously estimate both local storm severity and species-specific variation in susceptibility to windthrow as a function of storm severity and tree size. While the method was first applied in unmanaged stands, it can be readily extended to incorporate the effects of retention systems and partial harvesting in order to examine specifically how the level or pattern of tree retention/removal affects windthrow risk.
In this study, we directly address how the risk of windthrow is affected by partial-cutting logging practices in complex-structured, mature- to old-growth mixed-species forests. Our specific objectives were to evaluate how harvest intensity (% basal area removal) and proximity to a logging-created edge affect species-specific windthrow risk for trees of different canopy positions in the natural-origin mixed interior cedar-hemlock forests of north-western British Columbia (BC).
2. Materials and Methods
2.1. Study Area
This study is a component of the Date Creek Silvicultural Systems Experiment [14], located near Hazelton, north-western BC (55°22′ N, 127°50′ W; 370–665 m elevation). Study sites were located in the moist cold subzone of the Interior Cedar-Hemlock biogeoclimatic zone (ICHmc [15]). Forests of this region represent a transition between the interior Sub-Boreal Spruce zone to the east and the Coastal Western Hemlock zone to the west [16,17].
Western hemlock (Tsuga heterophylla (Raf.) Sarg.) is the late successional dominant in these forests, followed by western redcedar (Thuja plicata Dougl. ex D. Don), with varying mixtures of subalpine fir (Abies lasiocarpa (Hook.) Nutt.), hybrid spruce (a complex of white spruce (Picea glauca (Moench) Voss), Sitka spruce (P. sitchensis (Bong.) Carr.) and Engelmann spruce (P. engelmannii Parry ex Engelm.)), lodgepole pine (Pinus contorta var. latifolia Engelm.), paper birch (Betula papyrifera Marsh.), trembling aspen (Populus tremuloides Michx.) and black cottonwood (Populus balsamifera ssp. trichocarpa Torr. and Gray), and at higher elevations, amabilis fir (Abies amabilis Dougl. ex Forbes). Morainal parent materials dominate the area, ranging in texture from loamy sand to clay loam. Eluviated dystric brunisols, orthic dystric brunisols, and orthic humo-ferric podzols are the most common soils [18].
2.2. Field Methods
We sampled wildfire origin (120–350 years ago) stands, containing stratified mixtures of coniferous and deciduous tree species, within the 4000 ha Date Creek Research Forest or in nearby operational logging areas in the Helen and Muldoe drainages (~20–50 km north of Hazelton). Local knowledge of partial cutting areas with different retention/removal levels was used to search for potential sample stands. We established a balanced number of sample plots within stands representing a range of basal area removal. We purposely spread our sampling throughout the study area. Each sample site was uniform in topography and soils and represented mesic conditions (average soil moisture and nutrients for the region).
We did not sample in areas with evidence of multiple, recent storm events (e.g., cohorts of windthrown trees with distinctly different levels of decomposition). We sampled areas where we could reliably determine that (1) only a single event had caused the damage; and (2) that the event was recent enough for sampled windthrow trees to be reliably differentiated from other sources of windthrow or mortality. Plots were located so that the overall degree of windthrow was relatively uniform within the plot. No plots were located within 40 m of an opening greater than 1 ha in size. We sampled in areas with no logging history (6 plots) and in areas that had been partially harvested with varying levels of basal area removal (18 plots) (Table A1 and Table A2).
In practical terms, each plot needed to be large enough to contain approximately 25–50 individuals in order to generate sufficient sample sizes for our analysis. We used variable-sized circular plots (106–1963 m2) to ensure roughly equal sample sizes in each plot. The distribution of sample trees was well balanced by harvest intensity, with 20%, 26%, 21% and 33% of sample trees in areas with 0–20%, 20–40%, 40–60% and 60–80% basal area removal, respectively (Table A1 and Table A2).
Species and diameter at breast height (DBH, measured at 1.3 m height) were assessed on all windthrown and standing trees >10 cm DBH rooted within the plots (n = 915, Table A1 and Table A2). Plots contained 20 to 81 trees, with most plots containing 25 to 50 trees. Windthrown trees included trees either snapped or uprooted (uprooted included trees leaning at greater than a 45° angle from the vertical). Sample trees were recorded as edge trees if they were rooted within 10 m of a logging-created opening greater than 0.01 ha in size (10 × 10 m). Within partial cut areas, stump diameters were recorded in order to calculate harvest intensity (% basal area removal) associated with each plot. Partial cut sites were logged 2–12 years before sampling, and before the discrete storm event associated with the plot.
2.3. Analysis
Our analyses closely follow the regression methods outlined in two earlier studies [12,13], in which the probability of windthrow is modelled using a hierarchical logistic regression as a function of (i) storm severity; (ii) tree species; and (iii) tree size. We extended the analyses to consider whether risk of windthrow is also a function of (iv) harvest intensity (% of basal area removed in a harvest prior to the storm); and (v) proximity of a tree to a distinct forest edge. We used a model selection approach to compare a set of increasingly complex models incorporating different subsets of these factors in different functional forms. In effect, the alternate models represent competing hypotheses for the suite of factors examined in this study to predict susceptibility to windthrow.
An important feature of the analysis is that it simultaneously estimates both local storm severity and species susceptibility to windthrow. In principle, it would be desirable to have independent, physical measurements of storm severity (wind speed, duration, etc.). Accurate, plot-level measurements of wind speeds during severe storms, however, are rarely available. An alternative approach, employed here, is to simply estimate a plot-level term in the regression model that can be interpreted as an index of storm intensity, on a scale ranging from 0 when the storm is below the intensity required to produce any measured degree of damage on any trees, to 1 when all canopy trees, regardless of species or size, would suffer catastrophic damage. It is important to note that storm severity is not measured from the data; rather, it is an estimated parameter of the hierarchical logistic regression model. In a traditional framework, this is analogous to estimating plot-level parameters to account for the nesting of trees within plots. Thus, the analysis is explicitly hierarchical, with a separate storm severity parameter estimated for each plot. One of the benefits of using a likelihood and model comparison approach is that our models assign a specific meaning to that plot-level parameter (namely storm severity). The hierarchical nature of the regression model also avoids issues of pseudo-replication given the nesting of measurements of trees within plots.
Our likelihood analysis requires a census of the target species in a series of plots that vary widely in overall degree of damage. The plots need to contain a reasonable mixture of species and tree sizes to avoid confounding the effects of those terms with the effects of variation in storm severity. The plots also need to be small enough to satisfy the assumption that local storm severity was roughly uniform within the plot.
Our basic regression model ignores both harvest intensity and proximity to edge and fits the simple hierarchical logistic model developed for windthrow risk as a function of storm severity, tree species and tree size [12]:
where pisj is the probability of windthrow for the jth individual of species s in plot i, Si is the estimated storm severity for plot i, DBHisj is diameter at breast height (cm at 1.3 m height) of the jth individual of species s in plot i, and as, bs, and cs are estimated, species-specific parameters. Since DBH and tree height correlate closely, either of them can be used as a predictor for tree size. The storm severity index (Si) is allowed to vary from 0 to 1, with 1 representing the most severe level of windthrow observed in any of the plots in the dataset.
By setting the bs parameter in Model 1 to zero, we also tested an even simpler model in which the risk of wind damage is species-specific, but independent of tree size:
We then tested two alternate models that incorporated the effects of harvest intensity and proximity to an edge. Model 3 introduces the effect of prior harvest removal and assumes that the effect (on the logit) is additive and independent of tree size:
In this model, BA is the fraction of basal area removed in the harvest, and hs is a species-specific parameter controlling the magnitude of the effect of prior harvest on the risk of windthrow of species s.
Model 4 assumes the effects of prior harvest interact with tree size:
Models 1a, 3a, and 4a are the same as Models 1, 3, and 4, but separate cs parameters are estimated for non-edge and edge trees of each species. The exponent in Model 4 allows a complex set of behaviours, depending on the estimated species-specific parameters (b and h). If h > 0, then at low BA removal the probability of windthrow is similar regardless of tree size, and at high BA removal there is a greater difference between large and small trees. If b < 0, then at low levels of removal, tree size has a large effect, and at higher levels of removal a smaller effect. If the exponential term is positive over the entire range of observations, then larger trees always have a greater probability of windthrow. If the value of the whole term crosses from positive to near zero or negative, then the effects of tree size vary with BA removal. We examined output for both Model 3 and Model 4 for evidence of confounding of the parameter estimates for site-specific storm severity (Si) with the observed level of any prior partial harvest (BA), but there was not a significant relationship between either BA removal and estimated storm severity (r = 0.39, p = 0.06) or between level of prior harvest and observed proportion of stems in the plot that were windthrown (r = 0.14, p = 0.53).
We tested use of both absolute DBH and relative DBH (i.e., the DBH of an individual tree as a fraction of the DBH of the largest tree in the plot). Relative DBH reflects the position of an individual in the size hierarchy within a given stand (i.e., dominant to subordinate). We examined relative DBH because of our assumption that both exposure to wind and susceptibility to windthrow might vary more as a function of position within the size hierarchy of a stand than as a function of absolute DBH.
Maximum likelihood estimates of model parameters were derived using simulated annealing (a global optimization algorithm) to determine the most likely parameters (i.e., the parameters that maximize the log-likelihood), given our observed data set. See Canham et al. [12] for details of the likelihood function and the annealing algorithm. While the annealing algorithm used for the analyses reported here was implemented in dedicated software, the algorithm is also available in the likelihood R package. We used the Akaike information criterion (AIC) to incorporate both parsimony and likelihood in selecting the best model.
3. Results
3.1. Model Selection
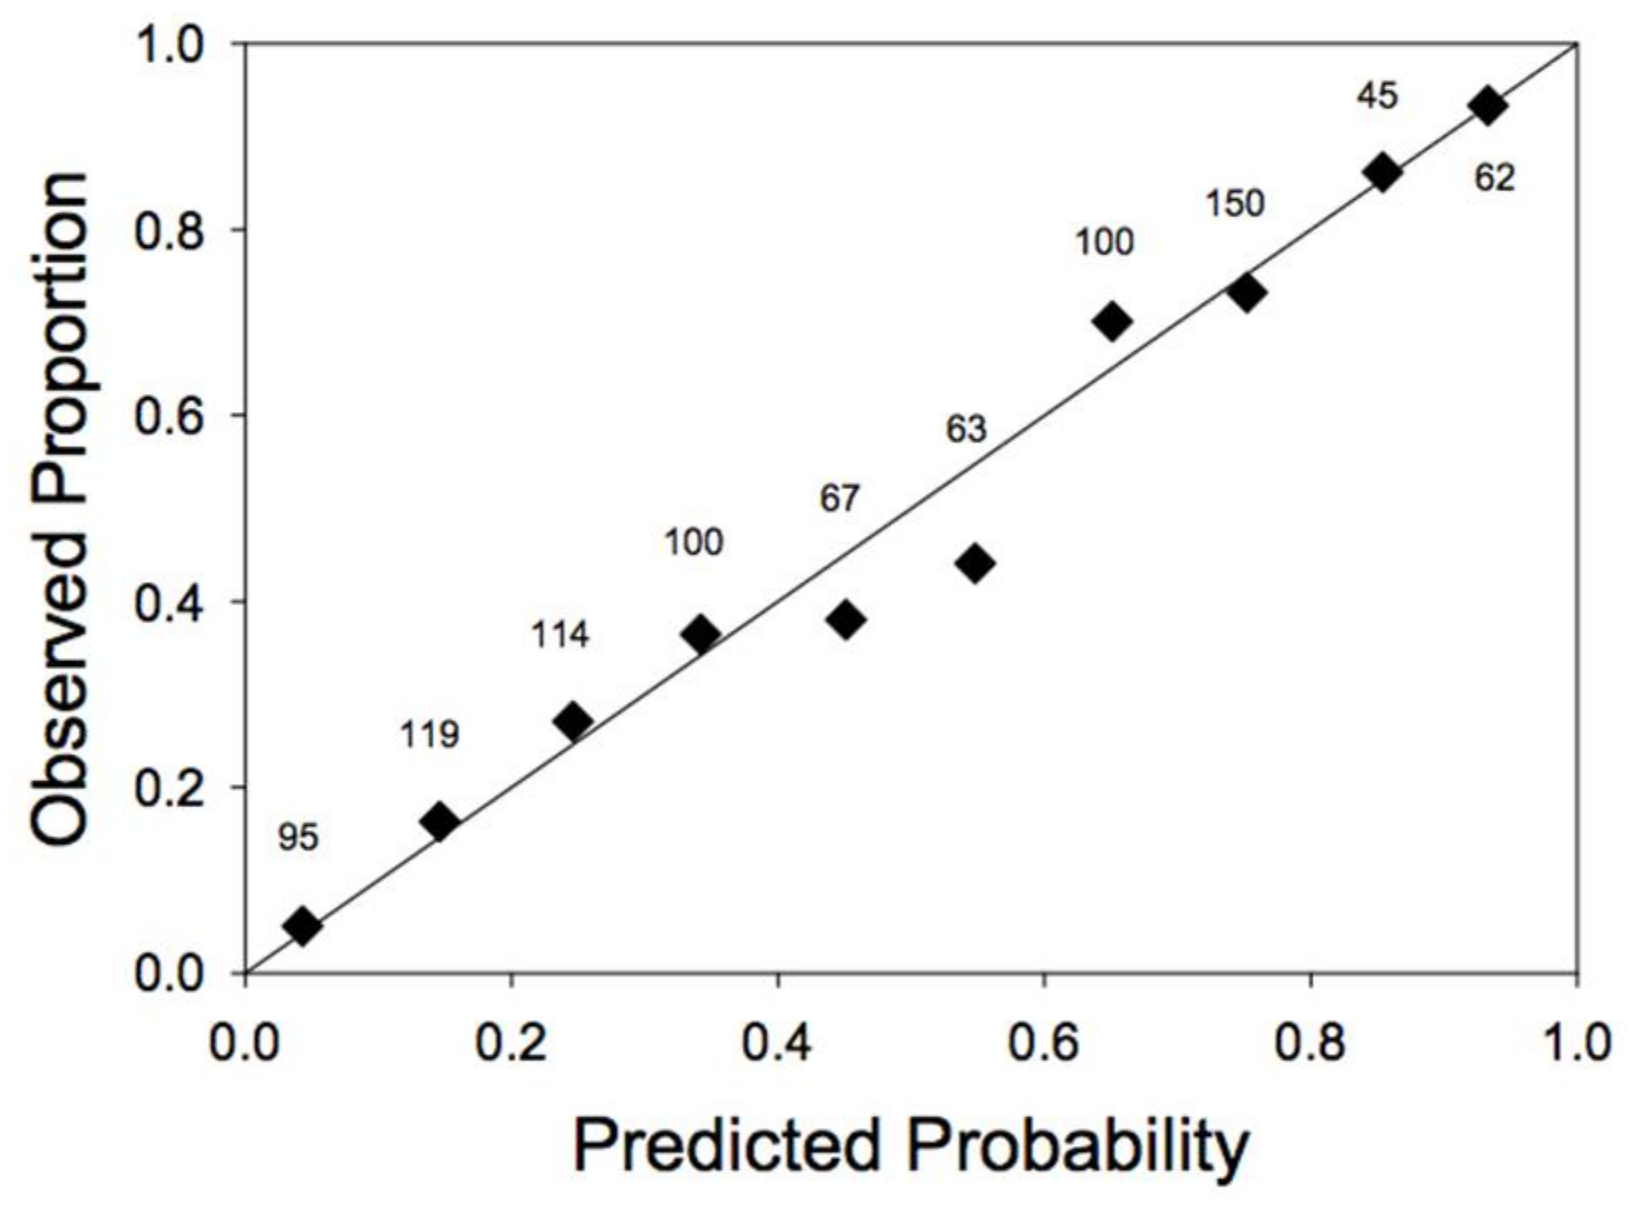
Models that used relative DBH were consistently better than models that used absolute DBH (AIC values 10–38 units lower; Table 1). Omitting size effects altogether resulted in a much worse fit (Model 2 vs. Model 1; Table 1). Model 3, which introduced the level of partial harvest as an independent and additive effect on susceptibility to windthrow, was not supported by the data (higher AIC values than either Model 1 or Model 4; Table 1). Strong support, however, was found for an interaction between the effects of DBH and partial harvesting (Model 4 vs. Model 1; Table 1). We also found strong support for relative DBH models that included edge effects in the prediction of windthrow risk (i.e., Models 1a, 3a, and 4a vs. Models 1, 3, and 4; Table 1). The best overall model (Model 4a; Table 1) predicted susceptibility to windthrow as a function of all four independent variables: storm severity, relative tree size, prior harvest level (interacting with tree size) and proximity to an edge. The model provided a good fit to data, although it overestimated slightly the probability of windthrow in the middle of the range of predicted probabilities (Figure 1).
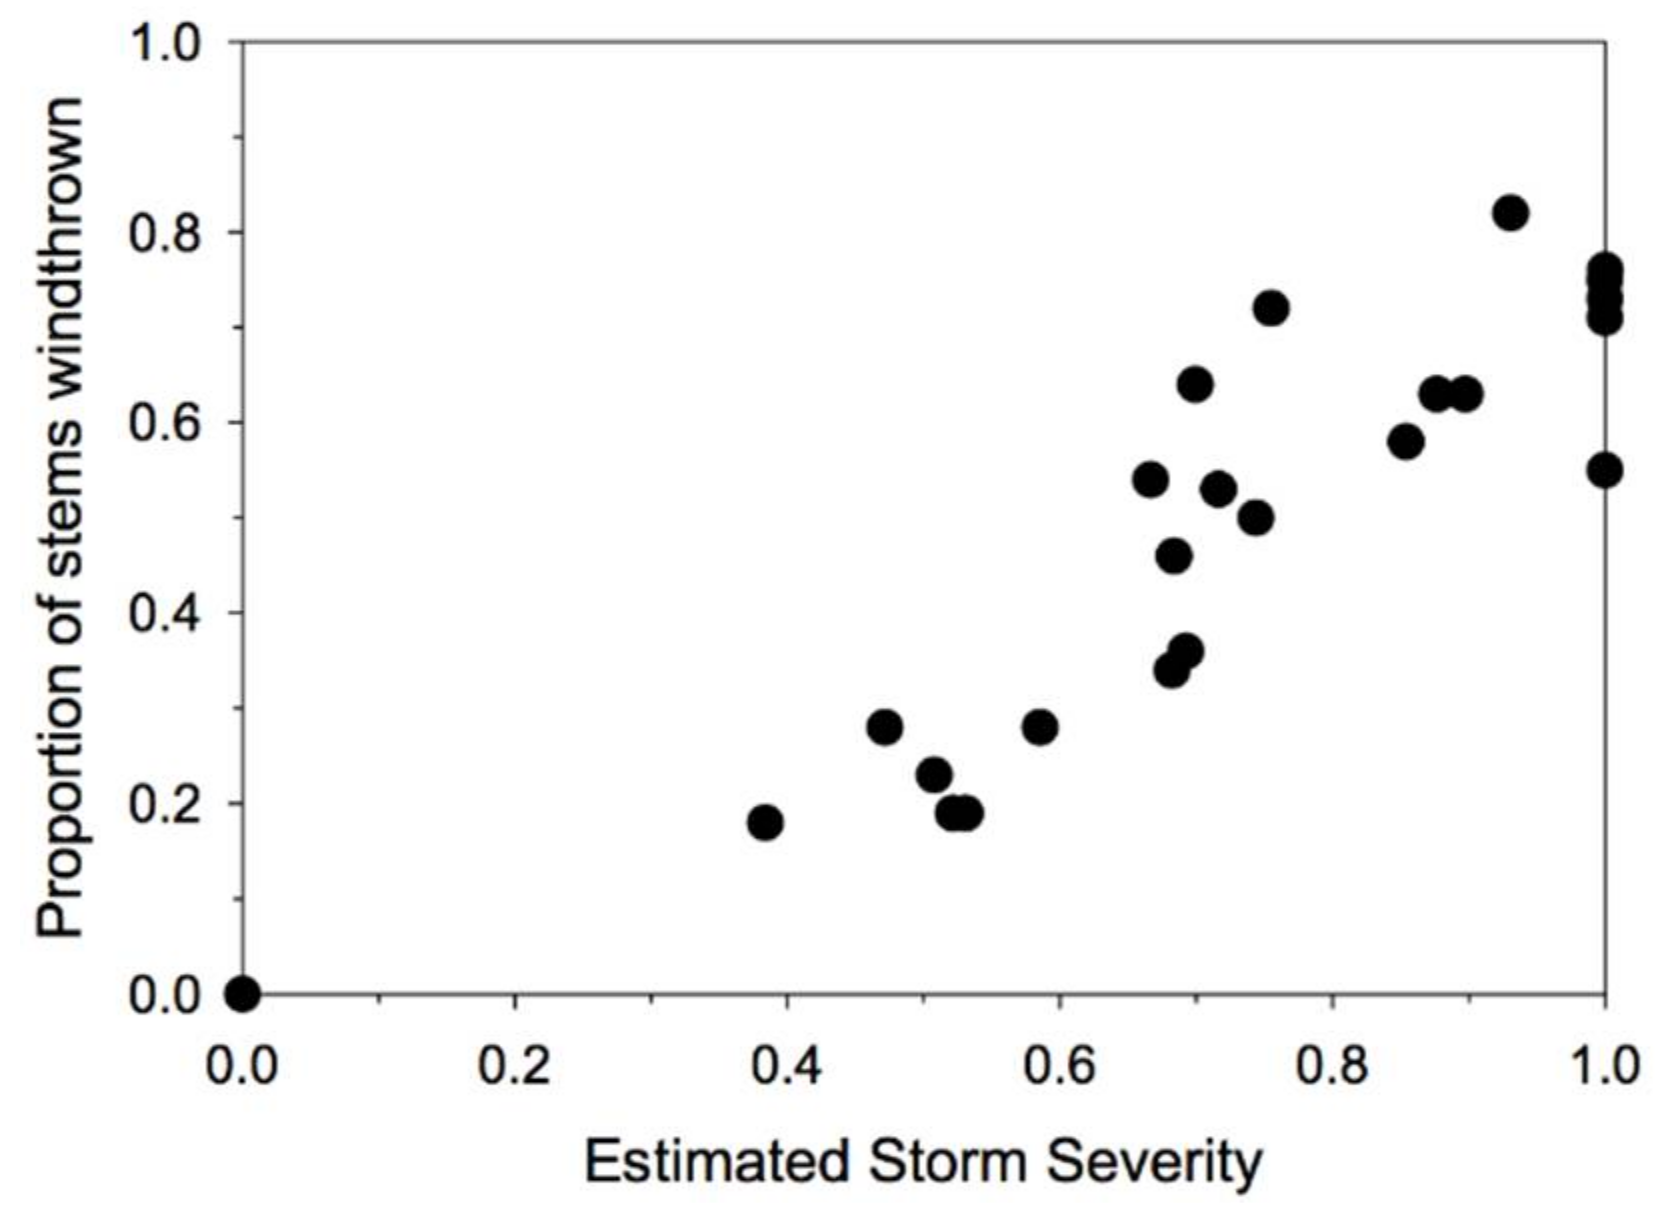
Our approach simultaneously estimates both the local effective severity of the storm (as an index, with a maximum of 1 for the plot with the greatest estimated storm severity) and the species and site conditions that determine susceptibility to windthrow given the estimated storm severity. Thus, our results reflect the range of storm severities included in our sample of plots. A plot of the estimated storm severities versus the proportion of stems >10 cm DBH that were windthrown indicates that there was a broad range of storm severities represented in the sample (Figure 2), and that the plots with the highest estimated storm severity experienced almost catastrophic windthrow (~80% of stems windthrown).
3.2. Windthrow Susceptibility in Unlogged Forests
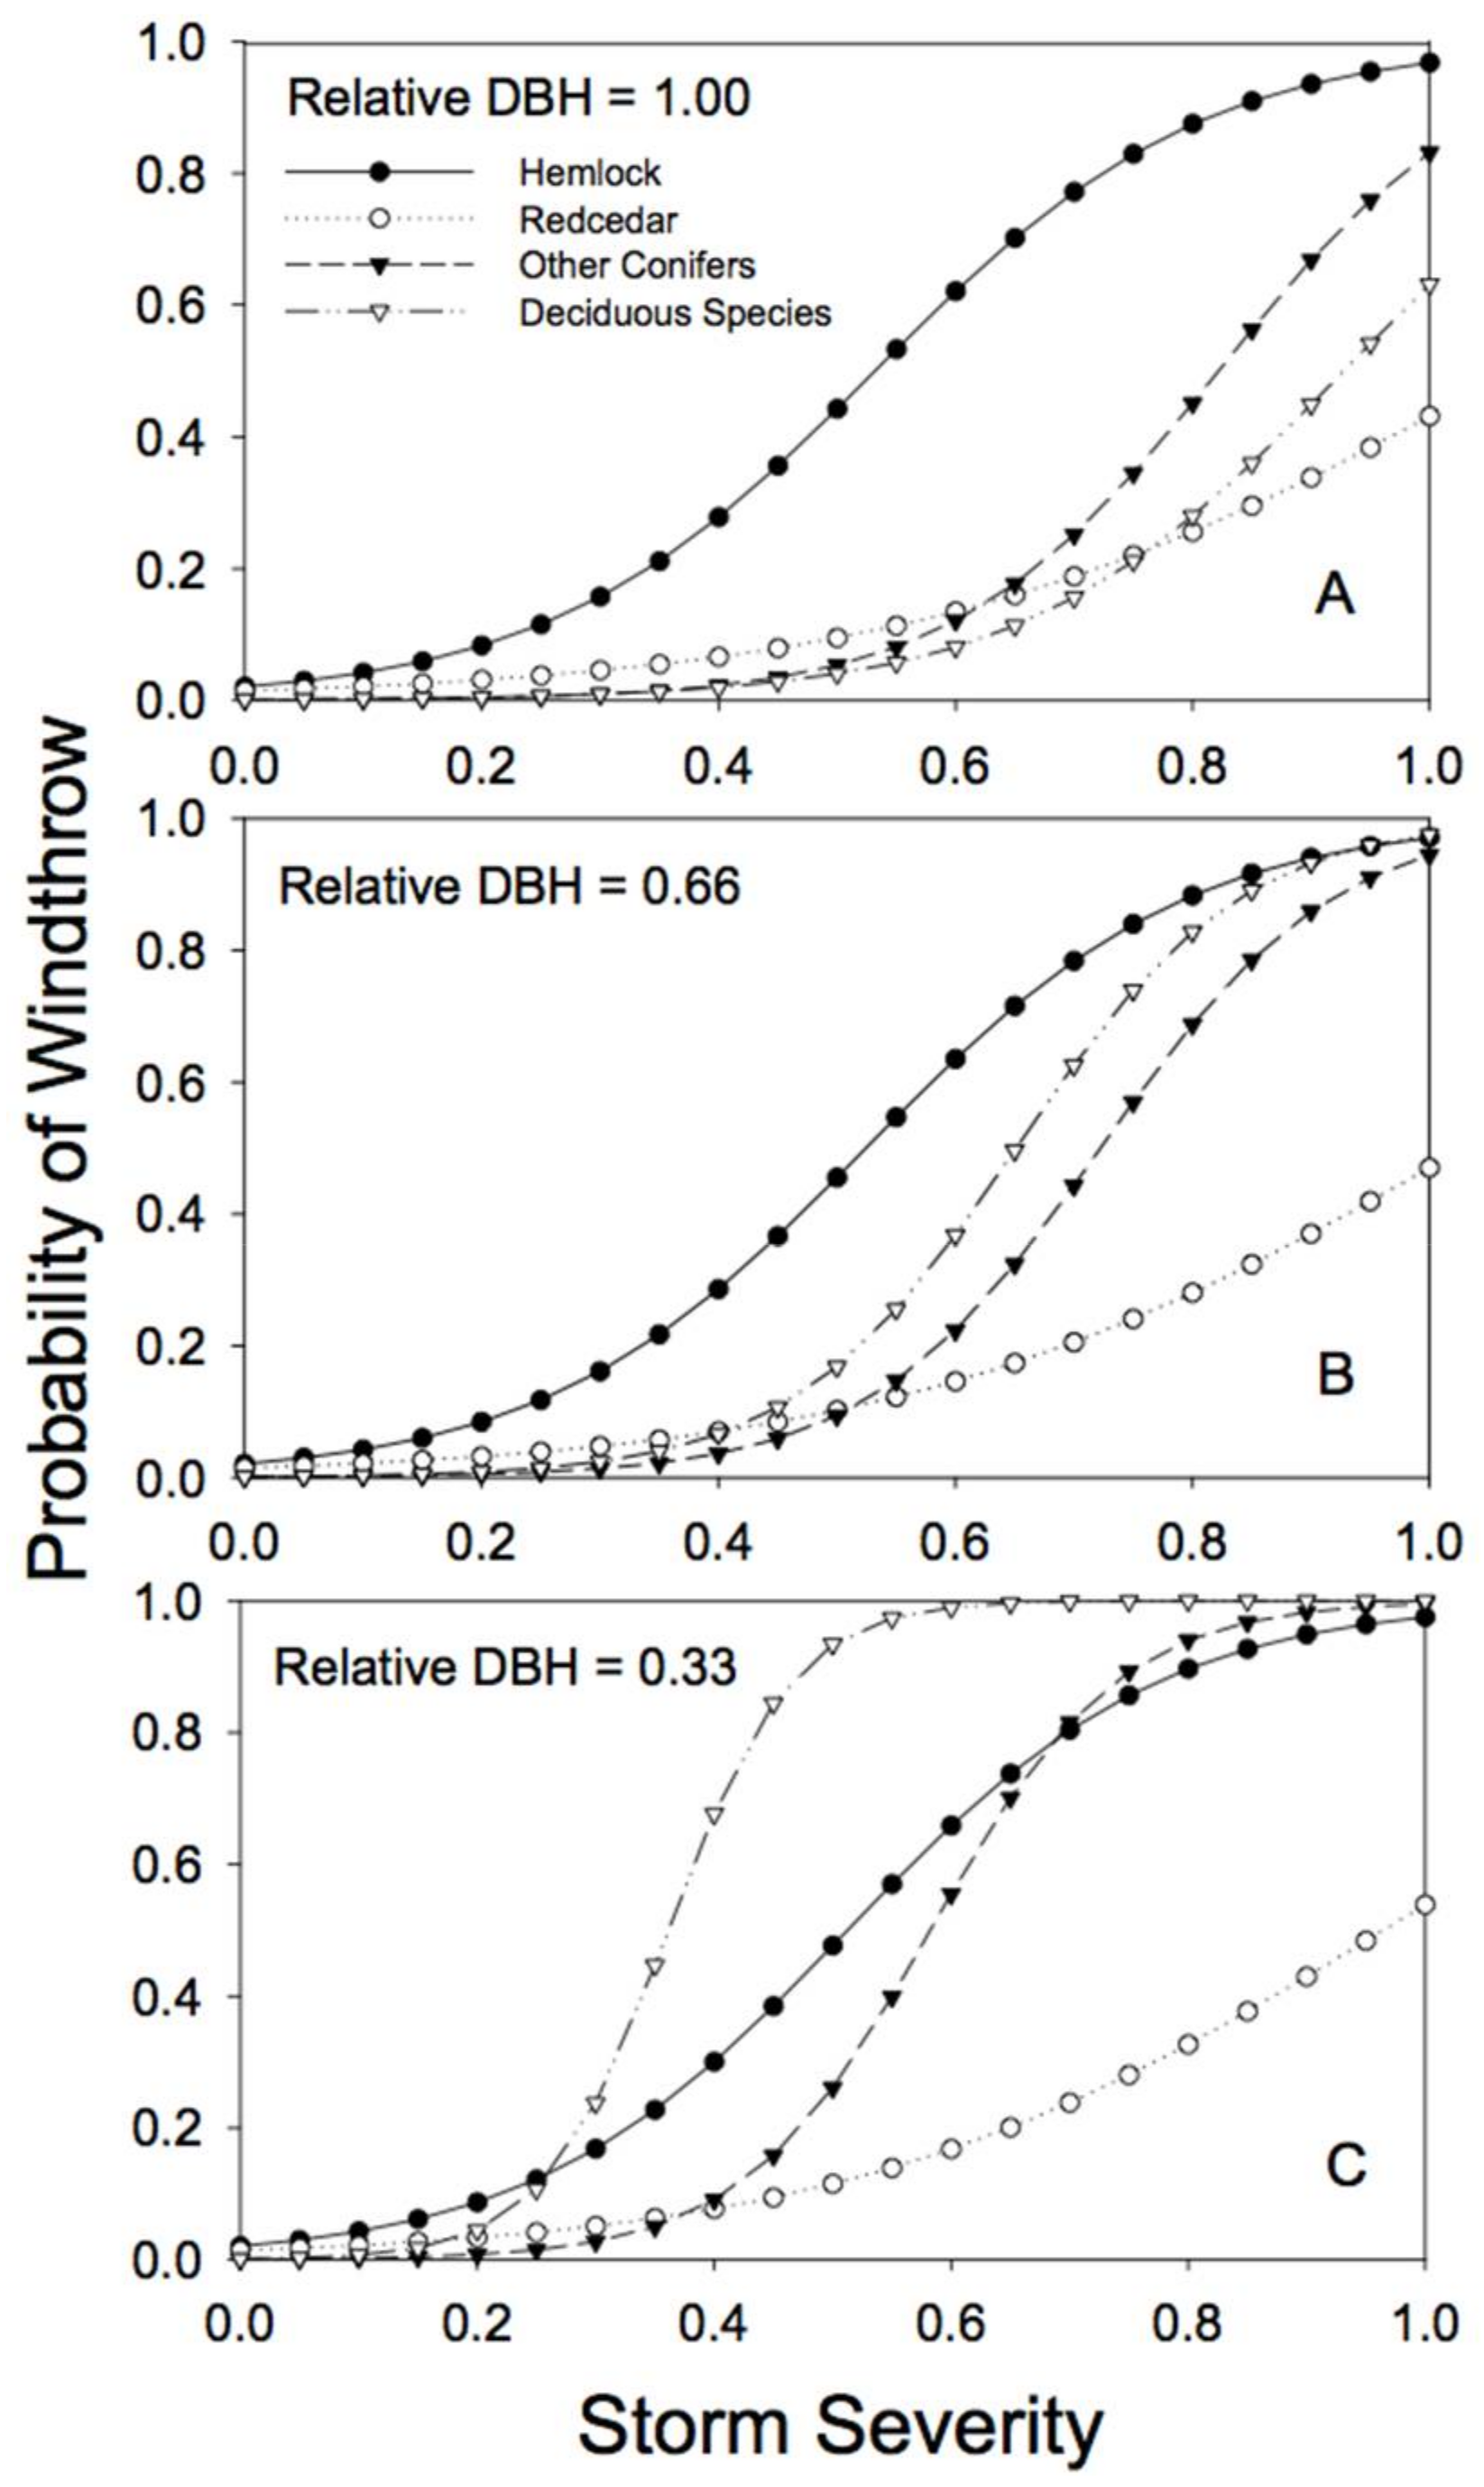
There were clear differences among species and tree sizes in susceptibility to windthrow in unlogged forests (i.e., sites with no partial harvesting and no edge effects; Figure 3). In general, western hemlock was the most susceptible to windthrow, and the risk of damage varied little with relative tree diameter (Table 2; note that the estimate of the b parameter is near zero). Western redcedar was generally the least susceptible to windthrow (lowest c parameter, Table 2), especially at high storm severity, and the risk of windthrow was little affected by tree size (Figure 3; Table 2). The susceptibility to windthrow of the other conifer and deciduous species varied considerably depending on size, with smaller trees (relative to the largest tree in the stand) at greatest risk (Table 2; note the negative b parameters). The individuals with the greatest risk of windthrow were trees of the deciduous species that were small relative to the largest tree in the stand (Figure 3).
3.3. Windthrow Susceptibility in Partially Cut Forests
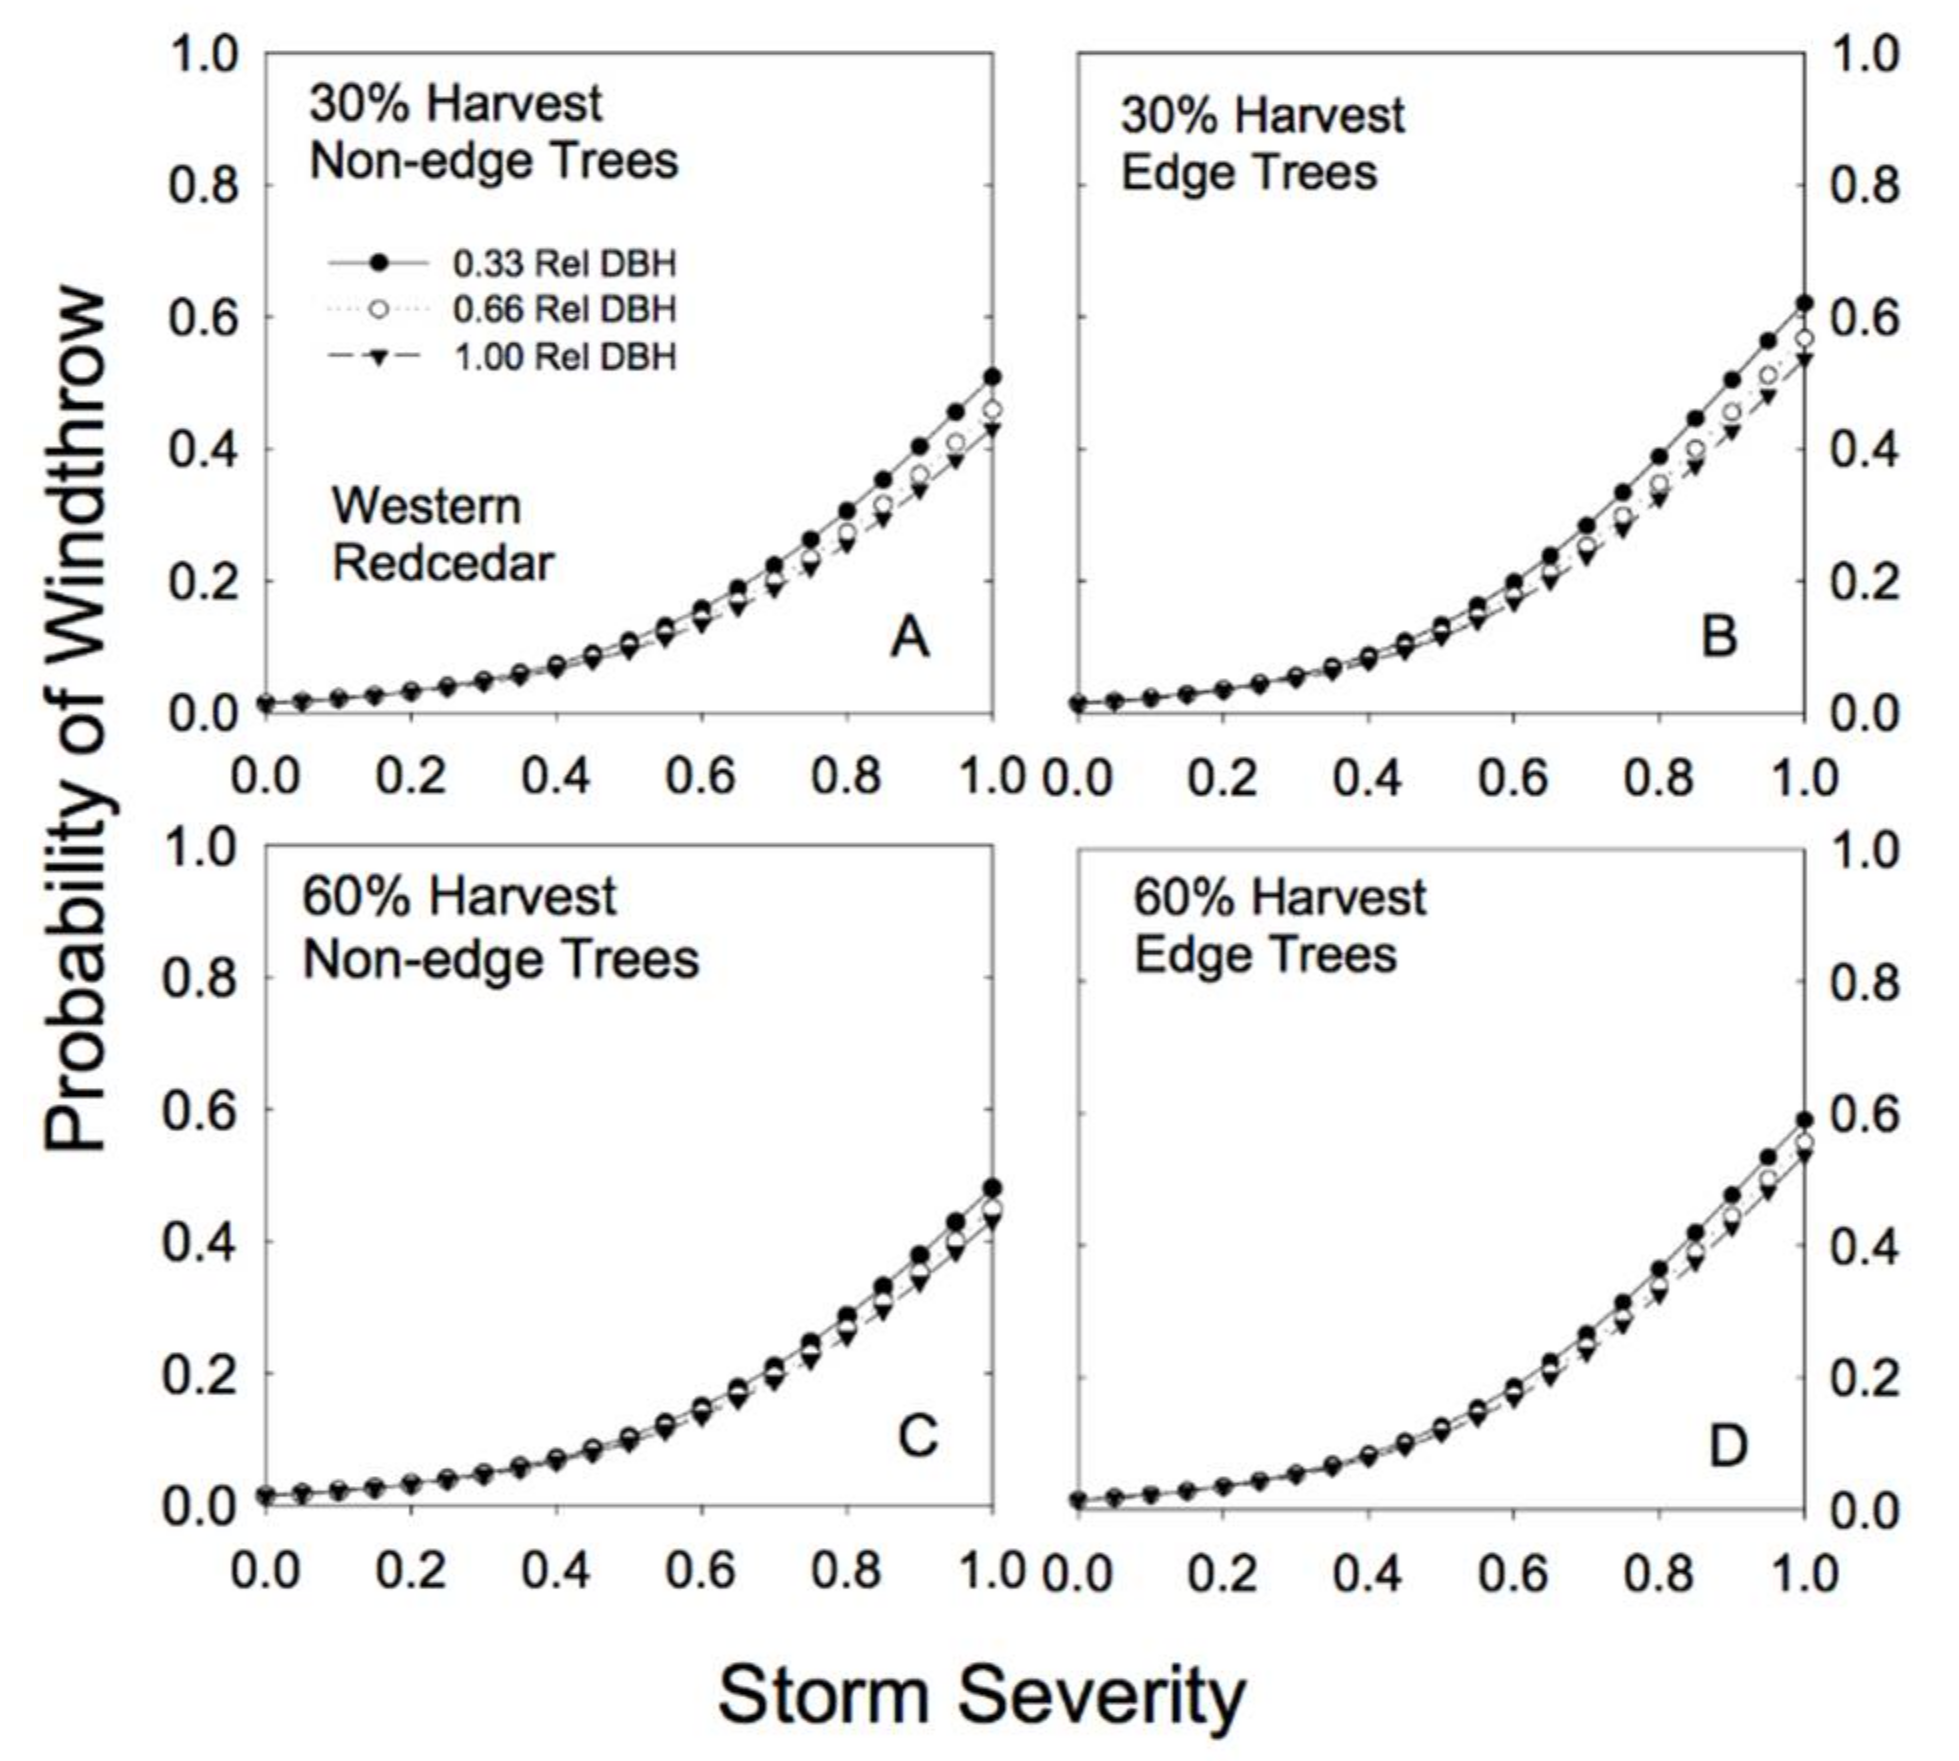
We found no overall increase in the risk of windthrow with increasing level of partial harvesting (Figure 4, Figure 5, Figure 6 and Figure 7). In fact, for the smaller relative DBH trees, windthrow risk actually declined as basal area removal increased, while for larger relative DBH trees the risk was essentially constant regardless of level of prior partial harvesting (Figure 4, Figure 5, Figure 6 and Figure 7).
Species-specific differences in response to both basal area removal and proximity to edge were clearly evident in the analysis (Table 2). For example, hemlock trees showed little effect of proximity to edge on risk of windthrow. In fact, edge trees appeared to be slightly more resistant to windthrow (Figure 4; Table 2). Partial cutting had a minimal effect on redcedar risk of windthrow: risk of damage to redcedar was low regardless of the level of basal area removal or proximity to an edge (Figure 5).
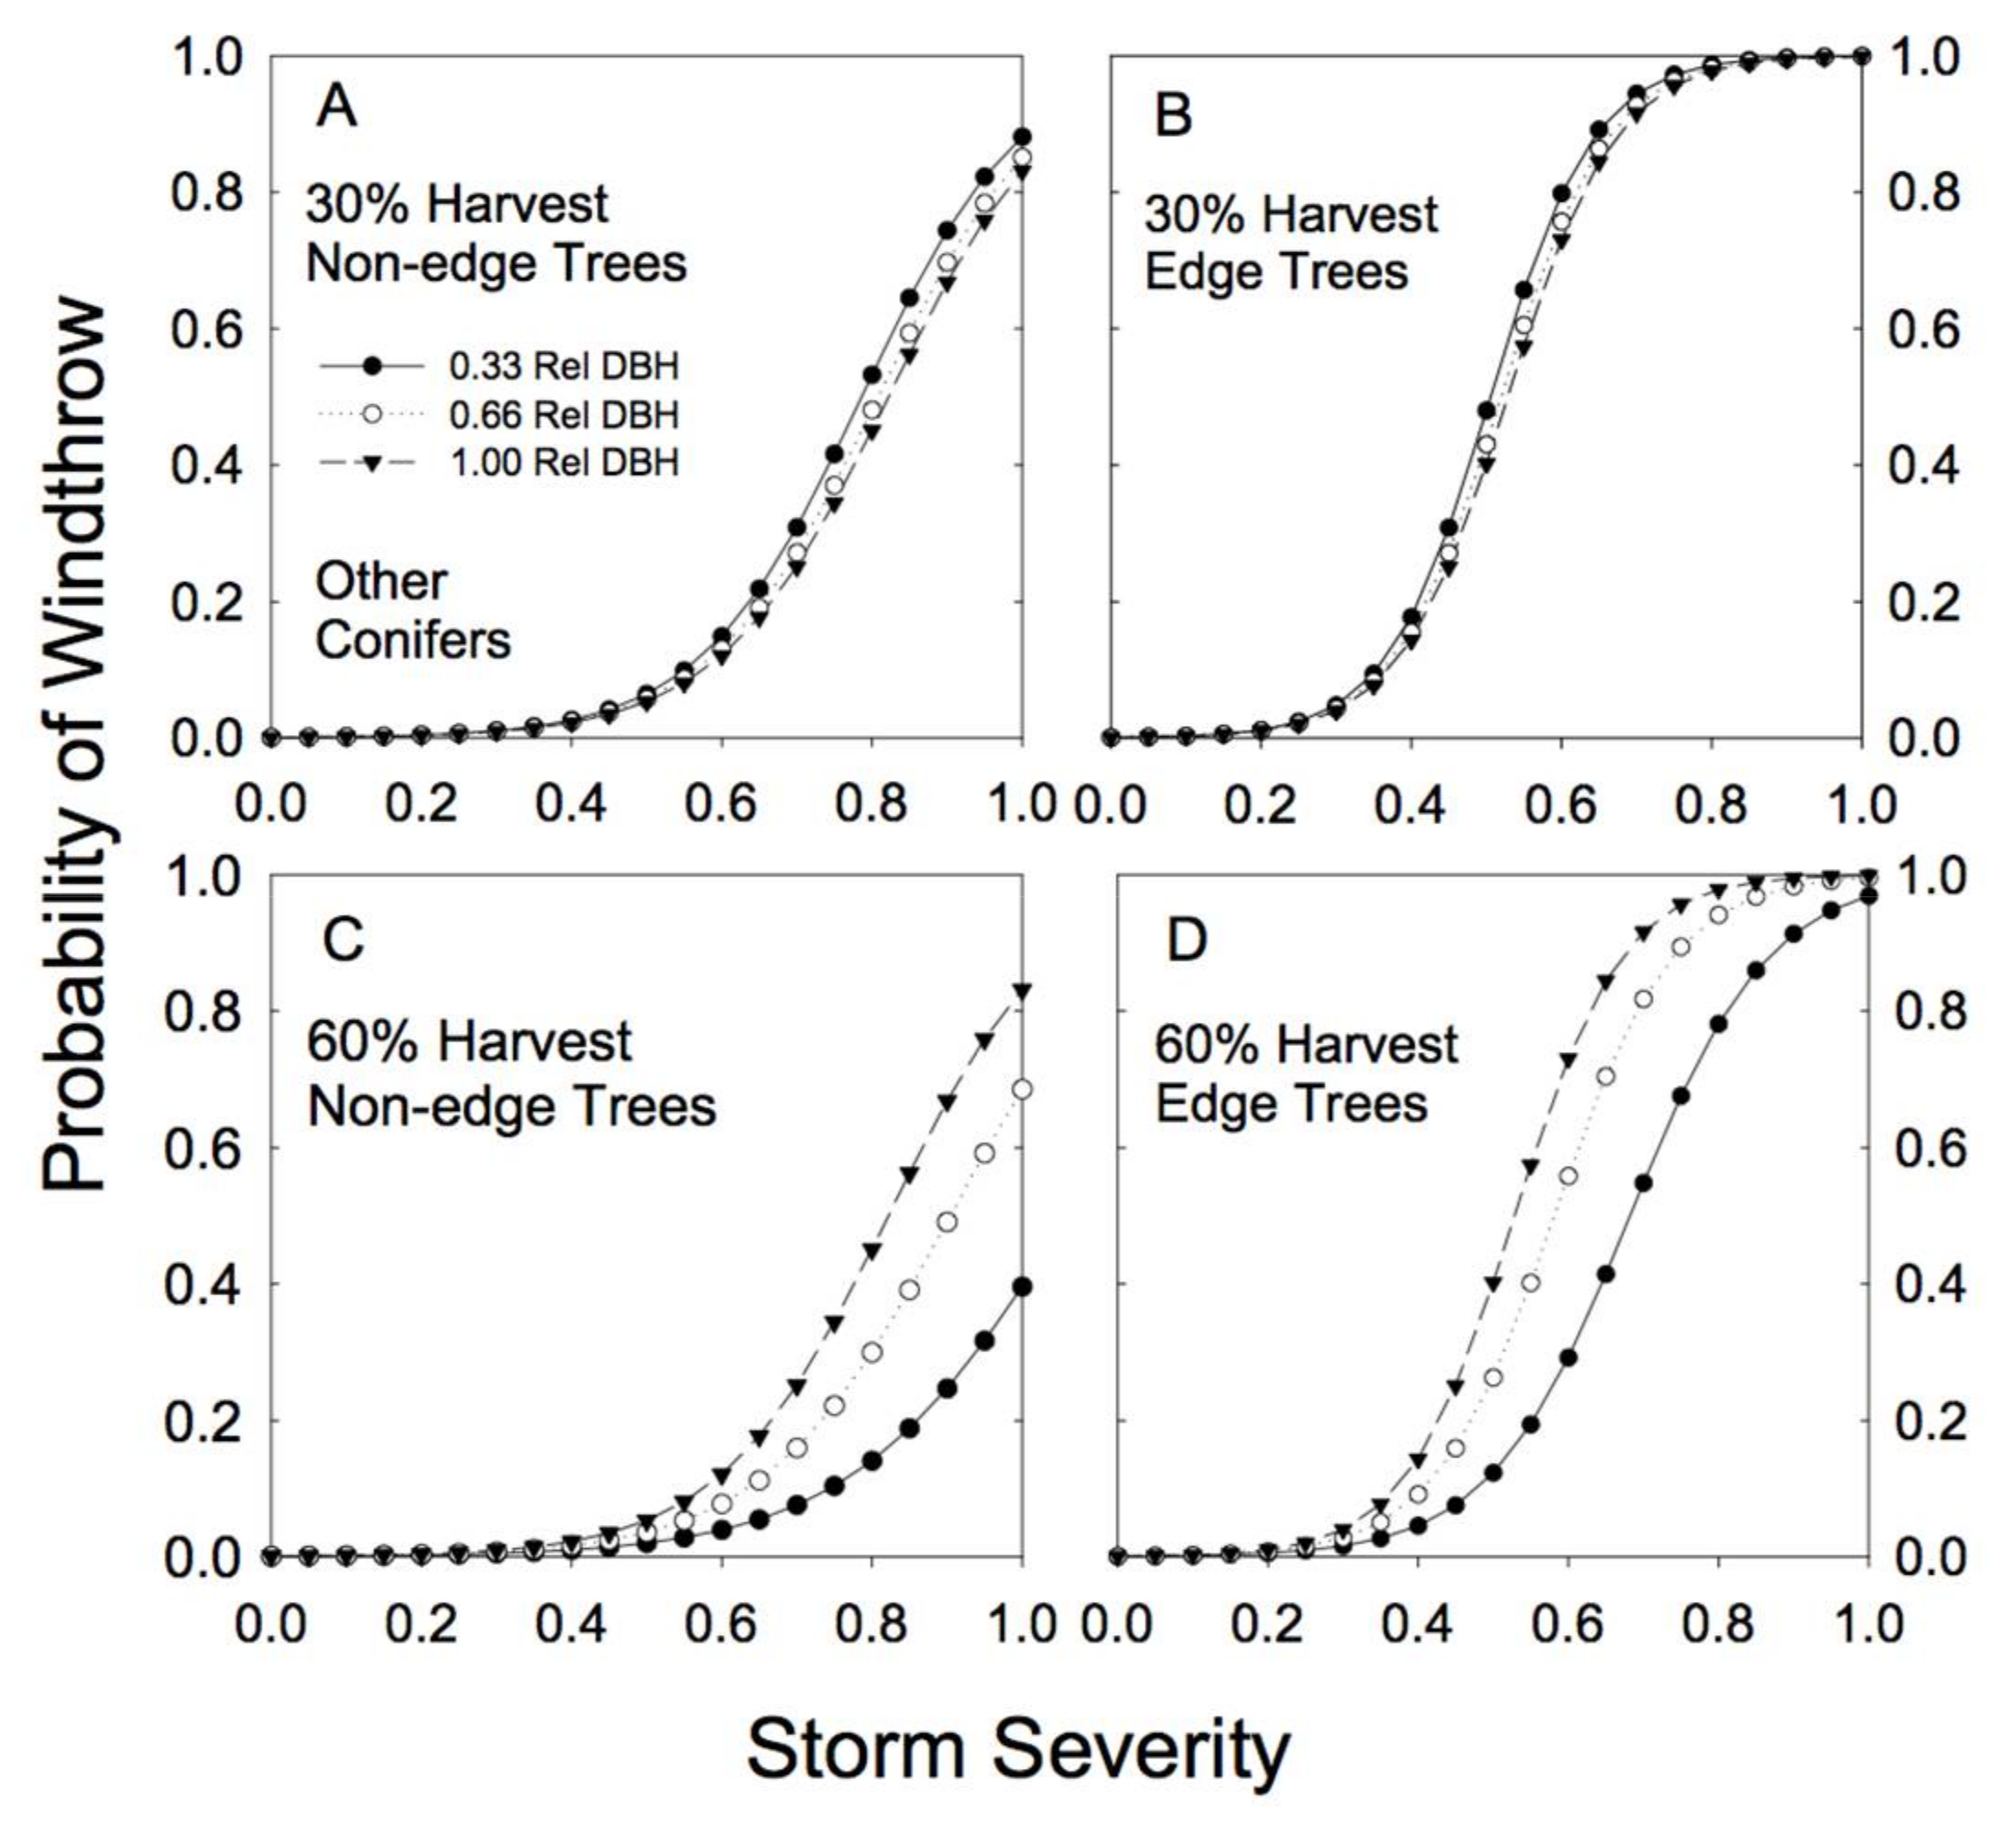
Our sample for the group of other conifer species was dominated by hybrid spruce (42%) and lodgepole pine (42%), with amabilis fir and subalpine fir each contributing only 8% of the observations in that group of species. As a group, these subordinate conifer species showed strong differences in susceptibility to wind damage in partially cut versus unlogged forests (Figure 6). In unlogged forests, smaller relative DBH stems had much higher susceptibility to less severe storms than larger relative DBH stems (Figure 3). In partially cut forests, the largest of this group of species were at most risk of windthrow, but only under relatively high levels of BA removal (60%; Figure 6). Individual trees near an edge had an increased susceptibility to windthrow across all levels of biomass removal (Table 2; high cedge; Figure 6).
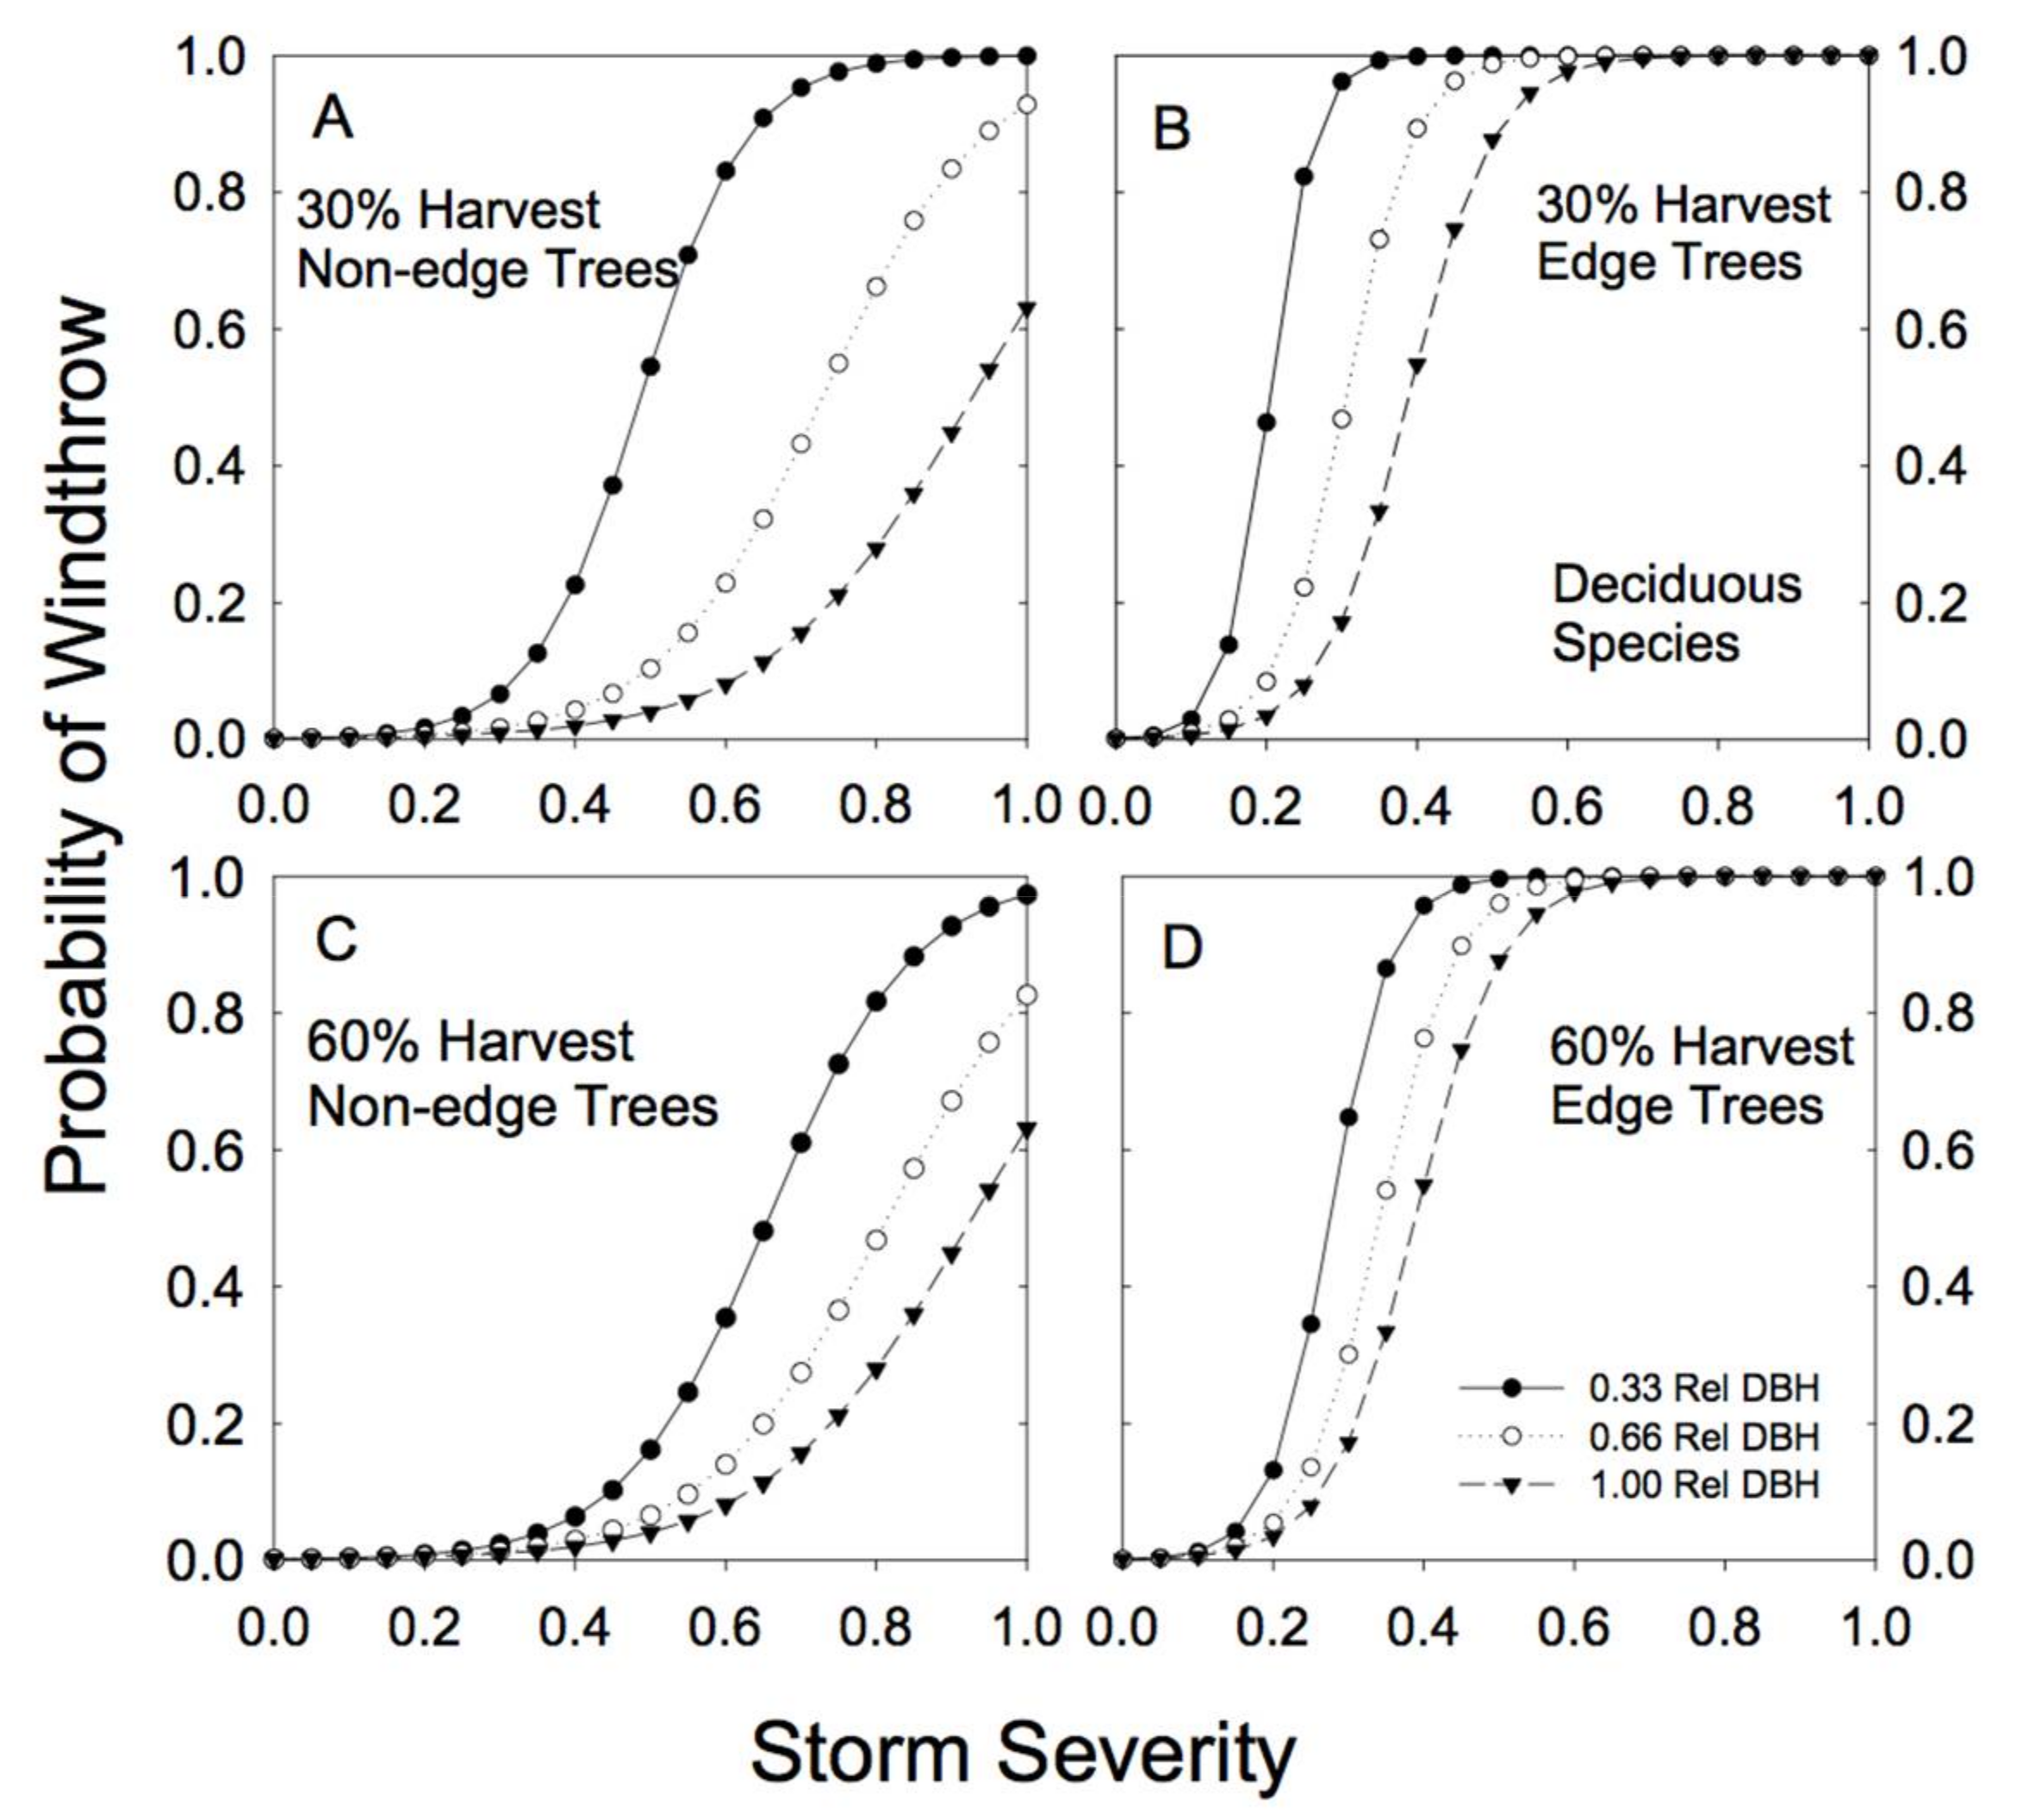
Sample sizes were lower for the combined deciduous tree species than for hemlock, redcedar or the other conifer grouping (Table A1 and Table A2). Paper birch represented 68% of the combined deciduous sample trees, followed by trembling aspen (27%) and black cottonwood (5%). The sample size for edge trees (4 trees total) was very low. The smallest-sized deciduous trees were extremely vulnerable to wind damage in partially cut forests (Figure 7; Table 2; note the negative b parameter). Proximity to an edge substantially increased the risk of wind damage for deciduous species of all sizes (Table 2; high cedge; Figure 7), although our confidence in this result is weak because of the very small numbers of edge trees in this group of species.
4. Discussion
An important feature of our study is that it separates the role of variation in storm severity from the effects of plant traits (species and size) and logging history (level of basal area removal and proximity to an edge) on the susceptibility of an individual to windthrow. We examined a wide range of sites, species compositions and levels of basal area reduction (0–76% removal), representing a variety of retention systems, in a mountainous forested region of north-western British Columbia.
Our model selection approach provides insight into how tree-level heterogeneity and partial harvest intensity interact to influence storm risk in forests. Our study is relatively unique in that it looks at susceptibility to damage from wind after first-entry harvesting in natural origin mixed-species forests. In these forests, we found no general increase in risk of windthrow with increasing level of partial harvest up to the maximum level of 76% removal observed in the study. For the larger relative diameter trees in our study, the risk of damage was essentially constant regardless of level of partial harvest, but interestingly for smaller relative diameter trees windthrow risk declined as removal levels increased. This may simply be due to there being less chance that a small tree is uprooted or broken by a larger tree as the removal rate increases. Although the overall risk of damage was unaffected by removal level, we did observe species-specific differences in damage near edges of small openings in partially harvested areas.
The forests sampled in our study were mature and old-growth stands of natural origin with no management intervention prior to partial cutting. These wildfire origin stands were mixed-species and would be considered even-aged, but would not be as uniform in structure as managed plantations. Old growth stands were multi-storied. In similar stand types in coastal BC, few trees were windthrown until partial cutting rates exceeded 80% removal [19]. Based on our study, we would add that the risk of windthrow is constant at partial cutting rates up to 76% removal in structurally variable, species-diverse forests. This contrasts strongly with results after thinning in uniform even-aged European forests where selective interventions removing 15–30% of the growing stock has been shown to increase the risk of wind damage [4,5,20].
Management interventions can have considerable influence on the susceptibility of forests to strong winds. For example, partial harvesting can create edge environments when groups of trees are harvested in small gaps or patches (i.e., openings <1 ha in size), as was the case at our study sites. In these edge environments, we found species-specific differences in susceptibility to storm damage. The two most common tree species in the study area, hemlock and redcedar, were not more susceptible to windthrow in edge environments. In contrast, the less common conifers and the deciduous species were more susceptible to windthrow along partial harvest edges. This suggests that during partial harvesting operations in complex stand types, tree-marking guidelines should include removal of the most wind-prone species from edges around small openings. In an earlier study, in natural origin high-elevation spruce-fir types in southern BC, windthrow was concentrated around the edges of openings (0.1–10 ha) [21], and as in our study there were species-specific differences in overall susceptibility. In European managed forest landscapes, edge exposure by harvesting was an additional risk factor, and certain species (e.g., Norway spruce) were more prone to damage than others [4,20]. Stand characteristics, especially tree species, were the most important factors for predicting storm impact [4].
To understand how storms can impact windthrow risk in forests, multiple approaches to data collection, analysis and modelling should be encouraged across different forest types. There is not one method of inquiry that if correctly pursued will provide a comprehensive understanding of windthrow in all forest types [22]. There are clearly many interacting factors that explain the risk of windthrow for any given stand type, location or time [4,5,21,23]. It is possible to develop mechanistic models of windthrow risk based on wind characteristics and very detailed parameters describing individual tree architecture and rooting patterns in sites with complex topographies [24,25,26]. Historically, these models have concentrated on simulation of storm damage within uniform stands [26].
The use of mechanistic models is difficult in structurally complex forests with variability in tree species, size and health, and this difficulty is further compounded when these forest types are found in mountainous terrain [19]. Modelling efforts, however, are now shifting to addressing storm damage dynamics in highly heterogeneous forest stands and landscapes [27,28], such as those found in the natural origin forests of BC. There are not necessarily any advantages between mechanistic and statistical approaches for understanding and predicting wind damage in forests at the stand level [29]. This suggests it is beneficial to identify advantages and limitations of both approaches in order to develop wind-damage risk-assessment tools for different stand types [22].
Our empirical study based on a relatively simple and rapid field assessment, followed by an analysis using a model formulation and comparison paradigm based on a likelihood approach [12,13,30], has encapsulated the basic processes that generate the observed patterns of windthrow after partial harvesting in structurally complex and species-diverse natural origin forests. This approach can be used at any time to better understand the susceptibility of storm damage after partial cutting in complex structured forests and is an alternative to the traditional approach of detailed sampling after a known storm event [4,20]. The equations and parameter estimates from a model formulation and comparison approach could be used to aid development of more mechanistic models for complex stands in diverse landscapes.
5. Conclusions
While we attempted to cover a wide range of stand conditions, ours is only one study. Our results indicate that susceptibility to windthrow is not increased as a result of partial harvesting in natural-origin structurally diverse, multi-species forests of north-western BC. Some topographic locations clearly are high risk for windthrow [30], but many are not, and there is mounting evidence that partial harvesting does not, in and of itself, increase the risk of windthrow in complex structured stands when retention levels exceed 20–30% [10,19,21].
Acknowledgments
We thank Gabrielle Newman for her sense of humour and dedication under difficult field conditions during the sampling phase of the study. Thanks to Erica Lilles for suggestions that improved the paper.
Author Contributions
K. David Coates and Erin C. Hall designed the study and supervised the field work. K. David Coates, Erin C. Hall and Charles D. Canham analyzed the data. All three authors contributed to writing the paper.
Conflicts of Interest
The authors declare no conflict of interest.
Appendix A

Table A1.
Summary statistics for DBH of hemlock and western redcedar stems sampled in the 24 plots by percent basal-area removal and tree species.
Table A1.
Summary statistics for DBH of hemlock and western redcedar stems sampled in the 24 plots by percent basal-area removal and tree species.
| BA Removal | Hemlock | Redcedar | |||||||
|---|---|---|---|---|---|---|---|---|---|
| Plot | % | Mean | Min | Max | n | Mean | Min | Max | n |
| 1 | 0 | 26.3 | 13 | 44 | 19 | 24.6 | 12.8 | 39.4 | 5 |
| 2 | 0 | 23.1 | 12.5 | 36.5 | 26 | 20.9 | 15 | 30.8 | 6 |
| 3 | 0 | 24.6 | 11.2 | 64.2 | 43 | 37.3 | 14.8 | 66.8 | 7 |
| 4 | 0 | 26.3 | 18 | 39.5 | 4 | 18.7 | 10.8 | 37.6 | 10 |
| 5 | 0 | 33 | 16.9 | 47.7 | 20 | 0 | 0 | 0 | 0 |
| 6 | 0 | 23.6 | 12.5 | 36.8 | 19 | 25.2 | 15.4 | 40.3 | 5 |
| 7 | 22 | 27.8 | 10.6 | 55.2 | 49 | 24.9 | 10 | 47.3 | 18 |
| 8 | 22 | 32.7 | 11.8 | 50.5 | 36 | 20.5 | 10.2 | 40.5 | 8 |
| 9 | 24 | 30 | 10.6 | 62 | 56 | 25.7 | 12.2 | 41.1 | 7 |
| 10 | 33 | 33.8 | 17.8 | 84.8 | 17 | 30.6 | 22.4 | 39.4 | 3 |
| 11 | 45 | 25.9 | 10.9 | 42.6 | 22 | 22.1 | 11.2 | 37.9 | 11 |
| 12 | 47 | 31.2 | 12.8 | 42 | 16 | 34.5 | 17.3 | 42.5 | 10 |
| 13 | 53 | 32.8 | 10.8 | 52 | 25 | 20.5 | 11.2 | 26.3 | 9 |
| 14 | 56 | 33.4 | 16.1 | 46.8 | 16 | 35.1 | 28.1 | 44.9 | 6 |
| 15 | 59 | 32.6 | 13.8 | 49.9 | 17 | 21.8 | 10.3 | 43.4 | 22 |
| 16 | 62 | 25.9 | 14.1 | 57.5 | 27 | 15.4 | 15.4 | 15.4 | 1 |
| 17 | 63 | 21.4 | 10.6 | 42.4 | 27 | 17.3 | 10.8 | 27.4 | 13 |
| 18 | 63 | 42.2 | 13.1 | 83.2 | 20 | 53.4 | 46.1 | 61.5 | 3 |
| 19 | 64 | 36.1 | 23.9 | 57.2 | 9 | 19 | 12.2 | 37.6 | 10 |
| 20 | 69 | 33.6 | 17 | 41.7 | 11 | 21.1 | 13.6 | 29.3 | 5 |
| 21 | 70 | 19.4 | 10.5 | 38.8 | 34 | 18.8 | 10.6 | 26.9 | 2 |
| 22 | 72 | 28.9 | 10.5 | 85.5 | 45 | 44.7 | 28.2 | 54.9 | 7 |
| 23 | 74 | 35.8 | 18.9 | 48.1 | 12 | 24.4 | 20.9 | 27.8 | 4 |
| 24 | 76 | 25.6 | 10.6 | 36.7 | 22 | 23.1 | 11.3 | 34.2 | 11 |
BA: the fraction of basal area removed in the harvest, DBH: diameter at breast height.
Table A2.
Summary statistics for DBH of other conifers and deciduous species sampled in the 24 plots by percent basal-area removal and tree species.
Table A2.
Summary statistics for DBH of other conifers and deciduous species sampled in the 24 plots by percent basal-area removal and tree species.
| BA Removal | Other Conifers | Deciduous | |||||||
|---|---|---|---|---|---|---|---|---|---|
| Plot | % | Mean | Min | Max | n | Mean | Min | Max | n |
| 1 | 0 | 40.3 | 36.4 | 44.1 | 2 | 31.8 | 31.8 | 31.8 | 1 |
| 2 | 0 | 34.9 | 28.5 | 41.8 | 7 | 0 | 0 | 0 | 0 |
| 3 | 0 | 0 | 0 | 0 | 0 | 0 | 0 | 0 | 0 |
| 4 | 0 | 43.1 | 37.9 | 48.2 | 2 | 31.5 | 24.7 | 39.2 | 5 |
| 5 | 0 | 29 | 22 | 36.3 | 5 | 0 | 0 | 0 | 0 |
| 6 | 0 | 0 | 0 | 0 | 0 | 19.5 | 19.5 | 19.5 | 1 |
| 7 | 22 | 41.6 | 22.5 | 66 | 14 | 0 | 0 | 0 | 0 |
| 8 | 22 | 52.7 | 35.3 | 70 | 2 | 40.7 | 31.5 | 48.1 | 4 |
| 9 | 24 | 39.3 | 30.2 | 52.1 | 6 | 26.7 | 20.3 | 33 | 7 |
| 10 | 33 | 40.5 | 31.9 | 46.2 | 5 | 0 | 0 | 0 | 0 |
| 11 | 45 | 32.1 | 20.8 | 48.9 | 10 | 26.4 | 17.6 | 45.4 | 5 |
| 12 | 47 | 0 | 0 | 0 | 0 | 0 | 0 | 0 | 0 |
| 13 | 53 | 37.6 | 24.5 | 53.7 | 9 | 30.6 | 24 | 36.3 | 8 |
| 14 | 56 | 38 | 36.5 | 39.4 | 2 | 24.5 | 17.9 | 31 | 2 |
| 15 | 59 | 35.8 | 18.1 | 57.3 | 3 | 0 | 0 | 0 | 0 |
| 16 | 62 | 33.1 | 29.4 | 36.7 | 2 | 0 | 0 | 0 | 0 |
| 17 | 63 | 0 | 0 | 0 | 0 | 31.4 | 20.6 | 41.2 | 4 |
| 18 | 63 | 10.5 | 10.5 | 10.5 | 1 | 0 | 0 | 0 | 0 |
| 19 | 64 | 34.2 | 28 | 42 | 7 | 30.7 | 20.4 | 43.4 | 5 |
| 20 | 69 | 29.6 | 26.8 | 33.7 | 4 | 0 | 0 | 0 | 0 |
| 21 | 70 | 0 | 0 | 0 | 0 | 24.5 | 24.5 | 24.5 | 1 |
| 22 | 72 | 28.8 | 23.8 | 34.7 | 3 | 0 | 0 | 0 | 0 |
| 23 | 74 | 33.8 | 26.5 | 39.8 | 4 | 27.9 | 27.9 | 27.9 | 1 |
| 24 | 76 | 28.7 | 24.4 | 33.3 | 8 | 0 | 0 | 0 | 0 |
References
- Gustafsson, L.; Baker, S.C.; Bauhus, J.; Beese, W.J.; Brodie, A.; Kouki, J.; Lindenmayer, D.B.; Lõhmus, A.; Pastur, G.M.; Messier, C.; et al. Retention forestry to maintain multifunctional forests: A world perspective. BioScience 2012, 62, 633–645. [Google Scholar] [CrossRef]
- Messier, C.; Puettmann, K.; Chazdon, R.; Andersson, K.P.; Angers, V.A.; Brotons, L.; Filotas, E.; Tittler, R.; Parrott, L.; Levin, S.A. From management to stewardship: Viewing forests as complex adaptive systems in an uncertain world. Conserv. Lett. 2015, 8, 368–377. [Google Scholar] [CrossRef] [Green Version]
- Nocentini, S.; Buttoud, G.; Ciancio, O.; Corona, P. Managing forests in a changing world: The need for a systemic approach. A review. For. Syst. 2017, 26, eR01. [Google Scholar] [CrossRef]
- Albrecht, A.; Hanewinkel, M.; Bauhus, J.; Kohnle, U. How does silviculture affect storm damage in forests of south-western Germany? Results from empirical modeling based on long-term observations. Eur. J. For. Res. 2012, 131, 229–247. [Google Scholar] [CrossRef]
- Mitchell, S.J. Wind as a natural disturbance agent in forests: A synthesis. Forestry 2013, 86, 147–157. [Google Scholar] [CrossRef]
- Maxwell, S.; Green, D.S.; Zhang, W. Identifying the determinants of windthrow damage in wildlife tree patches in the Boreal White and Black Spruce biogeoclimatic zone of northeastern British Columbia. J. Ecosyst. Manag. 2010, 10, 1–8. [Google Scholar]
- Moore, J.R.; Mitchell, S.J.; Maguire, D.A.; Quine, C.P. Wind damage in alternative silvicultural systems: Review and synthesis of previous studies. In Proceedings of the International Conference ‘Wind Effects on Trees’, Karlsruhe, Germany, 16–18 September 2003; pp. 191–198. [Google Scholar]
- Anyomi, K.A.; Ruel, J.-C. A multi-scale analysis of the effects of alternative silvicultural treatments on windthrow within balsam fir dominated stands. Can. J. For. Res. 2015, 45, 1739–1747. [Google Scholar] [CrossRef]
- Anyomi, K.A.; Mitchell, S.J.; Ruel, J.-C. Windthrow modelling in old-growth and multi-layered boreal forests. Ecol. Model. 2016, 327, 105–114. [Google Scholar] [CrossRef]
- Pukkala, T.; Laiho, O.; Lähde, E. Continuous cover management reduces wind damage. For. Ecol. Manag. 2016, 372, 120–127. [Google Scholar] [CrossRef]
- Coates, K.D. Windthrow damage two years after partial cutting of the Date Creek silvicultural systems study in the Interior Cedar-Hemlock forests of northwestern British Columbia. Can. J. For. Res. 1997, 27, 1695–1701. [Google Scholar]
- Canham, C.D.; Papaik, M.J.; Latty, E.F. Interspecific variation in susceptibility to windthrow as a function of tree size and storm severity for northern temperate tree species. Can. J. For. Res. 2001, 31, 1–10. [Google Scholar] [CrossRef]
- Canham, C.D.; Thompson, J.; Zimmerman, J.K.; Uriarte, M. Variation in susceptibility to hurricane damage as a function of storm intensity in Puerto Rican tree species. Biotropica 2010, 42, 87–94. [Google Scholar] [CrossRef]
- Coates, K.D.; Banner, A.; Steventon, J.D.; LePage, P.; Bartemucci, P. The Date Creek Silvicultural Systems Study in the Interior Cedar-Hemlock Forests of Northwestern British Columbia: Overview and Treatment Summaries; Land Management Handbook 38; B.C. Ministry of Forests: Victoria, BC, Canada, 1997.
- Banner, A.; MacKenzie, W.; Haeussler, S.; Thomson, S.; Pojar, J.; Trowbridge, R. A Field Guide to Site Identification and Interpretation for the Prince Rupert Forest Region; Land Management Handbook 26; B.C. Ministry of Forests: Victoria, BC, Canada, 1993.
- Pojar, J.; Klinka, K.; Meidinger, D.V. Biogeoclimatic ecosystem classification in British Columbia. For. Ecol. Manag. 1987, 22, 119–154. [Google Scholar] [CrossRef]
- Meidinger, D.; Pojar, J. Ecosystems of British Columbia. Special Report Series 6; B.C. Ministry of Forests: Victoria, BC, Canada, 1991.
- Agriculture Canada Expert Committee on Soil Survey. The Canadian System of Soil Classification; Agriculture and Agri-Food Canada Publication No. 1646; Agriculture Canada Publication: Ottawa, ON, Canada, 1987. [Google Scholar]
- Scott, R.E.; Mitchell, S.J. Empirical modelling of windthrow risk in partially harvested stands using tree, neighbourhood, and stand attributes. For. Ecol. Manag. 2005, 218, 193–209. [Google Scholar] [CrossRef]
- Valinger, E.; Fridman, J. Factors affecting the probability of windthrow at stand level as a result of Gudrun winter storm in southern Sweden. For. Ecol. Manag. 2011, 262, 398–403. [Google Scholar] [CrossRef]
- Huggard, D.J.; Klenner, W.; Vyse, A. Windthrow following four harvest treatments in an Engelmann spruce—Subalpine fir forest in southern interior British Columbia, Canada. Can. J. For. Res. 1999, 29, 1547–1556. [Google Scholar] [CrossRef]
- Kamimura, K.; Gardiner, B.; Dupont, S.; Guyon, D.; Meredieu, C. Mechanistic and statistical approaches to predicting wind damage to individual maritime pine (Pinus pinaster) trees in forests. Can. J. For. Res. 2015, 46, 88–100. [Google Scholar] [CrossRef]
- Ruel, J.-C.; Raymond, P.; Pineau, M. Windthrow after shelterwood cutting in balsam fir stands. North. J. Appl. For. 2003, 20, 5–13. [Google Scholar]
- Coutts, M.P.; Grace, J. (Eds.) Wind and Trees; Cambridge University Press: Cambridge, UK, 1995. [Google Scholar]
- Ruel, J.-C.; Quine, C.P.; Meunier, S.; Suarez, J. Estimating windthrow risk in balsam fir stands with the ForestGales model. For. Chron. 2000, 76, 329–337. [Google Scholar] [CrossRef]
- Gardiner, B.; Byrne, K.; Hale, S.; Kamimura, K.; Mitchell, S.J.; Peltola, H.; Ruel, J.C. A review of mechanistic modelling of wind damage risk to forests. Forestry 2008, 81, 447–463. [Google Scholar] [CrossRef]
- Seidl, R.; Rammer, W.; Blennow, K. Simulating wind disturbance impacts on forest landscapes: Tree-level heterogeneity matters. Environ. Model. Softw. 2014, 51, 1–11. [Google Scholar] [CrossRef]
- Anyomi, K.A.; Mitchell, S.J.; Perera, A.H.; Ruel, J.C. Windthrow dynamics in boreal Ontario: A simulation of the vulnerability of several stand types across a range of wind speeds. Forests 2017, 8, 233. [Google Scholar] [CrossRef]
- Hale, S.E.; Gardiner, B.; Peace, A.; Nicoll, B.; Taylor, P.; Pizzirani, S. Comparison and validation of three versions of a forest wind risk model. Environ. Model. Softw. 2015, 68, 27–41. [Google Scholar] [CrossRef] [Green Version]
- Mitchell, S.J.; Hailemariam, T.; Kulis, Y. Empirical modeling of cutblock edge windthrow risk on Vancouver Island, Canada, using stand level information. For. Ecol. Manag. 2001, 154, 117–130. [Google Scholar] [CrossRef]
Figure 1.
Goodness of fit of the analysis of the windthrow data. Plotted are the observed proportions of stems actually windthrown, as a function of the predicted probability of windthrow (using the parameters for Model 4a, reported in Table 2). The observations are divided into uniform classes of predicted probability of windthrow (0–0.1, 0.1–0.2, etc.). The numbers above each symbol give the number of observations in that class. Also plotted is a 1:1 line.

Figure 2.
The relationship between the estimated storm severities for the 24 plots in the study and the observed proportion of stems >10 cm DBH that were windthrown. Note that the actual proportions of stems windthrown is a function of both storm severity and differences among plots in species composition and size structure, as well as logging history.

Figure 3.
Predicted susceptibility to windthrow as a function of species and relative tree size for the 4 species groups in unlogged stands. The predictions were generated from Model 4a, using the parameters reported in Table 2, but with no prior harvest and for non-edge trees. (A) For trees with a relative DBH of 1.0; (B) for trees with a relative DBH of 0.66; (C) for trees with a relative DBH of 0.33. Relative DBH is the DBH of a tree as a fraction of the largest DBH tree in the plot.

Figure 4.
Predicted susceptibility to windthrow as a function of relative tree size and proximity to a forest edge for western hemlock. The predictions were generated from Model 4a, using the parameters reported in Table 2, for two different levels of prior harvest (30% and 60% basal area removal) and for 3 different relative tree sizes (0.33, 0.66, and 1.00 relative DBH). (A) For non-edge trees in a plot with a 30% harvest; (B) edge trees in a plot with a 30% harvest; (C) non-edge trees in a plot with a 60% harvest; (D) edge trees in a plot with a 60% harvest.
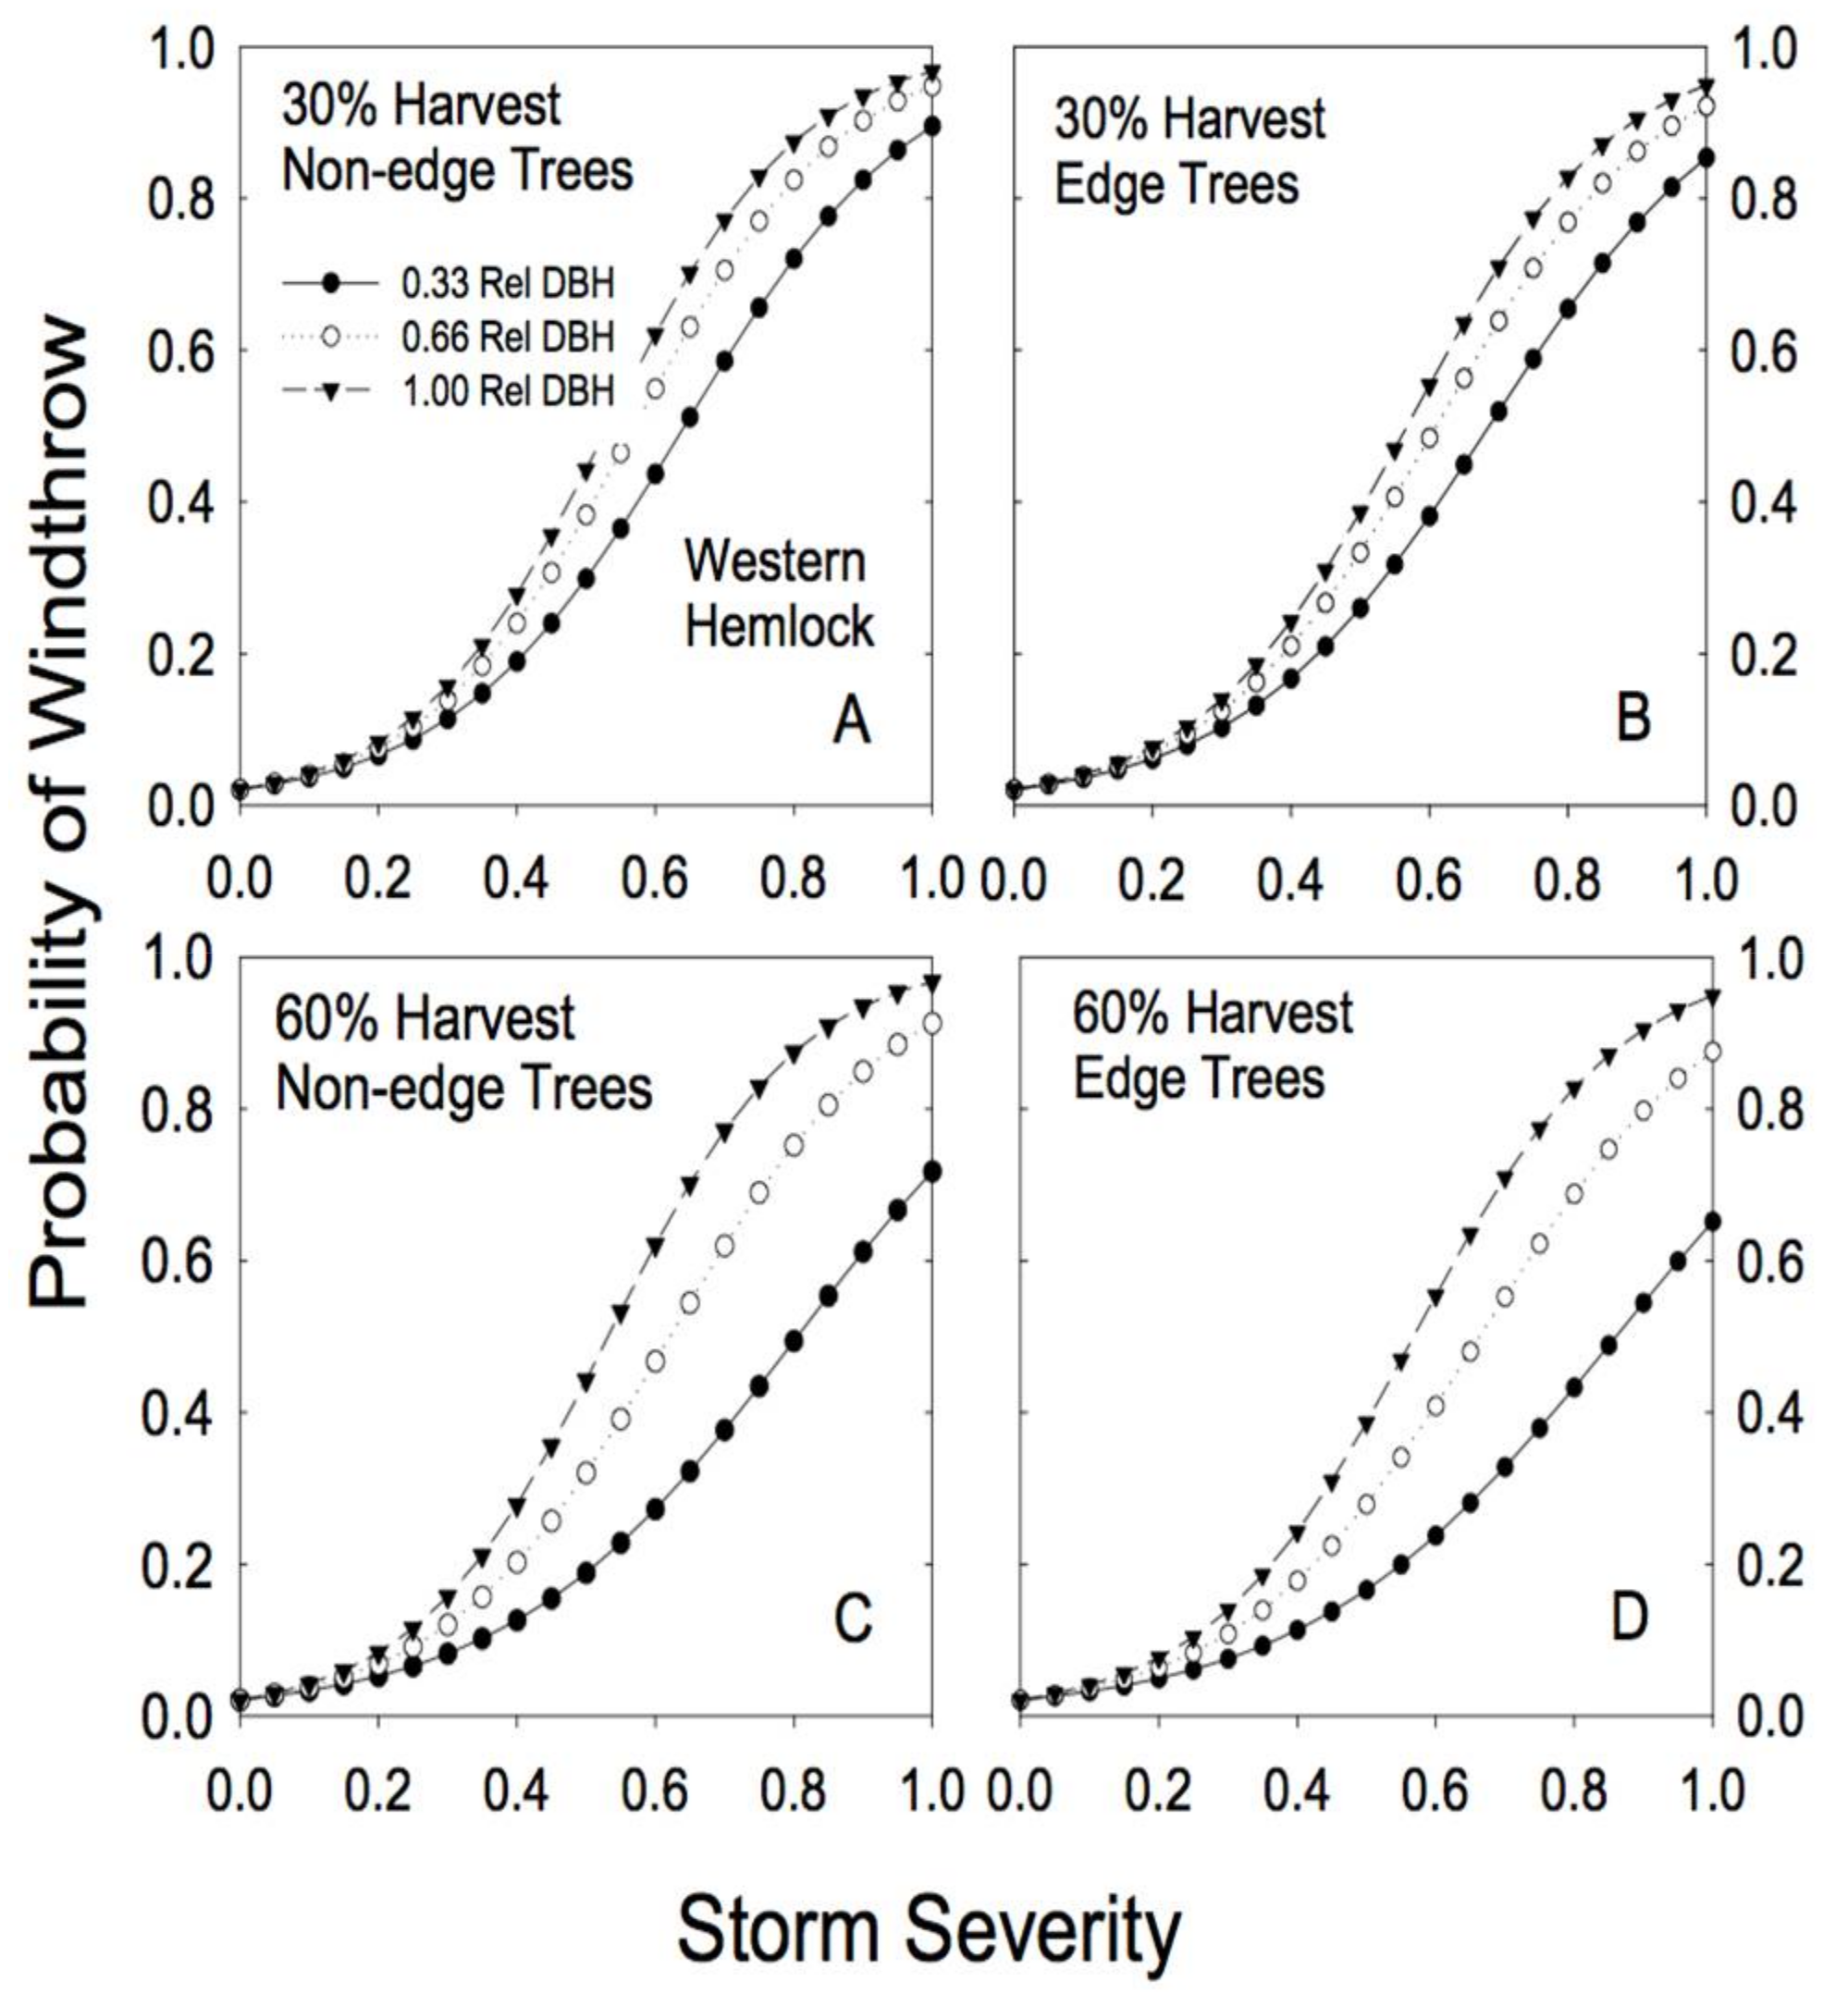
Figure 5.
Predicted susceptibility to windthrow as a function of relative tree size and proximity to a forest edge for western redcedar. The predictions were generated from Model 4a, using the parameters reported in Table 2, for two different levels of prior harvest (30% and 60% basal area removal) and for 3 different relative tree sizes (0.33, 0.66, and 1.00 relative DBH). (A) For non-edge trees in a plot with a 30% harvest; (B) edge trees in a plot with a 30% harvest; (C) non-edge trees in a plot with a 60% harvest; (D) edge trees in a plot with a 60% harvest.

Figure 6.
Predicted susceptibility to windthrow as a function of relative tree size and proximity to a forest edge for other conifer species. The predictions were generated from Model 4a, using the parameters reported in Table 2, for two different levels of prior harvest (30% and 60% basal area removal) and for 3 different relative tree sizes (0.33, 0.66, and 1.00 relative DBH). (A) For non-edge trees in a plot with a 30% harvest; (B) edge trees in a plot with a 30% harvest; (C) non-edge trees in a plot with a 60% harvest; (D) edge trees in a plot with a 60% harvest.

Figure 7.
Predicted susceptibility to windthrow as a function of relative tree size and proximity to a forest edge for the group of deciduous species. The predictions were generated from Model 4a, using the parameters reported in Table 2, for two different levels of prior harvest (30% and 60% basal area removal) and for 3 different relative tree sizes (0.33, 0.66, and 1.00 relative DBH). (A) For non-edge trees in a plot with a 30% harvest; (B) edge trees in a plot with a 30% harvest; (C) non-edge trees in a plot with a 60% harvest; (D) edge trees in a plot with a 60% harvest.

Table 1.
Akaike information criterion (AIC) values for the 4 sets of models using either absolute or relative diameter (diameter at breast height (DBH)). See text for a description of the different models. The best model (lowest AIC) and alternate models within 2 units of AIC are identified in bold.
| Model | DBH | AIC | DBH | AIC |
|---|---|---|---|---|
| 1 | Absolute | 1033 | Relative | 1023.4 |
| 1a | Absolute | 1027.5 | Relative | 1018.4 |
| 2 | Absolute | 1039.9 | Relative | 1039.9 |
| 3 | Absolute | 1035.5 | Relative | 1025.8 |
| 3a | Absolute | 1146.8 | Relative | 1017.4 |
| 4 | Absolute | 1027.6 | Relative | 1015.5 |
| 4a | Absolute | 1147.7 | Relative | 1009.3 |
Table 2.
Maximum likelihood parameter estimates (for variables defined in Equation 4) for Model 4a using relative DBH. Below each parameter estimate are the 2 unit asymptotic support limits.
Table 2.
Maximum likelihood parameter estimates (for variables defined in Equation 4) for Model 4a using relative DBH. Below each parameter estimate are the 2 unit asymptotic support limits.
| Tree Species | as | bs | cnon-edge | cedge | hs |
|---|---|---|---|---|---|
| Western hemlock | −3.85 | −0.034 | 7.24 | 6.78 | 0.68 |
| −4.06 to −3.67 | −0.079 to 0.029 | 6.87 to 7.59 | 5.88 to 7.73 | 0.57 to 0.80 | |
| Western redcedar | −4.24 | −0.093 | 3.96 | 4.38 | 0.082 |
| −4.61 to −3.83 | −0.22 to 0.04 | 3.47 to 4.49 | 2.70 to 5.75 | −0.14 to 0.35 | |
| Other Conifers | −7.36 | −0.31 | 8.95 | 13.92 | 0.9 |
| −7.90 to −6.85 | −0.43 to −0.17 | 8.20 to 9.66 | 11.51 to 16.37 | 0.68 to 1.19 | |
| Deciduous | −6.88 | −0.85 | 7.42 | 17.69 | 0.9 |
| −7.86 to −6.14 | −1.01 to −0.66 | 6.43 to 8.25 | 12.71 to 24.69 | 0.55 to 1.32 |
© 2018 by the authors. Licensee MDPI, Basel, Switzerland. This article is an open access article distributed under the terms and conditions of the Creative Commons Attribution (CC BY) license (http://creativecommons.org/licenses/by/4.0/).
Share and Cite
MDPI and ACS Style
Coates, K.D.; Hall, E.C.; Canham, C.D. Susceptibility of Trees to Windthrow Storm Damage in Partially Harvested Complex-Structured Multi-Species Forests. Forests 2018, 9, 199. https://doi.org/10.3390/f9040199
AMA Style
Coates KD, Hall EC, Canham CD. Susceptibility of Trees to Windthrow Storm Damage in Partially Harvested Complex-Structured Multi-Species Forests. Forests. 2018; 9(4):199. https://doi.org/10.3390/f9040199
Chicago/Turabian StyleCoates, K. David, Erin C. Hall, and Charles D. Canham. 2018. "Susceptibility of Trees to Windthrow Storm Damage in Partially Harvested Complex-Structured Multi-Species Forests" Forests 9, no. 4: 199. https://doi.org/10.3390/f9040199
Note that from the first issue of 2016, this journal uses article numbers instead of page numbers. See further details here.