Traffic-Induced Changes and Processes in Forest Road Aggregate Particle-Size Distributions


1
Department of Environment and Forest Resources, Chungnam National University, 99 Daehak-ro, Yuseong-gu, Daejeon 34134, Korea
2
School of Environmental and Forest Sciences, University of Washington, Seattle, WA 98195-2100, USA
3
US Department of Agriculture Forest Service, Rocky Mountain Research Station, 1221 South Main Street, Moscow, ID 83843-4211, USA
*
Author to whom correspondence should be addressed.
Forests 2018, 9(4), 181; https://doi.org/10.3390/f9040181
Submission received: 20 February 2018
/
Revised: 29 March 2018
/
Accepted: 30 March 2018
/
Published: 3 April 2018
(This article belongs to the Special Issue Forest Operations, Engineering and Management)
Abstract
:Traffic can alter forest road aggregate material in various ways, such as by crushing, mixing it with subgrade material, and sweeping large-size, loose particles (gravel) toward the outside of the road. Understanding the changes and physical processes of the aggregate is essential to mitigate sediment production from forest roads and reduce road maintenance efforts. We compared the particle-size distributions of forest road aggregate from the Clearwater National Forest in Idaho, USA in three vertical layers (upper, middle, and bottom of the road aggregate), three horizontal locations (tire track, shoulder, and half-way between them), and three traffic uses (none, light (no logging vehicles), and heavy (logging vehicles and equipment)) using Tukey’s multiple comparison test. Light traffic appears to cause aggregate crushing where vehicle tires passed and caused sweeping on the road surface. Heavy traffic caused aggregate crushing at all vertical and horizontal locations, and subgrade mixing with the bottom layer at the shoulder location. Logging vehicles and heavy equipment with wide axles drove on the shoulder and exerted enough stress to cause subgrade mixing. These results can help identify the sediment source and define adequate mitigation measures to reduce sediment production from forest roads and reduce road maintenance efforts by providing information for best management practices.
1. Introduction
Aggregate (crushed rock) is one of the most common surfacing materials used on low volume forest roads [1,2]. It reduces both wheel load stress to the subgrade material and maintenance costs, and provides better driving comfort than native-surface roads [3]. It also helps reduce sediment production from forest roads [4,5,6]. However, road aggregate deteriorates due to traffic, weather, and material properties [7], and, as a consequence, increased sedimentation occurs. Aggregate material can also be deformed and lost from the road surface due to vehicle traffic which then requires additional road maintenance. Therefore, it is important to understand how forest road traffic changes aggregate properties and movement (i.e., traffic-induced processes that change forest road aggregate).
Traffic-induced processes have been speculated on, and occasionally discussed, as part of field-based observations. For example, Reid and Dunne [8] mentioned (1) “breakdown of the surfacing material” and (2) “forcing upward of fine-grained sediment from the roadbed as traffic pushes the surfacing gravels into the bed”. Many other research studies have observed and discussed these processes, but often in varying terms. For example, the breakdown of road surfacing material (aggregate) was observed by Swift [4], described as “crushing” [9,10,11], and referred to as “powdering by traffic”, “particle attrition”, or “abrasion” [4,11,12]. It has also been described as “the mechanical degradation of surface aggregate under traffic loading” [13]. The second process, forcing upward of fine-grained sediment from the roadbed, was also observed by Swift [4], and has been further described as “piping” (enabling roadbed soil to pipe through the road prism; [6]), “pressing larger particles down through a matrix of fine sediment” [9], “churning” [10], “fine materials move through the pore spaces to the surface” [14], “pumping of fine particles onto the surface” [12], and “subgrade mixing” [13]. Our paper will refer to the breakdown of surfacing material as “crushing” and the forcing upward of fine-grained material as “subgrade mixing”.
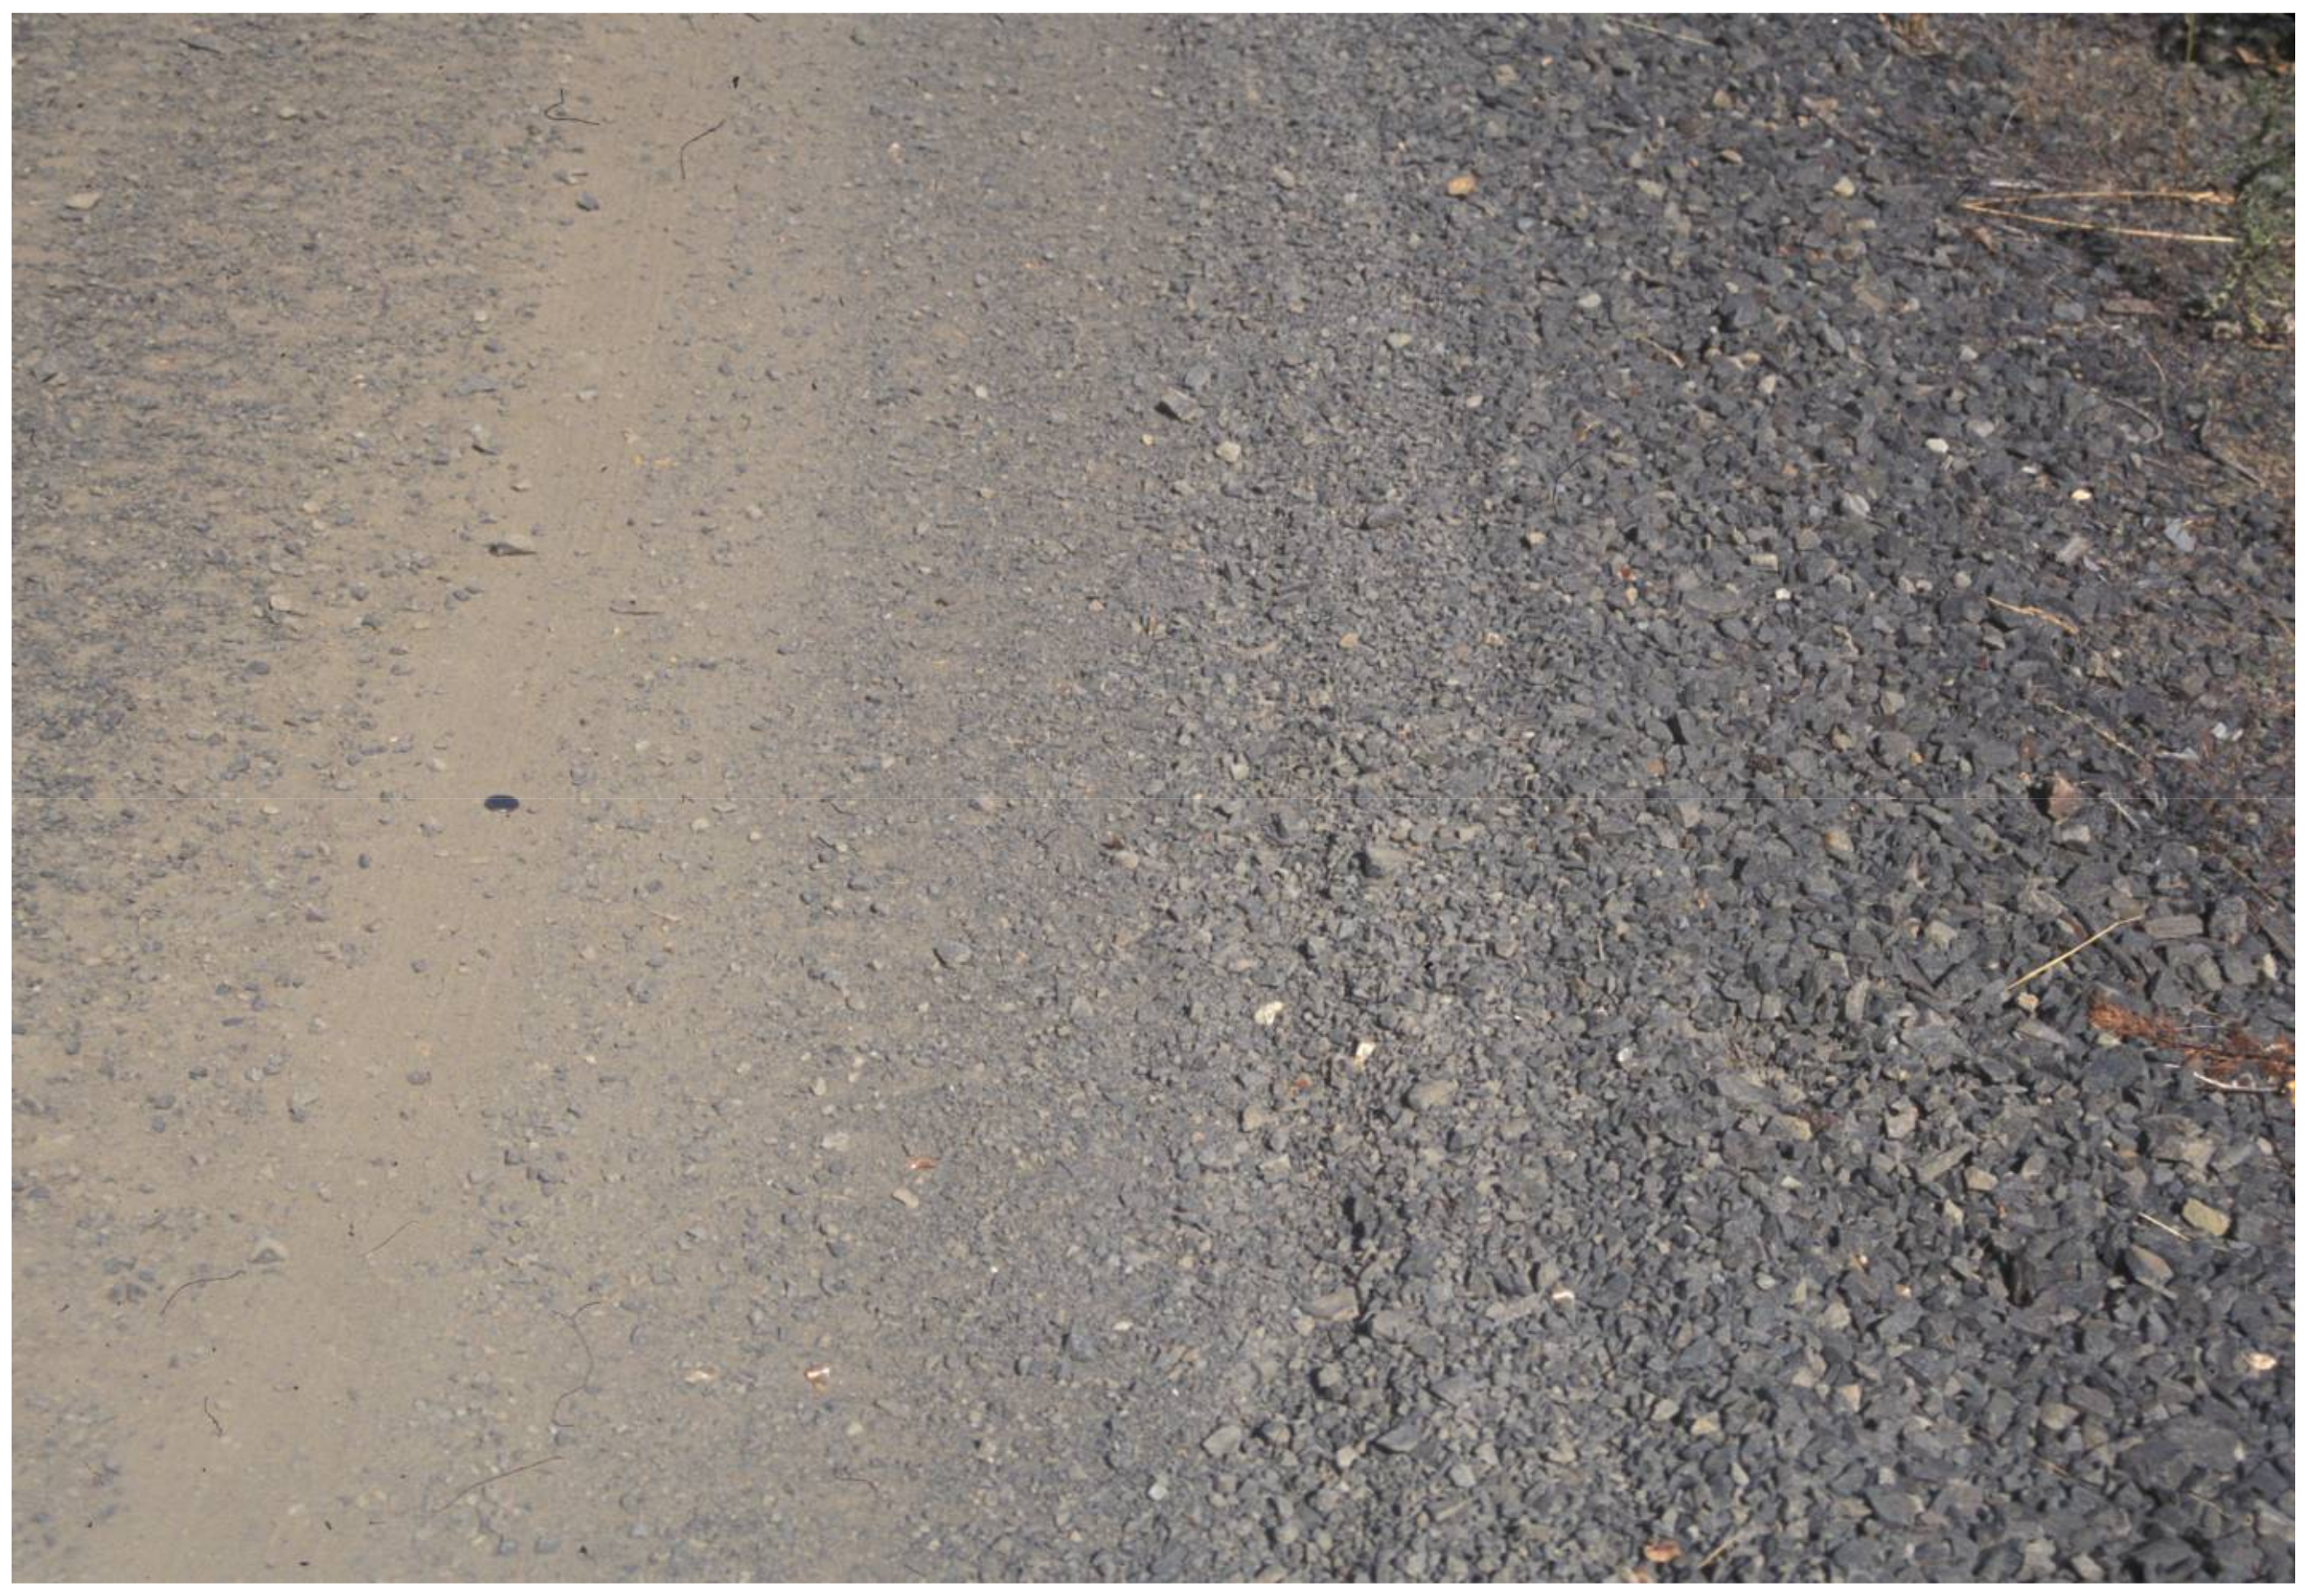
In addition to crushing and subgrade mixing, there is another traffic-induced process that alters forest road aggregate. Traffic moves loose aggregate material off the road by tire action [15], which is called “sweeping”. Traffic-induced sweeping results in the movement of loose aggregate particles to the roadside and shoulder. This is particularly prevalent at sharp corners where road surface aggregate tends to accumulate at the roadside (Figure 1) [11,16,17]. Two extreme cases of sweeping can be considered: sweeping-out (losing large-size particles, such as gravel, near tire tracks) and sweeping-in (receiving large-size particles near the shoulder).
It is difficult to investigate traffic-induced processes directly, because they can be related to many factors, such as the physical properties of road aggregate (e.g., particle size and strength) [13,18,19], tire pressure [20,21], road conditions (e.g., moisture content and compaction) [11,15,22], road gradient [6,12,23], road type (mainline or secondary road) [6], traffic use [6,8,11], and proximity to the root systems of neighboring trees [24]. However, the particle-size distribution (PSD) of road aggregate can be used as a surrogate to infer the traffic-induced processes of crushing, subgrade mixing, and sweeping.
Particle-size distribution is likely one of the most important characteristics of mineral soil and road aggregates and is routinely used to evaluate if the soil or aggregate is appropriate as an engineering material for road construction [2,25]. A PSD consists of a number of particle-size fractions (PSFs) for individual particle-size classes and is usually plotted as a cumulative frequency diagram in a semi-logarithmic scale (i.e., particle size using a logarithmic scale on the x-axis and percent passing on the y-axis). When traffic-induced processes such as crushing occur, smaller-size particles (fine sediment) are produced, changing the PSD. Therefore, the PSD can be used to infer the traffic-induced processes.
There have been few studies that have analyzed the soil and aggregate PSDs that are used for forest and gravel roads. In New Brunswick, Canada, surface and subgrade materials from two forest roads were analyzed using PSD [26], and two resurfacing methods were compared using PSDs from unpaved roads [16]. In addition, Foltz and Truebe [18,19] analyzed various aggregate material from the western USA and used PSD to evaluate aggregate quality. The PSD method has also been used to characterize surface and subgrade (base) materials in South Dakota, USA [27]. In Lithuania, PSDs were observed to become finer as gravel pavement wears away [28].
Understanding forest road PSDs can elucidate traffic-induced changes in aggregate size and distribution, and their processes. However, in previous studies, soil and aggregate materials were collected from limited cross-sectional locations. More importantly, previous studies did not investigate road aggregate PSD changes after traffic. To fully understand traffic effects on forest road aggregate, PSDs should be compared from various vertical and horizontal cross-sectional locations as well as after different traffic uses. We could not find any publications in which this is investigated. Understanding traffic effects on aggregate material can help reduce road maintenance efforts and costs, and help identify the sediment source (i.e., road aggregate or roadbed material) and define adequate mitigation measures to reduce sediment production by traffic from forest roads.
We hypothesize that all three traffic-induced processes (crushing, subgrade mixing, and sweeping) could alter the physical properties of forest road aggregate. Therefore, the goal of this study was to understand how traffic changes forest road aggregate PSD and, in particular, the magnitude of those changes for various traffic uses, thus contributing to a better understanding of forest roads, traffic, erosion, and their inter-relationships. The specific objectives were to (1) compare forest road aggregate PSDs with respect to vertical and horizontal location within a forest road cross-section and traffic use, and (2) infer how the traffic-induced processes changed the PSDs.
2. Materials and Methods
2.1. Study Area and Road Description
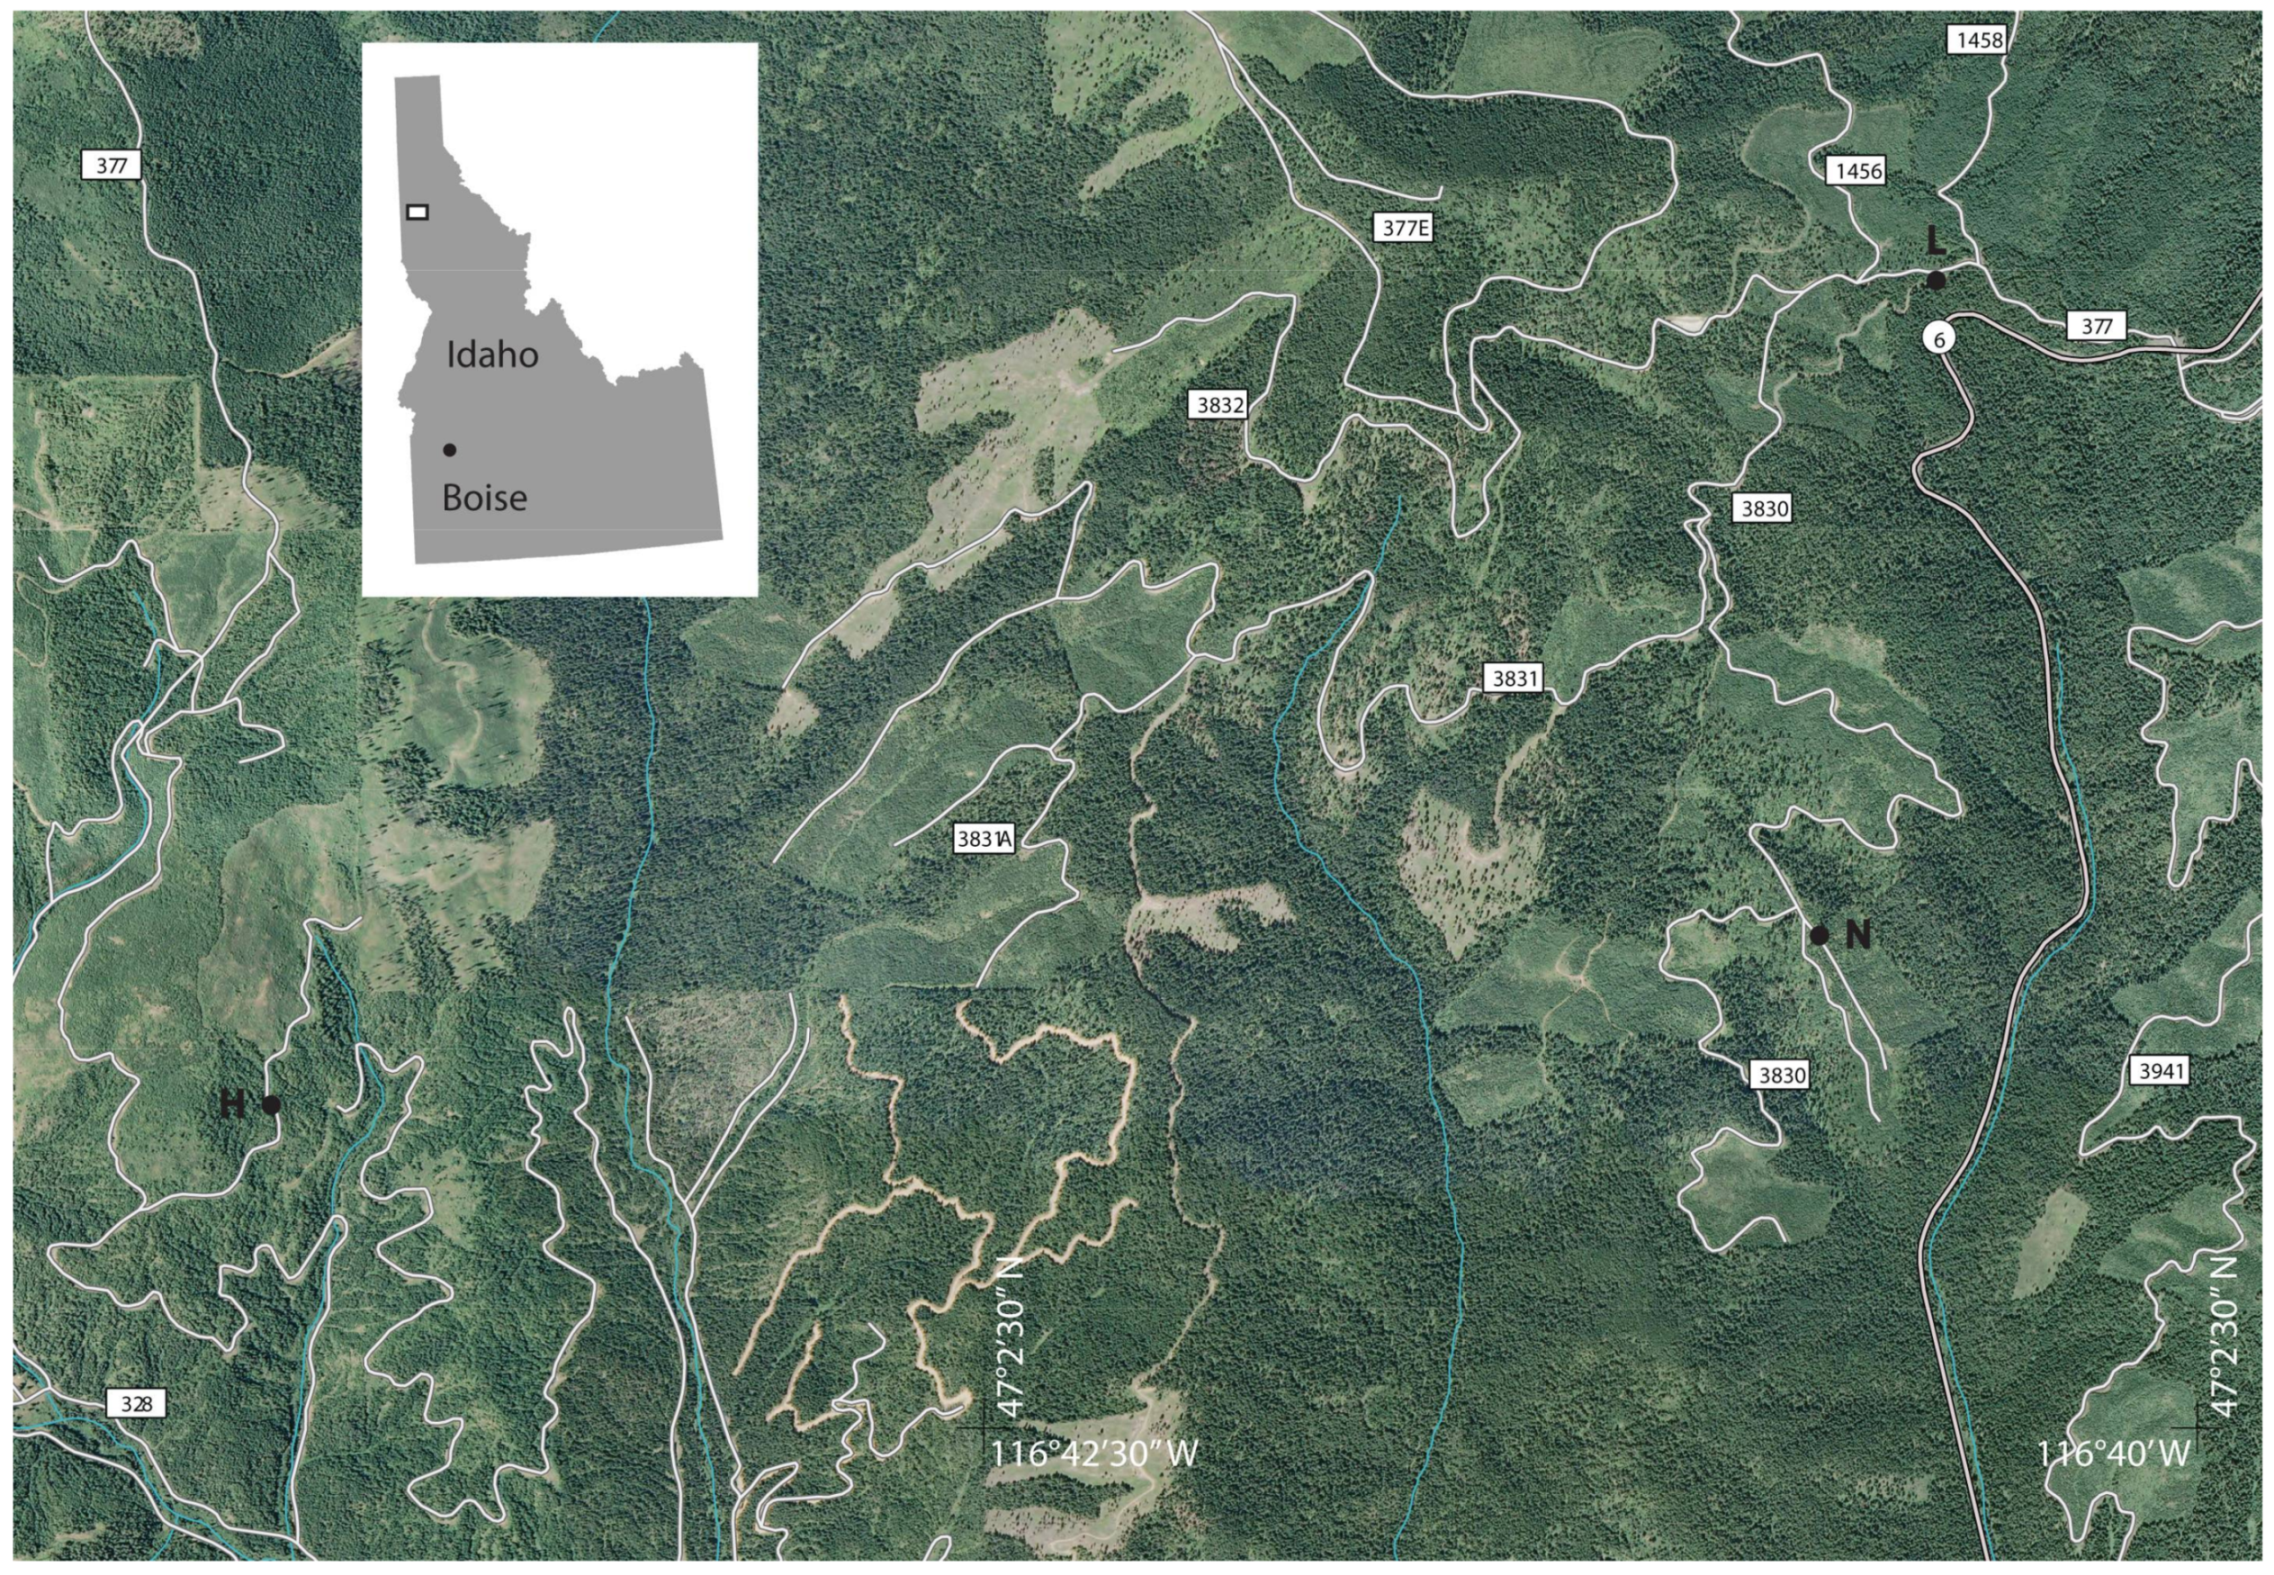
Study plots were located on three roads in the Clearwater National Forest area, about 39–43 km northeast of Moscow, Idaho (Figure 2; 47°03′12″ N, 116°40′47″ W; 47°04′07″, N 116°40′33″ W; and 47°02′57″ N, 116°43′58″ W, respectively). The study area has a normal precipitation of 658 mm year−1 [29] at a rainfall intensity of 18 mm hour−1 for 10-year return period [30,31]. It has dry summer months (average precipitation of 82 mm, July to September), on the basis of the closest weather station, located 13–17 km southwest of the study sites, in Potlatch, Idaho (46°57′36″ N, 116°51′18″ W; elevation 841 m). The normal annual mean temperature is 7.6 °C, ranging from −1.8 °C in December to 17.6 °C in August [29]. Each of the three roads used in this study had different traffic uses from the time they were constructed in 2002. The three roads were not specifically constructed for this study, but for actual forest management and log hauling. All three roads were primarily cut and fill roads, and were constructed using the same aggregate material (basalt) from the same quarry located 15–18 km south of the field sites. Each road was 5 m wide and had 0.1 m of aggregate applied on a fine subgrade of mineral soil in the same year, which was typical for forest road construction in the study area.
White Pine 3833 road was chosen to represent “no” traffic use (N). Since its construction this road was not used except for occasional light administrative traffic (about 20 passes per year). It had been closed to the public and no logging traffic passed prior to aggregate sample collection in 2005.
White Pine 3830-1 road was chosen for the “light” traffic use (L). After construction, this road was used by light trucks and automobiles, but with no log hauling. It also included approximately 20 passes of administrative vehicles per year. It is open to the public except during seasonal road closure when it is closed to large vehicles (larger than pickup trucks) from October to mid-June and closed to all vehicles from December to mid-May.
White Pine 377-M road was chosen for the “heavy” traffic use (H). It was used for log hauling during one dry season (June to September) before collecting aggregate samples. Log hauling was not allowed during wet road conditions because the load from heavy trucks and equipment could mix surface aggregate with subgrade and damage the road. Prior to use by logging traffic, the road had dust abatement applied by using calcium chloride (CaCl2) flake at a rate of 0.8 kg m−2. We estimated that approximately 375 round trips of a standard logging truck (one-way empty and one-way fully loaded) passed on the H road. Also, heavy logging equipment (e.g., tracked linkbelt yarder, high track caterpillar, excavator) passed on this road. Additionally, during logging, pickup-sized trucks made approximately 20 round trips per week for administrative and contractor use. The L and H roads were 12.8–22.8% more compacted than the N road when the aggregate samples were collected (Table 1).
2.2. Experimental Design
We used a total of 135 road aggregate samples collected during a single season. The 135 samples consisted of five replicates of 27 sample sets from the three vertical, three horizontal locations and three traffic uses. We analyzed the samples for PSD and compared them with respect to vertical, horizontal location, and traffic use. In addition, we compared PSDs on the N road and quarry samples to see if there were changes in PSD that should be attributed to road construction (i.e., when moving and applying aggregate). The PSD from the quarry was based on 12 aggregate samples collected at the time of road construction and was analyzed by the US Department of Agriculture, Forest Service, Palouse Ranger District office at the Clearwater National Forest.
2.3. Field Data Collection and Laboratory Analysis
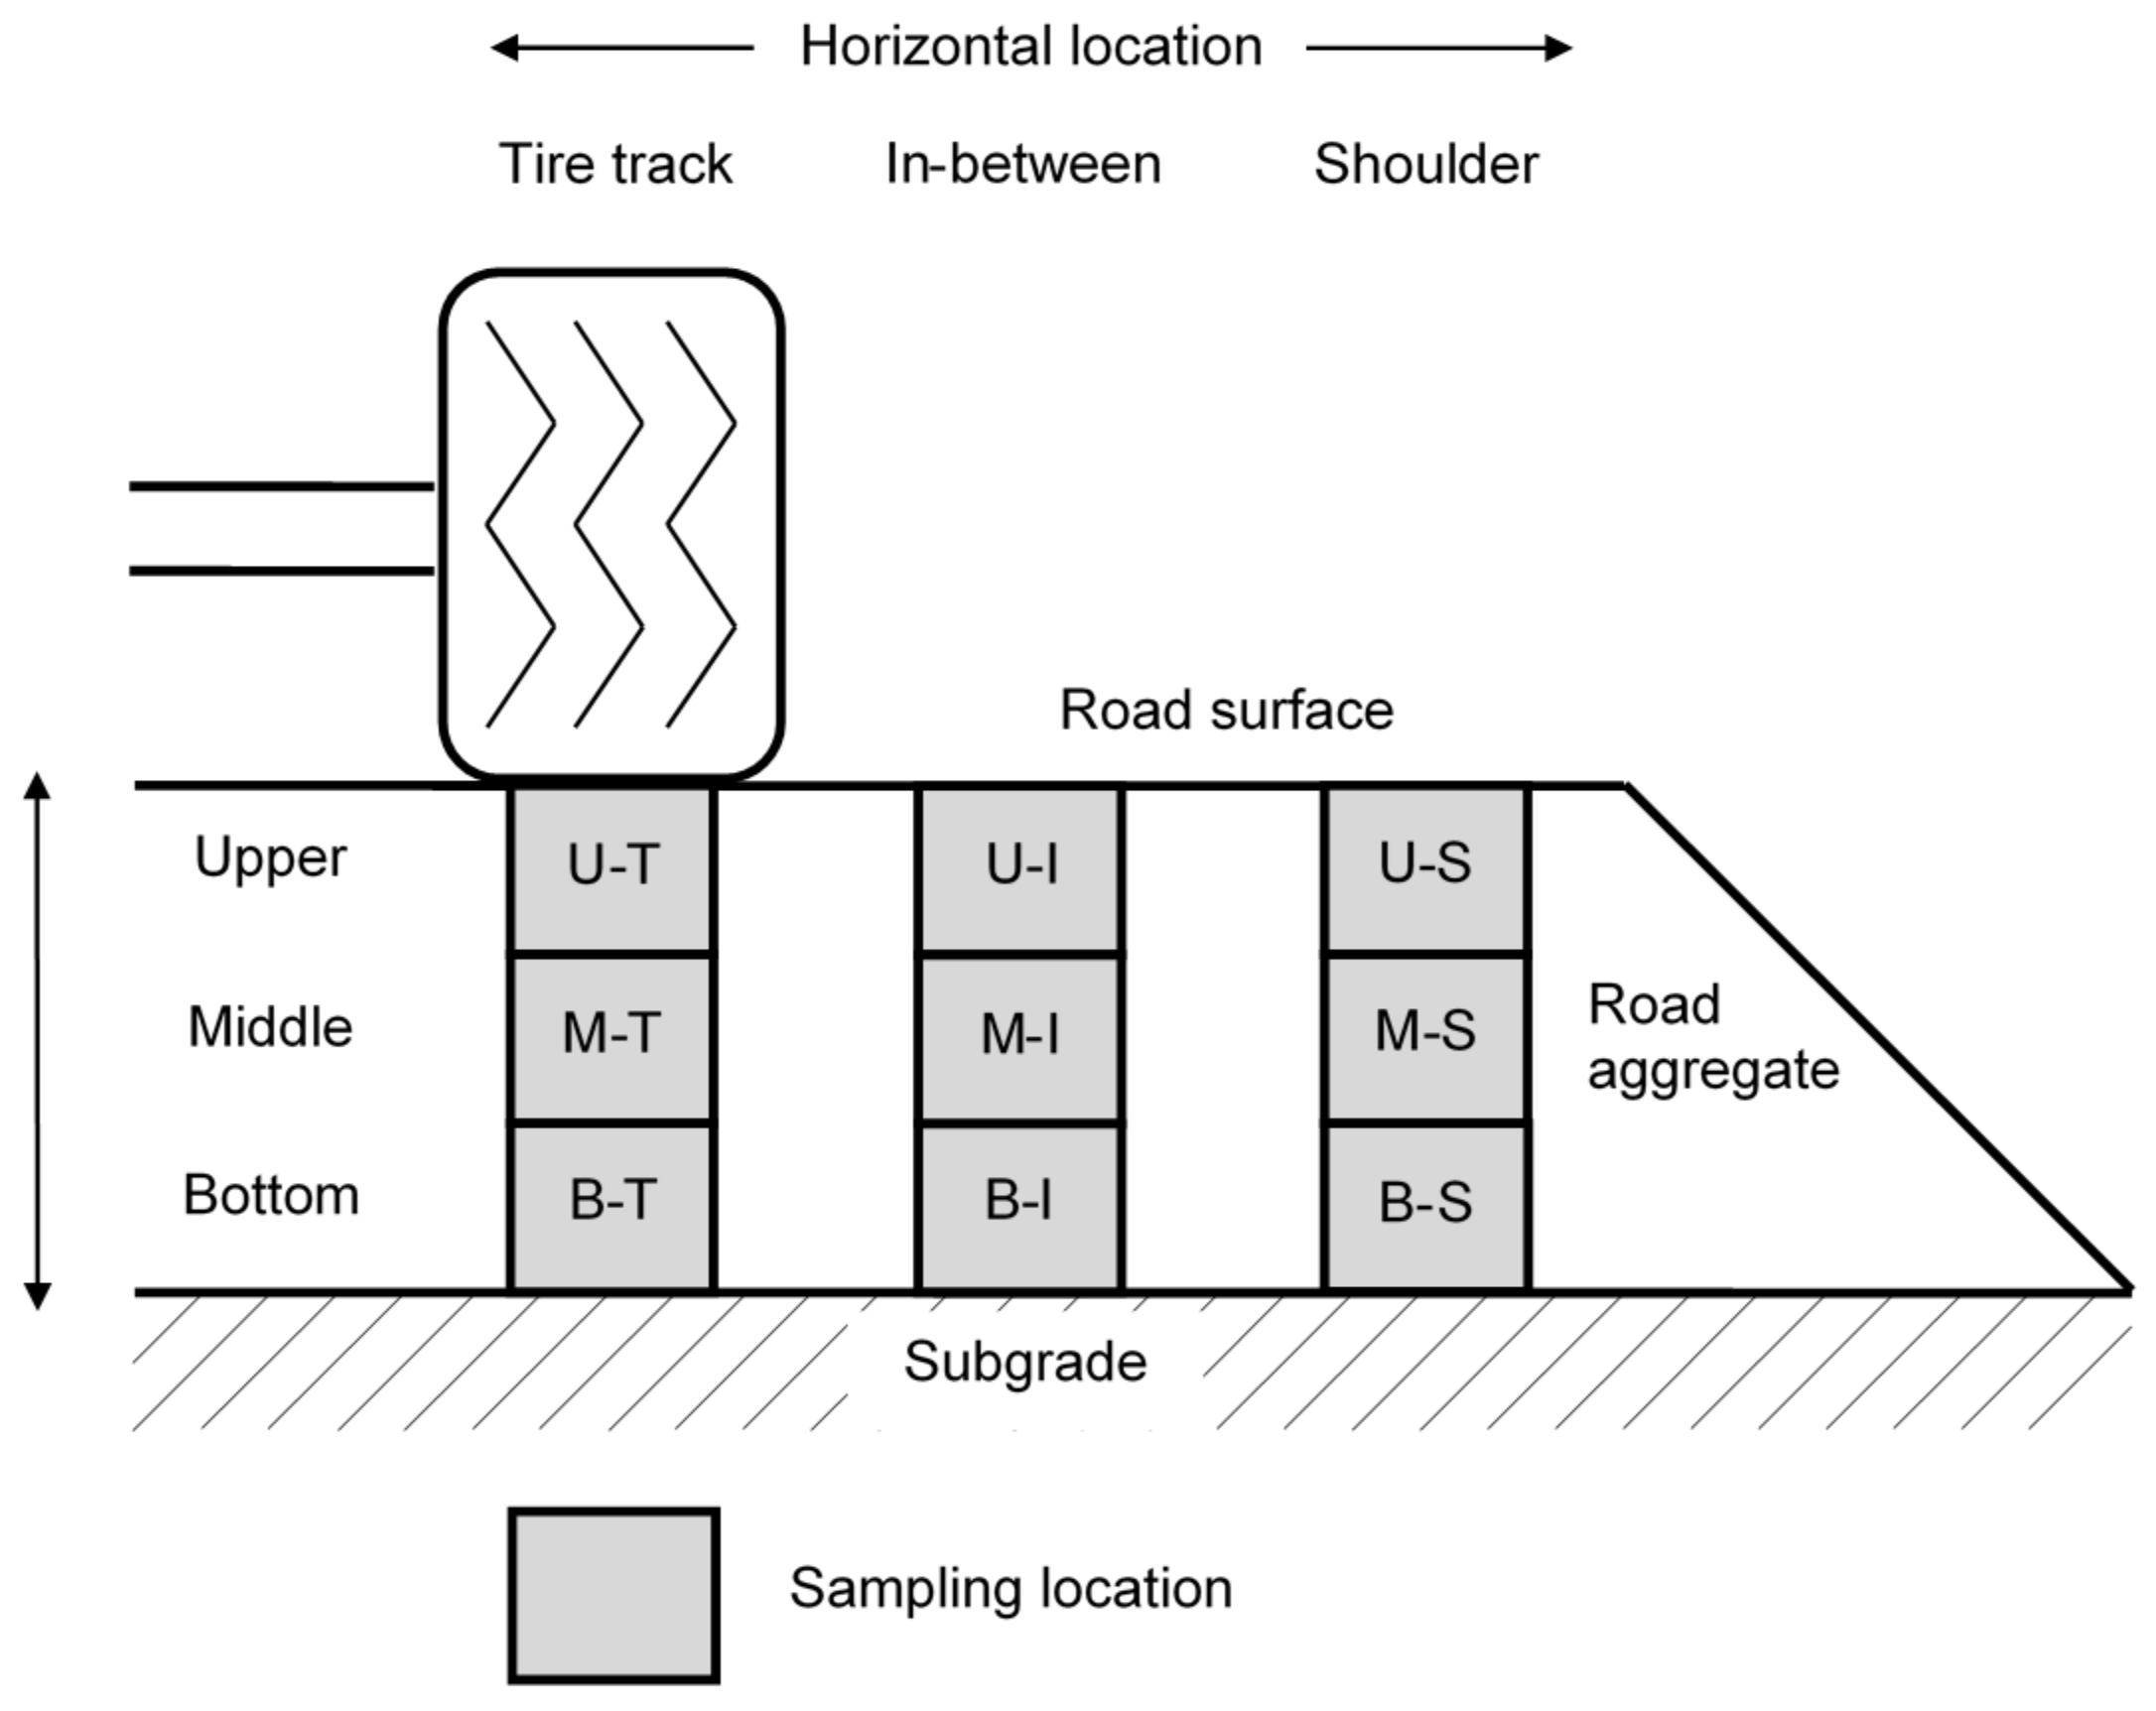
For each road traffic treatment, we collected aggregate samples from three vertical layers (upper (U), middle (M), and bottom (B)) at three horizontal locations (tire track, shoulder and in-between) to be able to capture the trends in aggregate changes by traffic (Figure 3). Tire track, T, was located 1.2 m from the outside edge of the shoulder; shoulder, S, was located 0.3 m from the outside edge; and in-between, I, was located half-way between T and S. Vehicles and equipment, especially ones with trailers and wide axle widths, could pass over all three horizontal locations, including the shoulder. Samples were collected to an aggregate depth of 0.1 m, resulting in an aggregate sampling depth of 33.3 mm which was deep enough to include the largest aggregate particle (25.4 mm diameter). When a large particle was found near the 33.3 mm depth, it was included in the layer with a larger proportion of that particle size. Aggregate samples in the bottom layer were collected down to the subgrade layer. Replicate cross-sections on each of the three roads were approximately 0.5 m apart.
The amount of aggregate material collected and analyzed was determined on the basis of the largest particle-size observed. The American Association of State Highway and Transportation Officials (AASHTO) T88-00 standard [34] and the American Society for Testing and Materials (ASTM) D422-63(2002) standard [35] suggested 2 kg of dry mass to analyze aggregate material with the largest particle of 25.4 mm diameter. A preliminary data analysis showed that 2 kg of dry mass required a volume of approximately 0.2 m length × 0.2 m width × 33.3 mm depth. Considering that a usual dry mass used for particle size analyses is about 0.5 kg (AASHTO T146-96 standard [36]), the collected 2 kg aggregate sample was divided into three or four sub-samples for ease in handling, analyzed following the AASHTO and ASTM procedures (AASHTO T88-00 standard [34] and ASTM D422-63(2002) standard [35]), and combined to make one PSD. We adopted a nested sampling method to reduce aggregate particle size analysis time [37]. For the nested method, we excavated and stored aggregate samples in two separate portions: small portion from 0.1 m × 0.1 m hole (0.5 kg), and large portion from 0.2 m × 0.2 m hole except the small portion (1.5 kg).
Particle size analyses followed the ASTM D2217-85 and D422-63(2002) standards [35,38] and Rhee et al. [37]. We conducted the small portion particle size analyses using 13 sieves: 25.4 mm (1 inch), 19.0 mm (¾ inch), 12.7 mm (½ inch), 9.51 mm (⅜ inch), 6.35 mm (¼ inch), 4.76 mm (US standard sieve No. 4), 3.36 mm (No. 6), 2.00 mm (No. 10), 1.00 mm (No. 18), 0.420 mm (No. 40), 0.250 mm (No. 60), 0.149 mm (No. 100), and 0.074 mm (No. 200). The large portion particle size analyses were conducted using only five sieves: 25.4 mm, 19.0 mm, 12.7 mm, 9.51 mm, and 6.35 mm. The small and large portions of the particle size analysis results were then combined to calculate a single particle size determination of each sampling location [37]. A particle size analysis finer than the 0.074 mm sieve was not conducted in the current study because a limited amount of crushing occurs below this particle-size in granular materials [39,40] and sieving is not used [35,40].
2.4. Comparison of Particle-Size Distributions
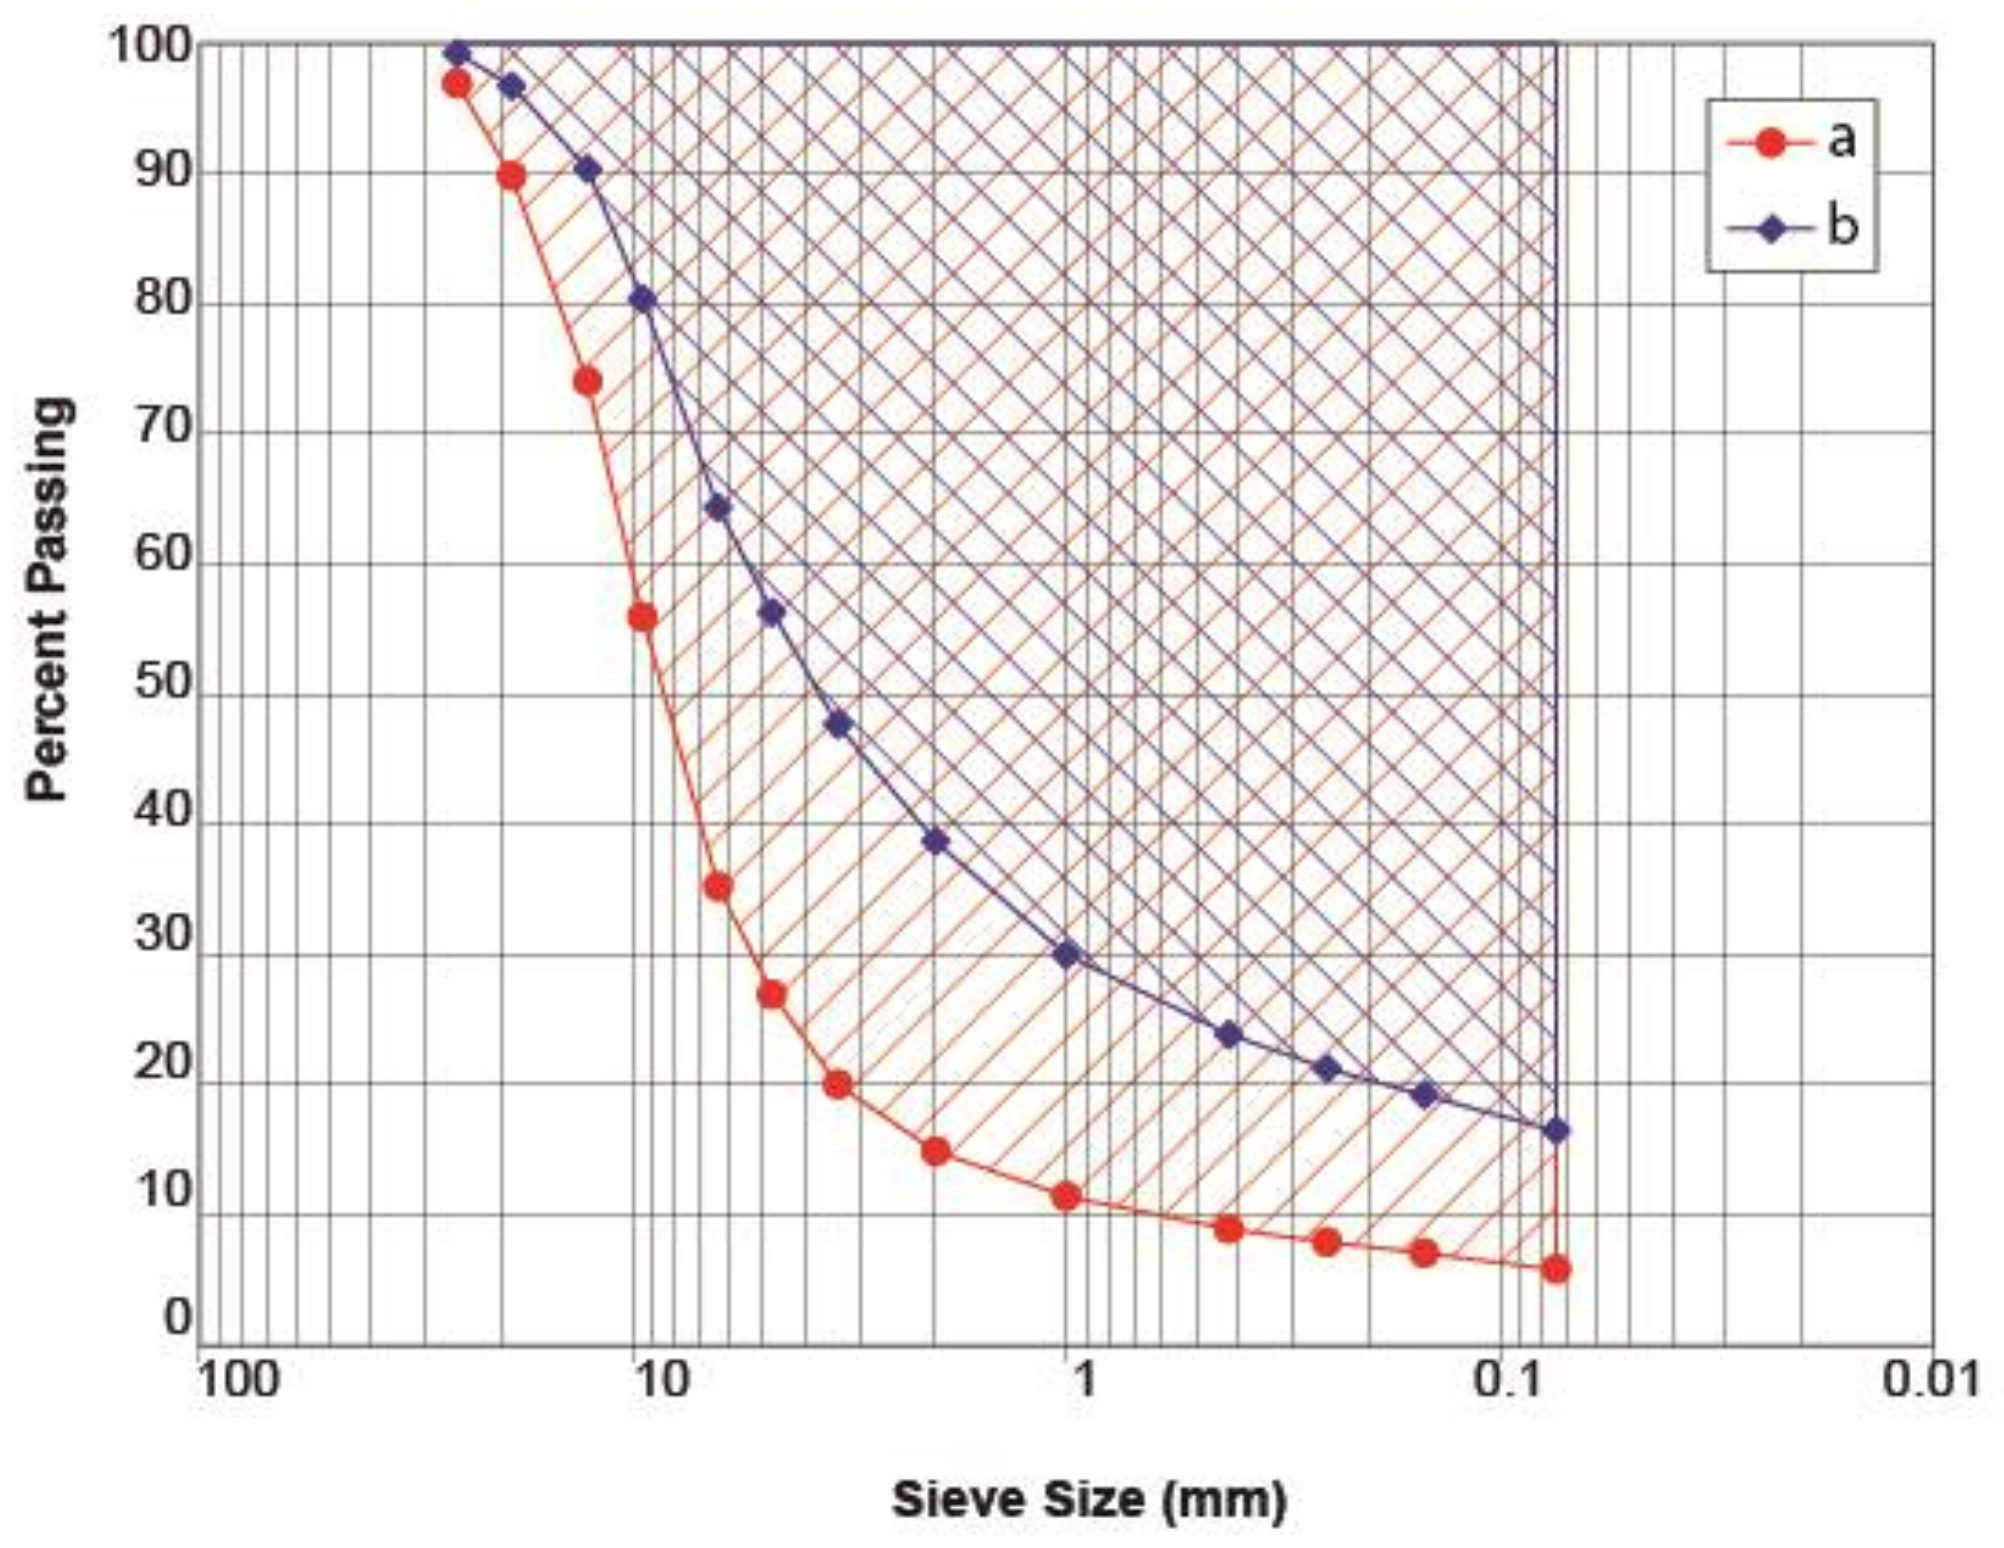
The PSD consists of particle-size fractions (PSFs) from each individual particle-size class. One way to compare PSDs is to compare the PSF results from each sieve size, which requires the same number and size of sieves. For example, 39 point-to-point comparisons are needed to compare three PSDs that consist of 13 sieve sizes. It is difficult to draw concise conclusions from many statistical comparisons for 13 individual sieve sizes. Instead, Hardin [39] suggested measuring particle breakage based on changes in entire PSD. He introduced breakage potential (Bp) as the area between the PSD curve and the 0.074 mm sieve in the cumulative frequency diagram (Figure 4). The Bp represents the total possible particle breakage if every particle were broken down smaller than the 0.074 mm-sieve size. We adopted the Hardin’s Bp as a surrogate parameter to represent a PSD for general and statistical comparison purposes in this study. We also compared changes in the shape of PSDs because traffic-induced processes might alter the shape of PSDs while having the same Bp value.
2.5. Statistical Analysis
We used Tukey’s multiple comparison test (honestly significant difference test [41]) to compare PSDs among different treatments of vertical layer (U, M, and B), horizontal location (T, I, and S), and road traffic use (N, L, and H). In addition, ANOVA (Analysis of Variance [41]) was used to compare the PSDs from N with the PSD from the quarry. We used a significance level of α = 5% for the statistical analyses.
3. Results
The PSDs from the collected aggregate were compared and analyzed with respect to different vertical layers and horizontal locations with the same level of traffic use and different traffic uses at the same cross-sectional location. In addition, we plotted the PSD data from the quarry and compared it with the other PSDs.
3.1. Particle-Size Distributions with No Traffic
3.2. Particle-Size Distributions after Light Traffic Use
The PSDs on the light traffic (L) road changed depending on the vertical layers and horizontal locations (Table 3 and Figure S2). Comparing vertical layers showed that the PSD at U-T-L was finer than at M-T-L; and the PSD at B-T-L was finer than both (U-T-L < M-T-L < B-T-L). In addition, the PSD at U-I-L was finer than at M-I-L and B-I-L. At the shoulder location, the PSD at U-S-L was coarser than at M-S-L and B-S-L. Comparing horizontal locations showed that the PSD at U-S-L was coarser than at U-T-L and U-I-L. There were no differences in PSDs at the horizontal locations at M-L and B-L.
3.3. Particle-Size Distributions after Heavy Traffic Use
On the heavy traffic (H) road, PSDs were uniform, except at B-S-H which had a finer PSD than the other vertical layers and horizontal locations (Table 4 and Figure S3). There were no differences in PSDs between different vertical layers at T-H and I-H. The PSD at B-S-H was finer than at U-S-H and M-S-H. There were no differences in PSDs at the horizontal locations at U-H and M-H. The PSD at B-S-H was finer than at B-T-H and B-I-H.
3.4. Particle-Size Distributions for Different Traffic Uses at the Same Cross-Sectional Location
The PSDs on the N road were not the same as the PSD from the quarry and varied by cross-sectional locations (Table 5 and Figure S4) despite having no differences from different vertical layers and horizontal locations (Table 2 and Figure S1). The PSDs at U-T-N, U-S-N, and M-S-N were coarser than from the quarry. However, at B-I-N, the PSD was finer than from the quarry. As traffic increased from none to light to heavy, PSDs became finer, except at M-T (Table 5 and Figure S4).
On the L and H roads, the PSDs were finer than on the N road at U-T and U-I. In addition, the PSDs on the H road were finer than on the L road at B-T, B-I, and shoulder locations. There were no differences between the PSDs at M-I-N and M-I-L, and at M-I-L and M-I-H; however, the PSD at M-I-H was finer than at M-I-N. The PSD at B-S-H was much finer than at B-S-N and B-S-L, and also finer than at other cross-sectional locations on the H road (Table 4).
4. Discussion
The study results help infer crushing, subgrade mixing, and sweeping-in processes by comparing PSDs from the quarry and forest road aggregate. We inferred that crushing occurred at U-T-L, U-I-L, and all cross-sectional locations on the H road, because the PSDs from these locations and traffic uses were finer than from the other locations. Crushing was only observed near the tire track and road surface (U-T and U-I) on the L road (Table 3) and was observed at all cross-sectional locations with increasing traffic use (H) (Table 4), indicating that the crushing occurred near the tire track on the road surface first, than in the deeper aggregate. Subgrade mixing might have occurred at B-S-H, because the PSD here was finer than the rest of the PSDs on H and the location of subgrade mixing (B-S-H) was the bottom layer (Table 4). Also the subgrade PSD was much finer than any of the road aggregate PSDs (Figure 5), confirming a strong likelihood of subgrade mixing. Considering that crushing occurred at the other cross-sectional locations on H, we inferred that both crushing and subgrade mixing occurred at B-S-H. We also inferred that sweeping occurred at U-S-L, because the PSD at U-S-L was coarser than at the other locations on the L road and the location of the sweeping-in (U-S-L) was the shoulder on the road surface (Table 3).
Our study results partially agree with the results from Toman and Skaugset [13] in which they observed that subgrade mixing did not occur on three forest roads in northwestern California and Oregon. However, our data indicate subgrade mixing might have occurred at one cross-sectional location on the H road. In addition, Toman and Skaugset [13] speculated that fine sediment came from either the surface aggregate itself or its breakdown by traffic, which agrees with our data that crushing is the dominant traffic-induced process influencing sediment production from forest roads.
No ruts were observed from the study roads and, therefore, 0.1 m deep aggregate was enough to prevent soil loss from the roadbed. Swift [4] reported that 0.05 m of aggregate depth was not enough, but 0.15 m prevented ruts and reduced soil loss from forest roads. When designing an aggregate-surfaced road, 0.1 m of minimum aggregate thickness is often chosen [1] and our study supports these previous findings.
Stress from vehicle loads causes the physical properties of forest road aggregate, such as PSD, to change. Compressive stress on a forest road is concentrated under the loading axis and is highest at or near the road surface [42,43]. We found that crushing occurred in the upper vertical layer at the tire track and in-between locations (U-T-L and U-I-L) where light traffic tires passed. Light traffic could pass on tire track and in-between locations, because light traffic vehicles have relatively narrow axle width (1.6–1.8 m) and the forest roads were relatively wide (5 m) leaving a large surface for driving. However, light traffic did not provide enough stress to crush the road aggregate below the upper layer (U). Likewise, with heavy traffic, crushing occurred at all cross-sectional locations, indicating that traffic passed on all horizontal locations including the shoulder. Heavy traffic vehicles have wide axle widths (1.8–2.2 m [44]) and many often have dual tires. Some heavy vehicles, such as Commercial Motor Vehicles (CMVs), are even wider (up to 2.6 m [45]). Overloaded vehicles used by the USDA Forest Service included a tracked loader with a width of 3.7 m and an axle load of 41 Mg [44]. In addition to heavy loads, tracked loaders do not use inflated tires but use steel tracks that likely crush the aggregate surface. Therefore, heavy logging vehicles and equipment can exert more structural damage (e.g., crushing) to a forest road than light traffic. For example, a passenger vehicle weighing 1.8 Mg with a tire pressure of 207 kPa (30 psi) would need to pass 528 times to cause the same structural damage to a forest road as a single pass by a standard 36 Mg log truck with a typical tire pressure of 550 kPa (80 psi [46]) [1]. Therefore, heavy traffic, including logging equipment, can provide enough stress to change the PSDs of all cross-sectional locations of forest road aggregate.
When there is enough stress, aggregate material may be crushed or moved down into the finer-textured subgrade material, but its movement is dependent on material strength, particle size of the aggregate, and road conditions such as water content and compaction. The material strength of cohesive soils and rocks can be approximated by using uniaxial compression strength [47]. Forest roads are usually well compacted with a uniaxial compression strength of 0.6–1 MPa (very stiff soil; very difficult to move with hand pick, pneumatic tool needed for excavation), ranging up to over 200 MPa (very strong rock; quartzite, dolerite, gabbro, and basalt). The normal and shear stress from traffic might not be enough to crush forest road aggregate particles, especially below the upper layer. However, the contact stress between tire and aggregate particle or between aggregate particles, might be enough to cause the crushing [48] because aggregate particles have polyhedron shapes with many flat faces and sharp edges [49], resulting in high contact stresses produced when the sharp edges are pressed. Farmani et al. [50] found that higher contact stress was distributed across the areas between large-size aggregate particles, indicating that this type of stress is more likely to break large-size particles. A material often loses its strength over time when experiencing stresses lower than the level that would cause instantaneous failure. This “fatigue” ultimately leads to fracturing if the stresses continue [51]. In nature, fatigue is a major factor in the physical weathering processes of rocks [52]. Erarslan and Williams [53] noted that static and cyclic loading due to vehicle-induced vibrations and traffic often caused rocks to fail at a lower stress. Vehicles used in forest operations, especially log trucks, have multiple axles and can exert repeated, cyclic loadings on the road aggregate. Therefore, traffic can cause the aggregate particles to break by fatigue failure. The roads we used had basalt as the aggregate material because this material is locally available and commonly used to surface forest roads throughout the Pacific Northwest [19]. There are a variety of aggregate tests developed by ASTM and AASHTO [18,19], including Los Angeles Abrasion (AASHTO T96 standard [54]) to measure aggregate’s resistance to crushing (mechanical breakdown) from traffic; however, they are beyond the scope of this study. Even if the study roads had a stronger aggregate material, heavy traffic and logging equipment could change the PSDs of some or all of the cross-sectional locations to a 0.1 m depth.
The heavy traffic road (H) was subjected to application of calcium chloride for dust abatement. Calcium chloride is used to help hold fine particles on the road surface together, thus reducing dust, surface raveling (loose aggregate), washboarding (corrugations), and maintenance costs [55,56,57]. Therefore, the effects of calcium chloride on subsequent PSDs was likely limited to the road surface. Since our work indicates no significant differences in PSDs from the upper and middle layers on the H road, we could not detect the effect of calcium chloride on PSDs using an aggregate sampling depth of 33.3 mm. A different sampling method might be needed to investigate the effect of dust abatement on road aggregate PSDs.
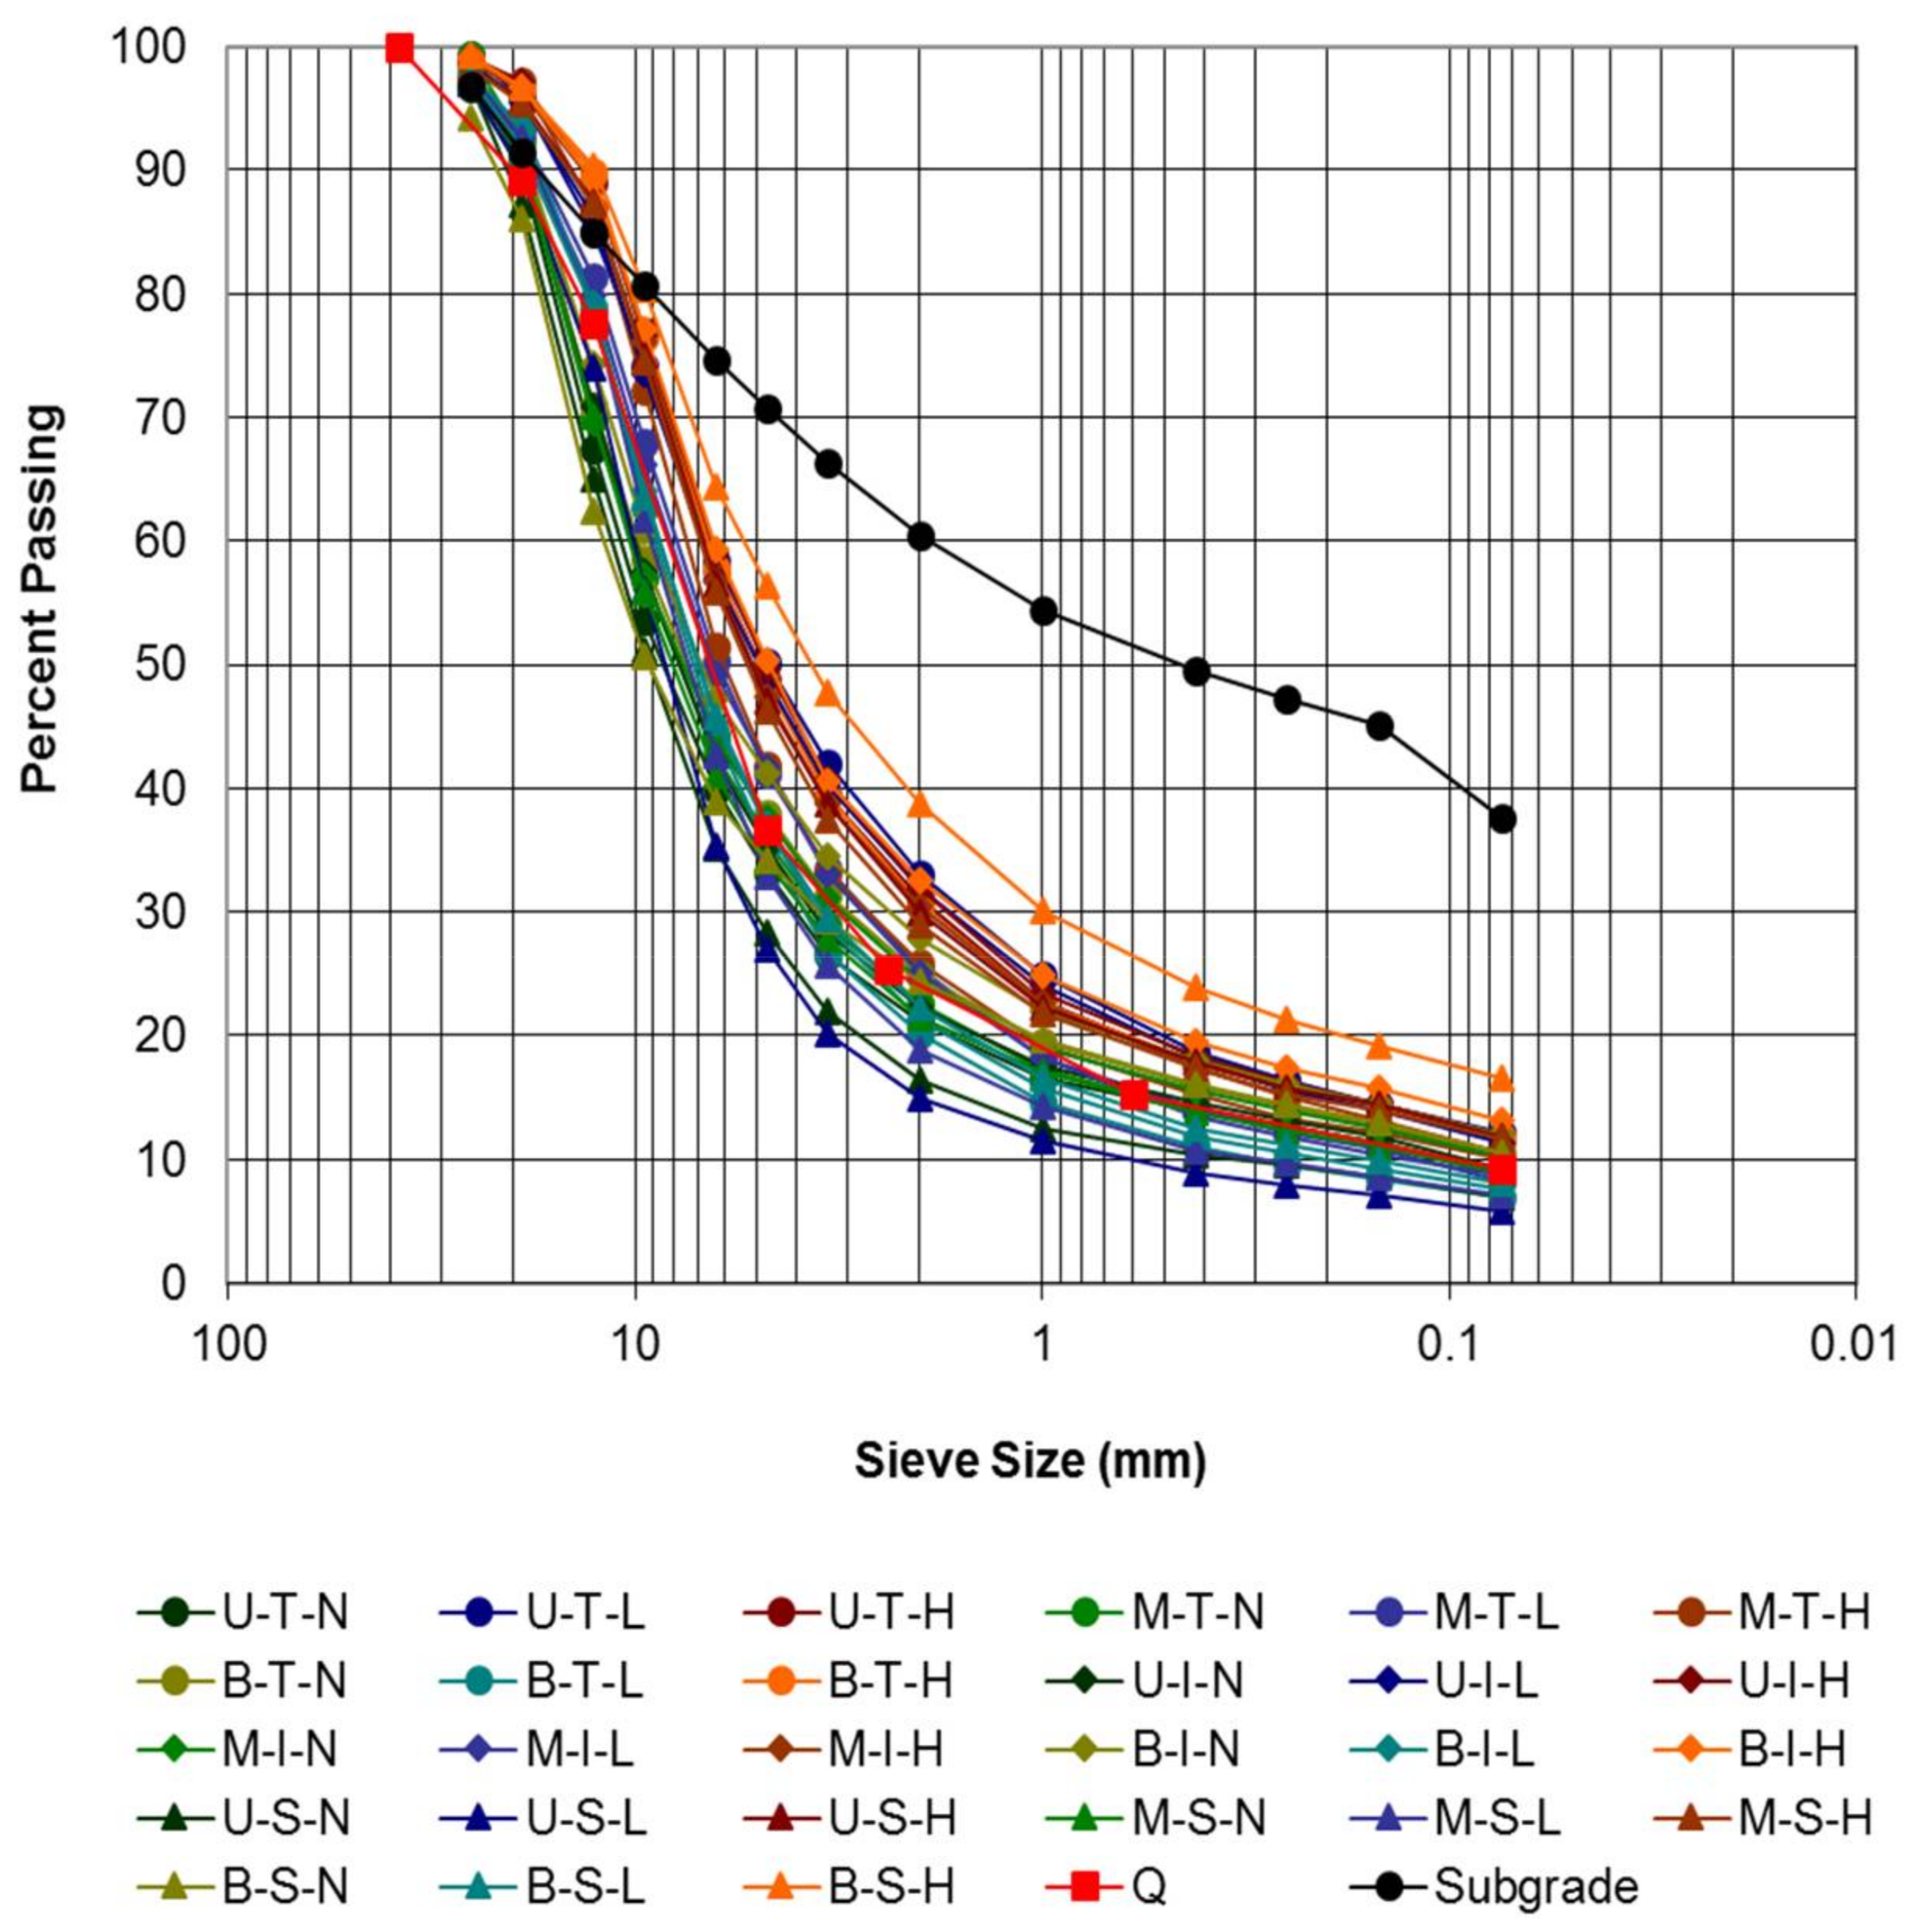
Particle size is an important factor for aggregate crushing. Soil and rock (aggregate) strength increases with decreasing particle size [58,59,60]. Forest road aggregate usually consists of various-sized particles to meet the Forest Service’s specifications for surface course aggregate [2]. Stress from traffic likely crushes larger-size particles into smaller ones within the road aggregate. Our data shows the changed PSDs did not get finer than a certain PSD limit, close to the particle-size distribution curves at U-I-H or B-I-H, except the particle-size distribution at B-S-H where subgrade mixing likely occurred in addition to crushing (Figure 5). This curve is the limit to which the stress from traffic can crush road aggregate. Traffic crushes and compacts road aggregate, and subsequently makes aggregate PSDs finer. Therefore, we can consider this PSD limit as the optimum compaction by crushing for a given road condition and aggregate material. A similar concept was noted by Fuller and Thompson [61] who described an idealized grading that represented the densest state of packing particles (Fuller packing) [62]. Once the aggregate reaches this limit, stress from traffic is delivered, without further changing the PSD, to the aggregate below or to the subgrade where more crushing or subgrade mixing may occur.
Aggregate is made by crushing rocks in a quarry and is delivered to a road construction site by vehicles such as dump trucks. It is then dumped out of the vehicle and spread on subgrade material. During this process, particle-size segregation might occur; as observed in some road aggregates [17,63]. While road aggregate is being delivered, vehicles vibrate and shake aggregate particles, which might potentially cause particle-size segregation. This particle-size segregation is often called the “Brazil-nut” effect which originated from the observation that shaking mixed nuts made the Brazil nuts (the biggest) move upward and end up on top of the mixed nuts [64]. This phenomenon occurs for granular materials having a wide size distribution, even at the molecular level, making large particles rise to the top of a mixture, and fine particles move downwards [64,65,66]. However, the shapes of the aggregate particles are polyhedrons [49], thus there can be interlocking of the aggregate particles which prohibits movement. Therefore, it is not known if particle-size segregation occurs during aggregate transport. Once aggregate arrives at the road construction site it is dumped out of the vehicle. When aggregate particles are dumped, large particles tend to roll down to the edge of the pile causing particle-size segregation. This is similar to a scree slope with rockfall sorting in which larger particles are at the bottom edge of the slope [67] and has been reported when granular materials with different particle properties (e.g., size, density, shape, resilience, angle of repose, and cohesiveness) are deposited [65,68]. Aggregate dumped and spread on subgrade likely has the same particle-size segregation occurring at road edges (i.e., shoulder). Interestingly, this study points out some inconsistencies. On the N road, PSDs were uniform (Table 2). However, at U-T-N, U-S-N, and M-S-N they were coarser than the PSD from the quarry (Table 5), indicating that particle-size segregation may occur from the quarry to the newly constructed road.
Root and soil interactions may also be another cause of changes in road aggregate, because vegetation root systems can loosen compacted road surface [69,70]. Also, roots from nearby trees can cause upheaval or displacement of the road surface [24]. This road surface change has particularly been noted on paved roads, but could also occur on unpaved roads, such as aggregate or native-soil-surfaced roads. However, we did not test for this on our road surfaces because of the relatively short timeframe that our study sites had been in use.
5. Conclusions
Knowledge of traffic-induced changes to forest road aggregate PSD is important for reducing road maintenance efforts and sediment production from forest roads. This study provides new data to help understand traffic-induced changes in PSD. Increased traffic changed the PSDs by all three processes we examined: crushing, subgrade mixing, and sweeping. We inferred these traffic-induced processes by comparing forest road aggregate PSDs from vertical and horizontal locations, and traffic uses. No differences in PSD were found on the no traffic road, indicating no processes occurred. Light traffic made the PSDs at U-T and U-I finer, indicating crushing occurred, and made the PSD at U-S coarser, indicating sweeping occurred. Heavy traffic and logging equipment with wide axles made all the PSDs finer, which indicates crushing occurred at all cross-sectional locations. In addition, the PSD at B-S was finer than the other locations and can be explained by subgrade mixing in the bottom layer at the shoulder.
Crushing appears to have been the dominant process on our study roads based on PSD comparisons. Crushing changed the PSDs up to a certain limit, but no finer. Having road aggregate close to the PSD limit would reduce aggregate crushing and fine sediment production. Crushing and subsequent compaction can cause the aggregate volume to change, resulting in permanent deformation of road surface with ruts, washboards, and potholes; requiring road maintenance. Therefore, having aggregate close to the PSD limit (i.e., the optimum compaction) will reduce road maintenance. Further, particle-size segregation of road aggregate may occur during transport, dumping, and surfacing the subgrade, but additional work is needed to investigate this segregation and to produce aggregate with more desirable PSDs.
Subgrade mixing can also be a dominant process in other geographical locations with different road conditions, aggregate, and subgrade properties (e.g., soft, weak subgrade, and wet road conditions). Understanding the physical processes on different road conditions will help mitigate sediment production from forest roads and reduce road maintenance efforts by providing information for best management practices. For example, strengthening the surface material (e.g., surface stabilization) is recommended if the dominant process is crushing; strengthening the subgrade (e.g., geotextile reinforcement on subgrade) if subgrade mixing is the dominant process; and collecting and recycling large aggregate particles on the shoulder and roadside for road resurfacing if sweeping occurs excessively. Future study is recommended to investigate traffic-induced processes in other locations where subgrade mixing or sweeping is the dominant process, and the effects of road treatments and management practices on the traffic-induced processes, for better road management.
Supplementary Materials
The following are available online at https://www.mdpi.com/1999-4907/9/4/181/s1, Figure S1: The particle-size distributions from different vertical layers and horizontal locations on no traffic use (N): (a) the particle-size distributions from different vertical layers at tire track (T); (b) at in-between (I); (c) at shoulder (S); (d) the particle-size distributions from different horizontal locations at upper (U); (e) at middle (M); and (f) at bottom (B). The particle-size distributions were based on average values of five replications [48], Figure S2: The particle-size distributions from different vertical layers and horizontal locations on light traffic use (L): (a) the particle-size distributions from different vertical layers at tire track (T); (b) at in-between (I); (c) at shoulder (S); (d) the particle-size distributions from different horizontal locations at upper (U); (e) at middle (M); and (f) at bottom (B). The particle-size distributions were based on average values of five replications [48], Figure S3: The particle-size distributions from different vertical layers and horizontal locations on heavy traffic use (H): (a) the particle-size distributions from different vertical layers at tire track (T); (b) at in-between (I); (c) at shoulder (S); (d) the particle-size distributions from different horizontal locations at upper (U); (e) at middle (M); and (f) at bottom (B). The particle-size distributions were based on average values of five replications [48], and Figure S4: The particle-size distributions from different traffic uses (no (N), light (L), and heavy (H)) at the same cross-sectional locations: (a) the particle-size distributions in upper layer at tire track location (U-T); (b) in upper layer at in-between location (U-I); (c) in upper layer at shoulder location (U-S); (d) in middle layer at tire track location (M-T); (e) in middle layer at in-between location (M-I); (f) in middle layer at shoulder location (M-S); (g) in bottom layer at tire track location (B-T); (h) in bottom layer at in-between location (B-I); and (i) in bottom layer at shoulder location (B-S). The particle-size distributions were based on average values of five replications [48].
Acknowledgments
The authors acknowledge many contributions from the following people: Randy Foltz (retired) and Benjamin Kopyscianski at the Rocky Mountain Research Station, USDA Forest Service for their guidance and help in the field and laboratory; David Ratliff, Dave Brady (retired), and Meg Foltz (retired) at the Palouse Ranger District, Clearwater National Forest, USDA Forest Service, and Dan Jones at the Potlatch Corporation for providing the information on White Pine roads and allowing us to access them; Peter Schiess (retired) at the School of Environmental and Forest Sciences, University of Washington, Hans-Erik Andersen at the Pacific Northwest Research Station, USDA Forest Service, and Finn Krogstad for their comments; and Natalie Copeland, Leah Kirkland, and Rebecca Shifler for analyzing the aggregate samples.
Author Contributions
Hakjun Rhee and James Fridley conceived and designed the experiments; Hakjun Rhee performed the experiments; Hakjun Rhee analyzed the data; and Hakjun Rhee and Deborah Page-Dumroese wrote the paper.
Conflicts of Interest
The authors declare no conflict of interest.
References
- Bolander, P.; Marocco, D.; Kennedy, R. Earth and Aggregate Surfacing Design Guide for Low Volume Roads; Engineering Staff EM-7170-16; US Department of Agriculture, Forest Service: Washington, DC, USA, 1996; p. 24. [Google Scholar]
- Turner, S.K.; Hutchinson, K. Forest Service Specifications for Construction of Roads and Bridges; Revised; Engineering Staff EM-7720-100; US Department of Agriculture, Forest Service: Washington, DC, USA, 1996; pp. 495–513. [Google Scholar]
- Thompson, M.; Sessions, J. Optimal policies for aggregate recycling from decommissioned forest roads. Environ. Manag. 2008, 42, 297–309. [Google Scholar] [CrossRef] [PubMed]
- Swift, L.W. Gravel and grass surfacing reduces soil loss from mountain roads. For. Sci. 1984, 30, 657–670. [Google Scholar]
- Kochenderfer, J.N.; Helvey, J.D. Using gravel to reduce soil losses from minimum-standard forest roads. J. Soil Water Conserv. 1987, 42, 46–50. [Google Scholar]
- Bilby, R.E.; Sullivan, K.; Duncan, S.H. The generation and fate of road-surface sediment in forested watershed in southwestern Washington. For. Sci. 1989, 35, 453–468. [Google Scholar]
- Larcombe, G. Forest Roading Manual; Liro Forestry Solutions: Rotorua, New Zealand, 1999; pp. 168–173, 284. [Google Scholar]
- Reid, L.M.; Dunne, T. Sediment production from forest road surfaces. Water Resour. Res. 1984, 20, 1753–1761. [Google Scholar] [CrossRef]
- Luce, C.H.; Black, T.A. Effects of traffic and ditch maintenance on forest road sediment production. In Proceedings of the Seventh Federal Interagency Sedimentation Conference, Reno, NV, USA, 25–29 March 2001; Subcommittee on Sedimentation: Washington, DC, USA, 2001; pp. V67–V74. [Google Scholar]
- Ziegler, A.D.; Sutherland, R.A.; Giambelluca, T.W. Interstorm surface preparation and sediment detachment by vehicle traffic on unpaved mountain roads. Earth Surf. Proc. Landf. 2001, 26, 235–250. [Google Scholar] [CrossRef]
- Sheridan, G.J.; Noske, P.J.; Whipp, R.K.; Wijesinghe, N. The effect of truck traffic and road water content on sediment delivery from unpaved forest roads. Hydrol. Process. 2006, 20, 1683–1699. [Google Scholar] [CrossRef]
- Ramos-Scharrón, C.E.; MacDonald, L.H. Measurement and prediction of sediment production from unpaved roads, St John, US Virgin Islands. Earth Surf. Proc. Landf. 2005, 30, 1283–1304. [Google Scholar] [CrossRef]
- Toman, E.M.; Skaugset, A.E. Reducing sediment production from forest roads during wet-weather hauling. Transp. Res. Rec. 2011, 2203, 13–19. [Google Scholar] [CrossRef]
- Foltz, R.B. Environmental impacts of forest roads: An overview of the state of the knowledge. In Proceedings of the Second International Forest Engineering Conference, Växjö, Sweden, 12–15 May 2003; Wide, M.I., Baryd, B., Eds.; Skogforsk: Uppsala, Sweden, 2003; pp. 121–128. [Google Scholar]
- Foltz, R.B.; Evans, G.L.; Truebe, M. Relationship of forest road aggregate test properties to sediment production. In Proceedings of the Conference on Watershed Management and Operation Management 2000, Fort Collins, CO, USA, 20–24 June 2000; Flug, M., Donald, F., Watkins, D.W., Eds.; American Society of Civil Engineers (ASCE): Reston, VA, USA, 2000. [Google Scholar]
- Gnanendran, C.T.; Beaulieu, C. On the behaviour of low-volume unpaved resource access roads: Effects of rehabilitation. Can. J. Civ. Eng. 1999, 26, 262–269. [Google Scholar] [CrossRef]
- Johnson, G. Minnesota’s experience with thin bituminous treatments for low-volume roads. Transp. Res. Rec. 2003, 1819, 333–337. [Google Scholar] [CrossRef]
- Foltz, R.B.; Truebe, M. Effect of aggregate quality on sediment production from a forest road. In Proceedings of the Sixth International Conference on Low-Volume Roads, Minneapolis, MN, USA, 25–29 June 1995; National Academy Press: Washington, DC, USA, 1995; pp. 49–57. [Google Scholar]
- Foltz, R.B.; Truebe, M. Locally available aggregate and sediment production. Transp. Res. Rec. 2003, 1819, 185–193. [Google Scholar] [CrossRef]
- Foltz, R.B.; Burroughs, E.R. A test of normal tire pressure and reduced tire pressure on forest roads: Sedimentation effects. In Proceedings of the Forestry and Environment Engineering Solutions, New Orleans, LA, USA, 5–6 June 1991; Stokes, B.J., Rawlins, C.L., Eds.; American Society of Agricultural Engineers (ASAE) Publication: St. Joseph, MI, USA, 1991; pp. 103–112. [Google Scholar]
- Foltz, R.B.; Elliot, W.J. Effect of lowered tire pressures on road erosion. Transp. Res. Rec. 1997, 1589, 19–25. [Google Scholar] [CrossRef]
- Parsakhoo, A.; Lotfalian, M.; Kavian, A.; Hosseini, S.A. Assessment of soil erodibility and aggregate stability for different parts of a forest road. J. For. Res. 2014, 25, 193–200. [Google Scholar] [CrossRef]
- Luce, C.H.; Black, T.A. Sediment production from forest roads in western Oregon. Water Resour. Res. 1999, 35, 2561–2570. [Google Scholar] [CrossRef]
- Giuliani, F.; Autelitano, F.; Degiovanni, E.; Montepara, A. DEM modelling analysis of tree root growth in street pavements. Int. J. Pavement Eng. 2017, 18, 1–10. [Google Scholar] [CrossRef]
- Ryżak, M.; Bieganowski, A. Methodological aspects of determining soil particle-size distribution using the laser diffraction method. J. Plant Nutr. Soil Sci. 2011, 174, 624–633. [Google Scholar] [CrossRef]
- McFarlane, H.W.; Paterson, W.J.; Dohaney, W.J. Use of the Benkelman Beam on Forest Roads; Logging Research Reports LRR/49; Pulp and Paper Research Institute of Canada: Point-Claire, QC, Canada, 1973. [Google Scholar]
- Selim, A.A.; Skorseth, O.K.; Muniandy, R. Long-lasting gravel roads: Case study from the United States. Transp. Res. Rec. 2003, 1819, 161–165. [Google Scholar] [CrossRef]
- Zilioniene, D.; Cygas, D.; Juzenas, A.A.; Jurgaitis, A. Improvement of functional designation of low-volume roads by dust abatement in Lithuania. Transp. Res. Rec. 2007, 1989, 293–298. [Google Scholar] [CrossRef]
- Climate Normals. Available online: http://www.ncdc.noaa.gov/data-access/land-based-station-data/land-based-datasets/climate-normals (accessed on 18 February 2018).
- Miller, J.F.; Frederick, R.H.; Tracey, R.J. NOAA Atlas 2: Precipitation-Frequency Atlas of the Western United States. Volume V—Idaho; US Department of Commerce, National Oceanic and Atmospheric Administration (NOAA), National Weather Service: Silver Spring, MD, USA, 1973. Available online: http://www.nws.noaa.gov/oh/hdsc/PF_documents/Atlas2_Volume5.pdf (accessed on 18 February 2018).
- Precipitation Frequency Data Server (PFDS). Available online: http://hdsc.nws.noaa.gov/hdsc/pfds (accessed on 18 February 2018).
- US Geological Survey (USGS). The National Map. Available online: http://nationalmap.gov/index.html (accessed on 19 November 2013).
- Model 3440 Surface Moisture-Density Gauge. Available online: http://www.troxlerlabs.com/products/3440.php (accessed on 4 May 2015).
- American Association of State Highway and Transportation Officials. AASHTO T88-00: Standard Method of Test for Particle Size Analysis of Soils; AASHTO: Washington, DC, USA, 2004. [Google Scholar]
- American Society for Testing and Materials. ASTM D422-63: Standard Test Method for Particle-Size Analysis of Soils; ASTM International: West Conshohocken, PA, USA, 2002. [Google Scholar]
- American Association of State Highway and Transportation Officials. AASHTO T146-96: Standard Method of Test for Wet Preparation of Disturbed Soil Samples for Test; AASHTO: Washington, DC, USA, 2000. [Google Scholar]
- Rhee, H.; Foltz, R.B.; Fridley, J.L.; Krogstad, F.; Page-Dumroese, D.S. An alternative method for determining particle-size distribution of forest road aggregate and soil with large-sized particles. Can. J. For. Res. 2014, 44, 101–105. [Google Scholar] [CrossRef]
- American Society for Testing and Materials. ASTM D2217-85: Standard Practice for Wet Preparation of Soil Samples for Particle-Size Analysis and Determination of Soil Constants; ASTM International: West Conshohocken, PA, USA, 1998. [Google Scholar]
- Hardin, B.O. Crushing of soil particles. J. Geotech. Eng. 1985, 111, 1177–1192. [Google Scholar] [CrossRef]
- Lade, P.V.; Yamamuro, J.A.; Bopp, P.A. Significance of particle crushing in granular materials. J. Geotech. Eng. 1996, 122, 309–316. [Google Scholar] [CrossRef]
- Zar, J.H. Biostatistical Analysis, 3rd ed.; Prentice Hall: Upper Saddle River, NJ, USA, 1996; pp. 179–217. ISBN 0130845426. [Google Scholar]
- Söhne, W. Fundamentals of pressure distribution and soil compaction under tractor tires. Agric. Eng. 1958, 39, 276–281, 290. [Google Scholar]
- Wong, J.Y. Theory of Ground Vehicles, 3rd ed.; John Wiley & Sons: New York, NY, USA, 2001; pp. 92–100. ISBN 0471354619. [Google Scholar]
- Ritter, M.A. Timber Bridges: Design, Construction, Inspection, and Maintenance; Engineering Staff EM 7700-8; US Department of Agriculture, Forest Service: Washington, DC, USA, 1992; pp. 6-3–6-9. [Google Scholar]
- Federal Highway Administration. Federal Size Regulations for Commercial Motor Vehicles; US Department of Transportation, Federal Highway Administration (FHWA), Office of Freight Management and Operations: Washington, DC, USA, 2004. Available online: http://ops.fhwa.dot.gov/freight/publications/size_regs_final_rpt/ (accessed on 18 February 2018).
- Mills, K.; Pyles, M.; Thoreson, R. Aggregate surfacing design and management for low-volume roads in temperature, mountainous areas. Transp. Res. Rec. 2007, 1989, 154–160. [Google Scholar] [CrossRef]
- Hoek, E.; Bray, J.W. Rock Slope Engineering, 3rd ed.; Elsevier Science: London, UK, 1981; p. 99. ISBN 0900488573. [Google Scholar]
- Rhee, H. Inferring Traffic induced Sediment Production Processes from Forest Road Particle Size Distributions. Ph.D. Thesis, University of Washington, Seattle, WA, USA, 6 July 2006. [Google Scholar]
- Anochie-Boateng, J.K.; Komba, J.J.; Mvelase, G.M. Three-dimensional laser scanning technique to quantify aggregate and ballast shape properties. Constr. Build. Mater. 2013, 43, 389–398. [Google Scholar] [CrossRef]
- Farmani, M.B.; Memarian, H.; Hansson, J.; Dusseault, M.B. Contact forces in non-bonded pavement materials. Road Mater. Pavement Des. 2007, 8, 483–503. [Google Scholar] [CrossRef]
- Mittemeijer, E.J. Fundamentals of Materials Science: The Microstructure—Property Relationship Using Metals as Model. Systems; Springer: Berlin, Germany, 2010; pp. 567–573. ISBN 9783642104992. [Google Scholar]
- Selby, M.J. Hillslope Materials and Processes, 2nd ed.; Oxford University Press: Oxford, UK, 1993; pp. 144–145. ISBN 0198741839. [Google Scholar]
- Erarslan, N.; Williams, D.J. Mechanism of rock fatigue damage in terms of fracturing modes. Int. J. Fatigue 2012, 43, 76–89. [Google Scholar] [CrossRef]
- American Association of State Highway and Transportation Officials. AASHTO T96: Standard Method of Test for Resistance to Degradation of Small-Size Coarse Aggregate by Abrasion and Impact in the Los Angeles Machine; AASHTO: Washington, DC, USA, 2002. [Google Scholar]
- Bolander, P.; Yamada, A. Dust Palliative Selection and Application Guide; US Department of Agriculture, Forest Service, Technology and Development Program: San Dimas, CA, USA, 1999. [Google Scholar]
- Monlux, S. Stabilizing unpaved roads with calcium chloride. Transp. Res. Rec. 2003, 1819, 52–56. [Google Scholar] [CrossRef]
- Monlux, S.; Mitchell, M. Chloride stabilization of unpaved road aggregate surfacing. Transp. Res. Rec. 2007, 1989, 50–58. [Google Scholar] [CrossRef]
- Weibull, W. A statistical theory of the strength of materials. Proc. R. Swed. Inst. Eng. Res. 1939, 151, 1–45. [Google Scholar]
- Lundborg, N. The strength-size relation of granite. Int. J. Rock Mech. Min. Sci. 1967, 4, 269–272. [Google Scholar] [CrossRef]
- Tang, C.A.; Tham, L.G.; Lee, P.K.K.; Tsui, Y.; Liu, H. Numerical studies of the influence of microstructure on rock failure in uniaxial compression—Part II: Constraint, slenderness and size effect. Int. J. Rock Mech. Min. Sci. 2000, 37, 571–583. [Google Scholar] [CrossRef]
- Fuller, W.B.; Thompson, S.E. The laws of proportioning concrete. Trans. Am. Soc. Civ. Eng. 1907, 59, 67–143. [Google Scholar]
- Bardet, J.P. Experimental Soil Mechanics; Prentice Hall: Upper Saddle River, NJ, USA, 1997; pp. 12–13. ISBN 0133749355. [Google Scholar]
- Chen, D.H.; Scullion, T.; Lee, T.C.; Bilyeu, J. Results from a forensic investigation of a failed cement treated base. J. Perform. Constr. Fac. 2008, 22, 143–153. [Google Scholar] [CrossRef]
- Rosato, A.; Strandburg, K.J.; Prinz, F.; Swendsen, R.H. Why the Brazil nuts are on top: Size segregation of particulate matter by shaking. Phys. Rev. Lett. 1987, 58, 1038–1040. [Google Scholar] [CrossRef] [PubMed]
- Thomson, F.M. Storage and flow of particulate solids. In Handbook of Powder Science and Technology, 2nd ed.; Muhammad, E.F., Otten, L., Eds.; Chapman & Hall: New York, NY, USA, 1997; pp. 389–486. ISBN 0412996219. [Google Scholar]
- Breu, A.P.J.; Ensner, H.M.; Kruelle, C.A.; Rehberg, I. Reversing the Brazil-nut effect: Competition between percolation and condensation. Phys. Rev. Lett. 2003, 90, 014302. [Google Scholar] [CrossRef] [PubMed]
- Gerber, E.; Scheidegger, A.E. On the dynamics of scree slopes. Rock Mech. 1974, 6, 25–38. [Google Scholar] [CrossRef]
- Williams, J.C. The segregation of particulate materials: A review. Powder Technol. 1976, 15, 245–251. [Google Scholar] [CrossRef]
- Kolka, R.K.; Smidt, M.F. Effects of forest road amelioration techniques on soil bulk density, surface runoff, sediment transport, soil moisture and seedling growth. For. Ecol. Manag. 2004, 202, 313–323. [Google Scholar] [CrossRef]
- Foltz, R.B.; Rhee, H.; Yanosek, K.A. Infiltration, erosion, and vegetation recovery following road obliteration. Trans. ASABE 2007, 50, 1937–1943. [Google Scholar] [CrossRef]
Figure 1.
Sorted surfacing material on forest road. Left is the tire track with a coin with a diameter of 24 mm on it, and right is the shoulder.
Figure 1.
Sorted surfacing material on forest road. Left is the tire track with a coin with a diameter of 24 mm on it, and right is the shoulder.

Figure 2.
Location of the study plots on the White Pine roads in the Clearwater National Forest, Idaho. The map was modified from the 1:24,000 US topographic map (West Dennis, Idaho; 7.5-min quadrangle map) with orthoimage [32]. N, L, and H indicate the plot locations on no, light, and heavy traffic use roads. The N was used for log-hauls after collecting the samples, and the H, before collecting the samples in this image. White lines without a border indicate a forest road network; the white line with borders at the right side indicates the Idaho state highway 6; and blue lines indicate streams.

Figure 3.
Sampling locations within a forest road cross section. The abbreviations indicate vertical layer and horizontal location of samples. U: upper; M: middle; B: bottom; T: tire track; S: shoulder; I: in-between.
Figure 3.
Sampling locations within a forest road cross section. The abbreviations indicate vertical layer and horizontal location of samples. U: upper; M: middle; B: bottom; T: tire track; S: shoulder; I: in-between.

Figure 4.
Hardin’s Breakage Potential (Bp): (a) particle-size distribution with Bp of 186.77; and (b) particle-size distribution with Bp of 140.77. The unit of Bp is %·log (mm). Higher Bp value represents a particle-size distribution with coarser particles.
Figure 4.
Hardin’s Breakage Potential (Bp): (a) particle-size distribution with Bp of 186.77; and (b) particle-size distribution with Bp of 140.77. The unit of Bp is %·log (mm). Higher Bp value represents a particle-size distribution with coarser particles.

Figure 5.
The particle-size distributions (PSDs) of the forest road aggregates and subgrade from the White Pine roads in the Clearwater National Forest and the quarry (Q) in Idaho. The abbreviations indicate different vertical layers (upper (U), middle (M), and bottom (B)), horizontal locations (tire track (T), in-between (I), and shoulder (S)), and traffic uses (no (N), light (L), and heavy (H)). The particle-size distributions changed by crushing did not get finer than a certain limit, close to the particle-size distribution curves at U-I-H or B-I-H, except the particle-size distribution at B-S-H where subgrade mixing likely occurred in addition to crushing. The road aggregate PSDs were based on average values of 5 replications [48]; the quarry, 12 replications; and the subgrade, 4 replications at B-S-H.


Table 1.
Comparison of dry densities 1 (Mg m−3) of forest road aggregate from different horizontal locations and traffic uses.
Table 1.
Comparison of dry densities 1 (Mg m−3) of forest road aggregate from different horizontal locations and traffic uses.
| Traffic Use | Horizontal Location | |||
|---|---|---|---|---|
| Center | Tire Track | In-Between | Shoulder | |
| No | A 1.606 b | A 1.727 b | A 1.671 c | A 1.542 b |
| (0.095) | (0.077) | (0.055) | (0.121) | |
| Light | A 1.921 a | A 2.053 a | A 2.051 a | N/A 2 |
| (0.045) | (0.176) | (0.026) | ||
| Heavy | A 1.893 a | A 1.987 a, b | A, B 1.885 b | B 1.777 a |
| (0.009) | (0.035) | (0.073) | (0.034) | |
1 Dry densities were measured using the Troxler Model 3440 nuclear soil moisture density gauge [33] in the same year when the aggregate samples were collected. The values are mean dry density with standard deviation in parentheses. Mean values in a row preceded by the same superscript capital letter (A or B) are not significantly different between the different horizontal locations on the same traffic use (p < 0.05). Mean values in a column followed by the same lowercase letter (a, b, or c) are not significantly different between the different traffic uses at the same horizontal location (p < 0.05). 2 No dry density was measured at this site using the Troxler Model 3440 nuclear soil moisture density gauge, due to roadside vegetation.
Table 2.
No traffic road particle-size distributions from the vertical and horizontal locations using the breakage potential (Bp) method. The values are average Bp with standard deviation in parentheses. The unit of Bp is % log (mm).
Table 2.
No traffic road particle-size distributions from the vertical and horizontal locations using the breakage potential (Bp) method. The values are average Bp with standard deviation in parentheses. The unit of Bp is % log (mm).
| Vertical Layer | Horizontal Location | Inferred Process | ||||
|---|---|---|---|---|---|---|
| Tire Track | In-Between | Shoulder | ||||
| Upper | 177.84 (4.62) | = | 174.42 (9.75) | = | 186.61 (10.07) | N/A 1 |
 | | | ||||
| Middle | 174.32 (6.26) | = | 171.74 (9.50) | = | 176.20 (3.34) | N/A |
| | | ||||
| Bottom | 170.35 (7.33) | = | 164.74 (6.69) | = | 175.91 (9.54) | N/A |
| Inferred process | N/A | N/A | N/A | |||
1 No inferred process is available. “=” symbol between means indicates equality of values.
Table 3.
Light traffic road particle-size distributions from the vertical and horizontal locations using the breakage potential (Bp) method. The values are average Bp with standard deviation in parentheses. The unit of Bp is %·log (mm).
Table 3.
Light traffic road particle-size distributions from the vertical and horizontal locations using the breakage potential (Bp) method. The values are average Bp with standard deviation in parentheses. The unit of Bp is %·log (mm).
| Vertical Layer | Horizontal Location | Inferred Process | ||||
|---|---|---|---|---|---|---|
| Tire Track | In-Between | Shoulder | ||||
| Upper | 153.33 (3.17) | = | 155.28 (7.65) | < | 186.77 (0.92) | Crushing/sweeping |
 | |  | ||||
| Middle | 167.74 (7.26) | = | 168.85 (7.73) | = | 178.18 (4.66) | N/A 1 |
| | | ||||
| Bottom | 176.65 (1.99) | = | 174.27 (5.80) | = | 173.32 (3.95) | N/A |
| Inferred process | Crushing | Crushing | Sweeping | |||
1 No inferred process is available. “=/</>” symbols between means indicate respective significance.
Table 4.
Heavy traffic road particle-size distributions from the vertical and horizontal locations using the breakage potential (Bp) method. The values are average Bp with standard deviation in parentheses. The unit of Bp is %·log (mm).
Table 4.
Heavy traffic road particle-size distributions from the vertical and horizontal locations using the breakage potential (Bp) method. The values are average Bp with standard deviation in parentheses. The unit of Bp is %·log (mm).
| Vertical Layer | Horizontal Location | Inferred Process | ||||
|---|---|---|---|---|---|---|
| Tire Track | In-Between | Shoulder | ||||
| Upper | 154.84 (4.90) | = | 153.31 (3.45) | = | 156.44 (4.47) | N/A 1 |
| | | ||||
| Middle | 163.47 (8.68) | = | 156.37 (6.66) | = | 157.89 (4.14) | N/A |
| | | ||||
| Bottom | 154.97 (2.51) | = | 151.31 (7.97) | > | 140.77 (5.60) | Subgrade mixing |
| Inferred process | N/A | N/A | Subgrade mixing | |||
1 No inferred process is available. “=/</>” symbols between means indicate respective significance.
Table 5.
Particle-size distributions from different traffic uses at the same cross-sectional locations using the breakage potential (Bp) method. The values are average Bp with standard deviation in parentheses. The unit of Bp is %·log (mm).
Table 5.
Particle-size distributions from different traffic uses at the same cross-sectional locations using the breakage potential (Bp) method. The values are average Bp with standard deviation in parentheses. The unit of Bp is %·log (mm).
| Vertical Layer | Traffic Use | Inferred Process | ||||||
|---|---|---|---|---|---|---|---|---|
| Quarry | No | Light | Heavy | |||||
| Horizontal location: Tire track | ||||||||
| Upper | 171.01 (4.88) | < | 177.84 (4.62) | > | 153.33 (3.17) | = | 154.84 (4.90) | Crushing |
| | | | |||||
| Middle | 171.01 (4.88) | = | 174.32 (6.26) | = | 167.74 (7.26) | = | 163.47 (8.68) | N/A 1 |
| | | | |||||
| Bottom | 171.01 (4.88) | = | 170.35 (7.33) | = | 176.65 (1.99) | > | 154.97 (2.51) | Crushing |
| Horizontal location: In-between | ||||||||
| Upper | 171.01 (4.88) | = | 174.42 (9.75) | > | 155.28 (7.65) | = | 153.31 (3.45) | Crushing |
| | | | |||||
| Middle | 171.01 (4.88) | = | 171.74 (9.50) | = | 168.85 (7.73) | = | 156.37 (6.66) | Crushing 2 |
| | | | |||||
| Bottom | 171.01 (4.88) | > | 164.74 (6.69) | = | 174.27 (5.80) | > | 151.31 (7.97) | Crushing |
| Horizontal location: Shoulder | ||||||||
| Upper | 171.01 (4.88) | < | 186.61 (10.07) | = | 186.77 (0.92) | > | 156.44 (4.47) | Crushing |
| | | | |||||
| Middle | 171.01 (4.88) | < | 176.20 (3.34) | = | 178.18 (4.66) | > | 157.89 (4.14) | Crushing |
| | | | |||||
| Bottom | 171.01 (4.88) | = | 175. 91 (9.54) | = | 173.32 (3.95) | > | 140.77 (5.60) | Subgrade mixing |
1 No inferred process is available. 2 Bp of the no traffic use is statistically greater than the high traffic use. “=/</>” symbols between means indicate respective significance.
© 2018 by the authors. Licensee MDPI, Basel, Switzerland. This article is an open access article distributed under the terms and conditions of the Creative Commons Attribution (CC BY) license (http://creativecommons.org/licenses/by/4.0/).
Share and Cite
MDPI and ACS Style
Rhee, H.; Fridley, J.; Page-Dumroese, D. Traffic-Induced Changes and Processes in Forest Road Aggregate Particle-Size Distributions. Forests 2018, 9, 181. https://doi.org/10.3390/f9040181
AMA Style
Rhee H, Fridley J, Page-Dumroese D. Traffic-Induced Changes and Processes in Forest Road Aggregate Particle-Size Distributions. Forests. 2018; 9(4):181. https://doi.org/10.3390/f9040181
Chicago/Turabian StyleRhee, Hakjun, James Fridley, and Deborah Page-Dumroese. 2018. "Traffic-Induced Changes and Processes in Forest Road Aggregate Particle-Size Distributions" Forests 9, no. 4: 181. https://doi.org/10.3390/f9040181
Note that from the first issue of 2016, this journal uses article numbers instead of page numbers. See further details here.