Tamarix microRNA Profiling Reveals New Insight into Salt Tolerance


Co-Innovation Center for Sustainable Forestry in Southern China, Nanjing Forestry University, Nanjing 210037, China
*
Author to whom correspondence should be addressed.
Forests 2018, 9(4), 180; https://doi.org/10.3390/f9040180
Submission received: 27 February 2018
/
Revised: 26 March 2018
/
Accepted: 27 March 2018
/
Published: 3 April 2018
(This article belongs to the Special Issue Genetics and Genomics of Forest Trees)
Abstract
:The halophyte tamarisk (Tamarix) is extremely salt tolerant, making it an ideal material for salt tolerance-related studies. Although many salt-responsive genes of Tamarix were identified in previous studies, there are no reports on the role of post-transcriptional regulation in its salt tolerance. We constructed six small RNA libraries of Tamarix chinensis roots with NaCl treatments. High-throughput sequencing of the six libraries was performed and microRNA expression profiles were constructed. We investigated salt-responsive microRNAs to uncover the microRNA-mediated genes regulation. From these analyses, 251 conserved and 18 novel microRNA were identified from all small RNAs. From 191 differentially expressed microRNAs, 74 co-expressed microRNAs were identified as salt-responsive candidate microRNAs. The most enriched GO (gene ontology) terms for the 157 genes targeted by differentially expressed microRNAs suggested that transcriptions factors were highly active. Two hub microRNAs (miR414, miR5658), which connected by several target genes into an organic microRNA regulatory network, appeared to be the key regulators of post-transcriptional salt-stress responses. As the first survey on the tamarisk small RNAome, this study improves the understanding of tamarisk salt-tolerance mechanisms and will contribute to the molecular-assisted resistance breeding.
1. Introduction
MicroRNAs (miRNAs or miRs) are endogenous small (~22 nt) noncoding RNAs that play important roles in plant development and morphogenesis through post-transcriptional regulation. For plant miRNAs, mRNA degradation is the major regulatory approach compared with translational inhibition because the complementation of miRNAs and target genes in plants is much greater than in animals [1,2,3]. Over the past decade, many plant miRNAs have been identified as stress-responsive or developmental regulatory molecules, and some have been functionally confirmed in genetic complementation experiments [4,5,6]. Dozens of miRNAs like miR167, miR169, miR319 and miR393, which are regulators of plant growth or development, have important effects in abiotic stress responses [7,8]. Many previous studies have suggested that miRNAs play important roles in abiotic stress and their potential functions in the regulation of stress responses are indicated by the increasing number of miRNAs expression profile studies [9,10,11].
Salinity is a major abiotic stress that impedes crop breeding. Hundreds of salt-tolerant genes and transcription factors (TFs), such as v-myb avian myeloblastosis viral oncogene homolog (MYB), WRKY and nuclear factor-Y (NF-Y) have been identified [12,13]. Recently, several new genes had been verified for increasing tolerance of transformed plants by T-DNA tagging overexpression, e.g., Oryza sativa salt tolerance activation 2-dominant [14], Oryza sativa intermediate filament like protein [15,16,17]. Some verified microRNA-target interactions have provided insights into miRNAs regulatory mechanisms of salt-stress responses. For example, the subtle regulation of the genes targeted by the miR398 family, Cu/Zn superoxide dismutases and downstream genes, have been investigated in many plant abiotic stress studies [18,19]. Recent studies revealed nearly forty conserved miRNAs responding to salt stress in different plants [20,21]. The salt-responsive miRNAs could dominate the plant growth attenuation and organ morphogenesis under salt stress. All these findings imply the miRNAs are potential key regulatory factors of the complex salt-tolerance traits.
The halophyte tamarisk (Tamarix) distributes naturally in the salinity-rich areas, such as seashore beaches, saline-alkali deserts, and delta-estuaries. As one of the most salt-tolerant trees, it is an important plant material for high salt-tolerance studies. Many Tamarix salt-responsive genes, such as aquaporin, peroxidase (POD), basic leucine zipper (bZIP), and NAC-domain transcription factor (NAC), have been identified by transgenic plant studies or microarray studies [22,23,24]. Although the studies of individual genes or several members of a gene family have gradually clarified the salt-tolerance mechanisms, they may be inefficient and time-consuming for uncovering the complex gene regulatory network responsible for salt stress responses, especially for deciphering the signaling crosstalk of secondary stress induced by high salinity. Several gene expression profile studies of Tamarix using transcriptome sequencing (RNA-seq) or microarrays have identified thousands of differentially expressed genes (DEGs) as salt-tolerant candidate genes [22,25,26]. Based on the previous studies, a genome-wide survey of miRNAs could outline the upstream regulators of salt-tolerant genes and illustrate an overview of post-transcriptional regulation under salt stress. Some miRNA high-throughput sequencing studies of halophytes predicted a number of microRNAs and target genes (miRNA-target pairs), which improved our understanding of gene regulatory networks on salt stress responses [27,28]. These studies could be basic references for experimental design of other halophytes’ miRNA profile studies.
As the first research on the sRNAome survey of Tamarix chinensis (T. chinensis), this study aimed to build miRNA profiles (salt treatment for 0.5 h, 1 h and control group) to identify salt-responsive candidate microRNAs. We investigated differentially expressed miRNAs and their important target genes by comprehensive analysis. The results indicated that two microRNAs and four target genes could be important factors of the post-transcriptional regulatory network responsible for high salt tolerance.
2. Materials and Methods
2.1. Plant Materials and Experimental Design
The 5-year-old T. chinensis trees selected as the ortet were planted in a nursery of Danyang (Zhenjiang, Jiangsu, China). The annual semi-lignified shoots of the T. chinensis ortet were collected as cutting material. Identical cuttings (7 cm in length and 1 cm in diameter) were cultured in sand substrate under the conditions of light 16 h, dark 8 h and temperature of 25 °C. The roots of one-month-old ramets were immersed in NaCl solution of three gradient concentrations (0.8%, 1.4%, 2% M/V) to estimate critical concentration of salt-resistance limit. The control group was immersed in water to estimate water stress effect. According to plant growing situation observations, we decided on 2% NaCl solution for the salt-stress treatment. Five time intervals (0.5 h, 1 h, 2 h, 4 h and 8 h) and a control group were set up for one-month-old (Group I) and two-month-old (Group II) ramets to decide on salt-responsive time points. After that, the roots were fully harvested and stored at −80 °C for POD enzymatic activity assay and RNA extraction for high-throughput sequencing.
2.2. Peroxidase (POD) Enzyme Activity
In preparation for POD activity assay, 100 mg roots were weighed for each sample of the different treatments (salt treatment for 0.5 h, 1 h, 2 h, 4 h and 8 h × Group I, II and two control groups). Plant POD Assay kits (A084-3, Jiancheng, Nanjing, China) were applied for POD activity assay according to the manufacturer’s instructions based on absorbency of the maximum absorption wave length (420 nm).
2.3. Small RNA Deep Sequencing
Six samples (two time points and one control group of Group I, II) were selected for RNA libraries construction, as shown in Table 1. Total RNA was isolated according to slightly improved CTAB-LiCl protocol [29]. RNA co ncentration was measured in a Qubit 2.0 Fluorometer (Life Technologies, Carlsbad, CA, USA) using the Qubit® RNA Assay Kit (Life Technologies, Carlsbad, CA, USA). RNA integrity was assessed according to RNA Integrity Number (RIN) of the Agilent Bioanalyzer 2100 system (Agilent Technologies, Santa Clara, CA, USA). Small RNA libraries were constructed with 3 μg total RNA of six samples. Before reverse transcriptase PCR, NEB 3′ and 5′ SR Adaptors from NEBNext® Multiplex Small RNA Library Prep Set (NEB, Ipswich, MA, USA) were specifically ligated to tags of six libraries After PCR amplification, DNA fragments corresponding to 140~160 bp (the length of cDNA of small noncoding RNA plus the 3′ and 5′ adaptors) were screened out as target fragments. Library quality was assessed on the Agilent Bioanalyzer 2100 System to ensure correct length of insert fragments. After cluster generation using TruSeq SR Cluster Kit v3-cBot-HS on the cBot Cluster Generation System (Illumina, San Diego, CA, USA), library preparations were sequenced on the Illumina Hiseq 2500 platform (Illumina, San Diego, CA, USA) and 50 bp single-end reads were generated. The libraries construction and high-throughput sequencing were performed at the Beijing Novo Gene Genomics Institute, China. The raw data have been uploaded to the Sequence Read Archive of National Center for Biotechnology Information (NCBI) and await Sequence Read Archive (SRA) data accession numbering.
2.4. Conserved and Novel MicroRNAs Identification
Clean reads were obtained by removing reads (1) containing poly-N; (2) with 5′ adapter contaminants; (3) without 3′ adapter or the insert tag; (4) containing poly-A or T or G or C; and (5) of low quality from raw data. Then, clean reads in the range of 18–30 nt were screened out as the sRNA tags. The sRNA tags were mapped to reference transcriptome [30] by Bowtie [31] without mismatch. Mapped sRNA tags were used to identify known miRNA, and miRBase 20.0 [32] was used as reference. Modified software miRdeep2 [33] and srna-tools-cli [34] were used to obtain the conserved miRNA and draw the precursors’ secondary structures. The precursors less than three reads were rejected for the correctness of miRNA identification.
sRNA tags were mapped to RepeatMasker [35] and Rfam [36] database to eliminate irrelevant tags. The protein-coding genes (tags), repeat sequences, rRNA, tRNA, snRNA, and snoRNA were identified and erased from source reads. Then transcripts which were mapped by these novel microRNA candidate tags were collected from the reference transcriptome. According to the hairpin structure of precursor, novel miRNAs were identified by the combined prediction analysis of the softwares miREvo [37] and miRdeep2.
2.5. Differentially Expressed MicroRNA Identification
The miRNA expression levels were estimated by transcripts per million (TPM). Differential expression analysis was performed using the DEGseq R package [38]. p-Value was adjusted using q-value [39]. “q-value < 0.01” and “|log2(fold change)| > 1” were set as the threshold of significant differentially expressed miRNA identification.
2.6. Target Genes Prediction
Coding Sequence (CDS) of all Unigenes of transcriptome [30] were predicted according to the BLAST hits in NR (NCBI non-redundant database) and Unigenes with no hits were performed on ESTscan 3.0 [40]. Unigenes containing “minus” open reading fragment (ORF) were converted to reverse complementary sequence. A total of 59,331 Unigenes was used as target genes source. The miRNA target genes prediction was performed by psRobot [41] and psRNATarget [42]. Finally, target genes predicted by the two tools were intersected to reject ambiguous results.
2.7. MicroRNA Expression Validation by qRT-PCR
For the study, 100 ng total RNA was reverse-transcribed using miRNA specific stem-loop primers (Table S1) with PrimeScript™ RT Master Mix Kit (Takara, Dalian, China). The qRT-PCR using gene-specific primers and universal primer (Table S1) were performed on Viia 7 Real-Time PCR System (ABI, Carlsbad, CA, USA). The reaction component and program were set according to PowerUp™ SYBR™ Green Master Mix (ABI, Carlsbad, CA, USA) manufacturer recommendations with three technical replications. Reference gene TIFY (unpublished) was used as control for normalization of 2−∆∆Ct methods to calculate relative expression of miRNAs. Student’s t-test of correlation analysis of high-throughput sequencing and qRT-PCR was performed using the basic R package.
3. Results
3.1. Selection of NaCl Treatment Method
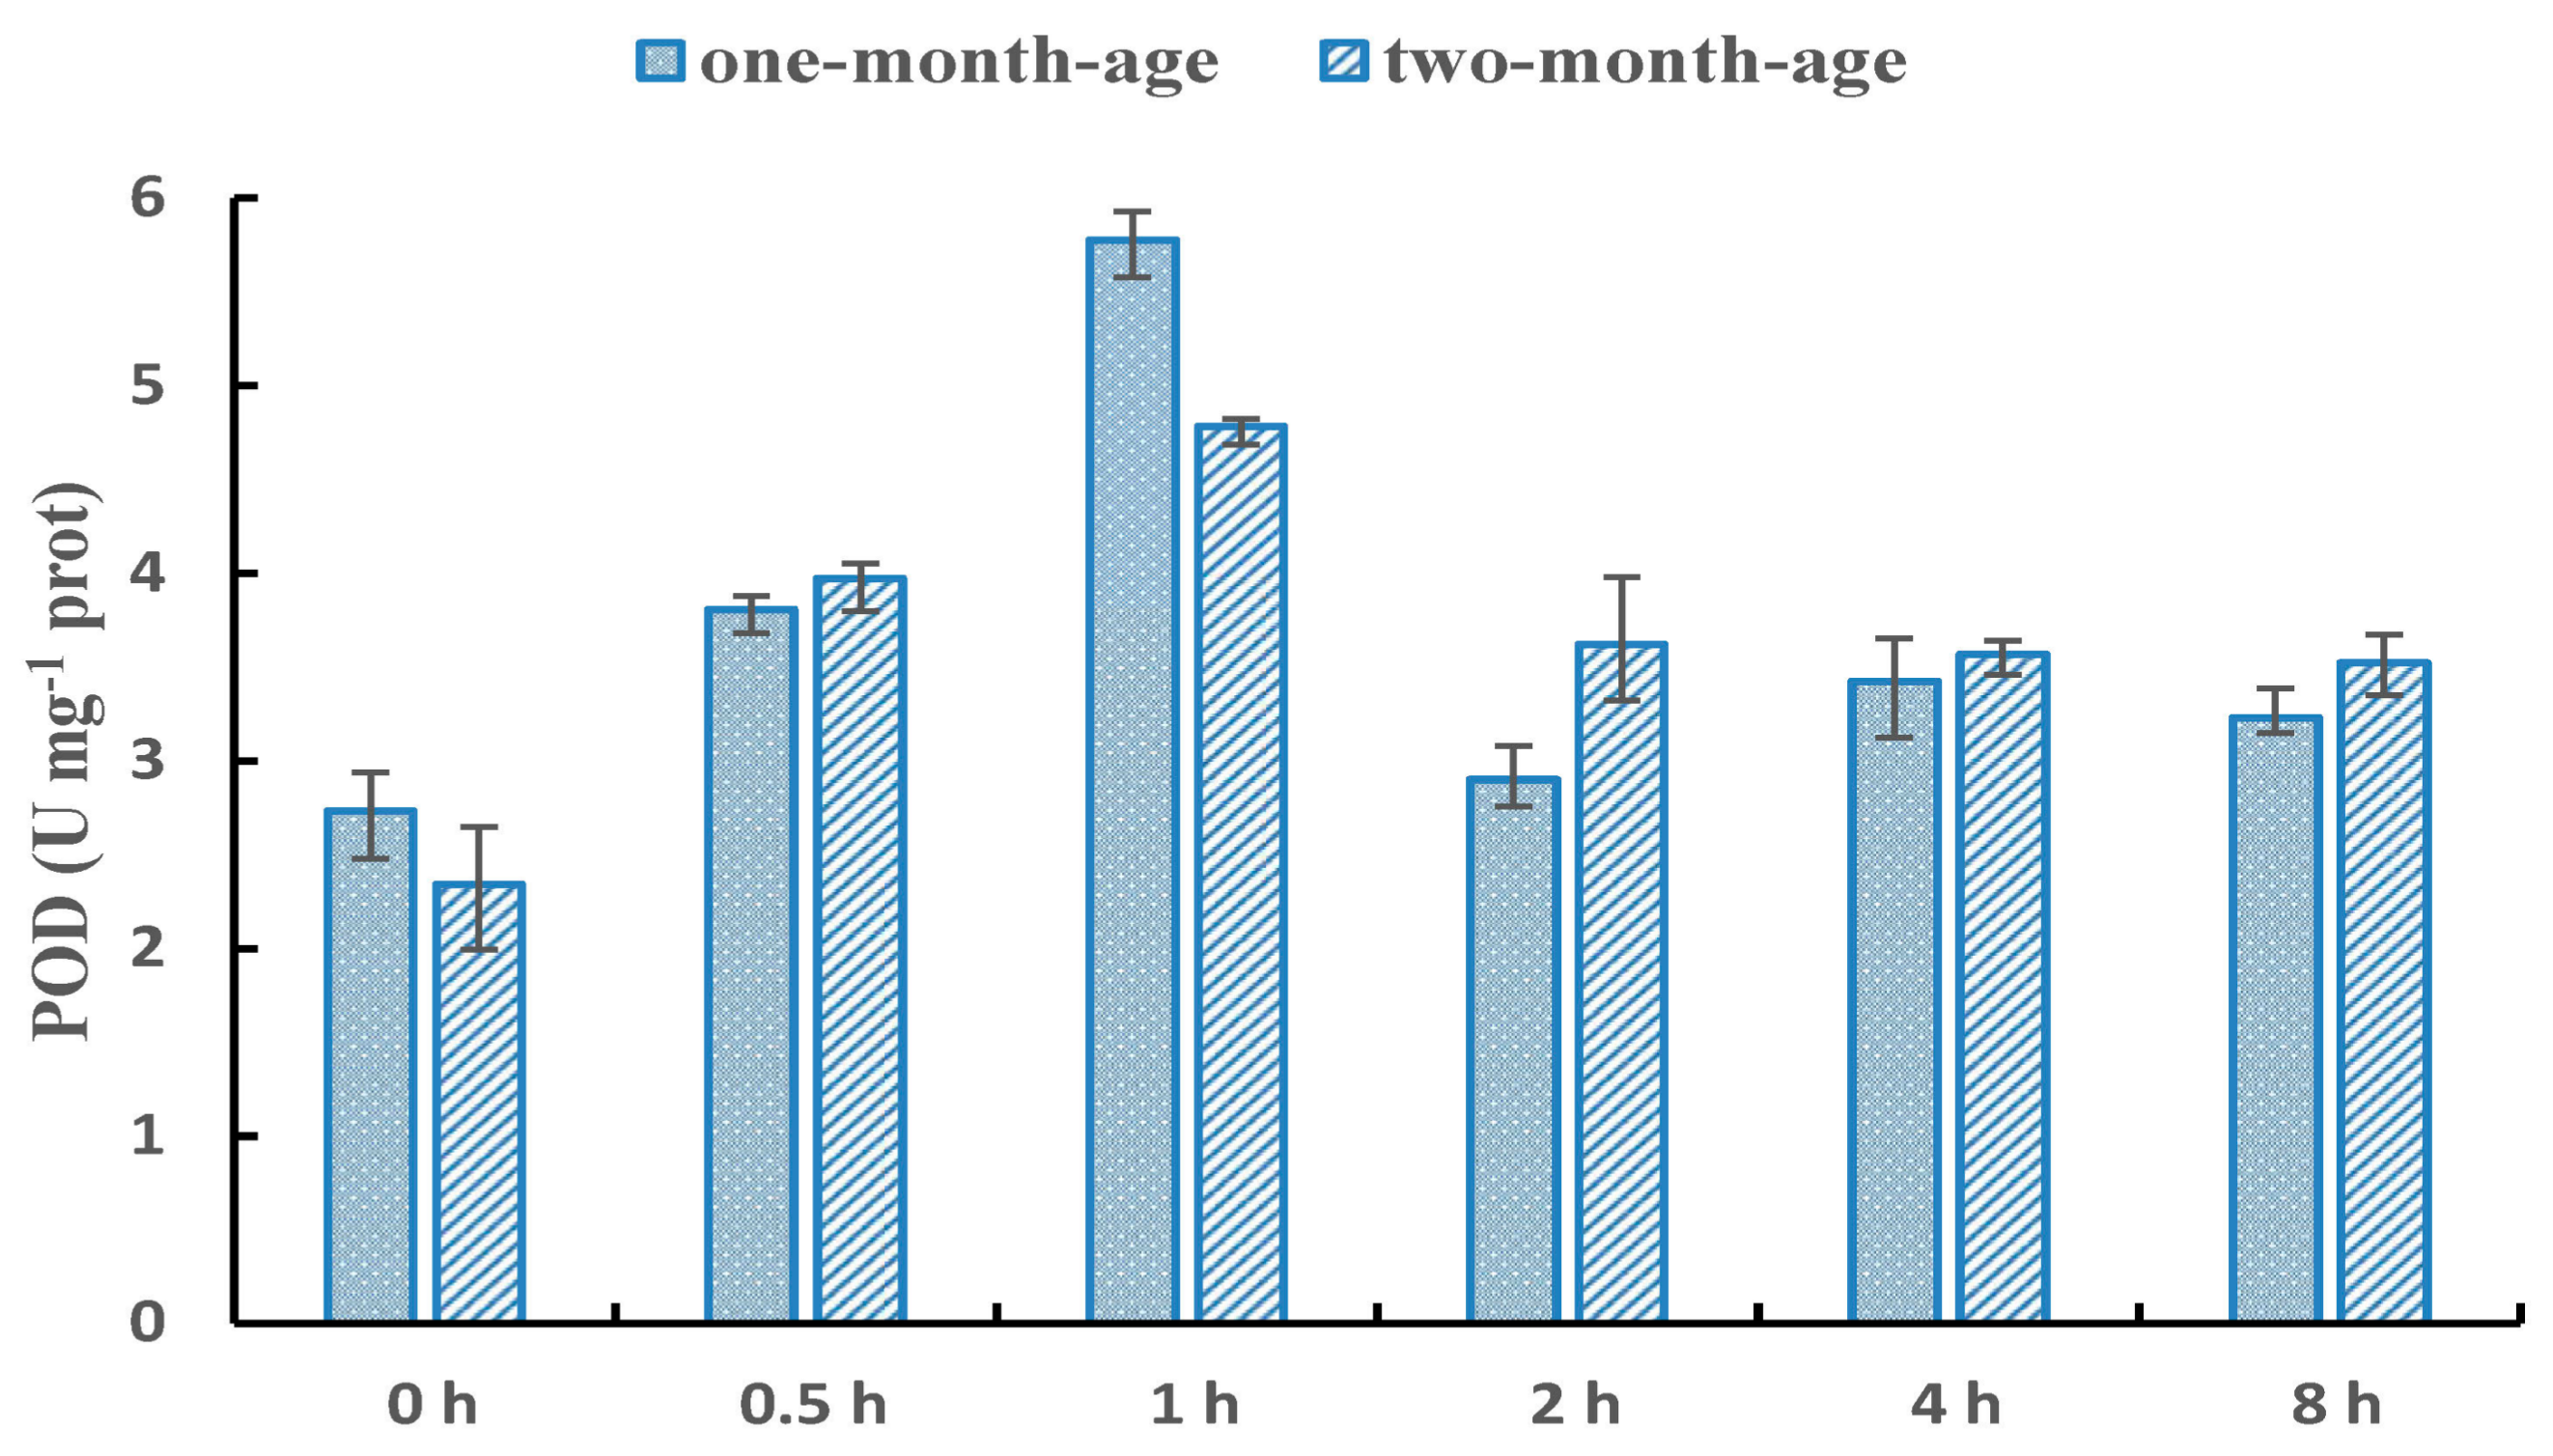
The extent and timing of NaCl stress in this study were determined by culturing rooted cuttings. The cuttings were considered more sensitive to salt than tamarisk tree used in our previous transcriptome study [30]. Unexpectedly, based on naked-eye observation of the shoots, cuttings under 0% (M/V), 0.8% (136 mM), 1.4% (239 mM), and 2% (342 mM) continuous NaCl stress did not show any abnormal morphological characteristics over a 7-d period. Until the eighth day, some twigs of cuttings treated by 2% NaCl became mildly dehydrated (turned yellow). Taking into account our observation and previous study of tamarisk salt-tolerance limit [25], we selected 2% NaCl as the salt concentration for our experiment. POD enzyme activity demonstrates the stress response intensity [43]. Here, the POD enzyme activity increased after 0.5 h of treatment, and reached the peak at 1 h. Then, it decreased to a stable level during 2–8 h (Figure 1). The response pattern of one-month-old cuttings (Group I) was similar to two-month-old cuttings (Group II). Thus, the appropriate salt treatment times were 0.5 h and 1 h. Therefore, roots of Group I and II with 2% NaCl treatment for 0.5 h and 1 h were used for the following libraries construction (Table 1).
3.2. Small RNAs Generated from Deep Sequencing
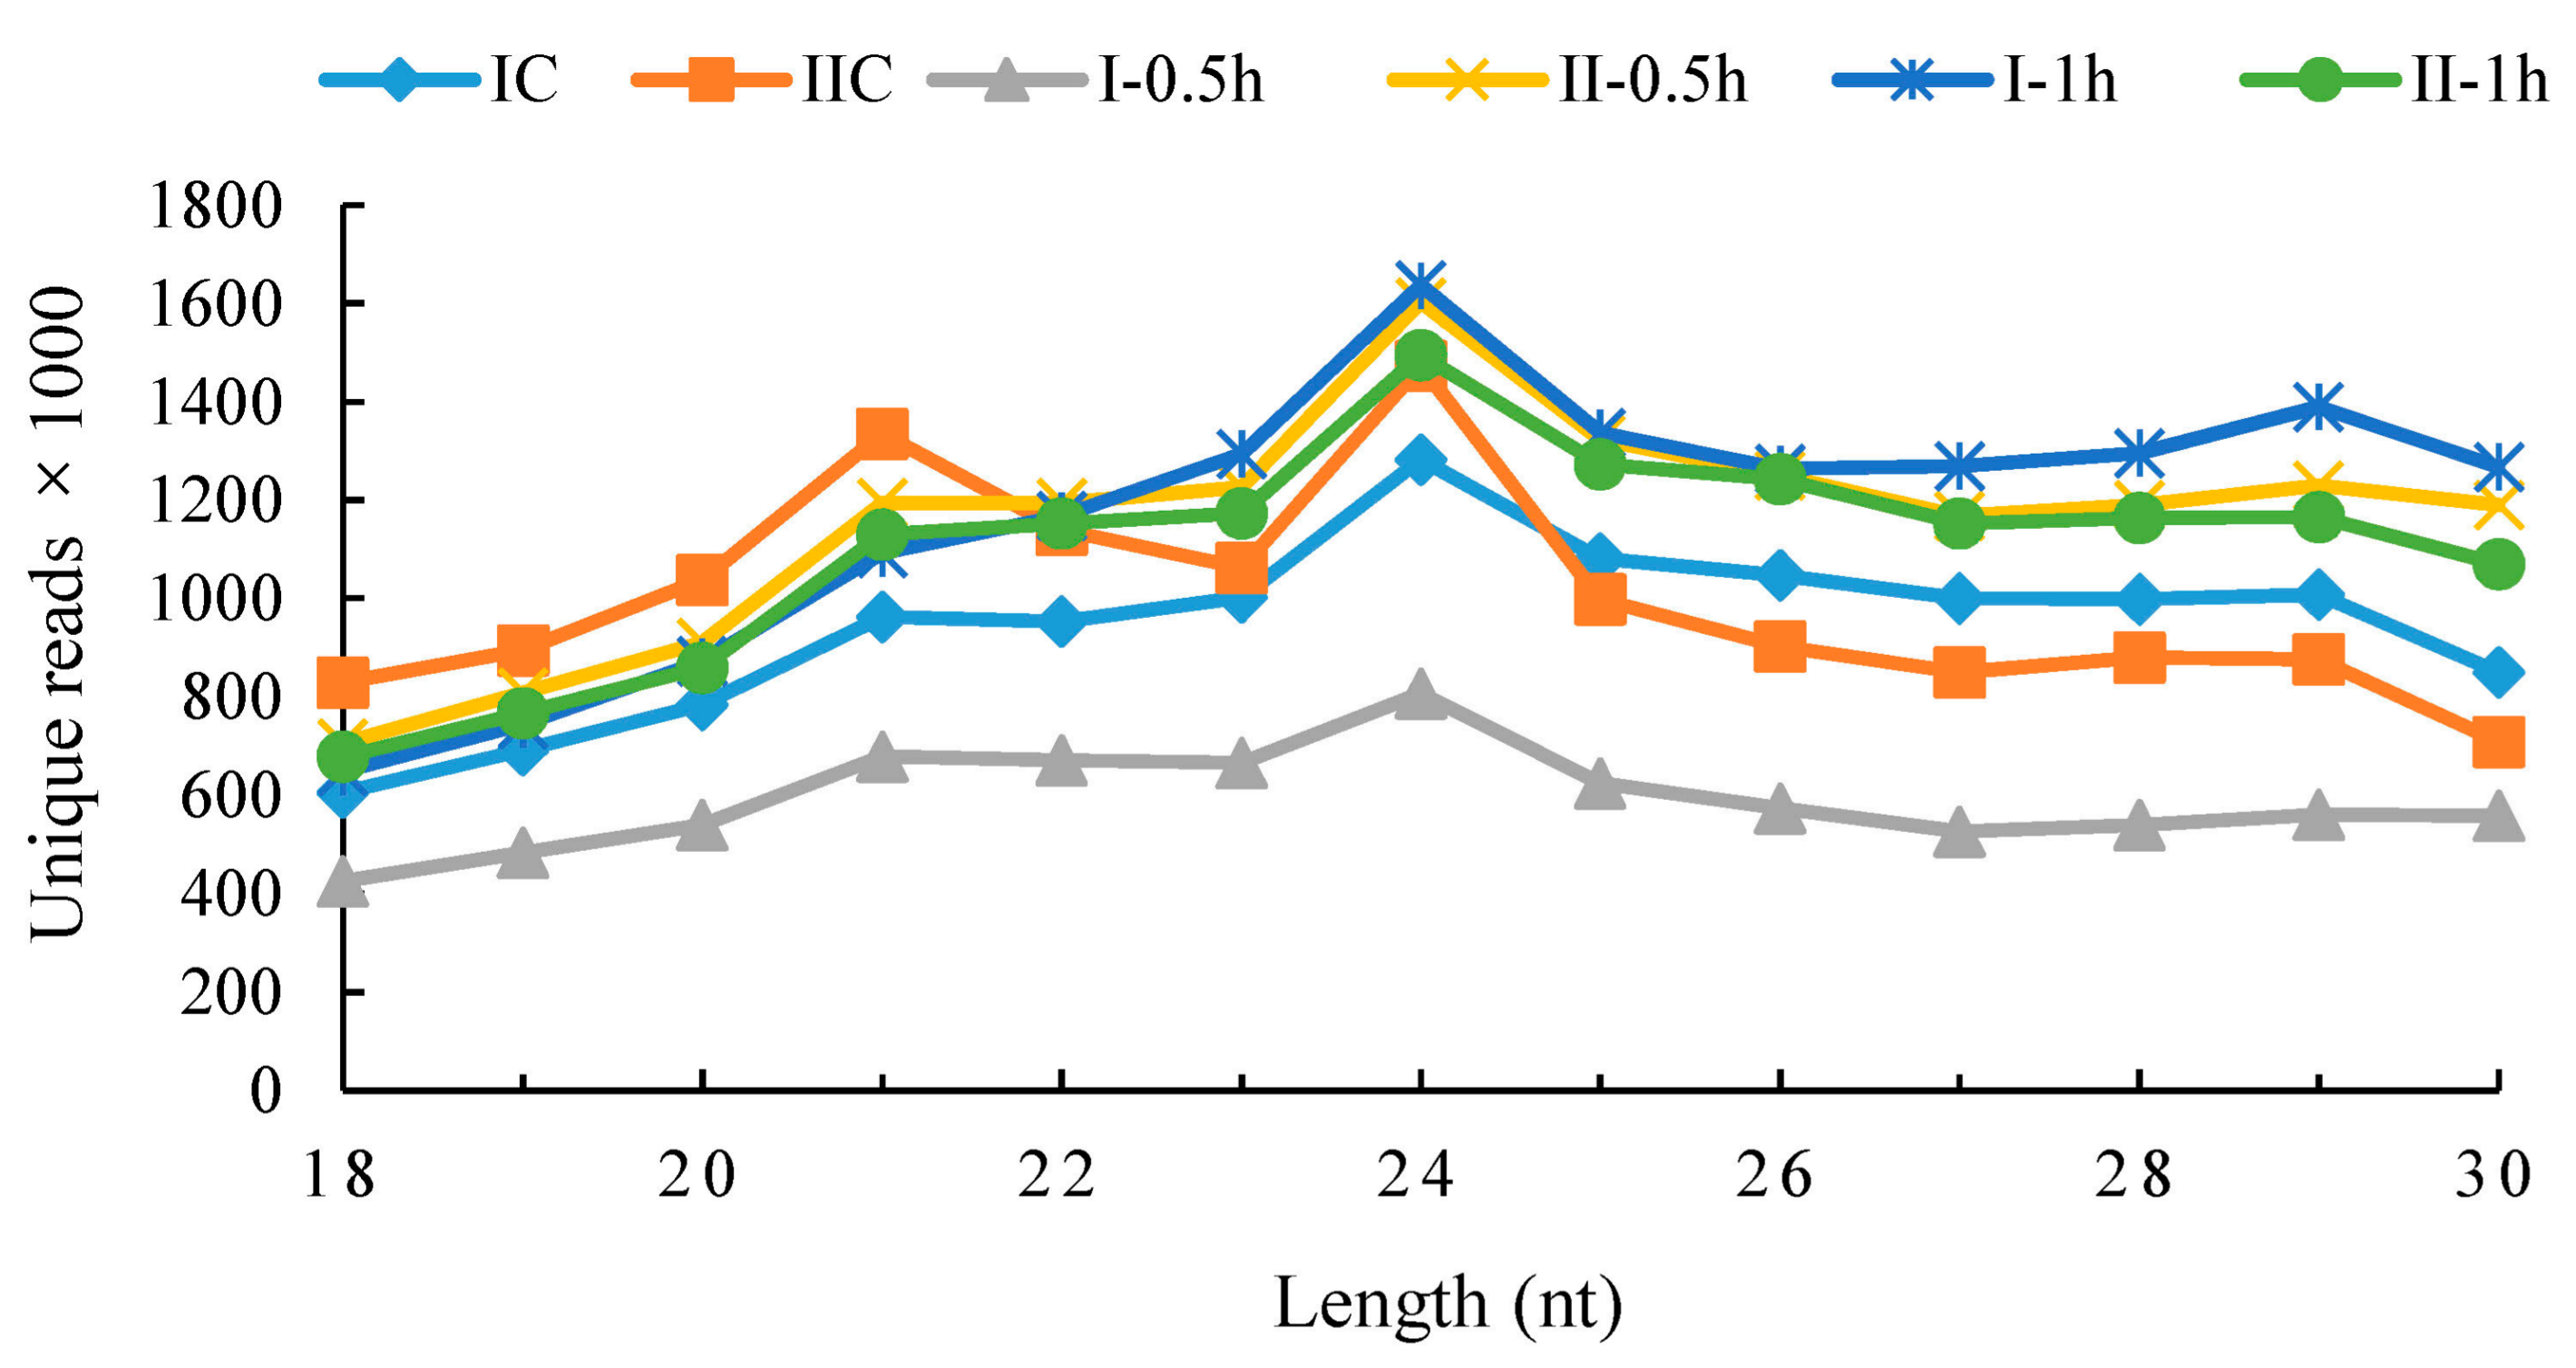
Six small RNA (sRNA) libraries (IC, I-0.5h, I-1h, IIC, II-0.5h and II-1h; Table 1) yielded 129,101,552 redundant reads (6.629 Gb data) with 12–27 million reads per library. Then, 7–15 million unique reads of 18–30 nt per library were selected for sRNA reads mapping and 45.69–68.88% reads mapped to the reference transcriptome. Only these mapped reads were selected for the microRNAs identification. All of the libraries had similar distribution of noncoding RNA families including rRNA and tRNA (~16–18%), snRNA and snoRNA (~0.28–0.46%). Detailed information, including reads numbers and percentages of the six libraries, are listed in Table 2. The 24-nt sRNAs were the most abundant sRNAs (~10% of all reads) based on the size distribution of sRNA (Figure 2). Approximately 80% of sRNAs (80.47%, 81.02%, 81.04%, 81.68%, 79.83% and 82.69% per library) returned no hits in BLAST algorithm-based search and the percentage was similar with sRNAomes of other plants [10,11,44]. The high percentage of unannotated sRNAs suggested they had not been fully appreciated in former studies.
3.3. Conserved and Novel MicroRNA Identification
In total, 558 known miRNA precursors (pre-miRNAs) and 28 novel pre-miRNAs were identified from the RNA reads. Of the 586 pre-miRNAs, 521 were classified into 46 miRNA families. The top-3 families, MIR159, 156, 166 had 56, 52, 42 identified pre-miRNAs respectively (Table S2). Their distributions were consistent with those of all plant pre-miRNAs (Table S2).
Of the 558 known pre-miRNAs, 307 were rejected due to lack of reads mapped in microRNA mature sequences. Thus, 251 known and 28 novel pre-miRNAs were selected for microRNA identification. Here, 251 conserved miRNAs were identified from the former and 18 novel miRNAs together with 19 putative miRNAs* (miRNA star strand) of the precursor reverse arm (−3p) were identified from the latter. All the 279 pre-miRNAs had canonical stem-loop structures by RNA secondary structural analyses. The numbers of conserved and novel miRNAs per library were 180–207 and 12–15 respectively, and the corresponding reads are listed in Table 2.
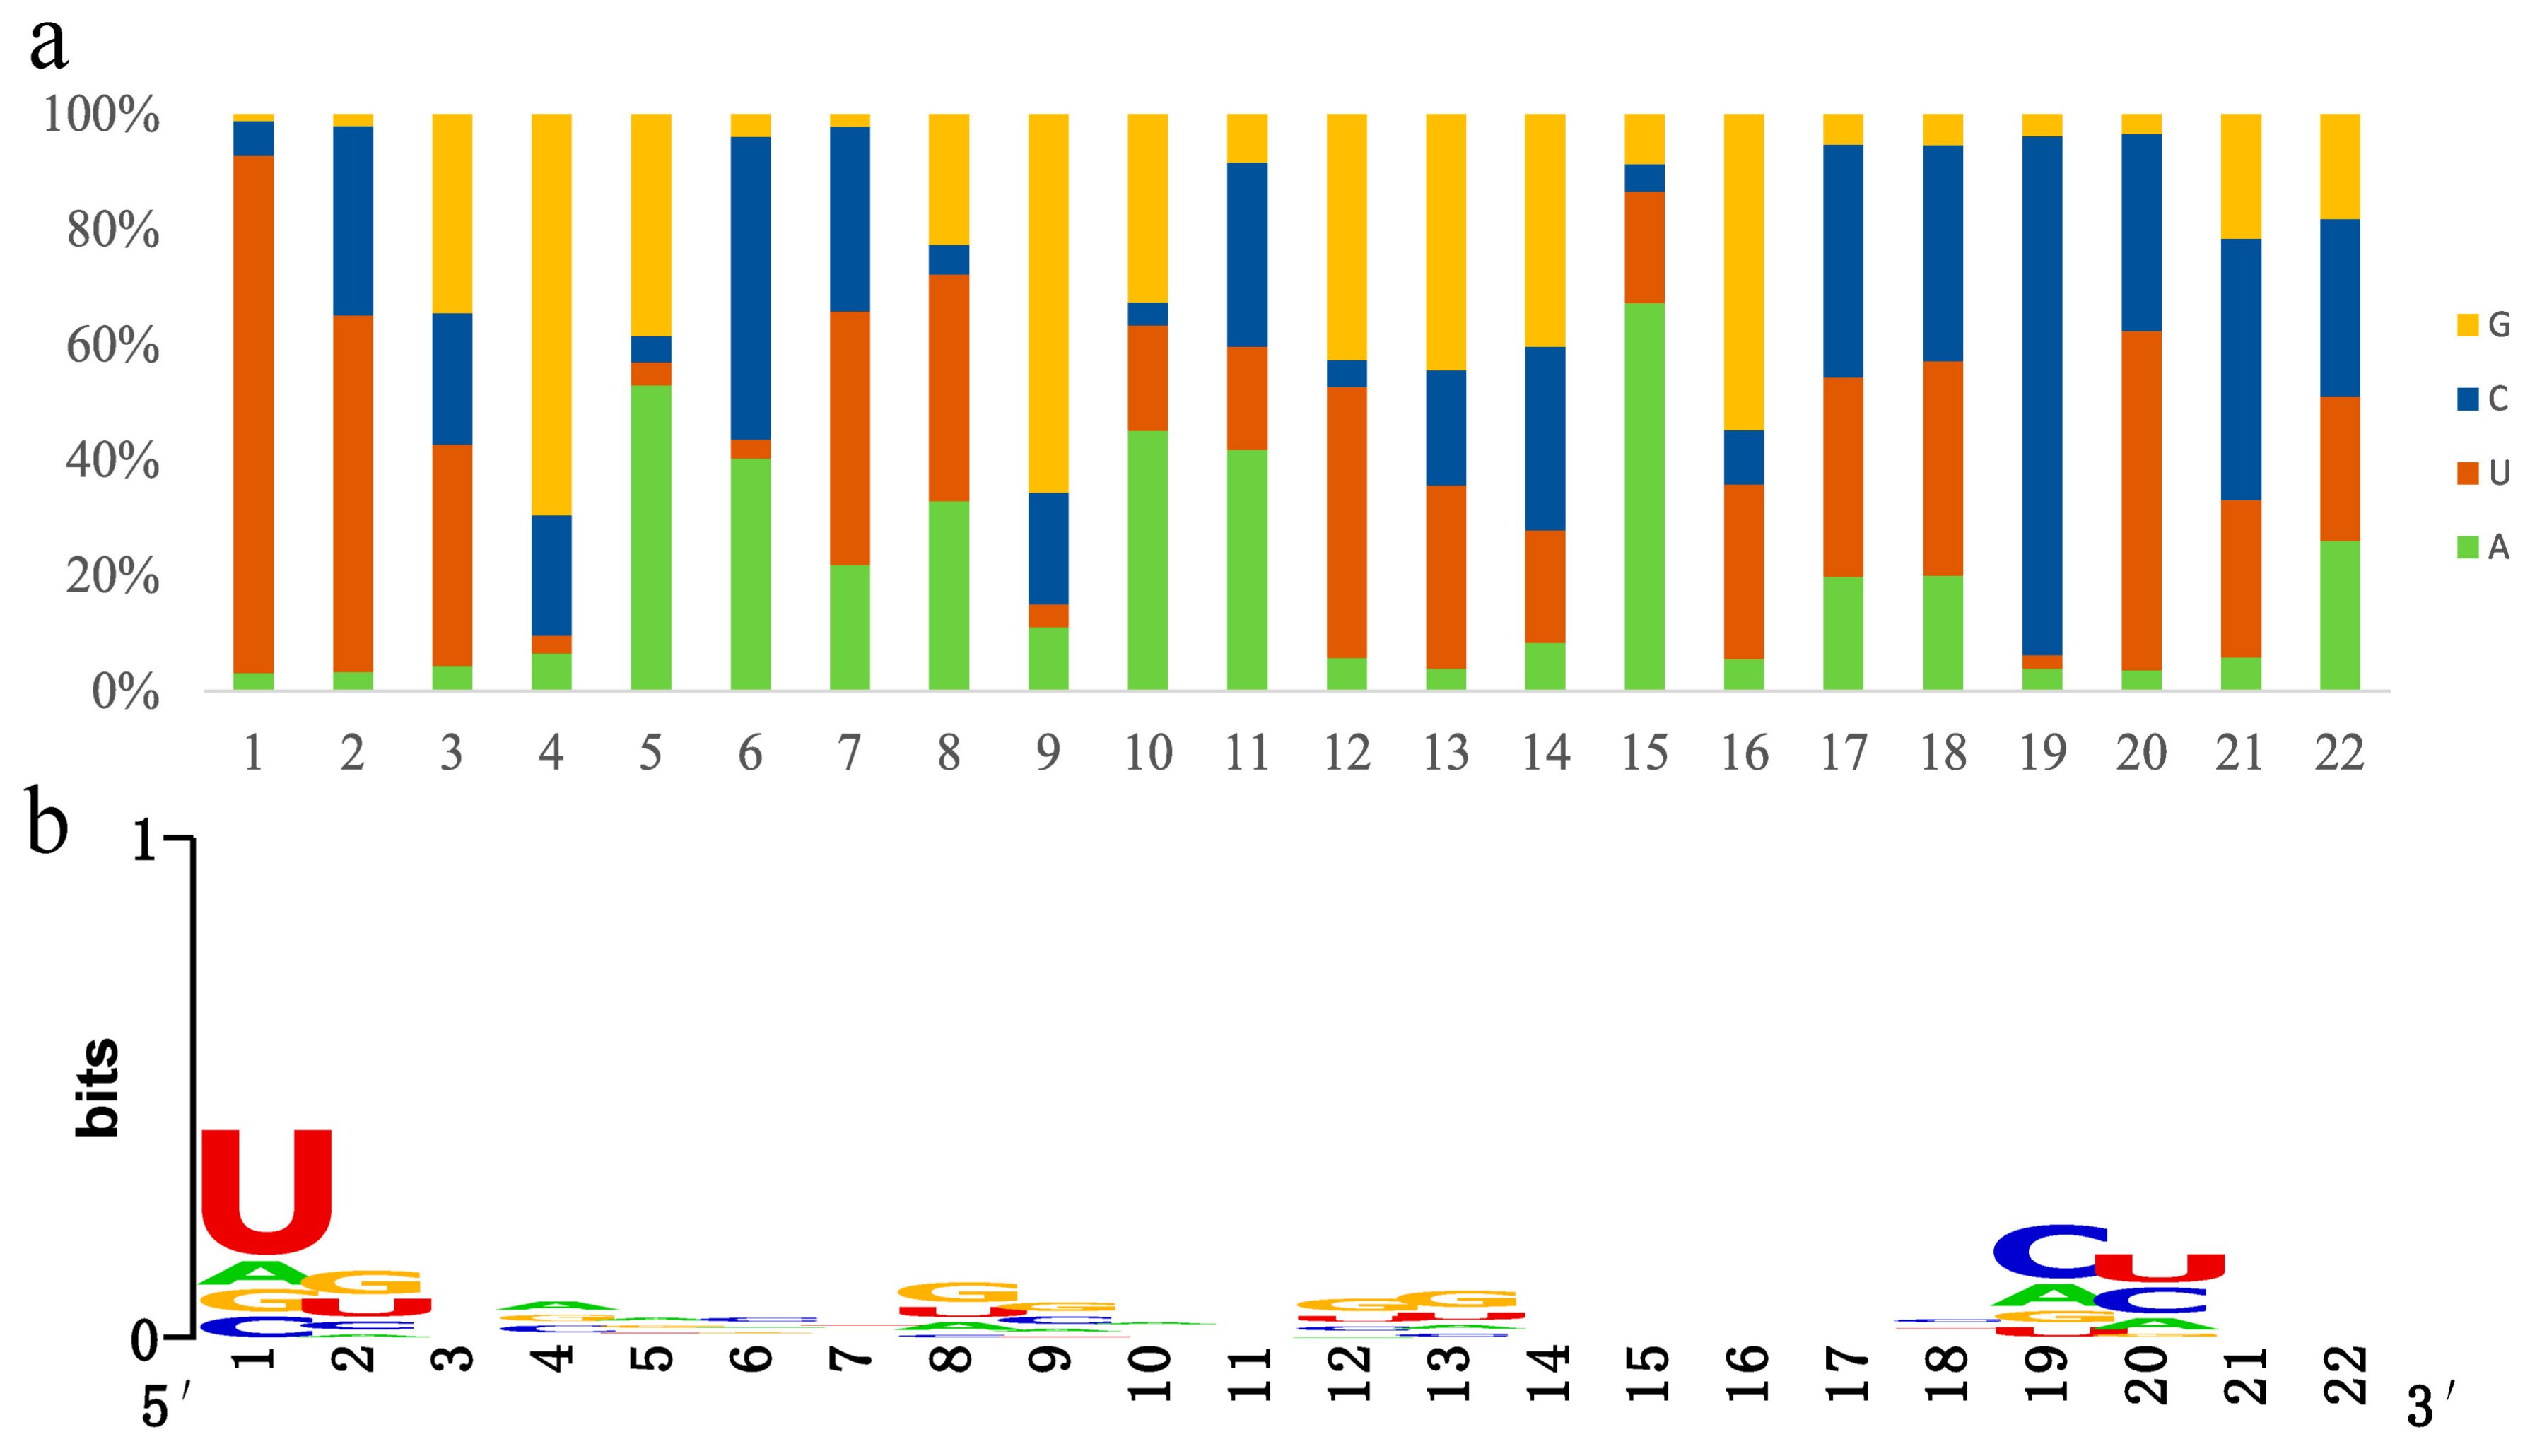
The nucleotide bias indicated that the first 5′ nucleotide with the highest frequency was U. The 5′ end nucleotides of miRNAs [45] are important for the binding stability of Argonaute (AGO). AGO has a strong preference in combining with miRNAs starting in U, as seen with rice AGO 1, 2 and 3 [46]. In addition to the U bias of first nucleotide, the C bias of 19th nucleotide seemed to be specific to Tamarix (Figure 3a).
The sequence logo [47] showed the highest conservation of the first nucleotide and a high conservation of the 19th and 20th nucleotides, which is consistent with nucleotide bias (Figure 3b). However, other non-conservative nucleotides did not correspond with the bias, e.g., the G bias of 4th, 9th nucleotide and the A bias of 15th nucleotide (Figure 3a). The nonconformity between nucleotide bias and conservation resulted from the abundance difference of microRNAs. The high-abundance microRNAs had greater weight for nucleotides bias but no effect on nucleotide conservation.
3.4. MicroRNA Profile Building and Time-Course Analysis
The miRNA profiles of six libraries (Table S3) were constructed based on expression level. The expression level was quantified using transcripts per million (TPM). Here, 122 (45.41%), 35 (12.95%) and 112 (41.64%) miRNAs were distributed in 0–15, 15–60 and 60– TPM intervals respectively. The intervals represented the low-, middle- and high-expression levels of miRNA abundance (Table 3).
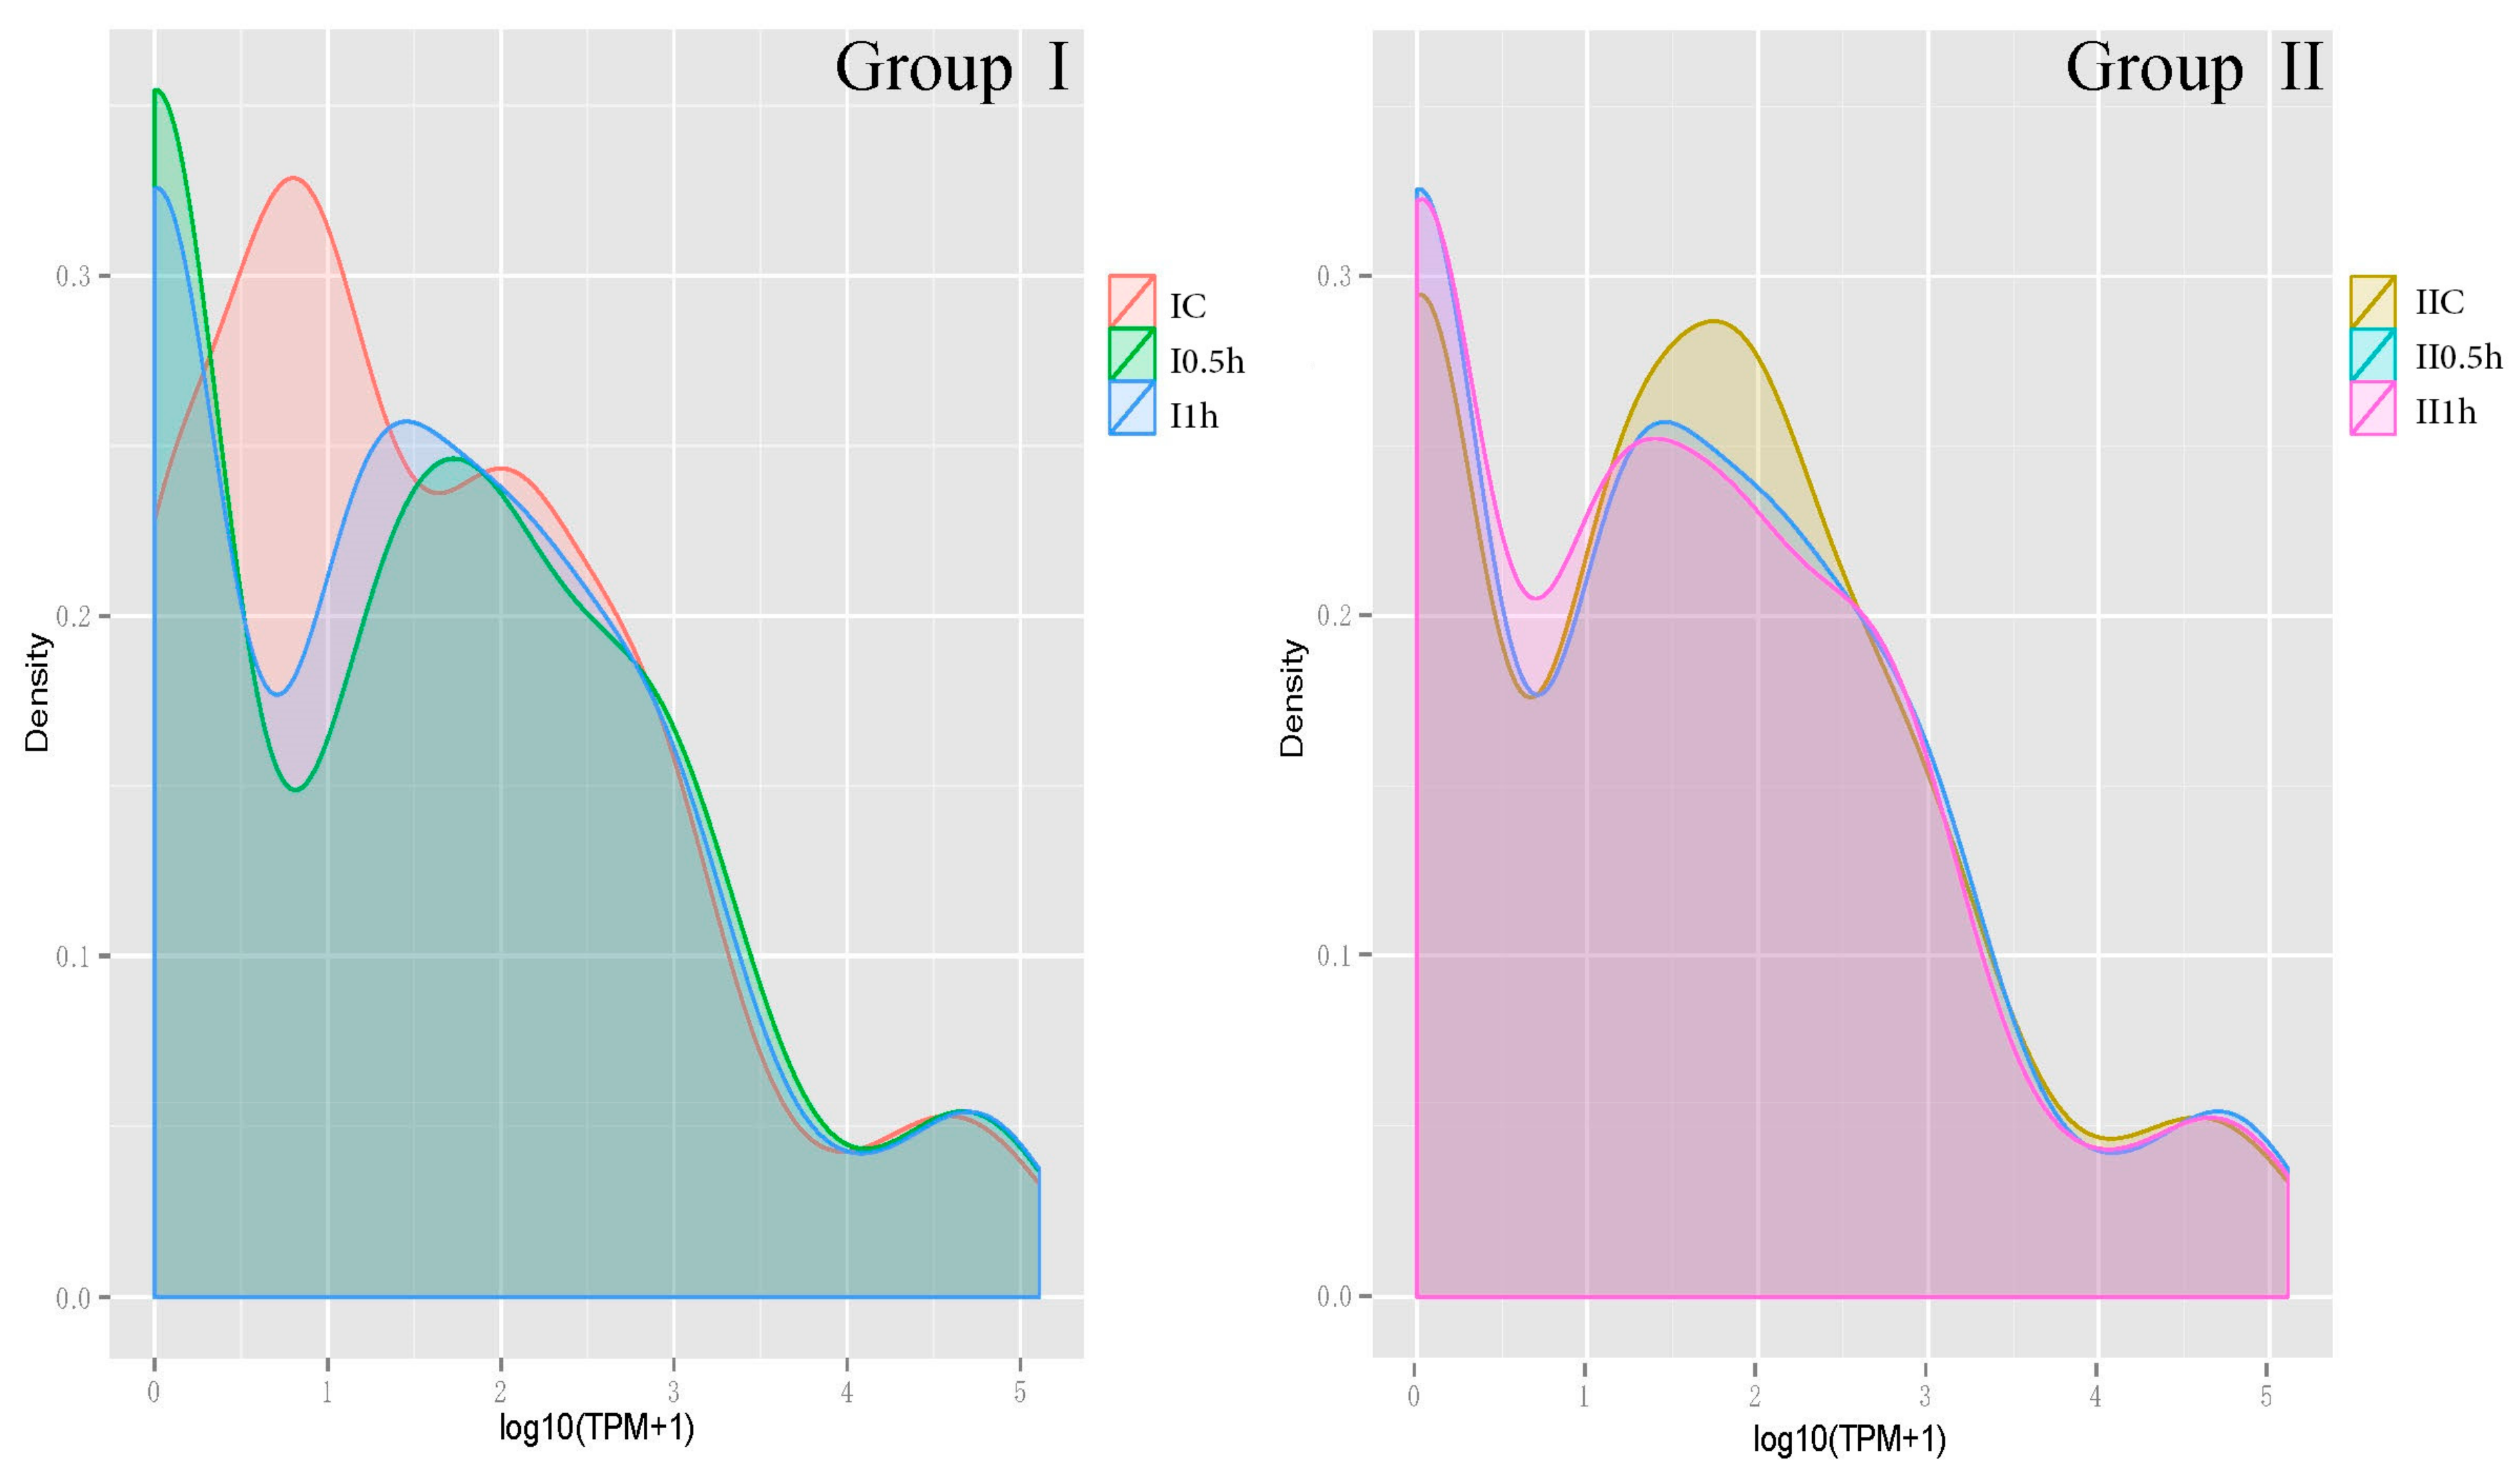
The TPM probability density distributions reflected the overview of the miRNA abundance (Figure 4). The probability density distribution of Group I changed from peak value (IC) to valley value (I-0.5h, I-1h) suggesting a significant shift occurred in interval 0–1.5 (TPM = 1–30). For Group II, on the contrary, only a minor change occurred in interval 1–2.5 (TPM = 10–315). The profiles’ changes were in conformity with the POD enzyme activity to some degree, and the difference between Groups I and II meets the expectation that younger tissues are more sensitive to salt stress.
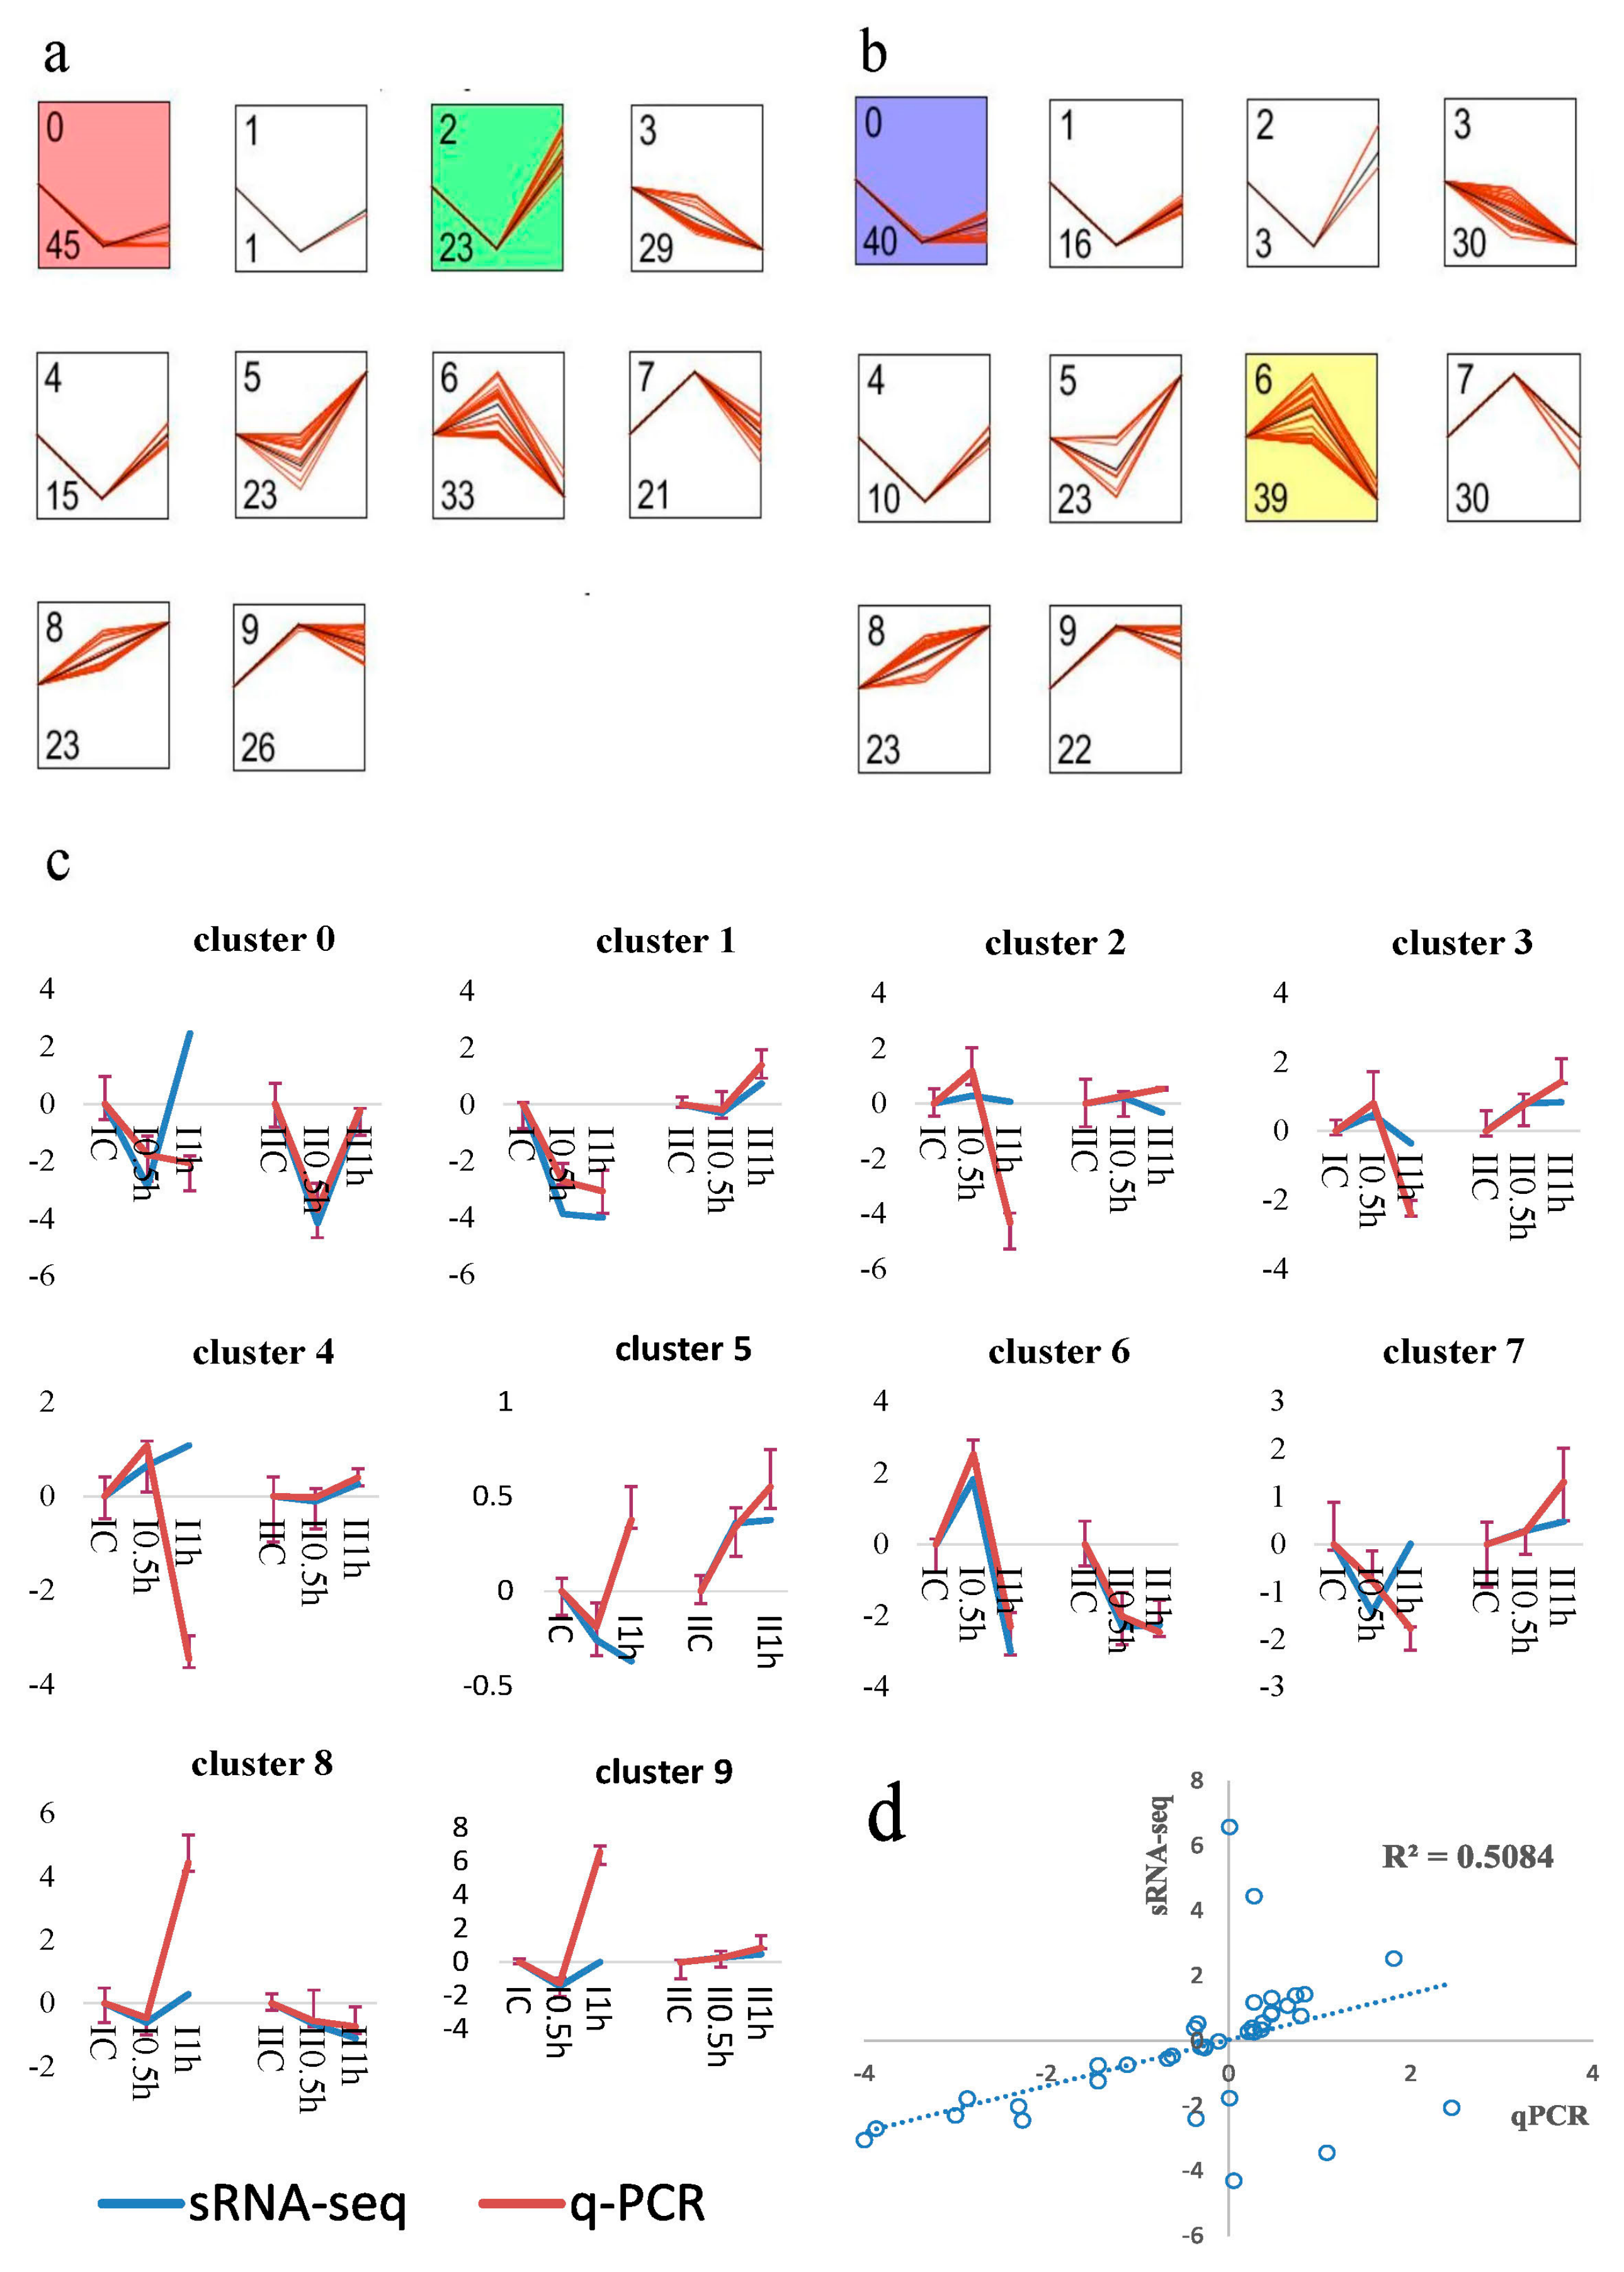
A short time-series expression miner (STEM) analysis [48] clustered miRNAs according to their temporal expression patterns. Profiles for Groups I (Figure 5a) and II (Figure 5b) showed dynamic changes of miRNA abundance. In total, 239 miRNAs and 237 miRNAs generated STEM profiles for Group I and II respectively. Three significantly enriched temporal expression profiles, clusters 0, 2 and 6, represented the main miRNA expression patterns. Cluster 0 was enriched with the most miRNAs (45 miRNAs of Group I and 40 miRNAs of Group II) and showed a “decrease to steady level” pattern. These miRNAs were down-regulated to a low abundance under salt stress. Cluster 2 (Group I) was enriched with 23 “down to up” regulated miRNAs and showed an opposite pattern to Cluster 6 (Group II) with 39 miRNAs. The other clusters were not significantly enriched, and Clusters 3 and 8 represented continuously decreasing and increasing patterns, indicating that those miRNAs had ultra (highest or lowest) abundance levels after 1 h of salt stress.
Stem-loop quantitative Real-Time PCR (qRT-PCR) is a reliable method for measuring miRNA expression levels. We used this technology to validate the expression patterns of ten miRNAs randomly selected from corresponding ten STEM clusters (Figure 5c). The Pearson correlation coefficient (R2 = 0.50854) and two-tailed t-test (p-value = 0.000808) indicated the significant positive correlations between sRNA-seq and qRT-PCR (Figure 5d). The comparisons of profiles showed that the expression patterns generated by qRT-PCR in each cluster were in high agreement with the sRNA-seq at 0.5 h. Additionally, microRNA profiles of Group II had higher consistency levels with sRNA-seq on average compared with Group I (Figure 5c).
3.5. Differentially Expressed MicroRNAs Identification
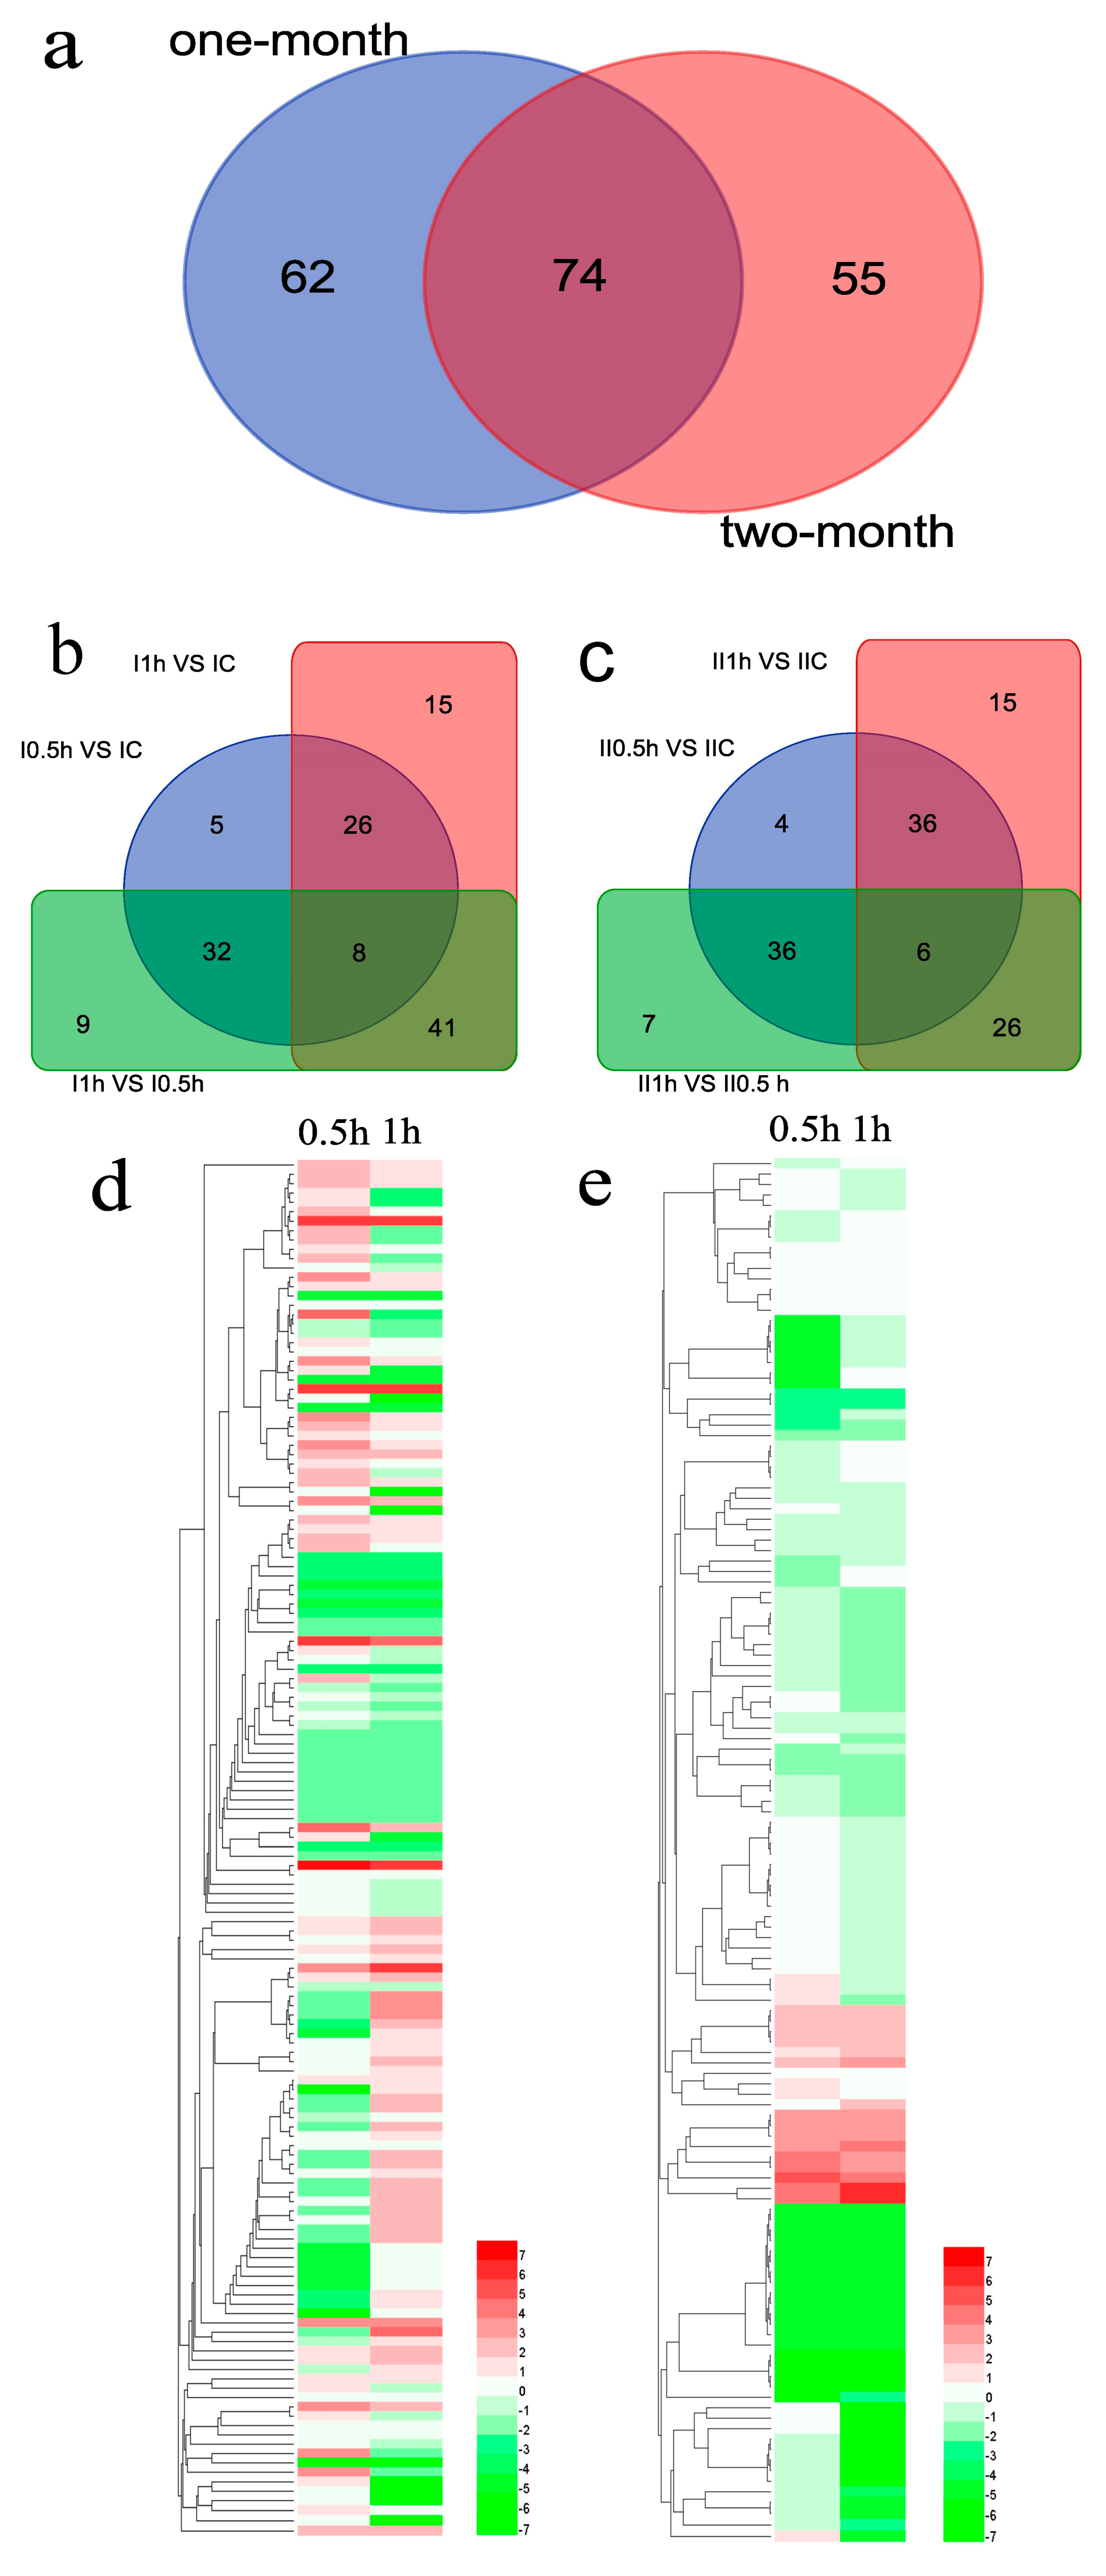
Overall, 191 miRNAs including 62 Group I-specific miRNAs, 55 Group II-specific miRNAs and 74 co-expressed miRNAs, were screened as the differentially expressed miRNAs (Figure 6a). According to the up/down-regulation of 74 co-expressed miRNAs, 41 miRNAs maintained a monotone regulation in time series. In the 41 miRNAs, 26 (11 up-regulated and 15 down-regulated) miRNAs had consistent regulatory patterns between two groups but 15 other miRNAs were conversely regulated. Considering the microRNAs differentially expressed in both groups, the 74 co-expressed miRNAs were selected as salt-responsive candidate microRNAs.
In Group I (Figure 6b), 136 differentially expressed miRNAs consisted of 71, 90 and 90 miRNAs from the three libraries comparison of I-0.5h vs. IC, I-1h vs. IC, I-1h vs. I-0.5h. Additionally, 34, 40 and 49 miRNAs were differentially expressed in each pairwise comparison. In Group II (Figure 6c), 129 differentially expressed miRNAs consisted of 82, 83 and 75 miRNAs from II-0.5h vs. IIC, II-1h vs. IIC, II-1h vs. II-0.5h. Additionally, 42, 42 and 36 miRNAs were differentially expressed in each pairwise comparison. In view of the fact that these differentially expressed miRNAs come from only a single set of biological replicates, any individual microRNA differential expression must be validated prior to follow-up study.
The heatmaps of Group I (136 miRNAs, Figure 6d) and Group II (129 miRNAs, Figure 6e) illustrated the fold changes of the differentially expressed miRNAs. Although the numbers of differentially expressed miRNAs in two groups were similar, the higher percentage of extremely differentially expressed (fold change >2 or <−2) miRNAs in Group I indicated that an intense salt stress response occurred in younger roots. In addition, in Group II, the higher percentage of down-regulated miRNAs indicated the older roots may respond to salt stress by down-regulating miRNAs to promote the expression of targeted salt-tolerant genes.
3.6. Target Genes Prediction and MicroRNA Regulatory Network
A total of 706 Unigenes were predicted as targets of 219 miRNAs. Fifty miRNAs had no targets due to conflicting predictions between psRoboot and psRNATarget. The 1475 putative miR-target pairs indicated that every miRNA regulated 7 targets and every predicted target was regulated by 2 miRNAs on average. In the 706 putative targets, 523 targets were function-annotated in the NR database, including 86 TFs such as squamosa promoter binding protein-like, MYB, NAC, APETALA2-like (AP2), homeobox-leucine zipper protein (HD-ZIP) and TCP domain transcription factor. The 510 predicted targets of all annotated target genes were divided into 46 gene ontology (GO) terms (Table S4) including the top three terms: binding (GO: 0005488), cellular process (GO: 0009987) and metabolic process (GO: 0008152). The 266 targets were annotated in 23 clusters of orthologous groups for eukaryotic complete genomes (KOG) function categories (Table S4) including the top three categories: General function prediction only (R), Transcription (K) and Post-translational modification, protein turnover, chaperones (O). The 107 targets were annotated in 89 Kyoto Encyclopedia of Genes and Genomes (KEGG) pathways (Table S4) including the top three pathways: Ubiquitin mediated proteolysis (ko04120), Spliceosome (ko03040) and RNA degradation (ko03018).
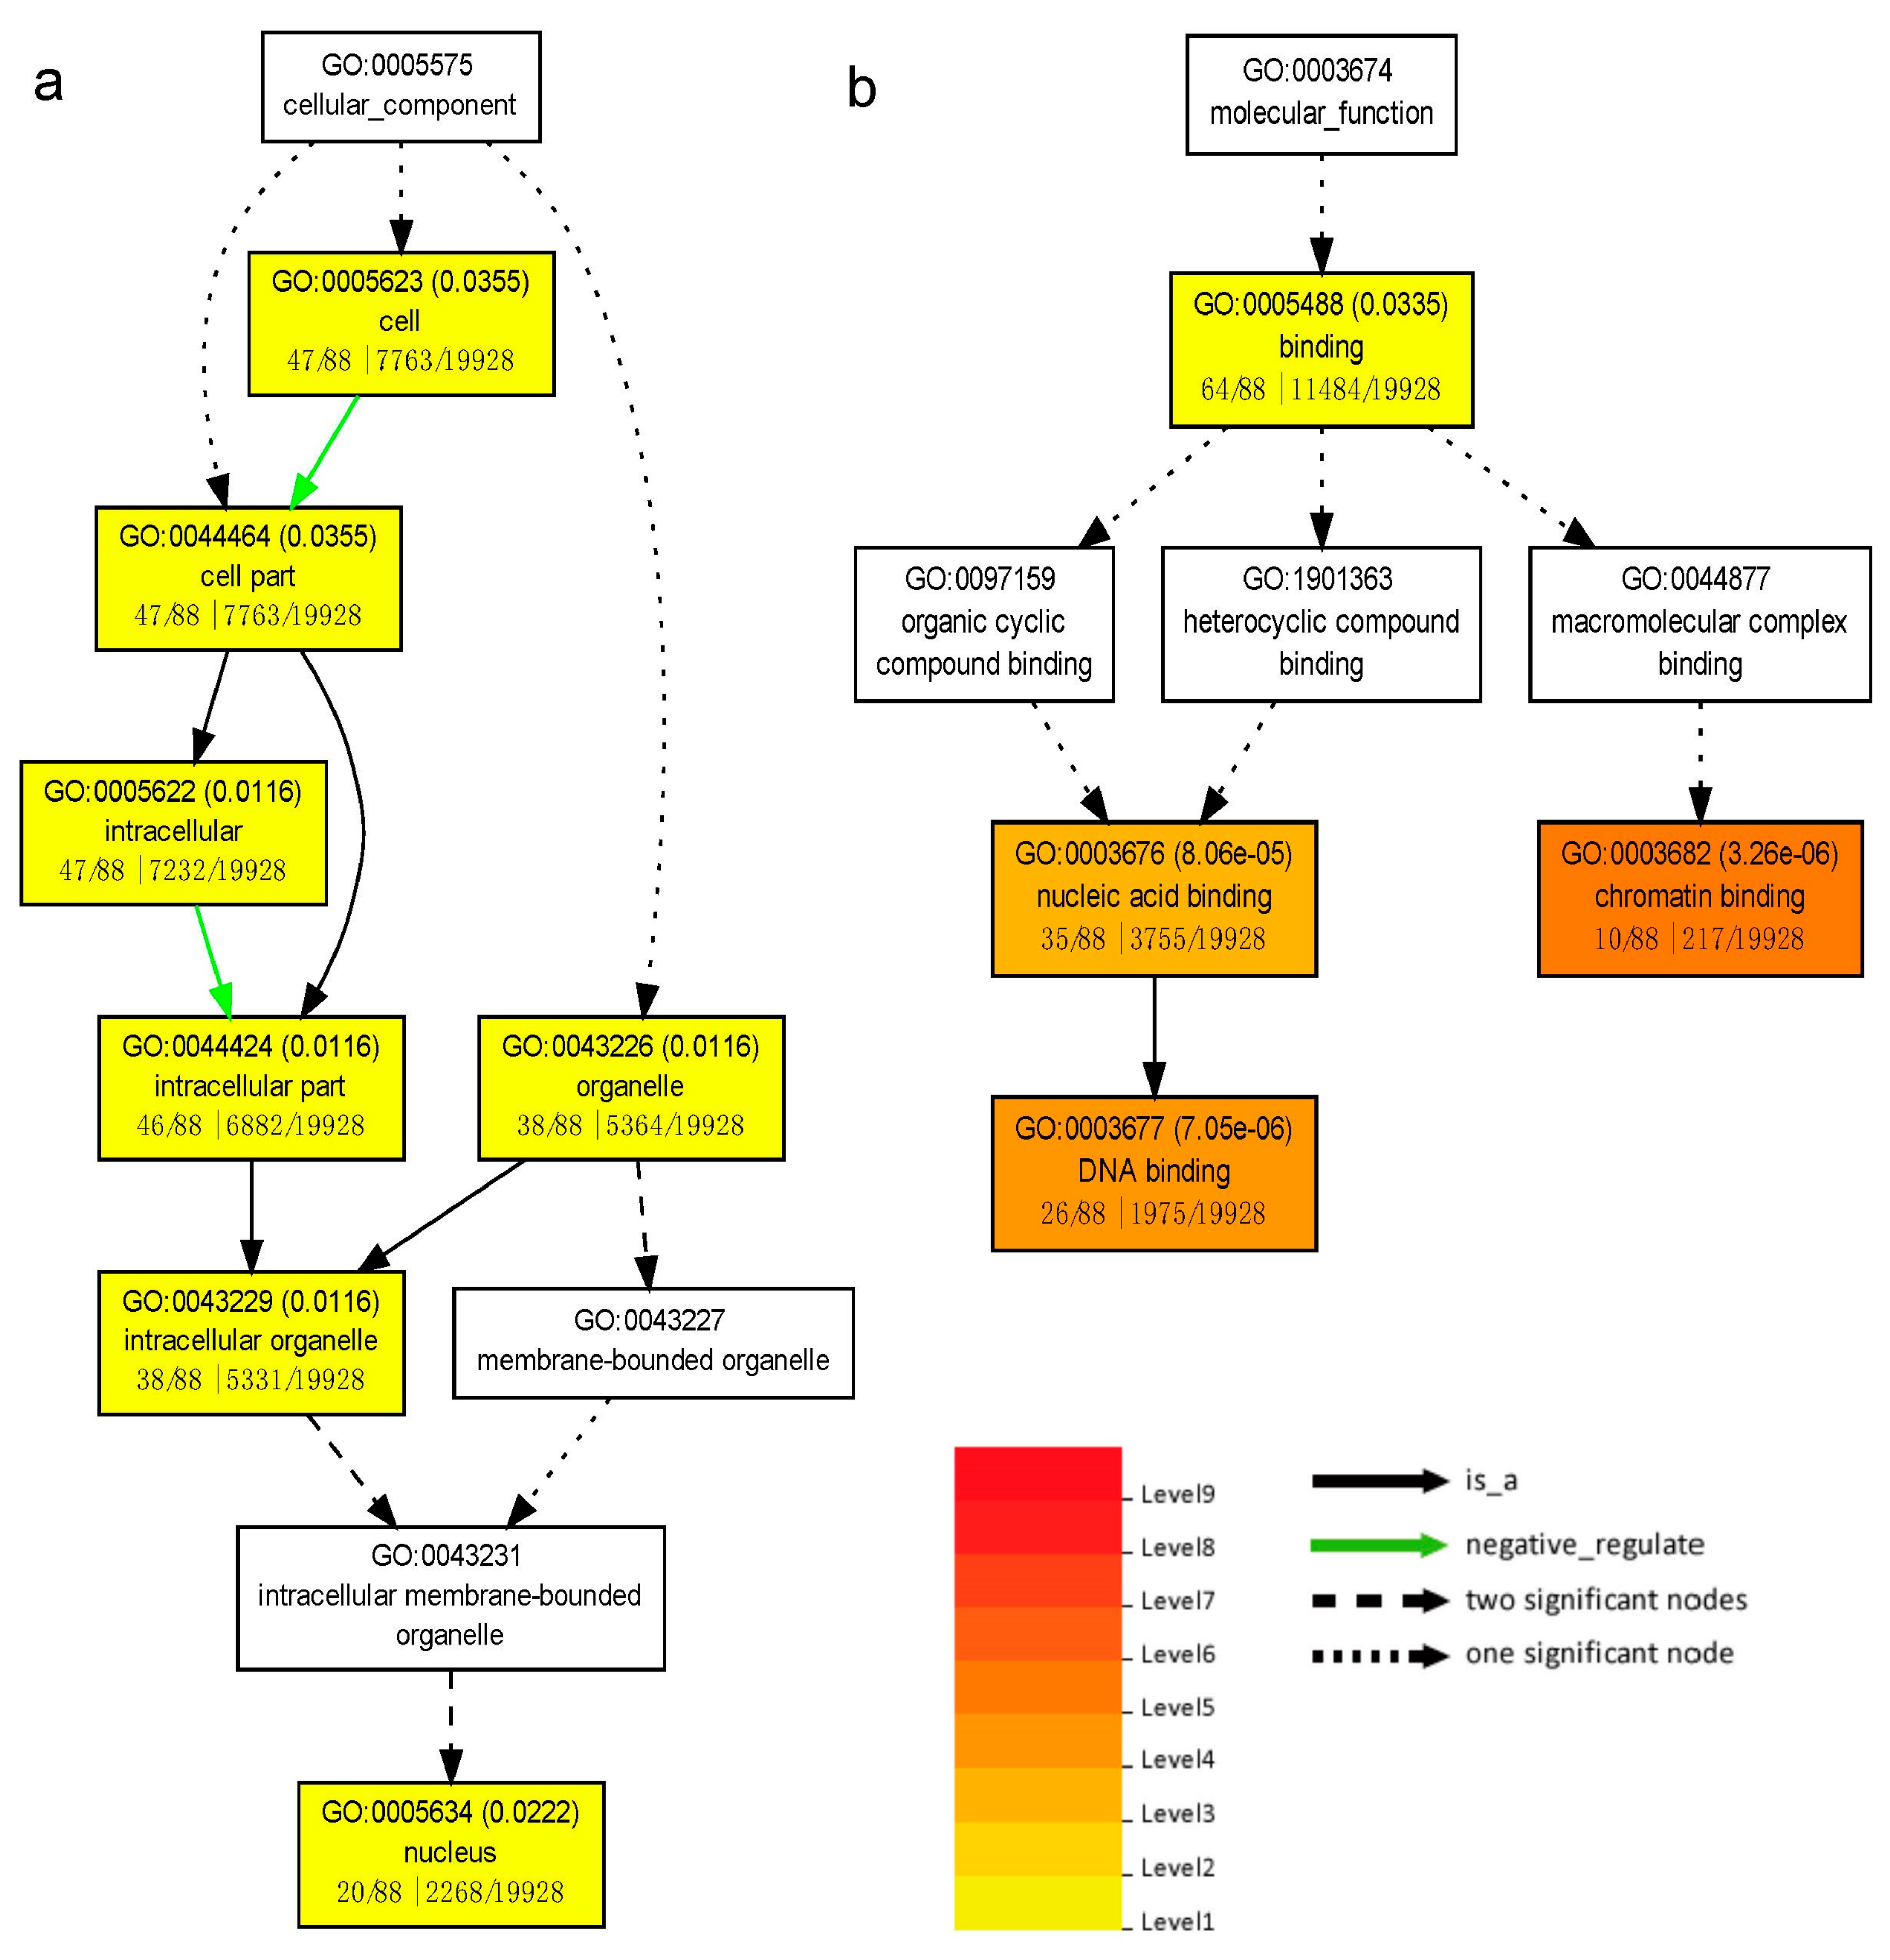
The 157 targets and 151 differentially expressed miRNAs constructed 454 miR-target pairs. To focus on the biological progress of salt responses, we performed the GO enrichment analysis using agriGO v2.0 [49], which suggested 88 target genes were enriched in 11 GO terms, including four terms of Cellular Component and seven terms of Molecular Function (Table S5). The GO directed acyclic hierarchical graph (Figure 7) made up a logical framework of enriched terms. The top three most enriched GO terms, chromatin binding (GO: 0003682), DNA binding (GO: 0003677) and nucleic acid binding (GO: 0003676), revealed the process of regulatory elements binding to DNA was highly active under salt stress. Considering TFs are the main targets of plant miRNAs, the results illustrated that miRNAs affect downstream responsive gene expression by regulating their TFs.
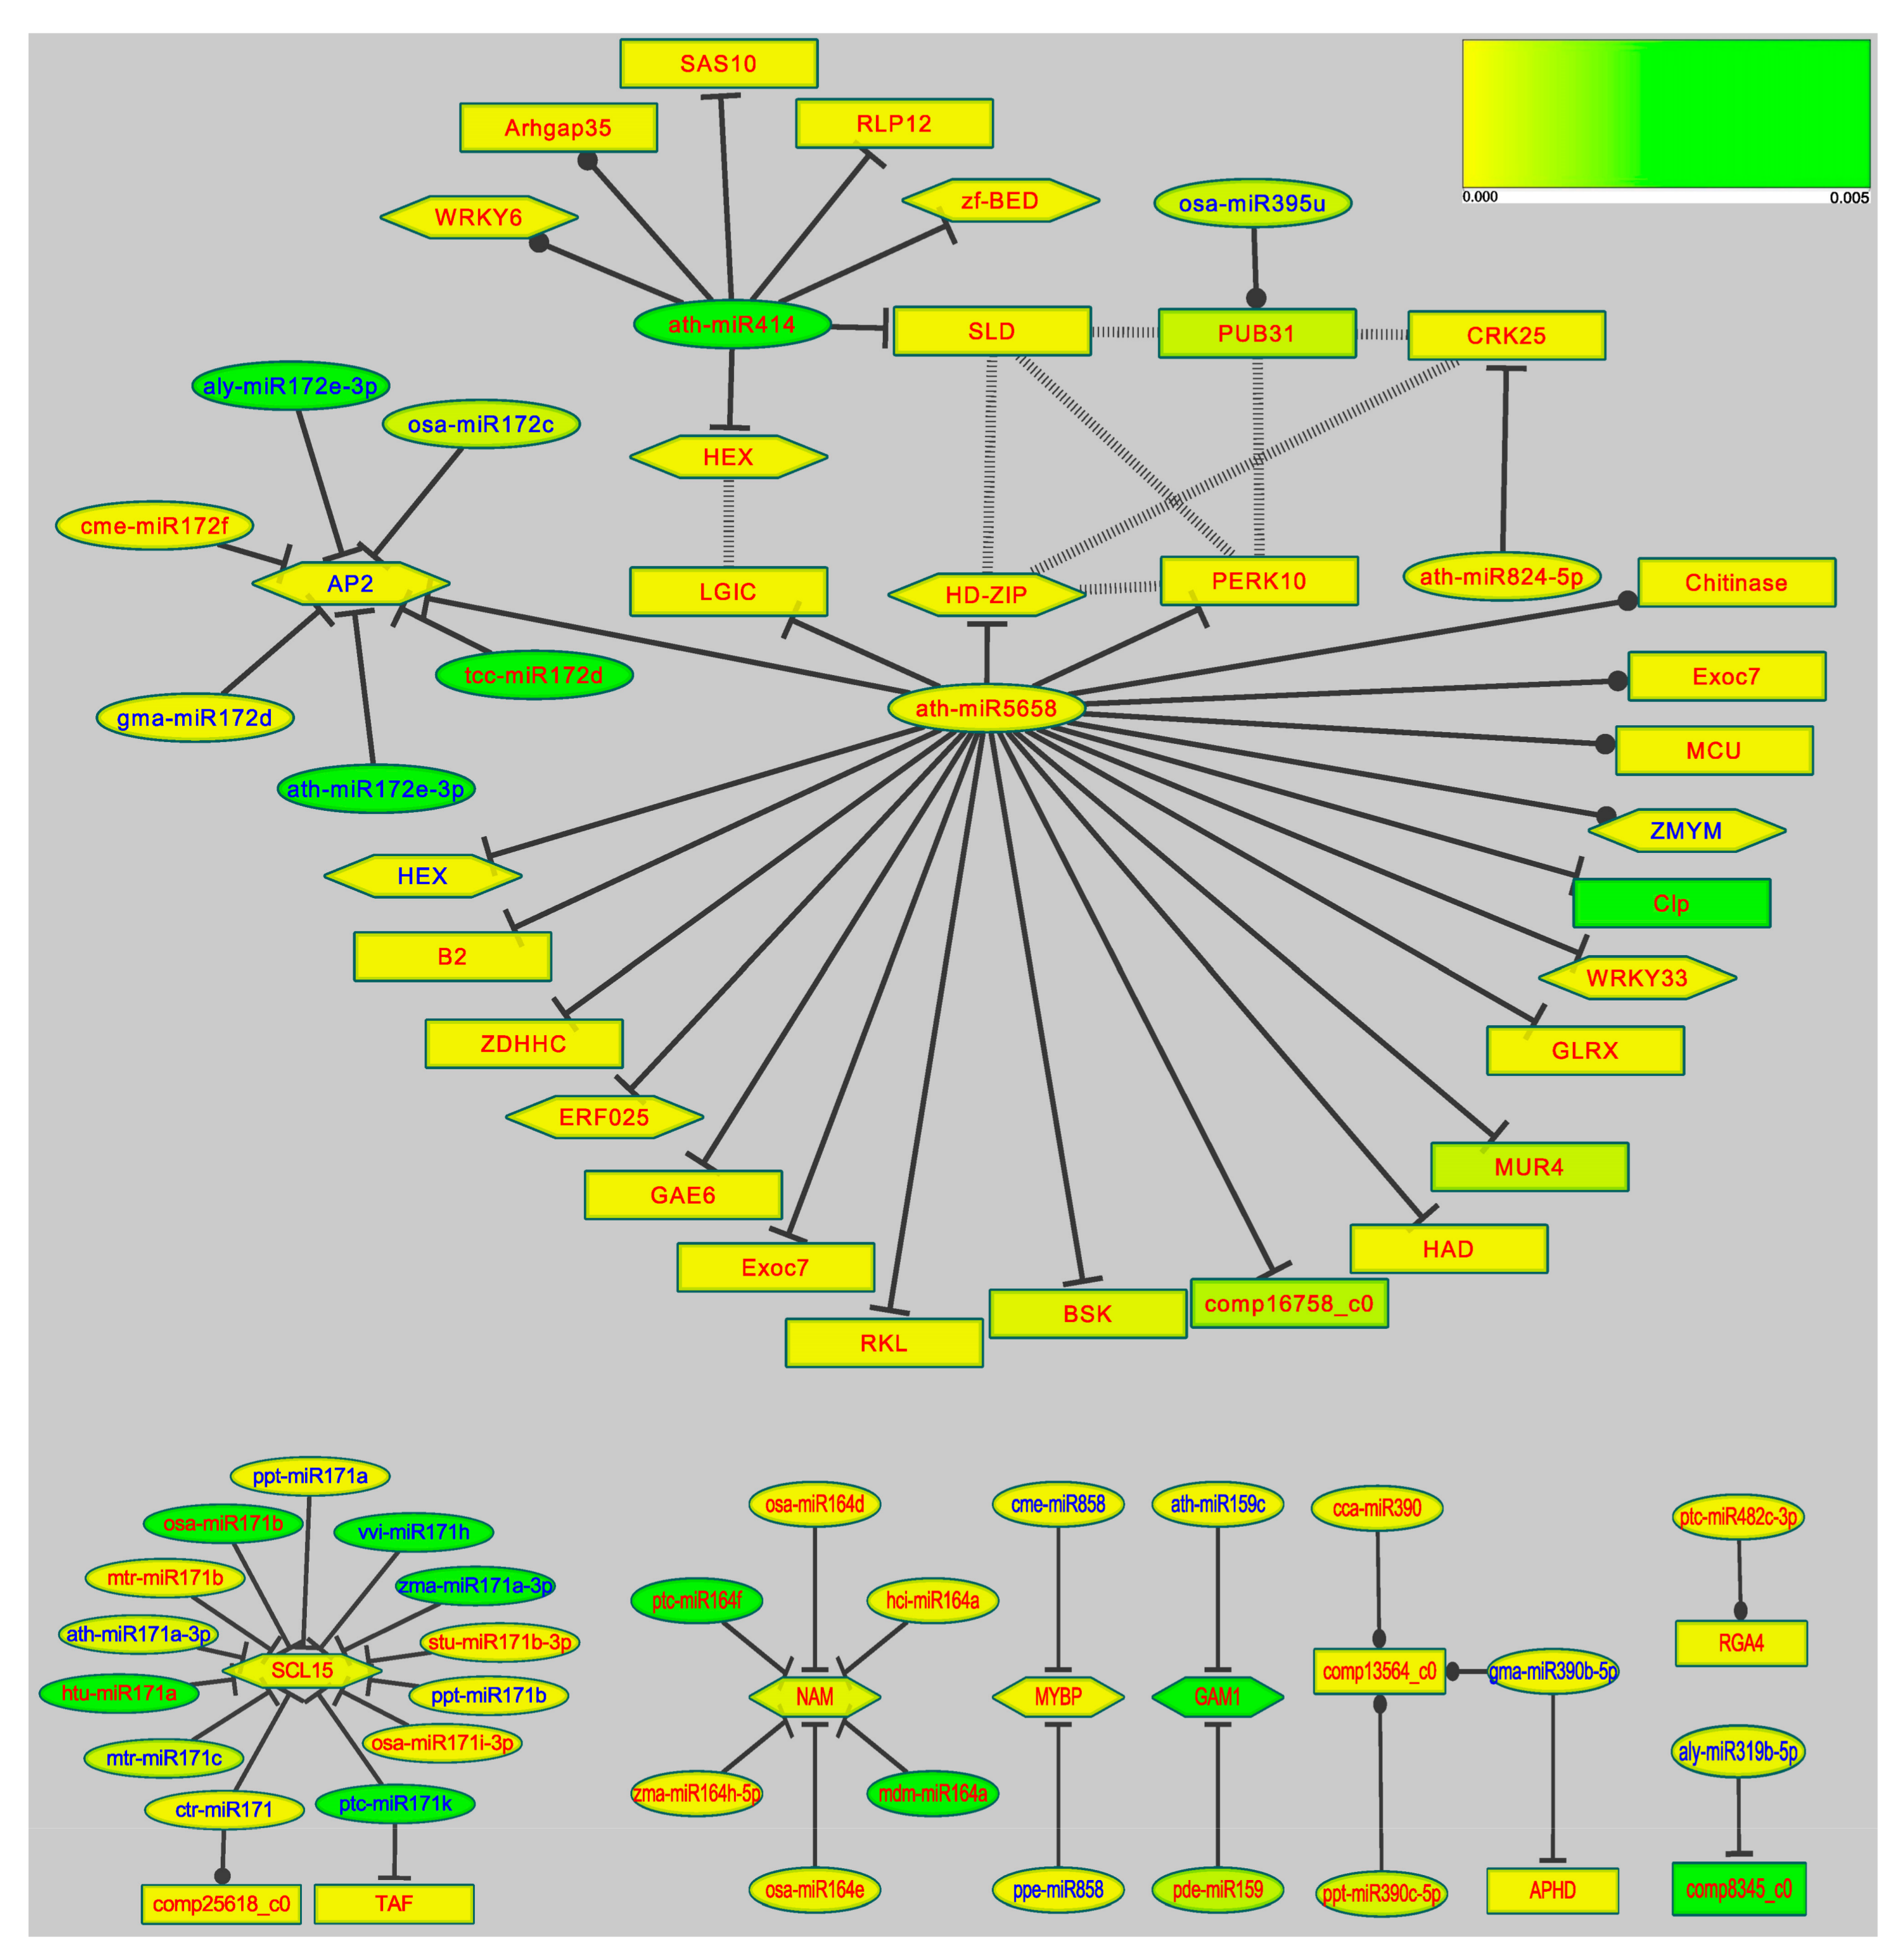
To demonstrate the interaction network under salt stress, we selected the 74 co-expressed miRNAs from all the differentially expressed microRNAs as salt responsive candidate miRNAs. In addition, the DEGs of RNA-seq were selected from all the predicted target genes. In total, 70 miR-target pairs (38 salt responsive miRNAs and 41 DEGs) and 8 proteins interactions (7 DEGs) were involved in the microRNA regulatory network on the Cytoscape platform [50]. The interactions between proteins were predicted according to the STRING database using poplar as the reference. The regulatory manner of cleavages or inhibition was predicted by psRNATarget. The false discovery rate and gene function annotation of DEGs were acquired from transcriptome data. Four genes use the Unigene IDs (e.g., compXXXX_c0) [30] as names because of their lack of hits in the function annotation. Eight sub-networks constituted the whole regulatory network. The sub-network mediated by ath-miR5658 (ath-miR414, ath-824-5p, miR172 and osa-miR395u) was the most complex. The other seven sub-networks were mediated by only one miRNA or several miRNAs of the same family.
4. Discussion
4.1. Strategy for Time-Course Experimental Design
High-quality expression profiles depend on the optimal strategy of experimental design, especially in high-throughput sequencing experiments. Based on previous reports [51,52], NaCl concentrations higher than 2% would induce salt shock symptoms of Tamarix, including curled or yellow leaves, branch exsiccation and individual death. Our 2% saline solution culture indicated the limit of T. chinensis salt-tolerance should be higher than the experiential concentration 2%. So 2% NaCl concentration was decided as the salt treatment on the prerequisite of salt shock on plants. Time points and intervals are the core of time-course experimental design [27,53,54]. In our study, plant materials, the young adventitious roots of cuttings, were so sensitive to abiotic stress that the time intervals and time points could dramatically affect the identification of differentially expressed miRNAs. The POD enzymes activity is a representative physiological index of salt stress responses. We set 0 h, 0.5 h, 1 h, 2 h, 4 h and 8 h as the time course because the transcriptome of roots quickly responded to salt stress. We decided on the choice of the time point of peak (1 h) and the preceding one (0.5 h) because the strongest and second strongest responses happened in the time points. The TPM distribution significantly change in I-0.5h and I-1h (Figure 4). It was consistent with the trend change of POD enzyme activity in 0.5 h and 1 h. This proved the rationality of time-point choice. The differentially expressed microRNAs that were co-expressed both in Group I and II were considered a strategy of salt-responsive microRNA identification for compensation of experimental error control [55,56,57,58,59]. Based on this, all of the 74 co-expressed miRNAs were selected as salt-responsive candidate microRNAs.
4.2. The miRNA Regulation Network of Tamarix under Stress
Among the 41 putative target genes in the microRNA regulatory network, 13 TFs were responsive to abiotic stress, like Ethylene-responsive transcription factor (ERF), HD-ZIP and MYB. Most of the other 28 putative targets were important signaling genes such as BR-signaling kinase (BSK), Receptor-like protein 12 and Protein tyrosine kinase. Interestingly, three important TFs were putatively targeted by multiple miRNA family members. The three TFs were Scarecrow-like protein 15 (SCL15), no apical meristem protein (NAM or CUC1 NAC) and AP2. Functions of the three TFs were well studied in model plant species. SCL15 is an important target of the miR171 family [60], and 14 miR171 members were identified in this study. The miR171-SCL interaction was identified in target predictions [61] and southern hybridization experiments in Arabidopsis [62]. Interactions of AP2 with miR5658 and miR172 family members were only computationally predicted in Arabidopsis [63]. In addition, miR172-AP2 and miR164-NAM pairs have been identified in other high-throughput sequencing studies [26,64]. In our study, NAM was putatively targeted by six up-regulated miR164 family members. SCL15 (AP2) were putatively regulated by the members of miR171 (miR172) with reverse expression patterns (Figure 8, label colors). The three TFs’ functions and regulatory patterns indicated that microRNAs’ (miR171, miR172, miR5658) mediated targets regulation was intricate and influenced by multiple factors.
In the seven protein-encoding genes, five genes consisted a putative small interaction network (Figure 8, dotted lines), including HD-ZIP, SLD (delta8-fatty-acid desaturase), PUB31 (U-box domain-containing protein 31), PERK10 (proline-rich receptor-like protein kinase) and CRK25 (cysteine-rich receptor-like protein kinase 25). The HD-ZIP associated with ABA-mediated salt tolerance was significantly differentially expressed in many abiotic stress profiles studies [26,65,66]. SLD encodes an important desaturase of lipids synthesis that enhances the salt tolerance of overexpressed Arabidopsis and other plants [67,68,69]. PUB plays a key role in ubiquity-26s proteasome pathway-mediated stress tolerance by regulating hormonal signaling [67]. The two kinase PERK10 and CRK25 are receptor-like protein kinases that could be the candidate sensors of salt stress, and their importance had been discussed in our previous study [30]. miR5658, miR414, miR395, miR824 and other targets were connected in a complex sub-network of proteins interactions. In this sub-network, the highest connectivity (four edges) of four targets (HD-ZIP, PUB31, SLD, PERK10) suggested that these hub genes could influence multiple pathways compared with other targets. Because some hub genes were directly (like AP2) or indirectly (like HD-ZIP) regulated by two or more microRNAs, their regulation of downstream salt responsive genes would be more sensitive and controllable.
In the differentially expressed miRNAs’ regulatory network, the two hubs ath-miR5658 and ath-miR414 (Figure 8) appeared to be more important regulators of salt-responsive genes than other microRNAs. Although mRNA cleavage is the major mechanism of miRNA-introduced silencing, several target genes were predicted to be regulated by translational inhibition (Figure 8, lines with T arrow) like “ctr-miR171---comp25618_c0”, “ptc-miR482d-3p---RGA4 (Leucine-rich repeat)”. However, the reliability of the translational inhibition predicted computationally based on mismatches in the paring regions, needs to be experimentally validated. Especially, both hub miRNAs regulated targets through translational inhibition and cleavage, indicating their flexible regulatory modes for different salt responsive genes. ath-miR5658 mediated the regulation of 22 targets, including the direct regulation of salt tolerance genes like BSK, inactive receptor kinase (RKL), as well as the indirect regulation based on “miR-TF-downstream genes” pathway. The two regulatory strategies were also used in the ath-miR414 mediated pathway. For the network connection, between miR56568 and miR414, the proteins Ligand-gated ion channel, Transcription factor HEX, SLD and HD-ZIP connected the two hub miRNAs in a complex organic network. This organic network is regulated in a complicated manner that involves miRNA-directed target and target-directed miRNA interactions. Thus, the two miRNAs could affect the targets of other miRNAs. As indicated earlier, ath-miR5658 and ath-miR414 may regulate Tamarix responses to environmentally complicated and changeable salt stress factors by the subtle and comprehensive post-transcriptional regulation of different target genes.
5. Conclusions
In summary, this research investigated the sRNAome of T. chinensis and identified 192 differentially expressed microRNAs from the time series expression profiles. In addition, 74 co-expressed microRNAs were identified as salt-responsive candidate microRNAs. Four putative target genes (HD-ZIP, PUB31, SLD, PERK10) acted as the bridges in the microRNA regulatory network. Two microRNAs miR5658 (ath-miR5658) and miR414 (ath-miR414), appeared to be the potential key regulators of the post-transcriptional regulatory network under salt stress. These findings will aid in understanding of T. chinensis salt tolerance. Further studies should focus on the experimental validation of these microRNAs’ functions and evaluate their potential as candidate molecules in salt-resistance breeding.
Supplementary Materials
The following are available online at https://www.mdpi.com/1999-4907/9/4/180/s1, Table S1: qRT-PCR primers, Table S2: MicroRNA families of pre-microRNAs, Table S3: MicroRNAs expression profile, Table S4: Target genes function classification, Table S5: GO enriched analysis of target genes of differentially expressed microRNAs.
Acknowledgments
This research was financially supported by the Science and Technology Support Program of Jiangsu Province (CN), BE2011321, the Priority Academic Program Development of Jiangsu Higher Education Institutions (PAPD), and the Doctorate Fellowship Foundation of Nanjing Forestry University.
Author Contributions
L.X. and M.X. conceived and designed the project. J.W. undertook the enzyme activity and molecular biology experiment. J.W., Z.L., Y.Y. and H.R. participated in the data analysis. J.W. drafted the manuscript. L.X. and M.X. modified the manuscript. All authors have read and approved the manuscript for publication.
Conflicts of Interest
The authors declare no conflict of interest.
References
- Bartel, D.P. MicroRNAs: Target recognition and regulatory functions. Cell 2009, 136, 215–233. [Google Scholar] [CrossRef] [PubMed]
- Brousse, C.; Liu, Q.; Beauclair, L.; Deremetz, A.; Axtell, M.J.; Bouche, N. A non-canonical plant microRNA target site. Nucleic Acids Res. 2014, 42, 5270–5279. [Google Scholar] [CrossRef] [PubMed]
- Li, J.; Reichel, M.; Li, Y.; Millar, A.A. The functional scope of plant microRNA-mediated silencing. Trends Plant Sci. 2014, 19, 750–756. [Google Scholar] [CrossRef] [PubMed]
- Li, C.; Zhang, B. MicroRNAs in control of plant development. J. Cell Physiol. 2016, 231, 303–313. [Google Scholar] [CrossRef] [PubMed]
- Jones-Rhoades, M.W.; Bartel, D.P.; Bartel, B. MicroRNAs and their regulatory roles in plants. Annu. Rev. Plant Biol. 2006, 57, 19–53. [Google Scholar] [CrossRef] [PubMed]
- Sunkar, R.; Li, Y.; Jagadeeswaran, G. Functions of microRNAs in plant stress responses. Trends Plant Sci. 2012, 17, 196–203. [Google Scholar] [CrossRef] [PubMed]
- Khraiwesh, B.; Zhu, J.; Zhu, J. Role of miRNAs and siRNAs in biotic and abiotic stress responses of plants. Biochim. Biophys. Acta (BBA) Gene Regul. Mech. 2012, 1819, 137–148. [Google Scholar] [CrossRef] [PubMed]
- Shukla, L.I.; Chinnusamy, V.; Sunkar, R. The role of microRNAs and other endogenous small RNAs in plant stress responses. BBA-Gene Regul. Mech. 2008, 1779, 743–748. [Google Scholar] [CrossRef] [PubMed]
- Ding, D.; Zhang, L.; Wang, H.; Liu, Z.; Zhang, Z.; Zheng, Y. Differential expression of miRNAs in response to salt stress in maize roots. Ann. Bot.-Lond. 2009, 103, 29–38. [Google Scholar] [CrossRef] [PubMed]
- Xie, F.; Wang, Q.; Sun, R.; Zhang, B. Deep sequencing reveals important roles of microRNAs in response to drought and salinity stress in cotton. J. Exp. Bot. 2015, 66, 789–804. [Google Scholar] [CrossRef] [PubMed]
- Xie, F., Jr.; Stewart, C.N.; Taki, F.A.; He, Q.; Liu, H.; Zhang, B. High-throughput deep sequencing shows that microRNAs play important roles in switchgrass responses to drought and salinity stress. Plant Biotechnol. J. 2014, 12, 354–366. [Google Scholar] [CrossRef] [PubMed]
- Muchate, N.S.; Nikalje, G.C.; Rajurkar, N.S.; Suprasanna, P.; Nikam, T.D. Plant salt stress: Adaptive responses, tolerance mechanism and bioengineering for salt tolerance. Bot. Rev. 2016, 82, 371–406. [Google Scholar] [CrossRef]
- Zhu, J.K. Salt and drought stress signal transduction in plants. Annu. Rev. Plant Biol. 2002, 53, 247–273. [Google Scholar] [CrossRef] [PubMed]
- Kumar, M.; Choi, J.; An, G.; Kim, S. Ectopic expression of OsSta2 enhances salt stress tolerance in rice. Front. Plant Sci. 2017, 8, 316. [Google Scholar] [CrossRef] [PubMed]
- Soda, N.; Sharan, A.; Gupta, B.K.; Singlapareek, S.L.; Pareek, A. Evidence for nuclear interaction of a cytoskeleton protein (OsIFL) with metallothionein and its role in salinity stress tolerance. Sci. Rep.-UK 2016, 6, 34762. [Google Scholar] [CrossRef] [PubMed]
- Xie, R.; Jin, Z.; Ma, Y.; Pan, X.; Dong, C.; Pang, S.; He, S.; Deng, L.; Yi, S.; Zheng, Y. Combined analysis of mRNA and miRNA identifies dehydration and salinity responsive key molecular players in citrus roots. Sci. Rep.-UK 2017, 7, 42094. [Google Scholar] [CrossRef] [PubMed]
- Fu, R.; Zhang, M.; Zhao, Y.; He, X.; Ding, C.; Wang, S.; Feng, Y.; Song, X.; Li, P.; Wang, B. Identification of salt tolerance-related microRNAs and their targets in maize (Zea mays L.) using high-throughput sequencing and degradome analysis. Front. Plant Sci. 2017, 8, 864. [Google Scholar] [CrossRef] [PubMed]
- Dugas, D.V.; Bartel, B. Sucrose induction of Arabidopsis miR398 represses two Cu/Zn superoxide dismutases. Plant. Mol. Biol. 2008, 67, 403–417. [Google Scholar] [CrossRef] [PubMed]
- Sunkar, R.; Kapoor, A.; Zhu, J.K. Posttranscriptional induction of two Cu/Zn superoxide dismutase genes in Arabidopsis is mediated by downregulation of miR398 and important for oxidative stress tolerance. Plant Cell 2006, 18, 2051–2065. [Google Scholar] [CrossRef] [PubMed]
- Kawa, D.; Testerink, C. Regulation of mRNA decay in plant responses to salt and osmotic stress. Cell. Mol. Life Sci. 2017, 74, 1165–1176. [Google Scholar] [CrossRef] [PubMed]
- Kumar, V.; Khare, T.; Shriram, V.; Wani, S.H. Plant small RNAs: The essential epigenetic regulators of gene expression for salt-stress responses and tolerance. Plant Cell Rep. 2018, 37, 61–75. [Google Scholar] [CrossRef] [PubMed]
- Gao, C.; Wang, Y.; Liu, G.; Yang, C.; Jiang, J.; Li, H. Expression profiling of salinity-alkali stress responses by large-scale expressed sequence tag analysis in Tamarix hispid. Plant Mol. Biol. 2008, 66, 245–258. [Google Scholar] [CrossRef] [PubMed]
- Ji, X.; Liu, G.; Liu, Y.; Zheng, L.; Nie, X.; Wang, Y. The bZIP protein from Tamarix hispida, ThbZIP1, is ACGT elements binding factor that enhances abiotic stress signaling in transgenic Arabidopsis. BMC Plant Biol. 2013, 13, 151. [Google Scholar] [CrossRef] [PubMed]
- Yang, G.; Wang, C.; Wang, Y.; Guo, Y.; Zhao, Y.; Yang, C.; Gao, C. Overexpression of ThVHAc1 and its potential upstream regulator, ThWRKY7, improved plant tolerance of Cadmium stress. Sci. Rep.-UK 2016, 6, 18752. [Google Scholar] [CrossRef] [PubMed]
- Yang, C.P.; Wang, Y.C.; Liu, G.F.; Jiang, J.; Zhang, G.D. Study on expression of genes in Tamarix androssowii under NaHCO3 stress using gene chip technology. Sheng Wu Gong Cheng Xue Bao 2005, 21, 220–226. [Google Scholar] [PubMed]
- Wang, C.; Gao, C.; Wang, L.; Zheng, L.; Yang, C.; Wang, Y. Comprehensive transcriptional profiling of NaHCO3-stressed Tamarix hispida roots reveals networks of responsive genes. Plant Mol. Biol. 2014, 84, 145–157. [Google Scholar] [CrossRef] [PubMed]
- Yang, C.; Wei, H. Designing microarray and RNA-Seq experiments for greater systems biology discovery in modern plant genomics. Mol. Plant 2015, 8, 196–206. [Google Scholar] [CrossRef] [PubMed]
- Yaish, M.W.; Sunkar, R.; Zheng, Y.; Ji, B.; Al-Yahyai, R.; Farooq, S.A. A genome-wide identification of the miRNAome in response to salinity stress in date palm (Phoenix dactylifera L.). Front. Plant Sci. 2015, 6, 946. [Google Scholar] [CrossRef] [PubMed]
- Xu, M.; Zang, B.; Yao, H.S.; Huang, M.R. Isolation of high quality RNA and molecular manipulations with various tissues of Populus. Russ. J. Plant Physl. 2009, 56, 716–719. [Google Scholar] [CrossRef]
- Wang, J.; Xu, M.; Gu, Y.; Xu, L. Differentially expressed gene analysis of Tamarix chinensis provides insights into NaCl-stress response. Trees-Struct. Funct. 2017, 31, 645–658. [Google Scholar] [CrossRef]
- Langmead, B. Aligning short sequencing reads with Bowtie. Curr. Protoc. Bioinform. 2010, 32, 11–17. [Google Scholar]
- Griffiths-Jones, S. miRBase: The microRNA Sequence Database; Humana Press: New York, NY, USA, 2006; Volume 342, pp. 129–138. [Google Scholar]
- Friedlander, M.R.; Mackowiak, S.D.; Li, N.; Chen, W.; Rajewsky, N. miRDeep2 accurately identifies known and hundreds of novel microRNA genes in seven animal clades. Nucleic Acids Res. 2012, 40, 37–52. [Google Scholar] [CrossRef]
- Moxon, S.; Schwach, F.; Dalmay, T.; MacLean, D.; Studholme, D.J.; Moulton, V. A toolkit for analysing large-scale plant small RNA datasets. Bioinformatics 2008, 24, 2252–2253. [Google Scholar] [CrossRef] [PubMed]
- Saha, S.; Bridges, S.; Magbanua, Z.V.; Peterson, D.G. Empirical comparison of ab initio repeat finding programs. Nucleic Acids Res. 2008, 36, 2284–2294. [Google Scholar] [CrossRef] [PubMed]
- Kalvari, I.; Argasinska, J.; Quinones-Olvera, N.; Nawrocki, E.P.; Rivas, E.; Eddy, S.R.; Bateman, A.; Finn, R.D.; Petrov, A.I. Rfam 13.0: Shifting to a genome-centric resource for non-coding RNA families. Nucleic Acids Res. 2017. [Google Scholar] [CrossRef] [PubMed]
- Wen, M.; Shen, Y.; Shi, S.; Tang, T. miREvo: An integrative microRNA evolutionary analysis platform for next-generation sequencing experiments. BMC Bioinform. 2012, 13, 140. [Google Scholar] [CrossRef] [PubMed]
- Wang, L.; Feng, Z.; Wang, X.; Wang, X.; Zhang, X. DEGseq: An R package for identifying differentially expressed genes from RNA-seq data. Bioinformatics 2010, 26, 136–138. [Google Scholar] [CrossRef] [PubMed]
- Storey, J.D. The positive false discovery rate: A Bayesian interpretation and the q-value. Ann. Stat. 2003, 31, 2013–2035. [Google Scholar] [CrossRef]
- Iseli, C.; Jongeneel, C.V.; Bucher, P. ESTScan: A program for detecting, evaluating, and reconstructing potential coding regions in EST sequences. Proc. Int. Conf. Intell. Syst. Mol. Biol. 1999, 99, 138–148. [Google Scholar]
- Wu, H.J.; Ma, Y.K.; Chen, T.; Wang, M.; Wang, X.J. PsRobot: A web-based plant small RNA meta-analysis toolbox. Nucleic Acids Res. 2012, 40, W22–W28. [Google Scholar] [CrossRef] [PubMed]
- Dai, X.; Zhao, P.X. psRNATarget: A plant small RNA target analysis server. Nucleic Acids Res. 2011, 39, W155–W159. [Google Scholar] [CrossRef] [PubMed]
- He, K.; Guo, C. Effects of salt stress on SOD and POD activities in three bamboos. J. Jiangsu Forestryence Technol. 1995, 22, 11–14. [Google Scholar]
- Wan, L.; Wang, F.; Guo, X.; Lu, S.; Qiu, Z.; Zhao, Y.; Zhang, H.; Lin, J. Identification and characterization of small non-coding RNAs from Chinese fir by high throughput sequencing. BMC Plant Biol. 2012, 12, 146. [Google Scholar] [CrossRef] [PubMed]
- Hutvagner, G.; Simard, M.J. Argonaute proteins: Key players in RNA silencing. Nat. Rev. Mol. Cell Biol. 2008, 9, 22–32. [Google Scholar] [CrossRef] [PubMed]
- Wu, L.; Zhang, Q.; Zhou, H.; Ni, F.; Wu, X.; Qi, Y. Rice microRNA effector complexes and targets. Plant Cell 2009, 21, 3421–3435. [Google Scholar] [CrossRef] [PubMed]
- Crooks, G.E.; Hon, G.; Chandonia, J.M.; Brenner, S.E. WebLogo: A sequence logo generator. Genome Res. 2004, 14, 1188–1190. [Google Scholar] [CrossRef] [PubMed]
- Ernst, J.; Bar-Joseph, Z. STEM: A tool for the analysis of short time series gene expression data. BMC Bioinform. 2006, 7, 191. [Google Scholar] [CrossRef] [PubMed]
- Tian, T.; Liu, Y.; Yan, H.; You, Q.; Yi, X.; Du, Z.; Xu, W.; Su, Z. agriGO v2.0: A GO analysis toolkit for the agricultural community, 2017 update. Nucleic Acids Res. 2017, 45, W122–W129. [Google Scholar] [CrossRef] [PubMed]
- Shannon, P.; Markiel, A.; Ozier, O.; Baliga, N.S.; Wang, J.T.; Ramage, D.; Amin, N.; Schwikowski, B.; Ideker, T. Cytoscape: A software environment for integrated models of biomolecular interaction networks. Genome Res. 2003, 13, 2498–2504. [Google Scholar] [CrossRef] [PubMed]
- Yin, J.; Li, W.; Zhang, P.; Zhang, J.; Liu, L. Study on the salt resistance of conifer Tamarisk in hydroponic experiment. J. Tianjin Univ. Technol. 2016, 32, 42–45. [Google Scholar]
- Liu, K.; Deng, C.; Hao, J. Physiological response of Tamarix austromongolica to NaCl stress. Guangdong Agric. Sci. 2012, 10, 38–42. [Google Scholar]
- Hansen, K.D.; Wu, Z.; Irizarry, R.A.; Leek, J.T. Sequencing technology does not eliminate biological variability. Nat. Biotechnol. 2011, 29, 572–573. [Google Scholar] [CrossRef] [PubMed]
- Liu, Y.; Zhou, J.; White, K.P. RNA-seq differential expression studies: More sequence or more replication? Bioinformatics 2014, 30, 301–304. [Google Scholar] [CrossRef] [PubMed]
- Schurch, N.J.; Schofield, P.; Gierlinski, M.; Cole, C.; Sherstnev, A.; Singh, V.; Wrobel, N.; Gharbi, K.; Simpson, G.G.; Owen-Hughes, T.; et al. How many biological replicates are needed in an RNA-seq experiment and which differential expression tool should you use? RNA 2016, 22, 839–851. [Google Scholar] [CrossRef] [PubMed] [Green Version]
- Gierliński, M.; Cole, C.; Schofield, P.; Schurch, N.J.; Sherstnev, A. Statistical models for RNA-seq data derived from a two-condition 48-replicate experiment. Bioinformatics 2015, 31, 3625–3630. [Google Scholar] [CrossRef] [PubMed]
- Nagalakshmi, U.; Wang, Z.; Waern, K.; Shou, C.; Raha, D. The transcriptional landscape of the yeast genome defined by RNA sequencing. Science 2008, 320, 1344–1349. [Google Scholar] [CrossRef] [PubMed]
- McIntyre, L.M.; Lopiano, K.K.; Morse, A.M.; Amin, V.; Oberg, A.L.; Young, L.J.; Nuzhdin, S.V. RNA-seq: Technical variability and sampling. BMC Genom. 2011, 12, 293. [Google Scholar] [CrossRef] [PubMed]
- Wang, X.; Li, X.; Zhang, S.; Korpelainen, H.; Li, C. Physiological and transcriptional responses of two contrasting Populus clones to nitrogen stress. Tree Physiol. 2016, 36, 628–642. [Google Scholar] [CrossRef] [PubMed]
- Rhoades, M.W.; Reinhart, B.J.; Lim, L.P.; Burge, C.B.; Bartel, B.; Bartel, D.P. Prediction of plant microRNA targets. Cell 2002, 110, 513–520. [Google Scholar] [CrossRef]
- Hwang, E.; Shin, S.; Yu, B.; Byun, M.; Kwon, H. miR171 family members are involved in drought response in Solanum tuberosum. J. Plant Biol. 2011, 54, 43–48. [Google Scholar] [CrossRef]
- Llave, C.; Xie, Z.; Kasschau, K.D.; Carrington, J.C. Cleavage of Scarecrow-like mRNA targets directed by a class of Arabidopsis miRNA. Science 2002, 297, 2053–2056. [Google Scholar] [CrossRef] [PubMed]
- Breakfield, N.W.; Corcoran, D.L.; Petricka, J.J.; Shen, J.; Sae-Seaw, J.; Rubio-Somoza, I.; Weigel, D.; Ohler, U.; Benfey, P.N. High-resolution experimental and computational profiling of tissue-specific known and novel miRNAs in Arabidopsis. Genome Res. 2012, 22, 163–176. [Google Scholar] [CrossRef] [PubMed]
- Feng, H.; Duan, X.; Zhang, Q.; Li, X.; Wang, B.; Huang, L.; Wang, X.; Kang, Z. The target gene of tae-miR164, a novel NAC transcription factor from the NAM subfamily, negatively regulates resistance of wheat to stripe rust. Mol. Plant Pathol. 2014, 15, 284–296. [Google Scholar] [CrossRef]
- Chen, X.; Chen, Z.; Zhao, H.; Zhao, Y.; Cheng, B.; Xiang, Y. Genome-wide analysis of soybean HD-Zip gene family and expression profiling under salinity and drought treatments. PLoS ONE 2014, 9, e87156. [Google Scholar] [CrossRef] [PubMed]
- Fujita, Y.; Fujita, M.; Shinozaki, K.; Yamaguchi-Shinozaki, K. ABA-mediated transcriptional regulation in response to osmotic stress in plants. J. Plant Res. 2011, 124, 509–525. [Google Scholar] [CrossRef] [PubMed]
- Lyzenga, W.J.; Stone, S.L. Abiotic stress tolerance mediated by protein ubiquitination. J. Exp. Bot. 2012, 63, 599–616. [Google Scholar] [CrossRef] [PubMed]
- Rodriguez-Vargas, S.; Sanchez-Garcia, A.; Martinez-Rivas, J.M.; Prieto, J.A.; Randez-Gil, F. Fluidization of membrane lipids enhances the tolerance of Saccharomyces cerevisiae to freezing and salt stress. Appl. Environ. Microb. 2006, 73, 110–116. [Google Scholar] [CrossRef] [PubMed]
- Zhang, J.; Liu, H.; Sun, J.; Li, B.; Zhu, Q.; Chen, S.; Zhang, H. Arabidopsis fatty acid desaturase FAD2 is required for salt tolerance during seed germination and early seedling growth. PLoS ONE 2012, 7, e30355. [Google Scholar] [CrossRef] [PubMed]
Figure 1.
POD enzyme activity dynamic changes under salt stress. The x-axis represents the NaCl treatment time and y-axis represents the peroxidase (POD) activity.
Figure 1.
POD enzyme activity dynamic changes under salt stress. The x-axis represents the NaCl treatment time and y-axis represents the peroxidase (POD) activity.
Figure 2.
Size distribution of small RNAs of the six libraries. The x-axis represents sequence lengths. The y-axis represents the number of unique reads (unique small RNAs). The six libraries are distinguished by different colors. IC, I-0.5h, I-1h: control group, salt treatment 0.5 h, salt treatment 1 h of one-month-old plants; IIC, II-0.5h, II-1h: control group, salt treatment 0.5 h, salt treatment 1 h of two-month-old plants.
Figure 3.
Sequence characteristics of miRNAs. (a) The nucleotide bias of miRNAs. The distributions of four bases are illustrated with different colored columns. The x-axis represents miRNA nucleotides from 5′ to 3′. The y-axis represents the percentage. (b) The nucleotide conservation of miRNAs. The nucleotide conservation is indicated by the overall height of the stack of symbols, while the height of symbols within the stack indicates the relative frequencies of each nucleotide (U, A, C, or G). The x-axis represents miRNA nucleotides from 5′ to 3′. The y-axis represents the conservation bits. The graphics were made using WebLogo [47].
Figure 4.
The density distribution profiles of miRNAs. Libraries of each group (I,II) are presented with different colors. The x-axis represents the log10 (TPM + 1). The y-axis represents the probability value of the TPM distribution. TPM: transcript per million; Group I: one-month-old plants; Group II: two-month-old plants. IC, I-0.5h, I-1h: control group, salt treatment 0.5 h, salt treatment 1 h of Group I; IIC, II-0.5h, II-1h: control group, salt treatment 0.5 h, salt treatment 1 h of Group II.
Figure 5.
Time-course expression and validation of miRNAs. Short Time-series Expression Miner (STEM) [48] analysis of (a) Group I and (b) Group II. Group I: one-month-old plants; Group II: two-month-old plants. The cluster ID and the number of miRNAs assigned to the corresponding cluster are indicated by the two figures at the upper- and lower-left corner, respectively. Each STEM profile is made up of ten miRNAs clusters sorted in decreasing order of miRNAs number. In every cluster, the x-axis represents the time series of 0, 0.5 and 1 h and the y-axis represents relative expression level with log normalization. The black line represents the model profile and the red lines represent individual miRNA expression profiles. Besides, the background color indicates corresponding clusters were statistically significantly enriched based on permutation test. The colored profiles had a statistically significant number of genes assigned. Non-white profiles of the same color represent profiles grouped into a single cluster. (c) Comparisons of the profiles between sRNA-seq and qRT-PCR. Ten miRNAs were randomly selected from corresponding clusters of STEM profiles. The x-axis represents six small RNA libraries and the y-axis represents relative expression level of log normalization (log2). Blue and red lines represent expression profiles of high throughput sequencing and qPCR, respectively. The error bars of qRT-PCR technical replicates are represented in I—shaped lines. (d) Pearson correlation analysis between qPCR and high throughput sequencing data. The correlation coefficient is 0.5084 (p = 0.000808).
Figure 6.
The differentially expressed miRNAs. (a) Venn diagram of Group I vs. II comparison. (b,c) Venn diagram of three comparisons in Groups I and II. (d,e) Heatmaps of Group I and II. The log2 [fold change] is demonstrated in the corresponding color gradation. Group I: one-month-old plants; Group II: two-month-old plants. IC, I-0.5h, I-1h: control group, salt treatment 0.5 h, salt treatment 1 h of Group I; IIC, I-0.5h, II-0.5h, II-1h: control group, salt treatment 0.5 h, salt treatment 1 h of Group II.
Figure 7.
Directed acyclic hierarchical graph (DAG) of enriched GO terms. (a) DAG of enriched GO terms in Cellular Component; (b) DAG of enriched GO terms in Molecular Function. The DAG shows the GO structural networks, which are represented by boxes with GO numbers and names in the first and second lines, respectively. The third line of each box represents the numbers of targets associated with the given GO term, the enriched targets, the Unigenes associated with the given GO term and all the enriched Unigenes. The color gradation represents the enrichment significance level which is corresponding to Q value (the number in brackets) based on multiple testing correction of p value [39]. Relationship types of terms are represented with colored arrows.
Figure 8.
MicroRNA regulatory network. The colors of nodes, based on the color gradation, represent differential expression’s false discovery rate (FDR) between 0–0.005 (scale in the top right, the lower the value the more accurate the data). The miRNAs are represented with circle nodes. Transcription factors are represented with hexagon nodes, other genes with rectangle nodes. The edges represent the putative regulation styles. Cleavage (prediction) is represented by solid lines with “T” arrow, inhibition (prediction) by solid lines with circle arrow. Interactions between proteins (prediction) are represented with dotted lines. Up-regulation is represented with red labels, down-regulation with blue labels.

Table 1.
The samples and treatments in the study.
| Samples ID | Tissue | Age | Treatment |
|---|---|---|---|
| IC | primary roots from cuttings of different age | Group I: One-month-old cuttings | water for 1 h, control group |
| I-0.5h | 2% salt for 0.5 h | ||
| I-1h | 2% salt for 1 h | ||
| IIC | Group II: Two-month-old cuttings | Water for 1 h, control group | |
| II-0.5h | 2% salt for 0.5 h | ||
| II-1h | 2% salt for 1 h |
Table 2.
Small RNA annotation and reads number.
| Small RNA Library | Roots of 2% NaCl Treated Cuttings | Type of Analysis | |||||
|---|---|---|---|---|---|---|---|
| Group I | Group II | ||||||
| IC | I-0.5h | I-1h | IIC | II-0.5h | II-1h | ||
| Clean reads | 20,304,895 (1.038 G) | 12,017,139 (0.626 G) | 27,490,082 (1.426 G) | 21,379,294 (1.093 G) | 24,151,563 (1.231 G) | 23,758,579 (1.215 G) | Deep sequencing |
| Clean reads of small RNA | 12,268,690 | 7,656,408 | 15,286,485 | 12,991,605 | 14,999,466 | 14,327,078 | Length selection |
| Mapped small RNA reads | 8,450,784 (68.88%) | 3,535,105 (46.17%) | 6,984,424 (45.69%) | 7,002,413 (53.9%) | 8,045,446 (53.64%) | 7,872,758 (54.95%) | Map to reference |
| rRNA and tRNA | 1,531,042 (18.12%) | 631,272 (17.86%) | 1,352,577 (19.37%) | 1,242,869 (17.75%) | 1,378,558 (17.13%) | 1,294,286 (16.44%) | BLAST |
| snRNA and snoRNA | 30,146 (0.36%) | 9131 (0.26%) | 23,888 (0.34%) | 23,057 (0.33%) | 37,014 (0.46%) | 22,183 (0.28%) | |
| Conserved miRNA reads | 41,979 (0.50%) | 29,239 (0.83%) | 31,756 (0.45%) | 100,486 (1.44%) | 57,517 (0.71%) | 45,494 (0.58%) | BLAST |
| Conserved unique miRNA | 180 | 158 | 167 | 207 | 187 | 170 | |
| Novel miRNA reads | 609 (0.01%) | 491 (0.01%) | 522 (0.01%) | 1282 (0.02%) | 848 (0.01%) | 642 (0.01%) | Prediction |
| Novel miRNA | 12 | 12 | 14 | 15 | 13 | 14 | |
Group I: one-month-old plants; Group II: two-month-old plants; IC, I-0.5h, I-1h: control group, salt treatment 0.5 h, salt treatment 1 h of Group I; IIC, II-0.5h, II-1h: control group, salt treatment 0.5 h, salt treatment 1 h of Group II. The percentage of Mapped small RNA reads is the ratio of (Mapped small RNA reads/Clean reads of small RNA). The other percentages are ratio of (corresponding reads/Mapped small RNA reads).
Table 3.
MicroRNA numbers and percentages in different TPM intervals.
| TPM Interval | IC | IIC | I-0.5h | II-0.5h | I-1h | II-1h | Mean |
|---|---|---|---|---|---|---|---|
| 0–15 | 128 (47.58%) | 109 (40.52%) | 125 (46.47%) | 125 (46.47%) | 128 (47.58%) | 118 (42.87%) | 122 (45.41%) |
| 15–60 | 28 (10.41%) | 43 (15.99%) | 30 (11.15%) | 30 (11.15%) | 35 (13.01%) | 43 (15.99%) | 35 (12.95%) |
| >60 | 113 (42.01%) | 117 (43.49%) | 114 (42.38%) | 114 (42.38%) | 106 (39.41%) | 108 (40.15%) | 112 (41.64) |
IC, I-0.5h, I-1h: control group, salt treatment 0.5 h, salt treatment 1 h of one-month-old plants; IIC, II-0.5h, II-1h: control group, salt treatment 0.5 h, salt treatment 1 h of two-month-old plants. TPM, transcripts per million.
© 2018 by the authors. Licensee MDPI, Basel, Switzerland. This article is an open access article distributed under the terms and conditions of the Creative Commons Attribution (CC BY) license (http://creativecommons.org/licenses/by/4.0/).
Share and Cite
MDPI and ACS Style
Wang, J.; Xu, M.; Li, Z.; Ye, Y.; Rong, H.; Xu, L.-a. Tamarix microRNA Profiling Reveals New Insight into Salt Tolerance. Forests 2018, 9, 180. https://doi.org/10.3390/f9040180
AMA Style
Wang J, Xu M, Li Z, Ye Y, Rong H, Xu L-a. Tamarix microRNA Profiling Reveals New Insight into Salt Tolerance. Forests. 2018; 9(4):180. https://doi.org/10.3390/f9040180
Chicago/Turabian StyleWang, Jianwen, Meng Xu, Zhiting Li, Youju Ye, Hao Rong, and Li-an Xu. 2018. "Tamarix microRNA Profiling Reveals New Insight into Salt Tolerance" Forests 9, no. 4: 180. https://doi.org/10.3390/f9040180
Note that from the first issue of 2016, this journal uses article numbers instead of page numbers. See further details here.