Article

Comparative Analysis of the Effects of Stem Height and Artificial Pruning on Seasonal Radial Growth Dynamics of Wild Cherry (Prunus avium L.) and Sycamore (Acer pseudoplatanus L.) in a Widely Spaced System

by
Lars Sprengel
*,
Dominik Florian Stangler
,
Jonathan Sheppard
,
Christopher Morhart
and
Heinrich Spiecker
Chair of Forest Growth and Dendroecology, Albert-Ludwigs-University Freiburg, Tennenbacher Str. 4, 79106 Freiburg, Germany
*
Author to whom correspondence should be addressed.
Forests 2018, 9(4), 174; https://doi.org/10.3390/f9040174
Submission received: 26 February 2018 / Revised: 19 March 2018 / Accepted: 27 March 2018 / Published: 29 March 2018
(This article belongs to the Section Forest Ecology and Management)

Abstract

:
Intensive artificial pruning of trees increases the proportion of high-value timber but simultaneously reduces the crown and consequently the capacity to assimilate photosynthates. Here, midterm effects of two intensive pruning treatments, a classical and a selective approach, on radial growth dynamics at different stem heights is comparatively analyzed for the broadleaved tree species sycamore (Acer pseudoplatanus L.) and wild cherry (Prunus avium L.) at a site in the upper Rhine valley in southwest Germany using high-resolution point-dendrometers starting three years after pruning. We fitted shape-constrained additive models to the dendrometer data and derived estimates of growth phenology and performance of individual trees over the 2010–2016 observation period. The statistical analysis based on linear mixed-effects models showed significantly later growth cessation and in individual years also higher rates of radial growth in sycamore compared to wild cherry. Growth onset for both tree species initiated systematically earlier at the higher dendrometer location compared to breast height. While no main effects of treatment or interactions of treatment with year were detected, we found significantly higher average daily growth rates and annual radial growth of wild cherry at the top dendrometer location compared to breast height in the selective pruning treatment. Our results provide new insights into seasonal growth patterns of sycamore and wild cherry in a widely spaced system and contribute to a better understanding of the effects of stem height, pruning treatment and climate on radial growth dynamics of valuable broadleaved tree species.

1. Introduction

The demand for high-value timber in Europe is predicted to increase in the near future, alongside the increased demand for all other woody products [1]. It is suggested that the demand for high-value timber derived from broadleaved tree species has already risen to the extent that supply can no longer meet demand [2]. Meanwhile, climate change predictions advise that mean annual air temperature will rise and that forest health is at risk, especially when forests consist of non-site-adapted and drought-intolerant tree species [3].
A rising demand for wood can be partially satisfied by planting and growing trees outside of forests in widely spaced systems. Targeted silvicultural treatments must be applied to trees cultivated in these systems in order to attain a high-quality product. Sycamore (Acer pseudoplatanus L.) and wild cherry (Prunus avium L.) do not self-prune well under these conditions and the amount of high-value timber for both species can consequently be increased by applying artificial pruning [4,5]. Such treatments incorporating a wide spacing between trees may be an option to increase the share of high-value timber of the crop trees.
Pruning is often a necessary treatment for the production of valuable timber, as production goals for such a product often stipulate branch-free log lengths of 4 to 15 m with mean mid under-bark diameters greater than 40 cm and with a knotty core of less than 10 cm in diameter [6]. When considering the highest quality logs, veneer production aims to use all wood outside a knotty core [7].
Pruning treatments applied to the study trees are a classical pruning treatment and a selective pruning treatment [8]. Springmann et al. [5] have studied the effect of these two pruning treatments on tree growth and secondary shoot development of wild cherry for the two years after pruning and found that diameter growth of intensively whorl-wise pruned trees was reduced in the year of and the first year after pruning. This was not the case for wild cherry trees treated with the intensive selective pruning treatment. Kupka [9] found in his study on growth response of young wild cherry trees to pruning that within a 5-year period after pruning tree diameter growth was reduced by one third when three quarters of the crown were removed and reduced by 10% with the removal of half of the crown [9]. Bulfin and Radford [10] also found in their study with regard to early formative shaping of newly planted broadleaved trees that the reduction in diameter growth of shaped sycamore and wild cherry trees was highly significant. This contradicts Kerr and Morgan [11], who found in their study on formative pruning on broadleaved trees that pruning on wild cherry had no effect on diameter growth up until 6 years after pruning. A study from Balandier [12] on consecutive annual pruning of young sycamore and wild cherry trees in agroforestry systems also showed no differences in stem diameter between pruned and un-pruned trees.
Growth monitoring with precision dendrometers is a well-established technique to study effects of weather, climate or forest management on high-resolution dynamics of radial stem growth [13,14,15]. This approach enables a more detailed understanding of the tree response to changeable and non-changeable environmental conditions, as well as investigation of the effects of silvicultural treatments, such as artificial pruning on secondary growth.
Radial displacement of trees has two distinguishable physiological causes: Radial growth processes and diurnal fluctuations due to swelling and shrinking of non-lignified extensible tissues mostly located in the phloem and bark, which are driven by the interrelationship of water uptake by the roots and transpirational losses by the leaves [16,17,18,19]. Radial growth is predominantly controlled by cambial cell divisions and xylem cell enlargement [20]. Cambial activity and cell differentiation processes in hardwoods in central Europe are limited to the growing season that starts in spring and ends in autumn [17]. During secondary growth the diurnal fluctuations may overlay the actual growth dynamics, especially if individual trees have low growth rates [16,21].
The impacts of artificial pruning on high-resolution radial growth dynamics are generally not well understood. Seasonal growth dynamics of sycamore and wild cherry and their control by environmental conditions have only been studied rudimentarily so far [22]. In addition, tree growth analyses focusing on breast height exclusively, might not accurately reflect tree and stand performance and aboveground carbon allocation patterns [23,24]. Van der Maaten-Theunissen and Bouriaud [24] found that on eight different study sites in southwestern Germany no clear patterns of average ring-area increment between different stem heights for silver fir (Abies alba Mill.) and Norway spruce (Picea abies (L.) H.Karst.) were evident. Bouriaud et al. [23] also found no clear trends of increasing or decreasing ring-width with increasing stem height for European beech (Fagus sylvatica L.) in eastern France. Spiecker [7] found in a study about radial growth and natural pruning of sessile and pedunculate oaks (Quercus petraea (Matt.) Liebl. and Q. robur L.) that radial growth at different stem heights is influenced by the competition with neighboring trees: Radial growth at breast height increases more strongly compared to radial growth at 5 m and 10 m stem height if trees are released, but is especially low for dominated trees compared to radial growth in 5-m and 10-m stem height. For lodgepole pine (Pinus contorta Dougl.) in Canada, Chhin et al. [25] found that growth at lower stem sections was mainly driven by climatic conditions prior to the growing season, whereas growth at higher stem sections was more related to climatic conditions during the growing season. Furthermore, comparisons of daily growth rates and tree-ring phenology in different tree compartments have only been performed in a limited amount of studies so far and information on the variability of high-resolution growth dynamics along the stem axis of sycamore and wild cherry is still lacking [26,27,28,29,30].
This study contributes a comparative analysis of the effects of artificial pruning on radial growth phenology (growth onset, growth cessation, duration of growth and day of the maximum growth rate) and performance (seasonal maximum growth rate, average daily growth rate and annual radial growth) based on a long-term dendrometer time series from 2010 to 2016 in different stem heights of sycamore and of wild cherry.
It is hypothesized that:
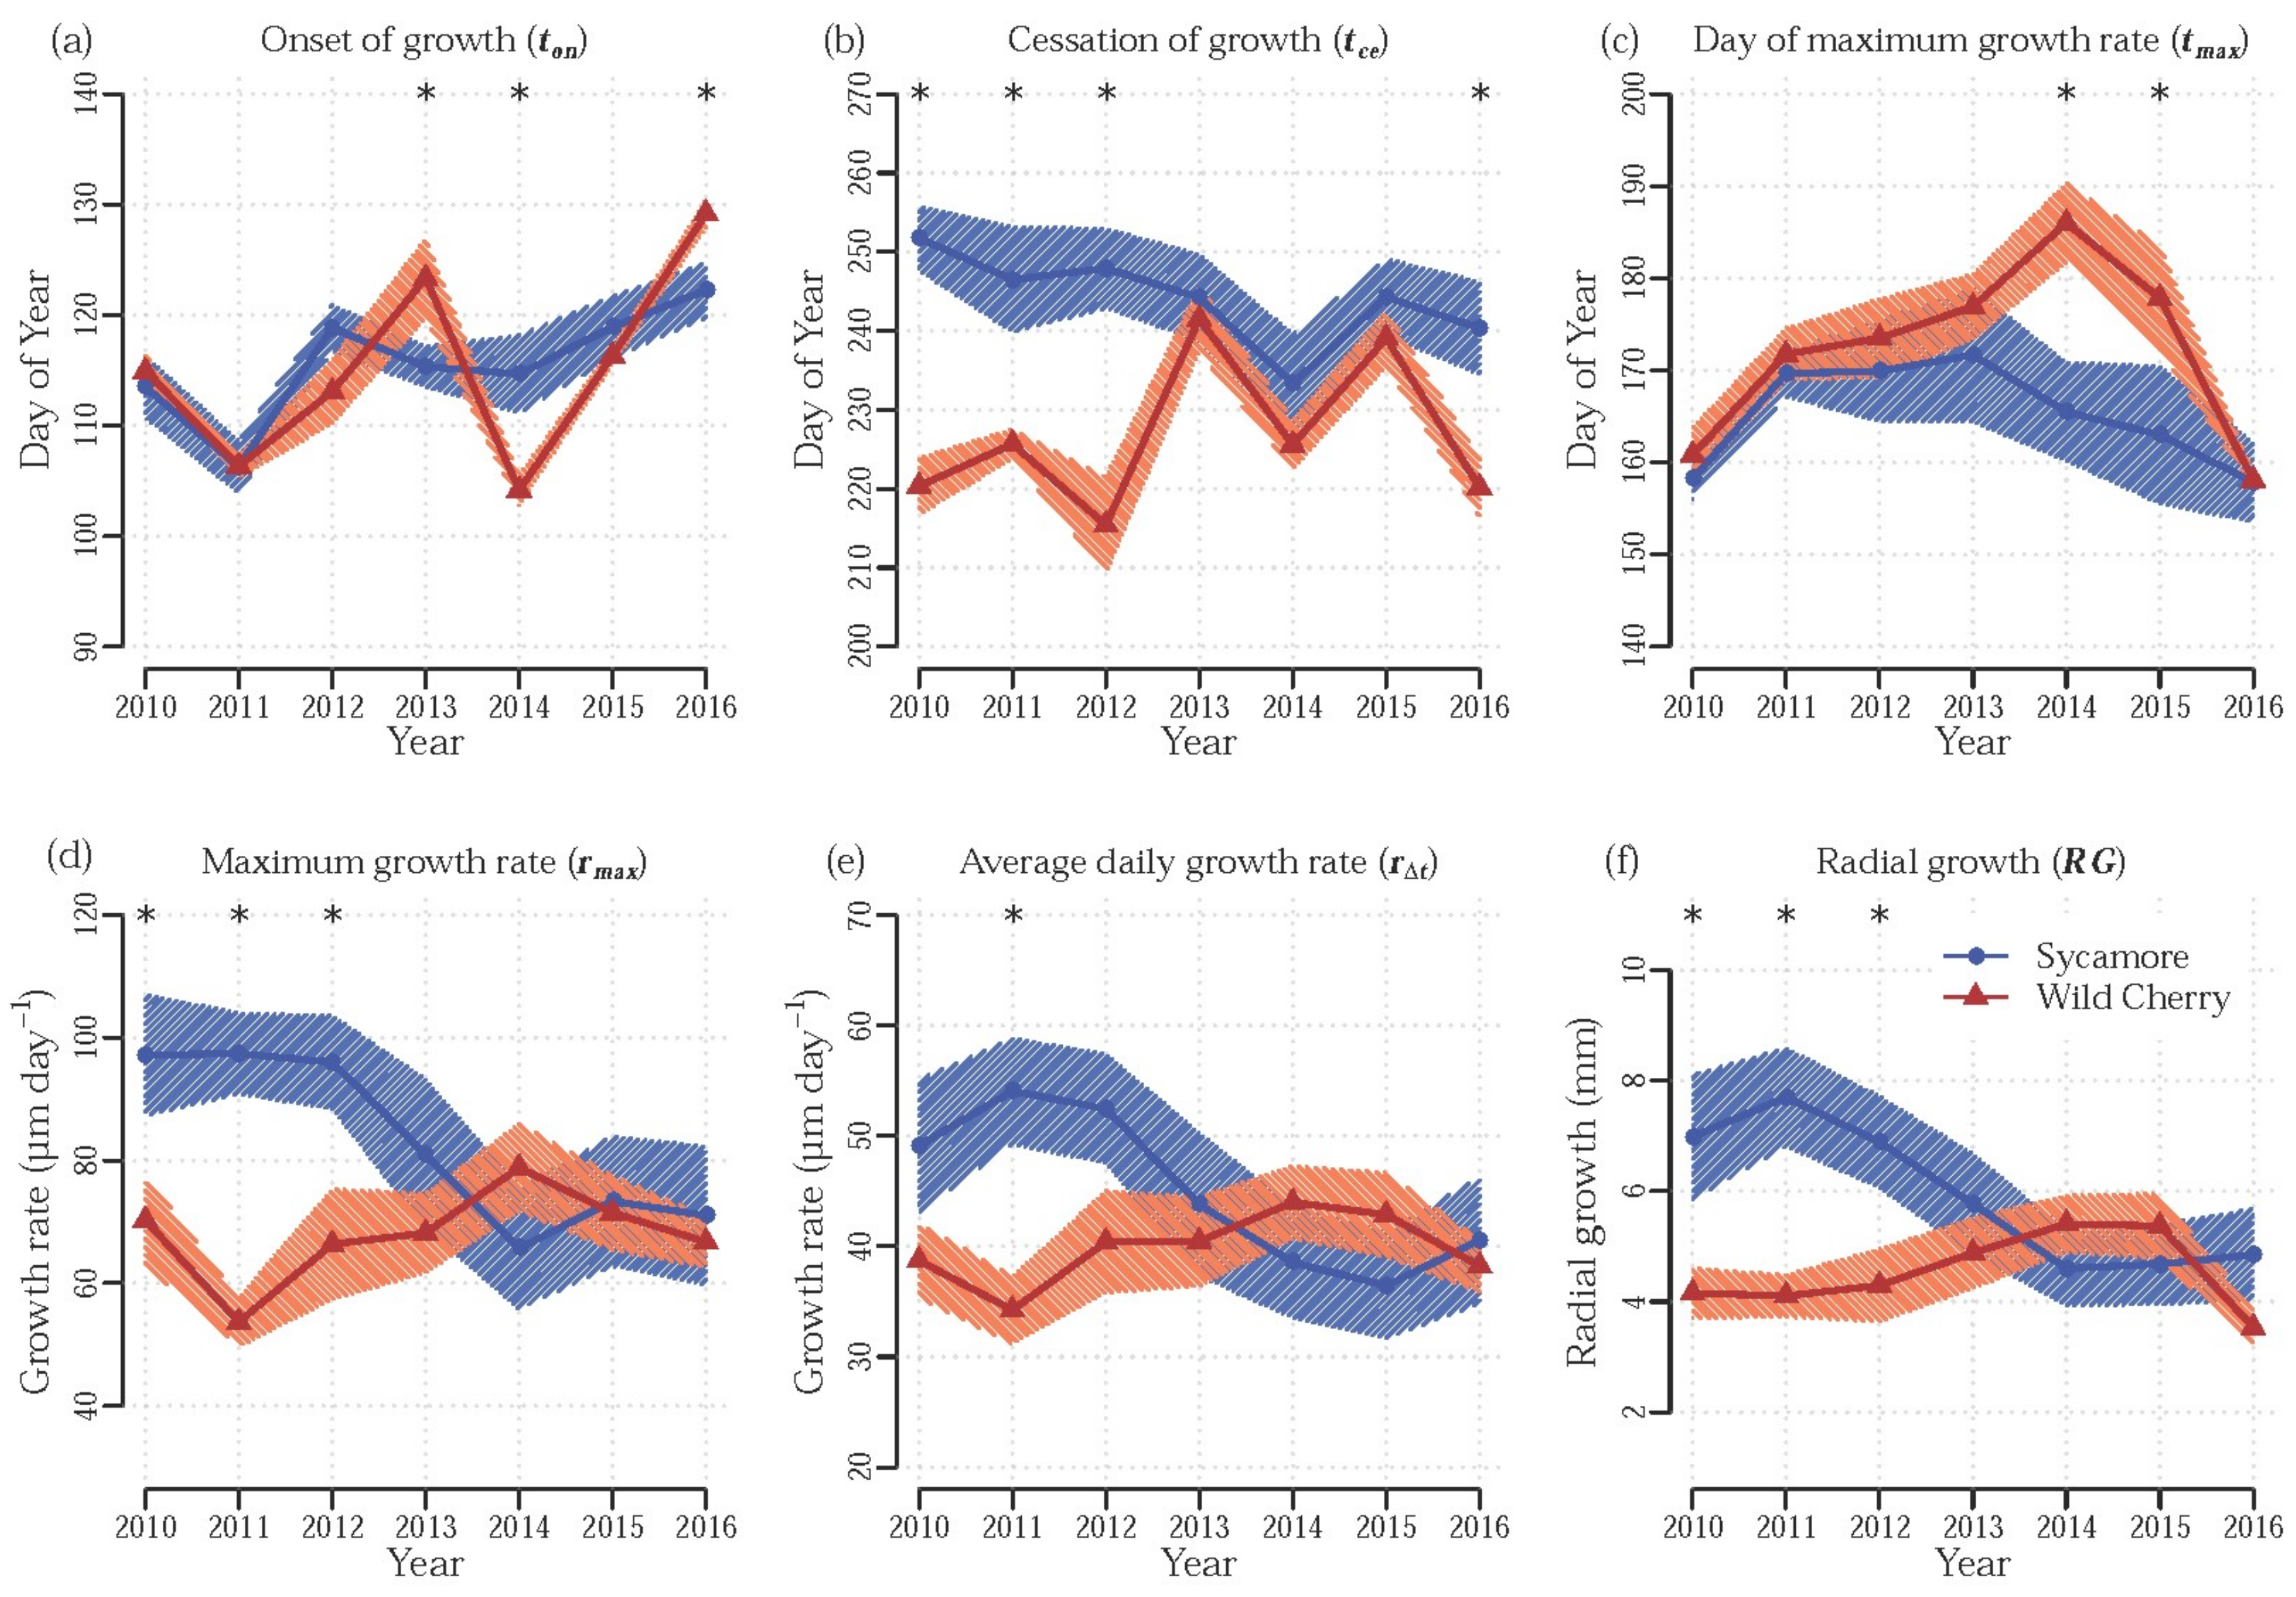
  • Between tree species there are no differences in growth phenology and seasonal growth patterns [22]. Based on findings of previous studies [20,31], we assume the day of the maximum growth rate to be controlled by the photoperiod cycle and to occur approximately at the time of summer solstice with no differences between treatments and stem locations.
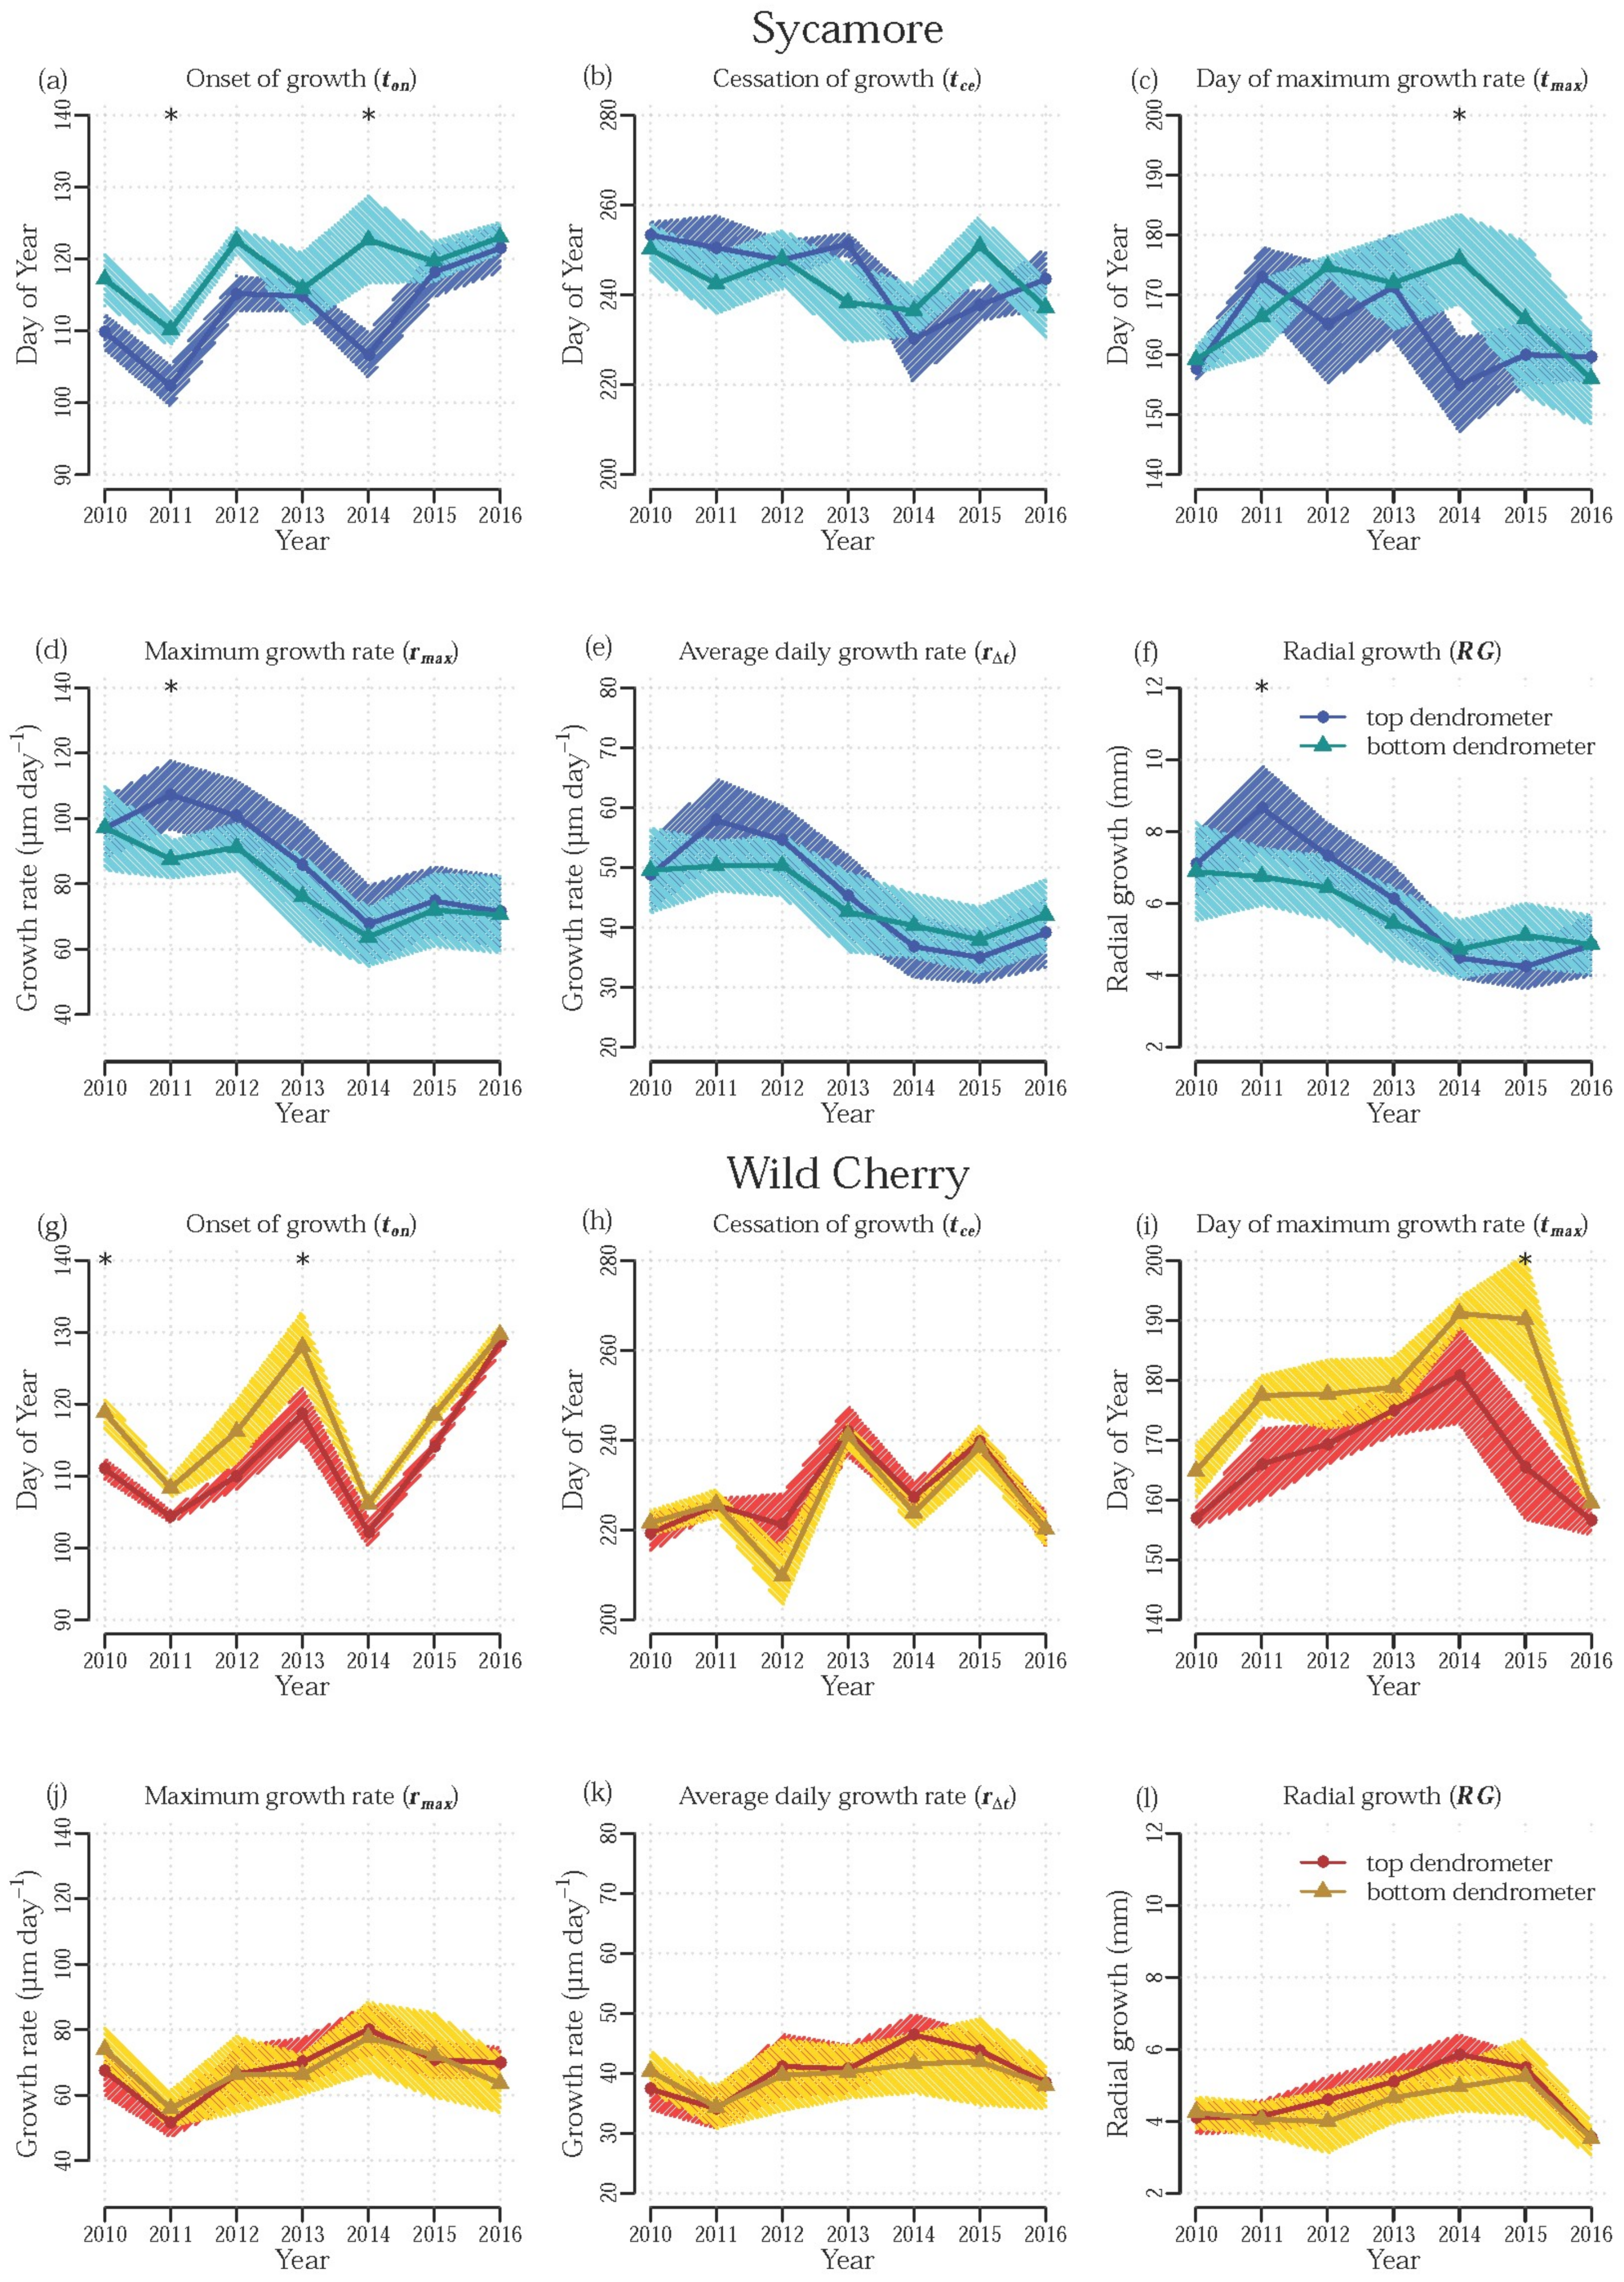
  • Between the two stem locations there is no clear difference in annual radial growth [23,24]. Growth onset occurs earlier at higher locations of the stem due to an earlier allocation of auxin and photosynthetic assimilates to areas of the stem closer to the leaves [26] and therefore growth duration is longer at higher locations of the stem.
  • Between pruning treatments there is a difference in annual radial growth due to the reduction of leaf mass in the crown of pruned trees, resulting in a temporarily reduced photosynthetic capacity leading to a lessened rate of biomass accumulation [8]. Therefore, we expect that the annual radial growth is smaller compared to un-pruned trees. The reduced growth rates after pruning treatment will also be reflected in a later growth onset and/or earlier growth cessation, as several studies found positive correlations between radial growth and the duration of cell production and cell enlargement [27,32,33,34]. The effect of pruning on growth dynamics also varies between the upper and the lower location of the stem [5].

2. Materials and Methods

2.1. Study Area and Experimental Setup

The research site is located close to the town of Breisach in the Upper Rhine Valley, South-West Germany (48°04′12″ N, 7°35′20″ E, ~180 m a.s.l.). During the baseline climate period 1981–2010, the mean annual precipitation sum was 658 mm, of which 357 mm fell between May and September (1 km × 1 km grid data of daily precipitation sums provided by the German National Meteorological Service, DWD). As gridded data for temperature were not available for the region, we used the data of the climate station Emmendingen-Mundingen (48°08′17″ N, 7°50′06″ E, 201 m a.s.l.), ~20 km east of the research site. Mean annual air temperature during the baseline climate period was 10.2 ℃ and mean temperature between May and September was 16.8 ℃.
For a more detailed characterization of the climatic conditions during the observation period, Figure 1 shows monthly values of mean air temperature (a), mean relative humidity (b), sum of precipitation (c) and mean available water capacity (d) for each year of the experiment as a deviation of the monthly mean values of the baseline climate period 1981–2010. It can be seen that especially in July and August 2015, the mean air temperature values were extremely high (Figure 1a). While in several years, unusual high average monthly mean values of relative humidity were observed, in June 2014 and July 2015 the research area experienced a high vapor-pressure deficit (Figure 1b). Dry spring conditions, indicated by very little precipitation and low soil water content, were identified in 2011 and 2014 (Figure 1c,d). While August 2010 and July 2014 had extraordinarily high amounts of precipitation, rainfall was particularly low in July 2015 and 2016. From July to December 2015 available water capacity was exceptionally low, which was also the case between September and December 2016 (Figure 1d).
Due to the vicinity of the river Rhine, the ground water table is high, at approximately 1 m below surface [36]. The soil is composed of silt, clay and loam and can be classified as a luvisol [5,37]. Nutrient availability can be regarded as optimal due to the former use as agricultural land [5].
Trees were planted in rows with 1.5 m spacing between trees and 7.5 m between rows. As single trees have been removed in the framework of management operations since the initial setup, spaces between trees vary. Trees were 2 to 3 years old when planted in 1997, being between 1.2 and 1.5 m tall at that time, and were all of local origin.
Stem radial displacement data have been recorded during the years 2010–2016 utilizing high-resolution point-dendrometers, which are based on a linear displacement transducer (Trans-Tek Inc., Ellington, CT, USA) (Figure 2). The measurement interval was set to one measurement every 5 min and from April 2016 onwards changed to one measurement every 15 min. All dendrometers are connected to a central data logger station (23X, Campbell Scientific, Logan, UT, USA).
Of each of the two tree species, six trees were equipped with two dendrometers on the north-facing side of the stem, one at 1.3 m above ground/at breast height and the second one below the third node from the top (at ~5 m above ground). All trees are part of a pruning experiment testing different pruning methods and intensities already described in detail by Springmann et al. [5]. Among the six trees of each species, two had been pruned applying an intensive classical pruning treatment (Classical Treatment), leaving only the 3 top nodes and removing all other branches, two had been pruned applying an intensive selective pruning treatment (Selective Treatment) removing all branches with a diameter of >2 cm and/or a branch angle of <40°, and two were not pruned in order to have a control group (Control) (Figure 2). Pruning took place in summer 2007. A more detailed description of all the trees that are part of this study is shown in Table 1.

2.2. Data Analysis and Statistical Methods

All statistical methods and data analyses were computed in the R programming environment using the Graphical User Interface R Studio [38,39]. To perform comparative analyses of seasonal radial growth dynamics, estimates for growth phenology (i.e., onset of growth (ton), cessation of growth (tce), duration of growth (∆t) and day of maximum growth rate (tmax)) and performance (i.e., seasonal maximum daily growth rate (rmax), average daily growth rate (rt) and annual radial growth (RG)) were determined. For this purpose, we extracted the irreversible radial growth component of the raw data of stem radial displacement measurements by fitting generalized additive models with monotonically increasing shape constraints (SCAM: shape constrained additive model) using the scam package [40,41]. We used the modelling efficiency as a statistic similar to the coefficient of determination to quantify the goodness of fit of our non-linear regression models [42]. In addition, we calculated the mean absolute error to assess the mean absolute difference between model predictions and stem radial displacement data in the units of the response (i.e., micrometers). The mean absolute percentage error quantifies the model accuracy independent from the scale of the response variable [42,43]. With averages of above 0.99, the modelling efficiency substantiated very high predictive power of the fitted SCAM for both tree species and all treatments (Table 2). Mean absolute errors and mean absolute percentage errors were in average higher in wild cherry than in sycamore. Mean absolute percentage errors of <0.6% for sycamore and <1.7% for wild cherry showed in general low relative differences between simulated values of the SCAM and dendrometer data.
In Central Europe secondary growth has a distinct seasonal pattern and generally starts during spring and ends in autumn [17]. However, in comparison to the pinning method or microcore sampling, dendrometer data do not provide empirical information to detect onset and cessation of cambial cell divisions and radial cell enlargement [44]. In order to estimate ton, tce and ∆t, a subjective threshold of the daily rate of radial growth or accumulated growth at a given point of time needs to be defined [13,45]. We followed the approach of Duchesne et al. [14], where ton and tce are defined as the days of the year when the first derivative of the SCAM (SCAM’) was irreversibly rising above or falling below the threshold of 5 µm day−1 in spring and autumn, respectively. In comparison to static properties of deterministic models such as the Weibull or Gompertz function [15,46], the more flexible SCAM have superior abilities to capture the partly complex patterns of intra-annual growth dynamics [41,43]. SCAM can be fitted easily to bimodal seasonal growth patterns, where for short periods of time during the growing season SCAM’ might sink below the defined threshold as a result of temporary growth depressions. However, in some cases SCAM might also detect false bimodal seasonal growth patterns, where SCAM’ does temporarily rise above the defined threshold in spring or autumn as a mere result of fluctuations or rehydrations in stem water status. In general, our individual dendrometer time series were characterized by clear unimodal growth patterns (Figure A1). In case the SCAM’ displayed bimodal characteristics, we defined both modes to be controlled by growth processes if the proportion of the cumulative increment of the smaller mode in relation to the cumulative increment of the larger mode was at least 5% (Figure A2). In case the proportion was lower than 5%, we regarded the smaller mode to be triggered by fluctuations in stem water status exclusively (Figure A3). ∆t was calculated as tceton, rmax represents the growth rate at tmax, RG is the accumulated growth between ton and tce, and rt was calculated as RG/∆t.
Seasonal growth response was analyzed by using linear mixed-effects models (LMEMs), which are in particular useful for repeated measurement data with sporadically missing values. The LMEMs were calculated using the lmer function of the package lme4 [47]. With support of the lmerTest package, ANOVA (analysis of variance) tables with p-values and F-statistics were calculated [48].
The linear mixed-effects model was formulated as follows:
y i , j , k , l , m = µ + S i + T j + L k + Y l + ( S × T ) i , j + ( S × L ) i , k + ( T × L ) j , k + ( S × Y ) i , l + ( T × Y ) j , l + ( L × Y ) k , l + ( S × T × L ) i , j , k + ( S × T × Y ) i , j , l + ( S × L × Y ) i , k , l + ( T × L × Y ) j , k , l + ( S × T × L × Y ) i , j , k , l + I m + ε i , j , k , l , m
where y i , j , k , l , m denotes the response variable, µ is the general experimental mean, S i is the fixed effect S of the tree species i (wild cherry or sycamore maple), T j is the fixed effect T of the treatment j (control, classical or selective pruning), L k is the fixed effect L of the dendrometer location k (top or bottom), Y l is the fixed effect Y of the Year l ; ( S × T ) i , j , ( S × L ) i , k , ( T × L ) j , k , ( S × Y ) i , l , ( T × Y ) j , l , ( L × Y ) k , l , ( S × T × L ) i , j , k , ( S × T × Y ) i , j , l , ( S × L × Y ) i , k , l , ( T × L × Y ) j , k , l and ( S × T × L × Y ) i , j , k , l are the interaction terms, I denotes the random effect of the individual tree m and ε i , j , k , l , m , . represents the residual error term.
Post hoc tests were performed to test for significant differences between tree species within years averaged over dendrometer locations using the function lsmeans of the package lsmeans [49]. As higher ranking interaction terms from the model formulation would have produced potentially misleading results, the post hoc tests were performed based on the model as described above, while changing treatment ( T ) and location ( L ) from fixed to random effects. Additional pairwise comparisons were conducted between locations within years separated by tree species. In this case, the model was modified by changing treatment ( T ) from fixed to random effect. Finally, we also conducted pairwise comparisons between locations within treatments separated by tree species and averaged over years. In this case, the model above was modified by changing year ( Y ) from a fixed to a random effect.

3. Results

3.1. Effect of Tree Species

While being rather identical in April and July, the rate of radial growth of sycamore was higher than in wild cherry for most weeks in May and June (Figure 3a). However, in August and September, radial growth rates of sycamore were consistently higher in comparison to wild cherry. While wild cherry had a rather normally distributed seasonal growth pattern averaged over the complete observation period, the pattern of sycamore had a distinct right-skewed shape.
Pairwise comparisons between the two tree species within each year showed a delayed growth onset (ton) for wild cherry compared to sycamore in 2013 (DOY (day of year) 123 vs. DOY 115; p < 0.05) and again in 2016 (DOY 129 vs. DOY 122; p < 0.05). In contrast, ton in 2014 occurred significantly earlier in wild cherry at DOY 104 compared to DOY 115 of sycamore (p < 0.01) (Figure 4a). Growth cessation (tce) took place later for sycamore in all of the investigated years with the differences being significant in 2010 (p < 0.001), 2011 (p < 0.01), 2012 (p < 0.001) and 2016 (p < 0.01) (Figure 4b). Across all years of the observation period, the effect of tree species was significant as a consequence of the later average growth cessation of sycamore (DOY 244) in comparison to wild cherry (DOY 227) (p < 0.05) (Table 3). Duration of growth lasted—same as for cessation of growth—significantly longer for sycamore in the years 2010 (p < 0.001), 2011 (p < 0.05), 2012 (p < 0.01) and 2016 (p < 0.01) (growth duration data not illustrated). According to the analysis of variance, the effect of tree species on the average growth duration was only slightly significant (p < 0.10). The day of the maximum growth rate (tmax) of wild cherry occurred in most of the years later in comparison to sycamore, with significant differences in 2014 (DOY 186 vs. DOY 166, p < 0.01) and 2015 (DOY 178 vs. DOY 163, p < 0.05) (Figure 4c). The maximum growth rate (rmax) of sycamore was significantly higher in 2010 (p < 0.05), 2011 (p < 0.01) and 2012 (p < 0.05) than for wild cherry and rather similar between the tree species in the following years during the measurements (Figure 4d). Similar patterns were visible for the average daily growth rate (rt) and annual radial growth (RG), where a conspicuous decline of growth rates of sycamore was observed in the more recent years, resulting in rather similar growth patterns between both tree species between the years 2013 and 2016. The average daily growth rate for sycamore was significantly higher in 2011 (p < 0.01) and annual radial growth for sycamore was significantly higher in 2010 (p < 0.05), 2011 (p < 0.01) and 2012 (p < 0.05) in comparison to wild cherry (Figure 4e,f).
While the main effect of the year was significant for all investigated response variables, significant interaction effects of tree species and year were also generally present with the exception of the day of the maximum growth rate (tmax) (Table 3).

3.2. Effect of Stem Height

Radial growth rates of sycamore were faster at the higher stem location compared to breast height during the beginning of the growing season in April (Figure 3b). With the exception of the second half of July, radial growth rates were almost identical during the remaining parts of the growing season between the dendrometer locations.
The faster radial growth rates during the beginning of the growing season in April and May at the higher stem location in comparison to breast height were even more pronounced in wild cherry (Figure 3c). The difference of the seasonal growth dynamics between the top and bottom locations revealed a slight phase shift between the locations from the beginning of the growing season until the second half of July.
Pairwise comparisons within years and between dendrometer locations showed that, for sycamore, growth onset (ton) took place consistently earlier at the higher location than at breast height with the differences being significant in 2011 (DOY 102 vs. DOY 110, p < 0.05) and 2014 (DOY 107 vs. DOY 123, p < 0.001) (Figure 5a). Similarly, duration of growth for sycamore lasted significantly longer at the top dendrometer location than at breast height in 2011 (149 days vs. 133 days, p < 0.05) and 2013 (146 days vs. 123 days, p < 0.01). No clear patterns between the locations of sycamore were observed for growth cessation (tce) and for the day of the maximum growth rate (tmax) with the exception of the year 2014, where tmax was reached 21 days earlier at the higher location (DOY 155) than at breast height (DOY 176) (p < 0.05) (Figure 5b,c). While the maximum growth rate (rmax) of sycamore displays a similar trend between the two dendrometer locations along the years, in 2011 rmax was significantly higher at the upper location (107 µm) than at breast height (88 µm) (p < 0.05) (Figure 5d). While similar patterns as for rmax were observed in the average daily growth rate (r∆t) and radial growth (RG) during the years (Figure 5e,f), significant differences were only found in RG during the year 2011, where the higher location (8.7 mm) showed a 2 mm wider radial growth than at breast height (p < 0.01).
Similar as with sycamore, growth onset in wild cherry (ton) displayed a similar trend between the dendrometer locations and initiated systematically later at breast height. In 2010, ton started 8 days earlier at the higher location (DOY 111) than at breast height (p < 0.05). In addition, for wild cherry ton took place also earlier at the higher location than at breast height in 2013 (top: DOY 119; bottom: DOY 128; p < 0.05) (Figure 5g). Growth cessation (tce) of wild cherry occurred rather synchronously between the dendrometer locations in most of the years, with no clear differences being observed (Figure 5h). Duration of growth lasted longer at the top dendrometer location (112 days) compared to breast height (94 days) in 2012 (p < 0.05). The lagged time of occurrence of the day of the maximum growth rate (tmax) at breast height remained widely constant throughout the observation period with the difference being significant in the year 2015 (top: DOY 166; bottom: DOY 190; p < 0.01) (Figure 5i). The maximum growth rate (rmax), the average daily growth rate (rt) and annual radial growth (RG) of wild cherry displayed parallel trends and were mostly similar between the dendrometer locations throughout the observation period with no significant differences being detected in individual years (Figure 5j–l).
No significant interaction effects of location and year or significant higher ranking interactions involving the location and year interaction were identified for any response variable (Table 3).

3.3. Effect of Treatment

In all three pruning treatments, growth onset (ton) of sycamore started earlier at the higher location on the stem than at breast height with the differences being significant for the control (DOY 113 vs. DOY 121, p < 0.01) and selective pruning (DOY 112 vs. DOY 118, p < 0.05) (Figure 6a). Within all treatments of sycamore, no significant differences in growth cessation (tce) or the day of the maximum growth rate (tmax) could be detected between the dendrometer locations. (Figure 6b,c). Duration of growth lasted—same as for onset of growth—significantly longer at the top dendrometer location compared to breast height in the control (140 days vs. 127 days, p < 0.05) and the selective pruning treatment (131 days vs. 119 days, p < 0.05). Although no differences could be observed for the control and selective pruning treatment, the maximum growth rate (rmax) in the higher location in the classical pruning treatment of sycamore was with 110 µm significantly higher compared to 93 µm at breast height (p < 0.05) (Figure 6d). No significant differences in sycamore could be detected when comparing average daily growth rates (rt) or annual radial growth (RG) between dendrometer locations in any pruning treatment (Figure 6e,f).
Similar as with sycamore, growth onset (ton) of wild cherry occurred earlier at the higher locations compared to breast height with the differences being significant for the classical (DOY 112 vs. DOY 119, p < 0.05) and selective pruning treatment (DOY 113 vs. DOY 121, p < 0.01) (Figure 6g). Growth cessation (tce) of wild cherry occurred in all treatments between DOY 220 and DOY 230 with no significant differences between the dendrometer locations (Figure 6h). Duration of growth lasted longer at the top dendrometer location (117 days) compared to breast height (106 days) in the classical treatment (p < 0.05). Across all treatments and both tree species, the earlier onset and longer growth duration of the higher dendrometer location compared to breast height was highly significant (p < 0.001), whereas no significant effects of treatment and tree species were observed (Table 3). In comparison to breast height, the day of the maximum growth rate (tmax) at the higher dendrometer location of wild cherry was observed significantly earlier in the control (DOY 167 vs. DOY 180, p < 0.05) and classical pruning treatment (DOY 168 vs. DOY 181, p < 0.05) (Figure 6i). The effect of the dendrometer location on the day of the maximum growth rate was also highly significant across tree species, treatments and years (p < 0.01) (Table 3). The maximum growth rate (rmax) was not significantly different between the dendrometer locations in any of the pruning treatments of wild cherry (Figure 6j) and effects of treatment, tree species and location on rmax were not observed in general (Table 3). While no differences were observed for the control and classical pruning treatment, in the selective pruning treatment the average daily growth rate (rt) and annual radial growth (RG) at the upper dendrometer location were higher compared to breast height (rt: 42 µm vs. 35 µm, RG: 4.9 mm vs. 3.8 mm, p < 0.05) (Figure 6k,l). Main effects of treatment or interactions of treatment with year on any response variable were not detected. However, significant 3-way interactions of species, treatment and location were detected for the maximum growth rate (rmax) and average daily growth rate (rt), respectively (p < 0.05) (Table 3).
In contrast to sycamore, the effect of the earlier peak of the maximum growth rate at the top stem location for wild cherry remained stable and visible also in the seasonal growth patterns averaged across all observation years (compare Figure 3b with Figure 6c and Figure 3c with Figure 6i).

4. Discussion

In this study, we used linear mixed-effects models to compare radial growth dynamics of the two tree species sycamore and wild cherry in different stem heights and to test whether pruning had a significant midterm effect on radial growth dynamics.
Differences between sycamore and wild cherry in radial growth dynamics were observed for the timing of growth cessation and in the seasonal growth patterns (Figure 3a and Figure 4c), contradicting our hypothesis that both tree species have similar seasonal growth dynamics as found in a previous study by Henhappl in south-western Germany [22]. The higher growth rates in August and later growth cessation of sycamore could be the result of its potentially better adaption to the site conditions or different wood formation strategies of the diffuse-porous sycamore compared to the semi-ring-porous wild cherry [50]. However, our findings of an average growth cessation of sycamore at DOY 244 are in line with Ladefoged [51], who observed that sycamore grows only half of its tree ring in May and June and continues radial growth until September.
The effect of the year is present for all growth estimates. This also accounts for the interaction effect of year and tree species with the exception of the day of the maximum growth rate (Table 3). Climate data show that the years 2014–2016 had dry summers with high vapor pressure deficit. For wild cherry, the day of maximum growth rate in 2014 and 2015 was significantly later during these years compared to sycamore (Figure 3). Stangler et al. [13] demonstrated that sugar maple (Acer saccharum Marshall) responded sensitively to an extreme heat wave by decelerating the rate of radial growth significantly earlier compared to the more resistant yellow birch (Betula alleghaniensis Britt.) during the growing season.
In 2013, a sharp decrease of the available water capacity was observed between June and August. In 2015 and 2016 from July to September mean air temperature was between relatively and extremely high, whereas precipitation and available water capacity were between relatively and extremely low (Figure 1). This could be an explanation for the declining seasonal maximum daily growth rates, average daily growth rates and annual radial growth of sycamore in the more recent years of the observation period, indicating a higher drought sensitivity compared to wild cherry (Figure 3). This is in accordance with the findings of Scherrer et al. [52], who ranked sycamore as more drought sensitive than wild cherry, due to higher canopy foliage temperature and reduced maintenance of sap flux dynamics during drought conditions. In contrast, the estimates for performance of sycamore were in none of the observation years significantly lower compared to wild cherry. However, sycamore demonstrated its higher efficiency to use the available water resources during years with no summer drought periods as indicated by its higher values of the maximum growth rate, average daily growth rate and annual radial growth between the years 2010 and 2012. Significant differences in the growth onset of the two tree species were not detected and contrasts within the years are difficult to interpret. Cambial activity of wild cherry might have experienced constraints after the relatively cool conditions in the months before and during spring of 2013 with a delayed growth onset. However, in the extreme dry April of 2014, growth onset of sycamore initiated significantly later, indicating again its potential drought sensitivity already very early in the growing season. As late winter 2015/2016 and early spring environmental conditions in 2016 were moderate, the later growth onset of wild cherry in 2016 might be a possible lag effect from an increased respiratory demand and depleted carbon pools by the extreme drought conditions and high temperatures during the previous summer [53]. Turnover of carbon pools in temperate forest tree species is highly variable and close correlations can exist between current year biomass increment and carbon uptake of the previous year [54].
Another of our main findings was that the dendrometer location on the stem had indeed a highly significant statistical effect on radial growth dynamics. In line with our hypothesis, growth initiated earlier and consequently lasted longer at higher stem locations than at breast height for both investigated tree species. Hauser [27] derived growth onset estimates of European beech based on a 10% threshold of the cumulative stem radial displacement at the end of September and found no differences between different stem heights. While Künstle [28] did not find differences between 1.90 m and 6.20 m stem height of solitary Norway spruce trees, earlier growth onsets were identified in the upper stem of 100-year-old Norway spruce trees by Vogel [55]. Using the pinning technique, Schmitt et al. [26] found in the diffuse-porous European beech growth onset in the upper stem heights to initiate about one week earlier than at breast height. In contrast, no differences were detected in the ring-porous black locust (Robinia pseudoacacia L.). In our study, the effect of the location was highly significant and present in the diffuse-porous sycamore and the semi-ring-porous wild cherry. This demonstrates that our algorithm, using absolute threshold values of the daily rates of annual radial growth, produced more compatible results to the direct observations of xylogenesis using the empirical pinning technique than the definition of relative threshold values in relation to final tree-ring width as performed e.g., by Hauser [27]. However, direct observations of cambial xylem cell production and enlargement are not possible with dendrometer measurements alone. Besides the irreversible radial xylem growth component, the dendrometer sensors also monitor the production and collapse of phloem and periderm cells as well as reversible swelling and shrinkage of extensible tissues [13]. Due to those uncertainties, the estimates of growth phenology and growth performance need to be considered as approximations, which might contain systematic bias. Therefore, our results should be validated by alternative approaches such as micro-coring or the pinning technique to directly study wood formation processes of the two investigated tree species [44,56,57].
The significant main effects of the year and location on the day of maximum growth rate contradict our hypothesis that this parameter was controlled by the photoperiod cycle exclusively. While for breast height our results are in general agreement with findings from previous studies that the day of the maximum growth rate occurs close to the time of the summer solstice [20,31], we also provided clear evidence that higher stem locations of sycamore and wild cherry maximized their growth rates significantly earlier.
We detected no main effect of the pruning treatment or interaction effect with the year, neither on the growth phenology nor on the performance (Table 3). Although the main effect of the year explained considerable proportions of the variance in the data, the lack of significant interaction effects of treatment and year indicates that the treatment effect did not vary during the course of our seven-year observation period. This is contradicting to our hypothesis, where we expected that the pruning treatment leads to shorter periods of cambial activity and reduced rates of radial growth. Also, Springmann et al. [5] found in their study that diameter growth in the year of pruning and in the following year of intensively classical pruned wild cherry trees was significantly smaller than for intensively selective pruned and un-pruned individuals, with 5% and 9% smaller tree rings, respectively. As our study was conducted covering a seven-year period starting three years after pruning and is therefore focusing more on the medium- to long-term effects, we conclude that in general the studied trees in terms of secondary growth adapted to their initial reduction of branches already in the third year after pruning. However, we found that pruning had a significant effect in interaction with the dendrometer location and tree species, likely triggered by the lower average daily growth rate and annual radial growth at breast height compared to the top location in the selective pruning treatment of wild cherry. The reduction of stem taper with increasing growth rates at the top location might have contributed to improve wood quality of wild cherry in the selective pruning treatment by stimulating a more cylindrical bole formation [58]. Low-density planting of broadleaved trees, such as in agroforestry systems, leads to more vigorous growth compared to stand-grown trees, which in turn leads to larger branches and greater taper. Heavy green pruning triggers a growth response that decreases stem taper and leads to a bole shape more similar to a stand-grown tree [59]. Pruning affects vigor most at the stem base, leading to a more cylindrical bole [60]. Furthermore, pruning diminishes taper due to increased secondary growth in stem parts where shoots are present [12]. Figure 6f shows that, even though not statistically significant, also radial growth is greater at the higher stem location for classical and selective pruned sycamore. A larger sample size with higher replications per pruning treatment and tree species could lead to a clearer result showing possibly a significant increase of radial growth at the upper stem section as well.

5. Conclusions

In conclusion our study shows that intensive classical and selective pruning of the valuable broadleaved tree species sycamore and wild cherry had no negative effect on radial growth dynamics three years after pruning. Furthermore, radial growth at different stem heights initiated systematically earlier at the higher location compared to breast height for both tree species. These results, as the study was conducted on trees in a widely spaced system, are limited to the two tree species sycamore and wild cherry in comparable environments and under the same climatic conditions. Results regarding the possible effects caused by pruning treatments need to be treated with caution, as the repeated measures of only two trees per pruning treatment for each tree species during our 2010–2016 observation period might have increased the probability of type II errors to occur during hypotheses testing. This means that the working hypotheses of an existing treatment effect might have erroneously been rejected due to the statistical penalty of low sample sizes.
We see high potential in additional research based on the analysis of the diurnal amplitudes of the stem radial displacement data to gain a better understanding of the long-term effects of applied pruning treatments and stem height on stem water storage dynamics [61,62]. Moreover, our study did not put its emphasis on the influence of climatic variables on radial growth dynamics but more on the effects of pruning treatment, tree species and different stem heights. Although we could highlight potentially different growth responses of sycamore and wild cherry to extreme climatic events, future studies should include climatic variables into the statistical models for more in-depth insights into the environmental control of growth phenology and high-resolution radial growth dynamics of the two investigated tree species [14,63].

Acknowledgments

The authors would like to thank Felix Baab for his tireless support and maintenance of the measurement equipment. We also acknowledge Olaf Grobbel for data management and continuous data quality assessment. This research was funded by the German Federal Ministry of Food and Agriculture (BMEL) within the project Agro-Wertholz (support code 22031112). The article processing charge was funded by the German Research Foundation (DFG) and the University of Freiburg in the funding program Open Access Publishing. The authors would also like to thank the reviewers and the academic editor for their comments and suggestions, which led to an improvement of this article.

Author Contributions

L.S., J.S. and C.M. performed the field work tasks; L.S. and D.F.S. analyzed the data with advice from J.S., C.M. and H.S.; L.S. wrote the paper with inputs from D.F.S., J.S., C.M. and H.S.; H.S. conceived and designed the experiments.

Conflicts of Interest

The authors declare no conflict of interest. The funding sponsors had no role in the design of the study; in the collection, analyses, or interpretation of data; in the writing of the manuscript, and in the decision to publish the results.

Appendix A

Figure A1. (a) Shape constrained additive model (SCAM) fitted to stem radial displacement data (SRD) measured by a precision point-dendrometer on a sycamore (top location) in the year 2012 (time series ID: D8_Ah_ob_2012). (b) Algorithm to estimate growth phenology, i.e., growth onset (ton), the maximum daily growth rate (tmax) and growth cessation (tce), based on the first derivate of the shape constrained additive model (SCAM’) representing a typical unimodal seasonal growth pattern.
Forests 09 00174 g0a1
Figure A2. (a) Shape constrained additive model (SCAM) fitted to stem radial displacement data (SRD) measured by a precision point-dendrometer on a sycamore (top location) in the year 2013 (time series ID: D8_Ah_ob_2013). (b) Algorithm to estimate growth phenology, i.e., growth onset (ton), the maximum daily growth rate (tmax) and growth cessation (tce), based on the first derivate of the shape constrained additive model (SCAM’) representing a bimodal seasonal growth pattern.
Forests 09 00174 g0a2
Figure A3. (a) Shape constrained additive model (SCAM) fitted to stem radial displacement data (SRD) measured by a precision point-dendrometer on a wild cherry (bottom location) in the year 2010 (time series ID: D19_Ki_un_2010). (b) Algorithm to estimate growth phenology, i.e., growth onset (ton), the maximum daily growth rate (tmax) and growth cessation (tce), based on the first derivate of the shape constrained additive model (SCAM’) representing a false bimodal seasonal growth pattern.
Forests 09 00174 g0a3

References

  1. Mantau, U.; Saal, U.; Prins, K.; Steierer, F.; Lindner, M.; Verherk, H.; Eggers, J.; Leek, N.; Olderburger, J.; Asikainen, A.; et al. Real Potential for Changes in Growth and Use of EU Forests; Centre of Wood Sciences, University of Hamburg: Hamburg, Germany, 2010. [Google Scholar]
  2. Becker, G.; Klädtke, J. Wood properties and wood processing of valuable broadleaved trees demonstrated with common ash and maple in southwest Germany. In Valuable Broadleaved Forests in Europe; Spiecker, H., Hein, S., Makkonen-Spiecker, K., Thies, M., Eds.; Brill: Leiden, The Netherlands; Boston, MA, USA, 2009; pp. 161–167. [Google Scholar]
  3. Spiecker, H. Minority tree species—A challenge for multi-purpose forestry. In Nature-Based Forestry in Central Europe: Alternatives to Industrial Forestry and Strict Preservation; Diaci, J., Ed.; Biotechnical Faculty, Department of Forestry and Renewable Forest Resources: Ljubljana, Slovenia, 2006; pp. 47–59. [Google Scholar]
  4. Pryor, S.N. The Silviculture and Yield of Wild Cherry; Her Majesty’s Stationery Office: London, UK, 1988. [Google Scholar]
  5. Springmann, S.; Rogers, R.; Spiecker, H. Impact of artificial pruning on growth and secondary shoot development of wild cherry (Prunus avium L.). For. Ecol. Manag. 2011, 261, 764–769. [Google Scholar] [CrossRef]
  6. Hein, S.; Spiecker, H. Controlling Diameter Growth of Common Ash, Sycamore and Wild Cherry. In Valuable Broadleaved Forests in Europe; Spiecker, H., Hein, S., Makkonen-Spiecker, K., Thies, M., Eds.; Brill: Leiden, The Netherlands; Boston, MA, USA, 2009; pp. 123–147. [Google Scholar]
  7. Spiecker, H. Zur Steuerung des Dickenwachstums und der Astreinigung von Trauben-und Stieleichen; Habilitation, Universität Freiburg, 1991; Selbstverlag Landesforstverwaltung Baden-Württemberg: Stuttgart, Germany, 1991. (In German) [Google Scholar]
  8. Morhart, C.; Sheppard, J.; Douglas, G.C.; Lunny, R.; Paris, P.; Spiecker, H.; Nahm, M. Management Guidelines for Valuable Wood Production in Agroforestry Systems; Chair of Forest Growth, University of Freiburg: Freiburg, Germany, 2015. [Google Scholar]
  9. Kupka, I. Growth reaction of young wild cherry (Prunus avium L.) trees to pruning. J. For. Sci. 2007, 53, 555–560. [Google Scholar] [CrossRef]
  10. Bulfin, M.; Radford, T. Effect of early formative shaping on newly planted broadleaves: Part 2: Height and diameter growth. Ir. For. 1998, 55, 52–61. [Google Scholar]
  11. Kerr, G.; Morgan, G. Does formative pruning improve the form of broadleaved trees? Can. J. For. Res. 2006, 36, 132–141. [Google Scholar] [CrossRef]
  12. Balandier, P. A method to evaluate needs and efficiency of formative pruning of fast-growing broad-leaved trees and results of an annual pruning. Can. J. For. Res. 1997, 27, 809–816. [Google Scholar] [CrossRef]
  13. Stangler, D.F.; Hamann, A.; Kahle, H.P.; Spiecker, H. A heat wave during leaf expansion severely reduces productivity and modifies seasonal growth patterns in a northern hardwood forest. Tree Physiol. 2017, 37, 47–59. [Google Scholar] [CrossRef]
  14. Duchesne, L.; Houle, D.; D’Orangeville, L. Influence of climate on seasonal patterns of stem increment of balsam fir in a boreal forest of Quebec, Canada. Agr. For. Meteorol. 2012, 162/163, 108–114. [Google Scholar] [CrossRef]
  15. Van der Maaten, E. Thinning prolongs growth duration of European beech (Fagus sylvatica L.) across a valley in southwestern Germany. For. Ecol. Manag. 2013, 306, 135–141. [Google Scholar] [CrossRef]
  16. Deslauriers, A.; Rossi, S.; Anfodillo, T. Dendrometer and intra-annual tree growth: What kind of information can be inferred? Dendrochronologia 2007, 25, 113–124. [Google Scholar] [CrossRef]
  17. Bresinsky, A.; Körner, C.; Kadereit, J.W.; Neuhaus, G.; Sonnewald, U. Strasburger’s Plant Sciences: Including Prokaryotes and Fungi; Springer: Berlin, Germany, 2013. [Google Scholar]
  18. Zweifel, R. The Rhythm of Trees: Water Storage Dynamics in Subalpine Norway Spruce. PhD Thesis, ETH Zürich, Zürich, Switzerland, 1999. [Google Scholar]
  19. Herzog, K.M.; Häsler, R.; Thum, R. Diurnal changes in the radius of a subalpine Norway spruce stem: Their relation to the sap flow and their use to estimate transpiration. Trees 1995, 10, 94–101. [Google Scholar] [CrossRef]
  20. Cuny, H.E.; Rathgeber, C.B.K.; Frank, D.C.; Fonti, P.; Mäkinen, H.; Prislan, P.; Rossi, S.; del Castillo, E.M.; Campelo, F.; Vavrčík, H.; et al. Woody biomass production lags stem-girth increase by over one month in coniferous forests. Nat. Plants 2015, 1, 15160. [Google Scholar] [CrossRef] [PubMed]
  21. Zweifel, R.; Häsler, R. Dynamics of water storage in mature subalpine Picea abies: Temporal and spatial patterns of change in stem radius. Tree Physiol. 2001, 21, 561–569. [Google Scholar] [CrossRef] [PubMed]
  22. Henhappl, G. Über die Stärkeänderungen der Peripheren Stammzone von Waldbäumen im Jahresablauf. Ph.D. Thesis, Albert-Ludwigs-Universität Freiburg, Freiburg im Breisgau, Germany, 1965. (In German). [Google Scholar]
  23. Bouriaud, O.; Bréda, N.; Dupouey, J.-L.; Granier, A. Is ring width a reliable proxy for stem-biomass increment?: A case study in European beech. Can. J. For. Res. 2005, 35, 2920–2933. [Google Scholar] [CrossRef]
  24. Van der Maaten-Theunissen, M.J.C.; Bouriaud, O. Climate-growth relationships at different stem heights in silver fir and Norway spruce. Can. J. For. Res. 2012, 42, 958–969. [Google Scholar] [CrossRef] [Green Version]
  25. Chhin, S.; Hogg, E.H.T.; Lieffers, V.J.; Huang, S. Growth-climate relationships vary with height along the stem in lodgepole pine. Tree Physiol. 2010, 30, 335–345. [Google Scholar] [CrossRef] [PubMed]
  26. Schmitt, U.; Möller, R.; Eckstein, D. Seasonal wood formation dynamics of beech (Fagus sylvatica L.) and black locust (Robinia pseudoacacia L.) as determined by the “pinning” technique. J. Appl. Bot. 2000, 74, 10–16. [Google Scholar]
  27. Hauser, S. Dynamik Hochaufgelöster Radialer Schaftveränderungen und des Dickenwachstums bei Buchen (Fagus sylvatica L.) der Schwäbischen Alb unter dem Einfluss von Witterung und Bewirtschaftung. Ph.D. Thesis, Albert-Ludwigs-Universität Freiburg, Freiburg im Breisgau, Germany, 2003. (In German). [Google Scholar]
  28. Künstle, E. Beginn, Verlauf und Ende des Dickenwachstums von Solitär-Fichten auf dem Schauinsland bei Freiburg in den Jahren 1989 bis 1993. In Methoden der Permanent-Zuwachsmessung: 12 Beiträge zur Meßtechnik und Sensoranpassung im Seminar der Bayer. Landesanstalt für Wald und Forstwirtschaft “Waldklimastationen 4/94” am 12.09.1994; Preuhsler, T., Ed.; Frank: München, Germany, 1995; pp. 24–39. (In German) [Google Scholar]
  29. Lemay, A.; Krause, C.; Rossi, S.; Achim, A. Xylogenesis in stems and roots after thinning in the boreal forest of Quebec, Canada. Tree Physiol. 2017, 37, 1554–1563. [Google Scholar] [CrossRef] [PubMed]
  30. Thibeault-Martel, M.; Krause, C.; Morin, H.; Rossi, S. Cambial activity and intra-annual xylem formation in roots and stems of Abies balsamea and Picea mariana. Ann. Bot. 2008, 102, 667–674. [Google Scholar] [CrossRef] [PubMed]
  31. Rossi, S.; Deslauriers, A.; Anfodillo, T.; Morin, H.; Saracino, A.; Motta, R.; Borghetti, M. Conifers in cold environments synchronize maximum growth rate of tree-ring formation with day length. New Phytol. 2006, 170, 301–310. [Google Scholar] [CrossRef] [PubMed]
  32. Rossi, S.; Anfodillo, T.; Čufar, K.; Cuny, H.E.; Deslauriers, A.; Fonti, P.; Frank, D.C.; Gričar, J.; Gruber, A.; King, G.M.; et al. A meta-analysis of cambium phenology and growth: Linear and non-linear patterns in conifers of the northern hemisphere. Ann. Bot. 2013, 112, 1911–1920. [Google Scholar] [CrossRef] [PubMed]
  33. Siegel, A. Optionen der Wachstumssteuerung von Gelbbirke und Zuckerahorn zur Überführung Exploitierter Laubmischwälder der Great Lakes-St. Lawrence Region (Kanada) in Naturnahen Wirtschaftswald. Ph.D. Thesis, Albert-Ludwigs-Universität Freiburg, Freiburg im Breisgau, Germany, 2012. (In German). [Google Scholar]
  34. Rossi, S.; Morin, H.; Deslauriers, A. Causes and correlations in cambium phenology: Towards an integrated framework of xylogenesis. J. Exp. Bot. 2012, 63, 2117–2126. [Google Scholar] [CrossRef] [PubMed]
  35. Matzarakis, A.; Mayer, H.; Schindler, D.; Fritsch, J. Simulation des Wasserhaushaltes eines Buchenwaldes mit dem Forstlichen Wasserhaushaltsmodell WBS3; Meteorologisches Institut, Albert-Ludwigs-Universität Freiburg: Freiburg im Breisgau, Germany, 2000. (In German) [Google Scholar]
  36. Sheppard, J. Options for Management of High Value Timber within Temperate Agroforestry Systems. Ph.D. Thesis, Albert-Ludwigs-Universität Freiburg, Freiburg im Breisgau, Germany, 2016. [Google Scholar]
  37. FAO. World Reference Base for Soil Resources 2006. A Framework for International Classification, Correlation and Communication; FAO: Rome, Italy, 2006. [Google Scholar]
  38. R Core Team. R: A Language and Environment for Statistical Computing; R Core Team: Vienna, Austria, 2017. [Google Scholar]
  39. RStudio Team. RStudio Integrated Development Environment for R; RStudio Team: Boston, MA, USA, 2017. [Google Scholar]
  40. Pya, N.; Wood, S.N. Shape constrained additive models. Stat. Comput. 2015, 25, 543–559. [Google Scholar] [CrossRef]
  41. Stangler, D.F.; Mann, M.; Kahle, H.P.; Rosskopf, E.; Fink, S.; Spiecker, H. Spatiotemporal alignment of radial tracheid diameter profiles of submontane Norway spruce. Dendrochronologia 2016, 37, 33–45. [Google Scholar] [CrossRef]
  42. Mayer, D.G.; Butler, D.G. Statistical validation. Ecol. Model. 1993, 68, 21–32. [Google Scholar] [CrossRef]
  43. Cuny, H.E.; Rathgeber, C.B.K.; Kiessé, T.S.; Hartmann, F.P.; Barbeito, I.; Fournier, M. Generalized additive models reveal the intrinsic complexity of wood formation dynamics. J. Exp. Bot. 2013, 64, 1983–1994. [Google Scholar] [CrossRef] [PubMed]
  44. Mäkinen, H.; Seo, J.W.; Nöjd, P.; Schmitt, U.; Jalkanen, R. Seasonal dynamics of wood formation: A comparison between pinning, microcoring and dendrometer measurements. Eur. J. For. Res. 2008, 127, 235–245. [Google Scholar] [CrossRef]
  45. Swidrak, I.; Schuster, R.; Oberhuber, W. Comparing growth phenology of co-occurring deciduous and evergreen conifers exposed to drought. Flora 2013, 208, 609–617. [Google Scholar] [CrossRef]
  46. Rossi, S.; Deslauriers, A.; Morin, H. Application of the Gompertz equation for the study of xylem cell development. Dendrochronologia 2003, 21, 33–39. [Google Scholar] [CrossRef]
  47. Bates, D.; Mächler, M.; Bolker, B.; Walker, S. Fitting Linear Mixed-Effects Models Using lme4. J. Stat. Soft. 2015, 67. [Google Scholar] [CrossRef]
  48. Kuznetsova, A.; Brockhoff, P.B.; Christensen, R.H.B. lmerTest: Tests in Linear Mixed Effects Models. Available online: http://CRAN.R-project.org/package=lmerTest (accessed on 11 March 2016).
  49. Lenth, R.V.; Hervé, M. lsmeans: Least-Squares Means. Available online: http://CRAN.R-project.org/package=lsmeans (accessed on 11 March 2016).
  50. Schweingruber, F.H. Anatomie Europäischer Hölzer: Ein Atlas zur Bestimmung Europäischer Baum-, Strauch- und Zwergstrauchhölzer = Anatomy of European Woods: An Atlas for the Identification of European Trees, Shrubs and Dwarf Shrubs; Schweingruber, F.H., Baas, P., Eds.; Paul Haupt: Bern, Switzerland, 1990. (In German) [Google Scholar]
  51. Ladefoged, K. The Periodicity of Wood Formation; Biologiske Skrifter, Kgl; Dansk Videnskabernes Selskab: Kobenhavn, Denmark, 1952; Volume 7. [Google Scholar]
  52. Scherrer, D.; Bader, M.K.-F.; Körner, C. Drought-sensitivity ranking of deciduous tree species based on thermal imaging of forest canopies. Agric. For. Meteorol. 2011, 151, 1632–1640. [Google Scholar] [CrossRef]
  53. Teskey, R.; Wertin, T.; Bauweraerts, I.; Ameye, M.; McGuire, M.A.; Steppe, K. Responses of tree species to heat waves and extreme heat events. Plant Cell Environ. 2015, 38, 1699–1712. [Google Scholar] [CrossRef] [PubMed]
  54. Richardson, A.D.; Carbone, M.S.; Keenan, T.F.; Czimczik, C.I.; Hollinger, D.Y.; Murakami, P.; Schaberg, P.G.; Xu, X. Seasonal dynamics and age of stemwood nonstructural carbohydrates in temperate forest trees. New Phytol. 2013, 197, 850–861. [Google Scholar] [CrossRef] [PubMed]
  55. Vogel, M. Methodik und Ergebnisse von Zuwachsfeinmessungen auf Tharandter Intensivmeßflächen. In Methoden der Permanent-Zuwachsmessung: 12 Beiträge zur Meßtechnik und Sensoranpassung im Seminar der Bayer. Landesanstalt für Wald und Forstwirtschaft “Waldklimastationen 4/94” am 12.09.1994; Preuhsler, T., Ed.; Frank: München, Germany, 1995; pp. 64–75. (In German) [Google Scholar]
  56. Rossi, S.; Anfodillo, T.; Menardi, R. Trephor: A new tool for sampling microcores from tree stems. IAWA J. 2006, 27, 89–97. [Google Scholar] [CrossRef]
  57. Seo, J.W.; Eckstein, D.; Schmitt, U. The pinning method: From pinning to data preparation. Dendrochronologia 2007, 25, 79–86. [Google Scholar] [CrossRef]
  58. Thies, M.; Pfeifer, N.; Winterhalder, D.; Gorte, B.G.H. Three-dimensional reconstruction of stems for assessment of taper, sweep and lean based on laser scanning of standing trees. Scand. J. For. Res. 2004, 19, 571–581. [Google Scholar] [CrossRef]
  59. Larson, P.R. Wood Formation and the Concept of Wood Quality; Bulletin No. 74; School of Forestry, Yale University: New Haven, CT, USA, 1969. [Google Scholar]
  60. Brazier, J.D. The effect of forest practices on quality of the harvested crop. Forestry 1977, 50, 49–66. [Google Scholar] [CrossRef]
  61. King, G.M.; Fonti, P.; Nievergelt, D.; Büntgen, U.; Frank, D.C. Climatic drivers of hourly to yearly tree radius variations along a 6 °C natural warming gradient. Agric. For. Meteorol. 2013, 168, 36–46. [Google Scholar] [CrossRef]
  62. Zweifel, R.; Zimmermann, L.; Newbery, D.M. Modeling tree water deficit from microclimate: An approach to quantifying drought stress. Tree Physiol. 2005, 25, 147–156. [Google Scholar] [CrossRef] [PubMed]
  63. Duchesne, L.; Houle, D. Modelling day-to-day stem diameter variation and annual growth of balsam fir (Abies balsamea (L.) Mill.) from daily climate. For. Ecol. Manag. 2011, 262, 863–872. [Google Scholar] [CrossRef]
Figure 1. Monthly values of (a) mean air temperature, (b) mean relative humidity, (c) sum of precipitation and (d) mean available water capacity for the years 2010–2016 as a deviation of the monthly means of the baseline climate period 1981–2010 (horizontal reference line). Grey shaded areas indicate the monthly 5th and 95th percentiles of the deviations of the baseline climate period (Data retrieved from the German National Meteorological Service (DWD); values for available water capacity are based on the deterministic forest hydrological model WBS3 calibrated for the site conditions of the research plot [35]).
Forests 09 00174 g001
Figure 2. Research setup of a tree group with the three pruning treatments Control, Classical Treatment and Selective Treatment (blue: branches with a diameter >2 cm; green: branches with angles <40°). On the right a detailed description of the high-resolution point-dendrometers (PD) is shown.
Forests 09 00174 g002
Figure 3. Seasonal dynamics of the daily rate of radial growth split for (a) species, (b) dendrometer locations of sycamore and (c) dendrometer locations of wild cherry. Transparent ribbons indicate model-based standard errors of the estimate and missing values were compensated by model predictions.
Forests 09 00174 g003
Figure 4. Estimates of onset (ton) and cessation of growth (tce), day of maximum growth rate (tmax), seasonal maximum daily growth rate (rmax), average daily growth rate (rt) and annual radial growth (RG) for sycamore and wild cherry over the years of measurements averaged over stem heights. Transparent ribbons indicate the model-based standard errors of the estimates and stars (*) indicate p-values < 0.05 for pairwise comparisons between tree species within the years. Missing values were compensated by model predictions.
Forests 09 00174 g004
Figure 5. Estimates of onset (ton) and cessation of growth (tce), day of maximum growth rate (tmax), seasonal maximum daily growth rate (rmax), average daily growth rate (rt) and annual radial growth (RG) of sycamore and wild cherry for top and bottom locations of dendrometers on the stem over the years of measurement. Transparent ribbons indicate the model based standard errors of the estimates and stars (*) indicate p-values < 0.05 for pairwise comparisons between dendrometer locations within the years. Missing values were compensated by model predictions.
Forests 09 00174 g005
Figure 6. Least-square means of onset (ton) and cessation of growth (tce), day of maximum growth rate (tmax), seasonal maximum daily growth rate (rmax), average daily growth rate (rt) and annual radial growth (RG) for locations of dendrometers on the stem and pruning treatments of sycamore and wild cherry. Error bars display the standard errors of the least-square means. Different lowercase letters indicate p-values < 0.05 for pairwise comparisons. Comparisons take place within pruning treatments, (indicated by same colors), and between dendrometer locations.
Forests 09 00174 g006
Table 1. Tree species, pruning treatment, diameter at breast height (DBH), tree height, crown length and crown projection area for all trees of this study measured in July 2016.
IDSpeciesPruning TreatmentDBH (cm)Tree Height (m)Crown Length (m)Crown Projection Area (m2)
1SycamoreControl19.514.612.738.71
2SycamoreControl17.113.611.420.33
3SycamoreClassical Treatment20.614.012.132.34
4SycamoreClassical Treatment11.013.010.47.53
5SycamoreSelective Treatment16.313.57.927.47
6SycamoreSelective Treatment15.613.08.724.31
7Wild CherryControl27.319.818.753.19
8Wild CherryControl18.319.818.730.36
9Wild CherryClassical Treatment22.118.713.238.51
10Wild CherryClassical Treatment22.816.013.232.97
11Wild CherrySelective Treatment22.419.212.123.01
12Wild CherrySelective Treatment15.016.59.612.70
Table 2. Modelling efficiency, mean absolute error and mean absolute percentage error of the shape constrained additive models (SCAMs) fitted to the annual dendrometer data averaged over the three applied treatments for the tree species sycamore and wild cherry.
Tree SpeciesTreatmentModelling EfficiencyMean Absolute ErrorMean Absolute Percentage Error
SycamoreControl0.999912.220.45
Classical Treatment0.999918.130.44
Selective Treatment0.999913.130.55
Wild CherryControl0.999821.420.71
Classical Treatment0.999026.461.38
Selective Treatment0.991126.541.68
Table 3. ANOVA table for the linear mixed-effects models with tree species ( S ), pruning treatment ( T ), dendrometer location ( L ) and year ( Y ) as fixed effects compiled for the analyzed response variables growth onset (ton), growth cessation (tce), day of maximum growth rate (tmax), maximum growth rate (rmax), average daily growth rate (rt) and annual radial growth (RG). p-values < 0.05 are highlighted in bold type; DF are degrees of freedom.
Fixed Effect(s)DFResponseF-Valuep-ValueResponseF-Valuep-Value
S1ton0.020.886rmax2.530.163
T20.040.9590.810.490
L127.72<0.0012.180.144
Y620.40<0.0012.850.015
S × T20.590.5821.500.297
S × L10.150.6992.220.140
T × L20.340.7132.590.082
S × Y65.43<0.0019.32<0.001
T × Y121.190.3031.440.166
L × Y61.050.3980.250.958
S × T × L22.150.1233.540.034
S × T × Y120.670.7791.390.189
S × L × Y61.200.3140.520.793
T × L × Y120.390.9640.560.864
S × T × L × Y120.470.9250.820.632
S1tce6.660.042rt0.860.389
T20.250.7860.600.580
L11.350.2480.240.629
Y66.72<0.0012.500.029
S × T20.160.8581.970.219
S × L10.060.8040.010.935
T × L20.890.4152.440.094
S × Y68.71<0.0018.38<0.001
T × Y121.520.1360.900.550
L × Y61.140.3480.430.856
S × T × L20.160.8514.080.021
S × T × Y120.510.9041.150.336
S × L × Y61.690.1360.710.645
T × L × Y120.470.9260.540.878
S × T × L × Y120.720.7290.660.780
S1tmax3.300.119RG2.050.202
T20.660.5500.300.754
L18.200.0052.770.100
Y64.59<0.0014.88<0.001
S × T21.210.3610.970.430
S × L11.530.2190.010.915
T × L20.610.5441.960.148
S × Y61.430.21311.42<0.001
T × Y120.810.6380.890.556
L × Y61.040.4050.820.559
S × T × L20.260.7752.170.121
S × T × Y120.570.8610.790.656
S × L × Y60.670.6740.990.436
T × L × Y121.150.3370.570.862
S × T × L × Y120.690.7580.530.889

