Article

Stand Transpiration Estimates from Recalibrated Parameters for the Granier Equation in a Chinese Fir (Cunninghamia lanceolata) Plantation in Southern China

1
Faculty of Life Science and Technology, Central South University of Forestry and Technology, Changsha 410004, China
2
Huitong National Station for Scientific Observation and Research of Chinese Fir Plantation Ecosystems in Hunan Province, Huitong 438107, China
3
Ecological Research Institute of Xizang Plateau, Tibet Agricultural and Animal Husbandry University, Linzhi 860000, China
*
Author to whom correspondence should be addressed.
Forests 2018, 9(4), 162; https://doi.org/10.3390/f9040162
Submission received: 2 February 2018 / Revised: 19 March 2018 / Accepted: 22 March 2018 / Published: 23 March 2018
(This article belongs to the Section Forest Ecophysiology and Biology)

Abstract

:
Chinese fir (Cunninghamia lanceolata (Lamb.) Hook) is an important native tree species that is widely distributed in subtropical areas of southern China and cultivated for wood extraction. However, information on water use by Chinese fir plantations is still scarce. In this study, we performed species-specific parameter calibrations for the original Granier equation for sap flow density (SFD) estimates. Stand transpiration (Es) was related to environmental inputs, such as rainfall, air temperature (Ta), vapor pressure deficit (VPD), photosynthetically-active radiation (PAR), air relative humidity (RH), and potential evapotranspiration (PET) in order to examine how environmental factors affect the Es of Chinese fir plantations. According to our results, Granier’s original parameters set underestimated C. lanceolata SFD by up to 54% compared to our species-specific calibrated parameters set. A strong positive correlation was found between SFD, diameter at breast height (DBH), and tree height among trees populations. The total Es in 2015 was 522.1 mm, with obvious seasonal dynamics and an average of 1.4 mm·day−1. Daily and monthly Es were positively correlated with VPD, PAR, Ta, and PET. A negative relationship between Es and RH was detected only at a daily timescale. Our findings indicate that the original Granier equation requires a parameter calibration when it is applied to species-specific thermal dissipation probe (TDP) estimates, and our findings can also provide novel insights on the water use of Chinese fir in major wood production areas in Southern China.

1. Introduction

The hydrological budget is one of the most important functions in terrestrial ecosystems and is crucial for both environmental and economic development [1,2]. Transpiration is a key element of the hydrological cycle and a main component driving water balances in forest ecosystems [3,4,5]. Accurate estimates of the transpiration of forest ecosystems, as well as an examination of its affecting factors, are critical for understanding the effects of forest characteristics on hydrological processes and watershed water resources management [5,6].
Transpiration in woody plants is often estimated based on sap flow density (SFD) [7]. The thermal dissipation probe (TDP) method is currently the most widely-used method for measuring SFD, which can provide information on water use at an individual tree scale and stand scale in forest ecosystems [8]. Granier [9] derived an empirical equation to calculate SFD based on the measurements of one hardwood species (Quercus pedunculata Ehrh.) and two conifer species (Pinus nigra Arnold and Pseudotsuga menziesii (Mirb.)):
S F D = a × K b
where SFD has the units of cm3 cm−2 s−1, a and b are empirical parameters with the estimated values of 0.0119 and 1.23, respectively, and K is a dimensionless quantity related to the temperature difference between a heated probe and a reference (unheated) probe. However, some studies have reported that the original equation could not accurately estimate SFD in all situations, and that specific parameter (a and b) calibration was required when it is applied [10,11,12]. For example, Bush et al. [13] found that the actual species-specific parameters differed by nearly two orders of magnitude when compared with the original equation parameters. Sun et al. [11] reported that a 9–55% discrepancy in SFD estimates occurred between the actual calibration parameters and the original equation parameters. Therefore, the species-specific parameter values derived from the empirical equation used for TDP could provide accurate estimates of SFD, regarding xylem anatomy or stem size.
Investigating the factors governing plant transpiration is important in order to understand the water use of forests in response to climate change. Es is closely related to meteorological factors, such as air temperature, vapor pressure deficit (VPD), wind speed, relative humidity, and solar radiation (Rs) [14,15,16]. Soil moisture also influences Es [17,18,19]. For instance, Jiao et al. [19] found that the status of soil moisture content at the beginning of the growing season impacted Es significantly during the growing season. Moreover, some studies have shown that the dominant factors affecting stand transpiration may vary at different timescales [20,21]. At a short timescale (e.g., daily and weekly), both Rs and VPD control the transpiration rate by affecting stomatal conductance, with VPD being the most correlated [22]. At longer timescales (e.g., monthly and seasonally), however, rainfall and other related factors may be expected to exert differing degrees of influence [4]. Understanding the influence of climatic factors on Es is, therefore, necessary for the evaluation and modeling of the physiological processes related to transpiration in the process-based biogeochemistry model.
Chinese fir (Cunninghamia lanceolata (Lamb.) Hook) is the principal species used for cultivating that has traditionally been managed for timber production due to its fast-growth rate and excellent wood quality [23]. Chinese fir plantations provide a great deal of economic values (e.g., timber production) to farmers at the local and national levels [24]. According to Lei [25], Chinese fir plantations expanded rapidly in the past four decades and their total planted area is now more than 9.21 million hectares, accounting for 35% of the total plantation area in China [23,24]. Recent studies reported that Chinese fir plantations had positive effects on ecosystem services (e.g., carbon sequestration; soil erosion preservation) [23,26]. However, despite their economic importance and ecosystem services, studies of the soil water use of Chinese fir plantations are lacking [27,28]. Hence, water use characteristics of Chinese fir plantations are worthy to be investigated thoroughly using the advanced sap flow measurement technology. In this study, we expect that the original Granier equation [9,29] results in biases of sap flow estimates in Chinese fir plantations. We hypothesize that the accuracy could be improved after the re-calibration of species-specific parameters of the Granier equation for Chinese fir plantations. The present study had three objectives:
(1)
to test the need for species-specific parameters for the original Granier’s equation in C. lanceolata;
(2)
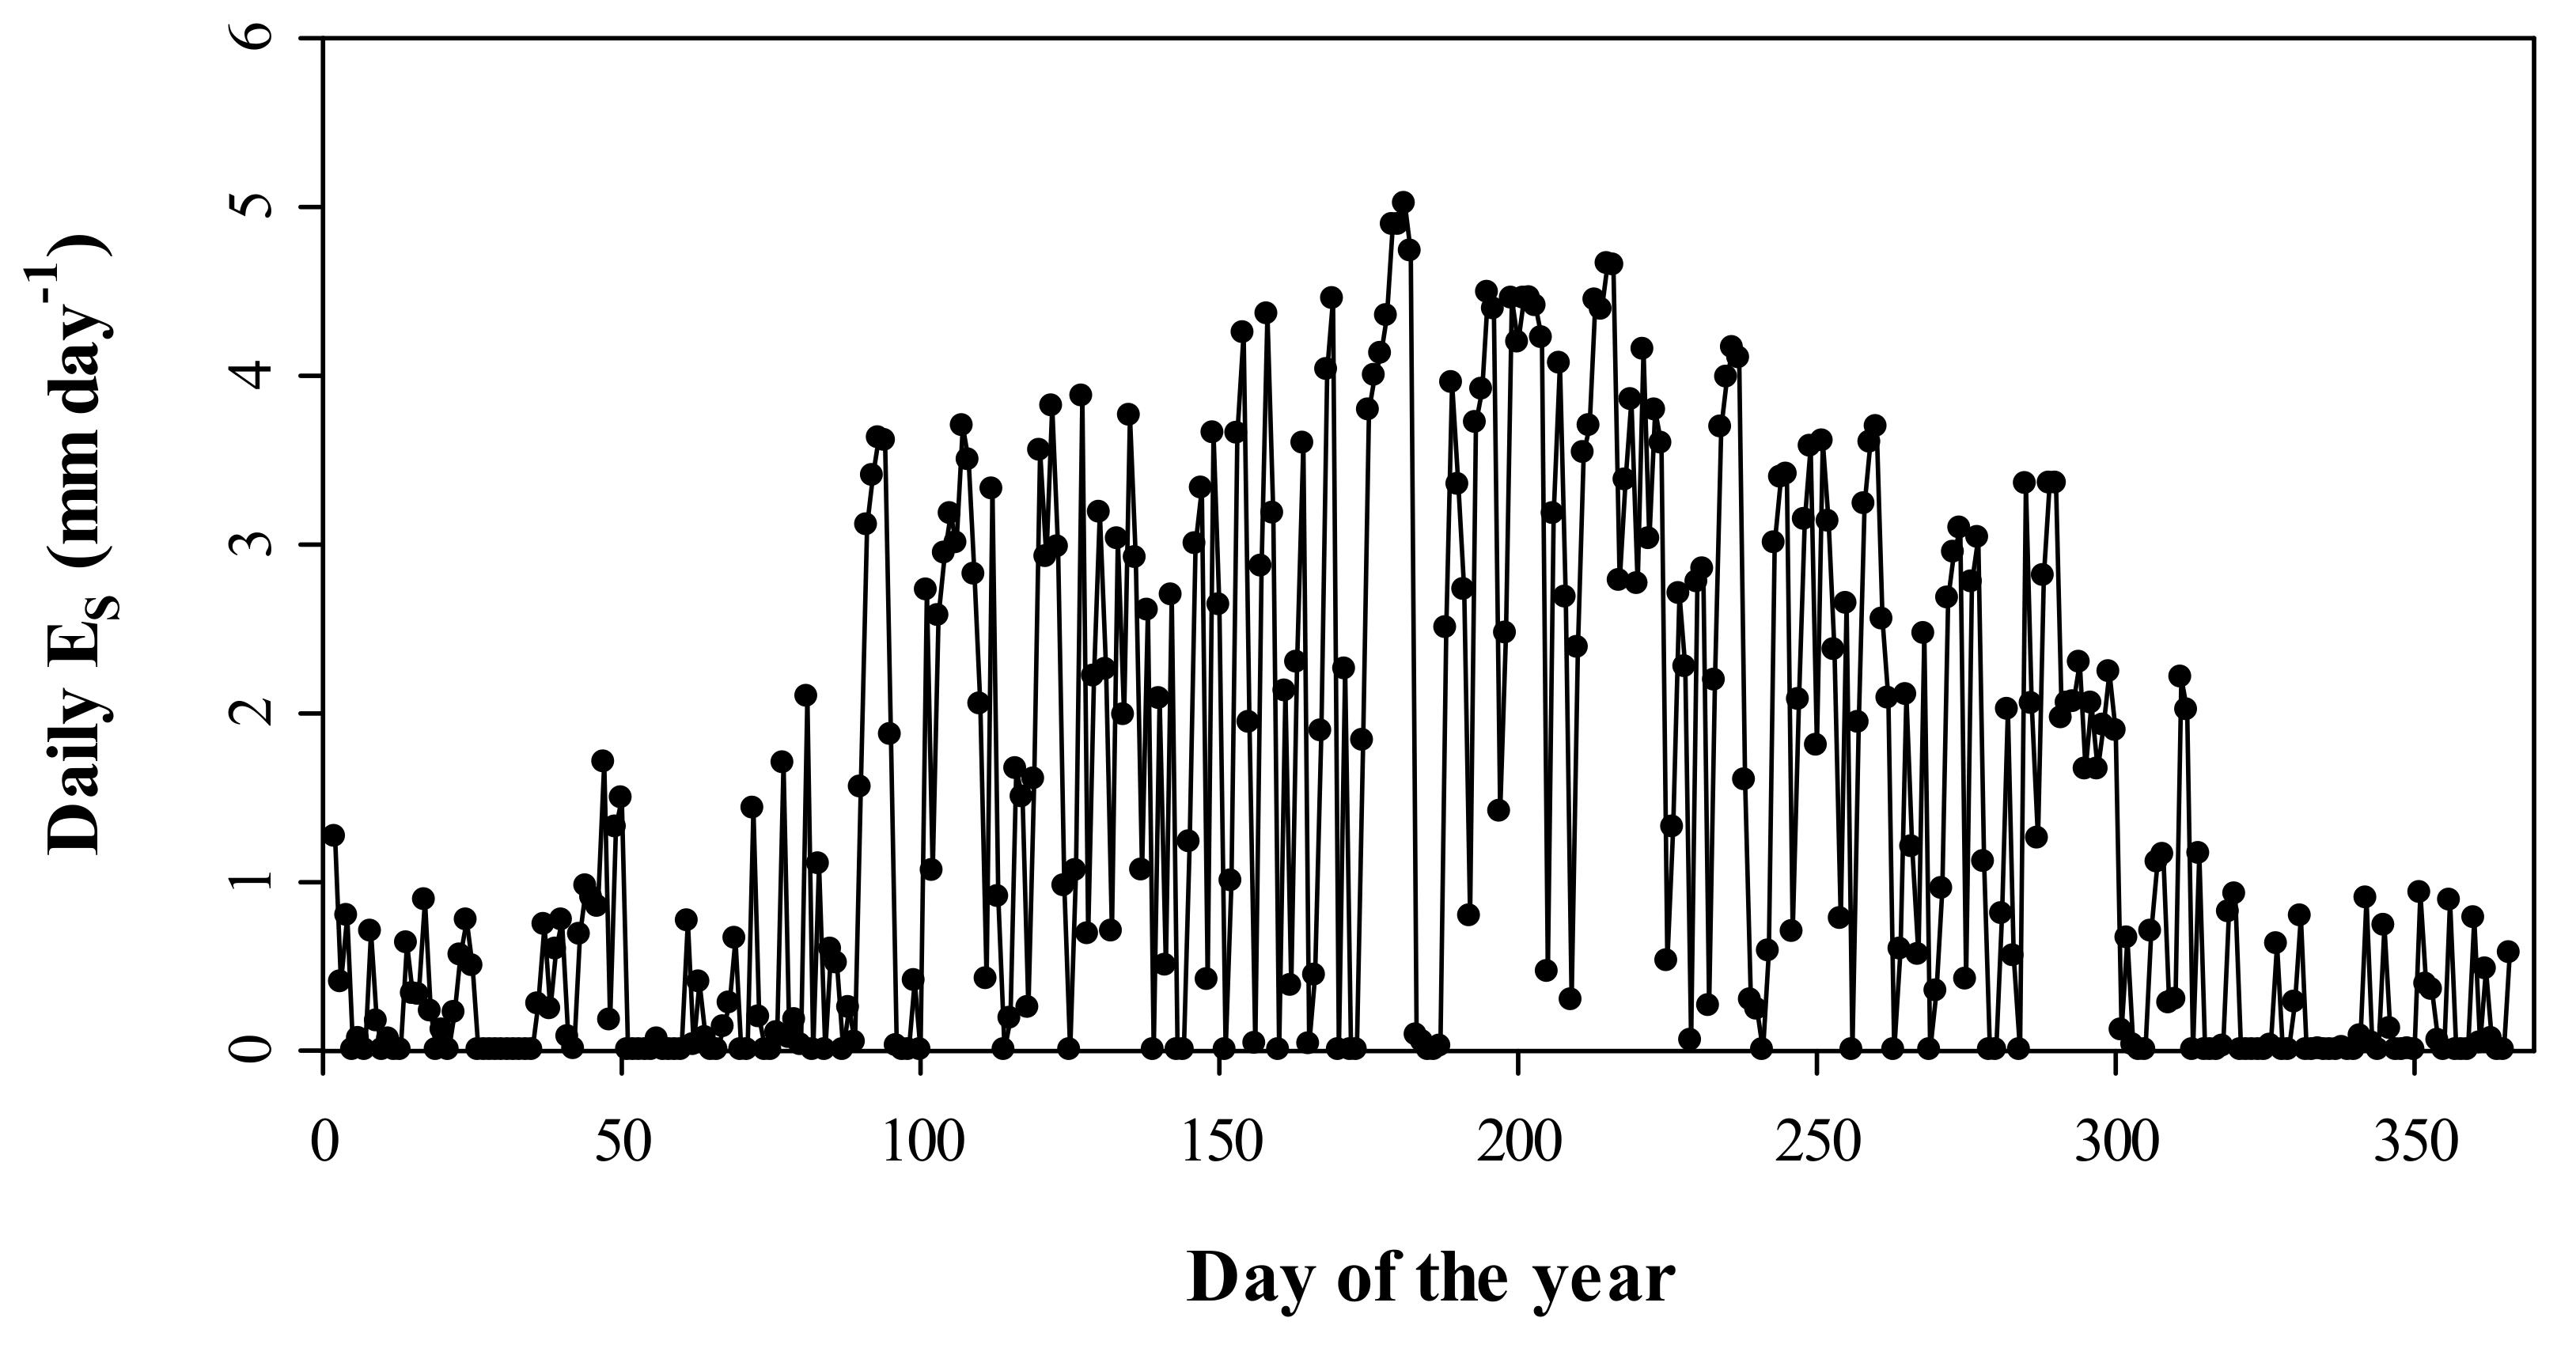
to examine seasonal variations in Es;
(3)
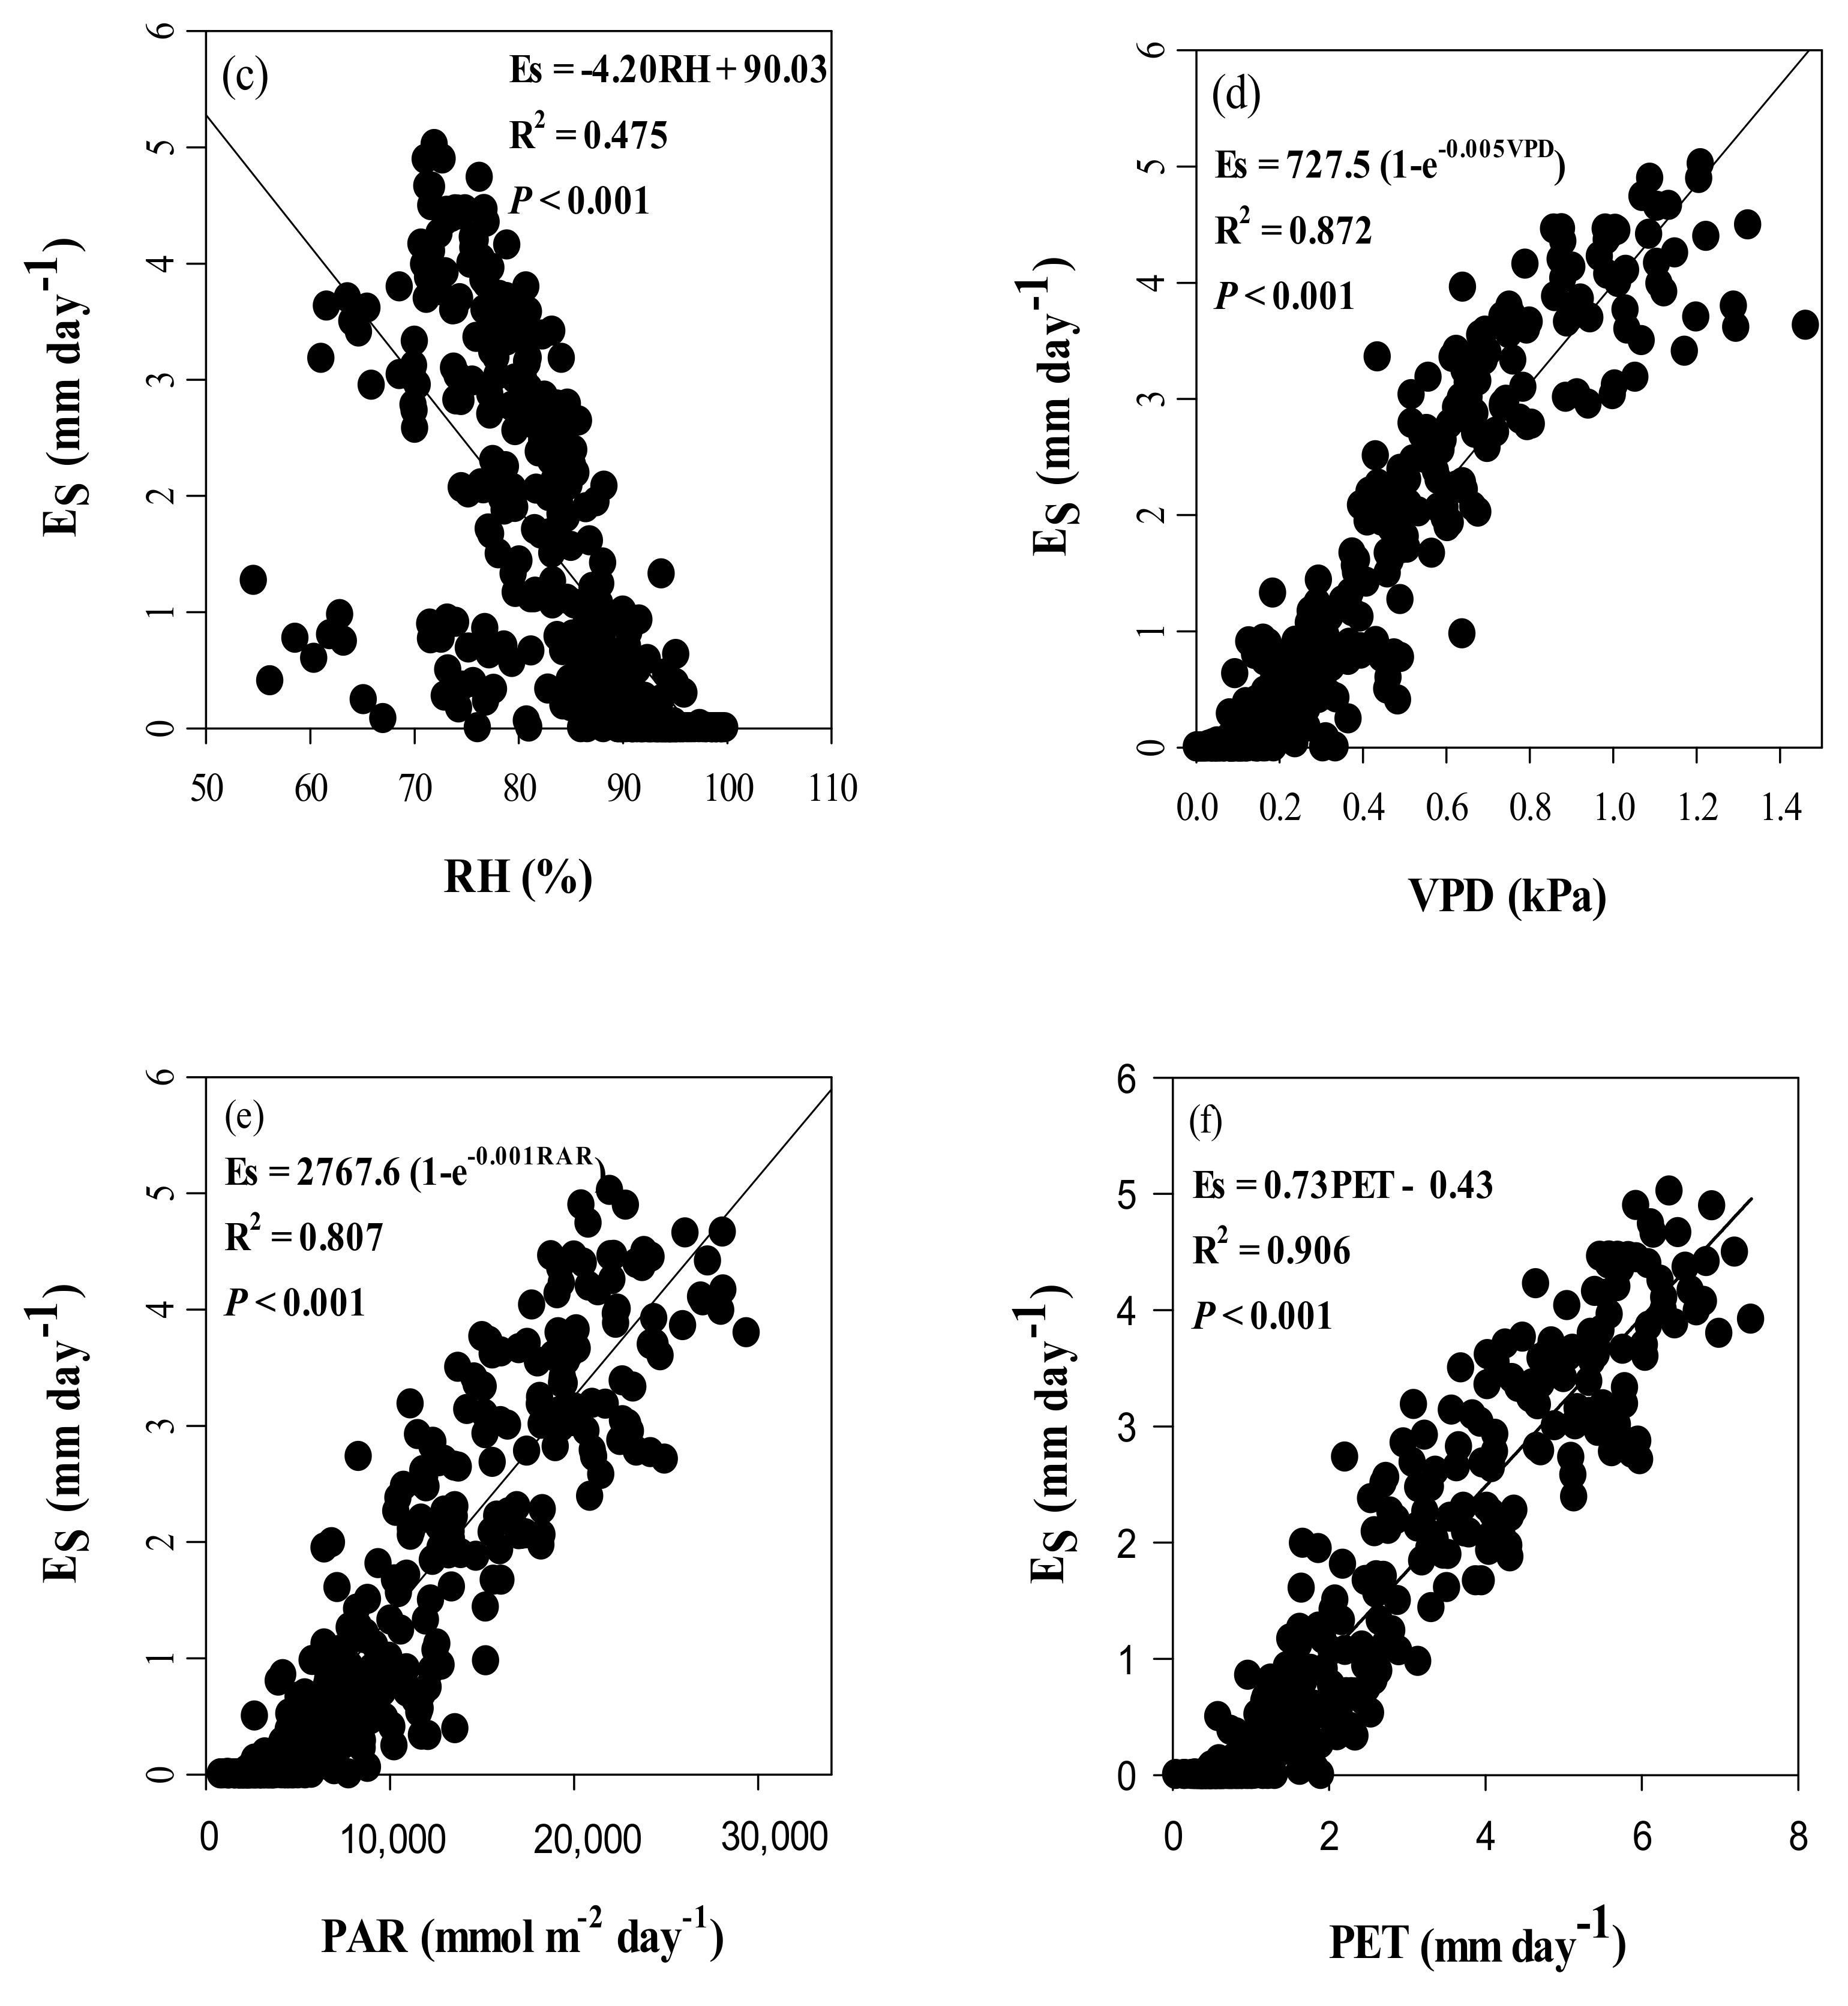
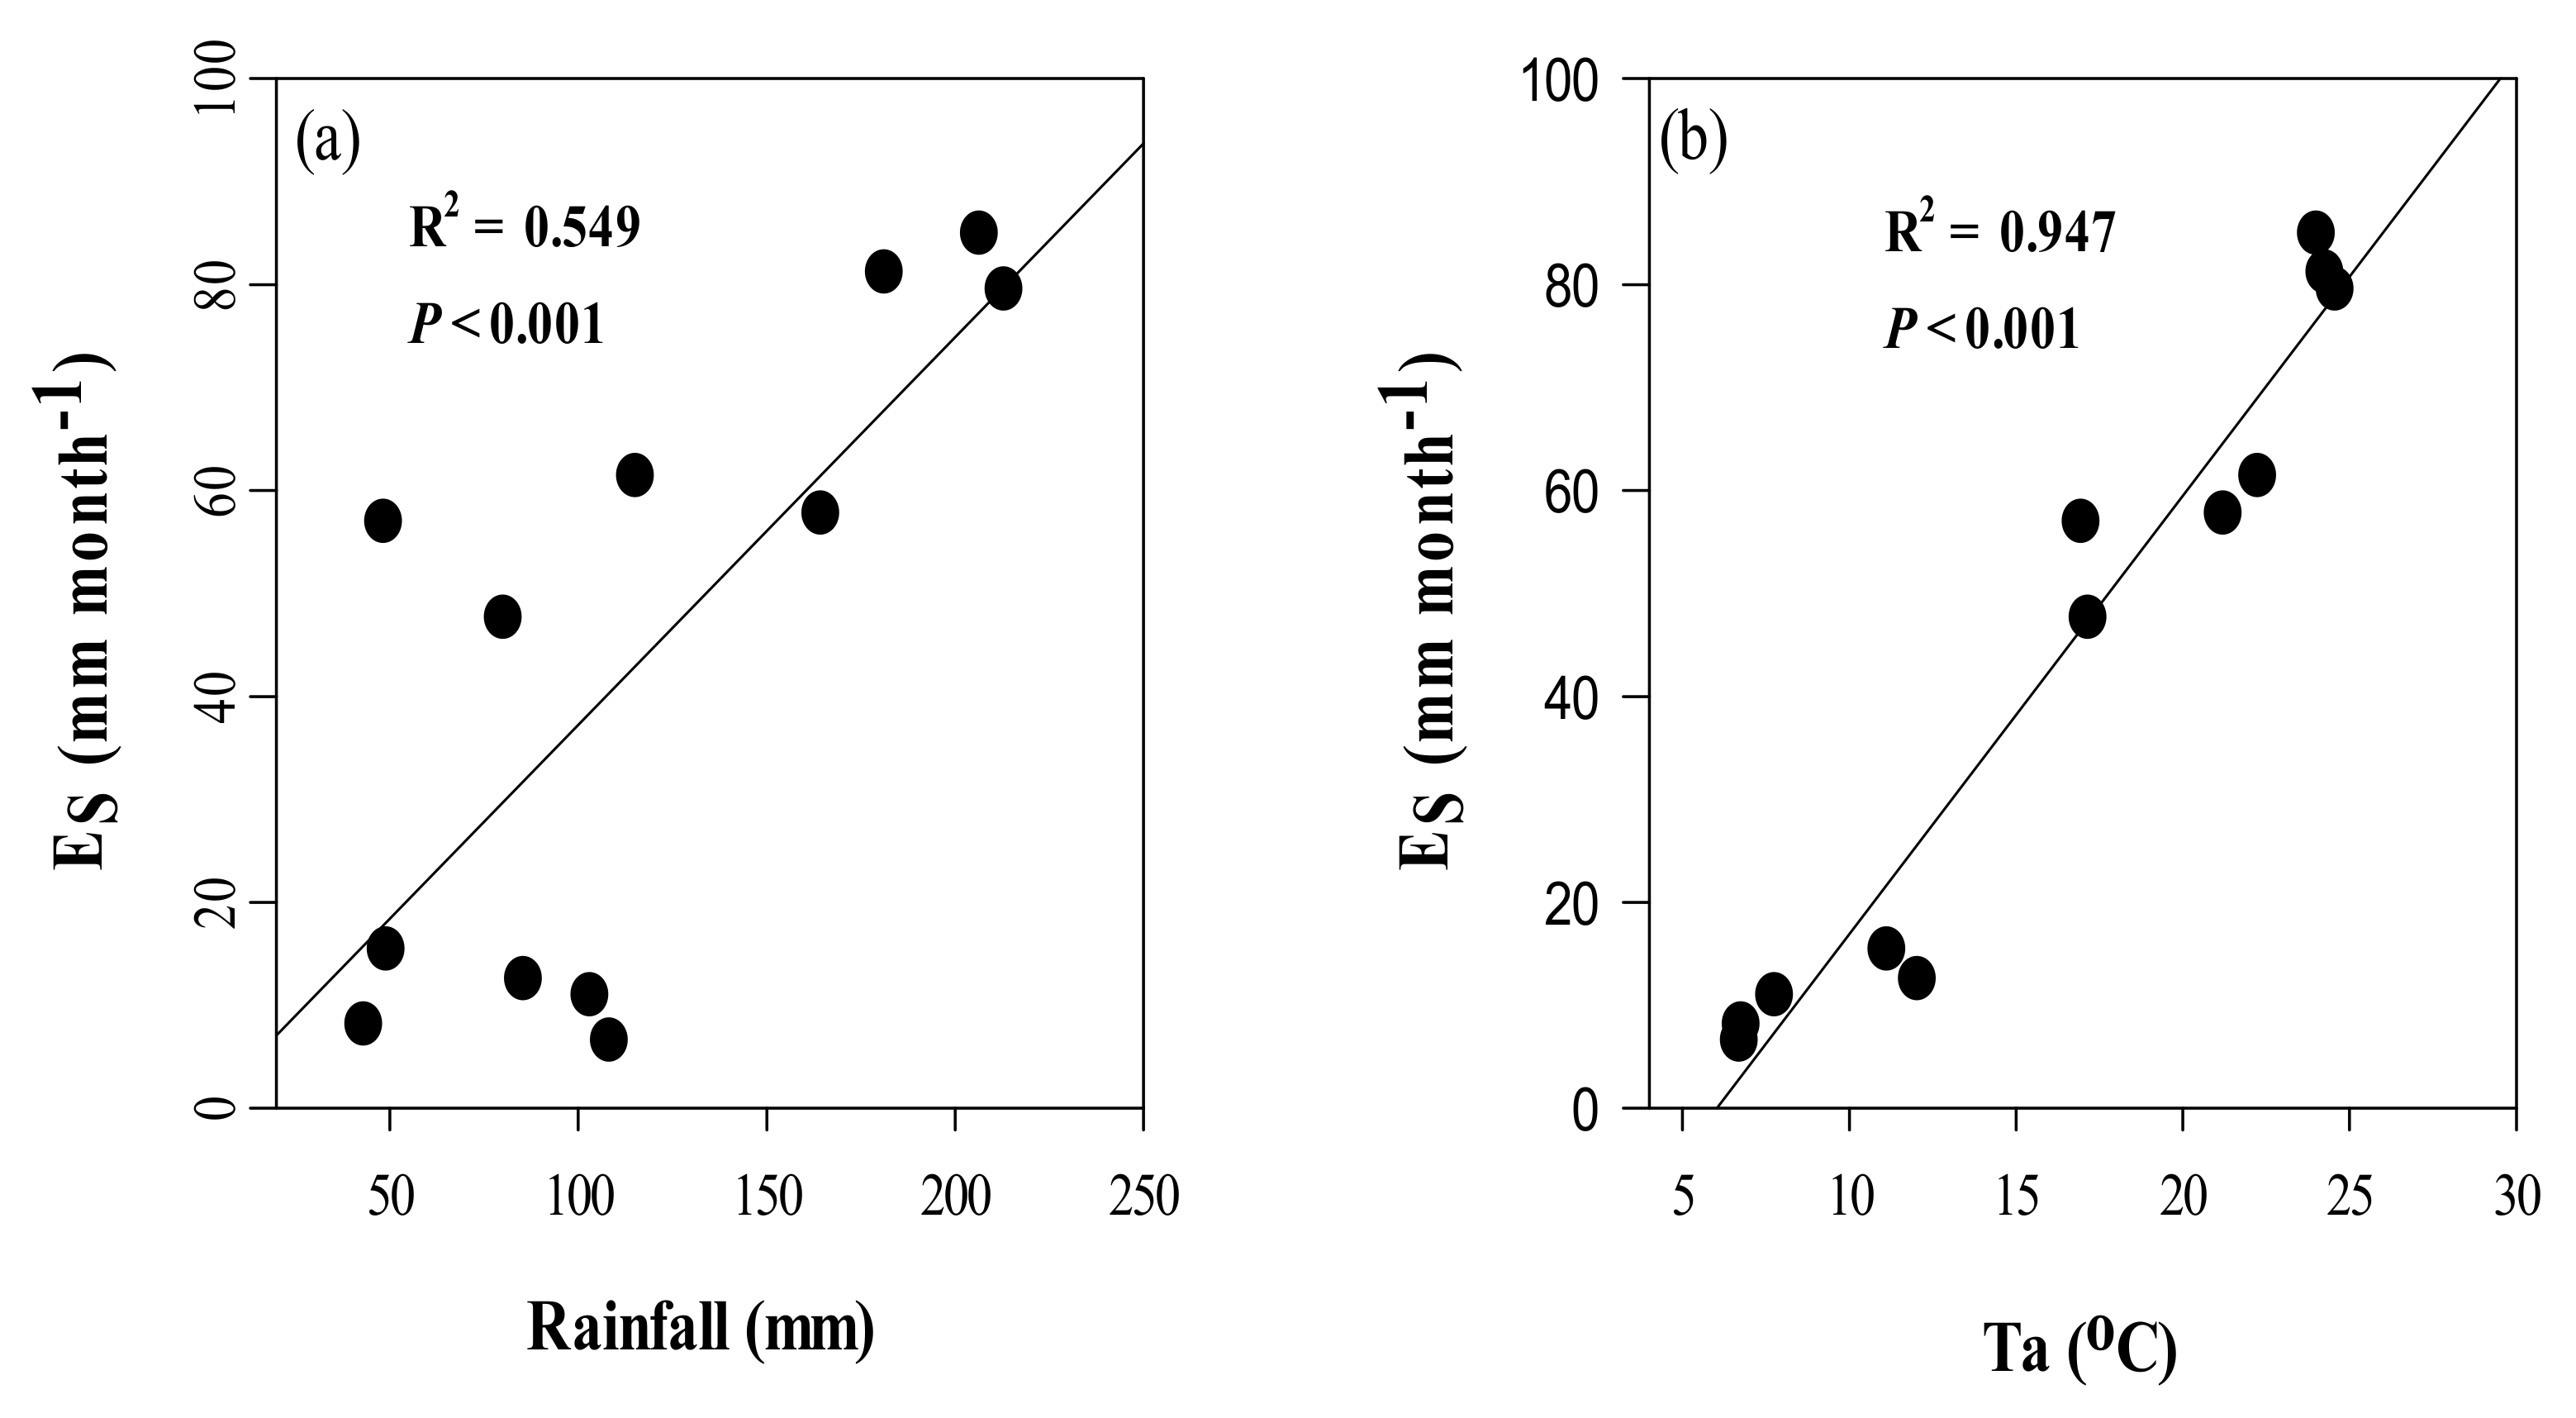
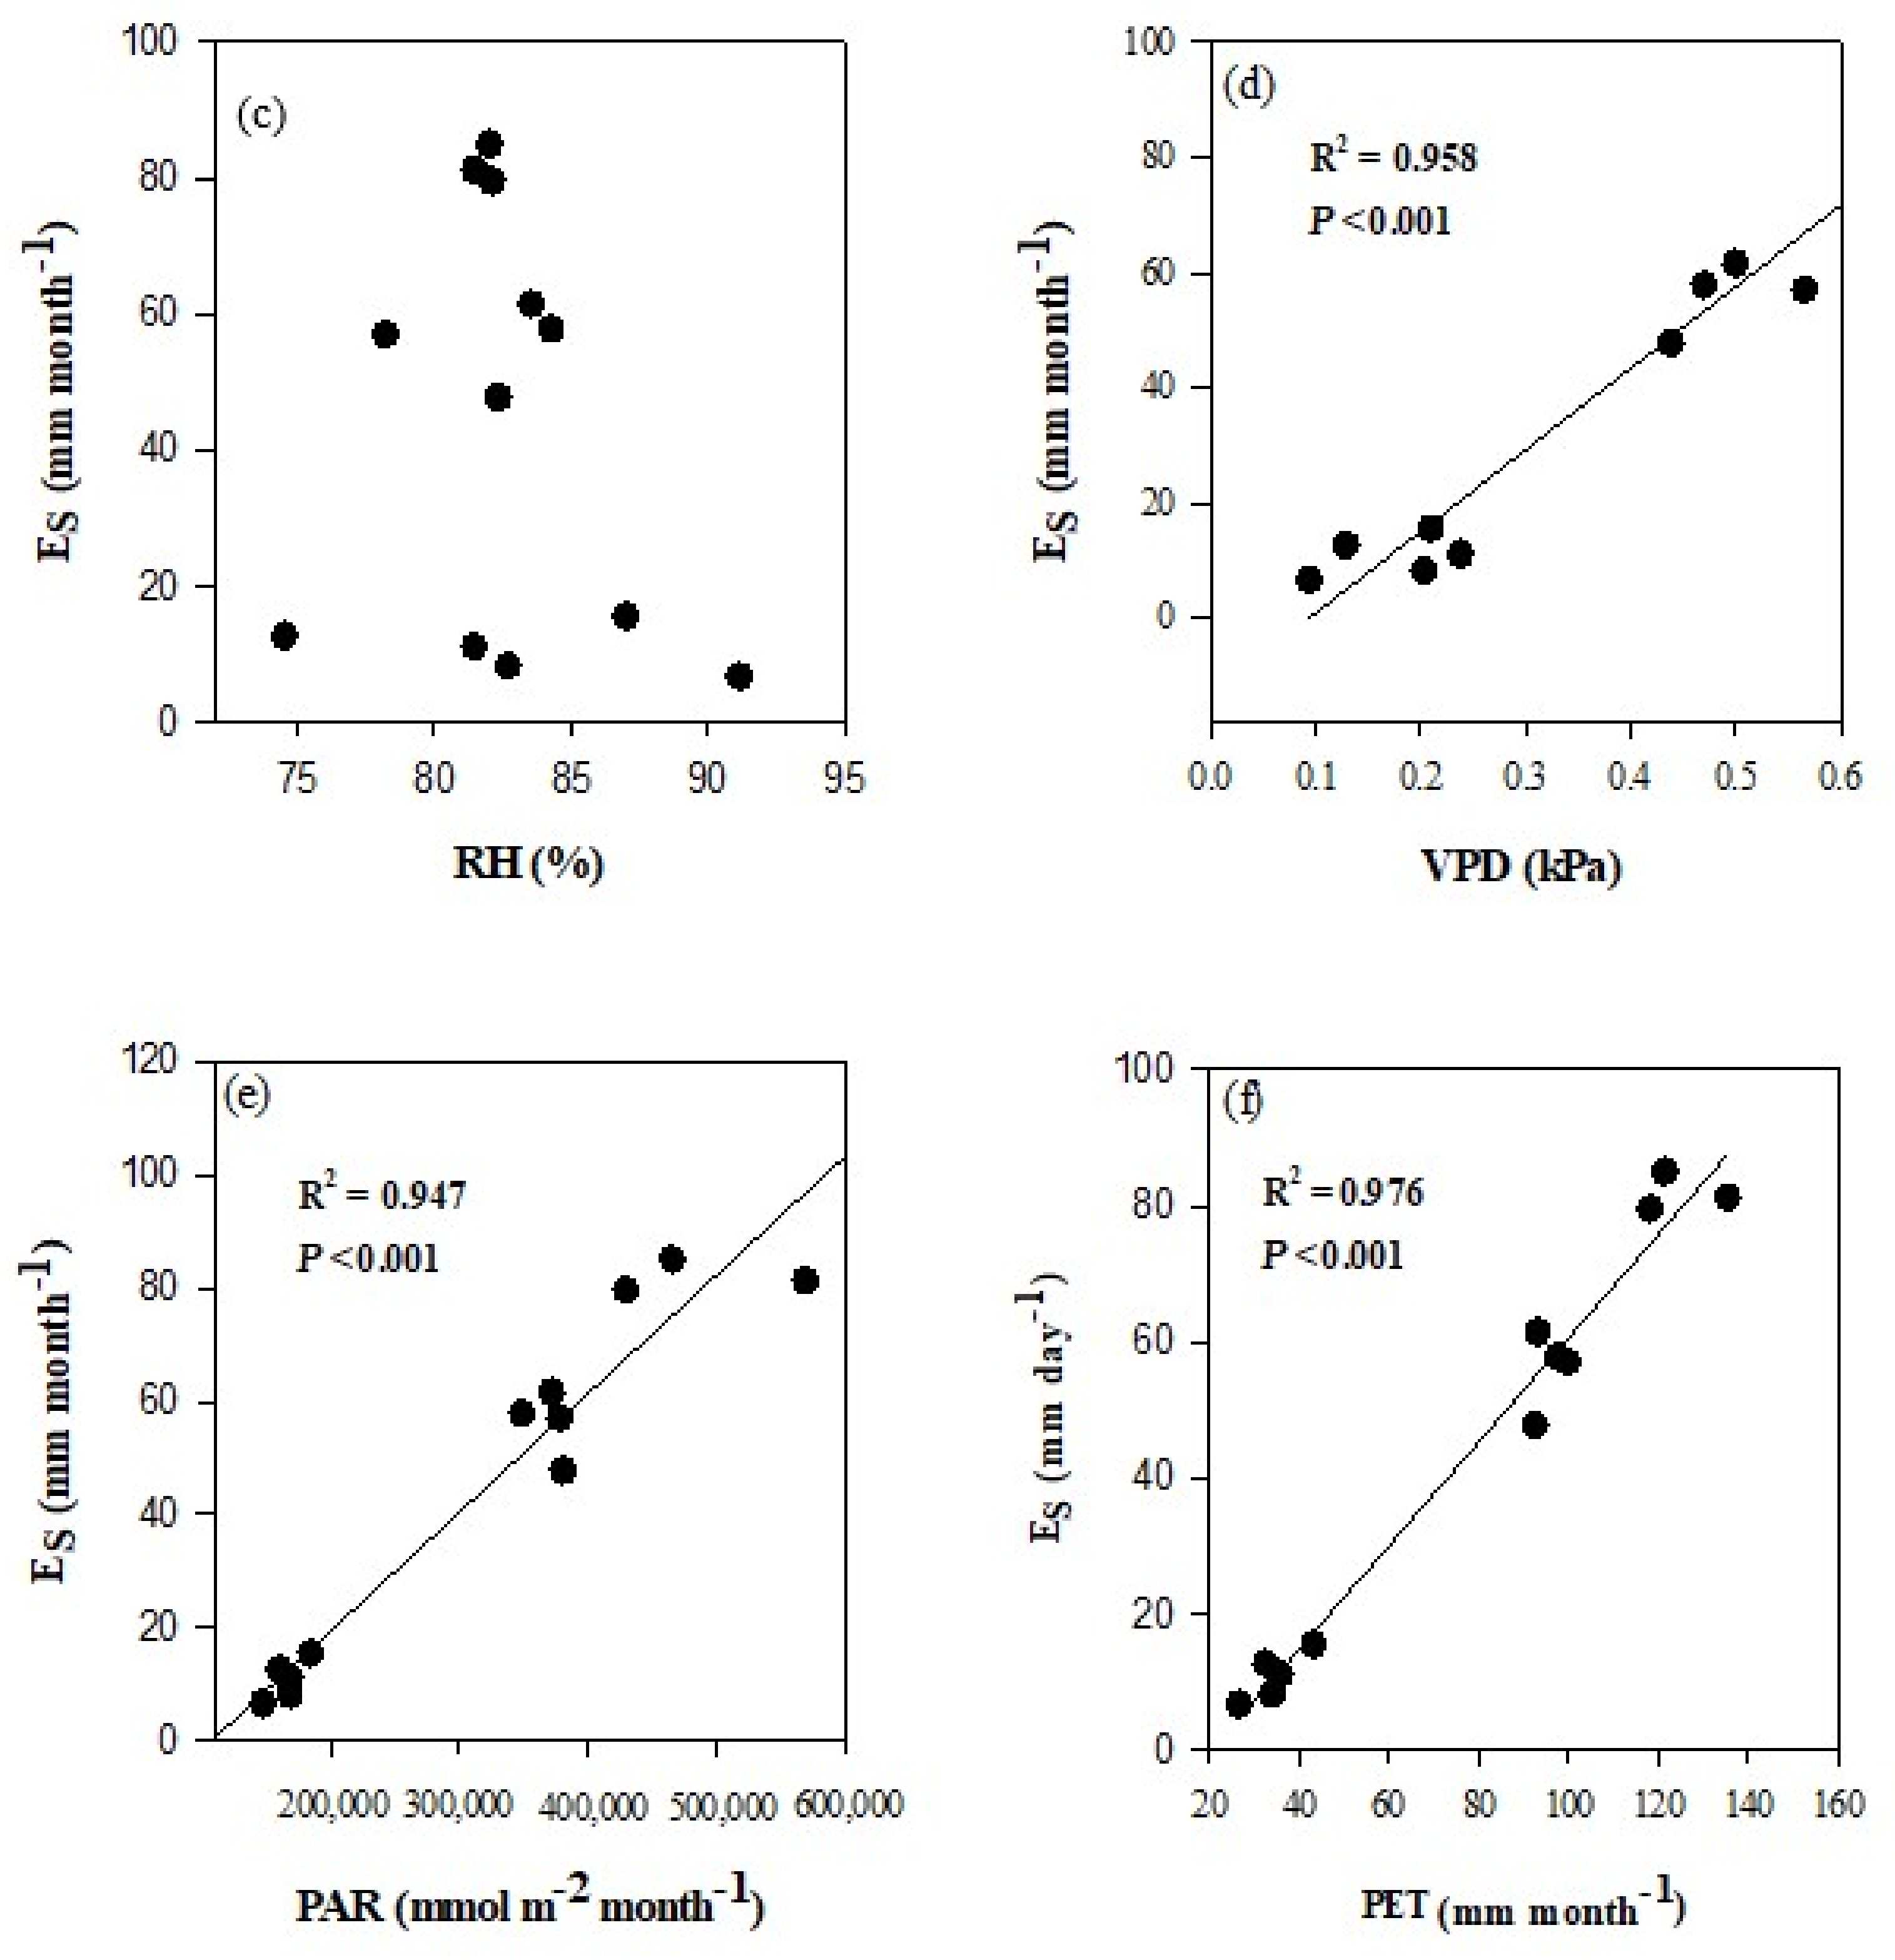
to determine how climatic variables affect Es in a C. lanceolata plantation.

2. Materials and Methods

2.1. Study Site

This study was conducted at the Huitong National Field Station for Scientific Observation Experiment for Chinese Fir Ecosystem (latitude 26°50′ N, longitude 109°45′ E). The study site has an elevation ranging from 280 to 390 m a.s.l, with a typical humid subtropical monsoon climate. The annual mean air temperature at the site is about 16.8 °C, with a mean monthly minimum temperature of 4.4 °C in January and a mean monthly maximum temperature of 26.3 °C in July. The annual rainfall averages 1268 mm, fluctuating between 944 and 1681 mm. The soil type is well-drained clay loam red soil, developed on slate and shale parent rock classified as lliti-Udic Ferrosols, corresponding to Acrisol in the World Reference Base for Soil Resources (Institute of Soil Science, Chinese Academy of Science 2001).
The Chinese fir plantation was 20 years old in 2015 and was the reforestation of a second rotation stand after a clear-cut in 1996. An experimental plot with an area of 25 m × 20 m was established in the center of the plantation for sap flow measurements. The plot was at a middle slope position, and the slope floor was flat. There were 100 trees in the plot in 2015 when this study was being carried out (Figure 1).

2.2. Meteorological Variables

The meteorological variables were measured in an adjacent open area outside the stands. They include air temperature (Ta) (°C), rainfall (mm), photosynthetically-active radiation (PAR) (umol m2 s−1), and air relative humidity (RH) (%). Air temperature and RH were measured by a thermohygrograph (HMP50, Vaisala, Helsinki, Finland). Rainfall was measured using a tipping-bucket rain gauge (Davis Rain collector II model 7852, Davis Instruments, Hayward, CA, USA), and PAR was measured using a pyranometer (LI-200, Li-Cor Inc., Lincoln, NE, USA). Measurements were recorded every 30 s and stored in a 30-min average in a data logger (CR10X, Campbell Scientific, Logan, UT, USA). VPD was calculated using relative humidity and temperature, as described by Campbell and Norman [30]. The daily potential evapotranspiration (PET) was calculated using the Food and Agriculture Organization (FAO) Penman-Monteith equation, described by Allen et al. [31].

2.3. Sapwood Area Determination

To avoid damaging the sampled trees used for sap flow measurements, a total of 40 core samples were collected using an increment borer (Haglöf Increment Borer, Långsele, Sweden) from 40 trees near the plot in order to identify the sapwood area, with samples covering a wide range of DBH classes. The yellowish sapwood from Chinese firs has a high moisture content and was easy to distinguish from the brown-colored heartwood in order to extract the cores. The sapwood area (As) was determined via the difference between the stem cross-sectional area beneath the bark and the heartwood area. Following Vertessy et al. [32], an allometric equation was used to relate As to DBH:
A S = B 0 × D B H B 1
where B0 and B1 are parameters of the equation.

2.4. Laboratory Experiment for Calibrating the Parameters of the Original Granier Equation

To test the accuracy of the original calibration equation proposed by Granier [9,29], a calibration system was built using cut stem segments from three Chinese fir trunks, using the gravimetric method described by Steppe et al. [33]. All stem segments were processed according to the procedure followed by Shinohara et al. [34]. Constant heads of water of 10, 20, 30, 40, 60, 80, and 100 cm were maintained on each cut stem segment for at least half an hour during the experiments.

2.5. Field Sap Flux Measurements and Scaling up of Sap Flux from Individual Trees to Stand

The SFD of 18 trees, representing the range of DBH classes in the study plot, were measured using Granier-type sensors [29] (Table 1) in 2015. The sensors were installed only at the north-facing side of 11 trees (tree nos. 1–11) and on two aspects (north and south) of seven trees (tree nos. 12–18) at a height of 1.3 m in order to quantify the azimuthal impacts in SFD. Each sensor consisted of two stainless steel probes, 10 mm long and 2 mm in diameter, inserted approximately 5 cm apart along the axis of the sapwood. The upper probe was heated by being supplied with a constant power of 0.2 W, while the lower probe remained unheated, and the temperature difference between the two probes was converted to SFD according to the calibrated equation used in this study. Sap flow signals were recorded every 30 s and averaged over 30 min in a data logger (CR1000, Campbell Scientific, Logan, UT, USA) with a multiplexer (AM16/32, Campbell Scientific, Logan, UT, USA). To minimize the thermal interference caused by direct sunlight and wind, the sensors were shielded with aluminum foil.
Whole-tree sap flow (F) was calculated as the product of SFD and the sapwood cross-sectional area [29]:
F = S F D × A S
Es was calculated from the sap flow measurements of individual trees using the following equation [35]:
E s = S F D mean × A ST A G
where Es is the stand transpiration, SFDmean is the mean stand SFD, AST is the total cross-sectional sapwood area in the study plot, and AG is the ground area in the plot. SFDmean was calculated as:
S F D mean = i n F i × A si A ST
where Fi is the average SFD of the ith DBH class and Asi is the total sapwood area of the sample trees of the ith DBH class.

2.6. Statistical Analysis

Recalibration curves were produced by fitting a least-squares power function to the pooled data for all measured segments. Pearson’s correlation analysis was used to test the significance of correlations between SFD, DBH, and tree height. An exponential threshold model was used [36] to analyze the effects of VPD and PAR on Es at a daily scale:
E s = a × ( 1 e b × X )
where a and b are fitting parameters, Es is daily transpiration, and X is the corresponding climate variable. The effects of rainfall, Ta, RH, and PET on the daily Es and monthly Es were investigated by linear regression. All analyses were performed in R 3.00 statistical software (R Development Core Team, 2015) for Microsoft Windows 10 [37].

3. Results

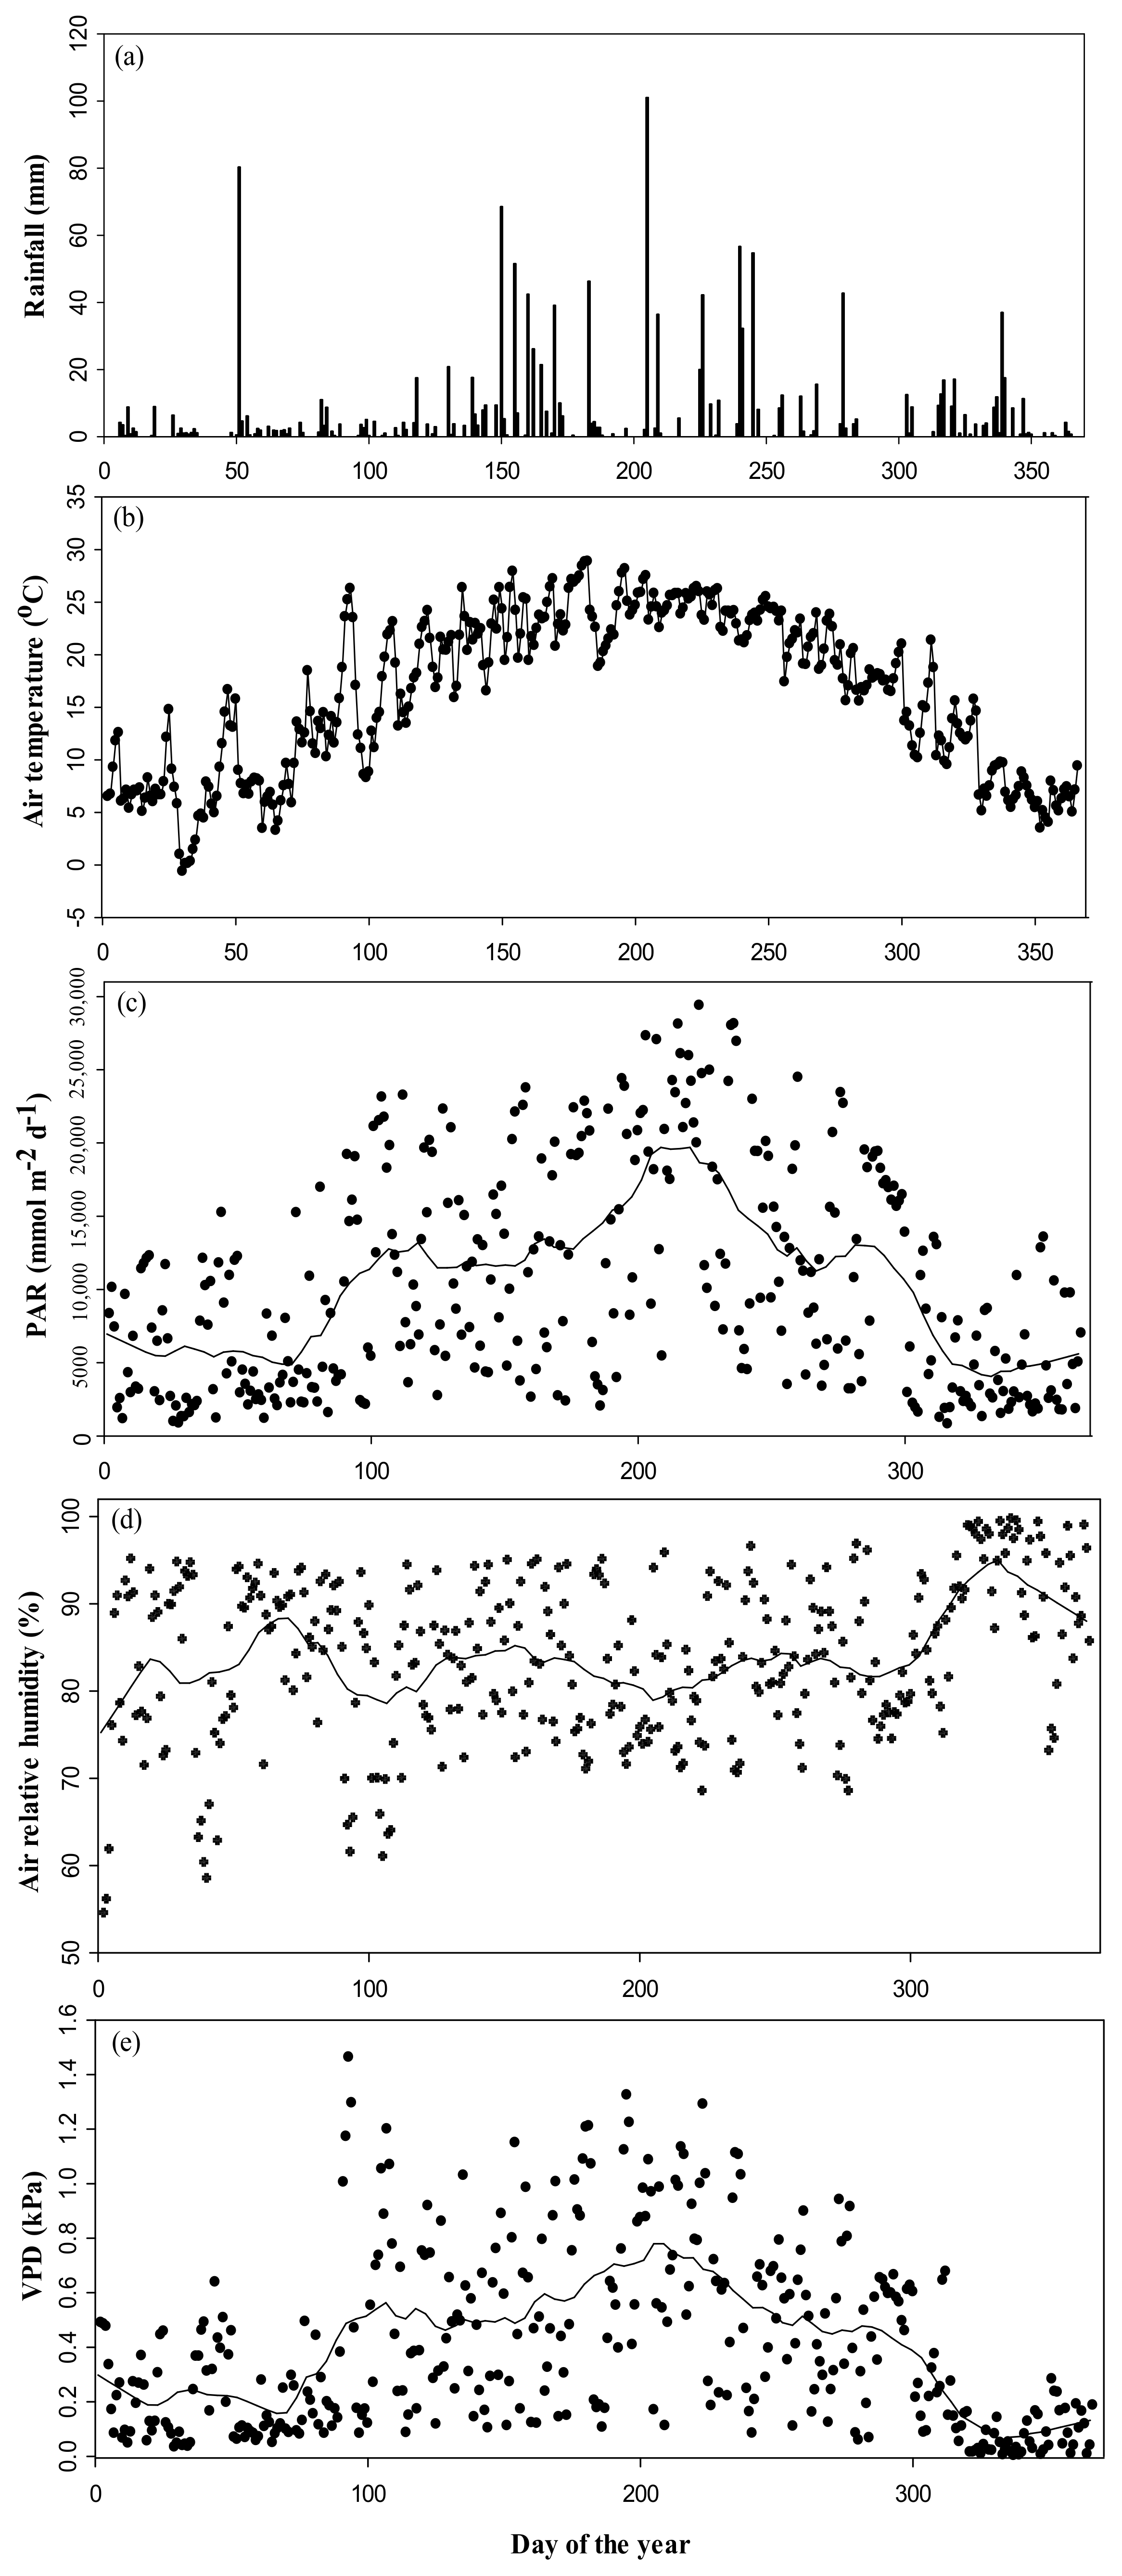
3.1. Climate Variables during the Study Period

The daily climate variables showed distinctive seasonal variations during the period (Figure 2). A gross rainfall of 1400.0 mm was recorded at the study site, which occurred mainly from April to September, and exhibited high intra-annual variability. The mean daily air temperature was 16.3 °C, with the minimum of −0.1 °C recorded in January and a maximum of 28.9 °C observed in June (Figure 2). The mean daily PAR was 37.3 mol m−2 day−1, and the lowest values were generally observed between January and March, while the highest values were observed between July and August (Figure 2). The mean daily VPD was 4.0 hPa, with high values observed in July and low values observed in December (Figure 2).

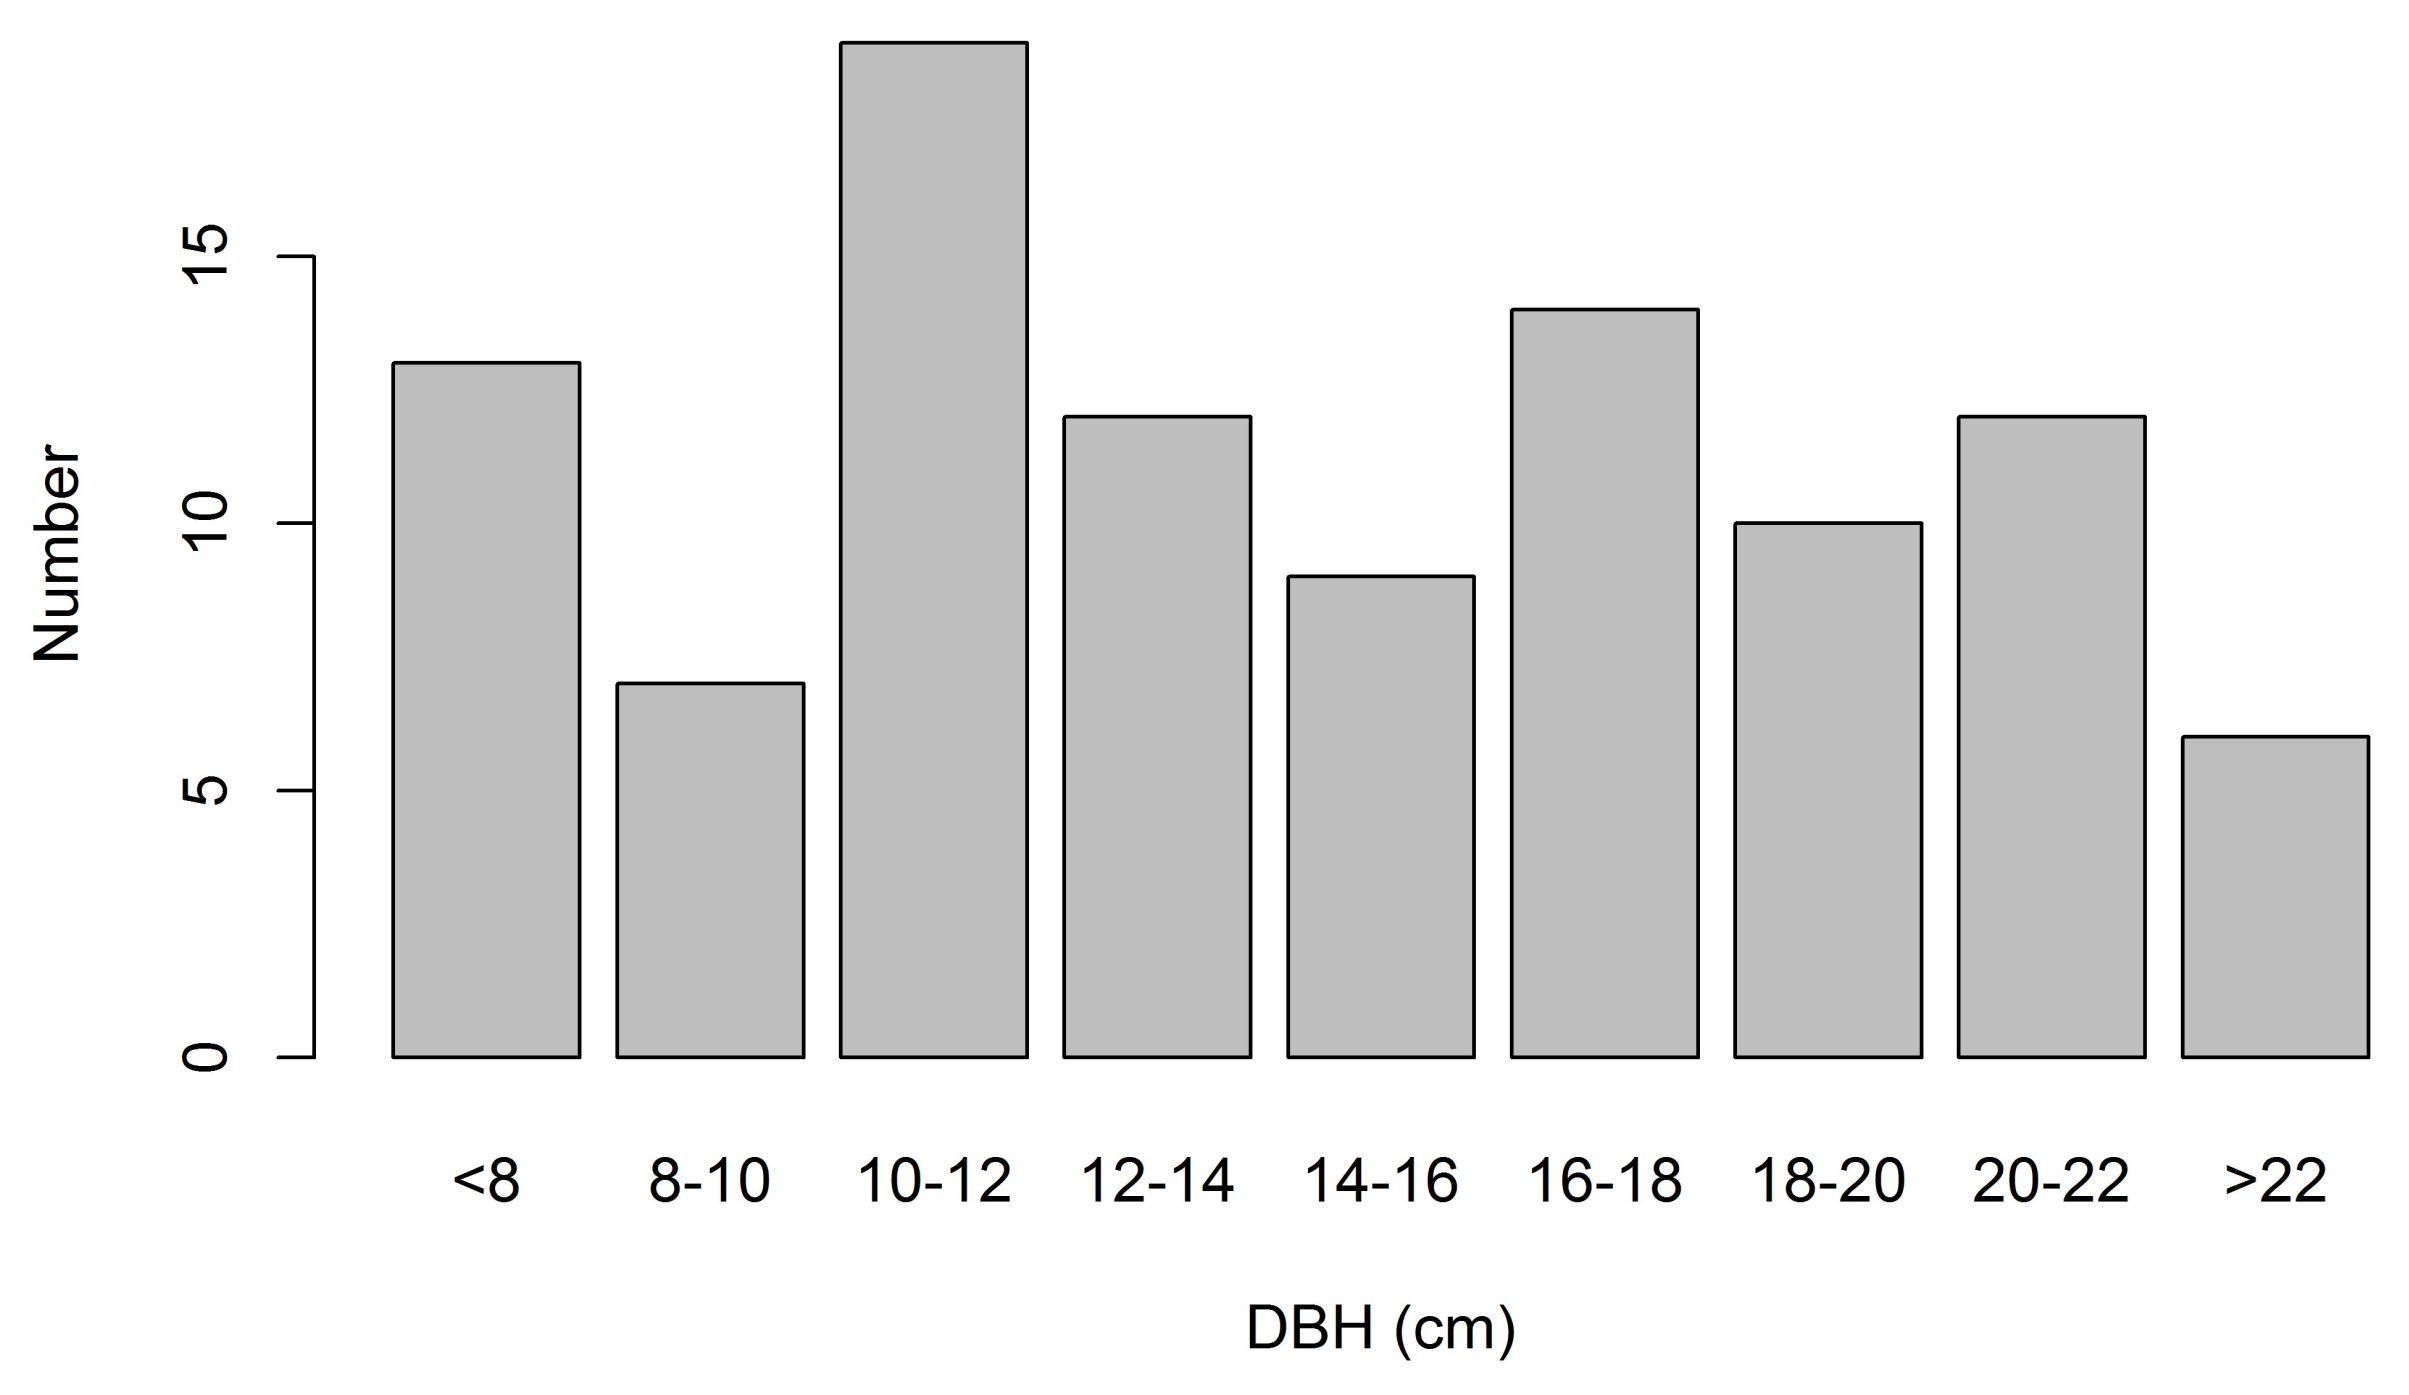
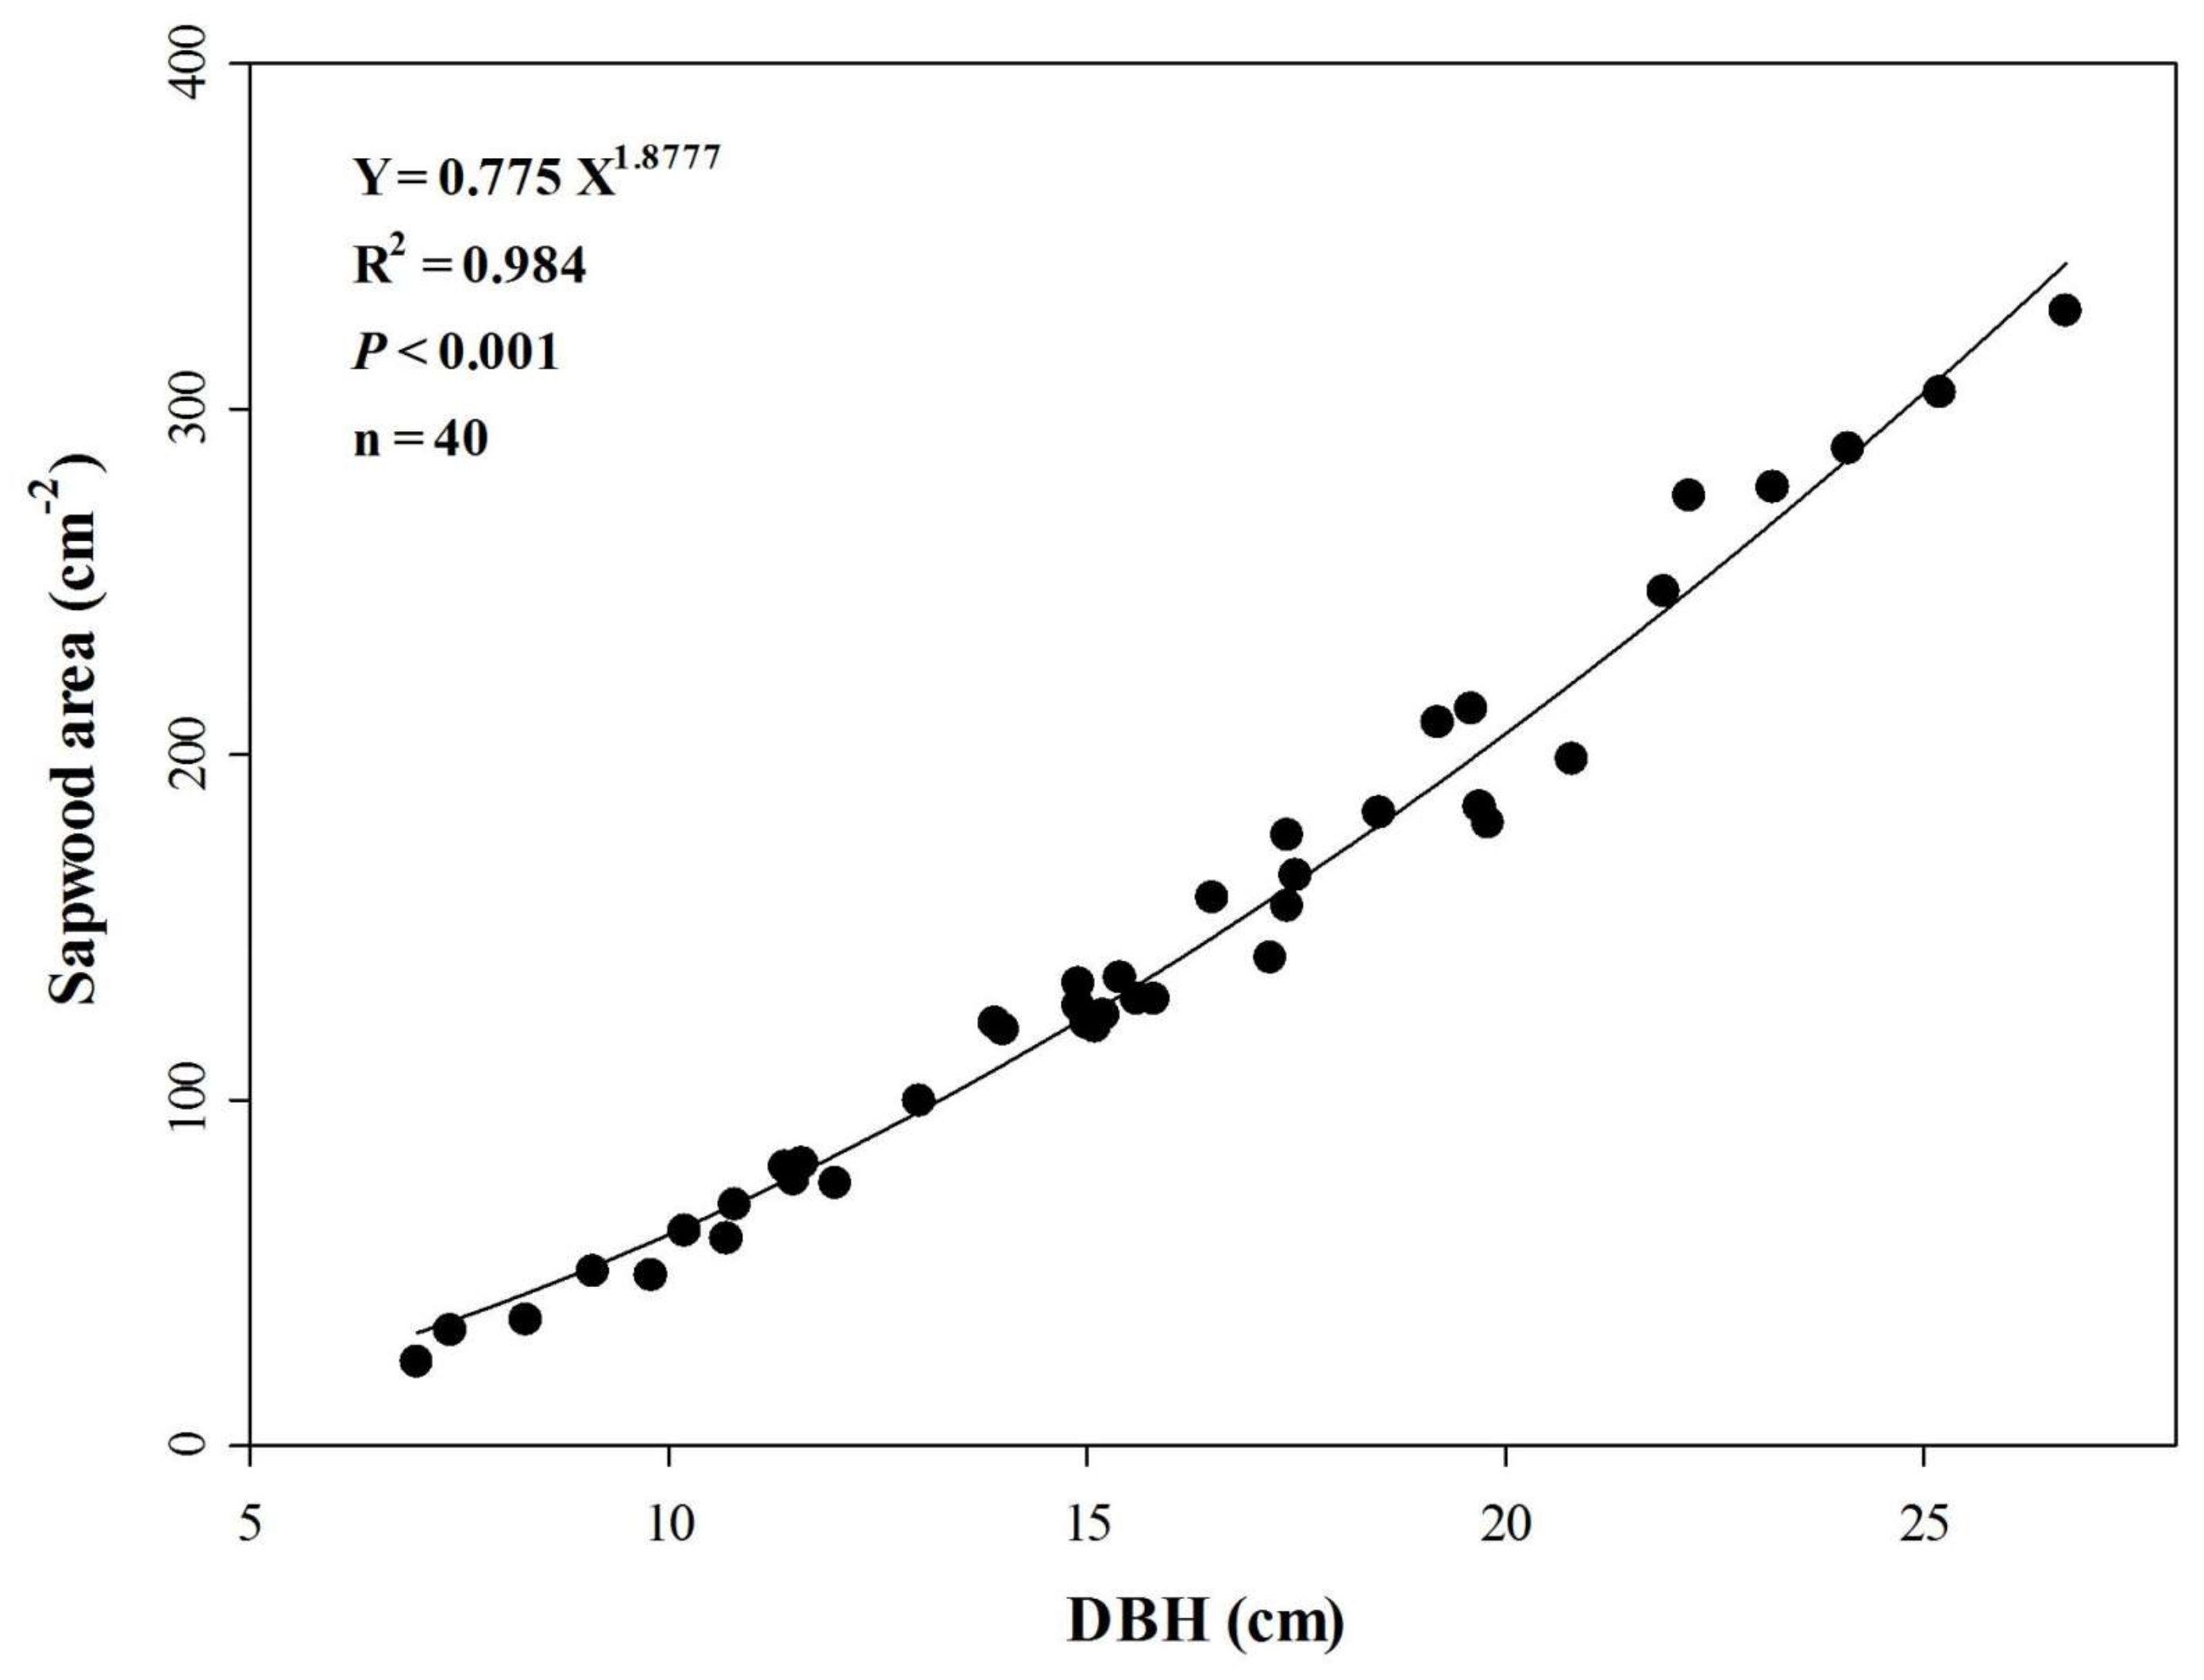
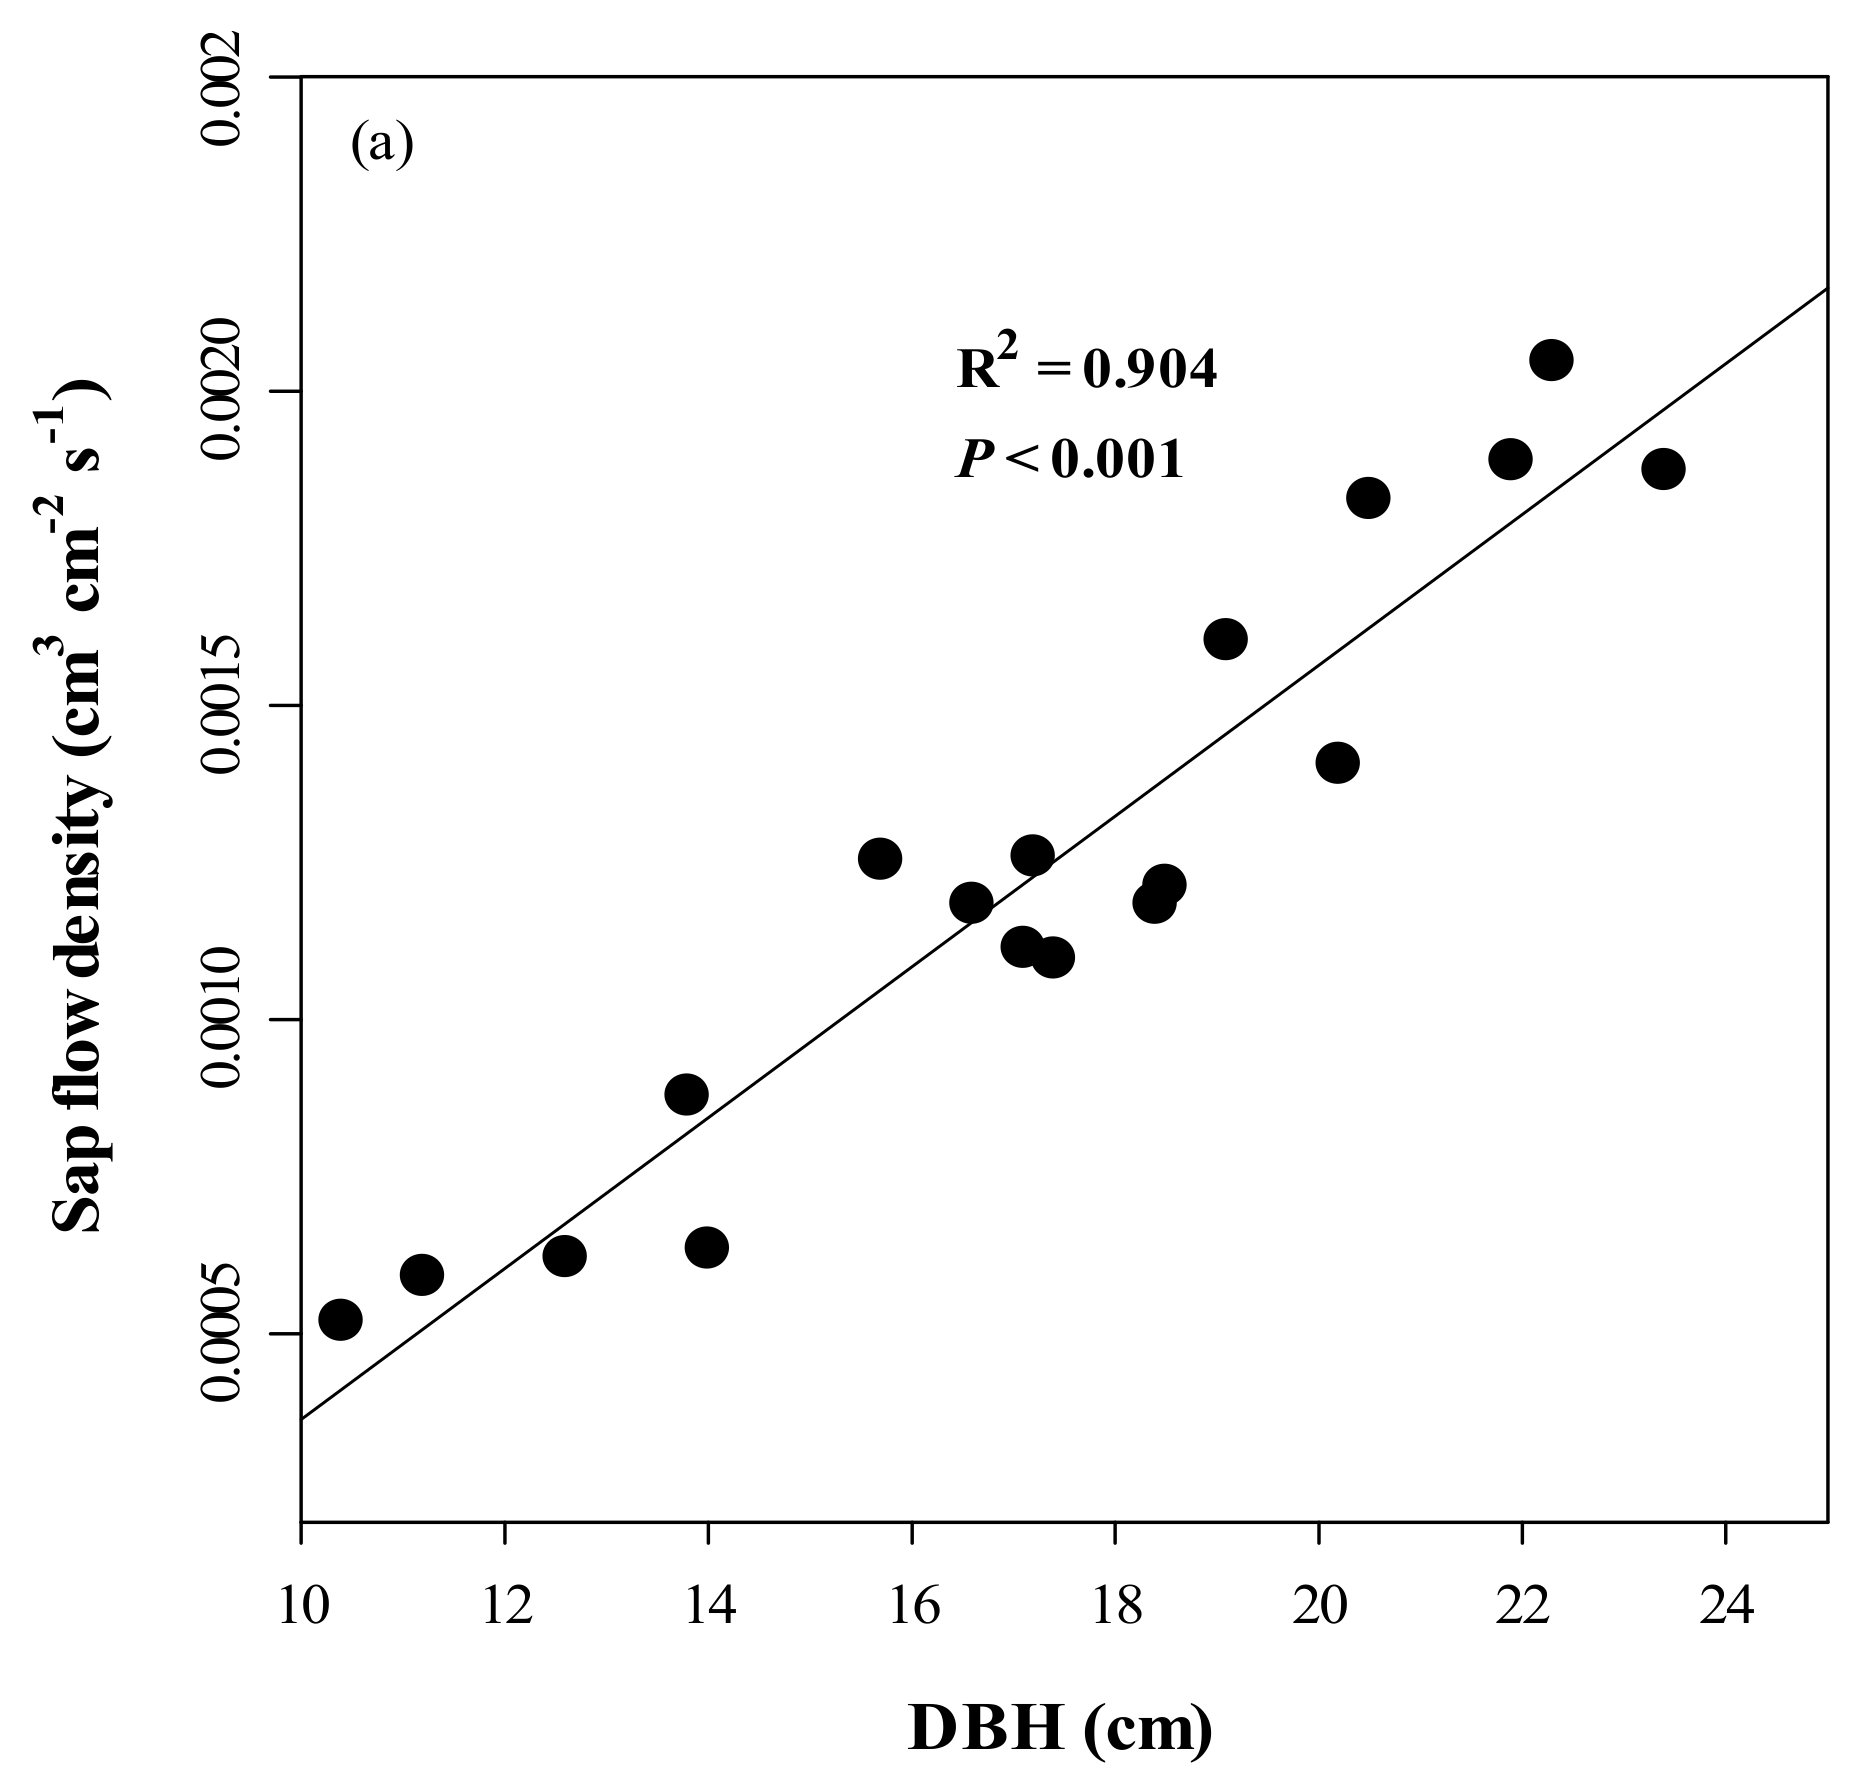
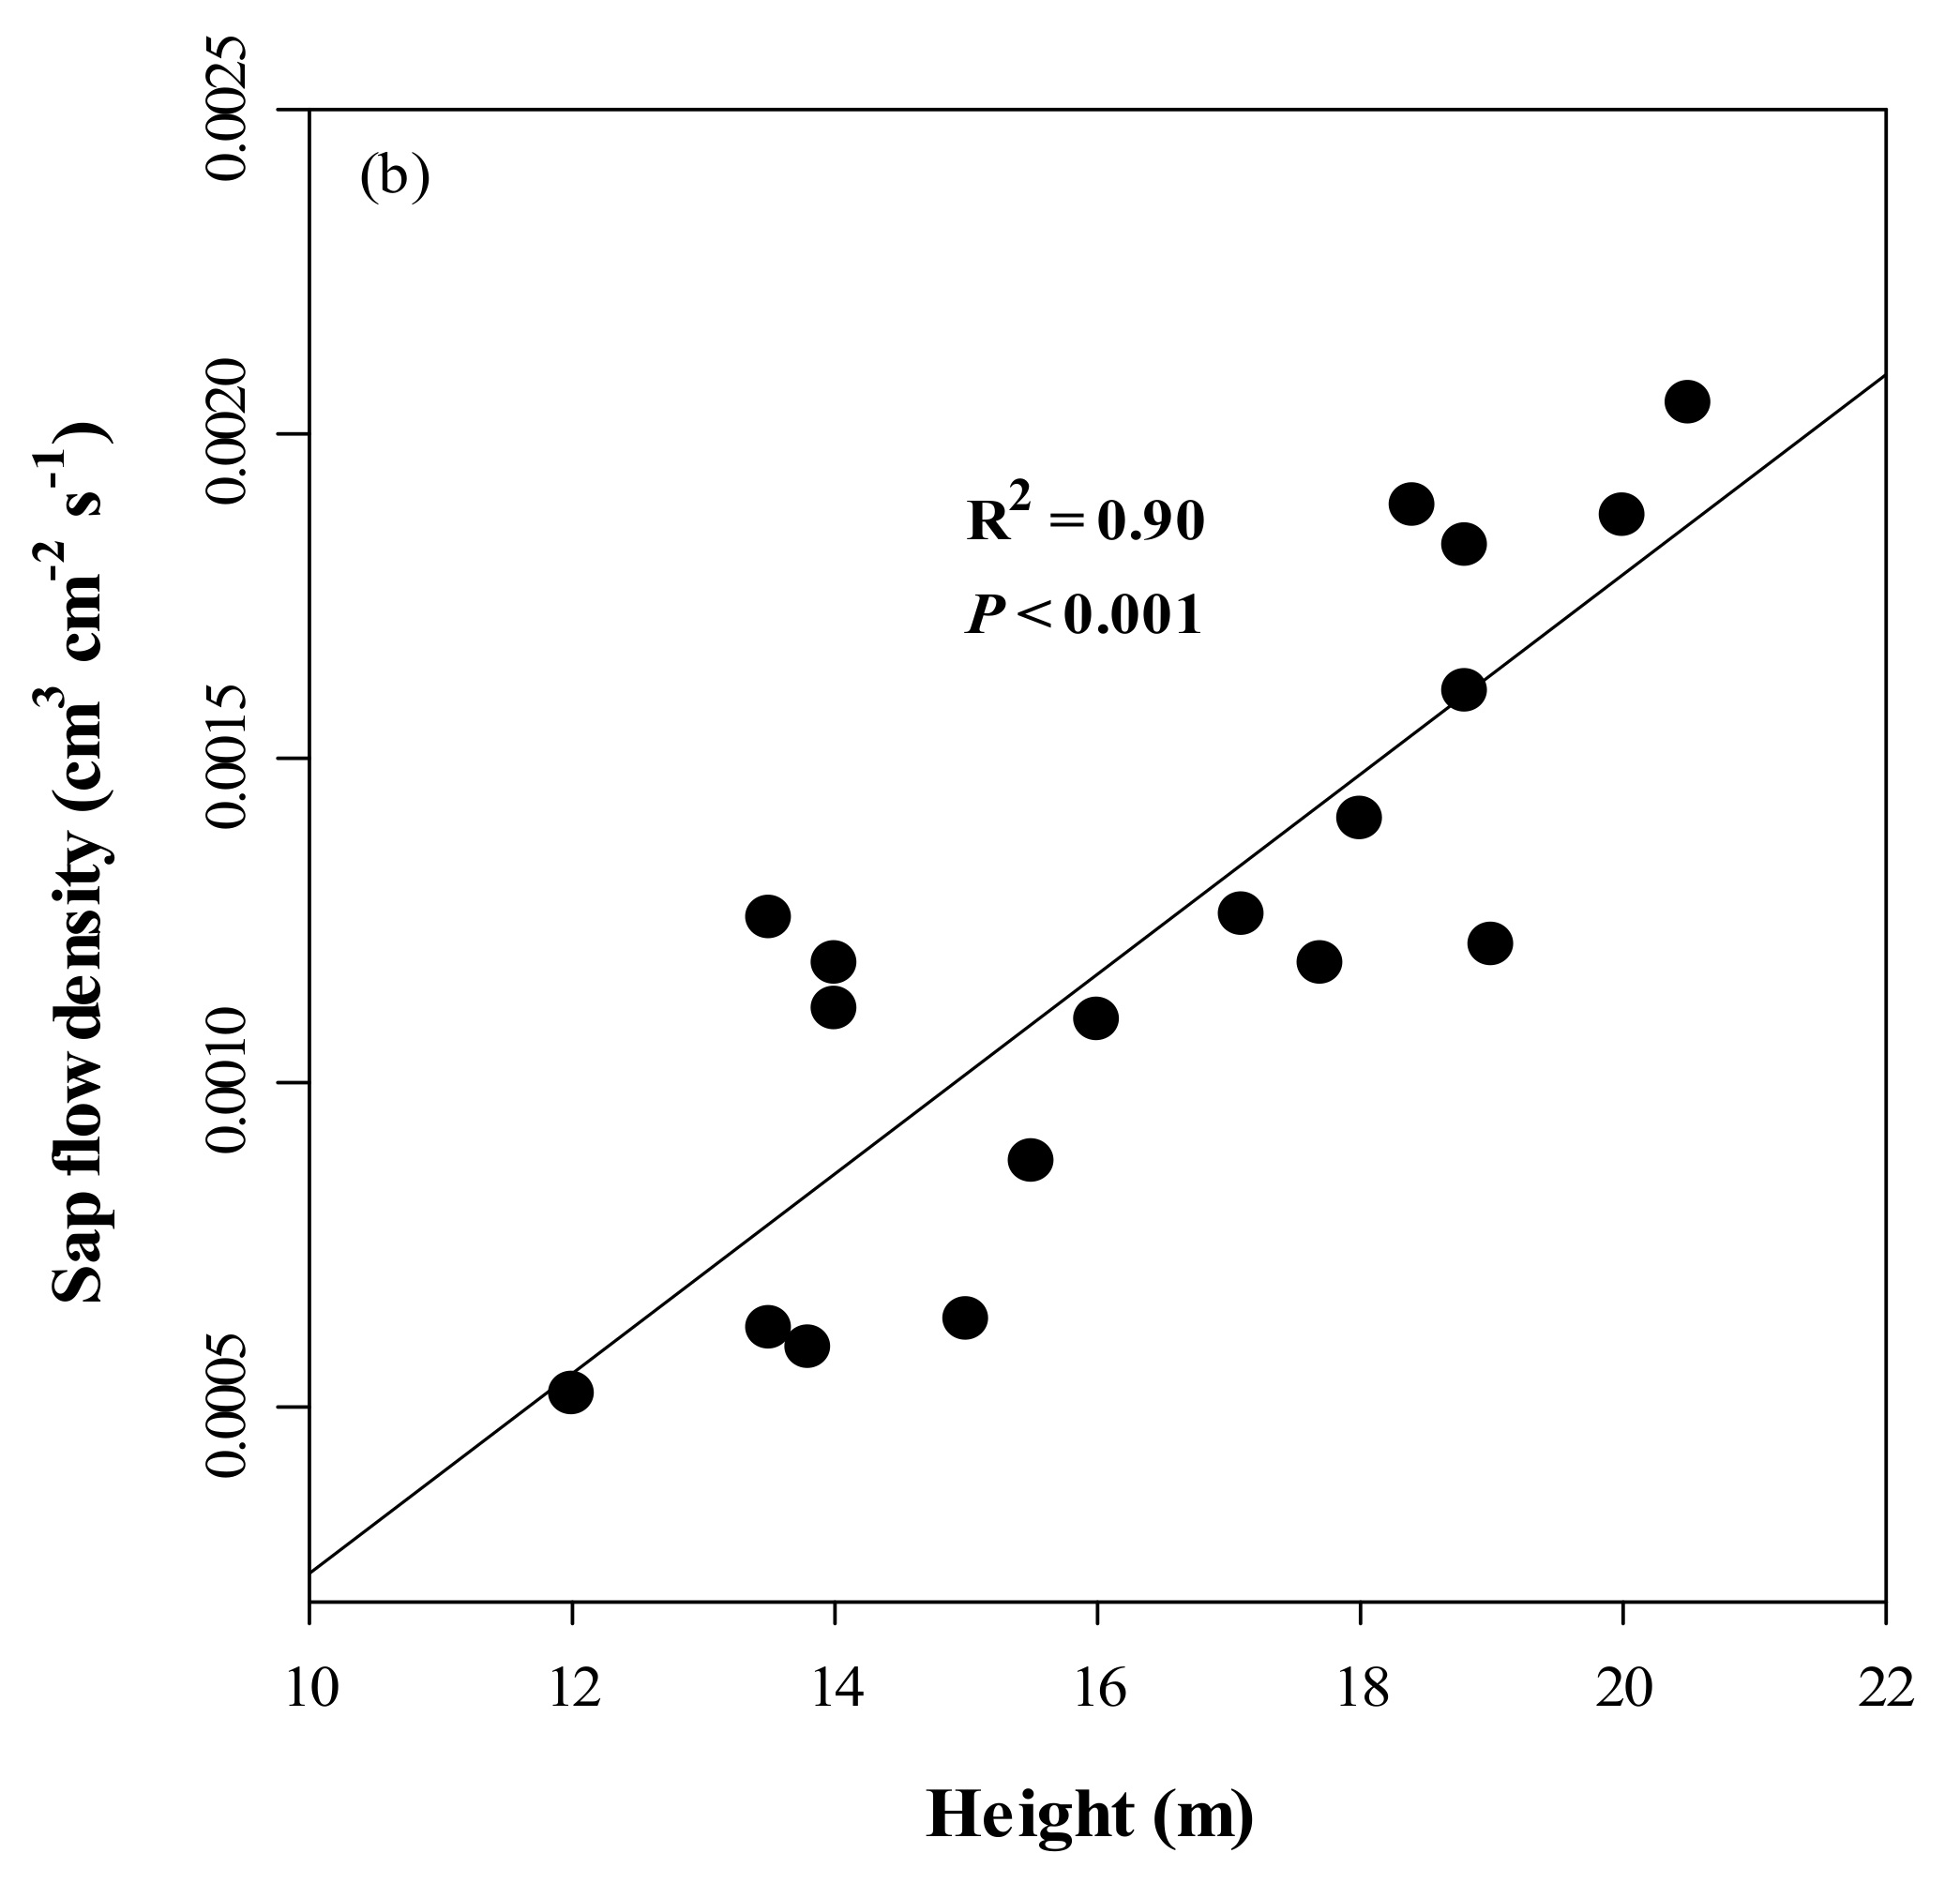
3.2. Sapwood Area and Its Relationship with DBH

A regression equation relating As to DBH was derived from the cores of 40 sampled trees (Figure 3). The As of Chinese fir trees was well fitted by a power function of DBH (As = 0.755 × DBH1.8777, R2 = 0.984, p < 0.001). Based on this equation, the As of Chinese fir trees in the study plot ranged from 19 to 281 cm2 with a mean value of 124 cm2 and the total As of the plot (AST) was 1 m2.

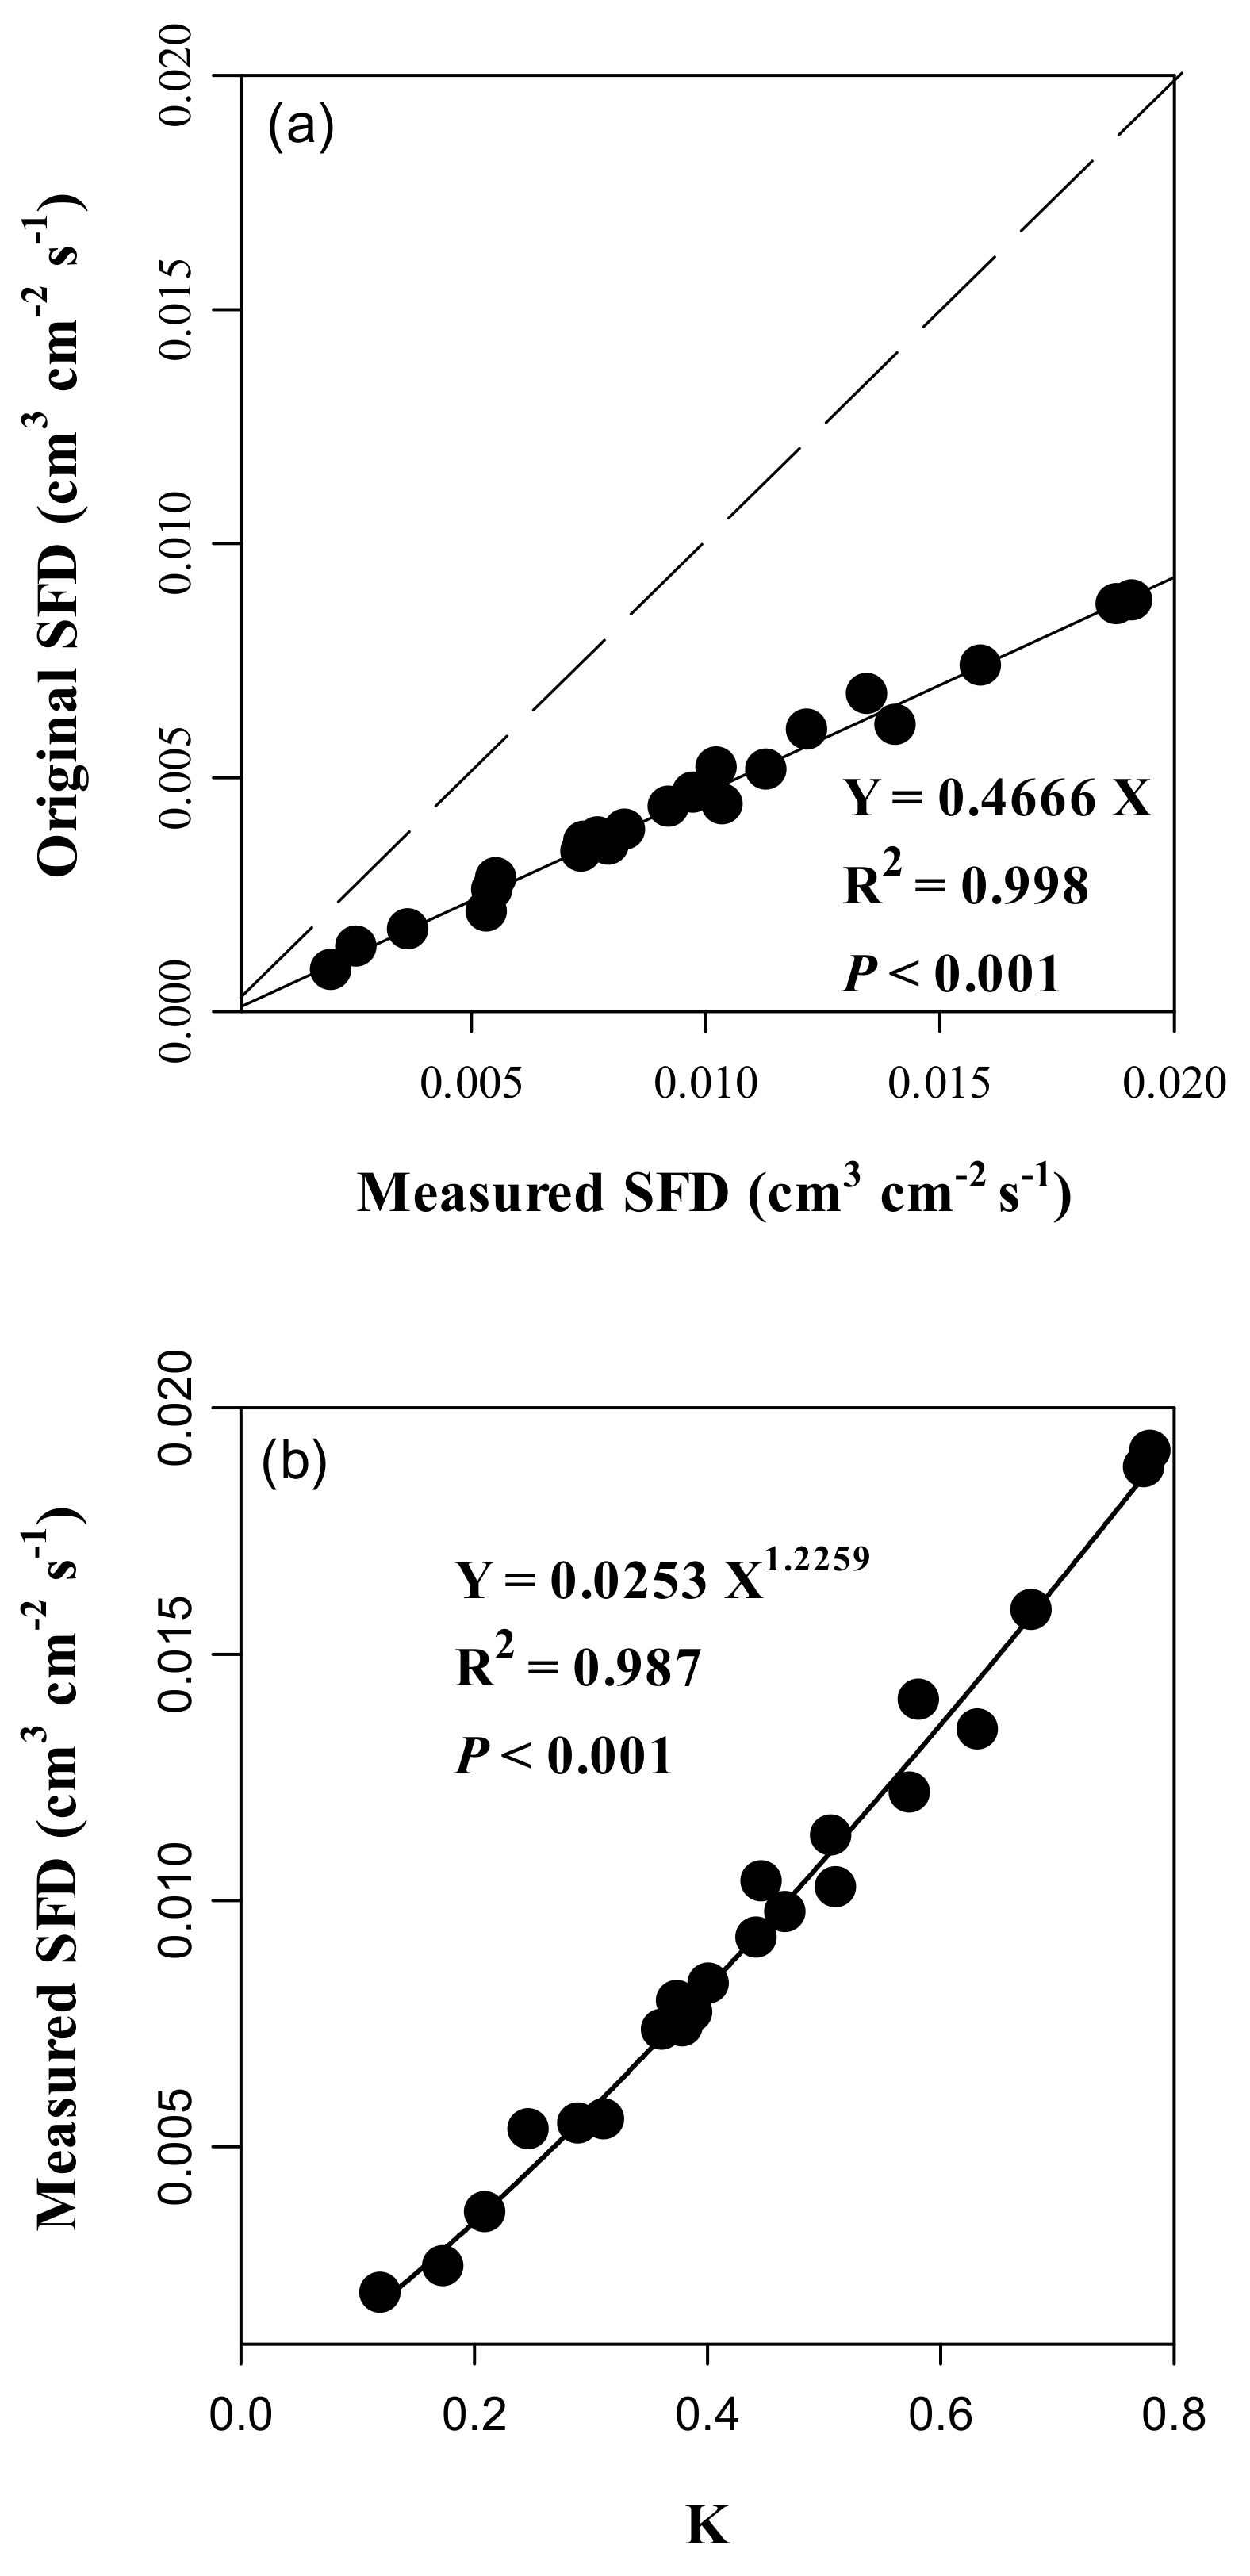
3.3. Accuracy and Error of the Calibrated Equation and Variations in SFD

The relationship between SFD values, estimated from the original Granier equation and measured via the gravimetric method, is shown in Figure 4a. The SFD values measured by the gravimetric method for different stem segments ranged from 0.019 to 0.208 cm3 m−2 s−1. Overall, the original Granier equation underestimated the actual SFD, and this error became more pronounced as SFD increased. The average percentage error between the SFD measured by the gravimetric method and the SFD estimated via the original Granier equation was 54%.
The values of parameters a and b after the calibration for Chinese firs differed from those in the original Granier equation (Equation (1)) (Figure 4b), in particular for a. The calibrated parameters of the new equation, based on the data for the laboratory experiment, were 0.0253 for a and 1.2259 for b, implying that the values originally proposed had errors of +112.6% and −0.4% for Chinese firs. For all of the 18 trees sampled, the mean SFD in 2015 was 0.0012 cm3 cm−2 s−1, with values ranging from 0.000052 (tree no. 1) to 0.0020 cm3 cm−2 s−1 (tree no. 17). The coefficient of variation (CV) of the SFD for the 18 trees was 38.6%. Figure 5 shows that SFD was significantly and positively correlated with DBH (R2 = 0.90, p < 0.001) and tree height (R2 = 0.71, p < 0.001).

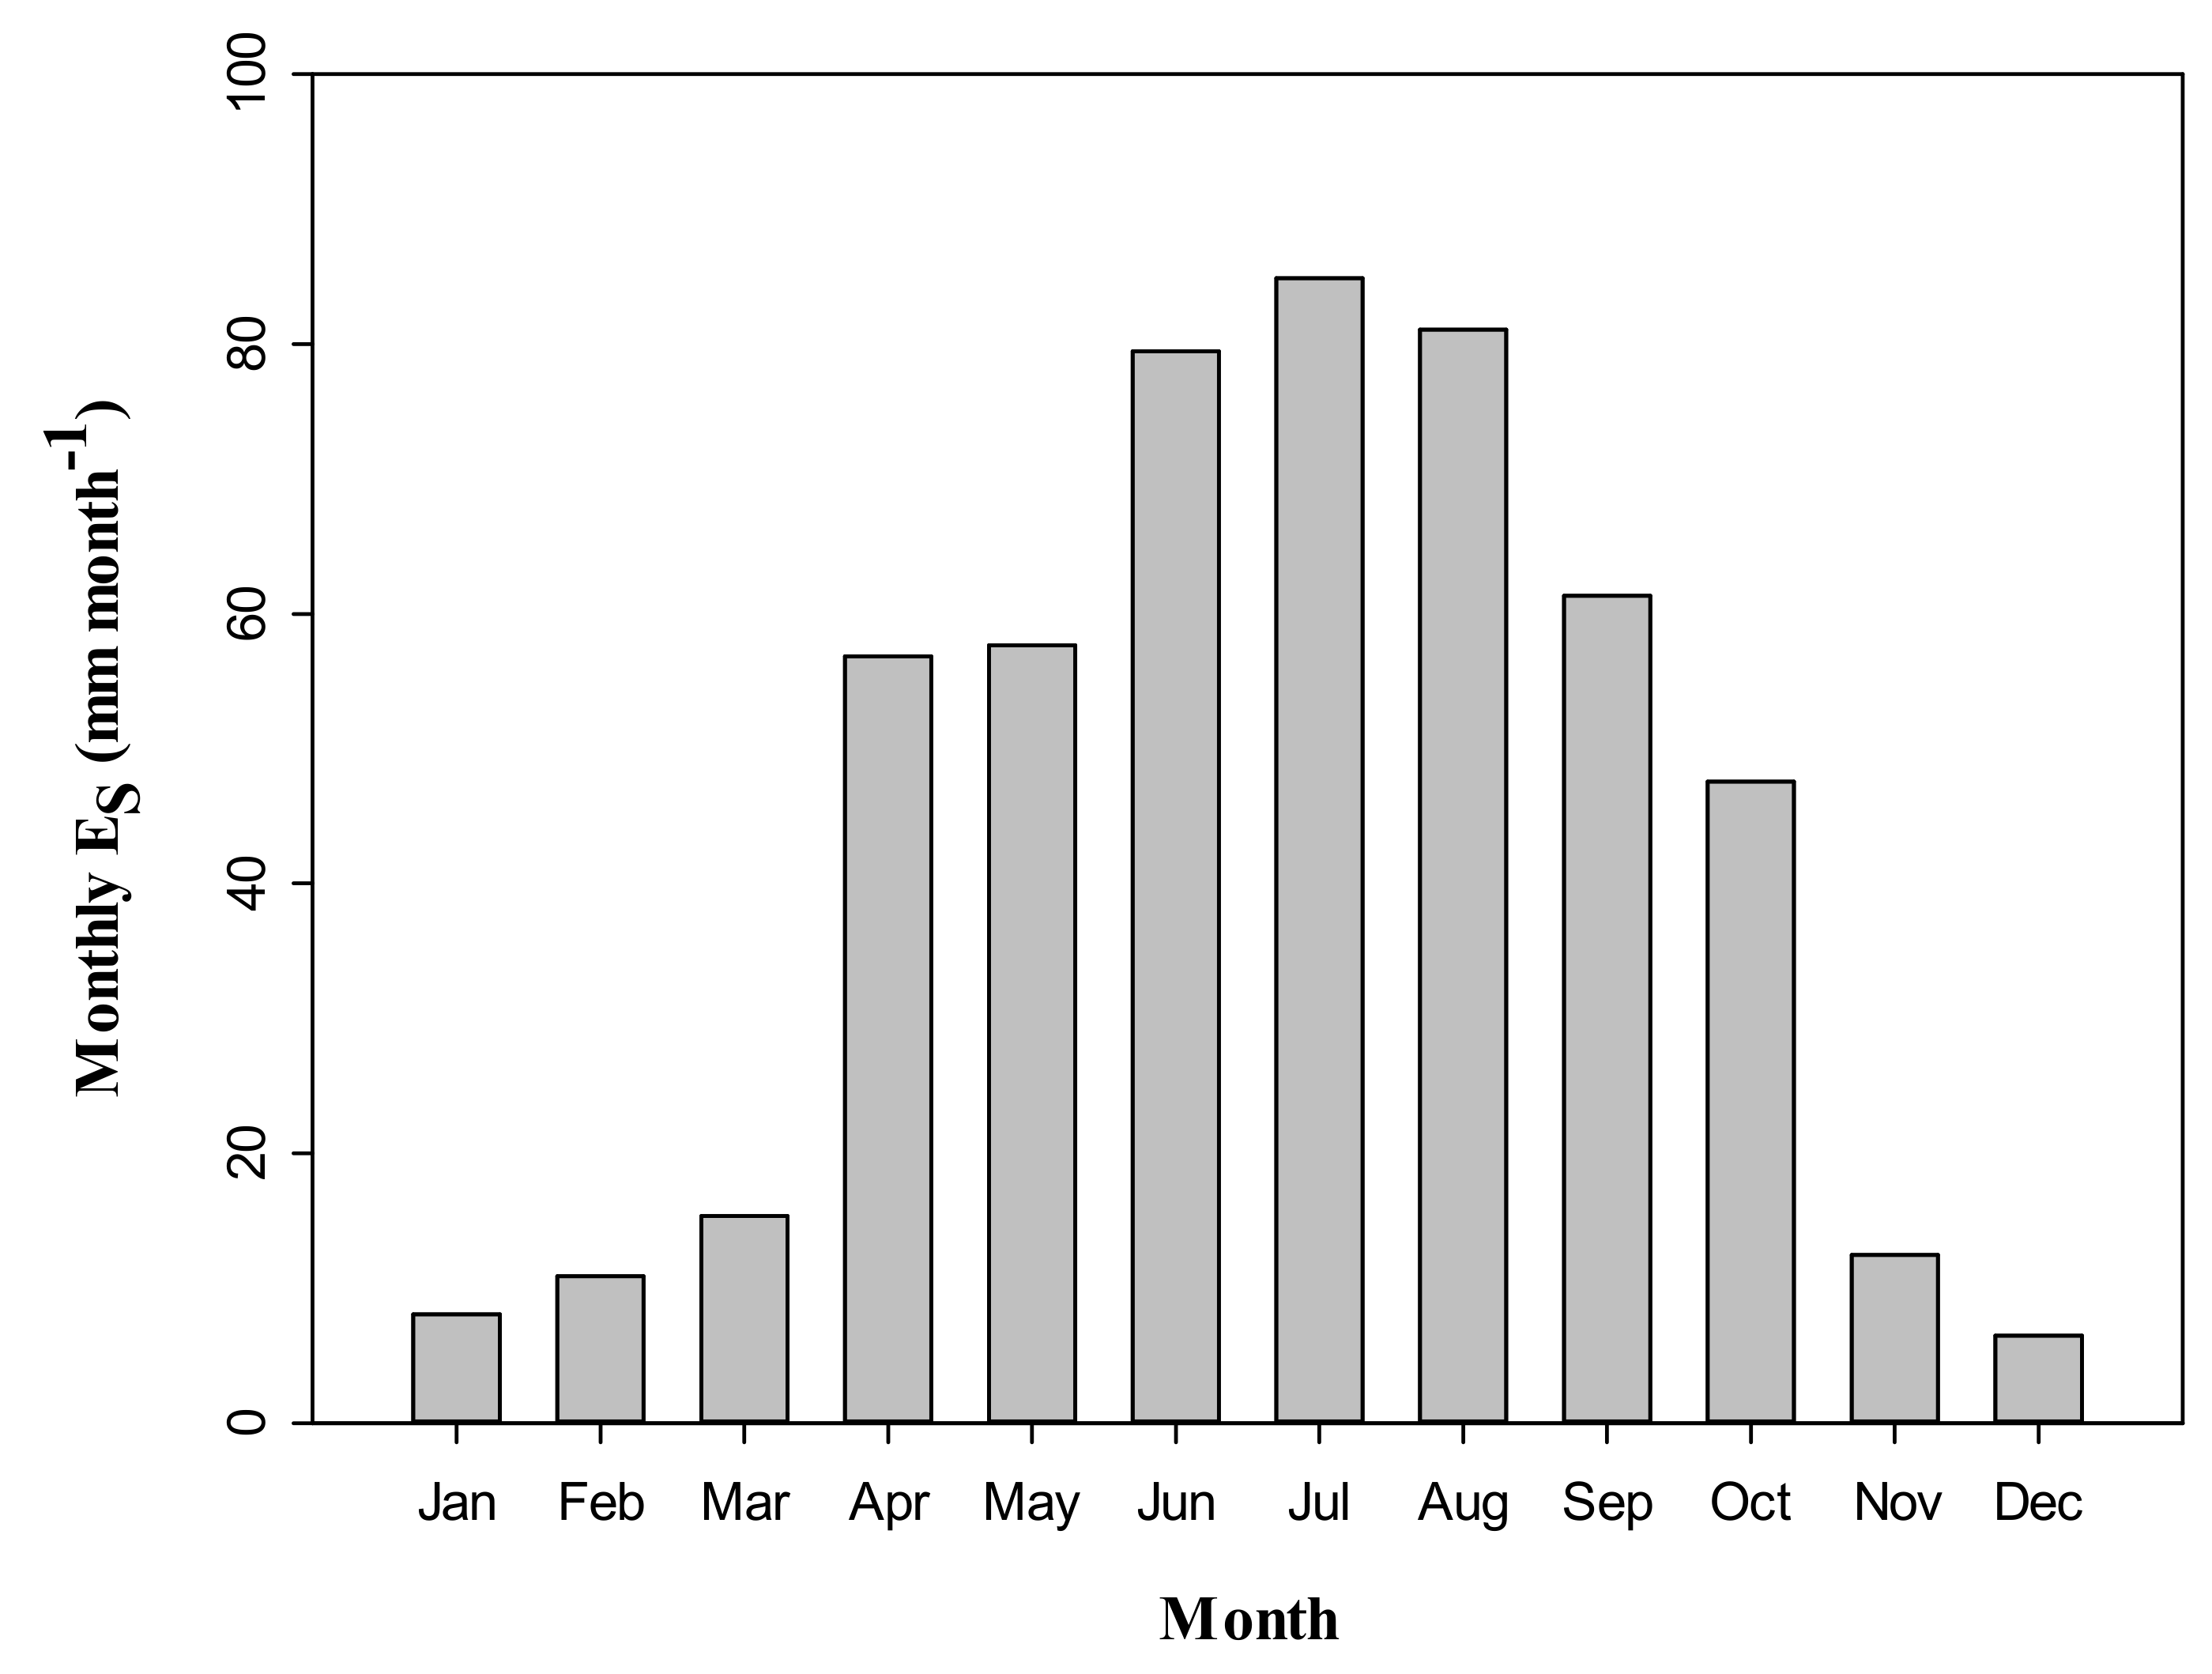
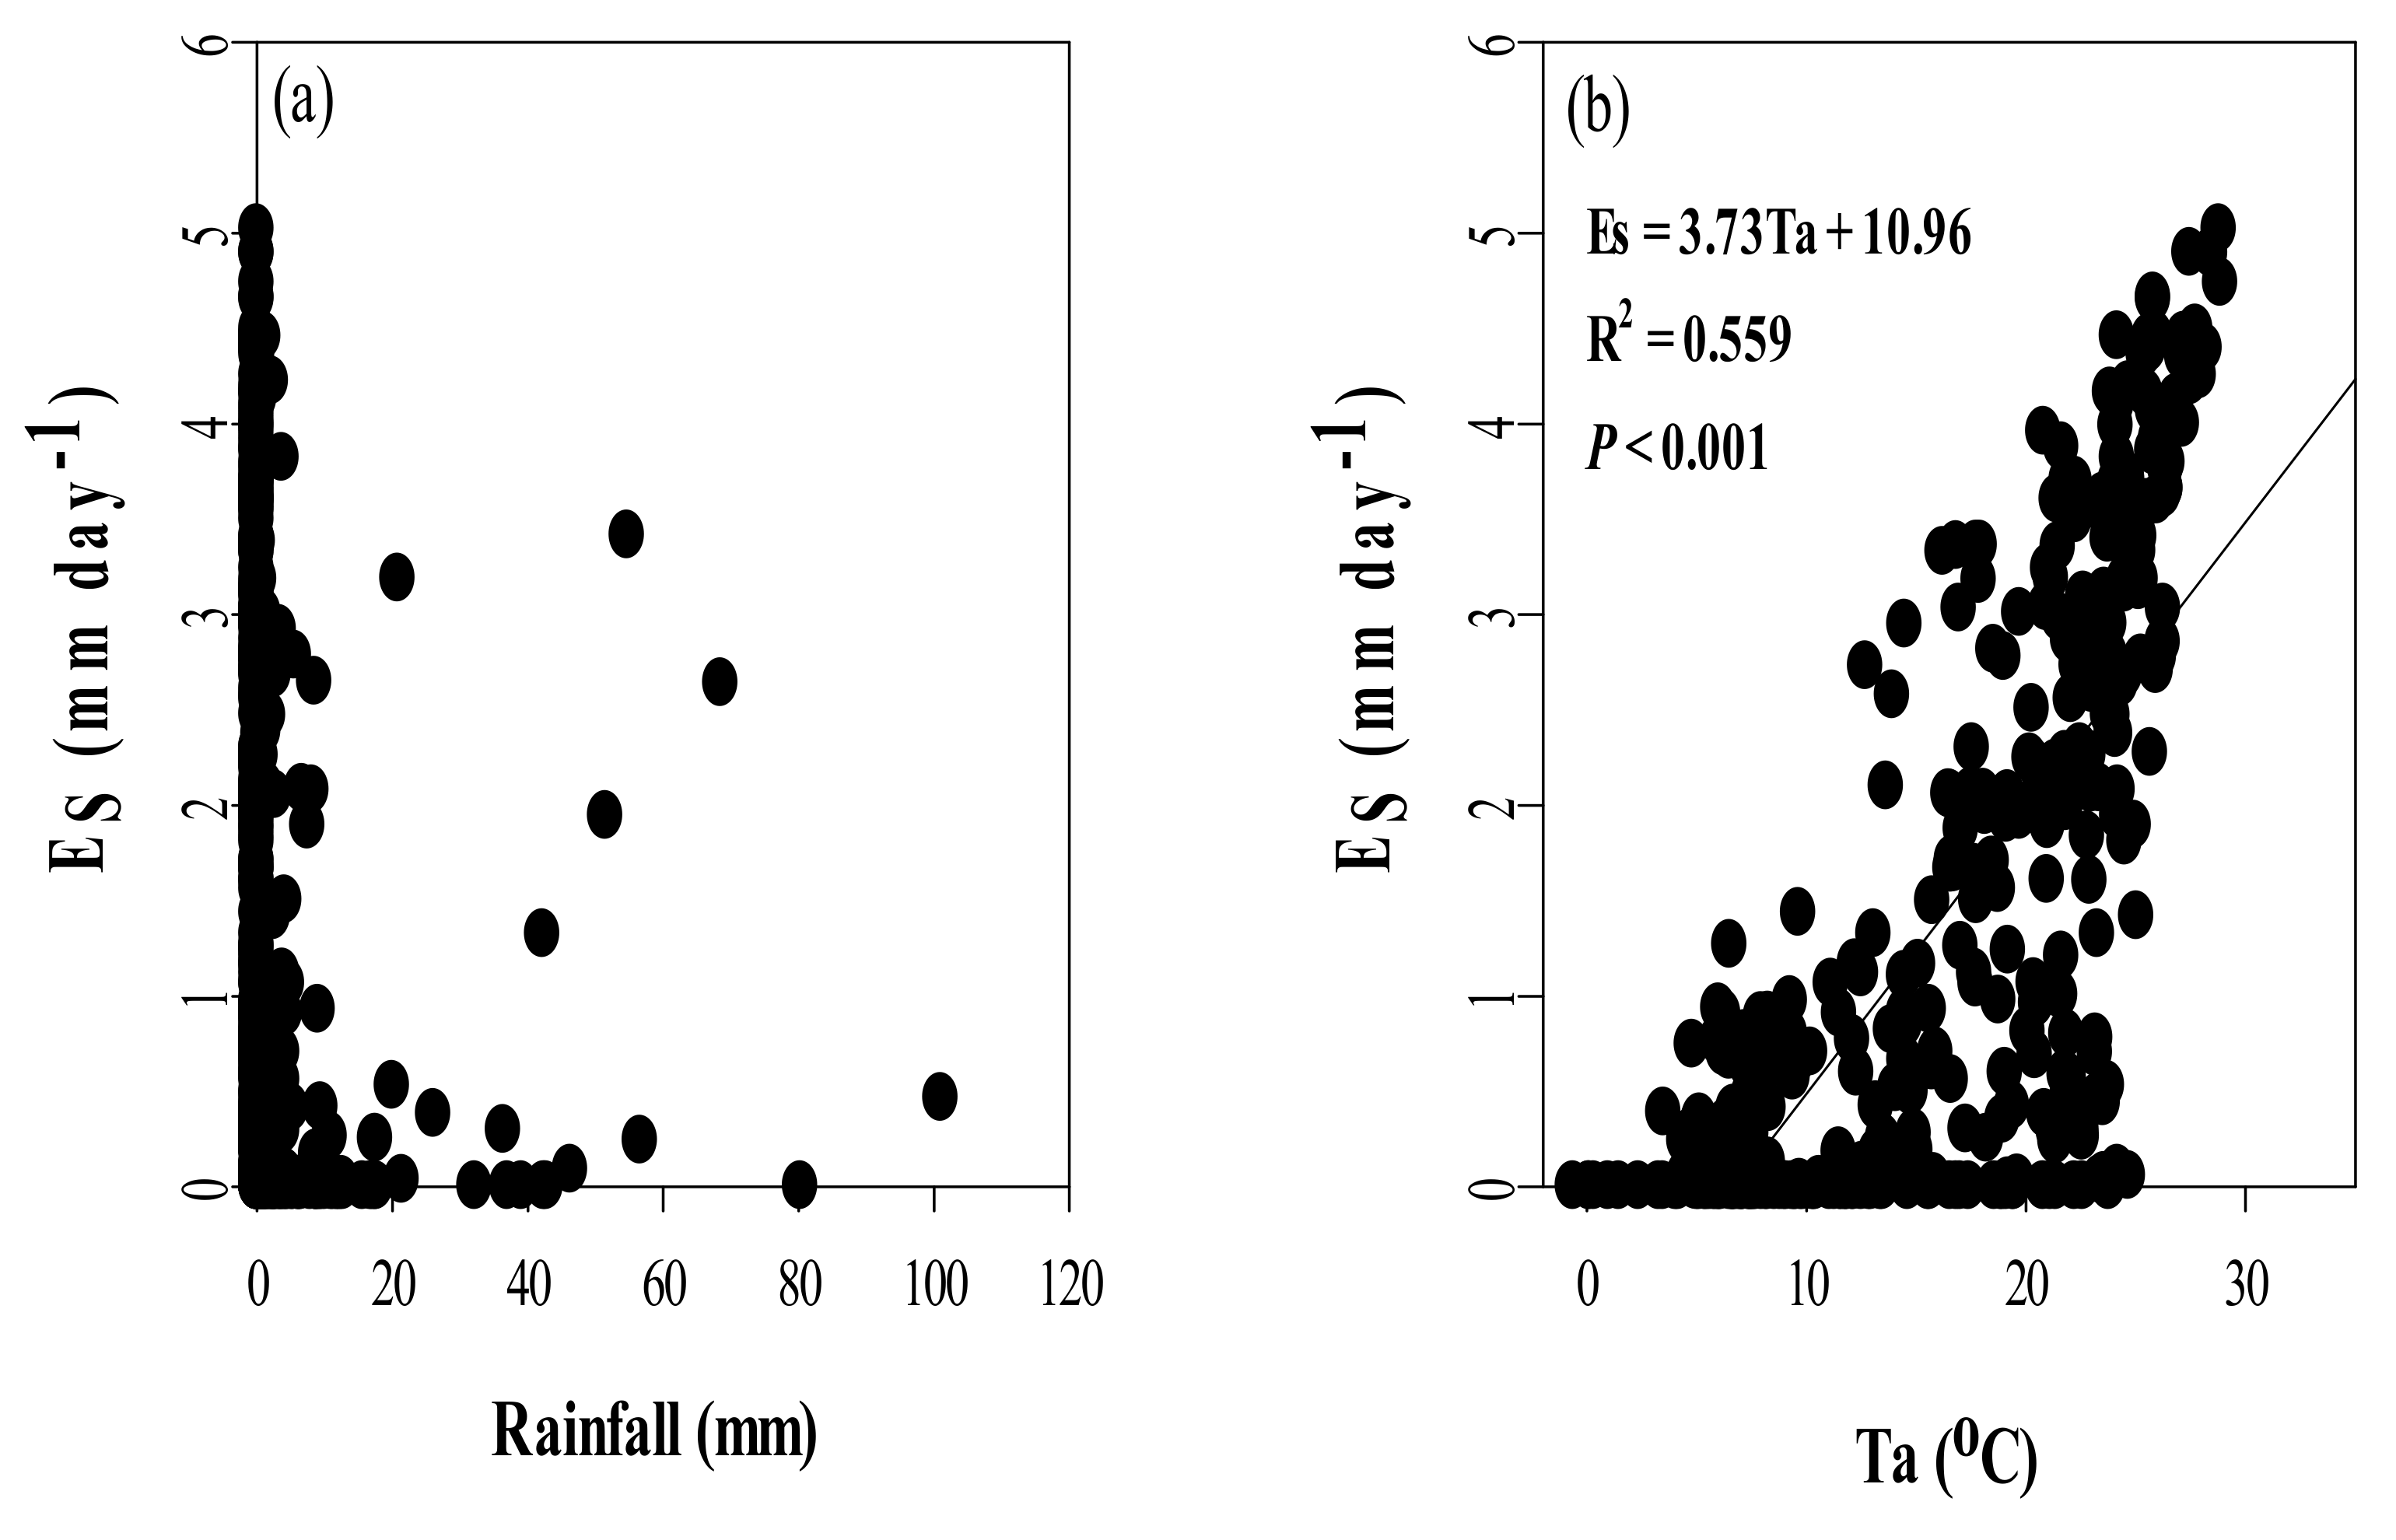
3.4. Seasonal Dynamics of Es and Relationships between Es and Climate Factors

The total Es of Chinese firs was 522.1 mm, about 37.3% of the total rainfall over the study period. Daily Es reached an average of 1.4 mm day−1, with values ranging from 0 to 5.0 mm (Figure 6). Es increased gradually from January to May (early growing season), maintained high values in June, July, and August (middle growing season), with a maximum value of 5.0 mm day−1 occurring on June 29 (day 180), and decreased gradually from September (late growing season) to December (Figure 6). The total Es during the growing season from April to October was 468.9 mm, about 89.8% of the total Es of the whole year, with the lowest monthly cumulative Es value at 47.6 mm in October, and with the highest monthly cumulative Es value at 84.9 mm in July (Figure 7).
To elucidate the different influences of the climatic factors on Es over the daily and monthly timescales, the relationships between Es and rainfall, Ta, RH, PAR, and VPD were respectively analyzed. On a daily timescale, linear regression showed that Es was significantly and positively correlated with Ta (R2 = 0.56, p < 0.001) and PET (R2 = 0.91, p < 0.001), but negatively correlated with RH (R2 = 0.48, p < 0.001). There was no obvious relationship between Es and precipitation (p > 0.05). Including VPD and PAR as the independent variables, the exponential threshold models explained 87.2% and 80.7% variability of daily Es, respectively (Figure 8).
On a monthly timescale, Es was significantly and positively correlated with monthly precipitation (R2 = 0.55, p < 0.001), PAR (R2 = 0.93, p < 0.001), VPD (R2 = 0.96, p < 0.001), Ta (R2 = 0.53, p < 0.001), and PET (R2 = 0.98, p < 0.001). However, no obvious relationship was found between monthly Es and RH (p > 0.05) (Figure 9).

4. Discussion

4.1. Calibration of Parameters for the Original Granier Equation

The TDP method is one of the most commonly used techniques to measure sap flow. Nevertheless, if species-specific parameters were not taken into account, the method could generate large errors in the plant water use estimates [10,13,33]. Some studies have discussed whether the TDP method should be recalibrated for a specific species [8,13]. Using the gravimetric approach, our recalibrated experiments demonstrated that the estimates of the original TDP differed substantially from the actual SFD. The large errors in TDP were associated with the parameters a and especially b from the original empirical equation defined by Granier [9,29]. The calibrated parameters in this study were 0.0253 for a and 1.2259 for b (R2 = 0.987), illustrating that the values originally proposed had an error of +112.6% and −0.4% for Chinese firs. This resulted in an overall 54% error in SFD (i.e., approximately 1.5 times the sap flux density calculated from Equation (1)). Using the same method, Lu and Chacko [38] found that the TDP method underestimated cumulative daily SFD by 6–10% in two Mangifera indica trees. Steppe et al. [33] found an underestimate of SFD by 60% in Fagus grandifolia trees. The different degrees of errors between estimated and actual SFD among species imply that the parameter values (a and b) in the original equation may not be appropriate for estimating the TDP of all species. Thus, there are no universal a and b parameter values that are suitable for all tree species when accurately estimating the SFD from the TDP method.

4.2. Es Estimates for Chinese Fir Plantations

Several studies have reported the existence of significant relationships between tree characteristics (i.e., tree height or DBH) and the water use of trees [34,39]. These relationships could be explained by energy limitations in our study plot. Shinohara et al. [34] reported a clear relationship between SFD and DBH in Japanese cedar forests. Similarly, SFD was found to be significantly and positively correlated with DBH and tree height in our study (Figure 5). These results indicate that C. lanceolata forests may not suffer from water availability constraints, and that their main constraint in transpiration in our study plot is light and atmospheric evaporative demand availability. Furthermore, SFD estimates were greatly affected by large trees with greater sapwood areas. In this study, a strong significant and positive correlation was found between SFD with DBH (R2 = 0.91, p < 0.01), and there was an approximately fourfold difference between the largest and the smallest SFD (Figure 5a).
The results of this study provide quantitative information on transpiration at the stand level. During the study period, the total Es of C. lanceolata was 37.3% of the gross rainfall and daily Es had an average value of 1.43. In other studies on coniferous forests, some transpiration observations were higher than the present study, but others were lower. For example, the Es of a temperate Pinus tabulaeformis plantation varied from 1.4 and 2.2 mm day−1, with a mean Es 1.8 mm day−1 in the Loess Plateau region of China [40]. However, some researchers have reported that canopy transpiration rates in old growth temperate conifer stands range from 0.4 to 1.5 mm day−1, with a mean of 0.9 mm day−1 [41,42]. These differences are reasonable because Es is significantly affected by the physiology of trees [43], stand density [44], stand age [45], and environmental conditions [40,46].
Strong seasonal changes of Es were observed in this study (Figure 6 and Figure 7), with Es being larger in the growing season than in the dormant season. This seasonal variation in Es has generally been observed in temperate and tropical systems [21,41]. This has several explanations. First, in accordance with the humid conditions found at the study site, the drivers of Es (mainly VPD and PAR) were always greater in the growing season than in the dormant season (Figure 2). Second, our study site has a typical humid subtropical monsoon climate, where summer is a wet season while winter is a dry season, resulting in a soil water deficit in autumn and winter, which could inevitably reduce Es. In this study, in spring, the PAR and VPD were relatively low and rainfall rarely occurred. Conversely, in autumn, the rainfall increased the soil water content without increasing the soil moisture, but PAR and VPD were still relatively high, so the rates of Es that occurred during spring and autumn were between those found in the summer and winter.

4.3. Effects of Climate Variables on Es in Chinese Fir Plantation

Previous studies have found that a given forest stand Es is mainly affected by several climate variables, such as VPD, Rs, and air temperature [22,47]. Plant stomatal responses to Rs and VPD are the two key factors in terms of the trade-off between maximizing photosynthesis and minimizing transpiration [19,47,48]. Threshold responses were observed in Es to VPD and Rs [35,47,49]. Ewers et al. [36] developed an exponential saturation to describe the threshold relationship between Es and environmental factors, which was widely used to examine the regulation of environmental factors on Es [47,50]. For example, the model with VPD and Rs can explain 8% and 57% variations in daily Es in Japanese cedar forests, respectively [51]. Ghimire et al. [47] showed that Es exhibited a threshold relationship with VPD and Rs in a planted coniferous forest in the Lesser Himalaya of Central Nepal, with threshold values of 0.4 kPa for VPD and 200 W m−2 for Rs. Jiao et al. [19] reported that Es exhibited a threshold relationship with VPD and Rs in a black locust (Robinia pseudoacacia) plantation on the semi-arid Loess Plateau, China, with threshold values of 1.5 kPa for VPD and 250 W m−2 for Rs.
In this study, daily Es increased sharply with increasing VPD and the VPD threshold was approximately 1.2 kPa. Similarly, Es reasonably increased with increasing RAR and leveled off at a threshold value of around 23,000 mmol m−2 day−1. Ewers’ model including VPD or PAR can explain the variability of daily Es. RAR could explain 87.2% and 80.7% variations in daily Es in Chinese fir forest (Figure 8). Moreover, most previous studies have focused on the relationship between Es and other environmental factors such as PAR, VPD, and Ta alone [19,47], and few on the relationship between Es and PET [50]. Our study showed that PET, the lumped variable that is usually used to reflect atmospheric water demand, was more highly correlated with Es than a single environment factor at both the daily scale (Figure 8) and the monthly scale (Figure 9). This finding indicates the integrative impact of environmental factors on Es.
At the monthly timescale, the highest monthly Es occurred with the highest amount of precipitation in July 2010. The values were relatively high during the wet months when the region experienced higher precipitation (June, July, and August). VPD and PAR explained 96% and 95% variations in monthly Es, respectively. Ta also explained 95% of the variations in monthly Es (Figure 9). PAR and VPD usually control the transpiration rate by affecting plant stomatal conductance at a daily timescale [8]. At a monthly or seasonal timescale, variations in Es are controlled by plant phenology and environmental factors (e.g., climatic conditions and availability of soil water) [47,52]. Granier et al. [22] found that both Rs and VPD controlled the transpiration rate by affecting stomatal conductance, with VPD being the most correlated at a daily scale. At monthly scale, however, Wang et al. [4] found that rainfall might contribute towards influencing Es. This could explain the different influences between daily and monthly timescales. Jiao et al. [19] found that the status of soil water content at the beginning of the growing season had large impacts on Es in a black locust plantation on the semi-arid Loess Plateau, China. Hence, a future study should take soil water condition into consideration in order to understand variations in Es at different timescales.

5. Conclusions

In this study, a species-specific parameter calibration was performed for the original Granier equation for Chinese fir trees in southern China. The calibrated parameters resulted in considerably different estimates of SFD for Chinese firs when compared with the original calibration equation, which underestimated SFD by up to 54%. These results suggest that there is no universal set of parameter (a and b) values that are suitable for accurately calculating SFD measurements from TDP measurements; a relatively simple calibration appreciably improved the accuracy of the TDP. When accurate estimates of the water budget must be carried out in tree-dominated ecosystems, tree-to-tree variations in SFD should be considered. Our study also indicated that the dominant climatic factors have different effects on ES at different temporal scales.

Acknowledgments

This study was supported by the Key Program of the National Natural Science Foundation of China (31290221); the National Natural Science Foundation of China (31700636), the Project funded by China Postdoctoral Science Foundation (2017M612605), and Huitong Forest Ecological Station Program funded by the State Forestry Administration of China. We thank the post-graduate Renhui Li for collecting data in the field work.

Author Contributions

Zhonghui Zhao and Wenhua Xiang conceived and designed the experiments; Shuai Ouyang, Kaiyu Xiao, and Chuanhong Xu performed the experiments; Pifeng Lei, Jiangrong Li and Shuai Ouyang analyzed the data; Xiangwen Deng contributed technical advice and Shuai Ouyang wrote the paper.

Conflicts of Interest

The authors declare no conflict of interest.

References

  1. Bosch, D.D.; Marshall, L.K.; Teskey, R. Forest transpiration from sap flux density measurements in a Southeastern Coastal Plain riparian buffer system. Agric. For. Meteorol. 2014, 187, 72–82. [Google Scholar] [CrossRef]
  2. Yan, M.J.; Zhang, J.G.; He, Q.Y.; Shi, W.Y.; Otsuki, K.; Yamanaka, N.; Du, S. Sapflow-Based Stand Transpiration in a Semiarid Natural Oak Forest on China’s Loess Plateau. Forests 2016, 7, 227. [Google Scholar] [CrossRef]
  3. Burba, G.G.; Verma, S.B. Seasonal and interannual variability in evapotranspiration of native tallgrass prairie and cultivated wheat ecosystems. Agric. For. Meteorol. 2005, 135, 190–201. [Google Scholar] [CrossRef]
  4. Wang, Y.L.; Liu, G.B.; Kume, T.; Otsuki, K.; Yamanaka, N.; Du, S. Estimating water use of a black locust plantation by the thermal dissipation probe method in the semiarid region of Loess Plateau, China. J. For. Res. 2010, 15, 241–251. [Google Scholar] [CrossRef]
  5. Van de Wal, B.A.E.; Guyot, A.; Lovelock, C.; EvLockington, D.A.; Steppe, K. Influence of temporospatial variation in sap flux density on estimates of whole-tree water use in Avicennia marina. Trees 2015, 29, 215–222. [Google Scholar] [CrossRef]
  6. Wei, X.; Sun, G. Watershed Ecosytem Process and Management; Higher Education Press: Beijing, China, 2009. [Google Scholar]
  7. Kool, D.; Agam, N.; Lazarovitch, N.; Heitman, J.L.; Sauer, T.J.; Ben-Gal, A. A review of approaches for evapotranspiration partitioning. Agric. For. Meteorol. 2014, 184, 56–70. [Google Scholar] [CrossRef]
  8. Lu, P.; Urban, L.; Ping, Z. Granier’s thermal dissipation probe (TDP) method for measuring sap flow in trees: Theory and practice. Acta Bot. Sin. 2004, 46, 631–646. [Google Scholar]
  9. Granier, A. Une nouvelle méthode pour la mesure du flux de sève brute dans le tronc des arbres. Ann. For. Sci. 1985, 42, 193–200. [Google Scholar] [CrossRef]
  10. Smith, D.M.; Allen, S.J. Measurement of sap flow in plant stems. J. Exp. Bot. 1996, 47, 1833–1844. [Google Scholar] [CrossRef]
  11. Sun, H.; Aubrey, D.P.; Teskey, R.O. A simple calibration improved the accuracy of the thermal dissipation technique for sap flow measurements in juvenile trees of six species. Trees 2012, 26, 631–640. [Google Scholar] [CrossRef]
  12. Paudel, I.; Kanety, T.; Cohen, S. Inactive xylem can explain differences in calibration factors for thermal dissipation probe sap flow measurements. Tree Physiol. 2013, 33, 986–1001. [Google Scholar] [CrossRef] [PubMed]
  13. Bush, S.E.; Hultine, K.R.; Sperry, J.S.; Ehleringer, J.R. Calibration of thermal dissipation sap flow probes for ring-and diffuse-porous trees. Tree Physiol. 2010, 30, 1545–1554. [Google Scholar] [CrossRef] [PubMed]
  14. Dragoni, D.; Lakso, A.N.; Piccioni, R.M. Transpiration of apple trees in a humid climate using heat pulse sap flow gauges calibrated with whole-canopy gas exchange chambers. Agric. For. Meteorol. 2005, 130, 85–94. [Google Scholar] [CrossRef]
  15. Gebauer, T.; Horna, V.; Leuschner, C. Variability in radial sap flux density patterns and sapwood area among seven co-occurring temperate broad-leaved tree species. Tree Physiol. 2008, 28, 1821–1830. [Google Scholar] [CrossRef] [PubMed]
  16. Du, S.; Wang, Y.L.; Kume, T.; Zhang, J.G.; Otsuki, K.; Yamanaka, N.; Liu, G.B. Sapflow characteristics and climatic responses in three forest species in the semiarid Loess Plateau region of China. Agric. For. Meteorol. 2011, 151, 1–10. [Google Scholar] [CrossRef]
  17. Denmead, O.T.; Shaw, R.H. Availability of soil water to plants as affected by soil moisture content and meteorological conditions. Agron. J. 1962, 54, 385–390. [Google Scholar] [CrossRef]
  18. Keenan, T.; Sierra, J.M.; Lloret, F.; Ninyerola, M.; Sabate, S. Predicting the future of forests in the Mediterranean under climate change, with niche- and process based models: CO2 matters! Glob. Chang. Biol. 2011, 17, 565–579. [Google Scholar] [CrossRef]
  19. Jiao, L.; Lu, N.; Sun, G.; Ward, E.J.; Fu, B. Biophysical controls on canopy transpiration in a black locust (Robinia pseudoacacia) plantation on the semi-arid Loess Plateau, China. Ecohydrology 2016, 9, 1068–1081. [Google Scholar] [CrossRef]
  20. Phillips, N.; Oren, R. Intra- and inter-annual variation in transpiration of a pine forest. Ecol. Appl. 2001, 11, 385–396. [Google Scholar] [CrossRef]
  21. Zeppel, M.J.; Yunusa, I.A.; Eamus, D. Daily, seasonal and annual patterns of transpiration from a stand of remnant vegetation dominated by a coniferous Callitris species and a broad–leaved Eucalyptus species. Physiol. Plant. 2006, 27, 413–422. [Google Scholar] [CrossRef]
  22. Granier, A.; Biron, P.; Köstner, B.; Gay, L.; Najjar, G. Comparisons of xylem sap flow and water vapour flux at the stand level and derivation of canopy conductance for Scots pine. Theor. Appl. Climatol. 1996, 53, 115–122. [Google Scholar] [CrossRef]
  23. Tian, D. The Functioning of Chinese Fir Plantation Ecosystem; Science Press: Beijing, China, 2005. [Google Scholar]
  24. Lu, Y.; Coops, N.C.; Wang, T.; Wang, G. A process-based approach to estimate Chinese fir (Cunninghamia lanceolata) distribution and productivity in southern China under climate change. Forests 2015, 6, 360–379. [Google Scholar] [CrossRef]
  25. Lei, J. Forest Resources in China; Chinese Forestry Publishing House: Beijing, China, 2005. [Google Scholar]
  26. Wang, B.; Li, S.N.; Guo, H. The assessment of forest ecosystem services evaluation in Jiangxi Province. Jiangxi Sci. 2007, 5, 554–587. [Google Scholar]
  27. Zhong, Z.H.; Kang, W.X.; Tian, D.L.; Xiang, W.H.; Yan, W.D. Sap flow rate and its relationship with environmental factors of Chinese fir plantation in Huitong, Hunan Province. Sci. Silvae Sin. 2009, 45, 127–132. [Google Scholar]
  28. Yan, W.; Deng, X.; Chen, X.; Tian, D.; Xiang, W.; Peng, Y. Long-term variations of rainfall interception in different growth stages of Chinese fir plantations. Hydrol. Sci. J. 2015, 60, 2178–2188. [Google Scholar] [CrossRef]
  29. Granier, A. Evaluation of transpiration in a Douglas-fir stand by means of sap flow measurements. Tree Physiol. 1987, 3, 309–320. [Google Scholar] [CrossRef] [PubMed]
  30. Norman, J.M.; Campbell, G.S. An Introduction to Environmental Biophysics; Springer: New York, NY, USA, 1998. [Google Scholar]
  31. Allen, R.G.; Pereira, L.S.; Raes, D.; Smith, M. Crop Evapotranspiration: Guidelines for Computing Crop Water Requirements; FAO Irrigation and Drainage Paper No. 56; The Food and Agriculture Organization (FAO): Rome, Italy, 1998. [Google Scholar]
  32. Vertessy, R.; Benyon, R.; O’Sullivan, S.; Gribben, P. Relationships between stem diameter, sapwood area, leaf area and transpiration in a young mountain ash forest. Tree Physiol. 1995, 15, 559–567. [Google Scholar] [CrossRef] [PubMed]
  33. Steppe, K.; De Pauw, D.J.W.; Doody, T.M.; Teskey, R.O. A comparison of sap flux density using thermal dissipation, heat pulse velocity and heat field deformation methods. Agric. For. Meteorol. 2010, 150, 1046–1056. [Google Scholar] [CrossRef]
  34. Shinohara, Y.; Tsuruta, K.; Ogura, A.; Noto, F.; Komatsu, H.; Otsuki, K.; Maruyama, T. Azimuthal and radial variations in sap flux density and effects on stand-scale transpiration estimates in a Japanese cedar forest. Tree Physiol. 2013, 33, 550–558. [Google Scholar] [CrossRef] [PubMed]
  35. Kumagai, T.; Aoki, S.; Shimizu, T.; Otsuki, K. Sap flow estimates of stand transpiration at two slope positions in a Japanese cedar forest watershed. Tree Physiol. 2007, 27, 161–168. [Google Scholar] [CrossRef] [PubMed]
  36. Ewers, B.E.; Mackay, D.S.; Gower, S.T.; Ahl, D.E.; Burrows, S.N. Tree species effects on stand transpiration in northern Wisconsin. Water Resour. Res. 2002, 38, 1103. [Google Scholar] [CrossRef]
  37. R Development Core Team. R: A Language and Environment for Statistical Computing; R Foundation for Statistical Computing: Vienna, Austria, 2015. [Google Scholar]
  38. Lu, P.; Chacko, E. Evaluation of Granier’s sap flux sensor in young mango trees. Agronomie 1998, 18, 461–471. [Google Scholar] [CrossRef]
  39. Delzon, S.; Sartore, M.; Granier, A.; Loustau, D. Radial profiles of sap flow with increasing tree size in maritime pine. Tree Physiol. 2004, 24, 1285–1293. [Google Scholar] [CrossRef] [PubMed]
  40. Fang, S.; Zhao, C.; Jian, S. Canopy transpiration of Pinus tabulaeformis plantation forest in the Loess Plateau region of China. Environ. Earth Sci. 2016, 75, 1–9. [Google Scholar] [CrossRef]
  41. Zimmermann, R.; Schulze, E.D.; Wirth, C.; Schulze, E.E.; McDonald, K.C.; Vygodskaya, N.N.; Ziegler, W. Canopy transpiration in a chrono sequence of Central Siberian pine forests. Glob. Chang. Biol. 2000, 6, 25–37. [Google Scholar] [CrossRef]
  42. Moore, G.W.; Bond, B.J.; Jones, J.A.; Phillips, N.; Meinzer, F.C. Structural and compositional controls on transpiration in 40 and 450-year-old riparian forests in western Oregon, USA. Tree Physiol. 2004, 24, 481–491. [Google Scholar] [CrossRef] [PubMed]
  43. Ocheltree, T.W.; Nippert, J.B.; Prasad, P.V.V. Stomatal responses to changes in vapor pressure deficit reflect tissue-specific differences in hydraulic conductance. Plant Cell Environ. 2014, 37, 132–139. [Google Scholar] [CrossRef] [PubMed]
  44. Alsheimer, M.; Köstner, B.; Falge, E.; Tenhunen, J.D. Temporal and spatial variation in transpiration of Norway spruce stands within a forested catchment of the Fichtelgebirge, Germany. Ann. Sci. For. 1998, 55, 103–124. [Google Scholar] [CrossRef]
  45. Ewers, B.E.; Gower, S.T.; Bond-Lamberty, B.; Wang, C.K. Effects of stand age and tree species on canopy transpiration and average stomatal conductance of boreal forests. Plant Cell Environ. 2005, 28, 660–678. [Google Scholar] [CrossRef]
  46. Ma, L.; Lu, P.; Zhao, P.; Rao, X.Q.; Cai, X.A.; Zeng, X.P. Diurnal, daily, seasonal and annual patterns of sap-flux-scaled transpiration from an Acacia mangium plantation in South China. Ann. Sci. For. 2008, 65, 402. [Google Scholar] [CrossRef]
  47. Ghimire, C.P.; Lubczynski, M.W.; Bruijnzeel, L.A.; Chavarro-Rincón, D. Transpiration and canopy conductance of two contrasting forest types in the Lesser Himalaya of Central Nepal. Agric. For. Meteorol. 2014, 197, 76–90. [Google Scholar] [CrossRef]
  48. Granier, A.; Huc, R.; Barigah, S.T. Transpiration of natural rain forest and its dependence on climatic factors. Agric. For. Meteorol. 1996, 78, 19–29. [Google Scholar] [CrossRef]
  49. Chang, X.X.; Zhao, W.Z.; Liu, H.; Wei, X.; Liu, B.; He, Z.B. Qinghai spruce (Picea crassifolia) forest transpiration and canopy conductance in the upper Heihe River Basin of arid northwestern China. Agric. For. Meteorol. 2014, 198, 209–220. [Google Scholar] [CrossRef]
  50. Zhang, J.G.; Guan, J.H.; Shi, W.Y.; Yamanaka, N.; Du, S. Interannual variation in stand transpiration estimated by sap flow measurement in a semi-arid black locust plantation, Loess Plateau, China. Ecohydrology 2015, 8, 137–147. [Google Scholar] [CrossRef]
  51. Kumagai, T.; Tateishi, M.; Shimizu, T.; Otsuki, K. Transpiration and canopy conductance at two slope positions in a Japanese cedar forest watershed. Agric. For. Meteorol. 2008, 148, 1444–1455. [Google Scholar] [CrossRef]
  52. Yan, C.; Wang, B.; Zhang, Y.; Zhang, X.; Takeuchi, S.; Qiu, G.Y. Responses of sap flow of deciduous and conifer trees to soil drying in a subalpine forest. Forests 2018, 9, 32. [Google Scholar] [CrossRef]
Figure 1. Distribution of the values of the tree diameter at breast height (DBH) in the study plot.
Forests 09 00162 g001
Figure 2. Variation of daily environmental variables of the study plot in 2015. (a) rainfall (mm); (b) air temperature (Ta) (°C); (c) photosynthetically-active radiation (PAR) (mmol m−2 day−1); (d) air relative humidity (RH) (%); and (e) vapor pressure deficit (VPD) (kPa).
Forests 09 00162 g002
Figure 3. Relationship between sapwood area (As) and tree diameter at breast height (DBH) for Chinese fir plantations.
Forests 09 00162 g003
Figure 4. (a) A comparison of the SFD values estimated by the Granier equation of the original parameters (a = 0.0119, b = 1.231) and measured via the gravimetric method. The dashed line is the 1:1 line; (b) the relationship between the SFD values measured by the gravimetric method and the dimensionless sap flow index K for Chinese firs.
Forests 09 00162 g004
Figure 5. The relationship between sap flow density (SFD) and (a) tree diameter at breast height (DBH); and (b) tree height.
Forests 09 00162 g005aForests 09 00162 g005b
Figure 6. The variation of daily stand transpiration (Es) in 2015.
Forests 09 00162 g006
Figure 7. The cumulative monthly stand transpiration (Es) during the study period.
Forests 09 00162 g007
Figure 8. The relationships between the daily stand transpiration (Es) (mm) and (a) rainfall (mm); (b) air temperature (Ta) (°C); (c) photosynthetically-active radiation (PAR) (mmol m−2 day−1); (d) air relative humidity (RH) (%); (e) vapor pressure deficit (VPD) (Kpa); and (f) potential evapotranspiration (PET) (mm) during the study period.
Forests 09 00162 g008aForests 09 00162 g008b
Figure 9. The relationships between monthly stand transpiration (Es) (mm) and (a) rainfall (mm); (b) air temperature (Ta) (°C); (c) photosynthetically-active radiation (PAR) (mmol m−2 month−1); (d) air relative humidity (RH) (%); and (e) vapor pressure deficit (VPD) (Kpa); and (f) potential evapotranspiration (PET) (mm) during the study period.
Forests 09 00162 g009aForests 09 00162 g009b
Table 1. Characteristics of the 18 sampled trees, and the number and aspects of sensors (N: North, S: South).
Tree No.Measured PositionDBH (cm)Height (m)Sapwood Area (cm2)
1N10.412.061.32
2N11.213.870.48
3N12.613.587.93
4N13.815.5104.30
5N14.015.0107.16
6N15.713.5132.89
7N16.614.0147.55
8N17.114.0156.01
9N17.217.1157.72
10N17.416.0161.19
11N18.417.7179.02
12N, S18.519.0180.85
13N, S19.118.8192.02
14N, S20.218.0213.31
15N, S20.518.8219.29
16N, S21.918.4248.26
17N, S22.320.5256.84
18N, S23.420.0281.14

