Temporal Patterns of Wildfire Activity in Areas of Contrasting Human Influence in the Canadian Boreal Forest

1
Department of Renewable Resources, University of Alberta, Edmonton, AB T6G 2R3, Canada
2
Canadian Partnership for Wildland Fire Science, Department of Renewable Resources, University of Alberta, Edmonton, AB T6G 2R3, Canada
3
Northern Forestry Centre, Canadian Forest Service, Natural Resources Canada, Edmonton, AB T6H 3S5, Canada
*
Author to whom correspondence should be addressed.
Forests 2018, 9(4), 159; https://doi.org/10.3390/f9040159
Submission received: 15 February 2018
/
Revised: 15 March 2018
/
Accepted: 19 March 2018
/
Published: 21 March 2018
(This article belongs to the Special Issue Wildland Fire, Forest Dynamics, and Their Interactions)
Abstract
:The influence of humans on the boreal forest has altered the temporal and spatial patterns of wildfire activity through modification of the physical environment and through fire management for the protection of human and economic values. Wildfires are actively suppressed in areas with higher human influence, but, paradoxically, these areas have more numerous ignitions than low-impact ones because of the high rates of human-ignited fires, especially during the springtime. The aim of this study is to evaluate how humans have altered the temporal patterns of wildfire activity in the Canadian boreal forest by comparing two adjacent areas of low and high human influence, respectively: Wood Buffalo National Park (WBNP) and the Lower Athabasca Plains (LAP). We carried out Singular Spectrum Analysis to identify trends and cycles in wildfires from 1970 to 2015 for the two areas and examined their association with climate conditions. We found human influence to be reflected in wildfire activity in multiple ways: (1) by dampening (i.e., for area burned)—and even reversing (i.e., for the number of fires)—the increasing trends of fire activity usually associated with drier and warmer conditions; (2) by shifting the peak of fire activity from the summer to the spring; (3) by altering the fire-climate association; and (4) by exhibiting more recurrent (<8 year periodicities) cyclical patterns of fire activity than WBNP (>9 years).
Keywords:
Wildfire; Wildland fire; forest fire; boreal forest; fire management; human influence; climate1. Introduction
Wildfire is a critical phenomenon maintaining the ecological processes and integrity of the Canadian boreal forest [1]. Although most fire regimes in Canada are characterized by infrequent, high-intensity, extensive fires occurring mostly between May and August, there is great variability in the components of the fire regime across spatial and temporal scales [2]. Understanding the spatio-temporal patterns of fire occurrence and area burned is thus of foremost interest in Canada in ecological, social, and economic terms. Wildland fires burn on average between 1 to 3 million ha annually in Canada, affecting biological diversity [3,4], ecological services [5,6], and forest resources [7], and require costly fire management strategies for infrastructure and community protection [8,9].
Fire activity, which is usually measured as the number of fires and the total area burned, is driven by weather, climate [10,11], vegetation type [12,13], topography, human activities [8,14,15], and complex interactions among these factors. Globally, wildfire dynamics have been altered by human activities for millennia through people setting (accidental or deliberate) ignitions that add to the ones caused naturally by lightning, and by modifying the landscape through their activities, increasing access to wildlands, and by altering the arrangement, continuity, amount, structure, and distribution of fuels (i.e., flammable biomass). These changes, combined with climate change, have modified the components of the fire regime: severity, likelihood, seasonality, size, frequency, and intensity of fires [13,16,17,18,19,20].
Evidence suggests that fire suppression practices also have an important effect on the fire–weather relationship, potentially undermining the reliability of weather-based predictions. Current ignition rates in France, for example, are not as high as they were during the pre-suppression period, even under similar weather conditions [21]. Fire regimes in Catalonia, Spain, cannot be efficiently predicted unless fire suppression activities, in addition to climatic variables, are taken into account [22]. In the U.S. Rocky Mountains, alternating periods of fire–climate relationship strength were reported for the past century, suggesting that the interaction of climatic and non-climatic factors, such as fire suppression, is highly complex and needs to be assessed to improve our understanding of fire activity [23].
Over the last century, fire management activities in the Canadian boreal forest have shaped fire activity through aggressive suppression efforts and preventive measures. However, fire management has not been uniform over space and time because deploying resources to prevent and attack fires involves balancing potential economic, social, and ecological impacts, which can sometimes be conflicting [24,25,26,27]. To better reflect regional priorities, most of Alberta’s forested land surface has been divided into ten Wildfire Management Areas [28] that are managed by the provincial government. Fire management in Alberta has increased the containment (i.e., extinguishment before they reach 2 ha in size) of fires from 75% in 1998 to 93% in 2015 [29]. Regardless of technological advances and preventive measures, large fire events still occur in Alberta. Such is the case of the Horse River fire in Fort McMurray, Alberta (spring 2016; 580,633 ha burned), which caused the evacuation of 80,000 people and was the costliest natural disaster in Canada, with an estimated damage worth of CAN$10.9 billion [30,31]. In contrast, National Parks within Alberta are not included in the provincial Wildfire Management Areas because the administration falls under federal jurisdiction. In these parks, unlike the rest of forested Alberta, the ecological role of fires is favored and wildfires are only supressed when they pose a risk to surrounding inhabited areas and areas containing rare natural resources [32].
Although it is well recognized that human influence can alter fire activity in the boreal forest, the magnitude and direction of recent changes remain largely undocumented. The main goal of this study is to assess how human influence has affected the fire regime of two contrasting areas in the Canadian boreal forest over the past few decades. To achieve this goal, we analyzed the changes in the number of fires and area burned (fire activity) over time and their relationships with climate in two contiguous regions of Alberta with contrasting human influence (fire management and human land use). First, to establish whether fire activity has changed in each region, we analyzed annual trends of the number of fires and area burned, from 1970 to 2015, and compared them while distinguishing natural from anthropogenic fires. Secondly, to determine if the fire–climate relationships remain coherent despite the dissimilar human influence, we compared these relationships between regions. Finally, to better understand the correlations between fire activity and climate, we characterized the cyclical patterns of the number of fires, area burned, and climate, and compared them between regions in terms of the duration of their periodicities.
2. Materials and Methods
2.1. Study Areas
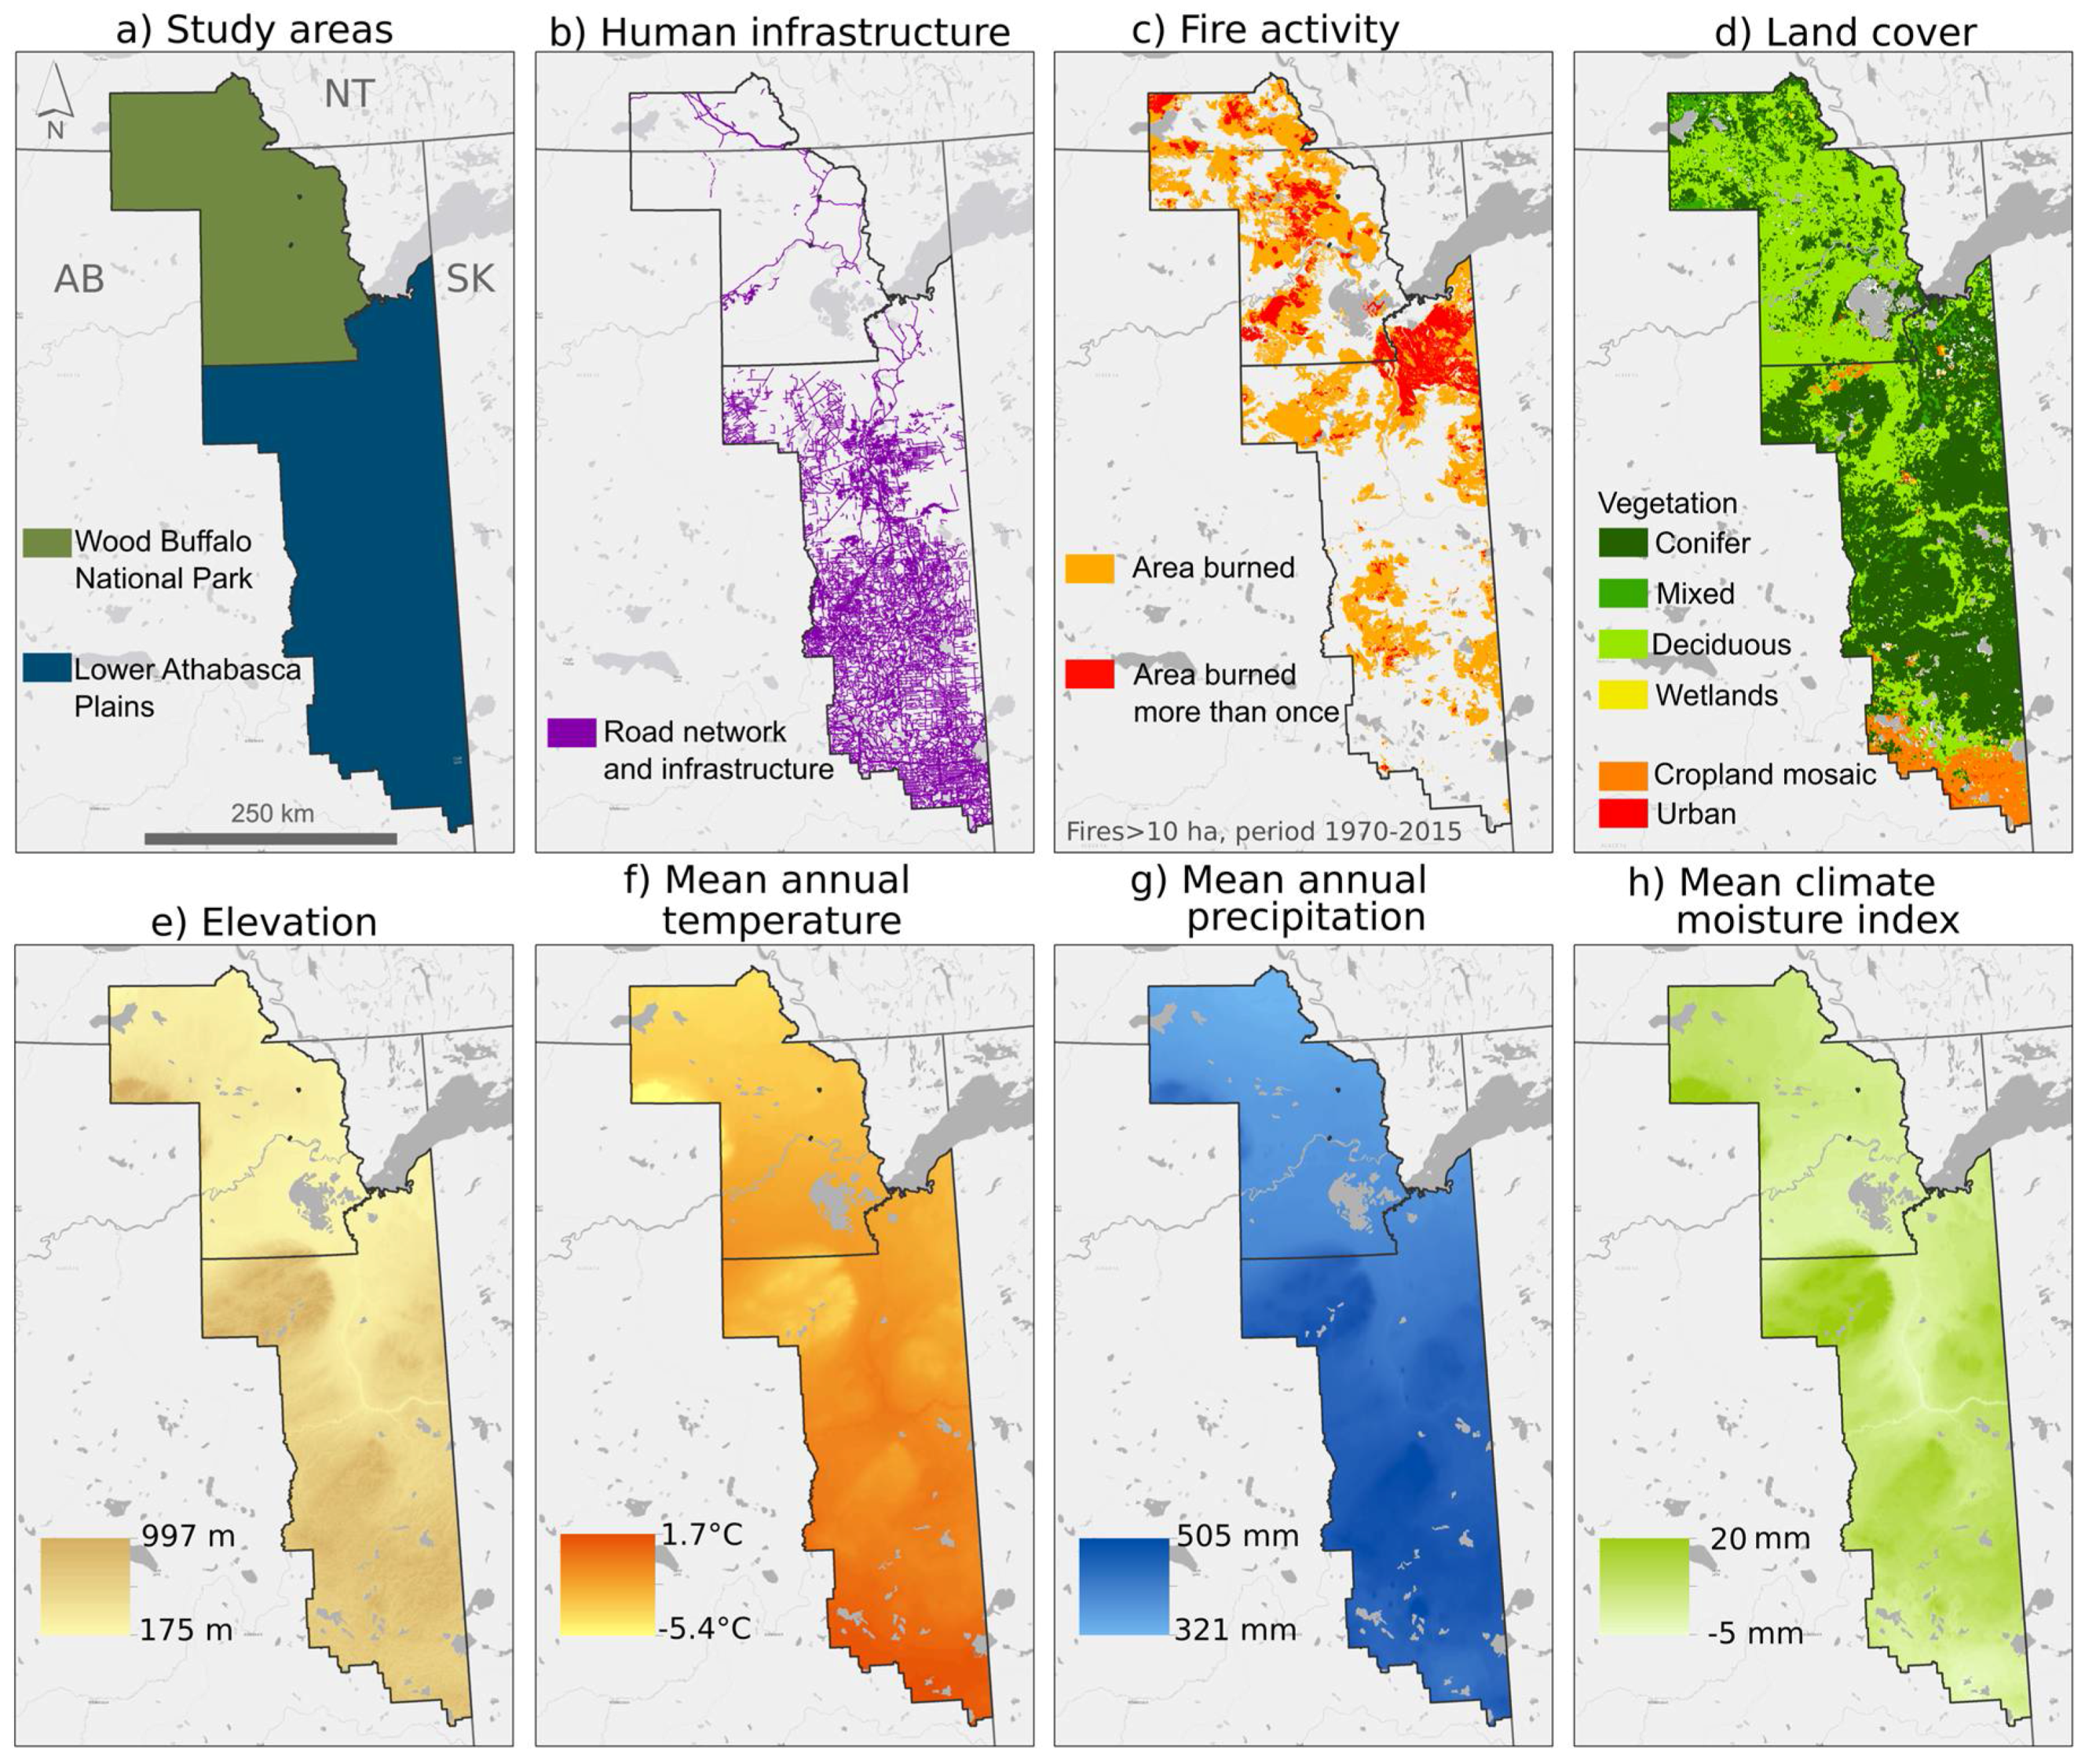
We chose two adjacent study regions located in the northeastern corner of the province of Alberta and a southern portion of Northwest Territories, Canada, that differ in their level of human influence, including wildfire management (Figure 1): Wood Buffalo National Park (WBNP, 4.3 Mha) and the Lower Athabasca Plains (LAP, 7.9 Mha). Both regions are located within the Boreal Forest Natural Region (BFNR), which covers approximately 58% of Alberta. The topography is mostly flat to gently hilly, and the vegetation is represented by four dominant types: upland deciduous, coniferous, mixed forests, and wetlands. The most common tree species found are black spruce (Picea mariana (Mill.) B.S.P.), white spruce (P. glauca (Moench) Voss), jack pine (Pinus banksiana Lamb.), trembling aspen (Populus tremuloides (Michx.)), balsam poplar (P. balsamifera L.), and eastern larch (Larix laricina (Du Roi) K. Koch) [33].
Although WBNP and LAP are very similar in terms of topography and vegetation composition, they are subjected to contrasting levels of human influence. Established in 1922, WBNP is a UNESCO (United Nations Educational, Scientific and Cultural Organization) world heritage site where the human influence is remarkably low; less than one percent of its area has been modified by human activities, which mainly consist of two roads (Table 1, Figure 1b). In contrast, LAP has almost 10 percent of its area destined to agriculture, tree harvesting, oil-and-gas exploration, and other rural and industrial activities. Comparatively, LAP also possesses a more extensive road network and more human settlements (Table 1, Figure 1b) [33,34]. Despite belonging to the same land management unit, we excluded the portion of LAP located on the north side of Lake Athabasca, because it is located in the Canadian Shield, which represents a topo-edaphic setting that differs substantially from the rest of the study area and WBNP, both located in the Boreal Plain.
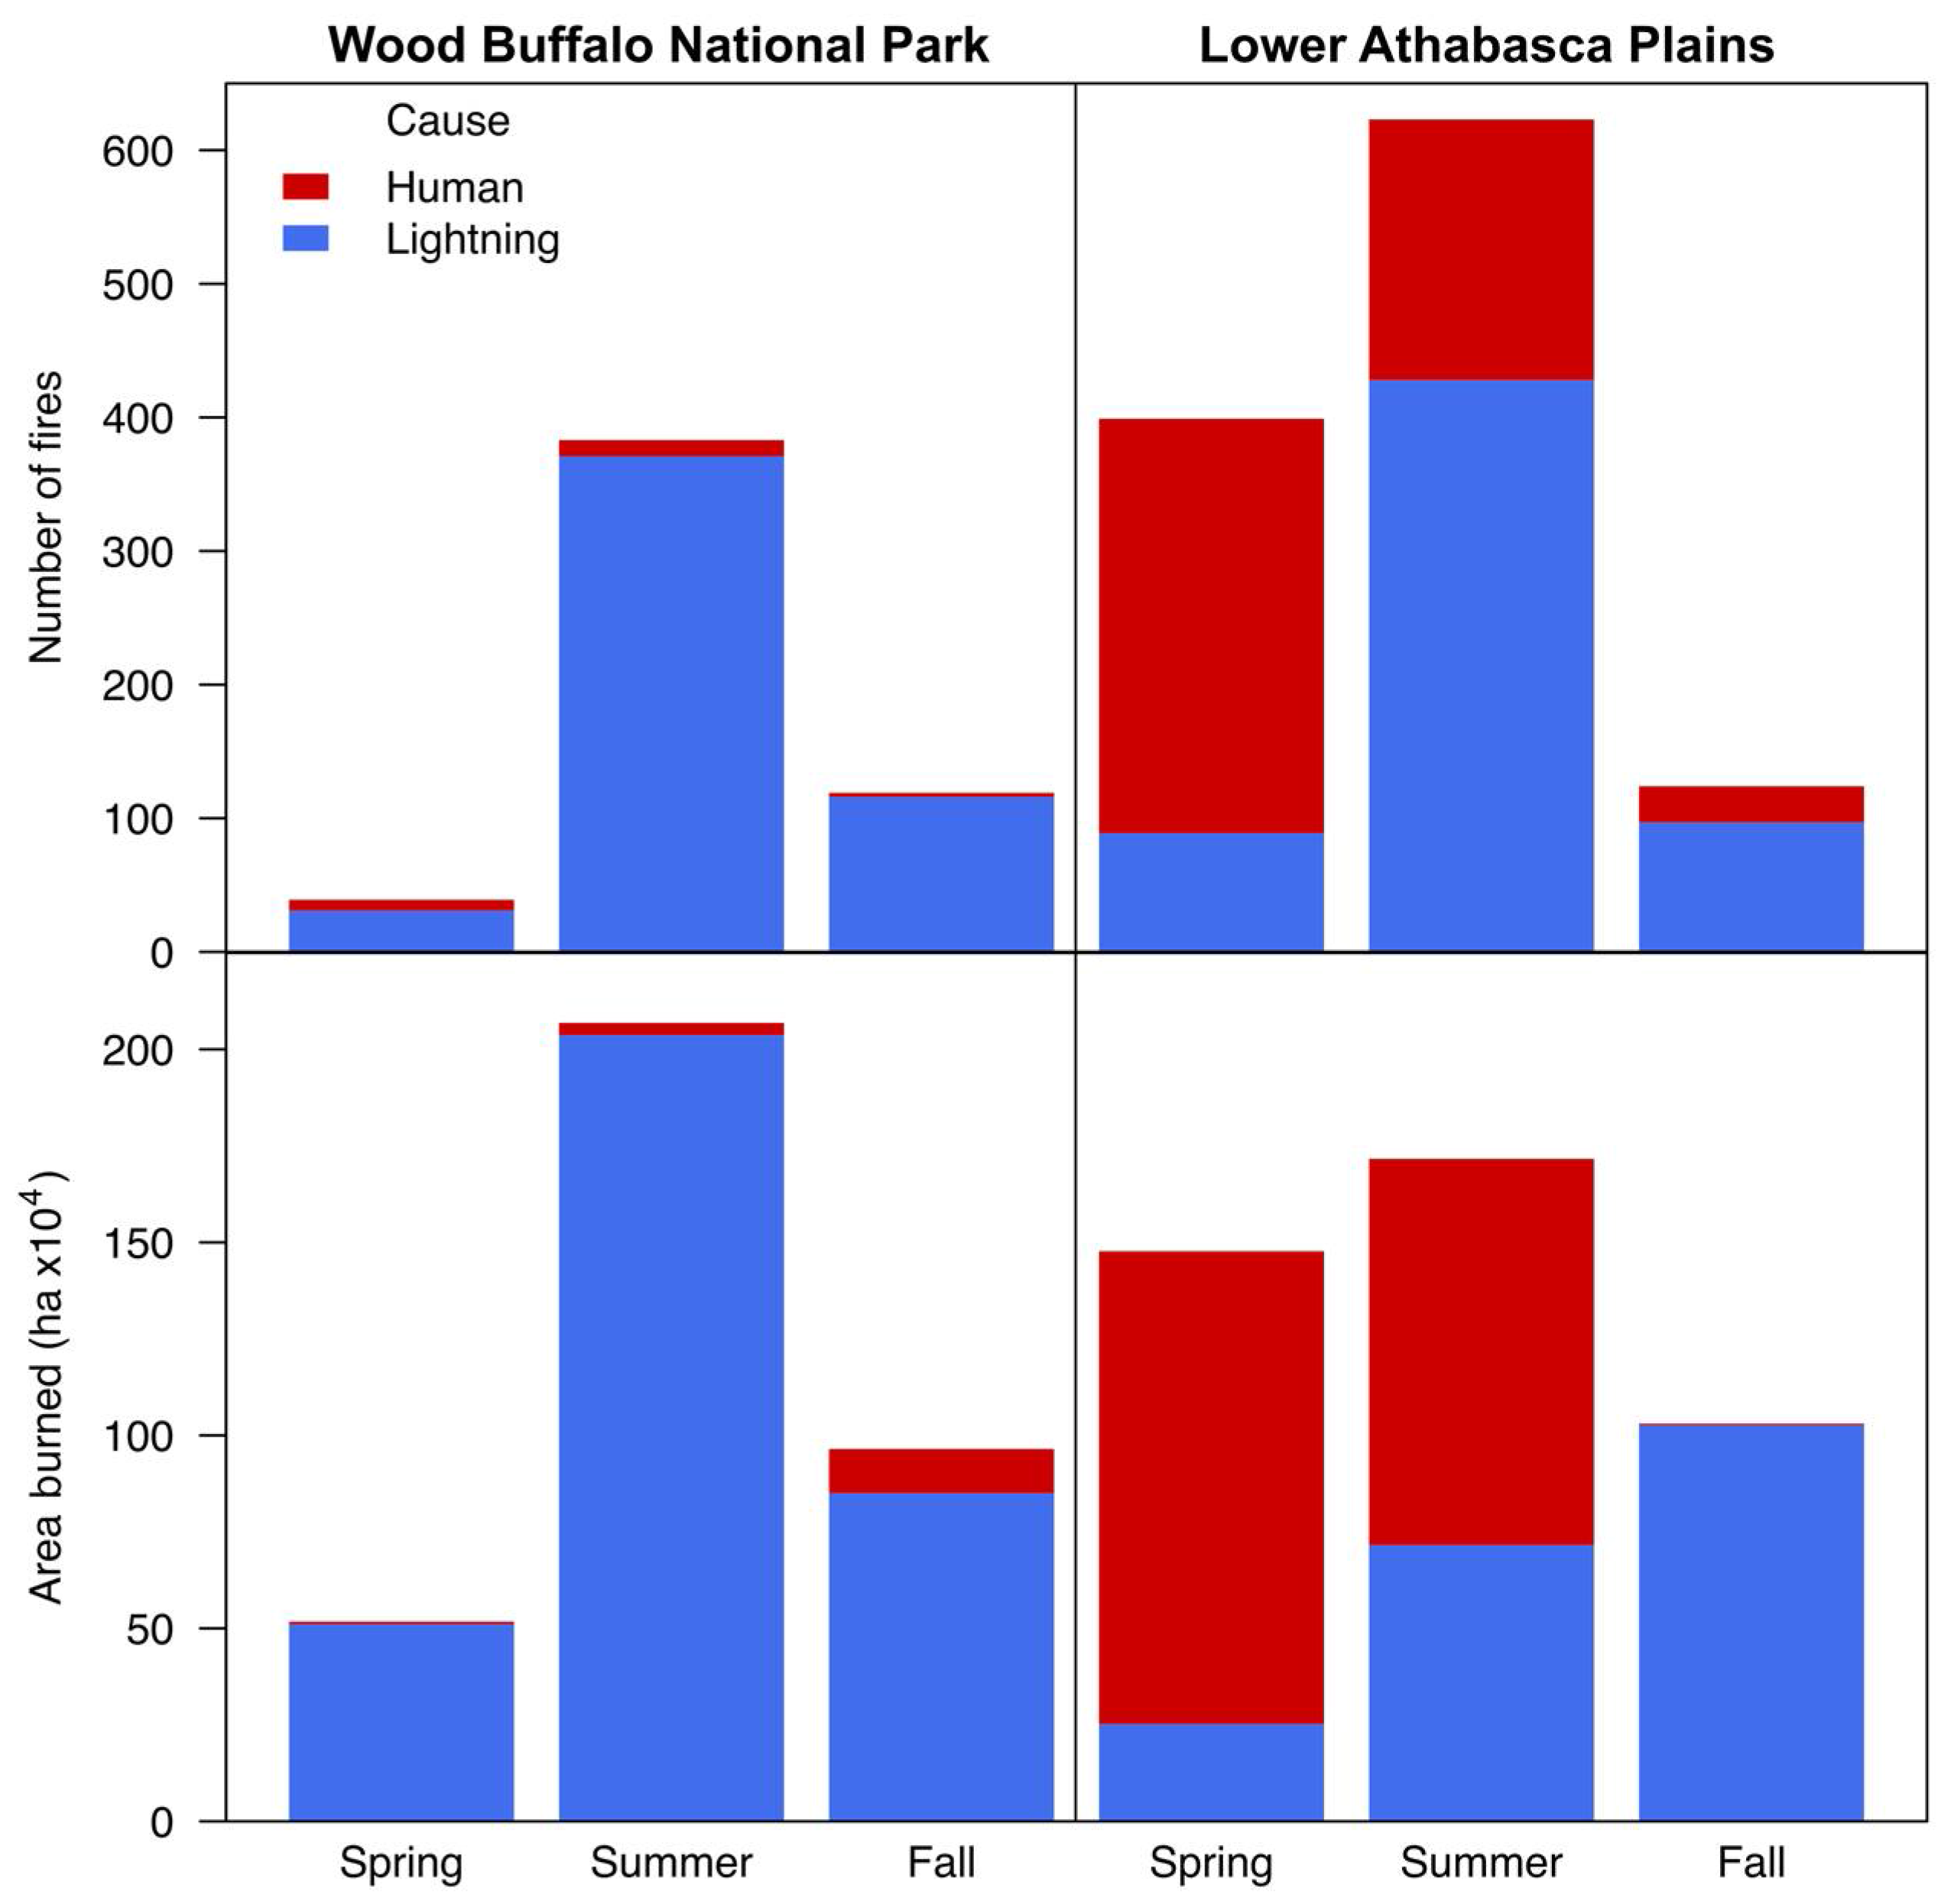
Fire management also differs between these regions. Fires in WBNP are not actively suppressed unless they pose an imminent threat to infrastructure within the park or neighbouring communities, leaving wildfires to fulfill their “natural” role. In contrast, LAP includes the community of Fort McMurray and most of the Lac La Biche Alberta Wildfire Management areas, where there is a strict policy to suppress and prevent fires. On average, during the period 1970–2015, lightning-caused fires in WBNP are larger than the ones in LAP (Table A1), whereas anthropogenic ones are larger in LAP. Human contribution to area burned is so prominent in LAP that the area burned by human-caused fires exceeds the area burned by lightning-caused fires in this region (Table A1). Summer is the season with the highest fire activity (number of fires and area burned; Figure 2) in both regions, but the human contribution to fires is considerably higher during the spring in LAP than in WBNP.
2.2. Fire Variables
We obtained the historical fire records from the Canadian National Fire Database [37] from which we derived the number of fires and area burned (ha) during the fire season (1 March to 31 October) [38] for the period 1970–2015. Although the database extends earlier than 1970, the analysis was limited to this time period because the data recording and methods of detection during the contemporary era were more reliable and consistent than those of the earlier period [24,27,39]. In addition, we only included fires ≥10 ha because they are less likely to go undetected or unreported than fires <10 ha. The fires were stratified by area (WBNP or LAP) and by cause (human or lightning) and summarized into annual time series using the total number of fires and total area burned (log transformed) during the fire season.
2.3. Fire-Climate Variables
In order to uncover possible relationships with the fire activity variables (area burned and number of fires), we built mean annual time series of climate and fire danger indexes from the Canadian Fire Weather Index System (FWIS) [40] (Table 2). We used the records from 67 weather stations located in WBNP and LAP for the period 1970–2015 [41]. Climate variables include annual means of temperature (℃), relative humidity (%), wind speed (km/h), and 24-h precipitation (mm), as well as codes and indices from the FWIS [40]: Fine Fuel Moisture Code (FFMC), Duff Moisture Content (DMC), Drought Code (DC), Initial Spread Index (ISI), Buildup Index (BUI), Fire Weather Index (FWI), and Daily Severity Rating (DSR). Indices and codes are calculated based on weather measurements taken at noon local standard time (LST) and the FWIS moisture codes from the previous day (Table 2).
2.4. Statistical Analysis
We searched for linear trends in the time series to identify overall changes in the number of fires and area burned during the 1970–2015 period. By decomposing the time series, we were able to separate them into their additive components: non-linear trend, oscillations (cyclical), and white noise. The non-linear trend was subtracted from the original time series as a “pre-whitening” step, which reduces the occlusion of the remaining components; in this way, we were able to identify oscillation frequencies and calculate their periodicities (years between peaks). Finally, we ran correlation tests between the fire-climate and fire activity time series in order to identify potential relationships between them. If a relationship was identified, we described its nature (positive, negative), strength, and periodicity (through their regular oscillations). All analyses were performed using R [42].
2.4.1. Linear Trend Detection
We tested the time series for autocorrelation processes, after which we ran a phase-randomized version of the Mann-Kendall trend test (slope different from 0: p ≤ 0.05, H0: β1 = β2, Ha: β1 ≠ β2) to find a significant linear trend. The Theil-Sen slope method was employed to calculate the slope value (β).
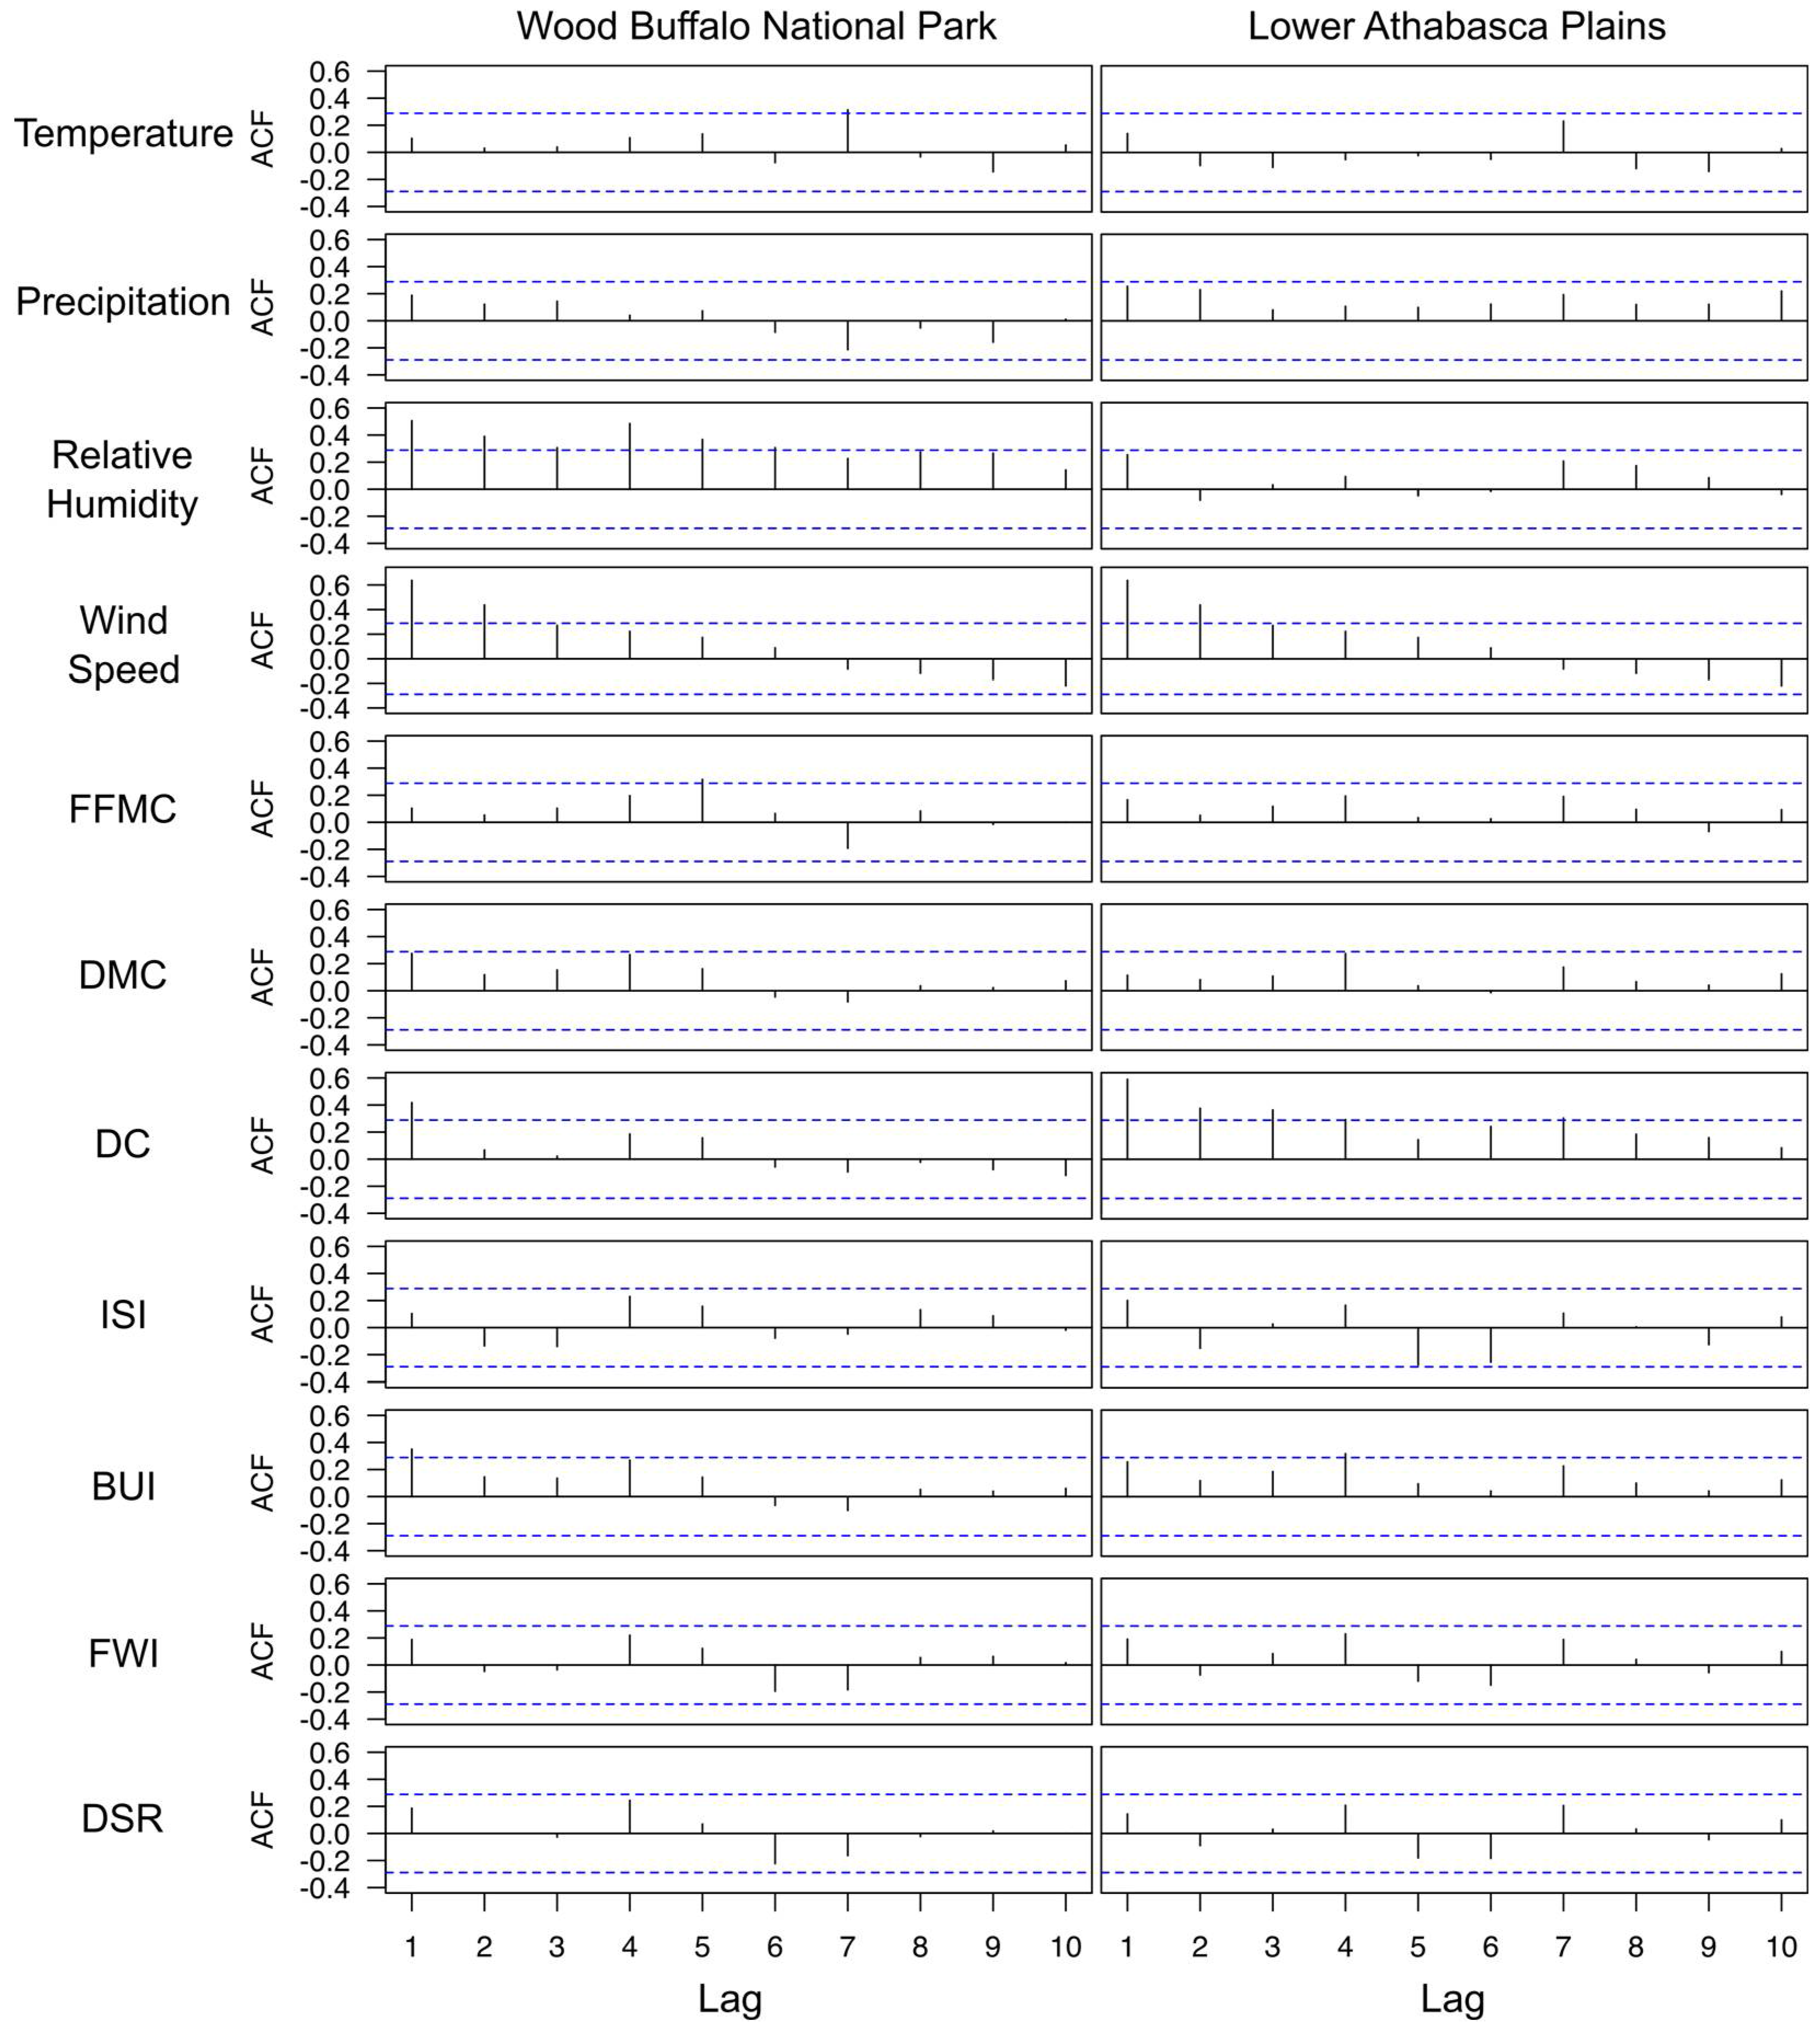
Some time series showed autocorrelation processes (aka. “red noise”), for which the magnitude and order were calculated. This was achieved by means of the autocorrelation and partial autocorrelation functions using the Acf function of the “forecast” R package [43] (Figure A1 and Figure A2). We found autocorrelation processes in the number of fires and area burned for both lightning-caused fires (first order autoregressive model, AR1 = 0.34) and human-caused fires (autoregressive-moving-average model, ARMA (3, 0), p = 0.42) in WBNP. In LAP, only area burned by human-caused fires and the total (L + H) showed autocorrelation ARMA (6, 0). To account for the serial correlation, we employed a phase-randomization method for the hypothesis testing of the trend, which is suitable for non-normal, autocorrelated data, and is robust against outliers (i.e., influential or extreme data). This method consists of the creation of surrogate time series (randomized versions of the original) to create a distribution which is then compared to the original time series to determine its significance. By doing so, we avoided spurious regressions due to the lack of error independence and unequal variances [44,45,46] and obtained a robust estimate of parameters of the regression by bootstrapping [47]. We employed the MKcorr.test function contained in the “MKCorr R” package [48].
2.4.2. Time Series Decomposition
Next, we separated the time series (number of fires, area burned, climate and FWIS indices) into their additive components: non-linear trend, oscillations (regular cycles), and white noise (random signal; see example in the appendix) by using an iterative Singular Spectrum Analysis (SSA, [49]) included in the “Rssa” package [50] in R. SSA is an adaptive non-parametric method ideal for short, noisy time series. This method does not require a priori knowledge of the model to be fitted (e.g., linearity, normality, and stationarity of the residuals, or the number and value of the contained periodicities), making it an advantageous technique to explore and analyze data when the parameters are unknown.
The separation of the components was achieved by running the decomposition process twice (hence the term “iterative”): first, we ran the analysis to extract the non-linear trend and, second, we subtracted this trend (detrending) from the original time series and ran the decomposition process again to extract the oscillatory (cyclical) components. This step also reduces the red noise significantly, so that the oscillations detected are unlikely to be autocorrelation processes [51]. Each iteration requires “windows” (adjacent values) of different lengths (number of values) to establish the resolution and minimum periodicity to detect. We used a small window (L = 12) to extract the non-linear trend, and a larger window (L = 24) on the detrended time series to extract the cyclical components [49]. We calculated the periodicities of the cyclical components originating from the eigenvectors that explained most variance (>20%) according to the SSA. This was achieved through the Estimation of Signal Parameters via Rotational Invariance Techniques (ESPRIT; [52]) using the function parestimate in the “Rssa” package and confirmed with the spectrum (mvspec function, “astsa” package [53]). As a result, we obtained a new set of time series produced for the two study areas (WBNP and LAP), the three ignition causes (lightning, human, lightning + human), the two fire variables (number of fires and area burned), the eleven fire-climate variables, and the two SSA derived outputs (one non-linear-trend and one detrended time series). Non-linear trends, unlike linear ones, may show changes over time according to different rates that might not be detected with the Mann-Kendall test, but they may still represent a relevant pattern in the time series.
2.4.3. Cross-Correlations of Time Series
In order to evaluate the correlations of fire activity time series between areas and fire activity series with fire-climate variables, we calculated the Kendall rank correlation coefficients and their significance from the detrended time series. We carried out correlations for two different time lags (zero and one year) to test for current and delayed effects of climate on fire, respectively.
We used a non-parametric “randomized-phase surrogate” technique for significance testing to reduce type-1 errors. This test employs the Fourier transform to generate a large number of random time series (called surrogates) with the same spectral properties as one of original (and thus, the same autocorrelation, if present) but with random phases. Then, the correlation between the two original time series is compared to a distribution of correlations produced by the surrogate series to obtain the statistical significance [54,55]. This analysis was performed using the surrogateCor function contained in the package “astrochron” [56] in R with 2000 random surrogate series.
3. Results
Fire activity from 1970 to 2015 has increased in WBNP in both the number of fires (β = 0.30, p < 0.01, Figure 3a) and area burned (β = 0.14, p < 0.01, Figure 3c), while in LAP, there is a statistically significant decrease in the number of fires (β = −0.21, p = 0.01, Figure 3b), and no overall change in area burned (β = 0.02, p > 0.05; Figure 3d). Lightning-caused fires were responsible for raising the number of fires in WBNP (β = 0.28, p < 0.05), whereas anthropogenic fires remained low (β = 0, p > 0.05) and their area burned unchanged (β = 0, p > 0.05; Figure 3a,c). Fire activity in WBNP exhibited nonlinear trends, indicating that the increase was faster during the second half of the time period than the first half. Although the non-linear trends suggest a decline in the number of fires caused by lightning or humans in LAP, neither of them were statistically significant (β = 0, p > 0.05 and β = −0.9, p > 0.05 respectively), but their sum (L + H) was (Figure 3b).
In general, a warming and drying climate trend was found over the 46 years studied in both WBNP and LAP, with faster changes in WBNP (Table 3). Most of the fire-climate time series showed some change (linear trend) over the same period that would lead to an increased wildfire activity, but this is only observed in WBNP. In general, for both WBNP and LAP, we found a declining trend in PRECIP, RH, and WINS, and an increasing trend for FFMC, DMC, DC, and BUI. Only ISI did not change overall in any of the areas. Although we did not find a linear trend for temperature in LAP, the non-linear trend extracted by SSA does show an increase (Figure A3), as well as for FWI and DSR in WBNP. The most drastic increase in both areas was observed in the Drought Code, which indicates moisture deficits in the deeper soil levels (Table 3).
Cross-correlations of detrended time series between regions indicated a similar pattern of fire activity regardless of the differences in human influence. Lightning-caused fire time series correlations (for both number of fires and area burned) showed the highest coefficients, whereas human-caused fires showed the lowest (Table 4).
Although the association of fire activity with fire climate was similar in both regions (we observed significant correlations with similar coefficient values for both the number of fires and area burned time series; Table 5), we noted that: (1) mean annual temperature was only correlated with lightning-caused fires in WBNP and human-caused fires and area burned in LAP, (2) mean annual precipitation was associated with lightning-caused fire activity but not human-caused fires in both areas, (3) human-caused fires in WBNP do not have any association with fire-climate, and (4) lightning-caused fires only correlated with temperature and relative humidity in WBNP. We only found three one-year lagged correlations: between the number of human-caused fires in LAP with wind speed (τ = −0.30, p < 0.005), and area burned by lightning ignitions with precipitation in WBNP (τ = −0.26, p < 0.05) and temperature in LAP (τ = 0.29, p < 0.005).
Fire activity in WBNP was characterized by longer and more acute periodicities than the ones found in LAP. We observed that the number of fires and area burned by lightning in WBNP showed strong activity peaks every ~12 years, whereas in LAP, weaker oscillations (i.e., under eight years) were most frequent. Anthropogenic ignitions in both areas mostly displayed high frequency (short periods) oscillations (~3–6 years); however, area burned by humans also showed strong oscillations every ~11 years (Figure 4).
Fire-climate oscillations were very similar between regions, with the strongest periodicities (i.e., higher variance explained) falling under the ENSO domain (2.5–8 years) and aligning with many of the periodicities of fire activity (between 3–6 years). Most of the strongest fire-climate periodicities were found at around four years. With the exception of DC (an index of drought involving precipitation and temperature) and BUI (calculated through DC and DMC), we did not detect strong long periodicities (over nine years) from the fire-climate time series (Figure 4).
4. Discussion
Human activities have been continuously altering the dynamics of the boreal forest in Alberta over the past few decades, and have generated recognizable spatial and temporal patterns of wildfire activity. In the 1970–2015 period, we found increasing fire-conducive climatic trends in both study areas that were reflected in occurrence and area burned increases only in the region with the lowest human interference (WBNP), which agrees with findings reported across Canada [57,58,59]. In contrast, we observed a dampening effect of fire activity in the region with the most human impact (LAP), resulting in a decline in the number of fires and no overall change (no trend) in the area burned. Previous studies also suggest that although area burned has increased due to the changing climate in the boreal forest, this is not necessarily the case in areas of higher human influence [60,61].
The main causes limiting the potential area burned under high human influence are: (1) the strong prevention and fire suppression policies, (2) improved accessibility, (3) the location of the human ignitions (i.e., closer to human infrastructures), and (4) land-use change. The first cause is a consequence of two of the objectives of fire suppression in Alberta: reducing the spread of fires before 10 AM of the following day and preventing them from attaining 2 ha in size [28], which results in fewer escaped fires (i.e., defined here as fires ≥10 ha). In addition, the widespread road network facilitates access for fire-management activities to take place. Although human ignitions might increase over time, they also have a tendency to cluster in the wildland-urban interface (WUI; [61,62]), where fire detection and initial attack are more efficient, impeding their further growth in spite of fire-prone weather conditions. Finally, conversion of forested areas to agricultural, urban, and petrochemical mining land uses has altered the vegetation’s structure and composition. These changes, in turn, have impacted the burn rates and ignition likelihood, and the increased fragmentation has reduced vegetation continuity, countering potential area burned [15,62,63,64,65,66,67].
Wildfire suppression practices, in conjunction with other human-induced changes, have the potential to not just slow down, but also to reverse trends in fire activity; hence, non-climatic factors have the potential to alter fire-climate relationships. Such cases have been reported in France, where recent fire activity stopped tracking climatic trends and decreased along with major changes in fire suppression policy [21,68], and in South Africa, where land-use changes mediated the relationship between climate and area burned [69].
Unlike trends, overall annual fluctuation patterns of wildfire activity exhibited some similarities between regions, regardless of the level of human influence. This is because climate and lightning still persist as dominant factors regulating the totality of fire activity in the boreal forest [70,71,72]. We further support this observation, given that wildfire activity was similarly related to climate in both regions. In general, peaks of fire activity tracked a drier and warmer climate in both areas. We also found that temperature and relative humidity did not correlate to the number of lightning-caused fires in LAP, whereas they did in WBNP, suggesting that non-climatic factors (i.e., fire management, land-use change, road density) might have interfered with those relationships [21,73].
Anthropogenic fire activity is associated with the same climatic variables as lightning-caused fire activity, with only very few exceptions. Most notably, we observed a lack of association between anthropogenic fires and precipitation that might indicate that more of these fires may occur in years with higher soil moisture conditions than lightning-caused fires. This observation has also been reported before in the U.S. [74], where the authors concluded that anthropogenic ignitions can occur in a broader range of moisture environments than lightning-caused fires, thereby resulting in a wider wildfire “niche”. In addition, the shift of the peak of anthropogenic fire activity from the summer to the spring, accompanied by a longer fire season length [20,74,75,76], might have caused anthropogenic and lightning fires associated with different climatic conditions within the year. This means that even if precipitation was higher overall during the year, the actual precipitation events might have been clustered to only the season where they could limit lightning-caused fires (summer), but not anthropogenic fires (spring).
We found periodicities that suggest a match with different teleconnections’ oscillatory patterns. Large-scale climatic patterns (teleconnections) and their interactions influence weather and local climate, and consequently, fire activity in Canada [77,78]. Wildfire cycles under higher human influence (LAP), as well as most fire-climate periodicities, were predominantly characterized by shorter periods (<8 years) compared to longer periods under low human influence (WBNP; >9 years). The short periodicities of fire activity under high human influence suggest a higher susceptibility to Quasi-biennial and el Niño Southern Oscillations (QBO and ENSO, 2–2.5 and 2.5–8 years), whereas under lower human influence (WBNP), they seem to respond to ENSO and a quasi-decadal oscillation (Pacific Decadal Oscillation + sunspot cycle, 9–13 years) [79]. We also found traces of larger oscillations in WBNP (<15 years, not shown) that are usually associated with the PDO and IPO (Pacific Decadal and Pacific Interdecadal Oscillations), but due to the short time series we used, the signals were weak and possibly spurious. The absence of long fire-climate periodicities explaining area burned by humans in LAP at 10–12 years, might be a result of coinciding peaks of short oscillations of different periodicity that may create longer, stronger oscillations. These kinds of interactions have been documented for longer-term climatic patterns, when negative phases of ENSO and PDO concur with positive AMO phase, increasing the occurrence of fires in Colorado [80], or when positive ENSO and PDO phases coincide in the Rocky Mountains [81] in the U.S. In order to support these partial observations, future research with longer, seasonal time series are required.
The creation of Wood Buffalo National Park almost a century ago gave us the opportunity to compare this area of very low human impact with the adjacent area under a strong anthropogenic transformation in the same ecological region, avoiding the conflation of human influence with other factors. Furthermore, we used a temporal and spatial extent that allowed us to distinguish more directly the effect of human influence on fire activity in the short term (years to decades) [57,62,70], which generates useful information for land managers. Understanding the temporal patterns of fire activity helps fire management agencies assign and efficiently distribute material and human resources to fight and prevent fires. For example, in the province of Alberta, increasing attention is being given to the earliest part of the fire season (i.e., spring), when numerous human ignitions often coincide with the early onset of warm weather due to a lengthening of the fire season that has resulted in large and destructive wildfires (e.g., the Fort McMurray fire of 2016) [82].
5. Conclusions
Over the 46-year period studied (1970–2015), we observed how wildfire activity patterns in the boreal forest have been shaped by the continuously increasing influence of humans, potentially creating a novel fire regime through the modification of the seasonality, size, and frequency of fires. In our area of study, under high human influence, fire activity (area burned and number of fires) peaks in the spring instead of the summer, burning rates are lower, on average, and fewer fires over 10 ha occur than in the more natural area. Analyses used mostly non-parametric statistical techniques that are suitable for the highly variable and stochastic nature of the data. We showed how human influence affects fire activity by changing its trends and cyclical patterns, and how anthropogenic wildfire activity generates temporal patterns and associations with climate distinctive (albeit similar) from those associated with lightning wildfire activity. In general, although northern Alberta is subjected to drier and warmer climatic conditions, in areas of a high anthropogenic footprint, human influence appears to dampen and reverse the expected fire activity trends and affect the cyclical nature of fire occurrence. These rapid changes pose a new set of challenges for managers and researchers who try to understand and predict the impact of altered fire regimes on the diversity, structure, and future fire activity of a boreal forest. Our results further emphasize the importance of explicitly incorporating the multi-faceted human impact to improve our understanding of fire activity, how it is affecting the fire regime at different spatial and temporal scales, and to produce more accurate predictive models of fire activity.
Acknowledgments
Support for this research came from the Canadian Partnership for Wildland Fire, Mike Flannigan NSERC Discovery Grant and CONACYT Mexico (Scholarship 312318) and the Department of Renewable Resources of the University of Alberta. We would also like to thank Richard Carr for providing the fire-climate data, Piyush Jain for introducing us to the “randomized-phase-surrogate” techniques for trend detections and correlations and sharing his R package for the Mann-Kendall trend test, John Little for his advice on using and accessing the National Fire Database, Ellen Whitman for her assistance in building the land cover map, Karen Blouin for proofreading, and Filmer Chu for our long discussions over the potential applications of time series analysis.
Author Contributions
M.D.F. conceived the original idea and supervised this project. R.C.-R. designed and performed the data analysis; R.C.-R. and M.-A.P. interpreted the results and wrote the paper.
Conflicts of Interest
The authors declare no conflict of interest. The founding sponsors had no role in the design of the study; in the collection, analyses, or interpretation of data; in the writing of the manuscript, and in the decision to publish the results.
Appendix A
Figure A1.
Autocorrelation plots for the number of fires and area burned (log transformed) time series in Wood Buffalo National Park and Lower Athabasca Plains.
Figure A1.
Autocorrelation plots for the number of fires and area burned (log transformed) time series in Wood Buffalo National Park and Lower Athabasca Plains.

Figure A2.
Autocorrelation plots for the fire-climate (climate and Fire Weather Index System) time series in Wood Buffalo National Park and Lower Athabasca Plains.
Figure A2.
Autocorrelation plots for the fire-climate (climate and Fire Weather Index System) time series in Wood Buffalo National Park and Lower Athabasca Plains.


Table A1.
Fire statistics in Wood Buffalo National Park (WBNP) and Lower Athabasca Plains (LAP) from 1970 to 2015. Letters L and H indicate lightning and human-caused fires, respectively.
Table A1.
Fire statistics in Wood Buffalo National Park (WBNP) and Lower Athabasca Plains (LAP) from 1970 to 2015. Letters L and H indicate lightning and human-caused fires, respectively.
| Region | WBNP | LAP | ||||
|---|---|---|---|---|---|---|
| Cause | L + H | L | H | L + H | L | H |
| Number of fires | 541 (100%) | 518 (95.75%) | 23 (4.25%) | 1146 (100%) | 614 (53.60%) | 532 (46.40%) |
| Proportional number of fires (fires per 100 kha) | 12.70 | 12.14 | 0.54 | 14.44 | 7.74 | 6.70 |
| Area burned (ha × 104) | 355.08 (100%) | 339.87 (95.70%) | 15.21 (4.30%) | 422.39 * (100%) | 199.56 (47.25%) | 222.83 (52.75%) |
| Mean fire size (ha) | 7332.51 | 6978.90 | 353.60 | 7384.40 | 4411.42 | 2972.98 |
Note: Information shown here is for fires ≥10 ha. Based on the National Fire Database [37]. * The Horse River fire (Fort McMurray) in 2016, increased this value by 13% in just one year.
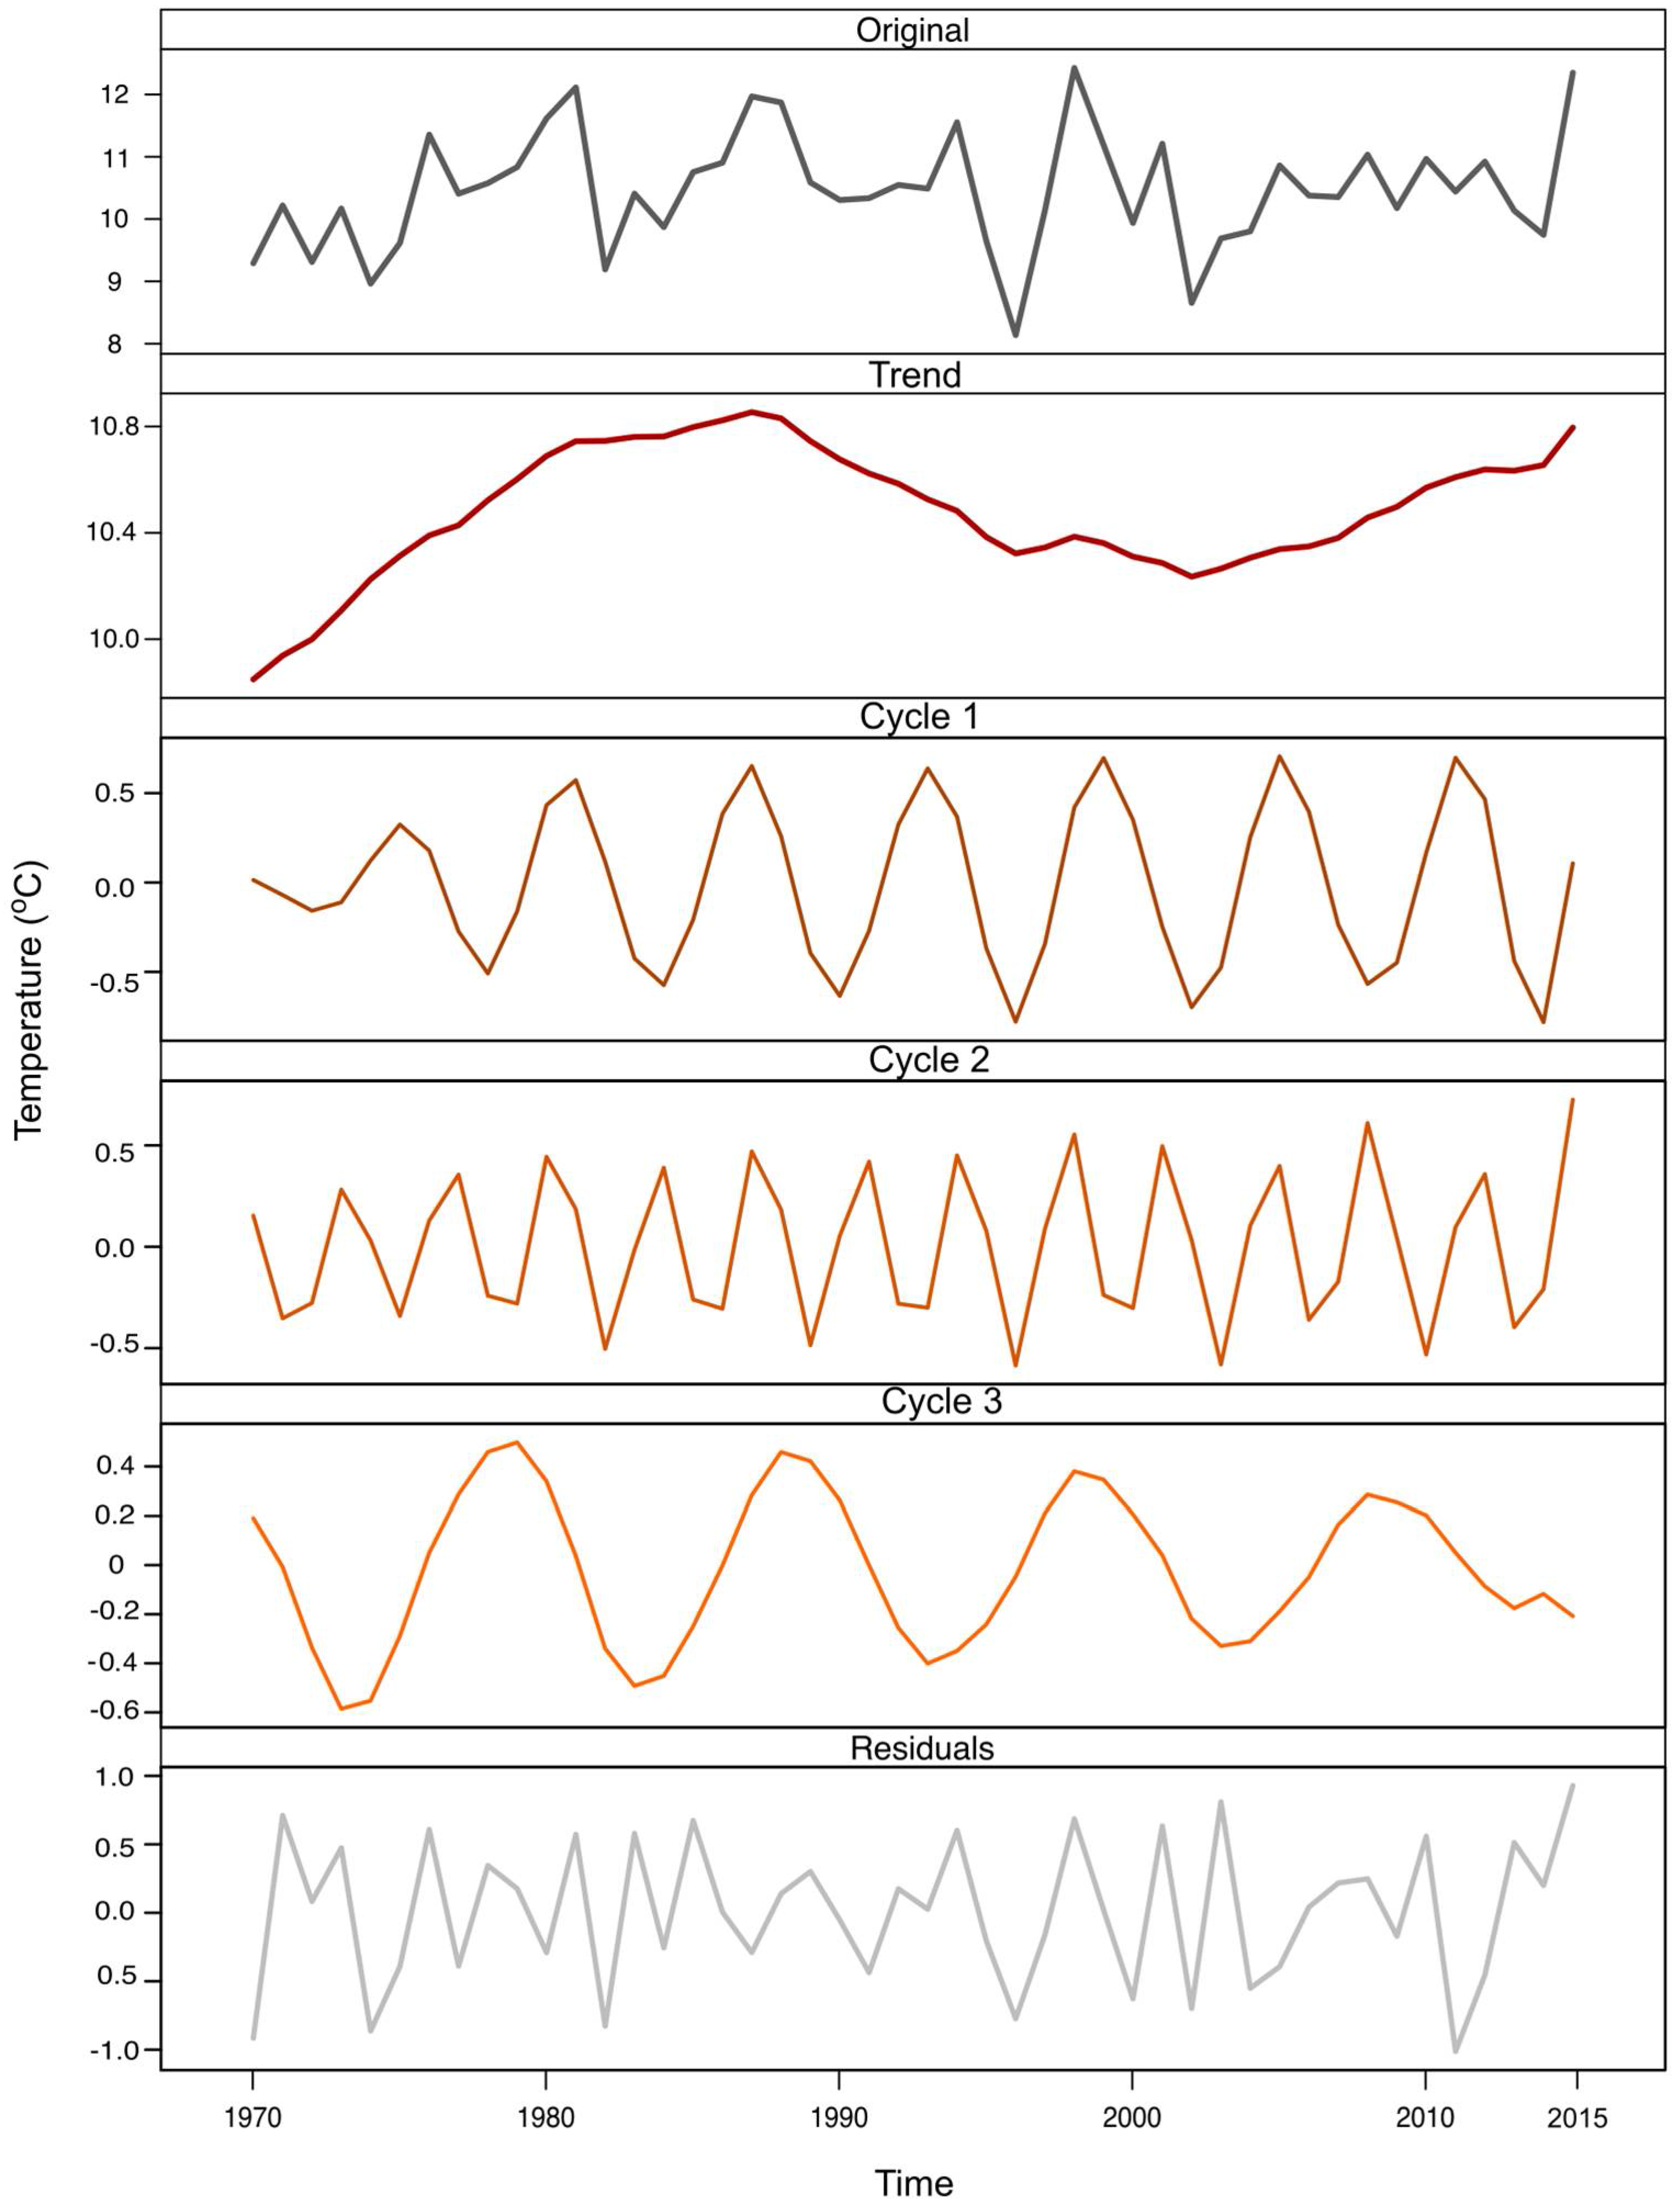
Figure A3.
Example of decomposition by Singular Spectrum Analysis for temperature time series in Lower Athabasca Plains, showing its additive components: trend, cycles (oscillations), and residuals (white noise, random). In this case, the trend is upward non-monotonic and each cycle has a distinctive periodicity of 5.8, 3.7, and 9.5 years, respectively.

References
- Weber, M.G.; Stocks, B.J. Forest Fires and Sustainability in the Boreal Forest of Canada. Ambio 1998, 27, 545–550. [Google Scholar]
- Stocks, B.J.; Mason, J.A.; Todd, J.B.; Bosch, E.M.; Wotton, B.M.; Amiro, B.D.; Flannigan, M.D.; Hirsch, K.G.; Logan, K.A.; Martell, D.L.; et al. Large forest fires in Canada, 1959–1997. J. Geophys. Res. 2002, 108. [Google Scholar] [CrossRef]
- Bergeron, Y.; Leduc, A.; Harvey, B.; Gauthier, S. Natural fire regime: A guide for sustainable management of the Canadian boreal forest. Silva Fenn. 2002, 36, 81–95. [Google Scholar] [CrossRef]
- Johnstone, J.F. Response of boreal plant communities to variations in previous fire-free interval. Int. J. Wildl. Fire 2006, 15, 497–508. [Google Scholar] [CrossRef]
- Kurz, W.; Apps, M. A 70-year retrospective analysis of carbon fluxes in the Canadian forest sector. Ecol. Appl. 1999, 9, 526–547. [Google Scholar] [CrossRef]
- Amiro, B.D.; Stocks, B.J.; Alexander, M.E.; Flannigan, M.D.; Wotton, B.M. Fire, climate change, carbon and fuel management in the Canadian boreal forest. J. Wildl. Fire 2001, 10, 405–413. [Google Scholar] [CrossRef]
- Martell, D.L. The impact of fire on timber supply in Ontario. For. Chron. 1994, 70, 164–173. [Google Scholar] [CrossRef]
- Bowman, D.M.J.S.; Balch, J.; Artaxo, P.; Bond, W.J.; Cochrane, M.A.; D’Antonio, C.M.; Defries, R.; Johnston, F.H.; Keeley, J.E.; Krawchuk, M.A.; et al. The human dimension of fire regimes on Earth. J. Biogeogr. 2011, 38, 2223–2236. [Google Scholar] [CrossRef] [PubMed]
- Hope, E.S.; McKenney, D.W.; Pedlar, J.H.; Stocks, B.J.; Gauthier, S. Wildfire Suppression Costs for Canada under a Changing Climate. PLoS ONE 2016, 11, 2223–2236. [Google Scholar] [CrossRef] [PubMed]
- Weber, M.G.; Flannigan, M.D. Canadian boreal forest ecosystem structure and function in a changing climate: Impact on fire regimes. Environ. Rev. 1997, 5, 145–166. [Google Scholar] [CrossRef]
- Flannigan, M.; Wotton, B. Climate, weather, and area burned. In Forest Fires: Behavior and Ecological Effects; Johnson, E.A., Miyanishi, K., Eds.; Academic Press: New York, NY, USA, 2001; pp. 351–373. [Google Scholar]
- Cumming, S.G. A parametric model of the fire-size distribution. Can. J. For. Res. 2001, 31, 1297–1303. [Google Scholar] [CrossRef]
- Krawchuk, M.A.; Cumming, S.G. Effects of biotic feedback and harvest management on boreal forest fire activity under climate change. Ecol. Appl. 2011, 21, 122–136. [Google Scholar] [CrossRef] [PubMed]
- Podur, J. Spatial and temporal patterns of forest fire activity in Canada. Ph.D. Thesis, University of Toronto, Toronto, ON, Canada, 2001. [Google Scholar]
- Gralewicz, N.J.; Nelson, T.A.; Wulder, M.A. Factors influencing national scale wildfire susceptibility in Canada. For. Ecol. Manag. 2012, 265, 20–29. [Google Scholar] [CrossRef]
- Marlon, J.R.; Bartlein, P.J.; Carcaillet, C.; Gavin, D.G.; Harrison, S.P.; Higuera, P.E.; Joos, F.; Power, M.J.; Prentice, I.C. Climate and human influences on global biomass burning over the past two millennia. Nat. Geosci. 2008, 1, 697–702. [Google Scholar] [CrossRef]
- Gustafson, E.J.; Zollner, P.A.; Sturtevant, B.R.; He, H.S.; Mladenoff, D.J. Influence of forest management alternatives and land type on susceptibility to fire in northern Wisconsin, USA. Landsc. Ecol. 2004, 19, 327–341. [Google Scholar] [CrossRef]
- Parisien, M.; Peters, V.; Wang, Y. Spatial patterns of forest fires in Canada, 1980–1999. J. Wildl. Fire 2006, 15, 361–374. [Google Scholar] [CrossRef]
- Pechony, O.; Shindell, D.T. Driving forces of global wildfires over the past millennium and the forthcoming century. Proc. Natl. Acad. Sci. USA 2010, 107, 19167–19170. [Google Scholar] [CrossRef] [PubMed]
- Flannigan, M.; Cantin, A.S.; de Groot, W.J.; Wotton, M.; Newbery, A.; Gowman, L.M. Global wildland fire season severity in the 21st century. For. Ecol. Manag. 2013, 294, 54–61. [Google Scholar] [CrossRef]
- Ruffault, J.; Mouillot, F. How a new fire-suppression policy can abruptly reshape the fire-weather relationship. Ecosphere 2015, 6, art199. [Google Scholar] [CrossRef]
- Brotons, L.; Aquilué, N.; de Cáceres, M.; Fortin, M.-J.; Fall, A. How fire history, fire suppression practices and climate change affect wildfire regimes in Mediterranean landscapes. PLoS ONE 2013, 8, e62392. [Google Scholar] [CrossRef] [PubMed] [Green Version]
- Higuera, P.E.; Abatzoglou, J.T.; Littell, J.S.; Morgan, P. The changing strength and nature of fire-climate relationships in the northern Rocky Mountains, USA., 1902–2008. PLoS ONE 2015, 10, e0127563. [Google Scholar] [CrossRef] [PubMed]
- Cumming, S.G. Effective fire suppression in boreal forests. Can. J. For. Res. 2005, 786, 772–786. [Google Scholar] [CrossRef]
- Martell, D.L.; Sun, H. The impact of fire suppression, vegetation, and weather on the area burned by lightning-caused forest fires in Ontario. Can. J. For. Res. 2008, 38, 1547–1563. [Google Scholar] [CrossRef]
- Magnussen, S.; Taylor, S.W. Inter- and intra-annual profiles of fire regimes in the managed forests of Canada and implications for resource sharing. Int. J. Wildl. Fire 2012, 21, 328–341. [Google Scholar] [CrossRef]
- Murphy, P. Methods for evaluating the effects of forest fire management in Alberta. Ph.D. Thesis, University of British Columbia, Vancouver, BC, Canada, 1985. [Google Scholar]
- Alberta Agriculture and Forestry Forest Areas of Alberta. Available online: http://wildfire.alberta.ca/resources/maps-data/documents/ForestAreasAlberta-May03-2017.pdf (accessed on 4 November 2016).
- Alberta Environment and Parks Alberta Wildfire 2015 Statistics. Available online: http://aep.alberta.ca/files/PREV_AlbertaWildfire_2015_Infographic_.pdf (accessed on 1 January 2016).
- Alam, R.; Islam, S.; Mosely, E.; Thomas, S.; Dodwell, V.; Doel, D. Rapid Impact Assessment of Fort McMurray Wildfire. Available online: https://www.iclr.org/images/AlamIslam_QuickResponseSummary-ICLR.pdf (accessed on 7 January 2017).
- KPMG May 2016 Wood Buffalo Wildfire, Post-Incident Assessment Report. Available online: https://www.alberta.ca/assets/documents/Wildfire-KPMG-Report.pdf (accessed 7 January 2017).
- Parks Canada Agency Fire Management Zones. Available online: https://www.pc.gc.ca/en/nature/science/conservation/feu-fire/feuveg-fireveg/incendies-wildfire (accessed on 1 January 2017).
- Natural Regions Committee. Natural Regions and Subregions of Alberta; Downing, D.J., Pettapiece, W.W., Eds.; Government of Alberta: Edmonton, AB, Canada, 2006; Pub. No. T/852.
- Alberta Biodiversity Monitoring Institute ABMI Wall-to-wall Land Cover Map. 2012. Available online: http://abmi.ca/home/data-analytics/da-top/da-product-overview/GIS-Land-Surface/Land-Cover.html (accessed on 10 April 2017).
- US Geological Survey USGS. Global Visualization Viewer. Available online: http://glovis.usgs.gov (accessed on 1 April 2017).
- Wang, T.; Hamann, A.; Spittlehouse, D.L.; Murdock, T.Q. ClimateWNA—High-resolution spatial climate data for western North America. J. Appl. Meteorol. Climatol. 2012, 51, 16–29. [Google Scholar] [CrossRef]
- Canadian Forest Service. Canadian National Fire Database—Agency Fire Data. 2016. Available online: http://cwfis.cfs.nrcan.gc.ca/datamart (accessed on 15 November 2016).
- Government of Alberta. Forest and Prairie Protection Act. Available online: http://www.qp.alberta.ca/574.cfm?page=F19.cfm&leg_type=Acts&isbncln=9780779726554%5CnR:%5CAdmin%5COffice%5CRefMan%5CPrairieOffices%5CCalgaryOffice%5C1322-EnvironmentalAssessment%5C1332-Biophysical%5CReferences (accessed on 20 July 2016).
- Armstrong, G.W. A stochastic characterisation of the natural disturbance regime of the boreal mixedwood forest with implications for sustainable forest management. Can. J. For. Res. 1999, 29, 424–433. [Google Scholar] [CrossRef]
- Van Wagner, C.E. Development and Structure of the Canadian Forest Fire Weather Index System; Forestry Technical Report 35; Canadian Forestry Service: Otawa, ON, Canada, 1987. [Google Scholar]
- Natural Resources Canada. Canadian Forest Fire Weather Index System from the Canadian Wildland Fire Information System; Version 3.0; Canadian Forest Service, Northern Forestry Center: Edmonton, AB, Canada, 2016. [Google Scholar]
- R Development Core Team. R: A Language and Environment for Statistical Computing; R Foundation for Statistical Computing: Vienna, Austria. Available online: https://www.R-project.org/ (accessed on 4 June 2016).
- Hyndman, R.J.; Khandakar, Y. Automatic time series forecasting: The forecast package for R. J. Stat. Softw. 2008, 27, C3. [Google Scholar] [CrossRef]
- Metcalfe, A.V.; Cowpertwait, P.S.P. Introductory Time Series with R; Springer New York: New York, NY, USA, 2009; ISBN 978-0-387-88697-8. [Google Scholar]
- Crawley, M.J. The R Book, 2nd ed.; John Wiley and Sons: Chichester, UK, 2013; ISBN 9780470973929. [Google Scholar]
- Fox, J.; Weisberg, S. An {R} Companion to Applied Regression; Sage Publications: Thousand Oaks, CA, USA, 2002; ISBN 9781412975148. [Google Scholar]
- Harrell, F.E. Regression Modeling Strategies, 2nd ed.; Springer International Publishing: Cham, Switzerland, 2015; ISBN 978-3-319-19424-0. [Google Scholar]
- Jain, P. Package “MKcorrR”: Mann-Kendall Test with Autocorrelated Data. Unpublished work. 2017. [Google Scholar]
- Golyandina, N.; Korobeynikov, A. Basic singular spectrum analysis and forecasting with R. Comput. Stat. Data Anal. 2014, 71, 934–954. [Google Scholar] [CrossRef]
- Golyandina, N.; Korobeynikov, A.; Shlemov, A.; Usevich, K. Multivariate and 2D extensions of singular spectrum analysis with the Rssa package. J. Stat. Softw. 2014, 67, 1–78. [Google Scholar] [CrossRef]
- Yue, S.; Wang, C.Y. Assessment of the significance of sample serial correlation by the bootstrap test. Water Resour. Manag. 2002, 16, 23–35. [Google Scholar] [CrossRef]
- Roy, R.; Kailath, T. ESPRIT-estimation of signal parameters via rotational invariance techniques. IEEE Trans. Acoust. 1989, 37, 984–995. [Google Scholar] [CrossRef]
- Stoffer, D. Astsa: Applied Statistical Time Series Analysis. 2016. Available online: https://CRAN.R-project.org/package=astsa (accessed on 20 January 2017).
- Ebisuzaki, W.; Ebisuzaki, W. A method to estimate the statistical significance of a correlation when the data are serially correlated. J. Clim. 1997, 10, 2147–2153. [Google Scholar] [CrossRef]
- Baddouh, M.; Meyers, S.R.; Carroll, A.R.; Beard, B.L.; Johnson, C.M. Lacustrine 87Sr/86Sr as a tracer to reconstruct Milankovitch forcing of the Eocene hydrologic cycle. Earth Planet. Sci. Lett. 2016, 448, 62–68. [Google Scholar] [CrossRef]
- Meyers, S.R. astrochron: An R Package for Astrochronology. 2014. Available online: https://cran.r-project.org/package=astrochron (accessed on 15 December 2016).
- Tymstra, C.; Flannigan, M.D.; Armitage, O.B.; Logan, K. Impact of climate change on area burned in Alberta’s boreal forest. Int. J. Wildl. Fire 2007, 16, 153–160. [Google Scholar] [CrossRef]
- Girardin, M.P. Interannual to decadal changes in area burned in Canada from 1781 to 1982 and the relationship to Northern Hemisphere land temperatures. Glob. Ecol. Biogeogr. 2007, 16, 557–566. [Google Scholar] [CrossRef]
- Jolly, W.M.; Cochrane, M.A.; Freeborn, P.H.; Holden, Z.A.; Brown, T.J.; Williamson, G.J.; Bowman, D.M.J.S. Climate-induced variations in global wildfire danger from 1979 to 2013. Nat. Commun. 2015, 6, 7537. [Google Scholar] [CrossRef] [PubMed]
- Parisien, M.-A.; Miller, C.; Parks, S.A.; DeLancey, E.R.; Robinne, F.-N.; Flannigan, M.D. The spatially varying influence of humans on area burned in North America. Environ. Res. Lett. 2016, 11, 075005. [Google Scholar] [CrossRef]
- Robinne, F.-N.; Parisien, M.-A.; Flannigan, M.D. Anthropogenic influence on wildfire activity in Alberta, Canada. Int. J. Wildl. Fire 2016, 25, 1131–1143. [Google Scholar] [CrossRef]
- Gralewicz, N.J.; Nelson, T.A.; Wulder, M.A. Spatial and temporal patterns of wildfire ignitions in Canada from 1980 to 2006. Int. J. Wildl. Fire 2012, 21, 230. [Google Scholar] [CrossRef]
- Podur, J.; Martell, D.; Knight, K. Statistical quality control analysis of forest fire activity in Canada. Can. J. For. 2002, 205, 195–205. [Google Scholar] [CrossRef]
- Ryu, S.-R.; Chen, J.; Zheng, D.; Bresee, M.K.; Crow, T.R. Simulating the effects of prescribed burning on fuel loading and timber production (EcoFL) in managed northern Wisconsin forests. Ecol. Modell. 2006, 196, 395–406. [Google Scholar] [CrossRef]
- Krawchuk, M.A.; Cumming, S.G.; Flannigan, M.D.; Wein, R.W. Biotic and abiotic regulation of lightning fire initiation in the mixedwood boreal forest. Ecology 2006, 87, 458–468. [Google Scholar] [CrossRef] [PubMed]
- Cumming, S. Forest type and wildfire in the Alberta boreal mixedwood: What do fires burn? Ecol. Appl. 2001, 11, 97–110. [Google Scholar] [CrossRef]
- Parisien, M.-A.; Parks, S.A.; Krawchuk, M.A.; Flannigan, M.D.; Bowman, L.M.; Moritz, M.A. Scale-dependent controls on the area burned in the boreal forest of Canada, 1980-2005. Ecol. Appl. 2011, 21, 789–805. [Google Scholar] [CrossRef] [PubMed]
- Fréjaville, T.; Curt, T. Seasonal changes in the human alteration of fire regimes beyond the climate forcing. Environ. Res. Lett. 2017, 12, 35006. [Google Scholar] [CrossRef]
- Archibald, S.; Roy, D.P.; van Wilgen, B.W.; Scholes, R.J. What limits fire? An examination of drivers of burnt area in Southern Africa. Glob. Chang. Biol. 2009, 15, 613–630. [Google Scholar] [CrossRef]
- Wang, Y.; Anderson, K. An evaluation of spatial and temporal patterns of lightning-and human-caused forest fires in Alberta, Canada, 1980–2007. Int. J. Wildl. Fire 2011, 19, 1059–1072. [Google Scholar] [CrossRef]
- Veraverbeke, S.; Rogers, B.M.; Goulden, M.L.; Jandt, R.R.; Miller, C.E.; Wiggins, E.B.; Randerson, J.T. Lightning as a major driver of recent large fire years in North American boreal forests. Nat. Clim. Chang. 2017, 7, 529–534. [Google Scholar] [CrossRef]
- Erni, S.; Arseneault, D.; Parisien, M.A.; Bégin, Y. Spatial and temporal dimensions of fire activity in the fire-prone eastern Canadian taiga. Glob. Chang. Biol. 2017, 23, 1152–1166. [Google Scholar] [CrossRef] [PubMed]
- Arienti, M.C.; Cumming, S.G.; Krawchuk, M.A.; Boutin, S. Road network density correlated with increased lightning fire incidence in the Canadian western boreal forest. Int. J. Wildl. Fire 2009, 18, 970–982. [Google Scholar] [CrossRef]
- Balch, J.K.; Bradley, B.A.; Abatzoglou, J.T.; Nagy, R.C.; Fusco, E.J. Human-started wildfires expand the fire niche across the United States. Proc. Natl. Acad. Sci. USA 2017, 114. [Google Scholar] [CrossRef] [PubMed]
- Albert-Green, A.; Dean, C.B.; Martell, D.L.; Woolford, D.G. A methodology for investigating trends in changes in the timing of the fire season with applications to lightning-caused forest fires in Alberta and Ontario, Canada. Can. J. For. Res. 2013, 43, 39–45. [Google Scholar] [CrossRef]
- Wang, X.; Thompson, D.K.; Marshall, G.A.; Tymstra, C.; Carr, R.; Flannigan, M.D. Increasing frequency of extreme fire weather in Canada with climate change. Clim. Chang. 2015, 130, 573–586. [Google Scholar] [CrossRef]
- Fauria, M.M.; Johnson, E.A. Large-scale climatic patterns control large lightning fire occurrence in Canada and Alaska forest regions. J. Geophys. Res. Biogeosci. 2006, 111, G04008. [Google Scholar] [CrossRef]
- Mori, A.S. Climatic variability regulates the occurrence and extent of large fires in the subalpine forests of the Canadian Rockies. Ecosphere 2011, 2, 1–20. [Google Scholar] [CrossRef]
- Bridgman, H.A.; Oliver, J.; Glantz, M. The Global Climate System: Patterns, Processes, and Teleconnections; Cambridge University Press: Cambridge, UK, 2006; ISBN 052182642X. [Google Scholar]
- Schoennagel, T.; Veblen, T.T.; Kulakowski, D.; Holz, A. Multidecadal climate variability and climate interactions affect subalpine fire occurrence, Western Colorado (USA). Ecology 2007, 88, 2891–2902. [Google Scholar] [CrossRef] [PubMed]
- Schoennagel, T.; Veblen, T.T.; Romme, W.H.; Sibold, J.S.; Cook, E.R. ENSO and PDO variability affect drought-induced fire occurrence in rocky mountain subalpine forests. Ecol. Appl. 2005, 15, 2000–2014. [Google Scholar] [CrossRef]
- Pickell, P.D.; Coops, N.C.; Ferster, C.J.; Bater, C.W.; Blouin, K.D.; Flannigan, M.D.; Zhang, J. An early warning system to forecast the close of the spring burning window from satellite-observed greenness. Sci. Rep. 2017, 1, 14190. [Google Scholar] [CrossRef] [PubMed]
Figure 1.
Maps showing (a) the location of the areas of interest (53.63° N, 110° W, 60.70° N, 115.60° W): Wood Buffalo National Park, which occupies a portion of Alberta (AB) and Northwest Territories (NT), and Lower Athabasca Plains, which borders with the province of Saskatchewan (SK), (b) Human infrastructure cover (30-metre-resolution, Landsat; [34]), (c) Area burned from 1970–2015 (one-kilometer resolution), (d) Land cover (Global Land Cover Characterization Project, one-kilometer resolution, AVHRR; [35]), (e) Elevation, (f) Mean annual temperature, (g) Mean annual precipitation, and (h) Mean climate moisture index (precipitation minus potential evapotranspiration, mm, 1° latitude by 1° longitude resolution; [36]).
Figure 2.
Number of fires and area burned in Wood Buffalo National Park and Lower Athabasca Plains by season (spring, summer, and fall) and cause of ignition (lightning or human). Information based on fires ≥10 ha from 1970–2015.
Figure 2.
Number of fires and area burned in Wood Buffalo National Park and Lower Athabasca Plains by season (spring, summer, and fall) and cause of ignition (lightning or human). Information based on fires ≥10 ha from 1970–2015.

Figure 3.
Time series representing the number of fires (a,b) and area burned (c,d) for the period 1970–2015 in Wood Buffalo National Park (a,c) and Lower Athabasca Plains (b,d). Thin solid lines and shaded background indicate raw time series, dotted lines show the non-linear trend extracted by Singular Spectrum Analysis, and solid straight lines display the significant linear trends obtained by the Mann-Kendall trend test. Different colors indicate the cause of ignition. Theil-Sen’s slopes (β) and trend significance by Mann-Kendall are shown.
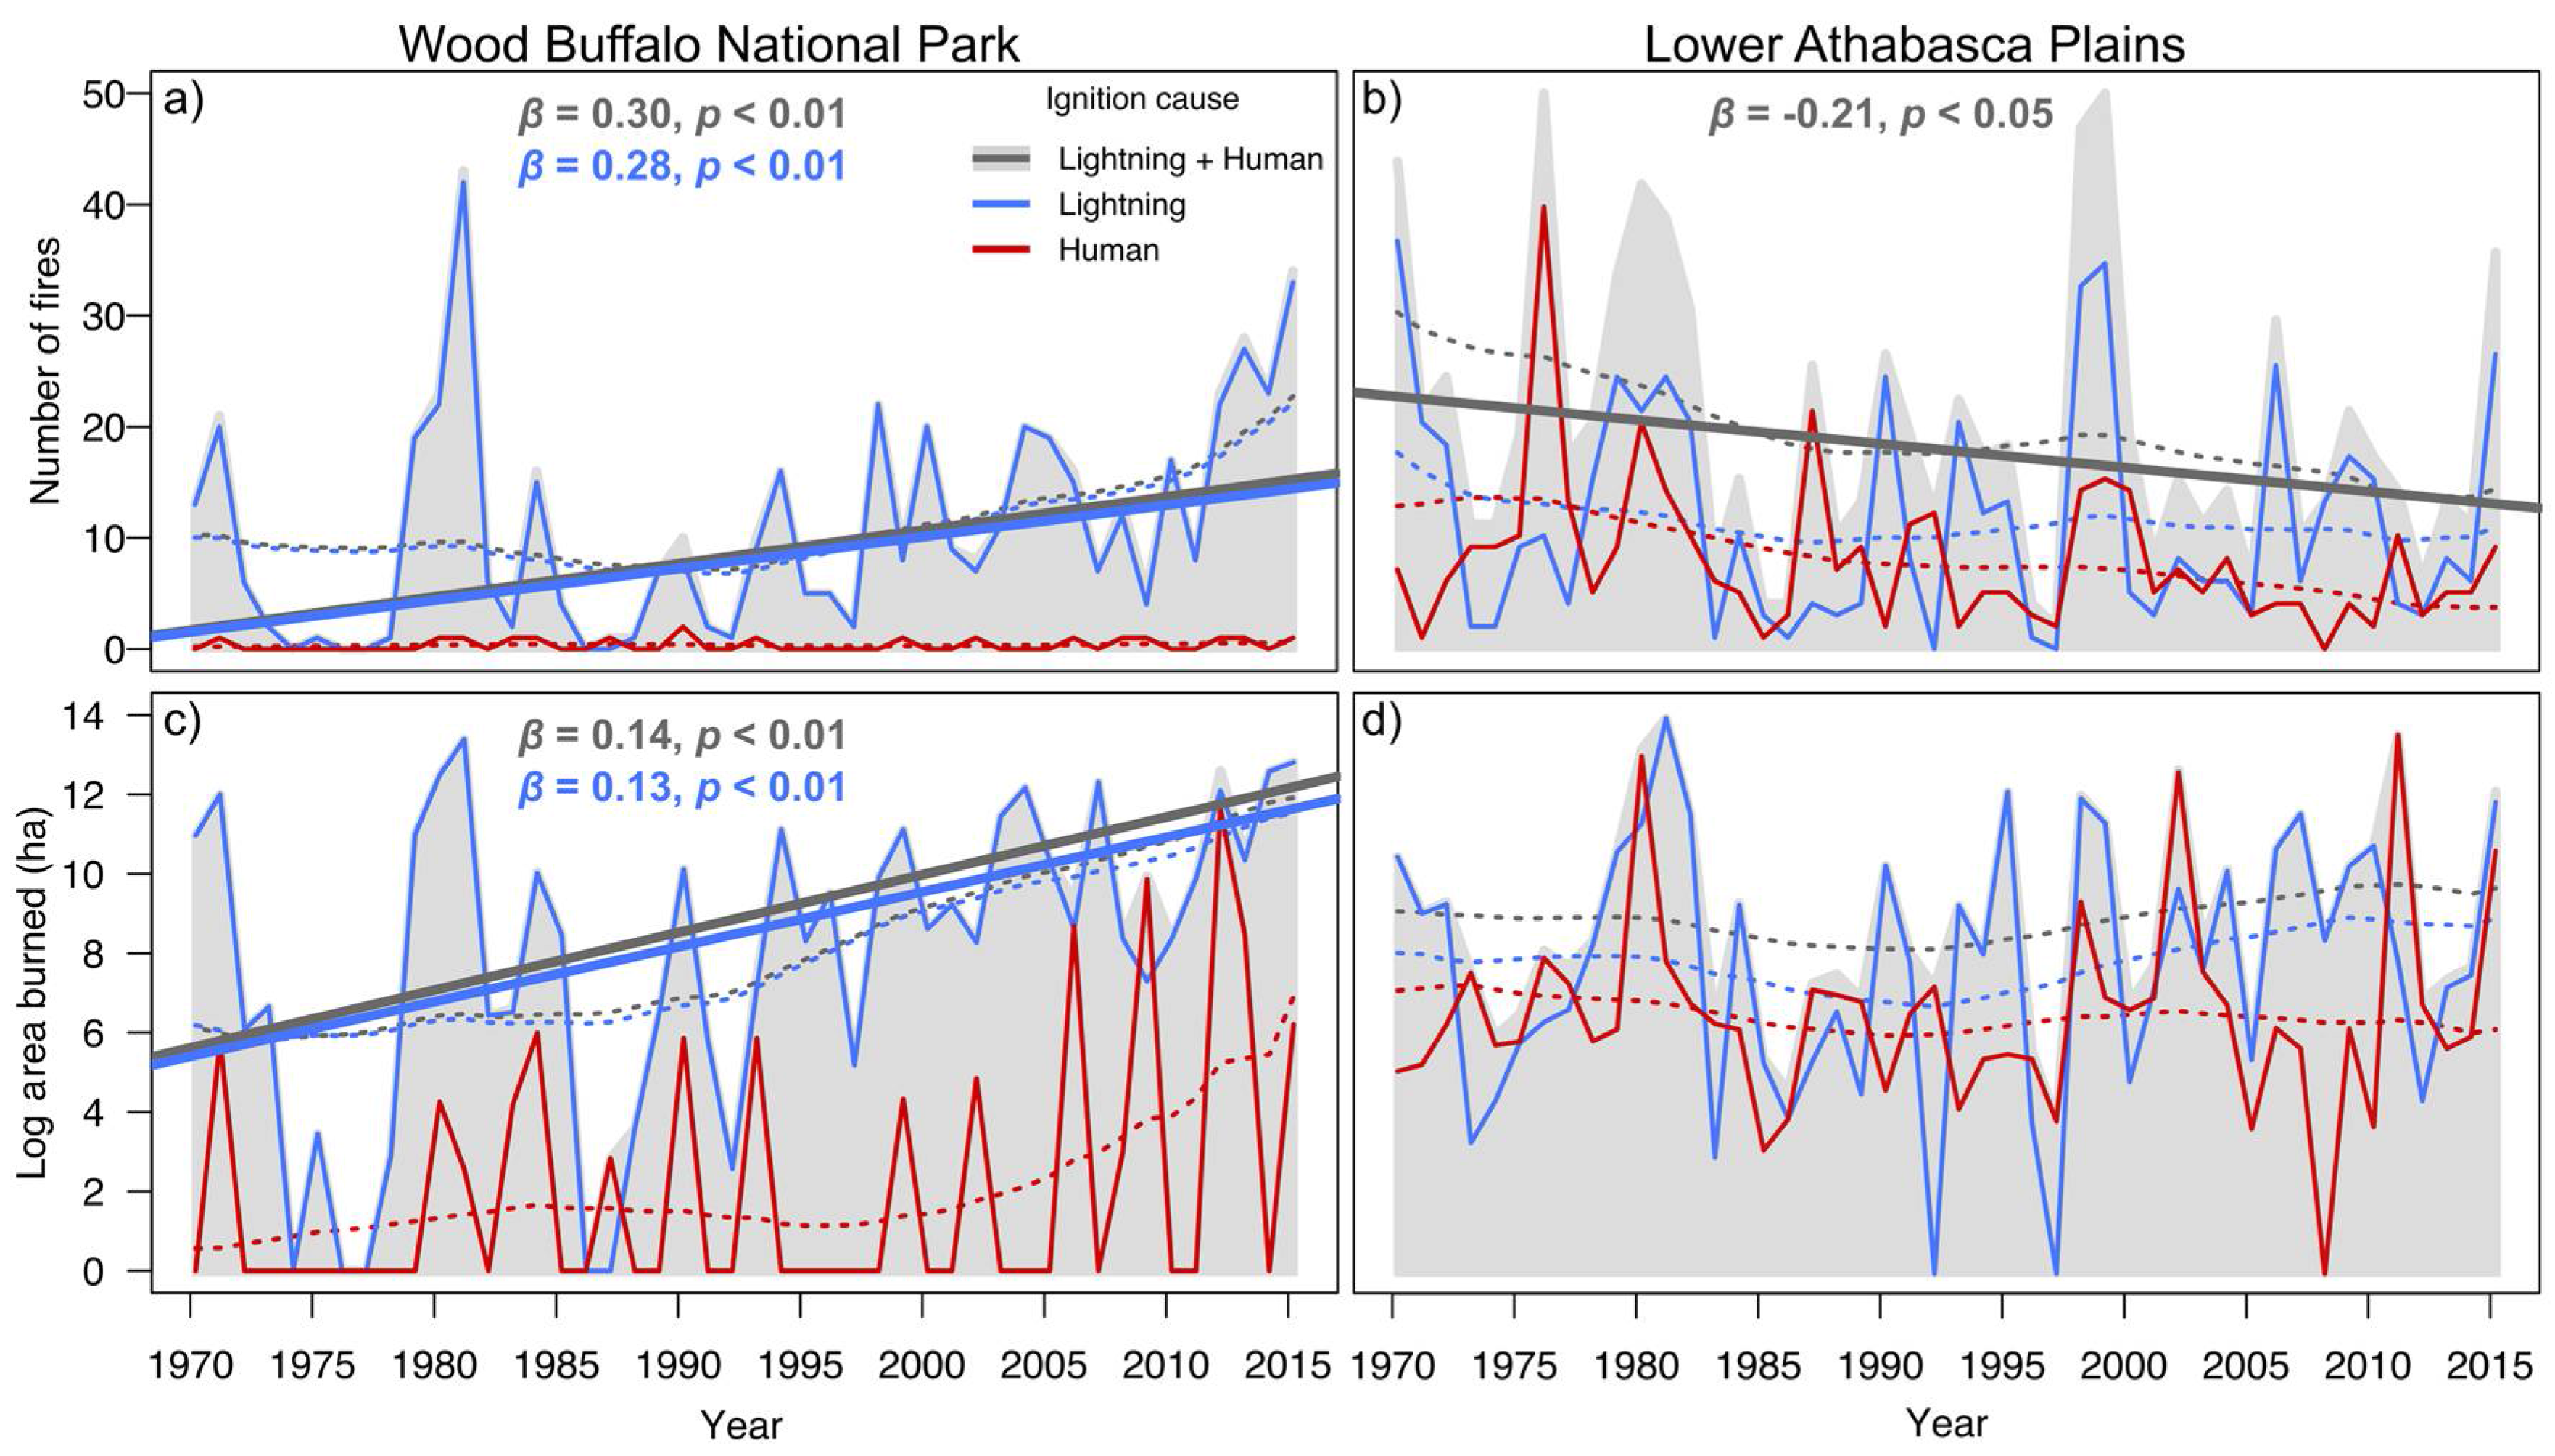
Figure 4.
Periodicities (i.e., duration of oscillations) of the fire activity and fire-climate variables, calculated for the cyclical components found in the time series. Size and color of the points indicate the variance explained by the eigenvectors from which the oscillations were extracted during SSA. Shading corresponds to the “typical” climatic teleconnection domains: Quasi-Biennial Oscillation (2–2.5 years, dark grey), El Niño Southern Oscillation (2.5–8 years, moderate grey), and a quasi-decadal oscillation (9–13 years, light grey).
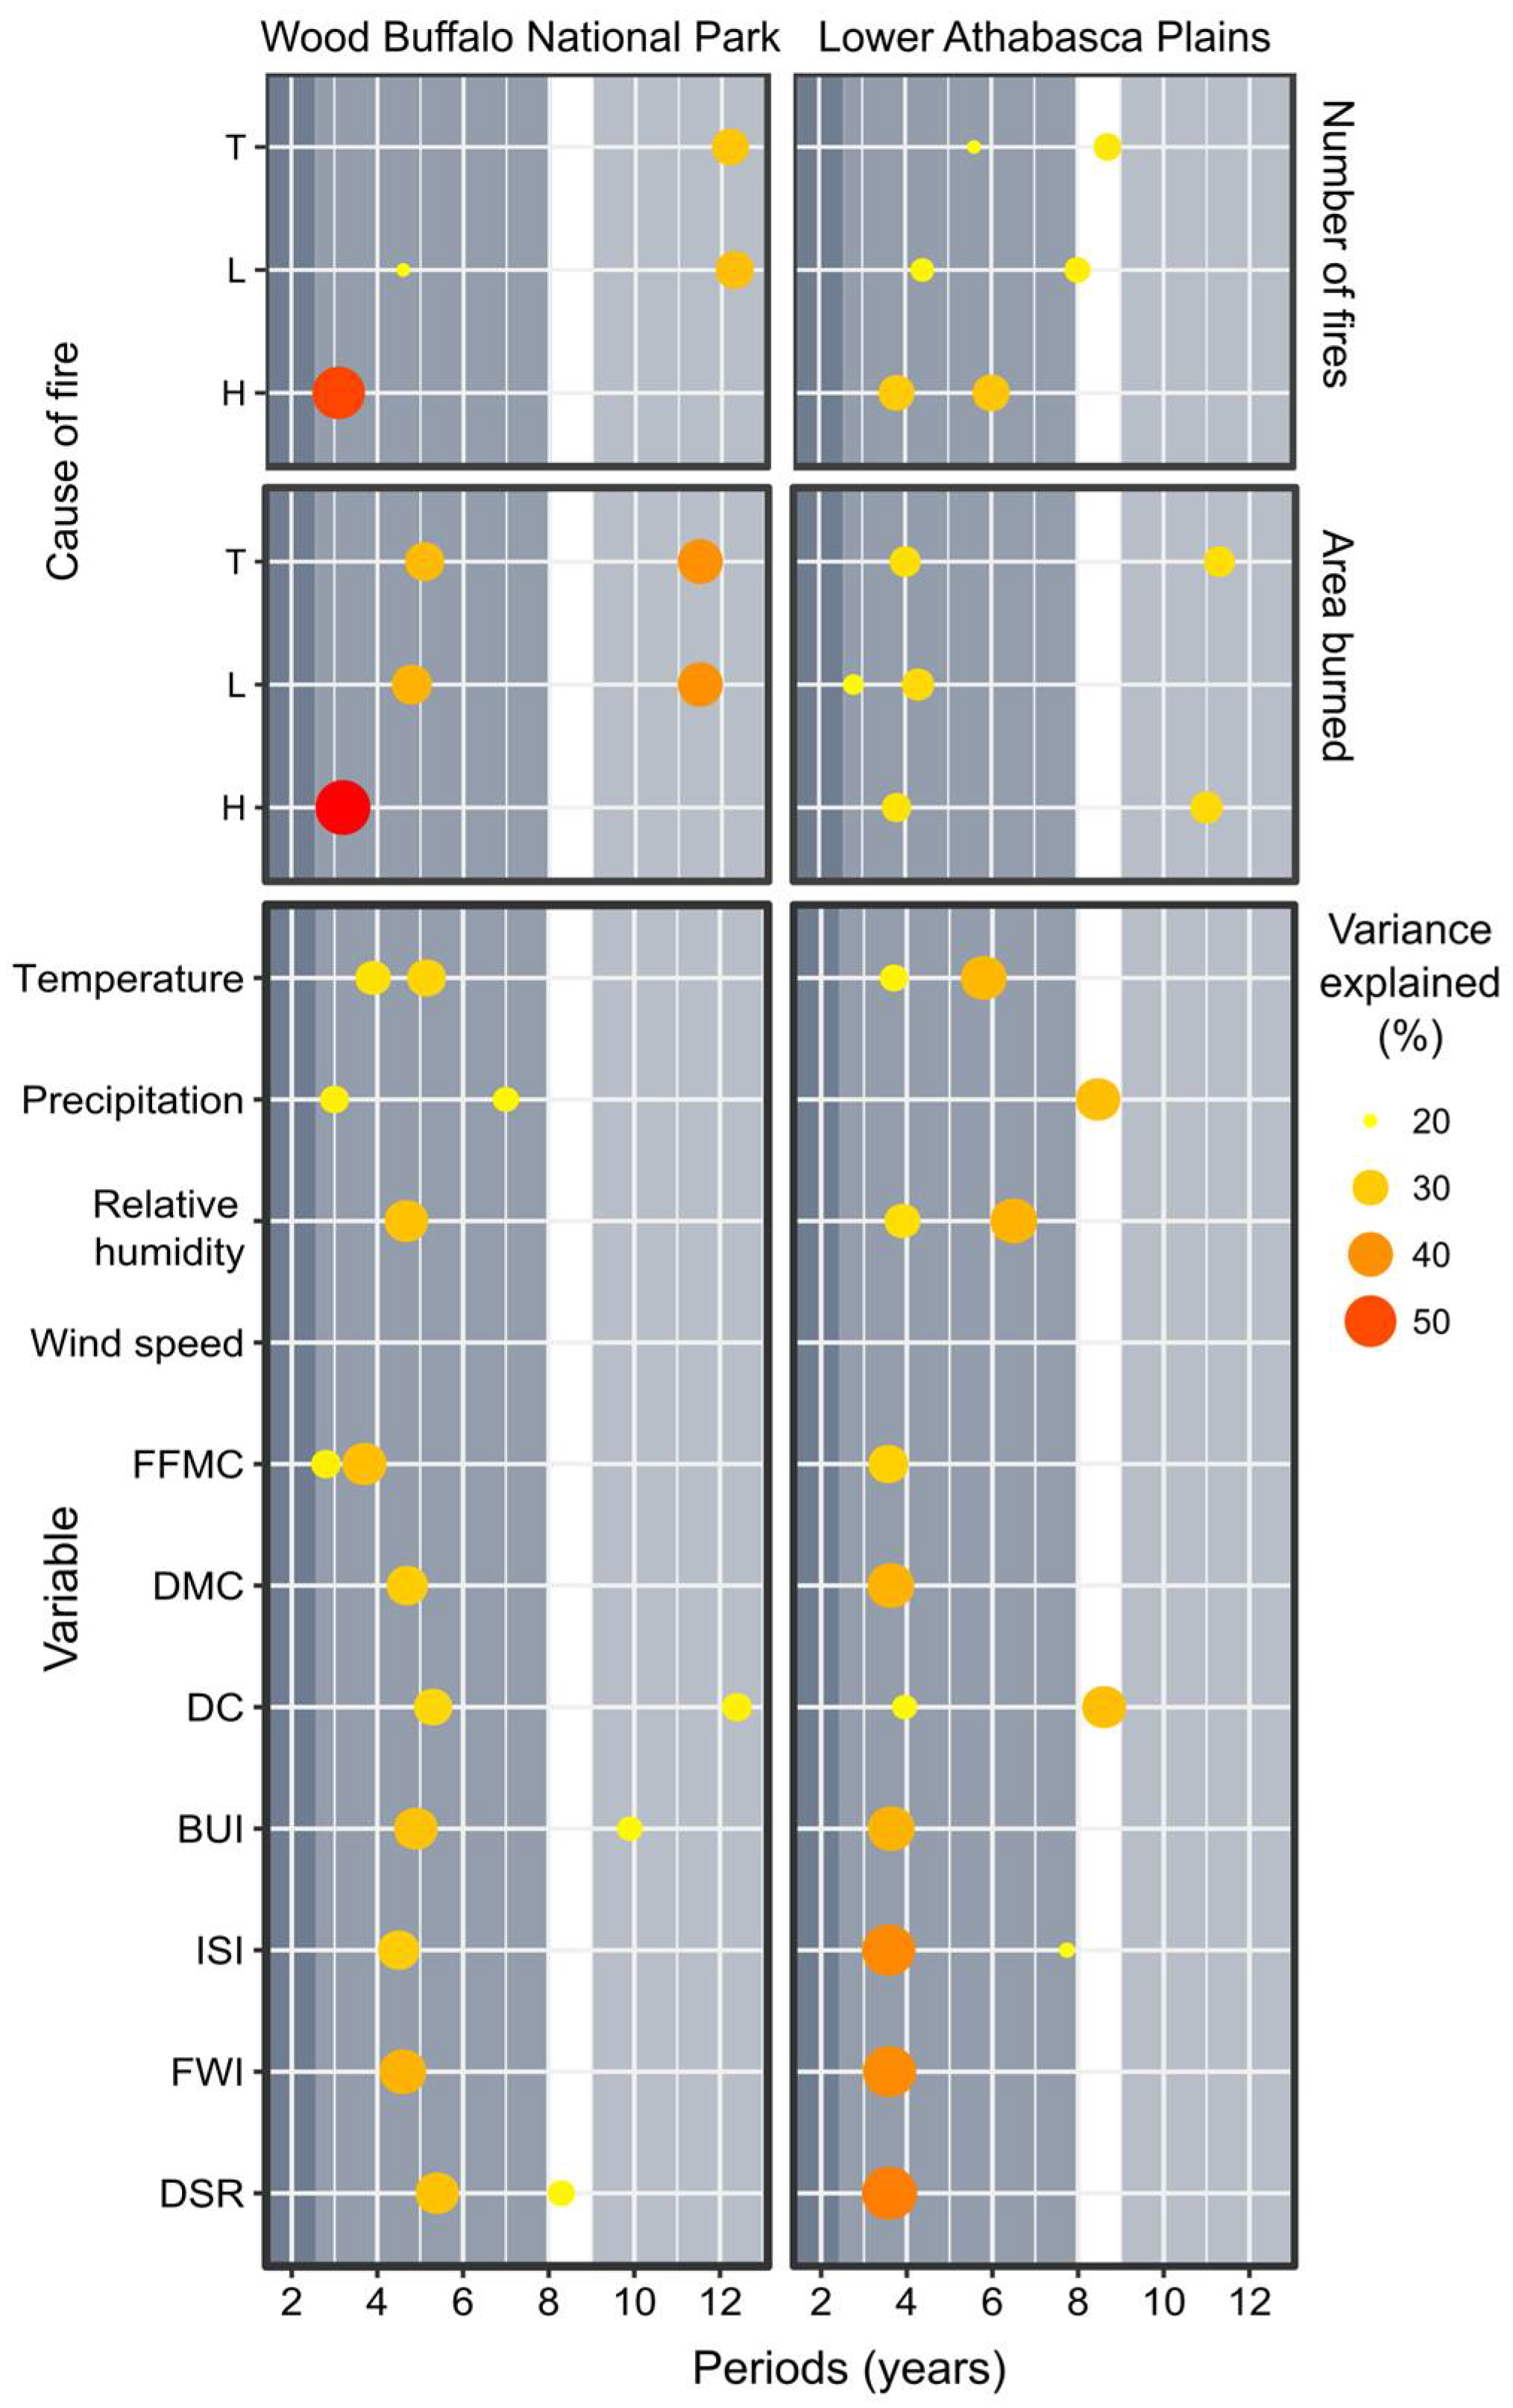
Table 1.
Area occupied or modified by the leading human activities in Wood Buffalo National Park (WBNP) and Lower Athabasca Plains (LAP).
Table 1.
Area occupied or modified by the leading human activities in Wood Buffalo National Park (WBNP) and Lower Athabasca Plains (LAP).
| Region | WBNP Area kha (%) | LAP Area kha (%) | ||
|---|---|---|---|---|
| Total | 4266 | (100) | 7932 | (100) |
| Cultivation | 0 | 134.80 | (3.16) | |
| Harvested (cut blocks) | 0 | 111.33 | (2.61) | |
| Mining | 0 | 32.42 | (0.76) | |
| Seismic lines | 0 | 29.86 | (0.70) | |
| Industrial-rural | 0 | 23.90 | (0.56) | |
| Roads and vegetated margins | 0.85 | (0.02) | 15.36 | (0.36) |
| Urban | 0 | 2.58 | (0.06) | |
| Total human-modified area | 0.85 | (0.02) | 350.25 | (8.21) |
Table 2.
Climate variables and Fire Weather Index System codes and indices used (Modified from Van Wagner [40]).
Table 2.
Climate variables and Fire Weather Index System codes and indices used (Modified from Van Wagner [40]).
| Acronym | Name | Units | Description |
|---|---|---|---|
| TEMP | Temperature | ℃ | A measure of heat present in the air |
| PRECIP | Precipitation | mm | A form of water, such as rain, snow etc. that condenses from the atmosphere and fall to the Earth |
| RH | Relative Humidity | % | Amount of water vapor present in air |
| WINS | Wind Speed | km/h | Velocity of air flow |
| FFMC | Fine Fuel Moisture Code | unitless | Moisture contained in the upper soil layer (litter and fine fuels) |
| DMC | Duff Moisture Code | unitless | Moisture for the loose organic layers of the soil, including medium-sized woody debris |
| DC | Drought Code | unitless | Moisture in deep compacted organic layer and large woody debris |
| ISI | Initial Spread Index | unitless | The expected rate of spread based on FFMC and wind speed |
| BUI | Buildup Index | unitless | Proxy for the fuel load available for combustion. Based on DMC and DC |
| FWI | Fire Weather Index | unitless | Reflects fire intensity and fire danger in forested areas. Based on ISI and BUI |
| DSR | Daily Severity Rating | unitless | Exponential transformation of FWI indicating severe conditions when DSR >2 |
Table 3.
Theil-Sen slope values (β) and significance by a random-phase Mann-Kendall trend test (* ≤0.05, ** ≤0.005) for the fire-climate variables in Wood Buffalo National Park (WBNP) and Lower Athabasca Plains (LAP). Values were calculated from annual time series.
Table 3.
Theil-Sen slope values (β) and significance by a random-phase Mann-Kendall trend test (* ≤0.05, ** ≤0.005) for the fire-climate variables in Wood Buffalo National Park (WBNP) and Lower Athabasca Plains (LAP). Values were calculated from annual time series.
| Acronym | Name | WBNP | LAP |
|---|---|---|---|
| TEMP | Temperature | 0.03 ** | 0.01 |
| PRECIP | Precipitation | <−0.01 * | −0.01 ** |
| RH | Relative Humidity | −0.15 ** | −0.06 ** |
| WINS | Wind Speed | −0.10 ** | −0.03 * |
| FFMC | Fine Fuel Moisture Code | 0.07 * | 0.07 ** |
| DMC | Duff Moisture Code | 0.30 ** | 0.23 ** |
| DC | Drought Code | 2.83 ** | 3.23 ** |
| ISI | Initial Spread Index | 0 | 0 |
| BUI | Buildup Index | 0.44 ** | 0.42 ** |
| FWI | Fire Weather Index | 0.04 | 0.06 ** |
| DSR | Daily Severity Rating | 0.02 | 0.02 * |
Table 4.
Correlation coefficient table for the number of fires (upper-right) and area burned (lower left, shaded) of the fire activity time series in Wood Buffalo National Park (WBNP) and Lower Athabasca Plains (LAP). Significance was calculated by a random-phase test (* ≤0.05, ** ≤0.005). Letters following area name indicate ignition cause: Lightning (L) and human (H).
| Region | WBNP | LAP | |||||
|---|---|---|---|---|---|---|---|
| Cause | L + H | L | H | L + H | L | H | |
| WBNP | L + H | 1 | 0.96 ** | 0.17 * | 0.31 ** | 0.36 ** | 0.08 |
| L | 0.94 ** | 1 | 0.13 | 0.30 ** | 0.35 ** | 0.09 | |
| H | 0.09 | 0.04 | 1 | 0.18 | 0.24 * | −0.07 | |
| LAP | L + H | 0.26 * | 0.25 * | 0.10 | 1 | 0.68 ** | 0.37 ** |
| L | 0.33 ** | 0.32 ** | 0.09 | 0.76 ** | 1 | 0.06 | |
| H | −0.01 | −0.01 | 0 | 0.29 * | 0.09 | 1 |
Table 5.
Kendall-correlation coefficient table for the relationship between the number of fires and area burned with fire-climate time series at lag 0 (i.e., current year) in Wood Buffalo National Park (WBNP) and Lower Athabasca Plains (LAP). Significance was calculated using a random-phase test (* ≤0.05, ** ≤0.005).
| Number of Fires | Area Burned | |||||||||||
|---|---|---|---|---|---|---|---|---|---|---|---|---|
| Region | WBNP | LAP | WBNP | LAP | ||||||||
| Ignition cause | L + H | L | H | L + H | L | H | L + H | L | H | L + H | L | H |
| Temperature | 0.20 * | 0.19 * | 0.17 | 0.20 | 0.12 | 0.23 * | 0.07 | 0.07 | 0.1 | 0.10 | 0.09 | 0.17 * |
| Precipitation | −0.29 * | −0.27 * | −0.02 | −0.22 * | −0.21 * | −0.14 | −0.23 * | −0.25 * | 0.07 | −0.20 * | −0.21 * | −0.14 |
| Relative humidity | −0.24 * | −0.23 * | −0.05 | −0.20 | −0.13 | −0.18 * | −0.21 | −0.22 * | −0.03 | −0.27 * | −0.24 * | -0.22 * |
| Wind speed | −0.14 | −0.15 | −0.05 | −0.18 | −0.07 | −0.2 * | −0.27 | −0.23 | −0.09 | −0.02 | −0.01 | −0.12 |
| FFMC | 0.26 * | 0.24 * | 0.1 | 0.23 * | 0.22 * | 0.15 | 0.20 | 0.20 * | 0.05 | 0.29 * | 0.27 * | 0.19 * |
| DMC | 0.33 * | 0.32 ** | −0.01 | 0.27 * | 0.03 * | 0.21 * | 0.37 ** | 0.40 ** | −0.06 | 0.40 ** | 0.34 ** | 0.30 ** |
| DC | 0.34 | 0.34 ** | 0.04 | 0.23 * | 0.25 * | 0.18 * | 0.36 * | 0.40 ** | −0.02 | 0.24 * | 0.26 ** | 0.27 * |
| BUI | 0.20 * | 0.35 ** | 0 | 0.30 * | 0.26 * | 0.2 * | 0.37 ** | 0.40 ** | −0.03 | 0.40 ** | 0.35 ** | 0.30 * |
| ISI | 0.21 * | 0.20 * | 0.10 | 0.28 * | 0.30 * | 0.1 | 0.23 * | 0.26 * | 0.07 | 0.40 ** | 0.32 ** | 0.21 * |
| FWI | 0.30 * | 0.30 * | 0.06 | 0.31 * | 0.30 * | 0.16 | 0.36 ** | 0.40 ** | 0.01 | 0.44 ** | 0.36 ** | 0.30 ** |
| DSR | 0.28 * | 0.26 * | 0.01 | 0.34 ** | 0.30 ** | 0.20 | 0.37 ** | 0.40 ** | 0.02 | 0.44 ** | 0.35 ** | 0.31 ** |
© 2018 by the authors. Licensee MDPI, Basel, Switzerland. This article is an open access article distributed under the terms and conditions of the Creative Commons Attribution (CC BY) license (http://creativecommons.org/licenses/by/4.0/).
Share and Cite
MDPI and ACS Style
Campos-Ruiz, R.; Parisien, M.-A.; Flannigan, M.D. Temporal Patterns of Wildfire Activity in Areas of Contrasting Human Influence in the Canadian Boreal Forest. Forests 2018, 9, 159. https://doi.org/10.3390/f9040159
AMA Style
Campos-Ruiz R, Parisien M-A, Flannigan MD. Temporal Patterns of Wildfire Activity in Areas of Contrasting Human Influence in the Canadian Boreal Forest. Forests. 2018; 9(4):159. https://doi.org/10.3390/f9040159
Chicago/Turabian StyleCampos-Ruiz, Rodrigo, Marc-André Parisien, and Mike D. Flannigan. 2018. "Temporal Patterns of Wildfire Activity in Areas of Contrasting Human Influence in the Canadian Boreal Forest" Forests 9, no. 4: 159. https://doi.org/10.3390/f9040159
Note that from the first issue of 2016, this journal uses article numbers instead of page numbers. See further details here.