Overstory Structure and Surface Cover Dynamics in the Decade Following the Hayman Fire, Colorado

1
USDA Forest Service, Rocky Mountain Research Station, 240 West Prospect Road, Fort Collins, CO 80526, USA
2
Department of Forest and Rangeland Stewardship, Colorado State University, Fort Collins, CO 80523, USA
*
Author to whom correspondence should be addressed.
Forests 2018, 9(3), 152; https://doi.org/10.3390/f9030152
Submission received: 16 February 2018
/
Revised: 13 March 2018
/
Accepted: 15 March 2018
/
Published: 17 March 2018
(This article belongs to the Special Issue Wildland Fire, Forest Dynamics, and Their Interactions)
Abstract
:The 2002 Hayman Fire burned with mixed-severity across a 400-ha dry conifer study site in Colorado, USA, where overstory tree and surface cover attributes had been recently measured on 20 0.1-ha permanent plots. We remeasured these plots repeatedly during the first post-fire decade to examine how the attributes changed through time and whether changes were influenced by fire severity. We found that most attributes were temporally dynamic and that fire severity shaped their dynamics. For example, low-severity plots experienced a modest reduction in live overstory density due to both immediate and delayed tree mortality, and no change in live overstory basal area through time; in contrast, high-severity plots experienced an immediate and total loss of live overstory density and basal area. Large snag density in low-severity plots did not vary temporally because snag recruitment balanced snag loss; however, in high-severity plots large snag density increased markedly immediately post-fire and then declined by about half by post-fire year ten as snags fell. Mineral soil cover increased modestly immediately post-fire in low-severity plots and substantially immediately post-fire in high-severity plots, but changed little in ensuing years for either severity class. By incorporating pre-fire and repeatedly-measured post-fire data for a range of severities, our study uniquely contributes to the current understanding of wildfire effects in dry conifer forests and should be of interest to managers, researchers, and others.
1. Introduction
Wildfires have long regulated dry conifer forests of the western USA. While wildfire activity for these forests was diminished relative to historical levels for most of the 20th century due to fire suppression, logging, grazing, and other land-use practices [1,2,3], in recent decades it has increased markedly [4,5,6]. The recent increase has likewise been borne out of past land-use practices, which allowed forests to become denser and more homogeneous [1,3,7], as well as out of a changing climate [4,5,6]. The resurgence of wildfires in western dry conifer forests thus makes it important that managers, researchers, and others thoroughly understand how forests are directly affected by fire and how they subsequently develop through time.
For forests, the direct effect of fire on overstory trees and organic surface material is commonly captured by the term “fire severity” [8]. Many of the recent wildfires in dry conifer forests of the west burned with uncharacteristic high-severity crown fires across fair portions of their area, creating patches where all or nearly all trees were killed and where most of the tree crown and surface organic material were consumed [9,10,11,12,13]. Yet even the most severe recent wildfires typically burned with a mix of severities, with low- to moderate-severity patches also comprising much of their area [9,10,11,12,13]. In these patches, where fire severity is generally more in line with historical fire severity [1,2,3], some or even many of the trees survived burning and tree crown and surface organic material were at most only partially consumed.
Overstory structure can change dramatically in the years after wildfire, with fire severity influencing the magnitude and timing of temporal change. Few studies have quantified time- and severity-related overstory dynamics simultaneously, however, with most focusing instead on either the effects of time in high-severity areas or on the effects of severity for one point in time. Low- and moderate-severity areas can experience additional declines in live tree abundance due to delayed mortality, particularly if trees were badly fire-injured [14,15,16]. The abundance of dead trees, or snags, can probably also be temporally variable, depending on the degree and timing of snag recruitment relative to snag fall. High-severity areas, on the other hand, experience complete or nearly complete tree mortality due to fire, so mortality in subsequent years is nominal. The transformation of all or nearly all live trees to snags can dramatically increase snag abundance in the short-term, but snag abundance can decline through time as they fall [17,18,19]. These variations in post-fire overstory structure across space and time can in turn have important implications for tree regeneration [15,20,21] and wildlife use [22,23,24], among other things.
The amount and type of organic material covering the mineral soil surface following wildfire influences hillslope runoff and erosion [25,26,27], fire behavior and severity during a reburn [28,29,30], and a host of other ecological properties and processes. As with post-fire overstory conditions, post-fire surface cover conditions can vary considerably with both time since fire and fire severity, but few holistic examinations of these factors have been conducted. Modest amounts of litter, duff, and wood can accumulate on the ground in low- and moderate-severity areas as scorched needles and dead tree branches and boles fall, augmenting unconsumed pre-fire material [15,31]. If light, water, and nutrient availability were boosted enough in low- and moderate-severity areas to promote understory plant growth, then herbs and shrubs can also modestly increase [31,32]. In contrast, in high-severity areas, the amount of litter and duff can remain minimal in ensuing years due to a lack of foliage in the crowns of overstory snags [15,31,33]. The amount of wood in high-severity areas, meanwhile, can increase substantially as the numerous overstory snags break and fall [15,18,33], and herbs and shrubs can be substantially promoted due to the greatly elevated levels of light, water, and nutrients [31,32,33].
Wildfires were largely excluded from dry conifer forests of the Colorado Front Range for much of the 20th century, but they have become increasingly frequent as of late [34]. The largest recent fire, the 2002 Hayman Fire, burned more than 52,000 ha of forest comprised predominately of ponderosa pine (Pinus ponderosa Lawson & C. Lawson) and Douglas-fir (Pseudotsuga menziesii (Mirb.) Franco) [9]. The Hayman Fire also burned a 400-ha study site where overstory tree, surface cover, and other measurements had been made a few years prior in 20 0.1-ha permanent plots [35,36,37]. While much of the area within the Hayman Fire footprint burned as an uncharacteristically severe crown fire [9,38], our study site and study plots burned more heterogeneously [32,39,40]. We took advantage of this serendipitous opportunity by remeasuring the plots repeatedly in the first post-fire decade [32,39,40]. Here, we report on how a variety of live overstory structure, dead overstory structure, and surface cover attributes changed through time as a result of fire, and whether fire severity influenced these changes. By incorporating pre-fire and repeatedly-measured post-fire data for a gradient of severities, our study contributes a unique perspective to the current understanding of wildfire effects in western dry conifer forests, and should be of interest to the management, scientific, and other communities.
2. Materials and Methods
2.1. Study Site and Study Plots
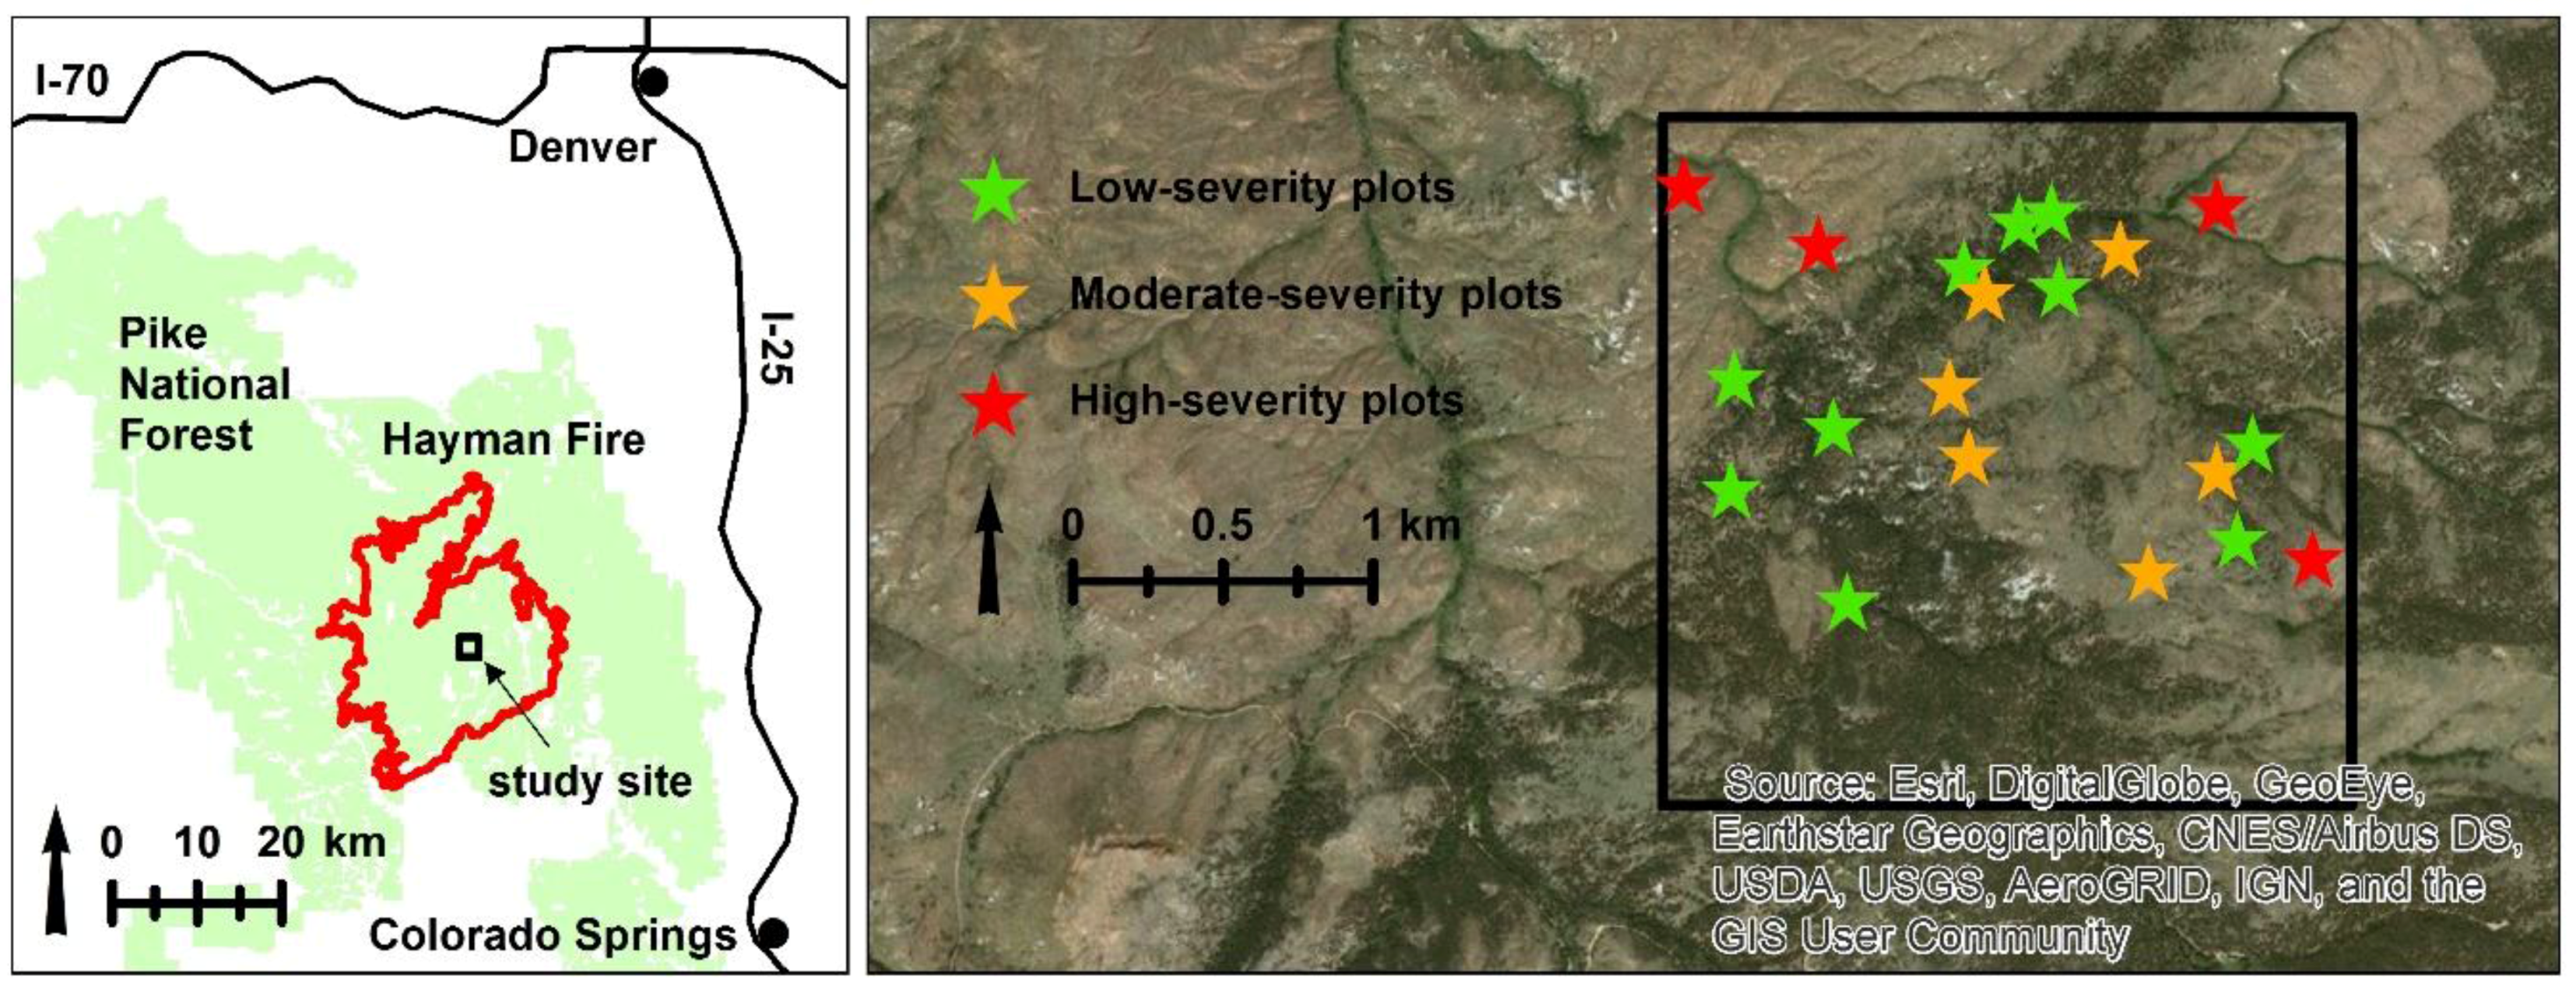
Our 400-ha study site is approximately 60 km southwest of Denver, Colorado, on Pike National Forest lands within the Hayman Fire perimeter (39.14° N, 105.24° W; Figure 1) [35,36,37]. Elevations range from about 2300 to 2500 m. The climate is warm and dry, with average January and July temperatures of about 4 °C and 17 °C, respectively, and average annual precipitation of about 38 cm [41]. The poorly-developed, gravelly soils are derived from Pikes Peak granite [42]. Vegetation at the site is characteristic of Front Range dry conifer forests. Overstories are dominated primarily by ponderosa pine and secondarily by Douglas-fir [35]. Understories are diverse communities of graminoids, forbs, and relatively low-statured shrubs [36,37]. The site’s disturbance history is also characteristic of Front Range dry conifer forests. Prior to Euro-American settlement in the mid to late 1800s, the wildfire regime was one of mixed-severity, with fire intervals for individual stands varying from very short (<10 years) to very long (>100 years), and fire severity varying from low to high [43]. The site experienced very few wildfires beginning in the late 1800s (that is, until the 2002 Hayman Fire), likely due in large part to the fire suppression policy that began in the early 1900s [43]. Logging and grazing are thought to have been rampant at the site from the late 1800s and early 1900s, and also may have contributed to the general lack of wildfires during this period [35,36,37,43]. To our knowledge, logging and grazing have not occurred since this time.
In 1996–1997, 20 randomly-located, upland, 0.1 ha (20 × 50 m) permanent plots were established at the study site (Figure 1) [35,36,37]. The plots subsequently burned in the Hayman Fire. This fire was human-ignited on June 8, 2002 [9]. Low fuel moistures, heavy and continuous fuel loads, and strong winds enabled the fire to burn approximately 24,000 ha on June 9, largely as a high-severity crown fire. The two plots in the northwest corner of our study site are thought to have been impacted by the fire on this day. While historical fires sometimes contained a high-severity component, the size of the high-severity patches created by the Hayman Fire on June 9 appear to be unprecedented over at least the last four centuries [38,43,44]. Less extreme weather conditions arrived on June 10 and persisted for much of the next three weeks, allowing the fire to burn somewhat more heterogeneously. The remaining 18 plots are thought to have burned early during this period. The Hayman Fire was contained on July 2, after having impacted more than 52,000 ha. In 2003, one year post-fire, we successfully reestablished all original plots [32,39,40]. Plot locations were precisely identified using pre-fire data such as plot coordinates and overstory tree stem maps, as well as from finding the remains of plot corner stakes and tree tags.
2.2. Data Collection
Overstory tree data in the 20 plots were first collected in 1996–1997 [35]. At this time, each tree taller than breast height (1.4 m) was tagged with a numbered aluminum tag and its location was mapped with a survey laser. Diameter at breast height (DBH), species, and live or dead status were also recorded for each tree. In 2003, one year post-fire, we relocated all pre-fire overstory trees, retagged them as necessary, and noted their status as either live, dead and standing, dead and downed, or dead and missing [32,39,40]. Dead and downed trees were those that were either uprooted or broken below breast height. Dead and missing trees were those that could not be relocated; these were typically trees that were dead before the fire and that were likely incinerated. Also in 2003, we assessed direct fire effects on trees by visually estimating the percent of the pre-fire live crown volume that was undamaged, scorched, and consumed. Status of all trees was recorded again in 2004, 2005, 2006, 2007, and 2012. DBH was measured again in 2004 and 2012. A small number of trees, mostly quaking aspen (Populus tremuloides Michx.), grew into the overstory of some plots during the course of this study. These trees had high turnover and were not tracked.
Surface cover data in the 20 plots were likewise first collected in 1996–1997, as part of an understory plant community survey [36,37]. Cover was visually estimated to the nearest percent within ten systematically-placed 1-m2 subplots per plot, with separate estimates made for mineral soil, rock, combined litter and duff, wood (including stumps and boles of standing dead trees), and individual live herb and shrub species. Total cover could therefore exceed 100% due to overlap among these elements. Measurements were repeated in 2003, 2004, 2005, 2006, 2007, and 2012 [32,39,40]. In 2003, we also assessed direct fire effects on organic surface material by noting the degree of scorch and consumption for pre-fire litter, duff, and wood in the subplots.
2.3. Data Calculations and Analyses
We used our overstory tree and surface cover data to produce plot-level estimates for ten attributes. Attributes describing live overstory structure were (1) density (stems ha−1) and (2) basal area (m2 ha−1). Because DBH measurements were only taken in 1996–1997, 2004, and 2012, we estimated the DBH of live trees for other study years prior to calculating basal area. For trees that were alive during the entire post-fire period, we accomplished this by determining the tree’s average annual DBH growth from 2004 to 2012 and linearly adjusting 2004 DBH values as necessary. For trees that died between 2004 and 2012, we calculated DBH assuming the average annual DBH growth rate for all trees alive during the entire post-fire period (0.1 cm year−1). Attributes describing dead overstory structure were (3) density (stems ha−1) and (4) persistence (percent standing) of large (>20 cm DBH) snags. We focused on large snags (sensu [45]) because they provide the most valuable wildlife habitat [22,46,47]. For persistence calculations, we only included trees that were alive pre-fire and dead in the first post-fire year, such that time since fire was synonymous with time since death. Persistence was the percent of these trees standing in each year. Surface cover attributes were percent (5) mineral soil; (6) rock; (7) litter and duff; (8) wood; (9) herb; and (10) shrub cover. The first four attributes were calculated by averaging cover across the ten subplots per plot. The latter two attributes were calculated by summing the cover of all relevant species in each subplot and then averaging across subplots.
We classified each plot as burning with low-, moderate-, or high-severity by utilizing our direct fire effects data [32,39,40]. We categorized plots where <50% of the overstory trees were killed and where tree crown and organic surface material consumption were generally slight as burning with low-severity (i.e., burned by light surface fire; ten plots). Moderate-severity plots experienced >50% overstory mortality and had modest tree crown and organic surface material consumption (i.e., burned by moderate to severe surface fire; six plots). High-severity plots experienced 100% overstory mortality and complete or nearly complete tree crown and organic surface material consumption (i.e., burned by severe crown fire; four plots).
We used generalized linear mixed models in SAS 9.4 (SAS Institute Inc., Cary, NC, USA) to examine how the ten attributes changed through time, and how temporal changes were influenced by fire severity. We modeled each against fire severity, time since fire, and fire severity × time since fire. Fire severity had three levels (low, moderate, and high) and time since fire had seven levels (pre-fire and one, two, three, four, five, and ten years post-fire). The appropriate distribution and link function for the attributes were defined in the models (e.g., a negative binomial distribution with a logarithmic link function for live overstory density and large snag density, and a beta distribution with a logit link function for all surface cover attributes). Models accounted for the repeated measurement of plots through time using the spatial power covariance structure. This structure was the one best able to account for the higher degree of correlation between measurements closer in time than between measurements further apart in time and for the unevenly-spaced time intervals between measurements. For models where severity or time was significant, we examined pairwise differences between levels using least squares means and Tukey-Kramer p-value adjustments for multiple comparisons. For models where severity × time was significant, we also examined pairwise differences using least squares means and Tukey-Kramer adjustments, but we “sliced” the interaction term to limit comparisons to those of levels of time within levels of severity and to those of levels of severity within levels of time. Significance was assessed at α = 0.050. We note that a similar analysis of shrub cover was conducted by Abella and Fornwalt [32], but it differs from ours in that they also incorporated data from unburned plots and they employed a slightly different model structure.
3. Results
3.1. Live Overstory Structure
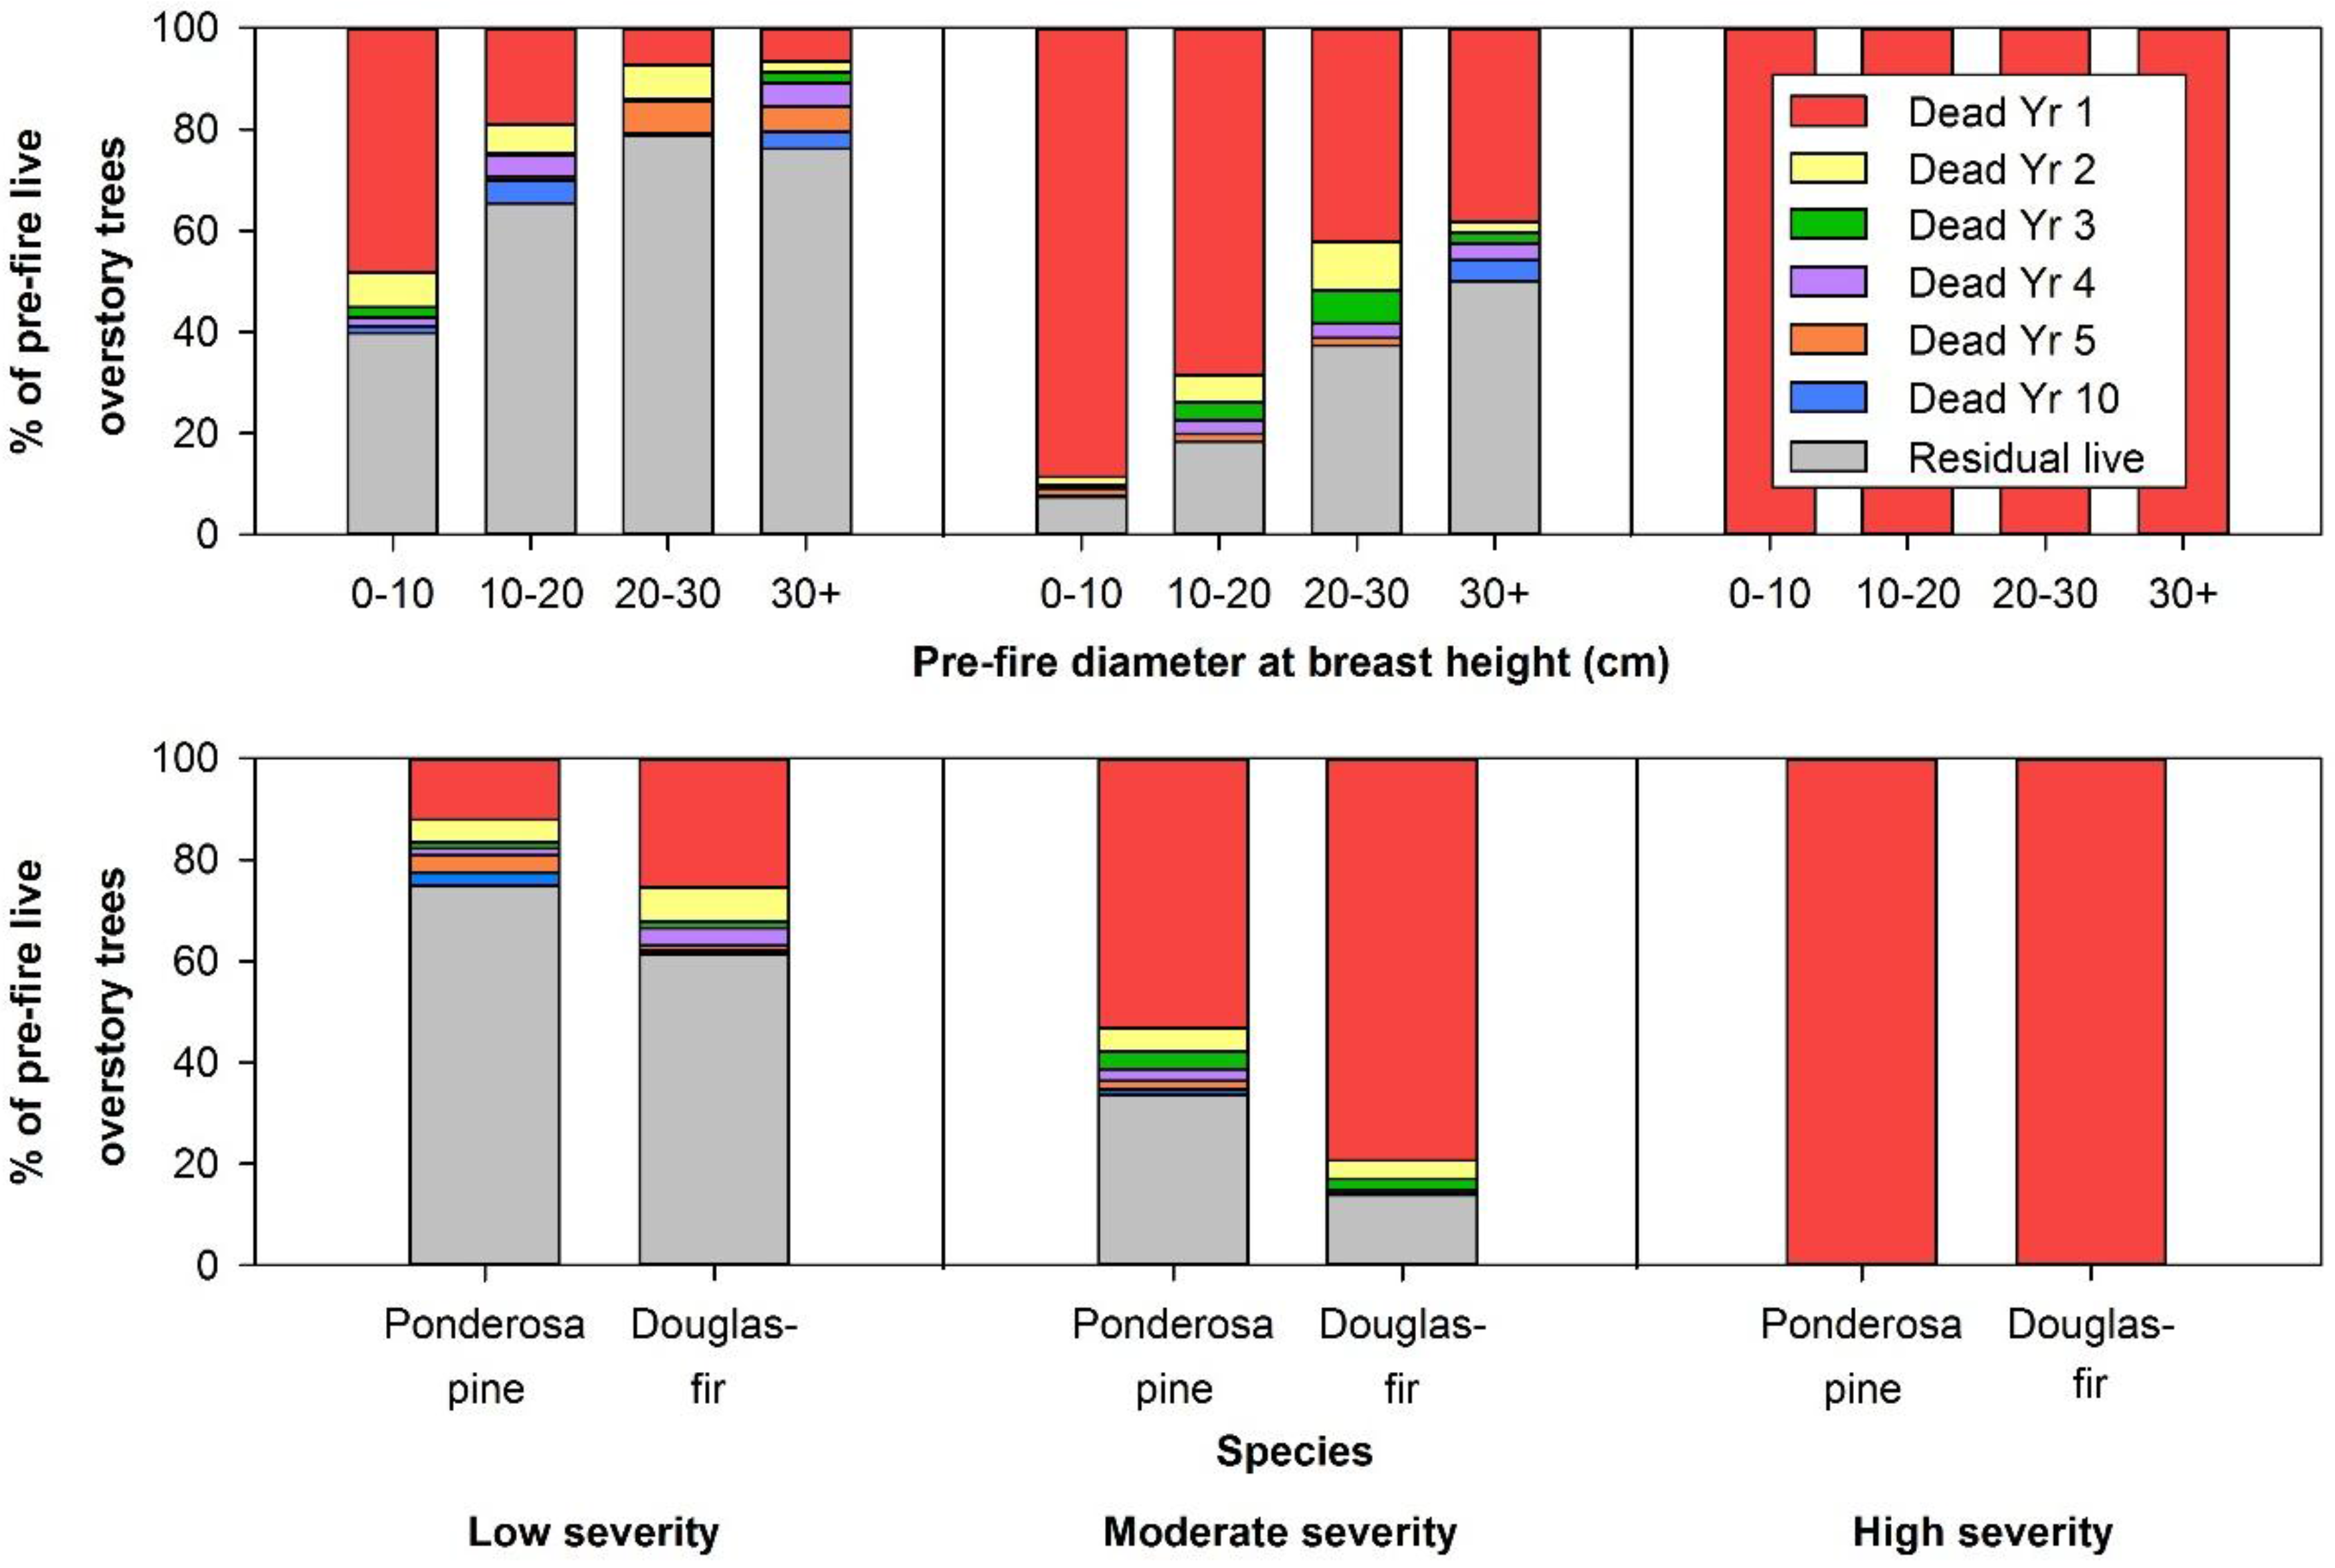
Live overstory density varied with fire severity, time since fire, and fire severity × time since fire, indicating that the severity classes experienced different temporal density patterns (Figure 2). Before the Hayman Fire, live overstory density averaged 572 stems ha−1 across all 20 plots, with no differences among fire severity classes. Trees were generally more abundant in the smaller than the larger size classes pre-fire, with 34% of trees in the 0–10 cm DBH class, 25% in the 10–20 cm DBH class, 24% in the 20–30 cm DBH class, and 17% in the 30+ cm DBH class. Ponderosa pine constituted 61% of pre-fire trees and Douglas-fir constituted 36%. Live overstory density in low-severity plots decreased 21% in post-fire year one, to an average of 371 stems ha−1. In post-fire year two, density in low-severity plots decreased an additional 5% due to delayed tree mortality. Density continued to decrease non-significantly thereafter, such that by post-fire year ten, it had been reduced by a total of 34%, to an average of 308 stems ha−1. Trees with the smallest DBHs experienced the greatest overall mortality, with 60% of 0–10 cm DBH trees killed, 35% of 10–20 cm DBH trees killed, 21% of 20–30 DBH trees killed, and 24% of 30+ cm DBH trees killed (Figure 3). Moreover, Douglas-fir experienced greater overall mortality than ponderosa pine, with 39% of the former and 25% of the latter killed. Meanwhile, the post-fire year one decrease in live overstory density was more substantial in moderate-severity plots; in these plots, density dropped 68%, to an average of 260 stems ha−1. Density decreased an additional 5% in post-fire year two and 2% in post-fire year three. By the time a decade had passed since the Hayman Fire, mean live overstory density in moderate-severity plots averaged 177 stems ha−1, 79% lower than pre-fire. Overall, 93% of trees in the 0–10 cm DBH class were dead, while 82% of trees in the 10–20 cm DBH class, 63% of trees in the 20–30 cm DBH class, and 50% of the trees in the 30+ cm DBH class were dead. Overall mortality was 86% for Douglas-fir and 66% for ponderosa pine. In high-severity plots, all pre-fire live trees were dead in the first post-fire year.
Live overstory basal area also varied with fire severity, time since fire, and their interaction (Figure 2). Live overstory basal area prior to the fire did not differ among severity classes, averaging 17 m2 ha−1 across all plots. Basal area was reduced by fire in moderate- and high-severity plots but not in low-severity plots. In moderate-severity plots, basal area declined 41% immediately following fire, to an average of 11 m2 ha−1 in post-fire year one. An additional small decline was also observed in the third post-fire year due to delayed tree mortality. By the end of the study, basal area in moderate-severity plots averaged 9 m2 ha−1, 53% lower than pre-fire basal area. In high-severity plots, basal area declined to 0 m2 ha−1 in post-fire year one, where it remained.
3.2. Dead Overstory Structure
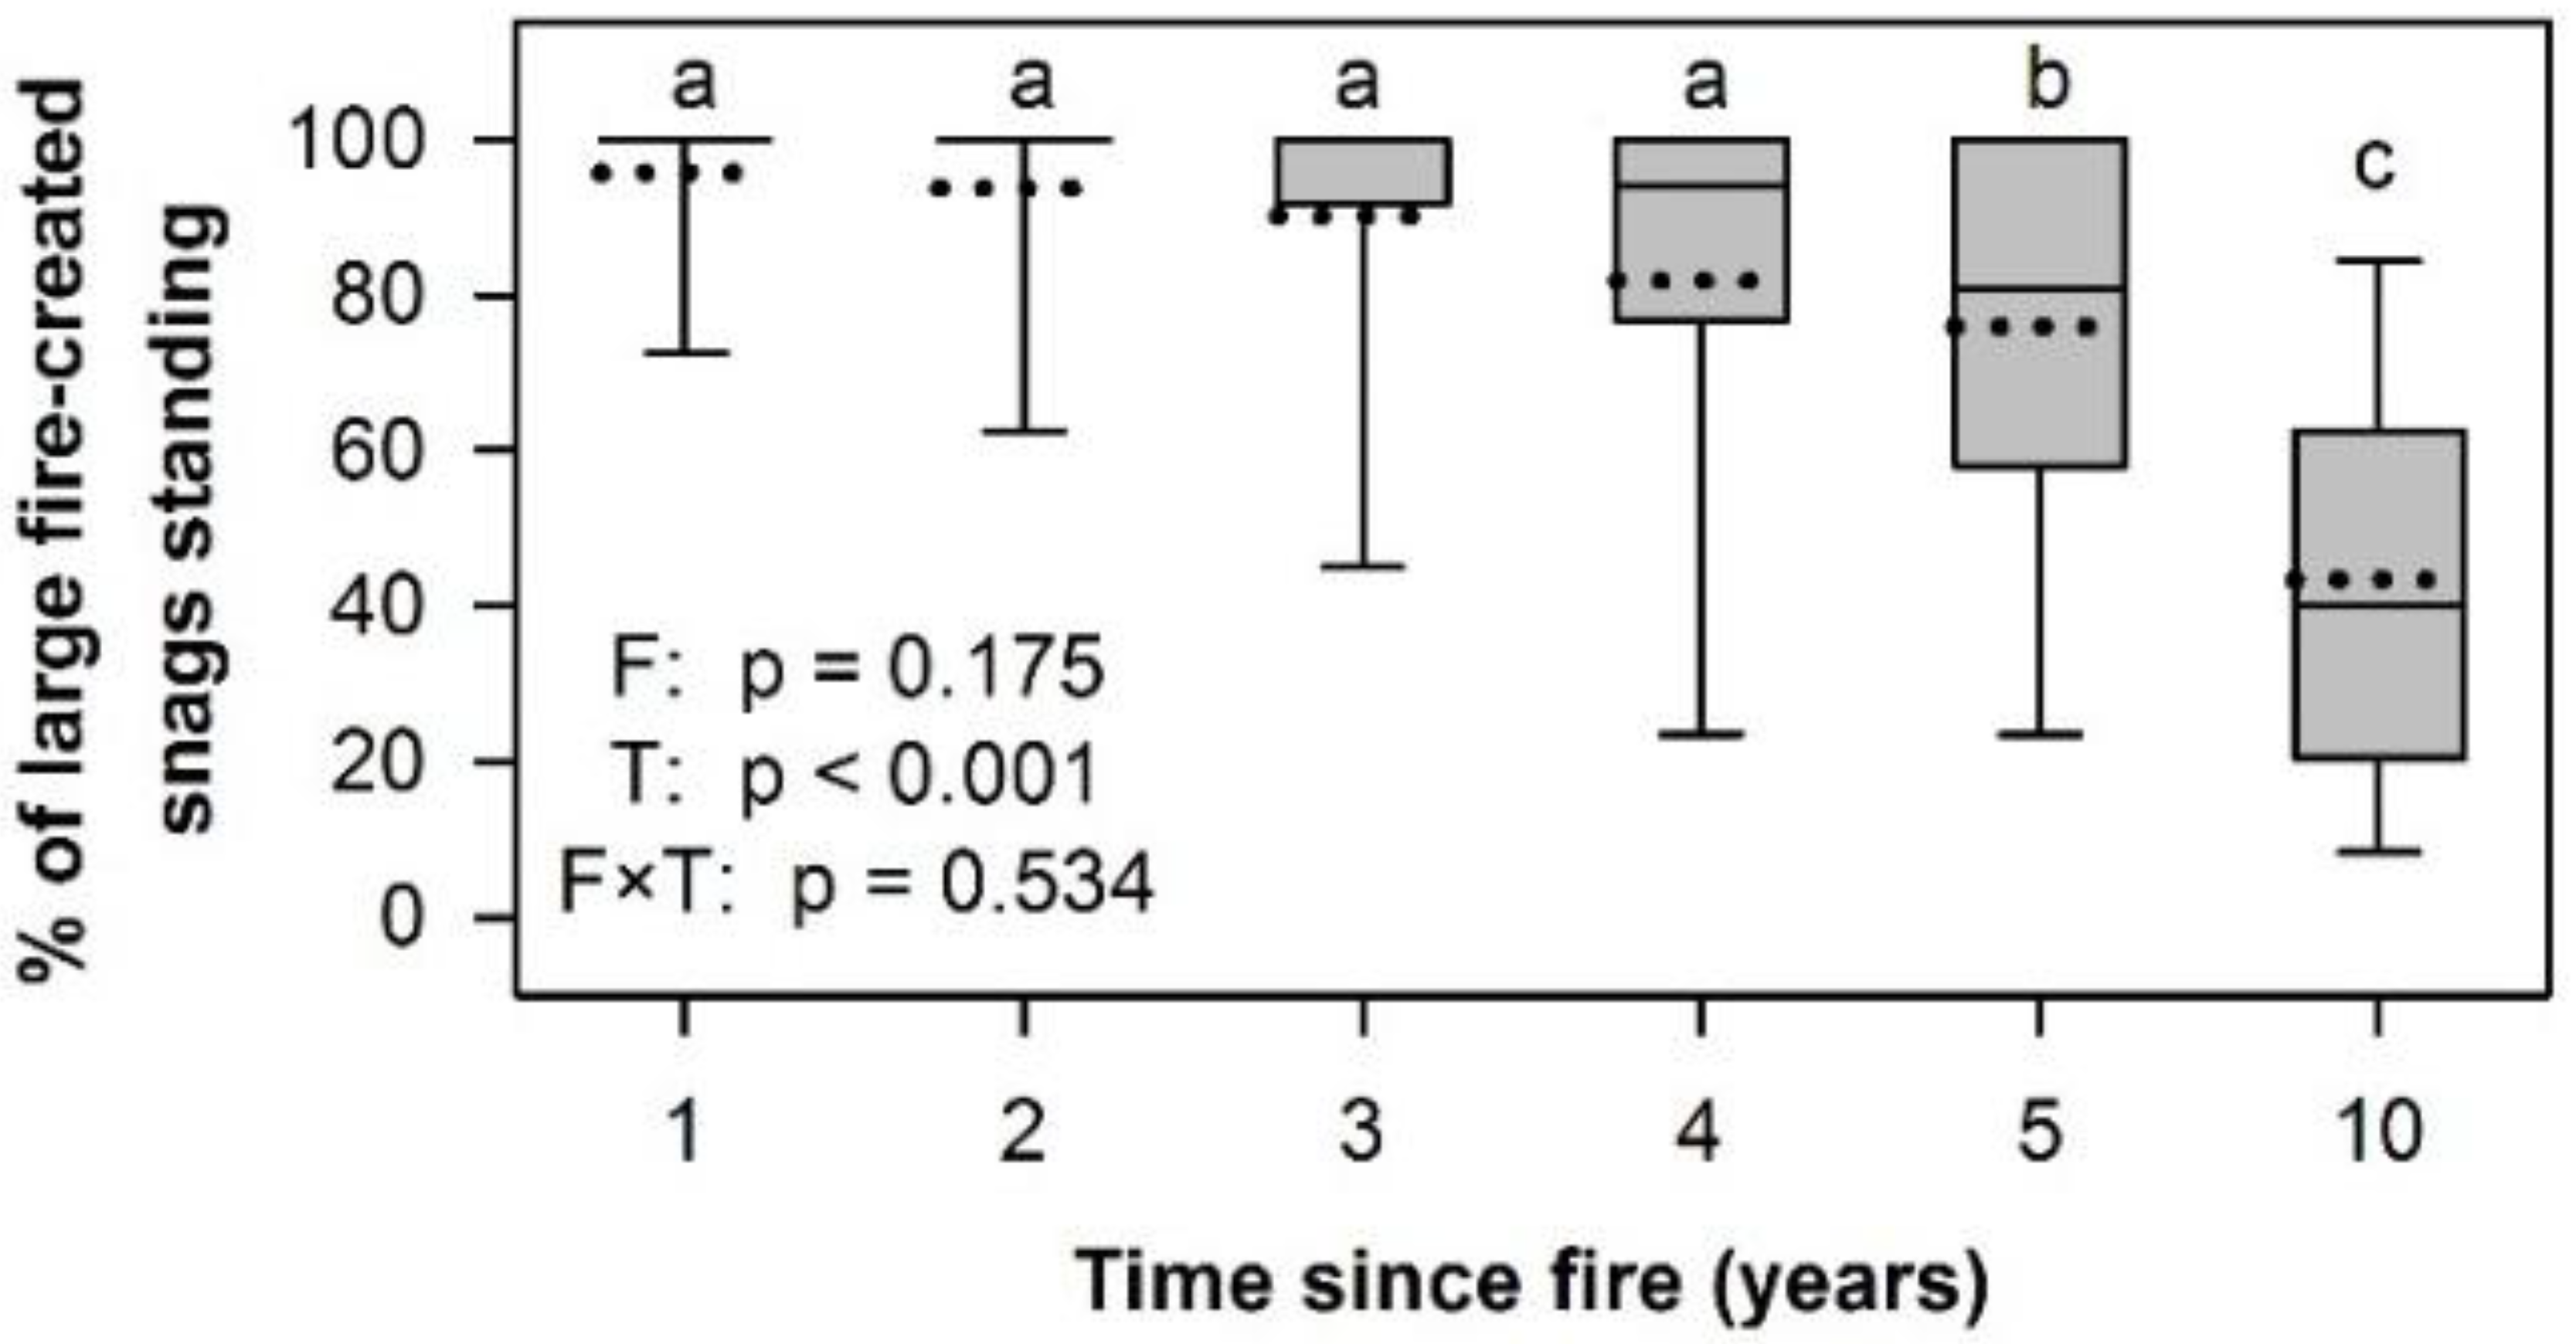
Time since fire was a strong predictor of whether large snags created by the Hayman Fire (i.e., trees that were alive before the fire and dead in post-fire year one) were standing (Figure 4). On average, >90% of the large fire-created snags remained standing through post-fire year three. By post-fire year five, an average of 76% of the large fire-created snags were standing; by post-fire year ten, 43% were standing. Moreover, ten years post-fire, an average of 67% of the large fire-created Douglas-fir snags remained standing, in contrast to 15% of the ponderosa pine snags.
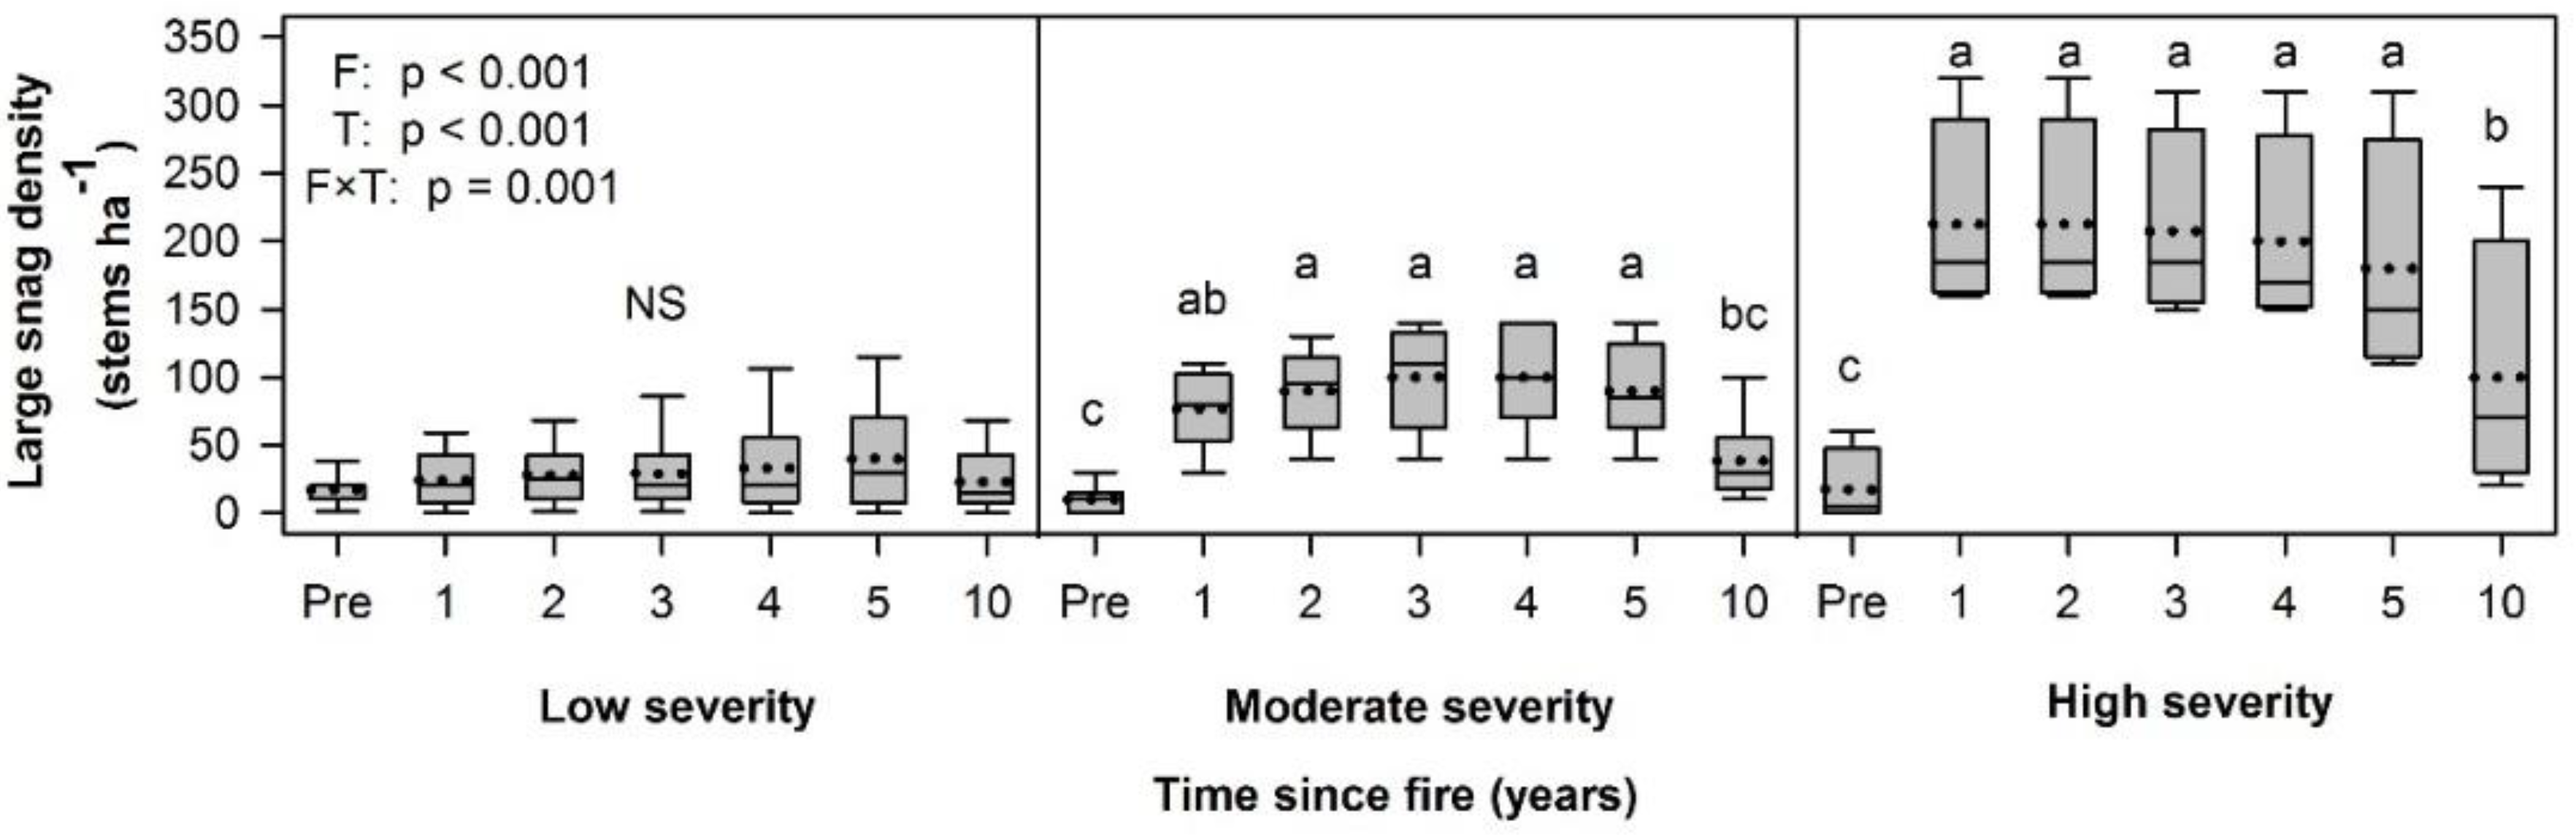
Time since fire was also a strong predictor of large snag density, as were fire severity and severity × time (Figure 5). Prior to the fire, large snag density averaged 15 stems ha−1, with no differences among the severity classes. Following the fire, snag density did not deviate from pre-fire levels in low-severity plots. In contrast, moderate- and high-severity plots saw a sustained post-fire increase in snag density over pre-fire levels for the first five years; the magnitude of this increase was 9-fold in moderate-severity plots and 11-fold in high-severity plots. By post-fire year ten, snag density in moderate-severity plots had returned to pre-fire levels. Snag density also declined by post-fire year ten in high-severity plots but was still 6-fold greater than pre-fire.
3.3. Surface Cover
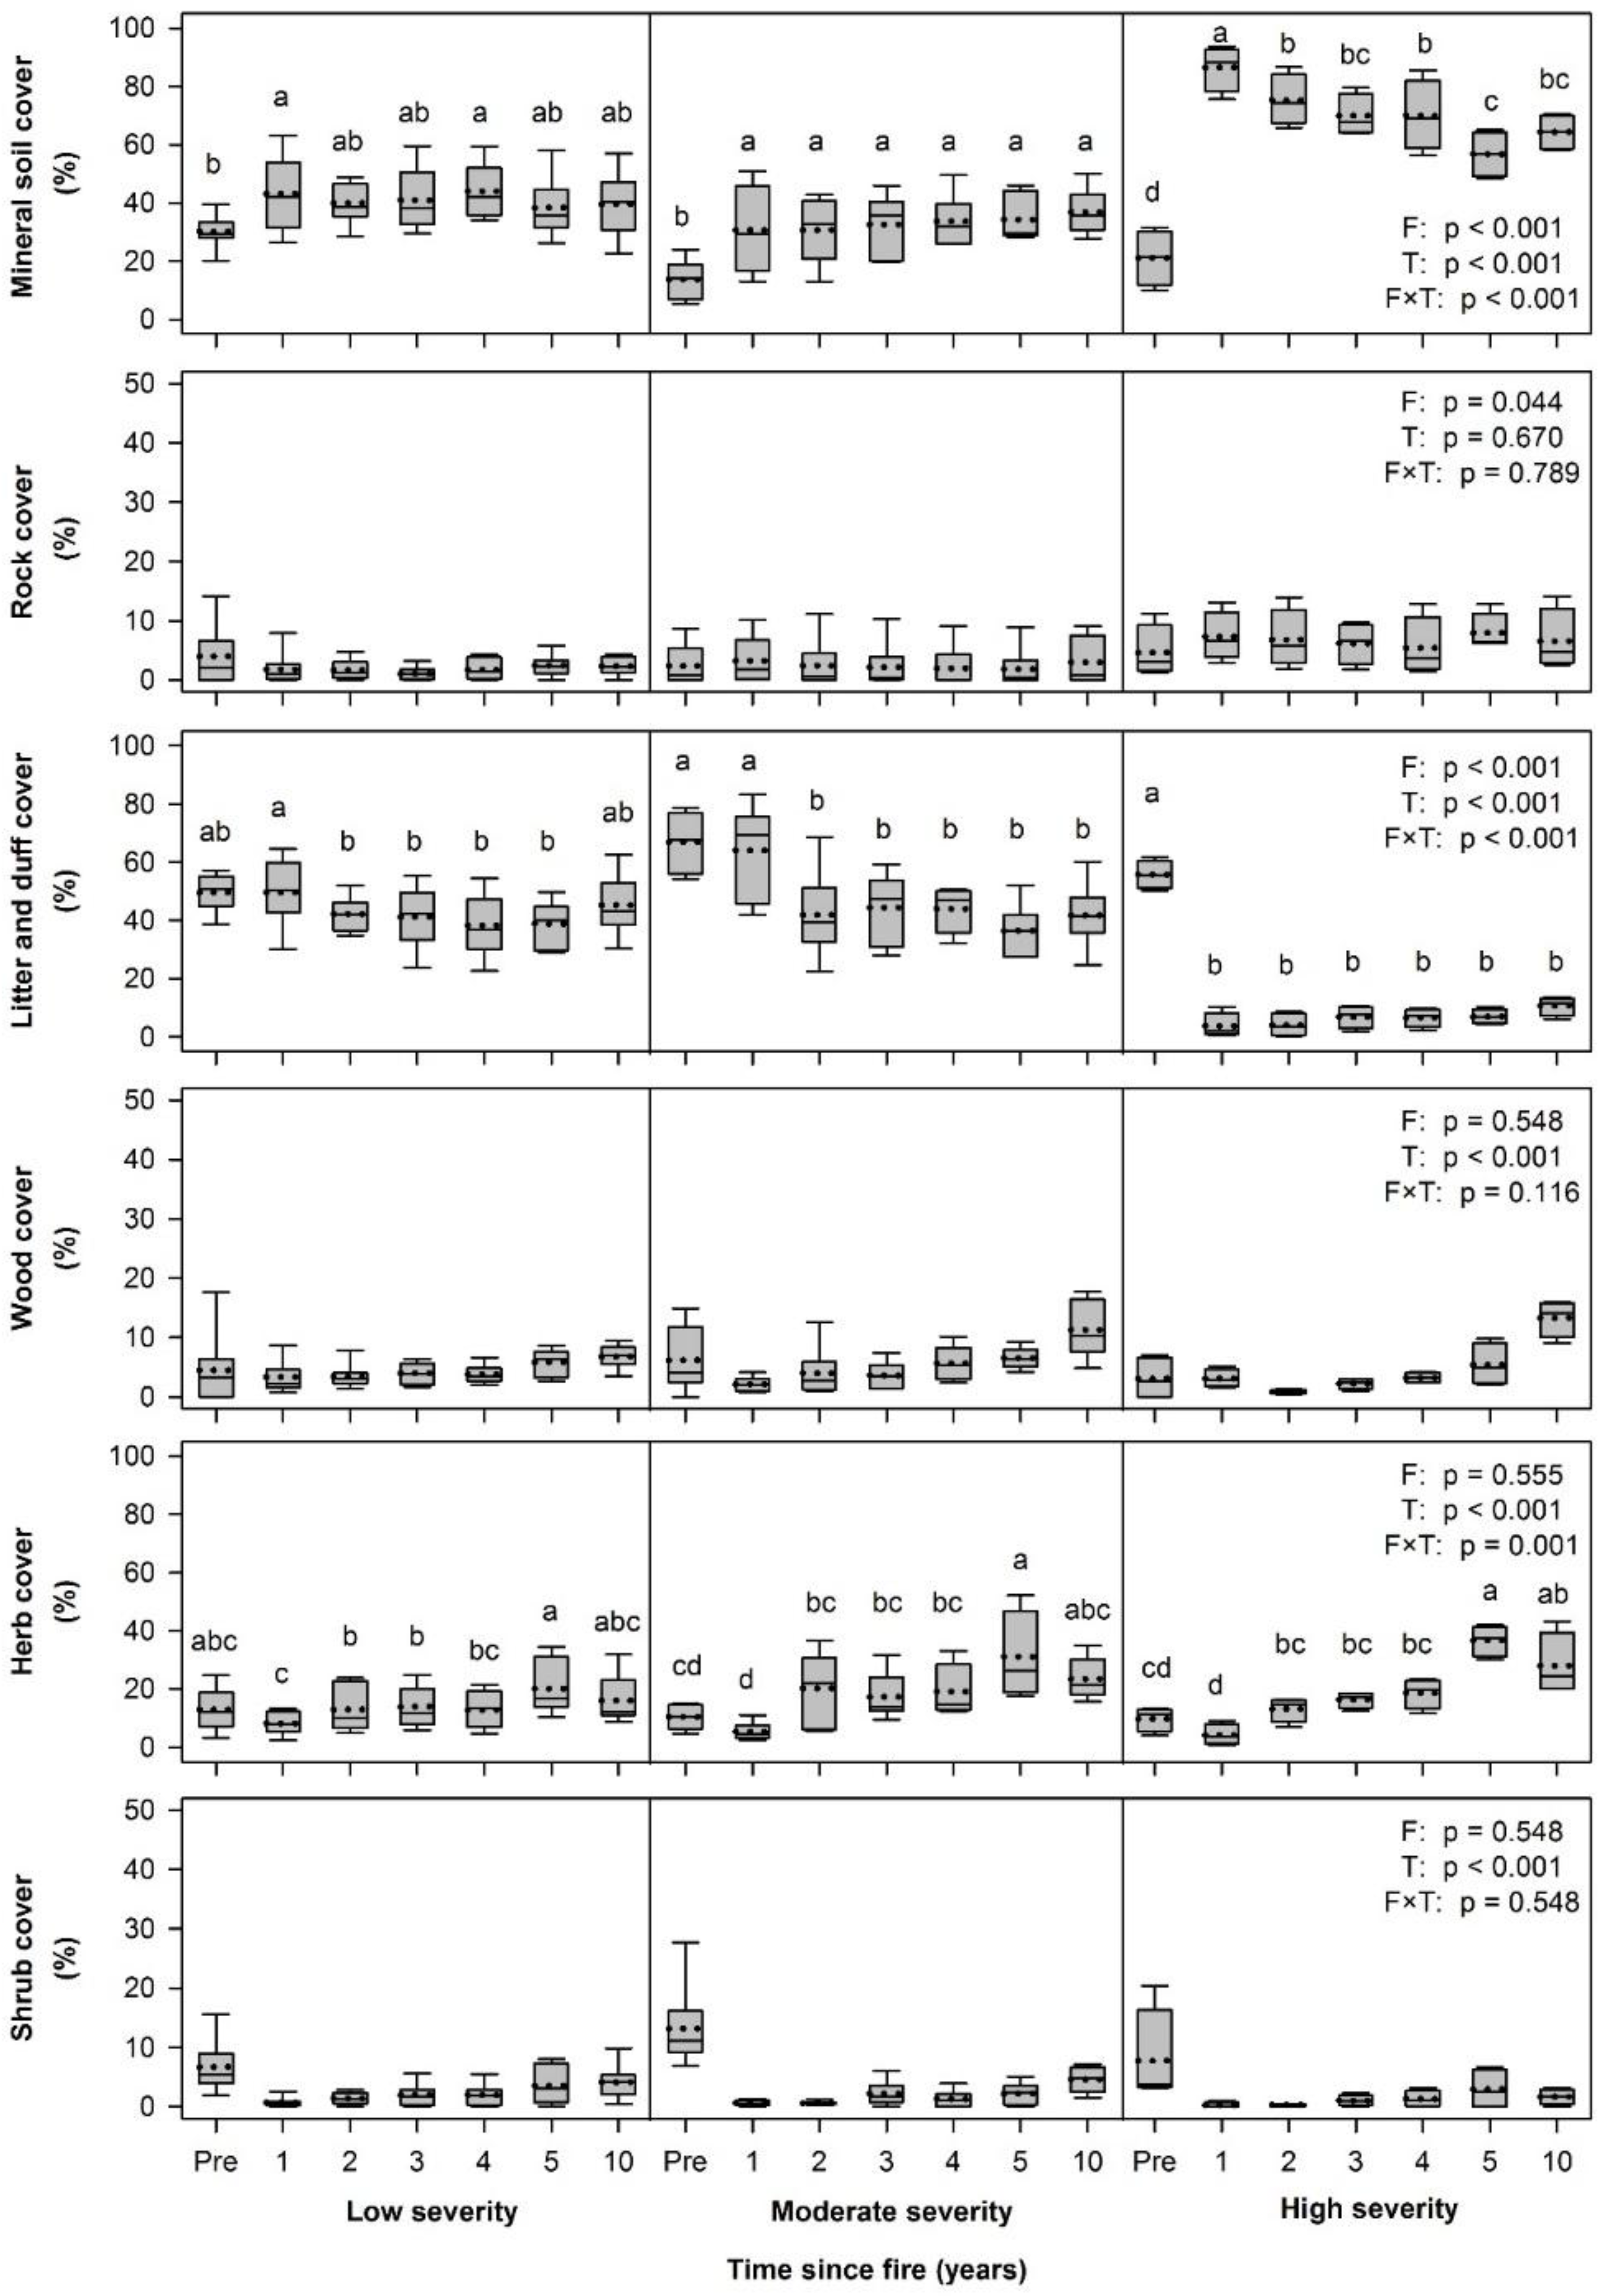
The Hayman Fire caused an increase in mineral soil cover, but the magnitude of the increase was severity-dependent, and to a lesser extent, time-dependent (Figure 6). Relative to pre-fire conditions, mineral soil cover increased 43% in low-severity plots in post-fire year one, while it increased 125% in moderate-severity plots. Mineral soil cover in high-severity plots increased >300% in post-fire year one, with mineral soil exposed across 86% of the ground surface on average. Mineral soil cover in low- and moderate-severity plots did not change in ensuing years relative to post-fire year one conditions but declined somewhat in high-severity plots.
The combined cover of litter and duff was likewise shaped by the interaction of fire severity and time since fire (Figure 6). For all severity classes, litter and duff covered 50% or more of the ground surface prior to the fire. Litter and duff cover were relatively unaffected by low-severity burning for the entire post-fire decade. Moderate-severity burning caused a sustained decrease in litter and duff cover that ranged from 34–45% through time, although interestingly this decrease did not manifest until the second post-fire year. High-severity burning caused an immediate and sustained decrease in litter and duff cover that ranged from 67–78% through time.
Wood cover was temporally dynamic, but these dynamics were not dependent on fire severity (Figure 6). Burning did not have an immediate effect on wood cover; average pre-fire wood cover was 5%, on par with the average post-fire year one cover of 3%. Wood cover gradually increased during the post-fire observation period but did not exceed pre-fire levels until the tenth post-fire year, when it averaged nearly 10%.
Finally, herb cover varied with fire severity, time since fire, and their interaction, while shrub cover varied solely with time (Figure 6). In low-severity plots, pre-fire herb cover was comparable to post-fire herb cover for all post-fire years, although some differences among post-fire years were evident. Across all years, herb cover averaged 14% in low-severity plots. In moderate- and high-severity plots, pre-fire herb cover was comparable to post-fire herb cover for the first four post-fire years, averaging 14% in the former and 12% in the latter across these years. Herb cover in moderate-severity plots increased over pre-fire levels in post-fire year five (to an average of 31%), while in high-severity plots it increased over pre-fire levels in post-fire years five (to an average of 37%) and ten (to an average of 28%). As Abella and Fornwalt [32] similarly show, shrub cover was reduced 93% immediately following burning, from an average of 9% pre-fire to 1% in post-fire year one. Shrub cover gradually increased in later years but always remained below pre-fire levels, peaking at 4% ten years post-fire.
4. Discussion
Dry conifer forests of the western USA have experienced a recent increase in wildfire activity [4,5,6], making it important that the direct and longer-term consequences of wildfires be thoroughly understood. Our unique study utilized pre-fire and repeatedly-collected post-fire data to examine how one recent wildfire, Colorado’s 2002 Hayman Fire, affected several live overstory structure, dead overstory structure, and surface cover attributes over the first post-fire decade, and whether temporal patterns were contingent on fire severity. We found that nearly all attributes changed through time as a result of the fire. Moreover, we found that for the majority of attributes, the magnitude and timing of changes depended on the severity with which the fire burned.
4.1. Live Overstory Structure
The Hayman Fire’s net effect on live overstory structure was wide-ranging at our study site. Low-severity areas underwent little structural change. Density was reduced by about a third by the tenth post-fire year, but because mortality was concentrated in the 0–10 cm DBH class, basal area was not reduced at all. These patterns resembled those documented for other western dry conifer forests experiencing low-severity wildfire [15,31], as well as for forests experiencing prescribed fire treatments and light hand and mechanical thinning treatments [48,49,50]. More substantial change occurred in moderate-severity areas, with density reduced by over 75% and basal area reduced by over 50% by the tenth post-fire year. The vast majority of trees in both the 0–10 and the 10–20 cm DBH classes were killed, as were the vast majority of Douglas-fir trees. The changes we observed in moderate-severity areas were in line with those brought about elsewhere by moderate-severity wildfire [15,31], and by aggressive hand and mechanical thinning treatments [48,50,51]. Meanwhile, high-severity areas experienced the greatest change in live overstory structure; in these areas, burning transformed dry conifer forests into herb-dominated openings devoid of overstory trees, just as it has done across the west [15,18,31].
Many managers, researchers, and others are interested in examining to what extent recent wildfires are advancing restoration goals in overly-dense, fire-excluded western dry conifer forests [31,52,53,54,55]. Restoration treatments in these forests primarily aim to increase their resilience to future burning (sensu [56]) by creating open and heterogeneous overstory conditions that are unlikely to carry large-scale high-severity crown fire [34,57,58]. Restoration objectives for a given area are usually informed by the range of conditions that occurred there historically (i.e., the historical range of variability (HRV)), as they represent the fire-resilient conditions that existed prior to post-settlement land-use practices like fire suppression, logging, and grazing [34,57,58]. Regarding live overstory structure, Battaglia et al. [7] estimated that historical density in dry conifer forests of the Front Range ranged from about 62 to 214 stems ha−1 and that historical basal area ranged from about 5 to 11 m2 ha−1. Comparing these values with our post-fire year ten values suggests that live overstory structure was generally restored to within HRV in moderate-severity portions of our study site. In contrast, post-fire live overstory structure in low-severity areas generally remained above HRV, while in high-severity areas it was well below HRV. That moderate-severity burning was most effective at moving structural attributes to within HRV has also been documented for other dry conifer forests in the west [15,31,54].
Repeatedly assessing the status of all pre-fire overstory trees in our low- and moderate-severity plots allowed us to quantify delayed tree mortality during the first post-fire decade. Similar to others [14,15,16], we detected small but significant reductions in live overstory structural attributes due to delayed mortality in post-fire year two in low-severity areas and in post-fire years two and three in moderate-severity areas. We suspect that this delayed mortality was primarily driven by the degree of fire-caused crown and bole injury [16,59,60] and exacerbated overall by the below-average annual precipitation conditions that began in 2000 and persisted for the entire post-fire sampling period [32,61]. We do not think that insects were also a primary driver of delayed mortality, as others have found [16,59,60], because we did not observe many signs of insect activity. While we also observed mortality in the other post-fire years, it was not substantial enough to elicit changes in live overstory structure. We anticipate that mortality in future years and decades will likewise have a negligible impact on structure in the absence of additional disturbance.
We anticipate that future live overstory structure at our study site will, however, be strongly shaped by patterns of conifer regeneration. We did not quantify conifer regeneration, but several authors have quantified it elsewhere in areas affected by the Hayman Fire and other Front Range wildfires [20,62,63,64,65]. Collectively, they found that low- and moderate-severity areas generally had some or even ample conifer regeneration, while high-severity areas generally had little or even no regeneration, particularly where surviving conifers were distant. This is because ponderosa pine, Douglas-fir, and most other co-occurring conifers rely on seeds from nearby surviving overstory trees to regenerate after fire. The regeneration patterns documented by these authors suggest that live overstory structure may ultimately come to resemble that found prior to the fire in low- and moderate-severity portions of our site, assuming that they are not further disturbed. However, in high-severity portions of our site, a return to pre-fire conditions is unlikely to occur naturally for centuries, if at all.
4.2. Dead Overstory Structure
Large snags provide nesting, foraging, and roosting habitat for numerous species of birds, bats, and other wildlife, but they can be rare in undisturbed western dry conifer forests [46,47,66]. Our results illustrate the striking influence that fire severity and time since fire can have on large snag structure, via their influence on snag recruitment and snag persistence. Low-severity areas did not experience a post-fire increase in large snag density. This stasis was not because such areas failed to recruit new large snags post-fire; rather, it was because recruitment was balanced by loss through incineration and snag fall. In contrast, large snag density increased following fire in moderate- and high-severity areas, at least temporarily. Large snag density in these areas peaked in the first post-fire year, driven by high rates of recruitment and low rates of loss in that year relative to others. By ten years post-fire, large snag densities had returned to pre-fire levels in moderate-severity areas. In high-severity areas, large snag densities were still elevated but nonetheless were in decline. We expect that densities in high-severity areas will return to pre-fire levels in upcoming years as the bulk of the remaining snags, most of which are Douglas-fir, fall [18,19,33]. We therefore also expect that any increased use by wildlife species dependent on large snags will be transient in our study site [67].
4.3. Surface Cover
Litter and duff typically blanket most of the ground surface in dry conifer forests of the west [21,51,68], and prior to the Hayman Fire, our study site was no exception. Although the Hayman Fire consumed some of the pre-fire litter and duff in low-severity areas, it did not alter their cover in the first post-fire year relative to pre-fire levels. This was primarily due to the rapid casting of scorched needles, the cover of which augmented residual litter and duff cover. Cover from scorched needle cast also augmented residual litter and duff cover in moderate-severity areas one year following fire. A different scenario unfolded in high-severity areas. Here the Hayman Fire consumed nearly all pre-fire litter and duff, and because it also consumed nearly all needles in the tree crowns, scorched needle cast contributed negligible new cover in the first post-fire year. Moreover, litter and duff cover in high-severity areas did not change in subsequent years. We think that litter and duff cover in high-severity areas will begin to show signs of recovery soon due to the accumulation of sloughing bark and detached herbaceous material, the most likely sources of new material [18,19,33]. However, pre-fire levels are unlikely to be attained for decades.
Several studies have examined how fire severity and time since fire influence the amount of wood in burned western dry conifer forests [15,18,19,31,33], although to our knowledge, only Keyser et al. [15] also examined these factors simultaneously. These latter authors found that substantial fine wood (<7.6 cm diameter) and coarse wood (>7.6 cm diameter) biomass accumulated in areas that burned with moderate- and high-severity, but not in areas that burned with low-severity, in the five years following a South Dakota wildfire. We were therefore surprised to find that temporal wood cover trajectories also did not vary with fire severity at our study site. Like Keyser et al., however, we did find that wood cover increased through the post-fire period; at our site, wood cover values ten years post-fire were approximately double what they were pre-fire and triple what they were one year post-fire. These increases undoubtedly reflect temporal snag fall dynamics, as discussed earlier, as well as temporal snag break-up dynamics due to the shedding of twigs, branches, and upper boles [18,19,33]. Moreover, we expect that fire severity will begin to influence temporal wood cover trajectories in the near future as the large number of snags still standing in high-severity areas continue to break apart and fall.
Many herb and shrub species in western dry conifer forests are considered to be fire-adapted due to their ability to rapidly establish following fire via sprouting or germinating from seeds [69]. Our herb cover results are consistent with this generalization; herb cover in the first post-fire year was comparable with pre-fire cover for all severity classes. Moreover, in later post-fire years herb cover more than doubled relative to pre-fire levels in moderate- and high-severity classes, highlighting the ability of many herb species to also rapidly expand following fire and other disturbances so long as overstory tree mortality is sufficient [31,40,70]. Herb cover appeared to more-or-less stabilize by the last five years of our study, suggesting it had equilibrated with the new overstory conditions. Thus, we predict that herb cover will probably not change appreciably in upcoming years. On the other hand, our shrub cover results indicate that shrub cover failed to reach pre-fire levels by the tenth post-fire year, regardless of fire severity (also see [32]). This is probably because kinnikinnick (Arctostaphylos uva-ursi (L.) Spreng.), by far the most common shrub species at our site prior to the fire, sprouts poorly following fire and does not establish readily from seeds [71]. It will likely take several more years for shrubs, especially kinnikinnick, to recover from burning.
The above surface cover results have a host of ecological implications. For example, the amount of litter, duff, wood, and other organic surface material affects fire behavior and fire effects during a reburn [72]. The amount of coarse wood is often of particular concern, as it strongly influences fire hazard and soil heating [28]. The relatively low wood cover values that we observed ten years post-fire, coupled with relatively low coarse wood biomass values (average of 15 Mg ha−1 and range of 0–48 Mg ha−1; P. Fornwalt unpublished data [73]), suggests that the amount of coarse wood currently does not surpass recommended upper thresholds from either a fire hazard or soil heating perspective [28]. However, it may surpass them in high-severity areas in future years as snags fall.
Despite post-fire increases in wood and herbs through time in high-severity portions of our study site, exposed mineral soil was still abundant ten years after the Hayman Fire, averaging around 60% cover. High levels of mineral soil cover can persist for several years following high-severity burning, particularly in relatively unproductive dry conifer forests like those studied here [26,74,75]. It should be noted that Robichaud et al. [74,75] also measured mineral soil cover in high-severity portions of the Hayman Fire, and found that it averaged approximately 30% to 45% seven years post-fire. The discrepancy between their values and ours may be partly due to measurement technique. Whereas Robichaud et al. estimated mineral soil cover as the amount of soil that did not have wood, herb, shrub, or other ground cover elements overlapping it, we estimated it as the amount of soil that was visible, irrespective of other overlapping elements. Regardless, it is clear that the amount of mineral soil cover remains greatly elevated in areas where the Hayman Fire burned most severely. This in turn suggests that post-fire sediment production, which increases as mineral soil cover increases, may also be greatly elevated in such areas [25,26,27]. Indeed, Rhoades et al. [76] found that drainage basins experiencing extensive high-severity burning in the Hayman Fire had considerably more streamwater-suspended sediment than unburned basins even into the fifth post-fire year, the last year of their study; likewise, Robichaud et al. [74] reported that high-severity hillslopes in the Hayman Fire were producing considerably more sediment than unburned hillslopes even into the seventh post-fire year.
4.4. Study Design Considerations
Our study design had some inescapable limitations owing to its opportunistic nature. Primary among them is that sampling was restricted to one study site within the very large Hayman Fire, constraining our ability to make inferences about the effects of fire severity and time since fire to elsewhere in this wildfire or to other wildfires. Another limitation is that our sample sizes were low, most notably for the high-severity class. This may have affected our ability to accurately characterize overstory and surface cover attributes with respect to fire severity and time since fire, and to detect changes in them due to these factors.
Yet our study design also allowed us to overcome some of the limitations inherent to many wildfire studies. First, we were able to utilize pre-fire data to assess change due to wildfire. Wildfires are unplanned events and pre-fire data are usually not available; thus, studies evaluating their effects tend to collect data in both unburned and burned sites and assume that these sites were comparable prior to burning [15,21,31]. Second, we were able to utilize repeatedly-measured data to investigate a decade of post-fire temporal dynamics. Such dynamics are more commonly evaluated using a chronosequence approach [18,19,33], which substitutes space for time and requires an assumption that differences due to site are small relative to differences due to the passage of time.
5. Conclusions and Recommendations
Our results highlight the considerable variability that can result from recent wildfires in western dry conifer forests due to gradients of both fire severity and time. We therefore suggest that management actions, if undertaken for our Hayman Fire study site or for similar post-fire sites, factor in how and when burning occurred. We also suggest that management actions aim to promote ecologically-appropriate conditions that will be resilient to future wildfires and other disturbances, such as the conditions found historically. Low-severity burning caused the least amount of change. Areas burned in this manner experienced a small reduction in live overstory density, but not a concurrent reduction in live overstory basal area. They also experienced no change in large snag density and little to no change in surface cover attributes like mineral soil cover, litter and duff cover, and herb cover. As in unburned areas, thinning or prescribed fire treatments could be implemented in low-severity areas in the first few post-fire years or decades to move live overstory structure closer to HRV [48,50,51]. Such treatments could also promote large snag and herb abundance. Moderate-severity burning caused significant reductions in live stand density and basal area, generally moving areas to within HRV; it also reduced the abundance of litter and duff and increased the abundance of herbs. Prescribed fire could be utilized in moderate-severity areas in future decades to maintain these ecological benefits [77]. Prescribed fire could also be used to create new large snags, as we found that elevated post-fire snag levels in moderate-severity areas were relatively short-lived. High-severity burning clearly caused the greatest ecological transformation. Notably, areas experiencing high-severity burning underwent an immediate, total, and likely long-lived [15,20,21] reduction in live overstory density and basal area. Tree planting could be conducted to hasten the return of a forested condition. In high-severity areas, we observed a marked increase in large snag density immediately post-fire, but it declined toward pre-fire levels by post-fire year ten due to snag fall. The bulk of the remaining snags will probably fall in upcoming years [18,19,33], potentially creating undesirable coarse wood loads [28]. Prescribed fire conducted during cool weather conditions could potentially be used before this point is reached to remove some of the coarse wood while minimizing adverse effects [28]. Finally, we also suggest that additional research be conducted in recently-burned western dry conifer forests so that the direct and longer-term implications of wildfires, and their relationship to fire severity, can be further clarified. Such research should help improve management practices for burned forests as they become ever more prevalent across the west.
Acknowledgments
This study was funded by the Joint Fire Science Program (projects 03-2-3-08, 04-2-1-118, and 11-1-1-5) and the Rocky Mountain Research Station (project NFP-13-16-FWE-38). We thank Stephanie Asherin, Marin Chambers, Allison Grow, Beckie Hemmerling, Lucas Herman, Chris Hines, Chris Martin, Jill Oropeza, Bill Palm, Chris Peltz, Sean Rielly, Jenny Ventker, and Chris Welker for assisting with field and lab work; Scott Baggett for providing statistical advice; and Mike Battaglia for commenting on earlier versions of the manuscript. Lodging, lab, and office facilities during field campaigns were provided by the Rocky Mountain Research Station’s Manitou Experimental Forest.
Author Contributions
P.J.F. conceived the study; P.J.F. and B.J.C. collected the data; P.J.F. and C.S.S. analyzed the data; P.J.F., C.S.S., and B.J.C. wrote the paper.
Conflicts of Interest
The authors declare no conflict of interest. The funding sponsors had no role in the design of the study; in the collection, analyses, or interpretation of data; in the writing of the manuscript; or in the decision to publish the results.
References
- Keane, R.E.; Ryan, K.C.; Veblen, T.T.; Allen, C.D.; Logan, J.; Hawkes, B. Cascading Effects of Fire Exclusion in Rocky Mountain Ecosystems: A Literature Review; General Technical Report RMRS-GTR-91; US Department of Agriculture, Forest Service, Rocky Mountain Research Station: Fort Collins, CO, USA, 2002; p. 24.
- Swetnam, T.W.; Baisan, C.H. Historical fire regime patterns in the southwestern United States since AD 1700. In Fire Effects in Southwestern Forests: Proceedings of the Second La Mesa Fire Symposium; Allen, C.D., Ed.; General Technical Report RM-286; US Department of Agriculture, Forest Service, Rocky Mountain Research Station: Fort Collins, CO, USA, 1996; pp. 11–32. [Google Scholar]
- Hessburg, P.F.; Agee, J.K.; Franklin, J.F. Dry forests and wildland fires of the inland Northwest USA: Contrasting the landscape ecology of the pre-settlement and modem eras. For. Ecol. Manag. 2005, 211, 117–139. [Google Scholar] [CrossRef]
- Westerling, A.L.; Hidalgo, H.G.; Cayan, D.R.; Swetnam, T.W. Warming and earlier spring increase western US forest wildfire activity. Science 2006, 313, 940–943. [Google Scholar] [CrossRef] [PubMed]
- Litschert, S.E.; Brown, T.C.; Theobald, D.M. Historic and future extent of wildfires in the Southern Rockies Ecoregion, USA. For. Ecol. Manag. 2012, 269, 124–133. [Google Scholar] [CrossRef]
- Westerling, A.L. Increasing western US forest wildfire activity: Sensitivity to changes in the timing of spring. Philos. Trans. Royal Soc. B-Biol. Sci. 2016, 371, 20150178. [Google Scholar] [CrossRef] [PubMed]
- Battaglia, M.A.; Gannon, B.; Brown, P.M.; Fornwalt, P.J.; Cheng, A.S.; Huckaby, L.S. Changes in forest structure since 1860 in ponderosa pine dominated forests of the Colorado and Wyoming Front Range, USA. For. Ecol. Manag. 2018. submitted. [Google Scholar]
- Keeley, J.E. Fire intensity, fire severity and burn severity: A brief review and suggested usage. Int. J. Wildland Fire 2009, 18, 116–126. [Google Scholar] [CrossRef]
- Graham, R.T. Hayman Fire Case Study; General Technical Report RMRS-GTR-114; US Department of Agriculture, Forest Service, Rocky Mountain Research Station: Ogden, UT, USA, 2003; p. 396.
- Lentile, L.B.; Smith, F.W.; Shepperd, W.D. Patch structure, fire-scar formation, and tree regeneration in a large mixed-severity fire in the South Dakota Black Hills, USA. Can. J. For. Res. 2005, 35, 2875–2885. [Google Scholar] [CrossRef]
- Kokaly, R.F.; Rockwell, B.W.; Haire, S.L.; King, T.V.V. Characterization of post-fire surface cover, soils, and burn severity at the Cerro Grande Fire, New Mexico, using hyperspectral and multispectral remote sensing. Remote Sens. Environ. 2007, 106, 305–325. [Google Scholar] [CrossRef]
- Hayes, J.J.; Robeson, S.M. Relationships between fire severity and post-fire landscape pattern following a large mixed-severity fire in the Valle Vidal, New Mexico, USA. For. Ecol. Manag. 2011, 261, 1392–1400. [Google Scholar] [CrossRef]
- Casas, A.; Garcia, M.; Siegel, R.B.; Koltunov, A.; Ramirez, C.; Ustin, S. Burned forest characterization at single-tree level with airborne laser scanning for assessing wildlife habitat. Remote Sens. Environ. 2016, 175, 231–241. [Google Scholar] [CrossRef]
- Harrington, M.G. Predicting Pinus ponderosa mortality from dormant season and growing season fire injury. Int. J. Wildland Fire 1993, 3, 65–72. [Google Scholar] [CrossRef]
- Keyser, T.L.; Lentile, L.B.; Smith, F.W.; Shepperd, W.D. Changes in forest structure after a large, mixed-severity wildfire in ponderosa pine forests of the Black Hills, South Dakota, USA. For. Sci. 2008, 54, 328–338. [Google Scholar]
- Hood, S.M.; Smith, S.L.; Cluck, D.R. Predicting mortality for five California conifers following wildfire. For. Ecol. Manag. 2010, 260, 750–762. [Google Scholar] [CrossRef]
- Dunn, C.J.; Bailey, J.D. Temporal dynamics and decay of coarse wood in early seral habitats of dry mixed conifer forests in Oregon's eastern Cascades. For. Ecol. Manag. 2012, 276, 71–81. [Google Scholar] [CrossRef]
- Roccaforte, J.P.; Fulé, P.Z.; Chancellor, W.W.; Laughlin, D.C. Woody debris and tree regeneration dynamics following severe wildfires in Arizona ponderosa pine forests. Can. J. For. Res. 2012, 42, 593–604. [Google Scholar] [CrossRef]
- Passovoy, M.D.; Fulé, P.Z. Snag and woody debris dynamics following severe wildfires in northern Arizona ponderosa pine forests. For. Ecol. Manag. 2006, 223, 237–246. [Google Scholar] [CrossRef]
- Chambers, M.E.; Fornwalt, P.J.; Malone, S.L.; Battaglia, M.A. Patterns of conifer regeneration following high severity wildfire in ponderosa pine - dominated forests of the Colorado Front Range. For. Ecol. Manag. 2016, 378, 57–67. [Google Scholar] [CrossRef]
- Welch, K.R.; Safford, H.D.; Young, T.P. Predicting conifer establishment post wildfire in mixed conifer forests of the North American Mediterranean-climate zone. Ecosphere 2016, 7, e01609. [Google Scholar] [CrossRef]
- Chambers, C.; Mast, J. Ponderosa pine snag dynamics and cavity excavation following wildfire in northern Arizona. For. Ecol. Manag. 2005, 216, 227–240. [Google Scholar] [CrossRef]
- Koprowski, J.L.; Leonard, K.M.; Zugmeyer, C.A.; Jolley, J.L. Direct effects of fire on endangered Mount Graham red squirrels. Southwest. Nat. 2006, 51, 59–63. [Google Scholar] [CrossRef]
- Kotliar, N.B.; Reynolds, E.W.; Deutschman, D.H. American three-toed woodpecker response to burn severity and prey availability at multiple spatial scales. Fire Ecol. 2008, 4, 26–45. [Google Scholar] [CrossRef]
- Johansen, M.P.; Hakonson, T.E.; Breshears, D.D. Post-fire runoff and erosion from rainfall simulation: Contrasting forests with shrublands and grasslands. Hydrol. Process. 2001, 15, 2953–2965. [Google Scholar] [CrossRef]
- Benavides-Solorio, J.d.D.; MacDonald, L.H. Measurement and prediction of post-fire erosion at the hillslope scale, Colorado Front Range. Int. J. Wildland Fire 2005, 14, 457–474. [Google Scholar] [CrossRef]
- Wagenbrenner, J.W.; Robichaud, P.R. Post-fire bedload sediment delivery across spatial scales in the interior western United States. Earth Surf. Process. Landf. 2014, 39, 865–876. [Google Scholar] [CrossRef]
- Brown, J.K.; Reinhardt, E.D.; Kramer, K.A. Coarse Woody Debris: Managing Benefits and Fire Hazard in the Recovering Forest; General Technical Report RMRS-GTR-105; US Department of Agriculture, Forest Service, Rocky Mountain Research Station: Ogden, UT, USA, 2003; p. 16.
- Coppoletta, M.; Merriam, K.E.; Collins, B.M. Post-fire vegetation and fuel development influences fire severity patterns in reburns. Ecol. Appl. 2016, 26, 686–699. [Google Scholar] [CrossRef] [PubMed]
- Stevens-Rumann, C.; Morgan, P. Repeated wildfires alter forest recovery of mixed-conifer ecosystems. Ecol. Appl. 2016, 26, 1842–1853. [Google Scholar] [CrossRef] [PubMed]
- Stevens-Rumann, C.S.; Sieg, C.H.; Hunter, M.E. Ten years after wildfires: How does varying tree mortality impact fire hazard and forest resiliency? For. Ecol. Manag. 2012, 267, 199–208. [Google Scholar] [CrossRef]
- Abella, S.R.; Fornwalt, P.J. Ten years of vegetation assembly after a North American mega fire. Glob. Chang. Biol. 2015, 21, 789–802. [Google Scholar] [CrossRef] [PubMed]
- Dunn, C.J.; Bailey, J.D. Temporal fuel dynamics following high-severity fire in dry mixed conifer forests of the eastern Cascades, Oregon, USA. Int. J. Wildland Fire 2015, 24, 470–483. [Google Scholar] [CrossRef]
- Addington, R.N.; Aplet, G.H.; Battaglia, M.A.; Briggs, J.S.; Brown, P.M.; Cheng, T.S.; Dickinson, Y.; Feinstein, J.A.; Fornwalt, P.J.; Gannon, B.; et al. Principles and Practices for the Restoration of Ponderosa Pine and Dry Mixed-Conifer Forests of the Colorado Front Range; General Technical Report RMRS-GTR-373, US Department of Agriculture, Forest Service, Rocky Mountain Research Station: Fort Collins, CO, USA, 2018; p. 121. [Google Scholar]
- Kaufmann, M.R.; Regan, C.M.; Brown, P.M. Heterogeneity in ponderosa pine/Douglas-fir forests: Age and size structure in unlogged and logged landscapes of central Colorado. Can. J. For. Res. 2000, 30, 698–711. [Google Scholar] [CrossRef]
- Fornwalt, P.J.; Kaufmann, M.R.; Huckaby, L.S.; Stoker, J.A.; Stohlgren, T.J. Non-native plant invasions in managed and protected ponderosa pine/Douglas-fir forests of the Colorado Front Range. For. Ecol. Manag. 2003, 177, 515–527. [Google Scholar] [CrossRef]
- Fornwalt, P.J.; Kaufmann, M.R.; Huckaby, L.S.; Stohlgren, T.J. Effects of past logging and grazing on understory plant communities in a montane Colorado forest. Plant Ecol. 2009, 203, 99–109. [Google Scholar] [CrossRef]
- Fornwalt, P.J.; Huckaby, L.S.; Alton, S.K.; Kaufmann, M.R.; Brown, P.M.; Cheng, A.S. Did the 2002 Hayman Fire, Colorado, USA, burn with uncharacteristic severity? Fire Ecol. 2016, 12, 117–132. [Google Scholar] [CrossRef]
- Fornwalt, P.J.; Kaufmann, M.R.; Stohlgren, T.J. Impacts of mixed severity wildfire on exotic plants in a Colorado ponderosa pine—Douglas-fir forest. Biol. Invasions 2010, 12, 2683–2695. [Google Scholar] [CrossRef]
- Fornwalt, P.J.; Kaufmann, M.R. Understorey plant community dynamics following a large, mixed severity wildfire in a Pinus ponderosa-Pseudotsuga menziesii forest, Colorado, USA. J. Veg. Sci. 2014, 25, 805–818. [Google Scholar] [CrossRef]
- US Department of Agriculture, Forest Service, Rocky Mountain Research Station. Long-Term Climate Data for Manitou Experimental Forest; US Department of Agriculture, Forest Service, Rocky Mountain Research Station: Woodland Park, CO, USA, 2018; unpublished.
- Moore, R. Soil Survey of Pike National Forest, Eastern Part, Colorado, Parts of Douglas, El Paso, Jefferson, and Teller Counties; US Department of Agriculture, Forest Service; US Department of Agriculture, Soil Conservation Service; Colorado Agricultural Experiment Station: Washington, DC, USA, 1992; p. 106.
- Brown, P.M.; Kaufmann, M.R.; Shepperd, W.D. Long-term, landscape patterns of past fire events in a montane ponderosa pine forest of central Colorado. Landsc. Ecol. 1999, 14, 513–532. [Google Scholar] [CrossRef]
- Huckaby, L.S.; Kaufmann, M.R.; Stoker, J.M.; Fornwalt, P.J. Landscape patterns of montane forest age structure relative to fire history at Cheesman Lake in the Colorado Front Range. In Proceedings of the Ponderosa Pine Ecosystems Restoration and Conservation: Steps toward Stewardship Conference, Proceedings RMRS-P-22; Vance, R.K., Covington, W.W., Edminster, C.B., Eds.; US Department of Agriculture, Forest Service, Rocky Mountain Research Station: Fort Collins, CO, USA, 2001; pp. 19–27. [Google Scholar]
- Hessburg, P.F.; Povak, N.A.; Salter, R.B. Thinning and prescribed fire effects on snag abundance and spatial pattern in an eastern Cascade Range dry forest, Washington, USA. For. Sci. 2010, 56, 74–87. [Google Scholar]
- Rabe, M.J.; Morrell, T.E.; Green, H.; deVos, J.C.; Miller, C.R. Characteristics of ponderosa pine snag roosts used by reproductive bats in northern Arizona. J. Wildl. Manag. 1998, 62, 612–621. [Google Scholar] [CrossRef]
- Ganey, J.; Vojta, S. Characteristics of snags containing excavated cavities in northern Arizona mixed-conifer and ponderosa pine forests. For. Ecol. Manag. 2004, 199, 323–332. [Google Scholar] [CrossRef]
- Korb, J.E.; Fulé, P.Z.; Stoddard, M.T. Forest restoration in a surface fire-dependent ecosystem: An example from a mixed conifer forest, southwestern Colorado, USA. For. Ecol. Manag. 2012, 269, 10–18. [Google Scholar] [CrossRef]
- Youngblood, A.; Metlen, K.L.; Coe, K. Changes in stand structure and composition after restoration treatments in low elevation dry forests of northeastern Oregon. For. Ecol. Manag. 2006, 234, 143–163. [Google Scholar] [CrossRef]
- Roccaforte, J.P.; Huffman, D.W.; Fule, P.Z.; Covington, W.W.; Chancellor, W.W.; Stoddard, M.T.; Crouse, J.E. Forest structure and fuels dynamics following ponderosa pine restoration treatments, White Mountains, Arizona, USA. For. Ecol. Manag. 2015, 337, 174–185. [Google Scholar] [CrossRef]
- Briggs, J.S.; Fornwalt, P.J.; Feinstein, J.A. Short-term ecological consequences of collaborative restoration treatments in ponderosa pine forests of Colorado. For. Ecol. Manag. 2017, 395, 69–80. [Google Scholar] [CrossRef]
- Fulé, P.Z.; Laughlin, D.C. Wildland fire effects on forest structure over an altitudinal gradient, Grand Canyon National Park, USA. J. Appl. Ecol. 2007, 44, 136–146. [Google Scholar] [CrossRef]
- North, M.P.; Stephens, S.L.; Collins, B.M.; Agee, J.K.; Aplet, G.; Franklin, J.F.; Fulé, P.Z. Reform forest fire management. Science 2015, 349, 1280–1281. [Google Scholar] [CrossRef] [PubMed]
- Huffman, D.W.; Sanchez Meador, A.J.; Stoddard, M.T.; Crouse, J.E.; Roccaforte, J.P. Efficacy of resource objective wildfires for restoration of ponderosa pine (Pinus ponderosa) forests in northern Arizona. For. Ecol. Manag. 2017, 389, 395–403. [Google Scholar] [CrossRef]
- Hunter, M.E.; Iniguez, J.M.; Lentile, L.B. Short- and long-term effects on fuels, forest structure and wildfire potential from prescribed fire and resource benefit fire in southwestern forests, USA. Fire Ecol. 2011, 7, 108–121. [Google Scholar] [CrossRef]
- Lake, P.S. Resistance, resilience and restoration. Ecol. Manag. Restor. 2013, 14, 20–24. [Google Scholar] [CrossRef]
- Allen, C.D.; Savage, M.; Falk, D.A.; Suckling, K.F.; Swetnam, T.W.; Schulke, T.; Stacey, P.B.; Morgan, P.; Hoffman, M.; Klingel, J.T. Ecological restoration of southwest ponderosa pine ecosystems: A broad perspective. Ecol. Appl. 2002, 12, 1418–1433. [Google Scholar] [CrossRef]
- Hessburg, P.F.; Churchill, D.J.; Larson, A.J.; Haugo, R.D.; Miller, C.; Spies, T.A.; North, M.P.; Povak, N.A.; Belote, R.T.; Singleton, P.H.; et al. Restoring fire-prone inland Pacific landscapes: Seven core principles. Landsc. Ecol. 2015, 30, 1805–1835. [Google Scholar] [CrossRef]
- Sieg, C.H.; McMillin, J.D.; Fowler, J.F.; Allen, K.K.; Negron, J.F.; Wadleigh, L.L.; Anhold, J.A.; Gibson, K.E. Best predictors for postfire mortality of ponderosa pine trees in the intermountain west. For. Sci. 2006, 52, 718–728. [Google Scholar]
- Ganio, L.M.; Progar, R.A. Mortality predictions of fire-injured large Douglas-fir and ponderosa pine in Oregon and Washington, USA. For. Ecol. Manag. 2017, 390, 47–67. [Google Scholar] [CrossRef]
- Koepke, D.F.; Kolb, T.E.; Adams, H.D. Variation in woody plant mortality and dieback from severe drought among soils, plant groups, and species within a northern Arizona ecotone. Oecologia 2010, 163, 1079–1090. [Google Scholar] [CrossRef] [PubMed]
- Ziegler, J.P.; Hoffman, C.M.; Fornwalt, P.J.; Sieg, C.H.; Battaglia, M.A.; Chambers, M.E.; Iniguez, J.M. Tree regeneration spatial patterns in ponderosa pine forests following stand-replacing fire: Influence of topography and neighbors. Forests 2017, 8, 391. [Google Scholar] [CrossRef]
- Malone, S.L.; Fornwalt, P.J.; Battaglia, M.A.; Chambers, M.E.; Iniguez, J.M.; Sieg, C.H. Mixed-severity fire fosters heterogeneous spatial patterns of conifer regeneration in a dry conifer forest. Forests 2018, 9, 45. [Google Scholar] [CrossRef]
- Rother, M.T.; Veblen, T.T. Limited conifer regeneration following wildfires in dry ponderosa pine forests of the Colorado Front Range. Ecosphere 2016, 7, e01594. [Google Scholar] [CrossRef]
- Rother, M.T.; Veblen, T.T. Climate drives episodic conifer establishment after fire in dry ponderosa pine forests of the Colorado Front Range, USA. Forests 2017, 8, 159. [Google Scholar] [CrossRef]
- Spiering, D.J.; Knight, R.L. Snag density and use by cavity-nesting birds in managed stands of the Black Hills National Forest. For. Ecol. Manag. 2005, 214, 40–52. [Google Scholar] [CrossRef]
- Saab, V.A.; Russell, R.E.; Dudley, J.G. Nest-site selection by cavity-nesting birds in relation to postfire salvage logging. For. Ecol. Manag. 2009, 257, 151–159. [Google Scholar] [CrossRef]
- Kerns, B.K.; Thies, W.G.; Niwa, C.G. Season and severity of prescribed burn in ponderosa pine forests: Implications for understory native and exotic plants. Ecoscience 2006, 13, 44–55. [Google Scholar] [CrossRef]
- Brown, J.K.; Smith, J.K. Wildland Fire in Ecosystems: Effects of Fire on Flora; General Technical Report RMRS-GTR-42-2; US Department of Agriculture, Forest Service, Rocky Mountain Research Station: Ogden, UT, USA, 2000; p. 257.
- Laughlin, D.C.; Moore, M.M.; Bakker, J.D.; Casey, C.A.; Springer, J.D.; Fulé, P.Z.; Covington, W.W. Assessing targets for the restoration of herbaceous vegetation in ponderosa pine forests. Restor. Ecol. 2006, 14, 548–560. [Google Scholar] [CrossRef]
- Ferguson, D.E.; Byrne, J.C. Shrub Succession on Eight Mixed-Severity Wildfires in Western Montana, Northeastern Oregon, and Northern Idaho; Research Paper RMRS-RP-106; US Department of Agriculture, Forest Service, Rocky Mountain Research Station: Fort Collins, CO, USA, 2016.
- Anderson, H.E. Aids to Determining Fuel Models for Estimating Fire Behavior; General Technical Report INT-122; US Department of Agriculture, Forest Service, Intermountain Forest and Range Experiment Station: Fort Collins, CO, USA, 1982; p. 22.
- Fornwalt, P.J. Fuel Biomass Data for 20 0.1-ha Hayman Fire Plots; US Department of Agriculture, Forest Service, Rocky Mountain Research Station: Fort Collins, CO, USA, 2016; unpublished data.
- Robichaud, P.R.; Lewis, S.A.; Wagenbrenner, J.W.; Ashmun, L.E.; Brown, R.E. Post-fire mulching for runoff and erosion mitigation part I: Effectiveness at reducing hillslope erosion rates. Catena 2013, 105, 75–92. [Google Scholar] [CrossRef]
- Robichaud, P.R.; Wagenbrenner, J.W.; Lewis, S.A.; Ashmun, L.E.; Brown, R.E.; Wohlgemuth, P.M. Post-fire mulching for runoff and erosion mitigation part II: Effectiveness in reducing runoff and sediment yields from small catchments. Catena 2013, 105, 93–111. [Google Scholar] [CrossRef]
- Rhoades, C.C.; Entwistle, D.; Butler, D. The influence of wildfire extent and severity on streamwater chemistry, sediment and temperature following the Hayman Fire, Colorado. Int. J. Wildland Fire 2011, 20, 430–442. [Google Scholar] [CrossRef]
- North, M.; Collins, B.M.; Stephens, S. Using fire to increase the scale, benefits, and future maintenance of fuels treatments. J. For. 2012, 110, 392–401. [Google Scholar] [CrossRef]
Figure 1.
Location of the 400-ha study site within the Hayman Fire, Colorado, USA (left). Location and severity of the 20 0.1-ha plots within the study site, with post-fire aerial imagery in the background (right).
Figure 1.
Location of the 400-ha study site within the Hayman Fire, Colorado, USA (left). Location and severity of the 20 0.1-ha plots within the study site, with post-fire aerial imagery in the background (right).

Figure 2.
Live overstory (trees > 1.4 m tall) density (top) and basal area (bottom) with respect to fire severity and time since fire. Boxes represent 25th, 50th, and 75th percentiles, whiskers represent 10th and 90th percentiles, and dotted lines represent means. The p-values are model results for the effects of fire severity (F), time since fire (T), and their interaction (F × T). Within fire severity classes, letters separate means though time; NS indicates that means did not differ.
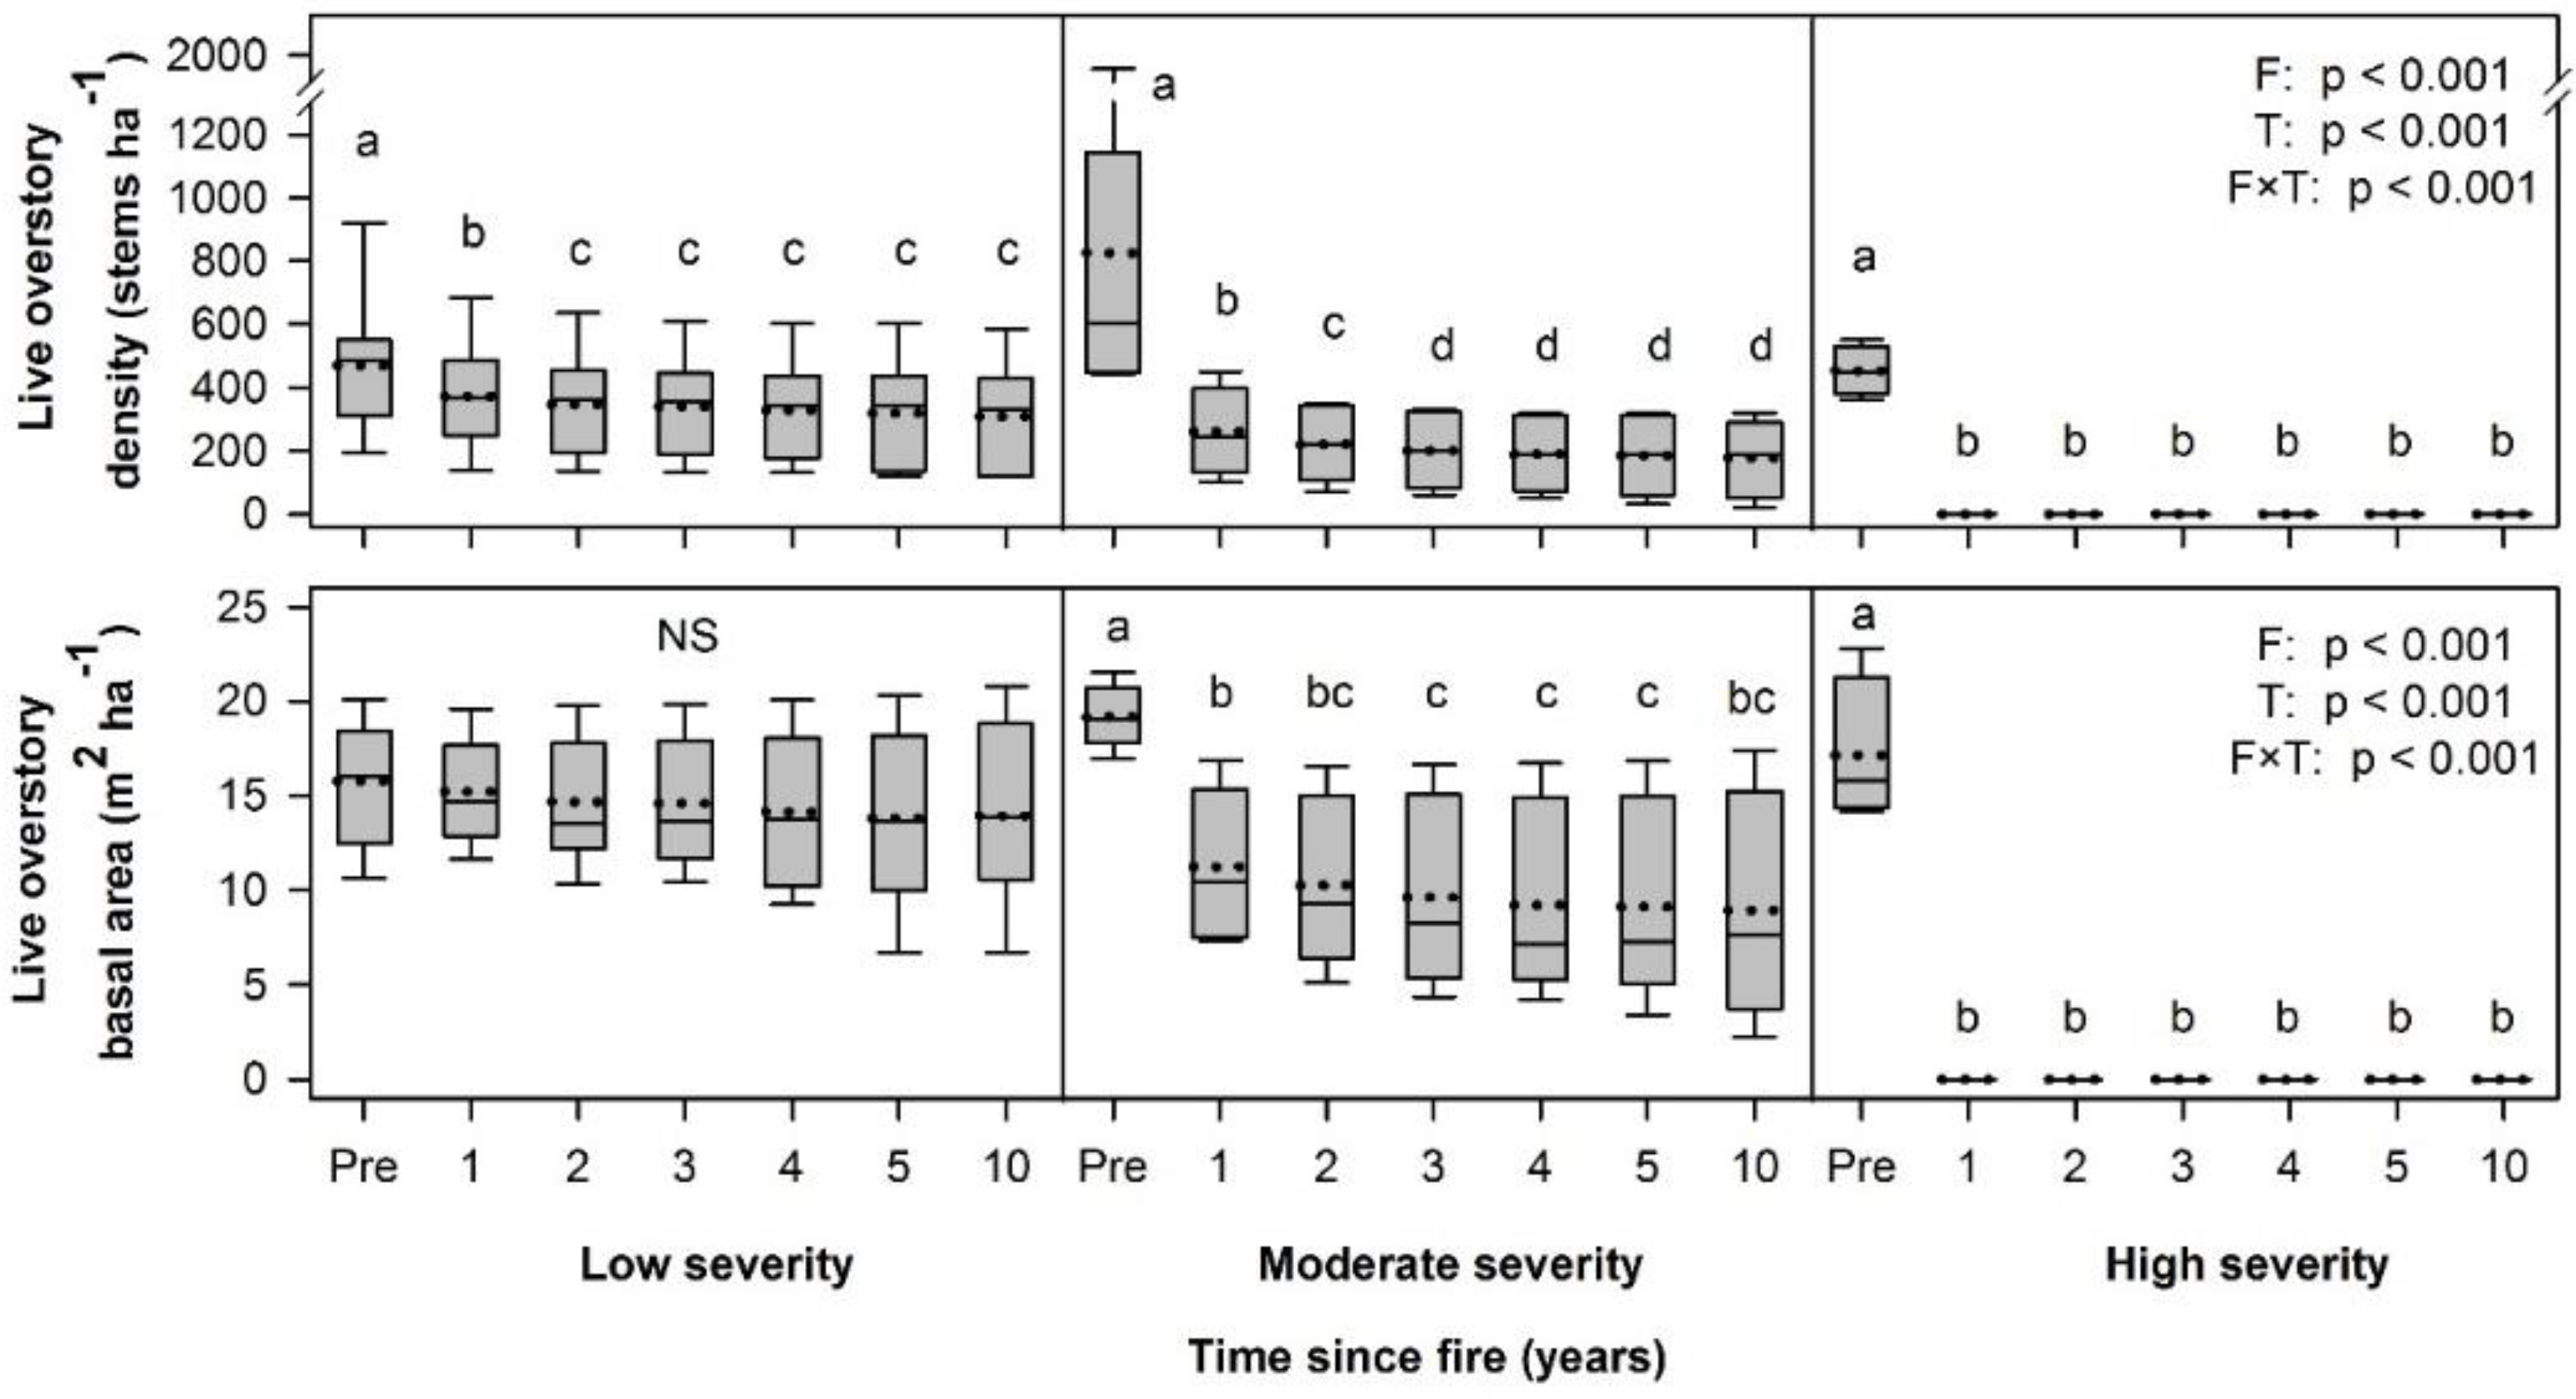
Figure 3.
Mean percent incremental post-fire mortality of pre-fire live overstory (>1.4 m tall) trees, by pre-fire diameter and fire severity (top) and by species and fire severity (bottom).
Figure 3.
Mean percent incremental post-fire mortality of pre-fire live overstory (>1.4 m tall) trees, by pre-fire diameter and fire severity (top) and by species and fire severity (bottom).

Figure 4.
Persistence of large (>20 cm diameter at breast height (DBH)) fire-created snags with respect to time since fire. Boxes represent 25th, 50th, and 75th percentiles, whiskers represent 10th and 90th percentiles, and dotted lines represent means. The p-values are model results for the effects of fire severity (F), time since fire (T), and their interaction (F × T). Letters separate means though time.

Figure 5.
Large (>20 cm DBH) snag density with respect to fire severity and time since fire. Boxes represent 25th, 50th, and 75th percentiles, whiskers represent 10th and 90th percentiles, and dotted lines represent means. The p-values are model results for the effects of fire severity (F), time since fire (T), and their interaction (F × T). Letters separate means though time within severity classes; NS indicates that means did not differ.

Figure 6.
Mineral soil, rock, litter and duff, wood, herb, and shrub cover (top to bottom) with respect to fire severity and time since fire. Boxes represent 25th, 50th, and 75th percentiles, whiskers represent 10th and 90th percentiles, and dotted lines represent means. The p-values are model results for the effects of fire severity (F), time since fire (T), and their interaction (F × T). For attributes where F × T was significant, letters separate means though time within severity classes.
© 2018 by the authors. Licensee MDPI, Basel, Switzerland. This article is an open access article distributed under the terms and conditions of the Creative Commons Attribution (CC BY) license (http://creativecommons.org/licenses/by/4.0/).
Share and Cite
MDPI and ACS Style
Fornwalt, P.J.; Stevens-Rumann, C.S.; Collins, B.J. Overstory Structure and Surface Cover Dynamics in the Decade Following the Hayman Fire, Colorado. Forests 2018, 9, 152. https://doi.org/10.3390/f9030152
AMA Style
Fornwalt PJ, Stevens-Rumann CS, Collins BJ. Overstory Structure and Surface Cover Dynamics in the Decade Following the Hayman Fire, Colorado. Forests. 2018; 9(3):152. https://doi.org/10.3390/f9030152
Chicago/Turabian StyleFornwalt, Paula J., Camille S. Stevens-Rumann, and Byron J. Collins. 2018. "Overstory Structure and Surface Cover Dynamics in the Decade Following the Hayman Fire, Colorado" Forests 9, no. 3: 152. https://doi.org/10.3390/f9030152
Note that from the first issue of 2016, this journal uses article numbers instead of page numbers. See further details here.