Pinus albicaulis Engelm. (Whitebark Pine) in Mixed-Species Stands throughout Its US Range: Broad-Scale Indicators of Extent and Recent Decline


1
Inventory & Monitoring Program, Rocky Mountain Research Station, USDA Forest Service, 507 25th St., Ogden, UT 84401, USA
2
Resource Monitoring and Assessment, Pacific Northwest Research Station, USDA Forest Service, 1220 SW 3rd Avenue, Suite 1400, Portland, OR 97204, USA, [email protected]
*
Author to whom correspondence should be addressed.
Forests 2018, 9(3), 131; https://doi.org/10.3390/f9030131
Submission received: 30 January 2018
/
Revised: 3 March 2018
/
Accepted: 7 March 2018
/
Published: 9 March 2018
(This article belongs to the Special Issue Ecology and Restoration of Whitebark Pine)
Abstract
:We used data collected from >1400 plots by a national forest inventory to quantify population-level indicators for a tree species of concern. Whitebark pine (Pinus albicaulis) has recently experienced high mortality throughout its US range, where we assessed the area of land with whitebark pine present, size-class distribution of individual whitebark pine, growth rates, and mortality rates, all with respect to dominant forest type. As of 2016, 51% of all standing whitebark pine trees in the US were dead. Dead whitebark pines outnumbered live ones—and whitebark pine mortality outpaced growth—in all size classes ≥22.8 cm diameter at breast height (DBH), across all forest types. Although whitebark pine occurred across 4.1 million ha in the US, the vast majority of this area (85%) and of the total number of whitebark pine seedlings (72%) fell within forest types other than the whitebark pine type. Standardized growth of whitebark pines was most strongly correlated with the relative basal area of whitebark pine trees (rho = 0.67; p < 0.01), while both standardized growth and mortality were moderately correlated with relative whitebark pine stem density (rho = 0.39 and 0.40; p = 0.031 and p < 0.01, respectively). Neither growth nor mortality were well correlated with total stand basal area, total stem density, or stand mean diameter. The abundance, extent, and relative growth vs. mortality rates of whitebark pine in multiple forest types presents opportunities for management to encourage whitebark pine recruitment in mixed-species stands. The lodgepole pine forest type contained more whitebark pine seedlings (35%) than any other forest type, suggesting that this forest type represents a potential management target for silvicultural treatments that seek to facilitate the recruitment of whitebark pine seedlings into larger size classes. National forest inventories in other countries may use a similar approach to assess species of concern.
1. Introduction
Whitebark pine (Pinus albicaulis Engelm.) is a foundational tree species that has experienced dramatic declines in recent decades [1]. High mortality has been attributed to several factors, including a combination of the native mountain pine beetle, Dendroctonus ponderosae, which kills relatively large trees; the nonnative pathogen Cronartium ribicola, which causes the fatal disease white pine blister rust; altered fire regimes over the past century; and climatic variation including drought and above-normal temperatures [2,3,4,5,6,7,8]. Whitebark pine is considered a foundational species given its importance for snowpack retention [5,9] and provision of food and habitat for wildlife such as grizzly bears (Ursus arctos horribilis), Clark’s nutcrackers (Nucifraga columbiana), and American red squirrels (Tamiasciurus hudsonicus) [10]. Mortality rates exceeding 50% of trees have been observed in previous studies of whitebark pine at local to regional scales [4,11,12].
Given the widespread nature of the mortality agents [5,6,13], it is reasonable to assume that such mortality has occurred throughout whitebark pine’s geographic range, but information for range-wide quantitative assessments is limited. Most studies have used purposive sampling at whitebark pine-dominated sites, with notable exceptions that included subalpine fir-dominated sites [14], conducted aerial censuses of entire watersheds [12], or conducted probabilistic sampling across a wide variety of environments [3]. Thus, it is possible that purposive sampling has overlooked the full potential range of sites where whitebark pine may occur. Further, the fact that whitebark pine is not an important timber species means that less attention has been focused on defining its full realized niche and population characteristics, compared to other pine timber species such as lodgepole pine (Pinus contorta Douglas ex Loudon) or ponderosa pine (Pinus ponderosa Lawson and C. Lawson). While it is reasonable to assume that most tree species are most abundant and robust in sites where they are relatively dominant—excepting successional transitions—the dramatic decline of whitebark pine calls for thinking outside the box, or thinking outside the whitebark pine forest type, and if possible expanding assessments to the species’ entire range.
National forest inventories offer an opportunity to use strategic, probabilistic sampling to assess multiple species of concern throughout a wide range of environments [15,16]. The purpose of this study was to quantify four indicators of whitebark pine viability using the US national forest inventory, which represents a spatially representative, broad-scale forest monitoring dataset. The first indicator is the area occupied by whitebark pine, including not only sites dominated by whitebark pine but also those with whitebark pine present as a minor component. The second indicator is the size-class distribution of live and dead whitebark pine trees, including changes in numbers of live versus dead trees over the past 2–3 decades. The third and fourth indicators are growth and mortality of whitebark pine trees, in aggregate and by size class. We also related whitebark pine tree growth and mortality to stand characteristics in order to address two questions. First, do growth and mortality of whitebark pine trees differ with respect to dominant forest type, specifically whitebark pine versus other forest types? Second, is whitebark pine growth higher, and mortality lower, in stands with a higher relative abundance of whitebark pine? The answers to these questions may help managers target restoration efforts to stands where whitebark pine is more likely to already exhibit relatively high growth and relatively low mortality.
2. Materials and Methods
2.1. Study Area and Data Collection
Our study area encompasses the geographic distribution of whitebark pine within the United States (US; Figure 1). Field data were collected by the Forest Inventory and Analysis (FIA) program of the Forest Service, US Department of Agriculture. Our analyses relied upon tree-level, stand-level, and plot-level variables from the FIA database [17], as well as numerous stand-level variables that we calculated using tree-level data (Table 1). Tree-level variables included identification of tree species; live/dead status; diameter at breast height (DBH) of all standing dead trees ≥12.7 DBH and all live trees ≥2.54 DBH, regardless of height; and number of whitebark pine seedlings on each plot. Seedlings (defined here as stems ≥15.2 cm tall with DBH <2.54 cm) and saplings (live trees ≥2.54 and <12.7 cm DBH) were measured on smaller regeneration plots within each FIA plot [18]. The stand-level variable consisted of forest type (FORTYPCD in the COND table of the FIA database [17]), which is calculated as a function of the species, sizes, and live/dead status of all trees measured in each stand [17]. For stands that have experienced recent disturbances that reduced tree cover below 10%, the forest type is classified as “nonstocked” [17]. Stands, which are referred to as “conditions” by FIA [17], are distinguished on the basis of six variables [18], although the only variable pertinent to this analysis is forest type. Thus, a single plot may contain multiple conditions that may or may not differ with respect to forest type. Calculated stand-level variables are described below in Section (Section 2.4. We aggregated ecoregion subsection [19] to the level of ecological province due to small sample sizes in some subsections.
The sample design consisted of a semi-systematic, probabilistic sample of forest ecosystems throughout the US [20]. This design-based sample enables stratified estimation of forest attributes—such as forest land area, number of trees, and forest change components such as growth and mortality—at broad spatial scales [20]. In the western US, FIA measures permanent plots once every ten years. Each year, 10% of plots are measured in a spatially interpenetrating sample design that avoids conflation of spatial with temporal trends [17,20]. The plot design, sample design, and statistical estimation methods used in this study are described in detail in the FIA database manual [17], and data collection methods are described in the FIA field manual [18].
We based most of our analyses on plots measured during the most recently available 10-year period in each US state, all of which were measured in the period 2005–2016; the sole exception to this is the comparison of current vs. historic numbers of live vs. dead whitebark pine trees, which used additional data from 1990–2000. The most recent 10-year survey (2007–2016) of FIA plots included 1406 plots with whitebark pine present (Figure 1). Because some plots contained more than one forest type, these plots encompassed 1510 stands, which included more than 64,000 whitebark pine trees across 20 forest types.
2.2. Area Occupied by Whitebark Pine
To estimate the total area occupied by whitebark pine in the US, we used queries within the EVALIDatorPC Microsoft Access tool for individual states [21]. Because EVALIDatorPC’s automated queries do not allow estimates of land area to be categorized by tree-level variables such as tree species, we first created a custom query that flagged each stand, or FIA “condition” [17,18], that contained a whitebark pine component. We defined stands with a whitebark pine component as those having at least one live whitebark pine seedling or sapling, or at least one live or dead whitebark pine tree ≥12.7 DBH. We used EVALIDatorPC’s area estimation tool to quantify the area with a whitebark pine component in each state, by forest type (FIA variable FORTYPCD [17]), and then summed the state-level areas for each forest type. To investigate the amount of whitebark pine present in each forest type, we also summarized the stand-level basal area of whitebark pine trees within each stand. We expected that whitebark pine stands, i.e., those in the whitebark pine forest type, would have significantly higher basal area of whitebark pine trees, and tested this expectation using the Kruskal–Wallis nonparametric test and the Dunn test for multiple comparisons (α = 0.05) [22].
2.3. Number of Trees by Size Class and Forest Type
To quantify the number of live and dead whitebark pine trees in all US states, we used FIA’s online EVALIDator tool [23] to separately estimate numbers of seedlings, live trees ≥2.54 cm DBH, and dead trees ≥12.7 cm DBH. We repeated the queries to estimate numbers of trees by ecological province, forest type, size class, and forest type plus size class. We also used EVALIDator [23] to estimate the numbers of live and dead trees in the most recent measurement and during the historic inventory in each state. Historic inventories were conducted over a period of 2–6 years between 1990 and 2000, with exact years and protocols depending on the state. Beginning in 2000, all states began implementing a nationally consistent, statistically robust sample and plot design [20]. To mitigate for known confounding effects of inventory methods, sample designs, and definitions between the two periods [24], we compared proportions of live and dead trees relative to the total number of whitebark pine trees during the historical period, rather than actual numbers of trees.
2.4. Whitebark Pine Growth and Mortality
To assess growth versus mortality of whitebark pine trees, we used the state-specific EVALIDatorPC [21] analysis tool to estimate mean annual net growth and mean annual mortality of whitebark pines. We included all trees ≥12.7 cm DBH in our estimates of net growth and mortality volumes for each state, using diameter class and forest type as classification variables, and then summed the individual state estimates. Both growth and mortality are expressed as volumes (m3∙ha−1∙year−1) rather than numbers of trees, such that larger trees contribute more to these fluxes, relative to smaller trees. Because the FIA database estimates growth only in terms of net growth, which is defined as the difference between gross growth and mortality, we summed net growth and mortality to calculate gross growth. Estimates of population-level growth and mortality are based on 404 plots, which is lower than the number of plots used for the previous subsections due to temporal and state-specific differences in protocols for measuring growth and mortality [17]. Population estimates account for these differences by including only plots where growth and mortality were measured with consistency [17,20].
To assess the relationship of growth and mortality rates of whitebark pine trees to stand characteristics, we calculated several plot-level metrics of stand density and relative whitebark pine abundance and examined pairwise correlations. First, to relate growth and mortality to stand characteristics rather than with the obviously correlated abundance of whitebark pine trees, we standardized both growth and mortality relative to the total volume of whitebark pine trees on each plot. Thus, we considered standardized growth and mortality rates (%∙year−1) rather than the absolute magnitudes of these fluxes. Second, we calculated the following stand characteristics at the plot level: total basal area of all species (m2∙ha−1), whitebark pine basal area as a percentage of total basal area (%), stem density of all species (trees∙ha−1), whitebark pine stem density as a percentage of total density (%), and mean tree diameter (cm). These stand characteristics were calculated using the following variables, all of which exist in the TREE table of the FIA database [17]: STATUSCD, SPCD, DIA, FGROWCFAL, FMORTCFAL, TPA_UNADJ, TPAGROW_UNADJ, and TPAMORT_UNADJ (see Table 1).
Because relationships between stand characteristics and standardized whitebark pine growth and mortality were nonlinear, we assessed the strength and significance of these relationships by means of the Spearman rank correlation coefficient and corresponding student’s t test [25]. To create a smoothed nonparametric representation of the nonlinear relationship between stand characteristics and standardized growth and mortality, we applied locally weighted regression, also known as loess [26] using function panel.smooth in R software [27]. This type of regression uses only nearest neighbors for fitting the curve, where the size of the neighborhood is defined by the span [28]. We set the span of the smoothing function to the default value of 10% of all observations [27].
3. Results
3.1. Area Occupied by Whitebark Pine
The estimated total area with whitebark pine present in the western US covers more than 4 million ha (Table 2). The vast majority of this area occurs in the Rocky Mountain States of Montana, Idaho, and Wyoming (Table 2). Only 15% of the area with whitebark pine presence was classified as whitebark pine forest type; the lodgepole pine, Engelmann spruce/subalpine fir, and subalpine fir forest types each contain more area than does the whitebark pine forest type (Table 2).
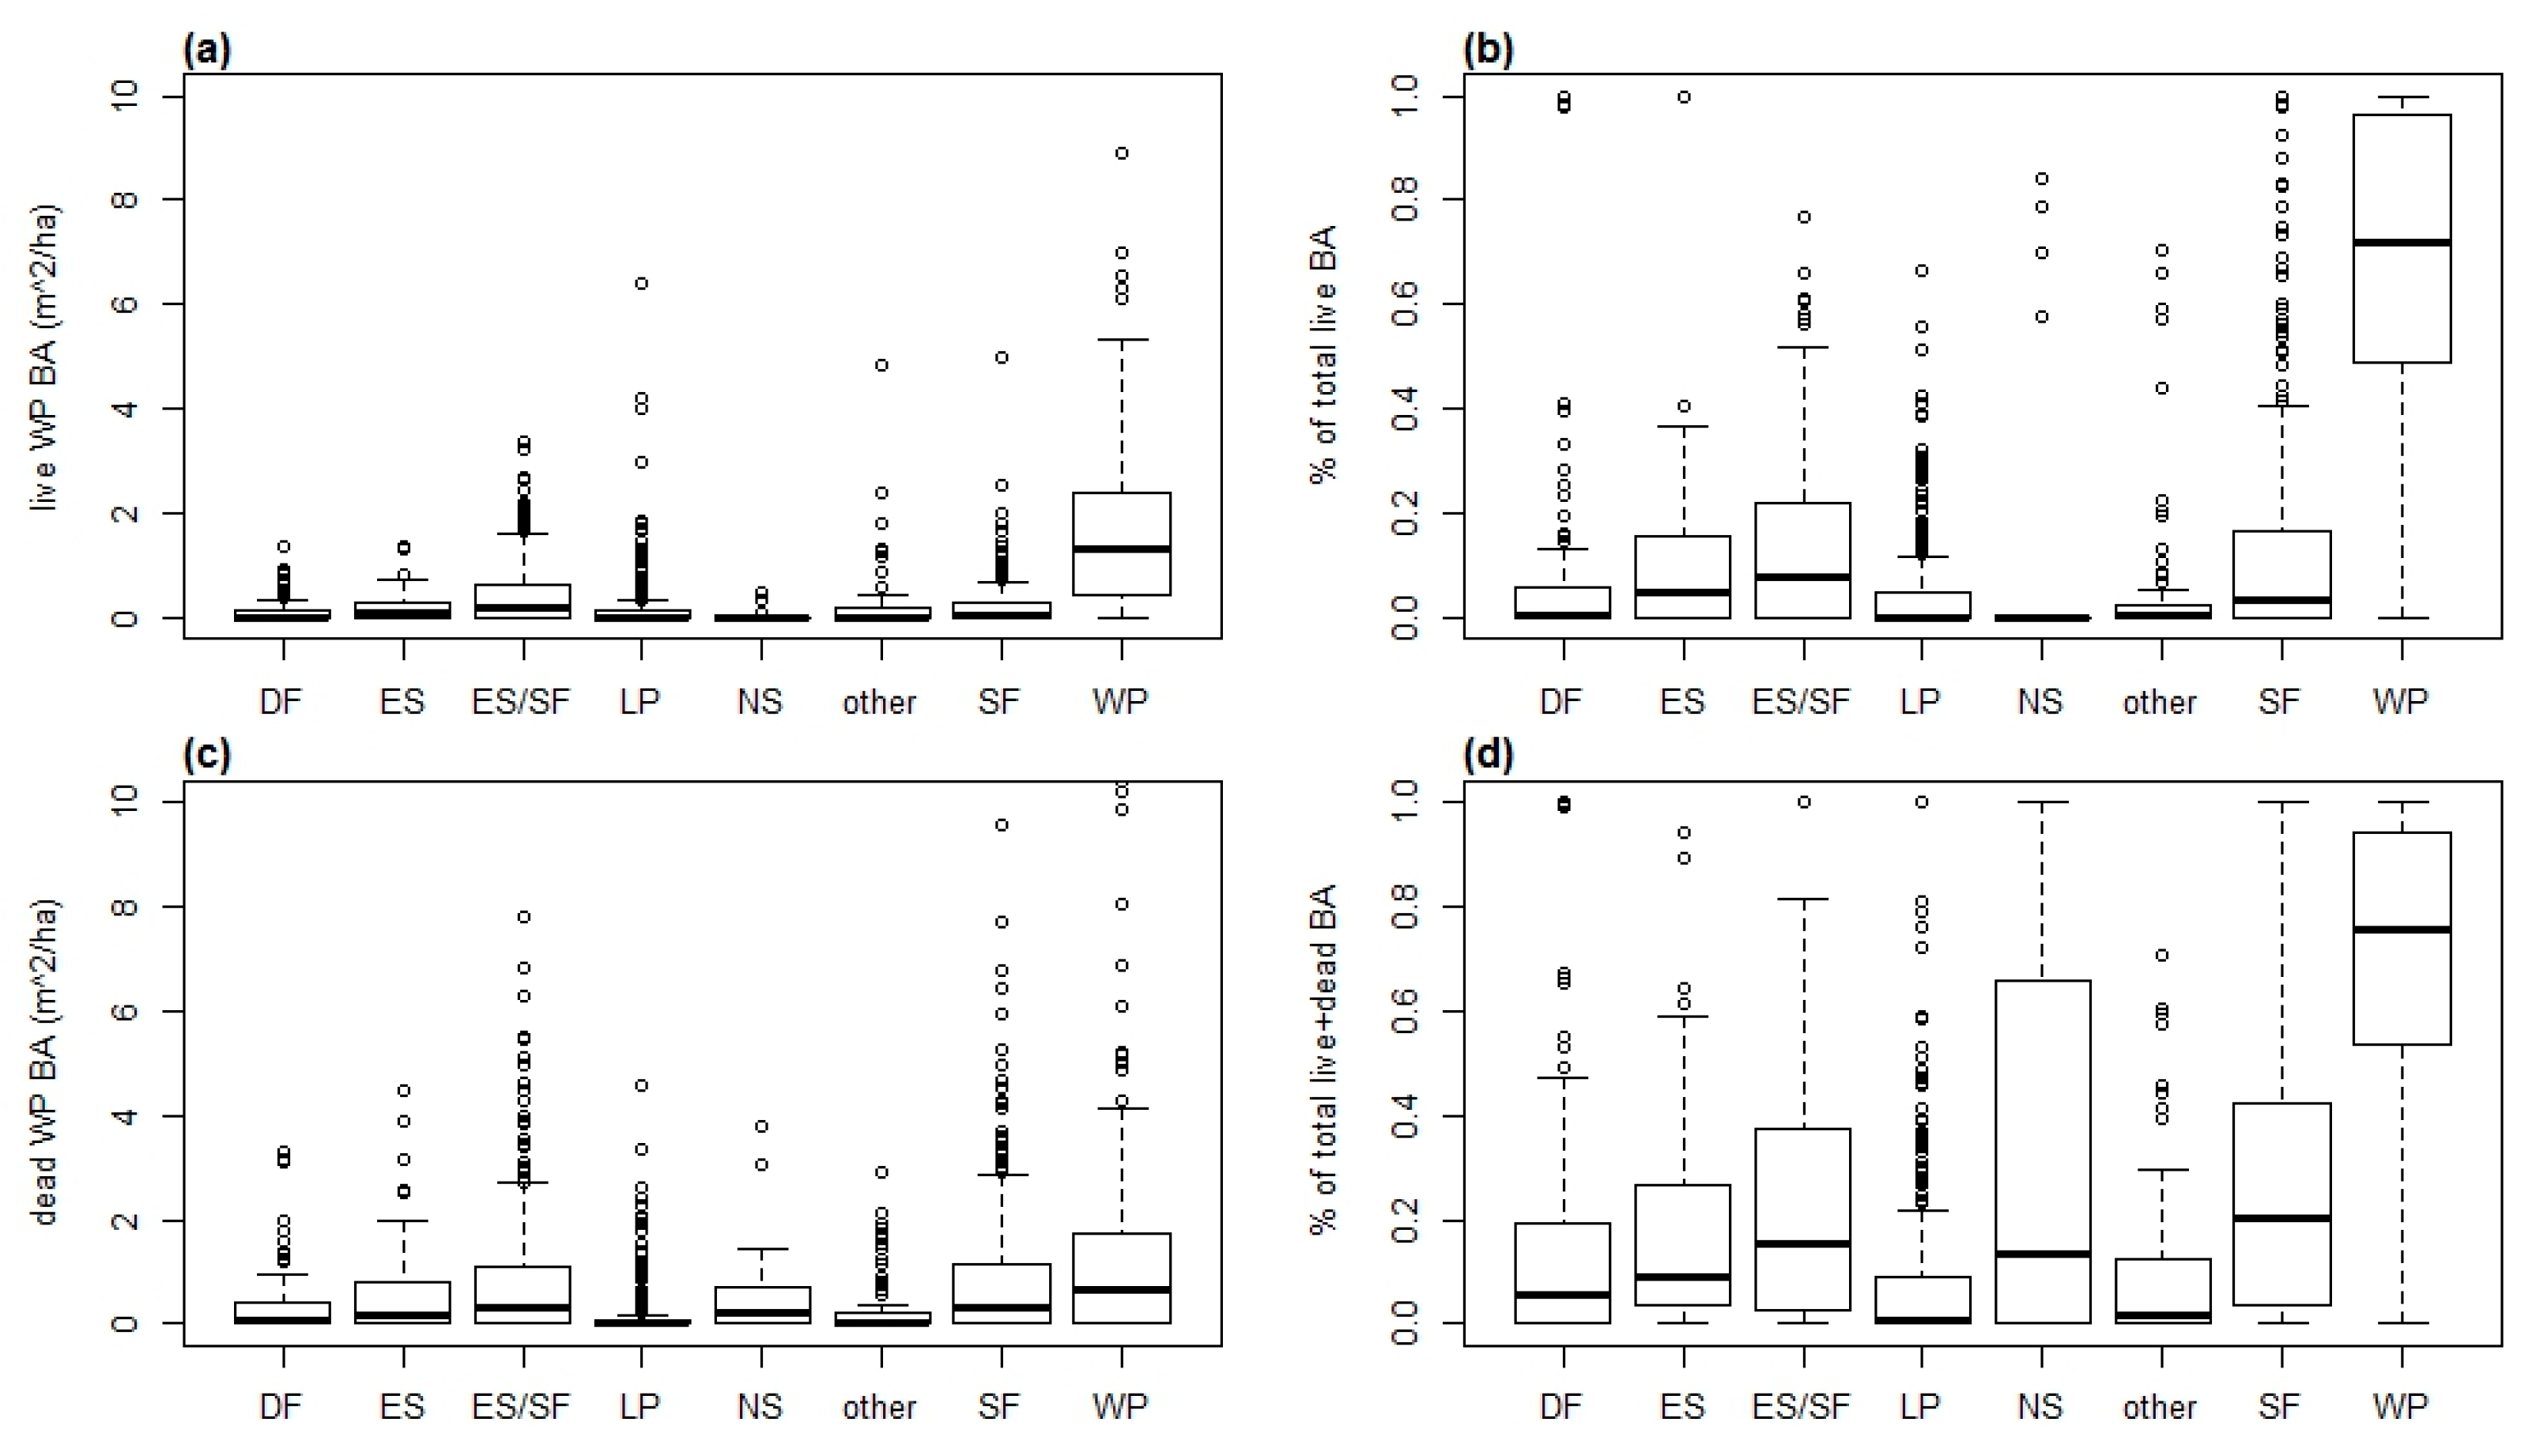
The distribution of whitebark pine trees in other forest types raises two questions: First, how much whitebark pine is present in these other forest types? The interquartile range of live whitebark pine basal area among all other forest types is below the interquartile range in the whitebark pine type (Figure 2), confirming that whitebark pine density is higher in the whitebark pine forest type. Second, has recent mortality of whitebark pine resulted in changes in forest-type classifications that undermine any analysis that compares forest types? The catastrophic recent mortality of whitebark pine suggests that the dominance of many stands may have shifted from whitebark pine to other species. Such a shift would be reflected by a large amount of whitebark pine basal area (live and dead) in non-whitebark pine forest types. However, the relative basal area of both live and dead whitebark pines in non-whitebark pine forest types does not support this hypothesis. Figure 2 shows the amount of live and dead whitebark pine basal area in each major forest type, as well as the relative dominance of whitebark pine, expressed as a percentage of the total stand basal area that consists of whitebark pine. Both the absolute and relative live and dead whitebark pine basal area was significantly higher in the whitebark pine forest type than in other types (Figure 2a,b; p < 0.05 for all comparisons of whitebark pine forest type to all other types). Thus, only a small proportion of stands would have been classified differently if all standing whitebark pines were currently alive.
3.2. Number of Trees by Size Class and Forest Type
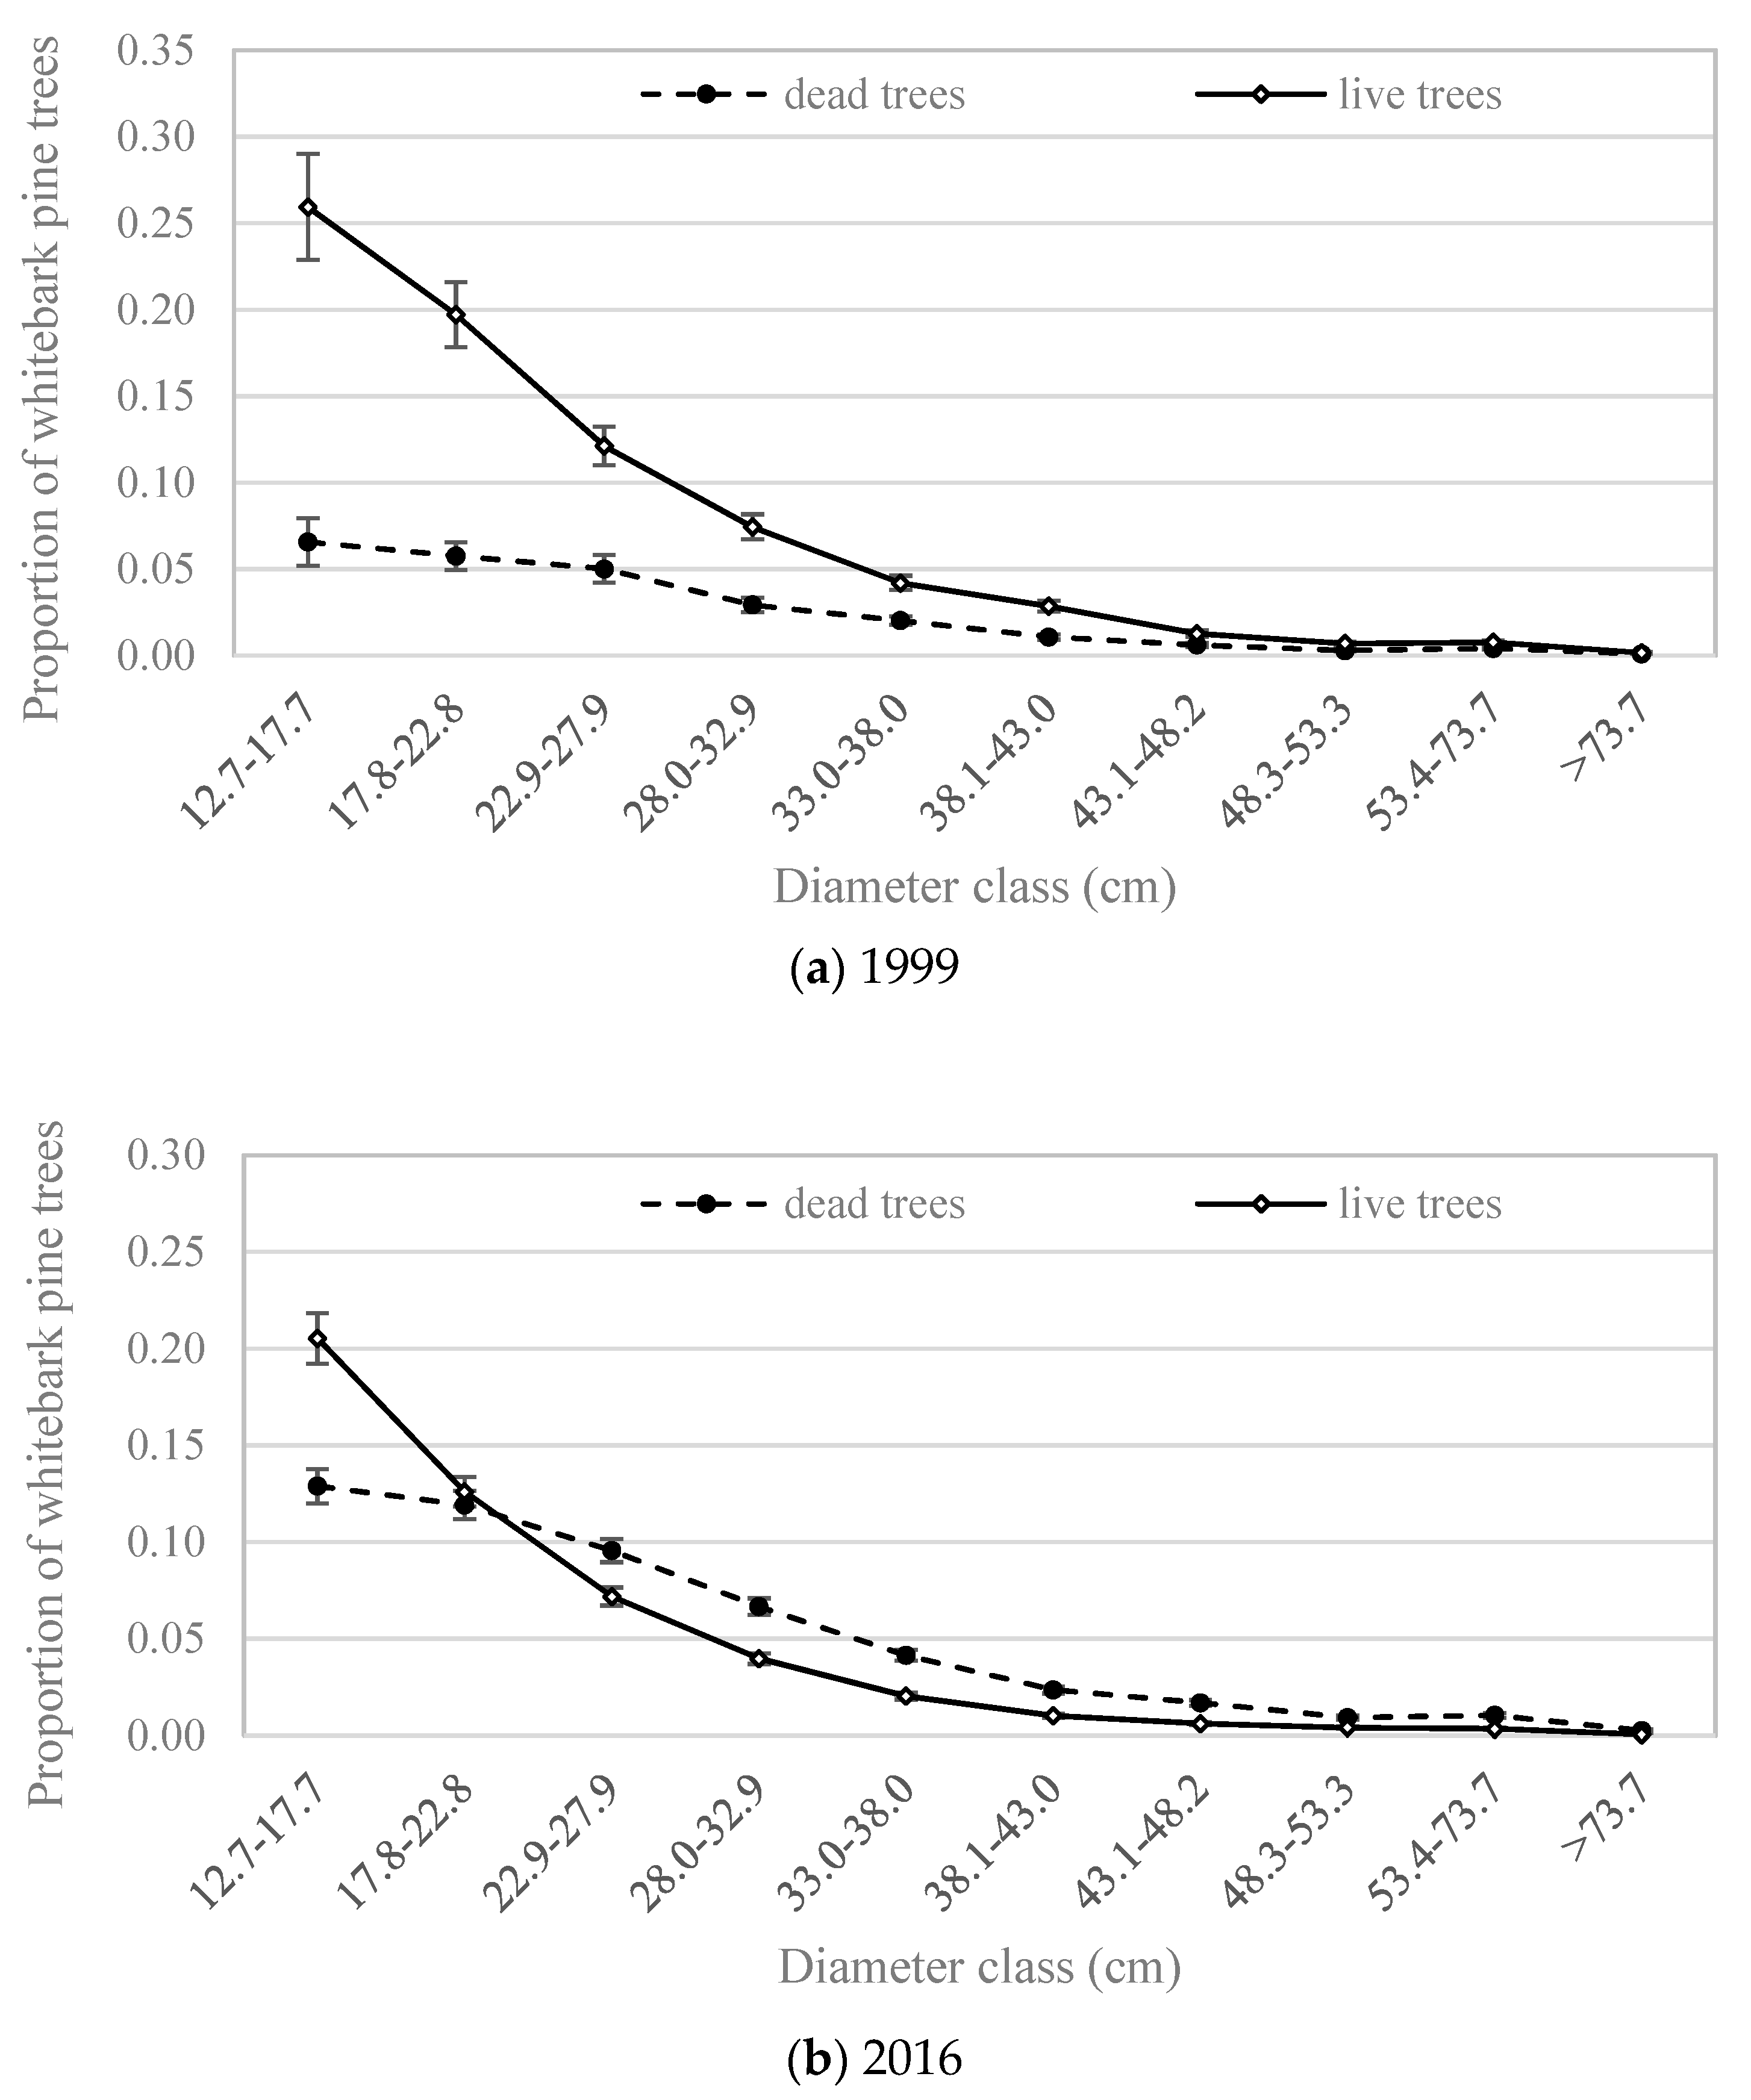
The percentage of whitebark pine trees ≥12.7 cm DBH that were dead has increased dramatically between the 1990s and 2016, from less than 25% to 51%. The percentage of standing whitebark pines that were alive during the period 2007–2016, when summarized by ecological province [19], varied from less than 10% in part of the northern Rocky Mountains to more than 90% in the Sierra Nevada (Figure 1). In the 1990s, live whitebark pine trees outnumbered dead ones in all size classes (Figure 3a). By 2016, nearly the reverse was true: dead whitebark pine trees outnumbered live ones in all but the smallest diameter class (DBH < 17.7 cm). By 2016, live whitebark pine trees outnumbered dead ones in the smallest diameter class (Figure 3b), but dead whitebark pine trees outnumbered live ones in all diameter classes ≥22.9 cm.
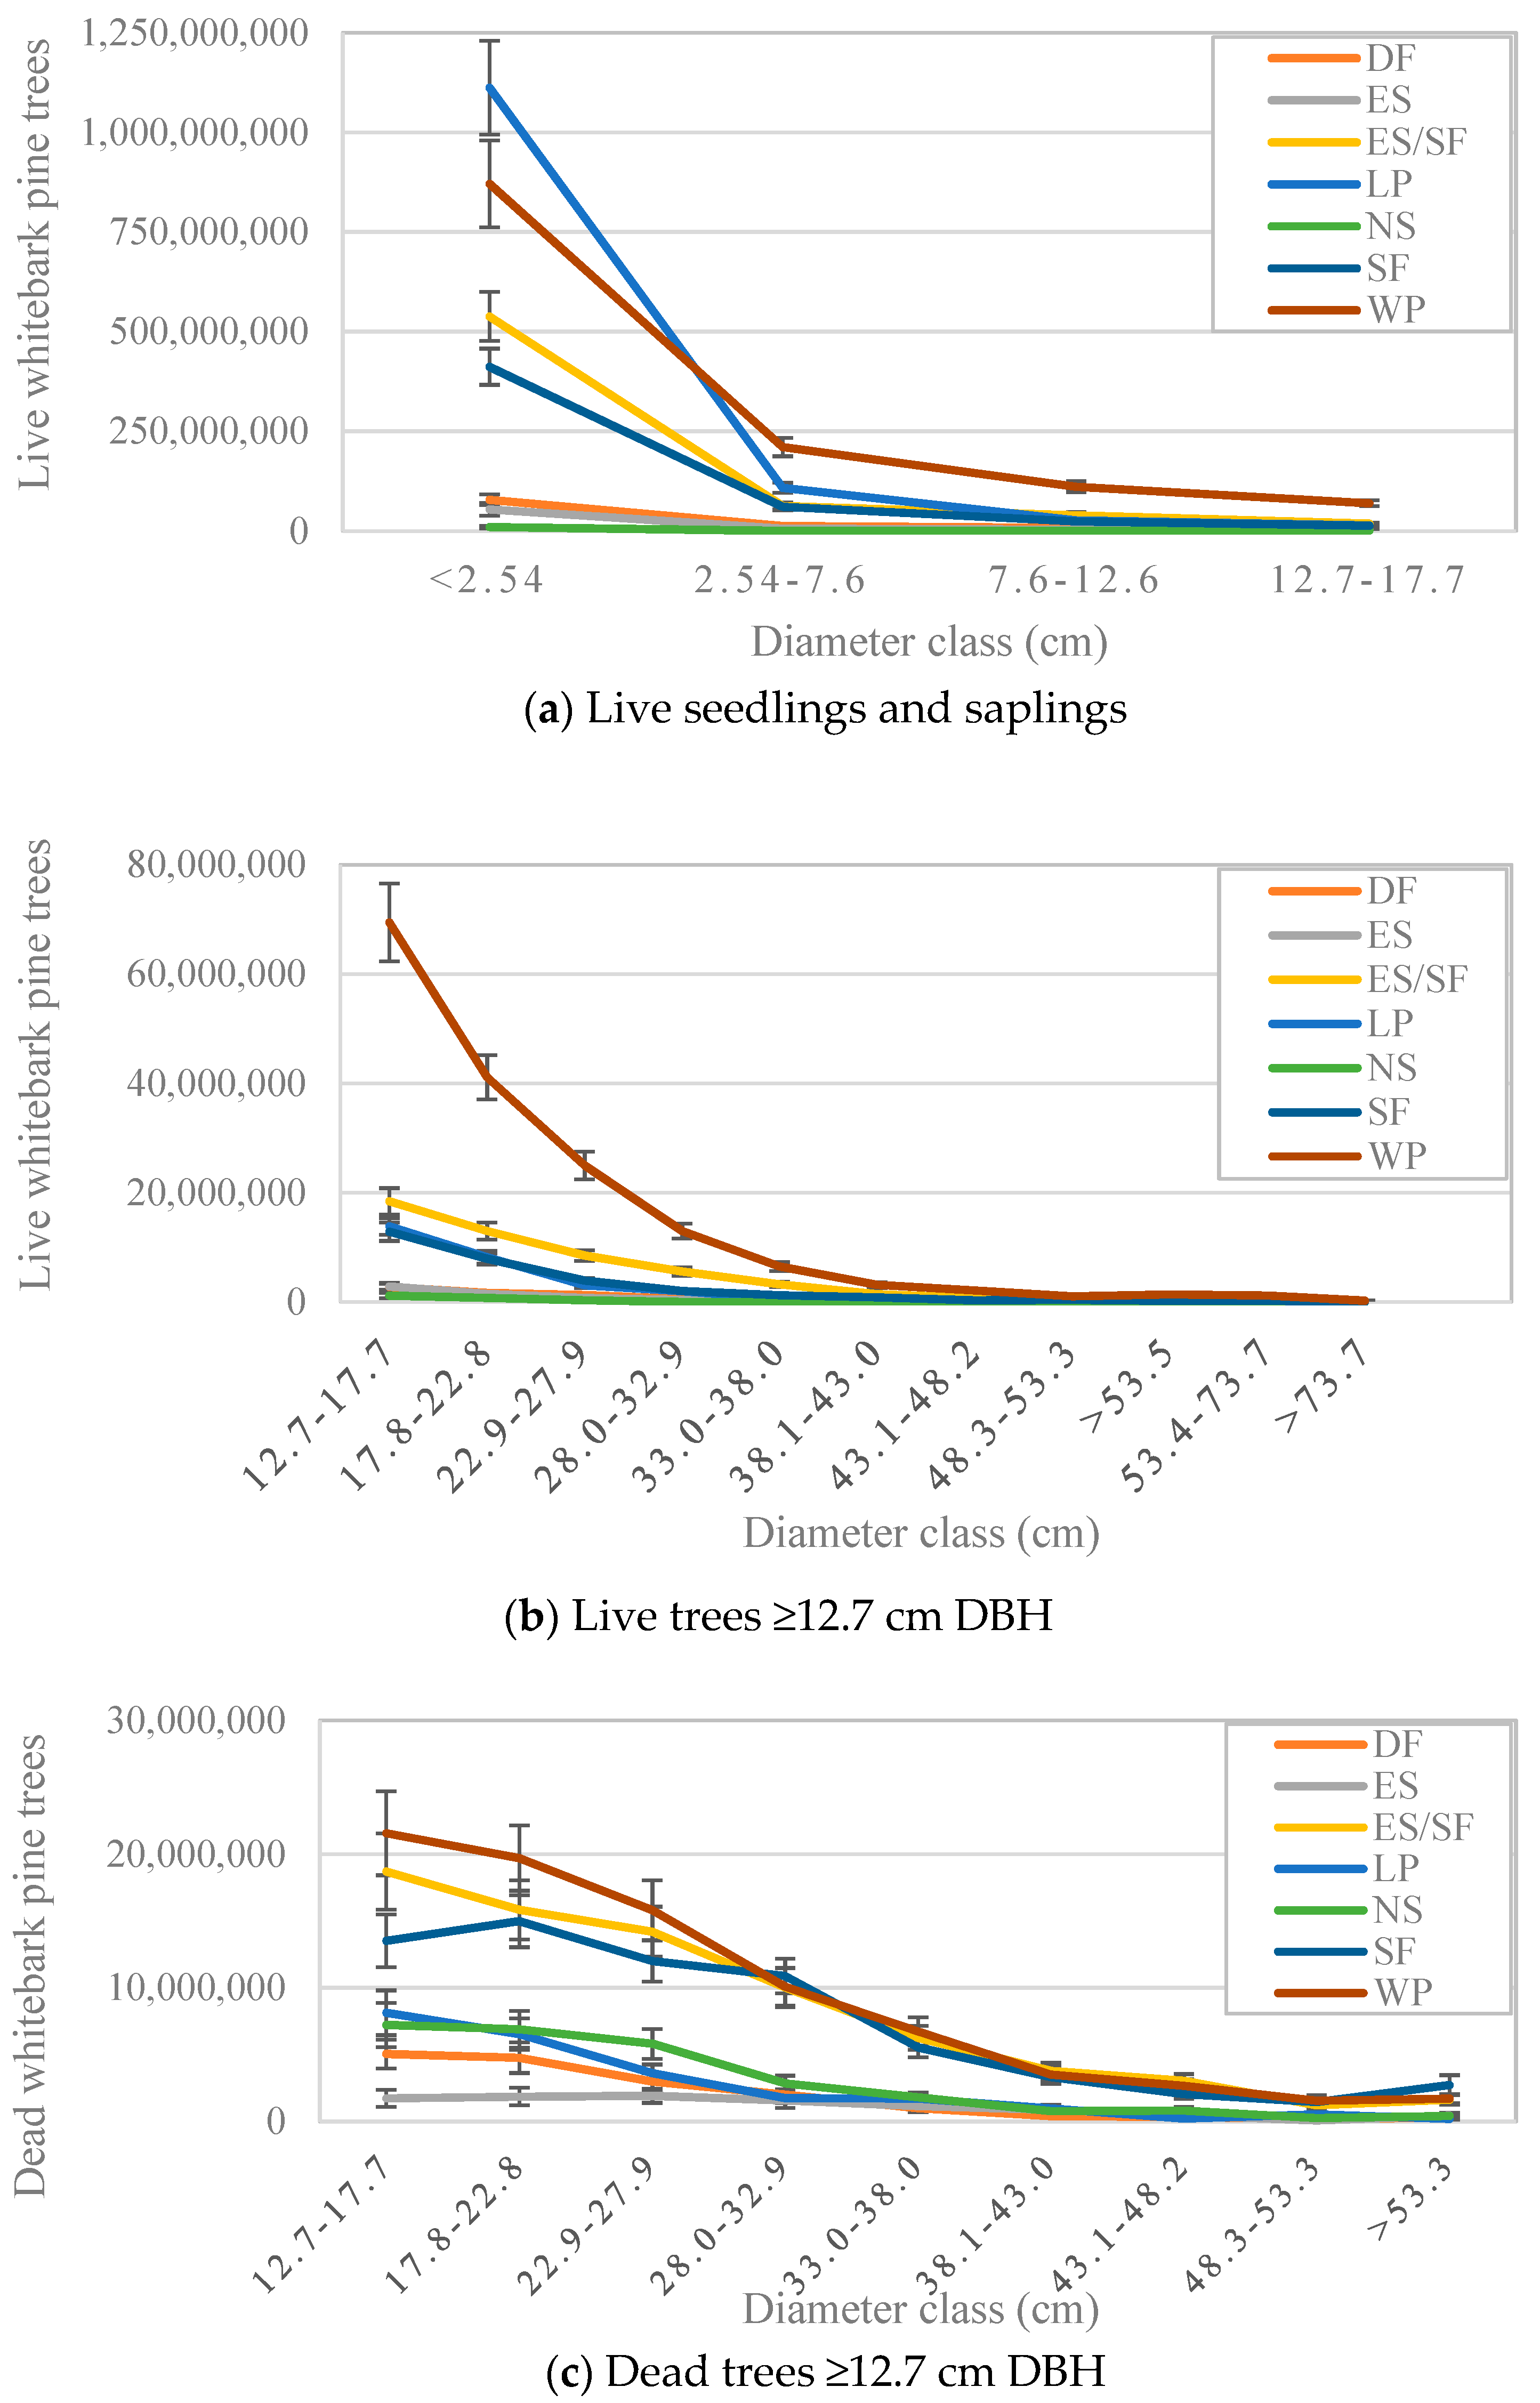
The whitebark pine forest type contained more dead whitebark pine trees ≥12.7 cm DBH, and more live trees ≥2.54 cm DBH, than any other forest type (Table 3). The lodgepole pine forest type contained more whitebark pine seedlings than any other forest type including the whitebark pine type (Table 3). However, the size-class distribution of whitebark pine trees in the lodgepole pine forest type also showed the steepest decline between the seedling and larger size classes (Figure 4), suggesting either that (1) recruitment rates of seedlings to saplings were lowest, i.e., that seedling mortality rates were highest, or (2) current seedlings represent an episodic pulse in recent seedling establishment, in this forest type. The total number of live whitebark pine trees was greatest in the whitebark pine forest type for all diameter classes larger than seedlings, and the total number of dead whitebark pine trees was comparable for most diameter classes across the whitebark pine, Engelmann spruce/subalpine fir, and subalpine fir forest types (Figure 4).
3.3. Whitebark Pine Growth and Mortality
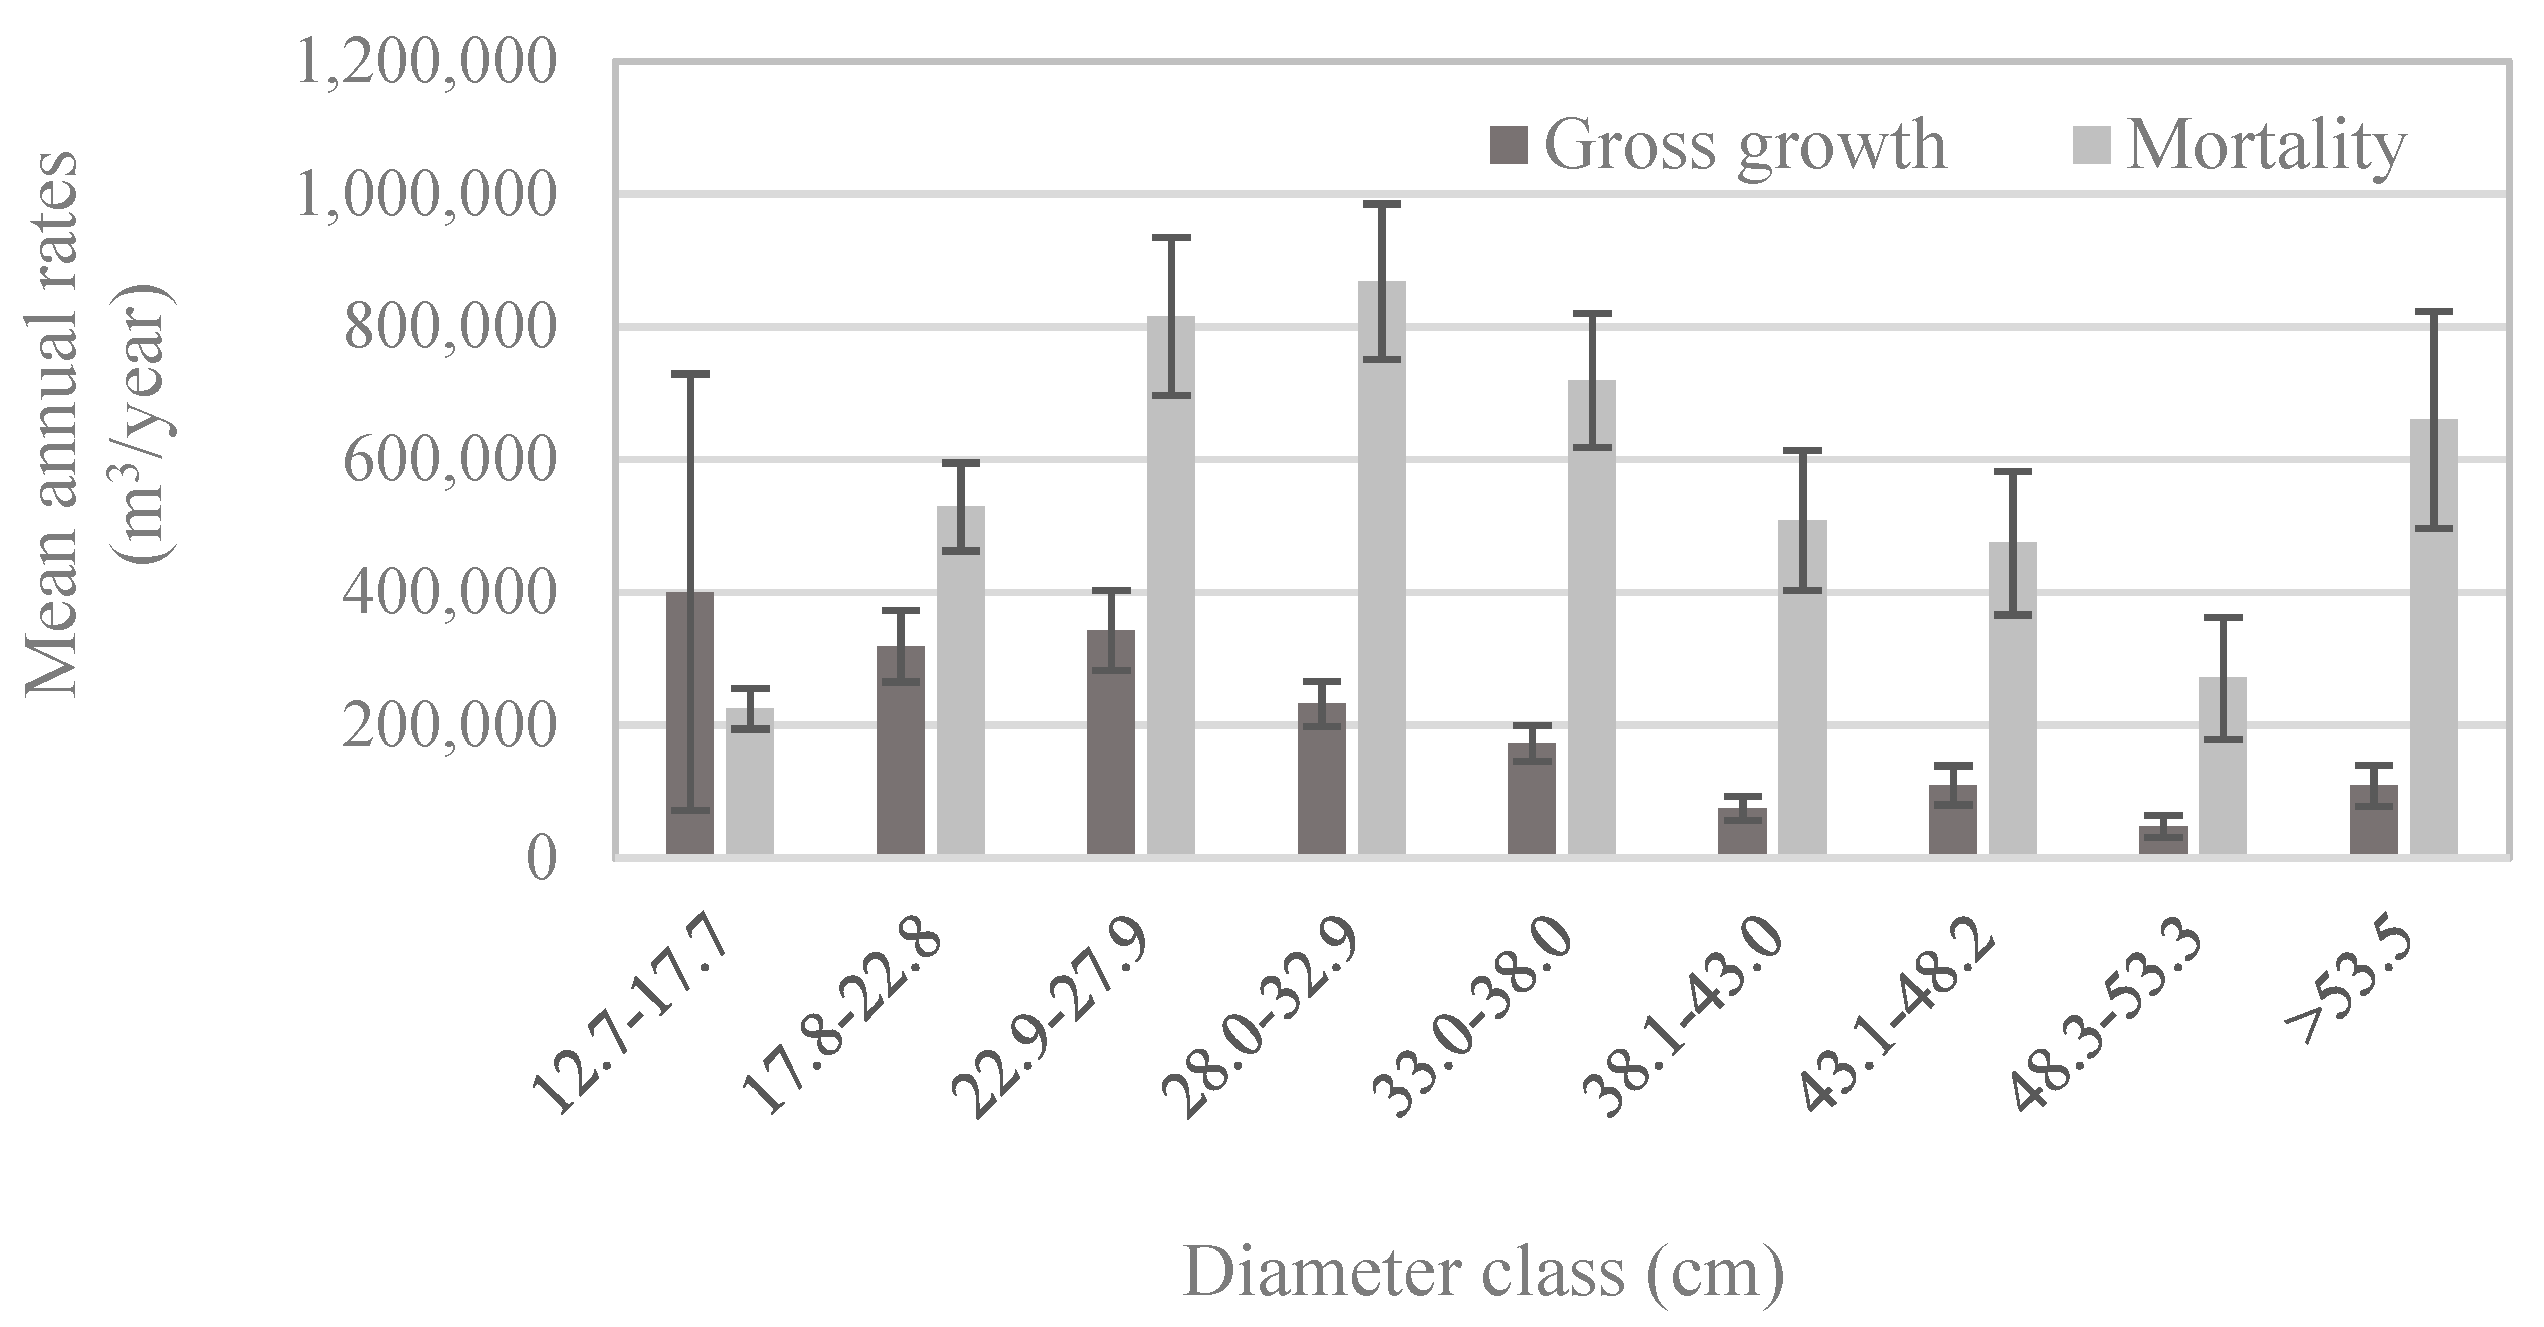
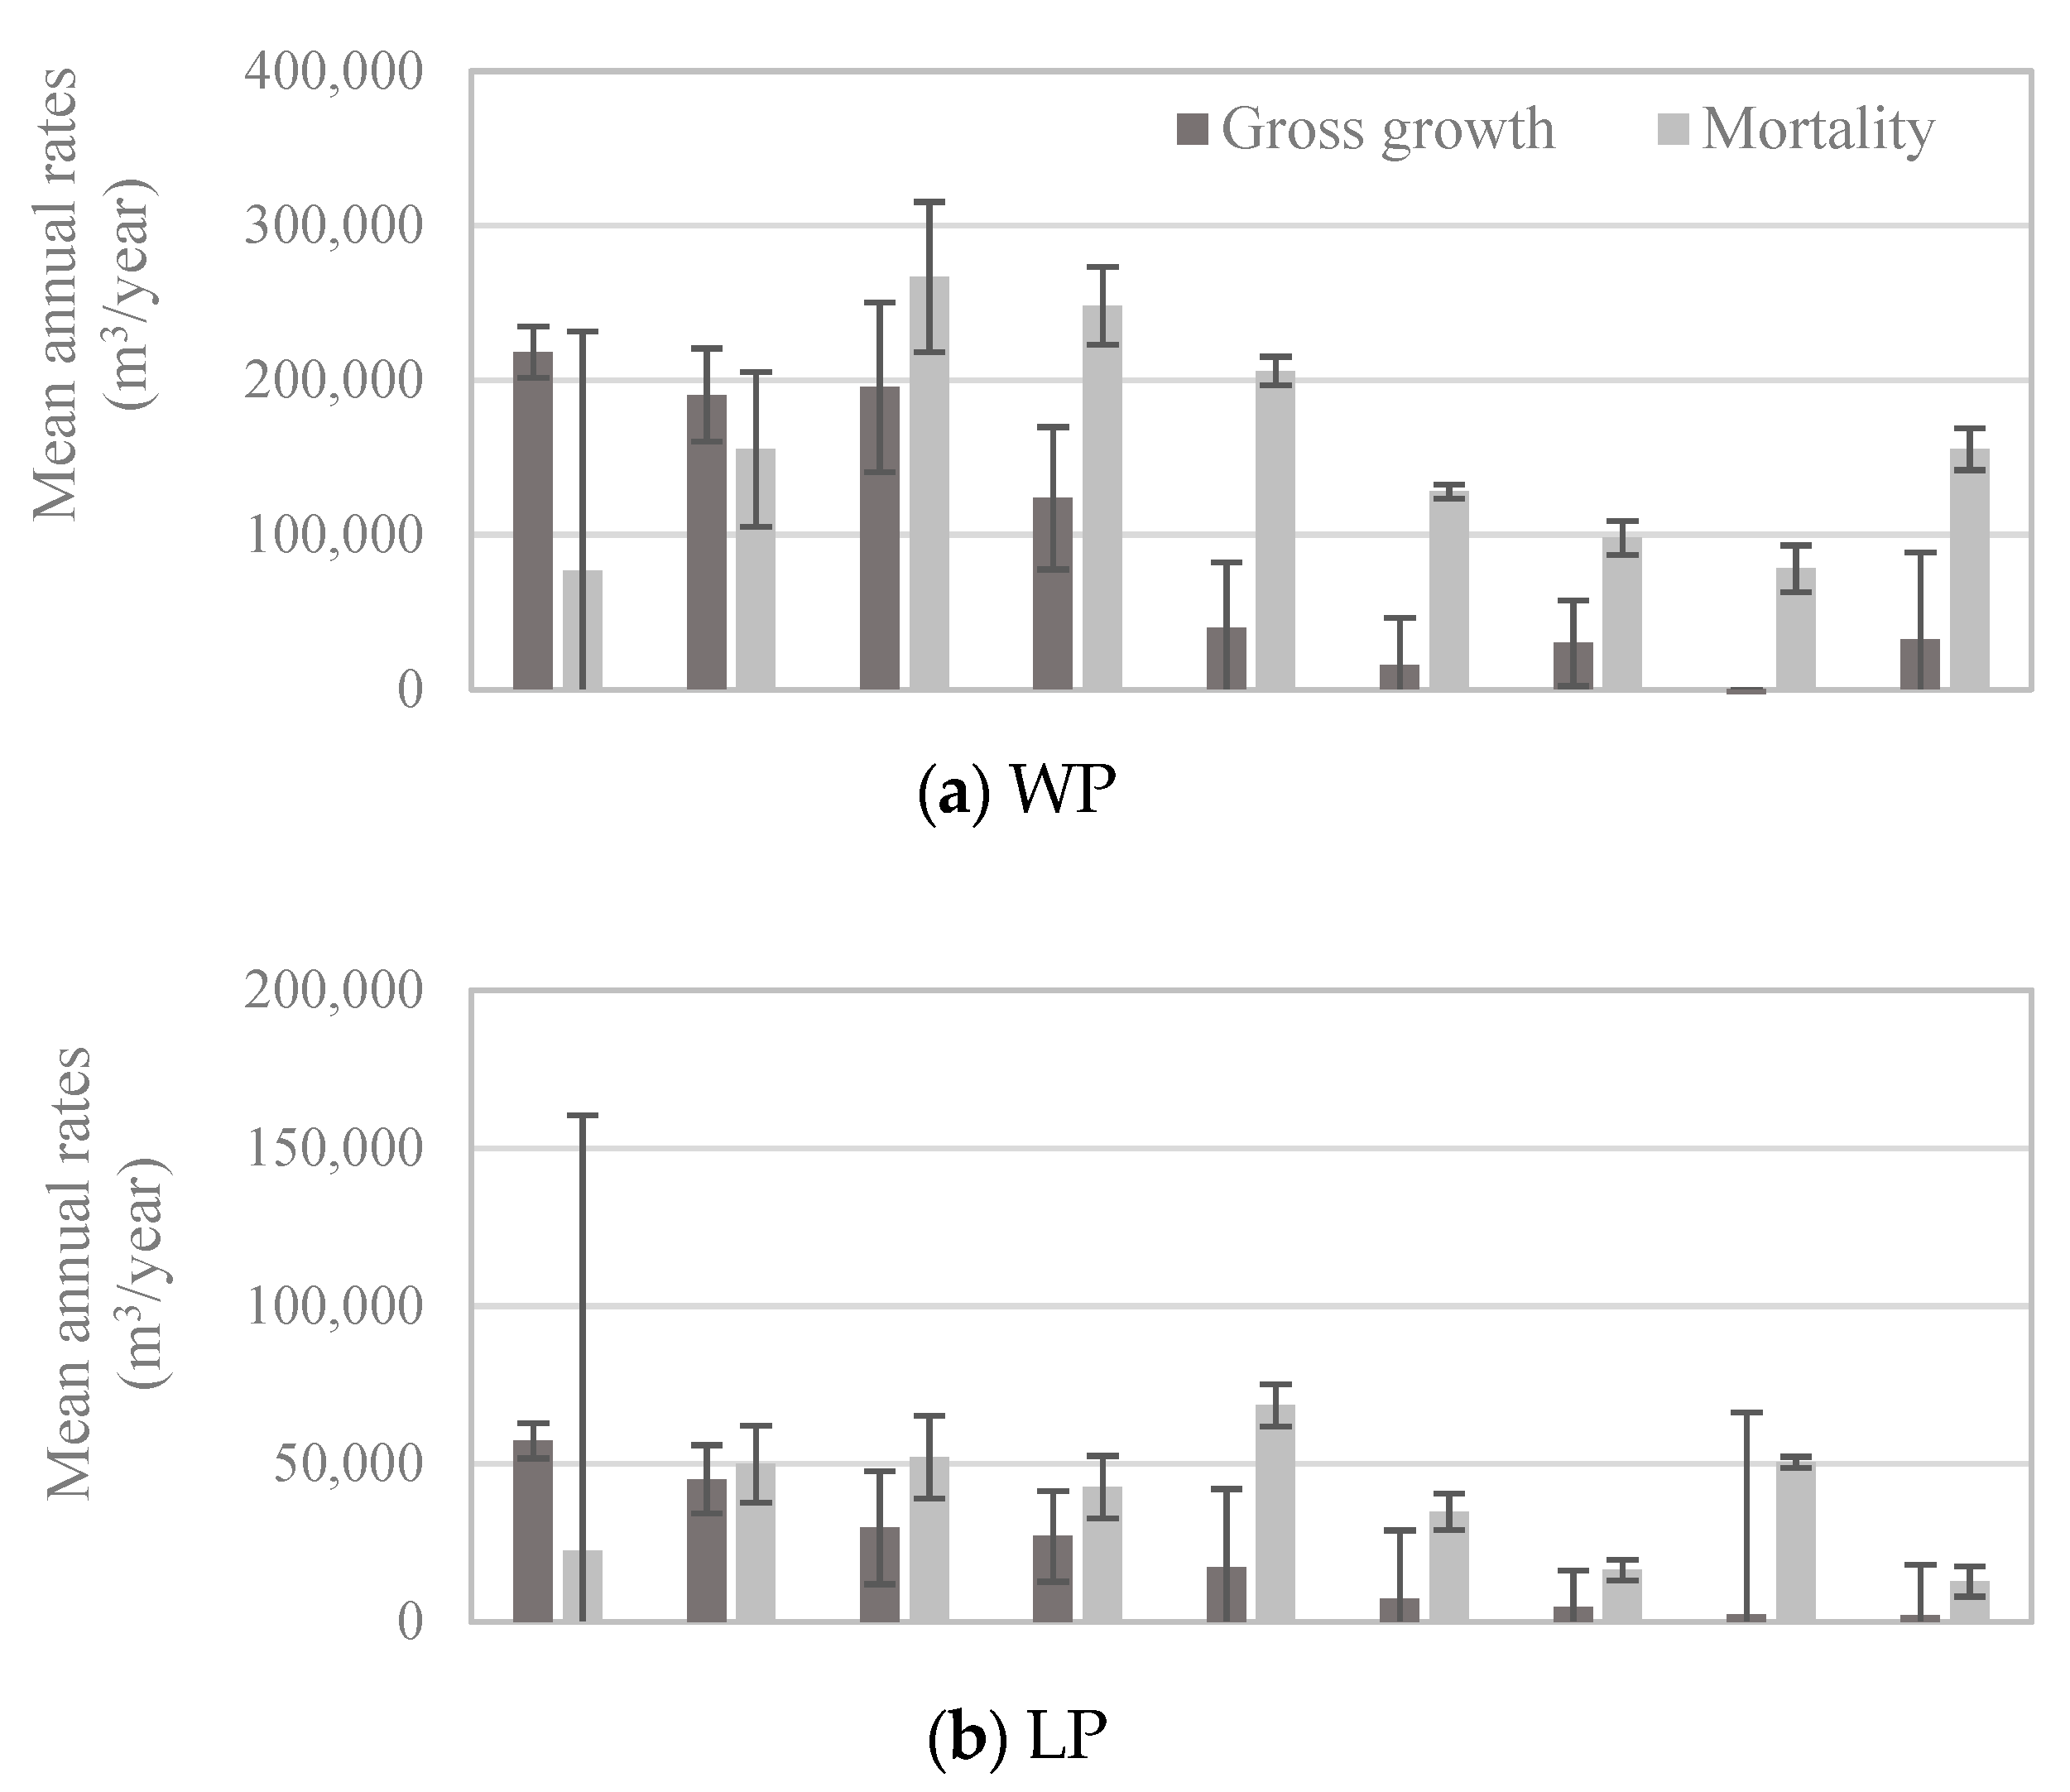
Patterns of whitebark pine tree growth and mortality followed those of the abundance of live vs. dead trees in each size class: for all but the smallest diameter classes, mortality exceeded gross growth (Figure 5). Net growth was negative in diameter classes larger than 22.8 cm (Figure 5), which means that during 2005–2016, live whitebark pine volume was lost to mortality faster than it was gained through incremental growth. Given that most whitebark pine trees larger than 12.7 cm DBH occur in stands dominated by whitebark pine (Figure 4b), it is unsurprising that patterns of growth and mortality in the whitebark pine forest type (Figure 6a) mirrored those of the entire US population (Figure 5), with positive net growth in diameter classes ≤22.8 cm. In forest types other than the whitebark pine type, patterns of growth relative to mortality in each diameter class exhibited subtle yet potentially important differences. For economy, only four major forest types are presented here—lodgepole pine, Engelmann spruce/subalpine fir, subalpine fir, and whitebark pine forest types—and these four types accounted for more than 83% of all live whitebark pine trees (Table 2). The whitebark pine forest type experienced positive net growth in the two smallest diameter classes (up to 22.8 cm; Figure 6a). The other three forest types exhibited negative net growth in all but the smallest diameter class (12.7–17.7 cm; Figure 6b–d).
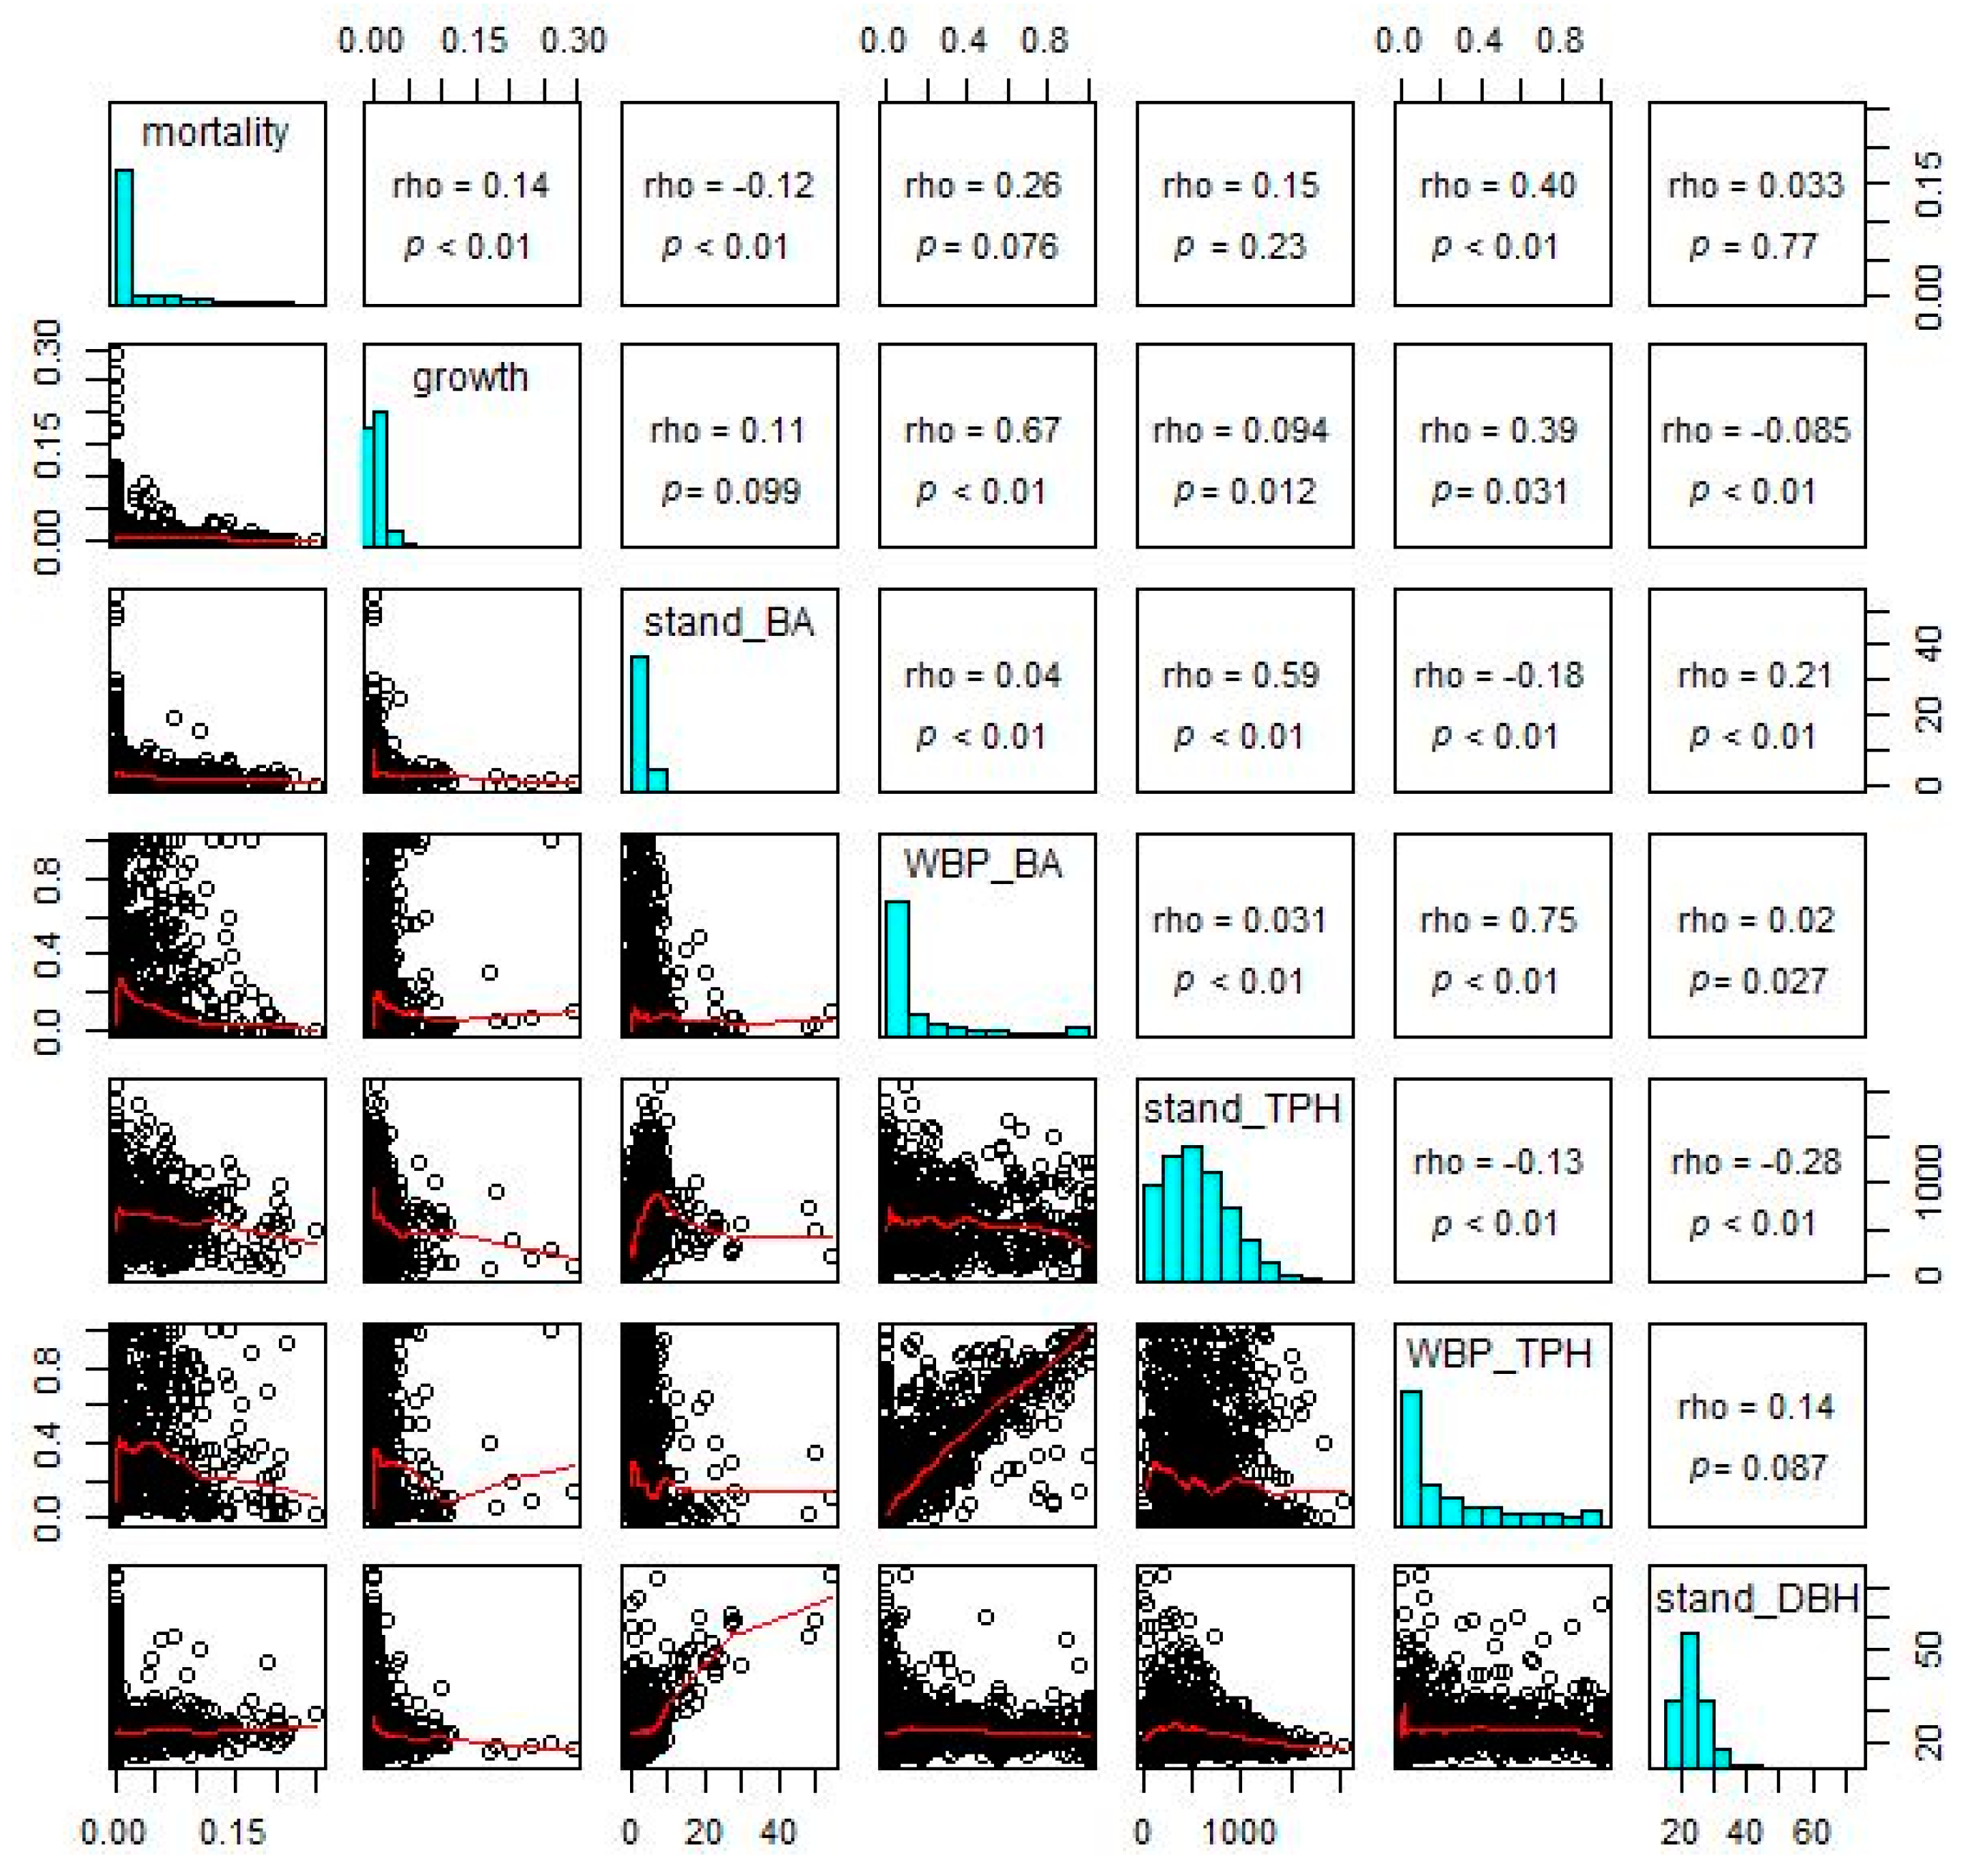
Standardized rates of mean annual mortality of whitebark pine trees were most strongly related to relative stem density of whitebark pine (WBP_TPH in Figure 7; rho = 0.4 and p < 0.01). Thus, standardized mortality was more strongly related to the proportion of whitebark pine trees in the stand than to basal area, total stem density, or mean stand size. Total stand basal area (stand_BA) was weakly but significantly and negatively correlated with standardized mortality (rho = −0.12; p < 0.01). Standardized mortality was weakly but non-significantly correlated with relative whitebark pine basal area (WBP_BA; rho = 0.26; p = 0.076), relative basal area of whitebark pine (WBP_BA; rho = 0.26; p = 0.076), and stand mean diameter (stand_DBH; rho = 0.033; p = 0.77).
In contrast to standardized mortality, standardized gross growth of whitebark pine trees was most strongly correlated with relative whitebark pine basal area (WBP_BA in Figure 7; rho = 0.67; p < 0.01). Similar to standardized mortality, standardized growth of whitebark pines was also moderately and significantly correlated with relative stem density of whitebark pine (WBP_TPH; rho = 0.39; p = 0.031). Standardized growth was weakly yet significantly correlated with total stem density (stand_TPH; rho = 0.094; p = 0.012) and mean stand diameter (stand_DBH; rho = −0.085; p < 0.01), and nonsignificantly related to total stand basal area (stand_BA; rho = 0.11; p = 0.099).
4. Discussion
Previous studies have observed >50% mortality of whitebark pine trees at smaller spatial scales [4,11,12], and our results extend this benchmark to the entire US range of whitebark pine. This level of mortality is dramatic and rare in other tree species with such broad geographic distribution and ecological importance, except among species susceptible to broad-scale fungal or insect infestations, such as chestnut blight, Dutch elm disease, and emerald ash borer, all of which have caused greater than 50% mortality in their host populations in eastern Canada [29]. However, this shift covers less than 30 years and thus represents the recent tail end of the long-term effects of white pine blister rust, which began spreading throughout western North America in the 1940s [13], combined with more recent mortality caused by synergistic stressors such as the mountain pine beetle and climatic factors [2,3,4,5,6,7,8]. The current prevalence of dead vs. live trees in intermediate to large diameter classes (Figure 3) is consistent with a shift toward smaller size-classes observed from a probabilistic sample at a finer spatial scale in the Greater Yellowstone Ecosystem [3].
Most of the area where whitebark pine is present (85%; Table 2), and the vast majority of whitebark pine seedlings and saplings (Table 3), occur in stands dominated by other tree species. Whitebark pines in other forest types thus represent a non-trivial portion of the total population in the US. The large number of seedlings in other forest types (Figure 4a) provides evidence that Clark’s nutcrackers disperse whitebark pine seeds in a wide variety of environments where light and moisture are conducive to the germination and growth of whitebark pine seedlings. However, the amount of mature whitebark pine in other forest types, as measured by basal area, is appreciably less than that in whitebark pine-dominated stands (Figure 2). In forest types other than the whitebark pine forest type, the steep decline in numbers of whitebark pines from seedling to larger size-classes suggests that site conditions are conducive to the germination of seedling growth but not to recruitment into mature size classes. This raises a concern as to whether the recruitment of mature, cone-producing whitebark pines is sufficient to foster future regeneration. The main dispersal agent of whitebark pine seeds is the Clark’s nutcracker [30], which is known to abandon foraging sites when cone production falls below a certain threshold [5]. The amount of live basal area at nearly all sites (Figure 2), including those in the whitebark pine type, is less than 5 m2 ha-1, which is the density estimated to produce a sufficient number of cones to attract and maintain Clark’s nutcrackers through the seed dispersal period [31]. Nonetheless, the broad distribution of whitebark pines in other forest types signifies two things. First, it suggests that Clark’s nutcrackers select whitebark pine seed cache sites based on factors other than the dominance of whitebark pine trees [32]. Second, it presents potential opportunities for management of whitebark pine in mixed-species stands, as discussed below.
It is noteworthy that the nonstocked forest type contains only a tiny fraction of all whitebark pine seedlings (Table 3) and the total area of whitebark pine presence (Table 2). The classification of a given stand into the nonstocked forest type implies stand-replacing disturbance—such as fire or harvest—in the site’s recent past [17]. Previous studies have identified alteration of fire regimes as a contributing factor to the decline and lack of regeneration of whitebark pine [5,33,34,35]. Thus, in the era prior to fire management, nonstocked stands would have contained an abundance of whitebark pine seedlings. In contrast, we found that the nonstocked forest type is relatively unimportant with respect to indicators of whitebark pine status in the US, which may indeed reflect a shift in fire regimes that has affected whitebark pine regeneration.
To return to one of our initial questions: do growth and mortality of whitebark pine trees differ with respect to dominant forest type, specifically whitebark pine versus other types? Recent mortality outpaced new growth for all but the smallest diameter classes of whitebark pine across all forest types (Figure 5). This pattern suggests that the size-class distribution of whitebark pine trees, at the scale of the US population, is shifting toward the smallest size classes. Indeed, the size-class distribution in 2016 exhibited a steeper decline between the smallest and subsequently larger size-classes than in 1999 (Figure 3). A decline of larger size-classes, which we observed to continue through 2016, could lead to decreased seed production by mature trees, which in turn may lead to decreased seed dispersal as Clark’s nutcrackers abandon sites with insufficient seed crops for foraging [31]. Growth and mortality rates of trees ≥12.7 cm DBH in the lodgepole pine forest type (Figure 6b) were similar to those in the whitebark pine forest type (Figure 6a).
The second question regarding growth and mortality was whether whitebark pine growth is higher, and mortality lower, in stands with a higher relative abundance of whitebark pine. Standardized growth was highest in stands with high relative stem densities of whitebark pine (WBP_BA in Figure 7). Both standardized mortality and growth rates were moderately correlated with relative whitebark pine stem density (WBP_TPH), and only weakly correlated with stand density of all species (stand_TPH and stand_BA) or with stand mean diameter (stand_DBH; Figure 7). Because these rates accounted for the total volume of whitebark pine trees on each plot, these correlations represent density-dependent intraspecific relationships. The mechanism for such relationships is unclear but may imply some pre-existing disposition toward stand vigor (or lack thereof). Such predispositions may exist due to natural resistance to the disease white pine blister rust (or lack of resistance), lack of exposure to mortality agents such as white pine blister rust in some areas, or relative absence of alternate hosts of the mountain pine beetle (e.g., density of lodgepole pines) in stands with a higher relative proportion of whitebark pine.
The lodgepole pine, Engelmann spruce/subalpine, and subalpine fir forest types pose potential targets for management that seeks to enhance the recruitment or survival of whitebark pine. The lodgepole pine forest type contains more whitebark pine seedlings (Table 2; Figure 4a), and the portion of this type with whitebark pine present covers more forest area (Table 1) than any other forest type with whitebark pines present. However, the steep decline in the whitebark pine size-class distribution in the lodgepole pine forest type (Figure 4) suggests that either (a) recent recruitment of whitebark pine seedlings into larger size-classes was lower in the lodgepole pine forest type than in other types, or (b) recent disturbance in lodgepole pine stands has resulted in a relatively large amount of seedling germination and establishment. The first explanation implies that while conditions are favorable for seed germination and seedling growth, they are not favorable for the growth of larger whitebark pines, possibly due to site factors such as soil texture or light availability, or due to frequent disturbance. The second explanation could result in the future recruitment of more mature whitebark pines; however, young whitebark pines may be subjected to mortality agents such as white pine blister rust that will prevent any increase in recruitment. Although overstory mortality creates canopy gaps that increase light availability and thus likely enhance the growth of young whitebark pine trees, it remains to be seen whether the recruitment of whitebark pines into the sapling size-class will increase following the recent widespread mortality of lodgepole pine due to the mountain pine beetle epidemic [6]. Future research and adaptive management might investigate whether silvicultural prescriptions such as shelterwood or patch cuts of lodgepole pine, where whitebark pine seedlings occur in the understory, could increase the recruitment of saplings.
The indicators presented here are easily measured and monitored as part of the US national forest inventory, but they do not account for the important role of genetic variation and genetically-based resistance to mortality agents such as white pine blister rust [5,34,36]. Even though widespread mortality caused by the mountain pine beetle is episodic rather than chronic [6], white pine blister rust occurs throughout the range of whitebark pine [7,37] and will thus continue to contribute to whitebark pine mortality. In an effort to quantify the range-wide impact of white pine blister rust relative to other mortality agents, we investigated the cause of death of trees that died during the 10-year period 2007–2016, which we briefly summarize here based on FIA’s EVALIDator online tool [23]. Among all whitebark pine trees that died during 2007–2016 and for which a causal agent was recorded, 54% were attributed to insects, 23% to disease, 15% to fire, and the remaining 8% to animals, weather, competition, or unknown causes. However, we recognize that the sample design of a national forest inventory—which prioritizes strategic, spatially and temporally balanced sampling over tactical surveys to determine cause of death—does not paint an accurate picture of the mortality agents affecting whitebark pine. In particular, the prevalence of white pine blister rust is almost certainly under-estimated because it is difficult to identify with certainty unless the fruiting bodies of the fungal pathogen are evident. Further, mortality of whitebark pine throughout western North America has been attributed to a combination of factors—including drought, heat, white pine blister rust, the mountain pine beetle, and altered disturbance regimes [2,3,4,5,6,7,8]—and it may be difficult to reliably assign a single causal agent at plots that are measured only once every 10 years. Nonetheless, probabilistic, broad-scale sampling of whitebark pine, combined with studies of the mechanisms driving population shifts, can inform future management of this species of concern.
Finally, this study opportunistically utilized a national forest inventory dataset to assess a species of concern at a scale that is not possible via purposive sampling due to logistical and cost constraints [15]. This approach contrasts with purposive sampling or experimentation—or even probabilistic sampling within a more constrained region—that enhances our understanding of finer-scale ecological relationships and drivers of demographic changes [3]. Strategic monitoring programs such as national forest inventories provide little insight into the mechanisms behind the dynamics caused by mortality agents such as white pine blister rust and the mountain pine beetle, yet they depict a broader picture of the effects of mechanisms and processes observed at finer scales. Thus, these approaches complement each other and provide a more comprehensive context for potential management of this species of concern. National forest inventories in other countries could be similarly applied to assessments of species of concern, provided that such inventories include species-level information in their data collection process.
5. Conclusions
Most strategies for managing whitebark pine focus on regeneration and recruitment rather than the prevention of mortality [5]. Treatments that can facilitate regeneration of whitebark pine and recruitment into larger size-classes may include planting, selective thinning, or a combination of these strategies. Our results suggest that the growth rates of whitebark pine trees will be highest, and mortality lowest, at sites that meet the following criteria: low total stand basal area, relatively high whitebark pine basal area, and relatively high stem density of whitebark pines. However, sites need not be dominated by whitebark pines; indeed, the vast majority of sites with whitebark pine trees present occur at sites within non-whitebark pine forest types. In particular, the lodgepole pine forest type already supports a large number of whitebark pine seedlings. Therefore, management objectives to increase the recruitment of whitebark pine should consider applying silvicultural treatments to sites in other forest types, with emphasis on the lodgepole pine forest type. Given recent episodic mortality of lodgepole pine due to the mountain pine beetle [6], it is likely that a combination of natural lodgepole pine mortality and targeted silvicultural prescriptions can facilitate the competitive release of existing young whitebark pines [38] in stands dominated by lodgepole pine.
The approach demonstrated in this study could be applied to other tree species of interest using national forest inventory data, including those in other countries, provided that the inventory collects information about regeneration and species identification. In the case of the US forest inventory, the fact that the inventory continually records information regarding forest type, regeneration, tree species, tree diameter, growth rate (via increment cores), and mortality status [18] enabled us to quantify total area, numbers of trees by size-class, growth, and mortality of a species of interest, both in total and by forest type. In the absence of tree-core information about tree growth, remeasurement of permanent plots would be required to complete a similar assessment of growth rates. Our results—specifically that there are more whitebark pine seedlings, spread across a larger area, in non-whitebark pine forest types than within the whitebark pine forest type—suggest that a species-level assessment based on a probabilistic inventory sample may yield different results than an assessment that only targets particular forest types. This approach can be applied for other tree species in countries that conduct strategic forest inventories, and it may increase the utility of such inventories.
Acknowledgments
This work, including costs to publish in open access, was supported by the Interior West Forest Inventory & Analysis (FIA) Program, Rocky Mountain Research Station, USDA Forest Service. The authors gratefully acknowledge the dozens of FIA field crews at the Pacific Northwest and Rocky Mountain Research Stations who collected the data analyzed in this study.
Author Contributions
S.A.G. and D.K.I. conceived the approach of using FIA data to assess whitebark pine; S.A.G. conceived the analysis methods; S.A.G. and D.K.I. collected a small portion of the field data (most was collected by dozens of FIA field crews); S.A.G. queried, analyzed and interpreted the data; S.A.G. wrote the paper and D.K.I. helped revise it.
Conflicts of Interest
The authors declare no conflict of interest.
References
- Ellison, A.M.; Bank, M.S.; Clinton, B.D.; Colburn, E.A.; Elliott, K.; Ford, C.R.; Forest, D.R.; Kloeppel, B.D.; Knoepp, J.D.; Lovett, G.M.; et al. Loss of Foundation Species: Consequences for the Structure and Dynamics of Forested Ecosystems. Front. Ecol. Environ. 2005, 3, 479–486. [Google Scholar] [CrossRef]
- Buotte, P.C.; Hicke, J.A.; Preisler, H.K.; Abatzoglou, J.T.; Raffa, K.F.; Logan, J.A. Climate influences on whitebark pine mortality from mountain pine beetle in the Greater Yellowstone Ecosystem. Ecol. Appl. 2016, 26, 2507–2524. [Google Scholar] [CrossRef] [PubMed]
- Shanahan, E.; Irvine, K.M.; Thoma, D.; Wilmoth, S.; Ray, A.; Legg, K.; Shovic, H. Whitebark pine mortality related to white pine blister rust, mountain pine beetle outbreak, and water availability. Ecosphere 2016, 7, e01610. [Google Scholar] [CrossRef]
- Millar, C.I.; Westfall, R.D.; Delany, D.L.; Bokach, M.J.; Flint, A.L.; Flint, L.E. Forest mortality in high-elevation whitebark pine (Pinus albicaulis) forests of eastern California, USA; influence of environmental context, bark beetles, climatic water deficit, and warming. Can. J. For. Res. 2012, 42, 749–765. [Google Scholar] [CrossRef]
- Keane, R.E.; Tomback, D.F.; Aubry, C.A.; Bower, A.D.; Campbell, E.M.; Cripps, C.L.; Jenkins, M.B.; Mahalovich, M.F.; Manning, M.; McKinney, S.T.; et al. A Range-Wide Restoration Strategy for Whitebark Pine (Pinus albicaulis); RMRS-GTR-279; USDA Forest Service Rocky Mountain Research Station: Fort Collins, CO, USA, 2012; p. 108.
- Raffa, K.F.; Aukema, B.H.; Bentz, B.J.; Carroll, A.L.; Hicke, J.A.; Turner, M.G.; Romme, W.H. Cross-scale drivers of natural disturbances prone to anthropogenic amplification: The dynamics of bark beetle eruptions. Bioscience 2008, 58, 501–517. [Google Scholar] [CrossRef]
- Smith, C.M.; Wilson, B.; Rasheed, S.; Walker, R.C.; Carolin, T.; Shepherd, B. Whitebark pine and white pine blister rust in the Rocky Mountains of Canada and northern Montana. Can. J. For. Res. 2008, 38, 982–995. [Google Scholar] [CrossRef]
- Keane, R.E.; Arno, S.F. Rapid decline of whitebark pine in western Montana: Evidence from 20-year remeasurements. West. J. Appl. For. 1993, 8, 44–47. [Google Scholar]
- Tomback, D.F.; Resler, L.M.; Keane, R.E.; Pansing, E.R.; Andrade, A.J.; Wagner, A.C. Community structure, biodiversity, and ecosystem services in treeline whitebark pine communities: Potential impacts from a non-native pathogen. Forests 2016, 7, 21. [Google Scholar] [CrossRef]
- U.S. Fish and Wildlife Service. Endangered and threatened wildlife and plants: 12-month finding on a petition to list Pinus albicaulis as endangered or threatened with critical habitat. Fed. Regist. 2011, 76, 42631–42654. [Google Scholar]
- Retzlaff, M.L.; Leirfallom, S.B.; Keane, R.E. A 20-Year Reassessment of the Health and Status of Whitebark Pine Forests in the Bob Marshall Wilderness Complex, Montana; RMRS-RN-73; USDA Forest Service Rocky Mountain Research Station: Fort Collins, CO, USA, 2016; p. 10.
- Macfarlane, W.W.; Logan, J.A.; Kern, W.R. An innovative aerial assessment of Greater Yellowstone Ecosystem mountain pine beetle-caused whitebark pine mortality. Ecol. Appl. 2012, 23, 421–437. [Google Scholar] [CrossRef]
- Wong, C.M.; Daniels, L.D. Novel forest decline triggered by multiple interactions among climate, an introduced pathogen and bark beetles. Glob. Chang. Biol. 2017, 23, 1926–1941. [Google Scholar] [CrossRef] [PubMed]
- Larson, E.R.; Kipfmueller, K.F. Patterns in whitebark pine regeneration and their relationships to biophysical site characteristics in southwest Montana, central Idaho, and Oregon, USA. Can. J. For. Res. 2010, 40, 476–487. [Google Scholar] [CrossRef]
- Manley, P.N.; Zielinski, W.J.; Schlesinger, M.D.; Mori, S.R. Evaluation of a multiple-species approach to monitoring species at the ecoregional scale. Ecol. Appl. 2004, 14, 296–310. [Google Scholar] [CrossRef]
- Rogers, P.C.; O’Connell, B.; Mwang’ombe, J.; Madoffe, S.; Hertel, G. sForest health monitoring in the Ngangao forest, Taita Hills, Kenya: A five year assessment of change. J. East Afr. Nat. Hist. 2008, 97, 3–17. [Google Scholar] [CrossRef]
- O’Connell, B.M.; Conkling, B.M.; Wilson, A.M.; Burrill, E.A.; Turner, J.A.; Pugh, S.A.; Christiansen, G.; Ridley, T.; Menlove, J. The Forest Inventory and Analysis Database: Database Description and User Guide Version 7.0 for Phase 2. Available online: https://www.fia.fs.fed.us/library/database-documentation/ (accessed on 3 January 2018).
- Forest Inventory and Analysis National Core Field Guide, Volume I: Field Data Collection Procedures for Phase 2 Plots, Version 6.0. Available online: https://www.fia.fs.fed.us/library/field-guides-methods-proc/docs/2013/Core%20FIA%20P2%20field%20guide_6-0_6_27_2013.pdf (accessed on 3 January 2018).
- Cleland, D.T.; Freeouf, J.A.; Keys, J.E.; Nowacki, G.J.; Carpenter, C.A.; McNab, W.H. Ecological Subregions: Sections and Subsections for the Conterminous United States; WO-GTR-76D; USDA Forest Service: Washington, DC, USA, 2007.
- Reams, G.A.; Smith, W.D.; Hansen, M.H.; Bechtold, W.A.; Roesch, F.A.; Moisen, G.G. The forest inventory and analysis sampling frame. In The Enhanced Forest Inventory and Analysis Program—National Sampling Design and Estimation Procedures; Bechtold, W.A., Patterson, P.L., Eds.; FS-SRS-80; USDA Forest Service Southern Research Station: Asheville, NC, USA, 2005; pp. 11–26. [Google Scholar]
- FIA DataMart. Available online: https://apps.fs.usda.gov/fia/datamart/ (accessed on 3 January 2018).
- Zar, J.H. Biostatistical Analysis, 3rd ed.; Prentice Hall: Upper Saddle River, NJ, USA, 1996; p. 662. [Google Scholar]
- Miles, P.D. Forest Inventory EVALIDator Web-Application Version 1.6.0.03. Available online: http://apps.fs.fed.us/Evalidator/evalidator.jsp (accessed on 23 March 2017).
- Goeking, S.A. Disentangling forest change from forest inventory change: A case study from the US Interior West. J. Forest. 2015, 113, 475–483. [Google Scholar] [CrossRef]
- Zar, J.H. Significance Testing of the Spearman Rank Correlation Coefficient. J. Am. Stat. Assoc. 1972, 67, 578–580. [Google Scholar] [CrossRef]
- Cleveland, W.S.; Devlin, S.J. Locally weighted regression: An approach to regression analysis by local fitting. J. Am. Stat. Assoc. 1988, 83, 596–610. [Google Scholar] [CrossRef]
- R Core Team. R: A Language and Environment for Statistical Computing; R Foundation for Statistical Computing: Vienna, Austria, 2013; Available online: https://www.R-project.org/ (accessed on 20 February 2018).
- James, G.; Witten, D.; Hastie, T.; Tibshirani, R. An Introduction to Statistical Learning; Springer: New York, NY, USA, 2013; 426p. [Google Scholar]
- Beardmore, T.; Loo, J.; McAfee, B.; Malouin, C.; Simpson, D. A survey of tree species of concern in Canada: The role for genetic conservation. For. Chron. 2006, 82, 351–363. [Google Scholar] [CrossRef]
- Hutchins, H.E.; Lanner, R.M. The central role of Clark’s nutcracker in the dispersal and establishment of Whitebark pine. Oecologia 1982, 55, 192–201. [Google Scholar] [CrossRef] [PubMed]
- McKinney, S.T.; Fiedler, C.E.; Tomback, D.F. Invasive pathogen threatens bird–pine mutualism: Implications for sustaining a high-elevation ecosystem. Ecol. Appl. 2009, 19, 597–607. [Google Scholar] [CrossRef] [PubMed]
- Lorenz, T.J.; Sullivan, K.A.; Bakian, A.V.; Aubry, C.A. Cache-site selection in Clark’s nutcracker (Nucifraga columbiana). Auk 2011, 128, 237–247. [Google Scholar] [CrossRef]
- Leirfallom, S.B.; Keane, R.E.; Tomback, D.F.; Dobrowski, S.Z. The effects of seed source health on whitebark pine (Pinus albicaulis) regeneration density after wildfire. Can. J. For. Res. 2015, 45, 1597–1606. [Google Scholar] [CrossRef]
- Tomback, D.F.; Sund, S.K.; Hoffman, L.A. Postfire regeneration of Pinus albicaulis: Height–age relationships, age structure, and microsite characteristics. Can. J. For. Res. 1993, 23, 113–119. [Google Scholar] [CrossRef]
- Perkins, J.L. Fire enhances whitebark pine seedling establishment, survival, and growth. Fire Ecol. 2015, 11, 84–99. [Google Scholar] [CrossRef]
- Mahalovich, M.F.; Hipkins, V.D. Molecular genetic variation in whitebark pine (Pinus albicaulis Engelm.) in the Inland West. In The Future of High-Elevation, Five-Needle white Pines in Western North America: Proceedings of the High Five Symposium; Keane, R.E., Tomback, D.F., Murray, M.P., Smith, C.M., Eds.; Proceedings RMRS-P-63; USDA Forest Service Rocky Mountain Research Station: Fort Collins, CO, USA, 2011; pp. 118–132. [Google Scholar]
- Kinloch, B.B., Jr. White pine blister rust in North America: Past and prognosis. Phytopathology 2003, 93, 1044–1047. [Google Scholar] [CrossRef] [PubMed]
- Campbell, E.M.; Antos, J.A. Postfire succession in Pinus albicualis—Abies lasiocarpa forests of southern British Columbia. Can. J. Bot. 2003, 81, 383–397. [Google Scholar] [CrossRef]
Figure 1.
Locations of 1406 forest inventory plots (black dots) with live or dead whitebark pines in the western US, with percentage of standing whitebark pine trees ≥2.54 cm diameter at breast height that are alive within each eco-province (aggregated from the ecological subsections of Cleland et al. 2007 [19]), based on plots measured between 2007 and 2016. Provinces in the central Great Basin are not shown due to small sample size. Plot locations are approximate.

Figure 2.
Stand-level basal area (BA) of whitebark pine (WP) trees from 1510 stands, by dominant forest type: (a) basal area of live whitebark pine trees; (b) basal area of live whitebark pine trees as a percentage of basal area of all live trees; (c) basal area of dead whitebark pine trees; and (d) basal area of live and dead whitebark pine trees as a percentage of basal area of all trees. Forest types are abbreviated as follows: DF = Douglas-fir (n = 120), ES = Engelmann spruce (n = 47), ES/SF = Engelmann spruce/subalpine fir (n = 313), LP = lodgepole pine (n = 362), NS = nonstocked (n = 34), other = aggregate of all types represented by <30 plots each (n = 75), SF = subalpine fir (n = 343), and WP = whitebark pine (n = 216). Horizontal lines within boxes represent medians. Upper and lower box boundaries represent 1st and 3rd quartiles (25th and 75th percentiles, respectively). Horizontal lines at ends of vertical dashed lines represent 1.5× the interquartile range, and circles represent plots beyond 1.5× the interquartile range.

Figure 3.
Size-class distributions of live and dead whitebark pine trees with DBH ≥12.7 cm in the western US, as estimated at the population scale, from Forest Inventory and Analysis data [23] for two time periods (a) 1999, and (b) 2016. Y-axes represent the proportion of all trees in each time period. Error bars represent +/− one standard error [20].

Figure 4.
Population estimates of the numbers of (a) live whitebark pine seedlings and saplings (n = 1142 plots), (b) live whitebark pine trees (n = 1142 plots), and (c) dead whitebark pine trees (n = 1078 plots) in the western US in major forest types, by diameter class. Forest types are abbreviated: WP = whitebark pine, LP = lodgepole pine, ES/SF = Engelmann spruce/subalpine fir, SF = subalpine fir, DF = Douglas-fir, ES = Engelmann spruce, and NS = nonstocked. Forest type symbols are the same in all the panels; y axes are scaled differently in each panel. The forest types shown here account for more than 98% of all whitebark pine trees in each of the following categories: dead trees at least 12.54 cm DBH., live trees at least 2.54 cm DBH., and live seedlings at least 15.24 cm tall. Error bars represent +/− one standard error [20]. Note that the number of plots used for live vs. dead tree estimates differ due to spatial–temporal differences in sampling protocols for dead trees; population-wide estimates account for these differences [17].

Figure 5.
Population estimates of the mean annual volume of gross growth and mortality of whitebark pine trees by diameter class, based on trees measured between 2005 and 2015 (n = 404 plots; measurement years vary by state) among all forest types. Error bars represent +/− one standard error [20].
Figure 5.
Population estimates of the mean annual volume of gross growth and mortality of whitebark pine trees by diameter class, based on trees measured between 2005 and 2015 (n = 404 plots; measurement years vary by state) among all forest types. Error bars represent +/− one standard error [20].

Figure 6.
Mean annual volume of gross growth (dark bars) and mortality (light bars) of whitebark pine trees by diameter class, based on trees measured between 2005 and 2015 (n = 341 plots; measurement years vary by state) within (a) the whitebark pine forest type (WP; n = 107 plots), (b) the lodgepole pine forest type (LP; n = 87 plots), (c) the Engelmann spruce/subalpine fir forest type (ES/SF; n = 77 plots), and (d) the subalpine fir forest type (SF; n = 70 plots). Note different scales of y-axes. Error bars represent +/− one standard error [20].


Figure 7.
Relationship between the standardized mean annual mortality and growth rates (%/year; shown above as mortality and growth, respectively) of whitebark pine trees and several stand-level indicators at 1406 plots: basal area of all species (stand_BA, in m2/ha), whitebark pine basal area as a percentage of stand basal area (WBP_BA, in %), tree density of all species (tree per hectare, indicated by stand_TPH, in stems/ha), density of whitebark pine trees as a percentage of total tree density (WBP_TPH, in %), and mean diameter at breast height of all species (stand_DBH, in cm). Standardized mean annual mortality and growth rates were calculated as the mean annual mortality and growth volumes per year per unit area, divided by the plot-level volume of whitebark pine trees per unit area. P-values are associated with the Spearman correlation coefficient (rho).


Table 1.
Summary of variables used in this study, including scale (tree, stand, or plot level), units, and source.
Table 1.
Summary of variables used in this study, including scale (tree, stand, or plot level), units, and source.
| Variable | Scale | Units | Source |
|---|---|---|---|
| Tree species | Tree | -- | SPCD in table TREE |
| Tree diameter | Tree | cm | DIA in table TREE |
| Tree live/dead status | Tree | -- | STATUS_CD in table TREE |
| Forest type | Stand | -- | FORTYPCD in table COND |
| Mean tree diameter | Stand | cm | Calc: f (tree diameter) |
| Total basal area of all species | Stand | m2 ha−1 | Calc: f (tree diameter) |
| Whitebark pine basal area/total basal area | Stand | % | Calc: f (tree species, tree diameter) |
| Total stem density of all species | Stand | trees∙ha−1 | Calc: f (TPA_UNADJ in table TREE) |
| Whitebark pine stem density/total stem density | Stand | % | Calc: f (tree species, TPA_UNADJ in table TREE) |
| Mean annual mortality | Stand | m3 ha−1 year−1 | Calc: f (FMORTCFAL, TPAMORT_UNADJ in table TREE) |
| Mean annual annual net growth | Stand | m3 ha−1 year−1 | Calc: f (FGROWCFAL, TPAGROW_UNADJ in table TREE) |
| Mean annual gross growth | Stand | m3 ha−1 year−1 | Calc: f (mean annual net growth, mean annual mortality) |
| Standardized mortality | Stand | % year−1 | Calc: f (mean annual mortality, VOLCFNET in table TREE) |
| Standarized growth | Stand | % year−1 | Calc: f (mean annual gross growth, VOLCFNET in table TREE) |
| Eco-province | Plot | -- | Calc: f (ECOSUBCD in table PLOT) |
All variables from the Forest Inventory and Analysis (FIA) database are shown in capital letters; see FIA database documentation [17] for additional information. Calculated variables are shown as a function of other variables with the prefix “Calc”. Unitless variables are indicated by “--“ in the Units column.
Table 2.
Area with a whitebark pine component (live seedling ≥15.2 cm tall and <2.54 cm diameter at breast height (DBH), live tree ≥ 2.54 cm DBH, or dead tree ≥ 12.7 cm DBH), by forest type, and proportion of area in each forest type and in each US state.
Table 2.
Area with a whitebark pine component (live seedling ≥15.2 cm tall and <2.54 cm diameter at breast height (DBH), live tree ≥ 2.54 cm DBH, or dead tree ≥ 12.7 cm DBH), by forest type, and proportion of area in each forest type and in each US state.
| Forest Type | Area (ha) | CA | ID | MT | NV | OR | WA | WY |
|---|---|---|---|---|---|---|---|---|
| Douglas-fir | 323,790 | 0.00 | 0.52 | 0.31 | 0.00 | 0.00 | 0.07 | 0.09 |
| Engelmann spruce | 140,083 | 0.00 | 0.08 | 0.25 | 0.00 | 0.01 | 0.04 | 0.62 |
| Engelmann spruce/subalpine fir | 840,285 | 0.00 | 0.16 | 0.51 | 0.00 | 0.02 | 0.03 | 0.28 |
| Lodgepole pine | 952,007 | 0.06 | 0.17 | 0.42 | 0.00 | 0.05 | 0.02 | 0.29 |
| Nonstocked | 232,906 | 0.00 | 0.41 | 0.42 | 0.00 | 0.01 | 0.04 | 0.12 |
| Subalpine fir | 804,461 | 0.00 | 0.37 | 0.38 | 0.00 | 0.03 | 0.07 | 0.15 |
| Whitebark pine | 629,401 | 0.16 | 0.13 | 0.38 | 0.01 | 0.03 | 0.04 | 0.26 |
| All types covering < 100,000 ha | 205,645 | 0.10 | 0.06 | 0.18 | 0.02 | 0.26 | 0.27 | 0.10 |
| Total | 4,128,578 | 0.04 | 0.23 | 0.40 | 0.00 | 0.04 | 0.05 | 0.23 |
(Abbreviations as follows: CA = California, ID = Idaho, MT = Montana, NV = Nevada, OR = Oregon, WA = Washington, and WY = Wyoming). Forest types whose whitebark pine component covers < 100,000 ha are aggregated.
Table 3.
Population estimates of the number of whitebark pine trees by major forest type in the western US. Forest types whose whitebark pine component covers <100,000 ha are not shown but included in total (“All types”).
Table 3.
Population estimates of the number of whitebark pine trees by major forest type in the western US. Forest types whose whitebark pine component covers <100,000 ha are not shown but included in total (“All types”).
| Forest Type 1 | Seedlings 2 | Saplings 3 | Live Trees 4 | Dead Trees 4 |
|---|---|---|---|---|
| DF | 78,083,238 | 26,874,601 | 6,688,873 | 17,058,244 |
| ES | 54,130,800 | 15,069,681 | 5,766,980 | 10,112,510 |
| ES/SF | 537,944,279 | 153,556,743 | 51,739,482 | 74,710,866 |
| LP | 1,111,981,547 | 162,479,371 | 28,096,009 | 23,707,011 |
| NS | 9,489,166 | 2,188,641 | 2,188,642 | 26,884,162 |
| SF | 411,773,363 | 113,610,271 | 29,361,035 | 66,516,853 |
| WP | 870,792,088 | 483,766,807 | 162,446,784 | 83,322,974 |
| All types | 3,134,662,520 | 975,173,510 | 291,634,115 | 307,623,262 |
1 Forest types abbreviated as: DF = Douglas-fir, ES = Engelmann spruce, ES/SF = Engelmann spruce/subalpine fir, LP = lodgepole pine, NS = nonstocked, SF = subalpine fir, and WP = whitebark pine; forest types with less than 100,000 ha are omitted. 2 Seedlings are defined as live individuals ≥15.25 cm tall and <2.54 cm DBH. 3DBH = diameter at breast height. 3 Saplings are defined as live individuals ≥2.54 cm DBH and <12.7 cm DBH. 4 Live and dead trees include only individuals with ≥12.7 cm DBH.
© 2018 by the authors. Licensee MDPI, Basel, Switzerland. This article is an open access article distributed under the terms and conditions of the Creative Commons Attribution (CC BY) license (http://creativecommons.org/licenses/by/4.0/).
Share and Cite
MDPI and ACS Style
Goeking, S.A.; Izlar, D.K. Pinus albicaulis Engelm. (Whitebark Pine) in Mixed-Species Stands throughout Its US Range: Broad-Scale Indicators of Extent and Recent Decline. Forests 2018, 9, 131. https://doi.org/10.3390/f9030131
AMA Style
Goeking SA, Izlar DK. Pinus albicaulis Engelm. (Whitebark Pine) in Mixed-Species Stands throughout Its US Range: Broad-Scale Indicators of Extent and Recent Decline. Forests. 2018; 9(3):131. https://doi.org/10.3390/f9030131
Chicago/Turabian StyleGoeking, Sara A., and Deborah Kay Izlar. 2018. "Pinus albicaulis Engelm. (Whitebark Pine) in Mixed-Species Stands throughout Its US Range: Broad-Scale Indicators of Extent and Recent Decline" Forests 9, no. 3: 131. https://doi.org/10.3390/f9030131
Note that from the first issue of 2016, this journal uses article numbers instead of page numbers. See further details here.