Nitrogen Alters Initial Growth, Fine-Root Biomass and Soil Organic Matter Properties of a Eucalyptus dunnii Maiden Plantation in a Recently Afforested Grassland in Southern Brazil

 , ,
, ,  ,
,
Abstract
:1. Introduction
2. Materials and Methods
2.1. Site Description and Experimental Design
2.2. Variables Assessed
2.2.1. Tree Growth
2.2.2. Fine-Root Biomass and Architecture
2.2.3. SOM Properties
2.3. Data Analysis
3. Results
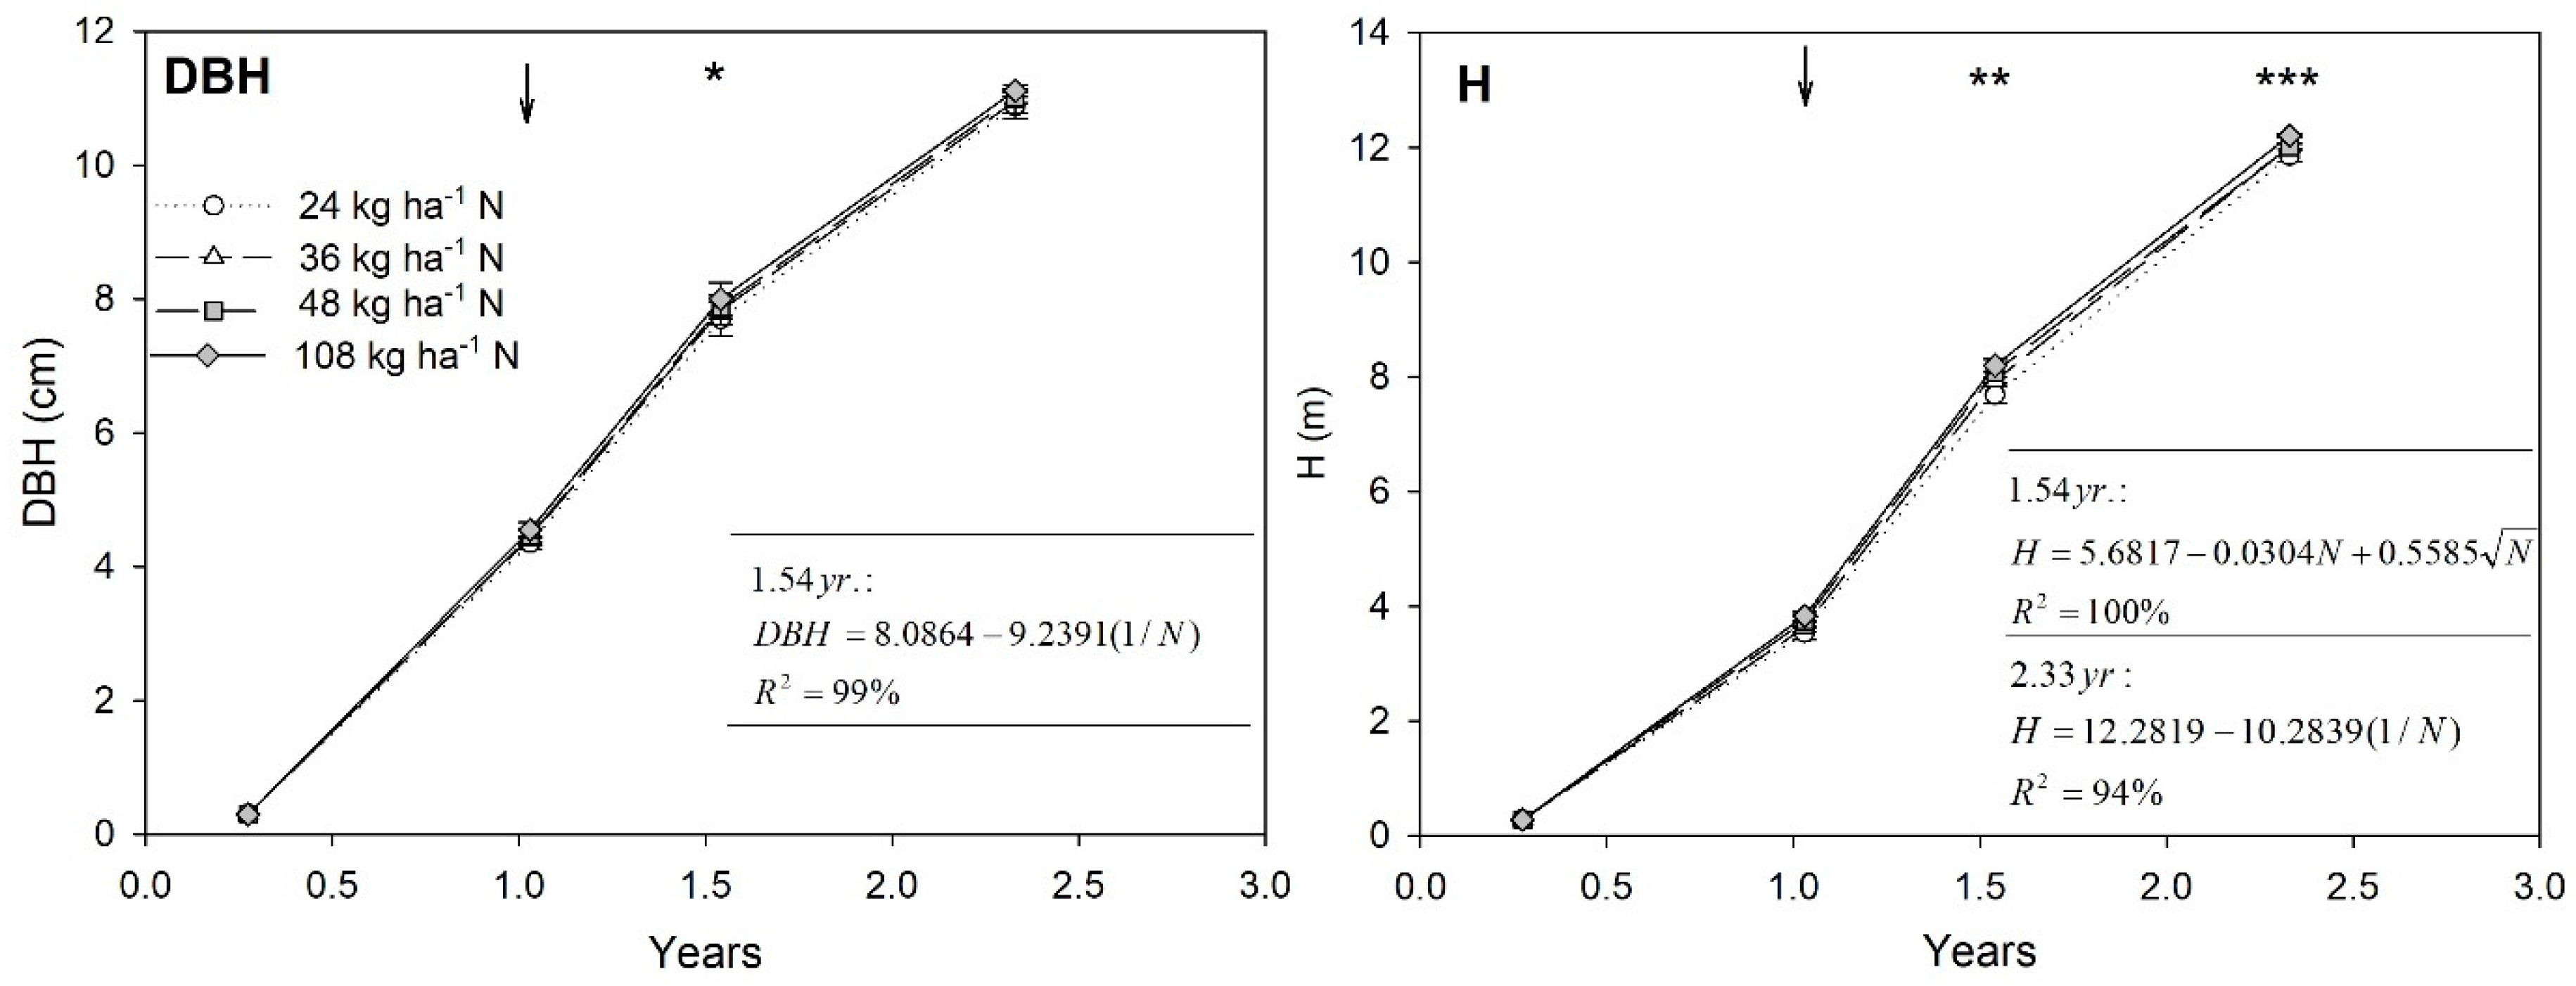
3.1. Tree Growth
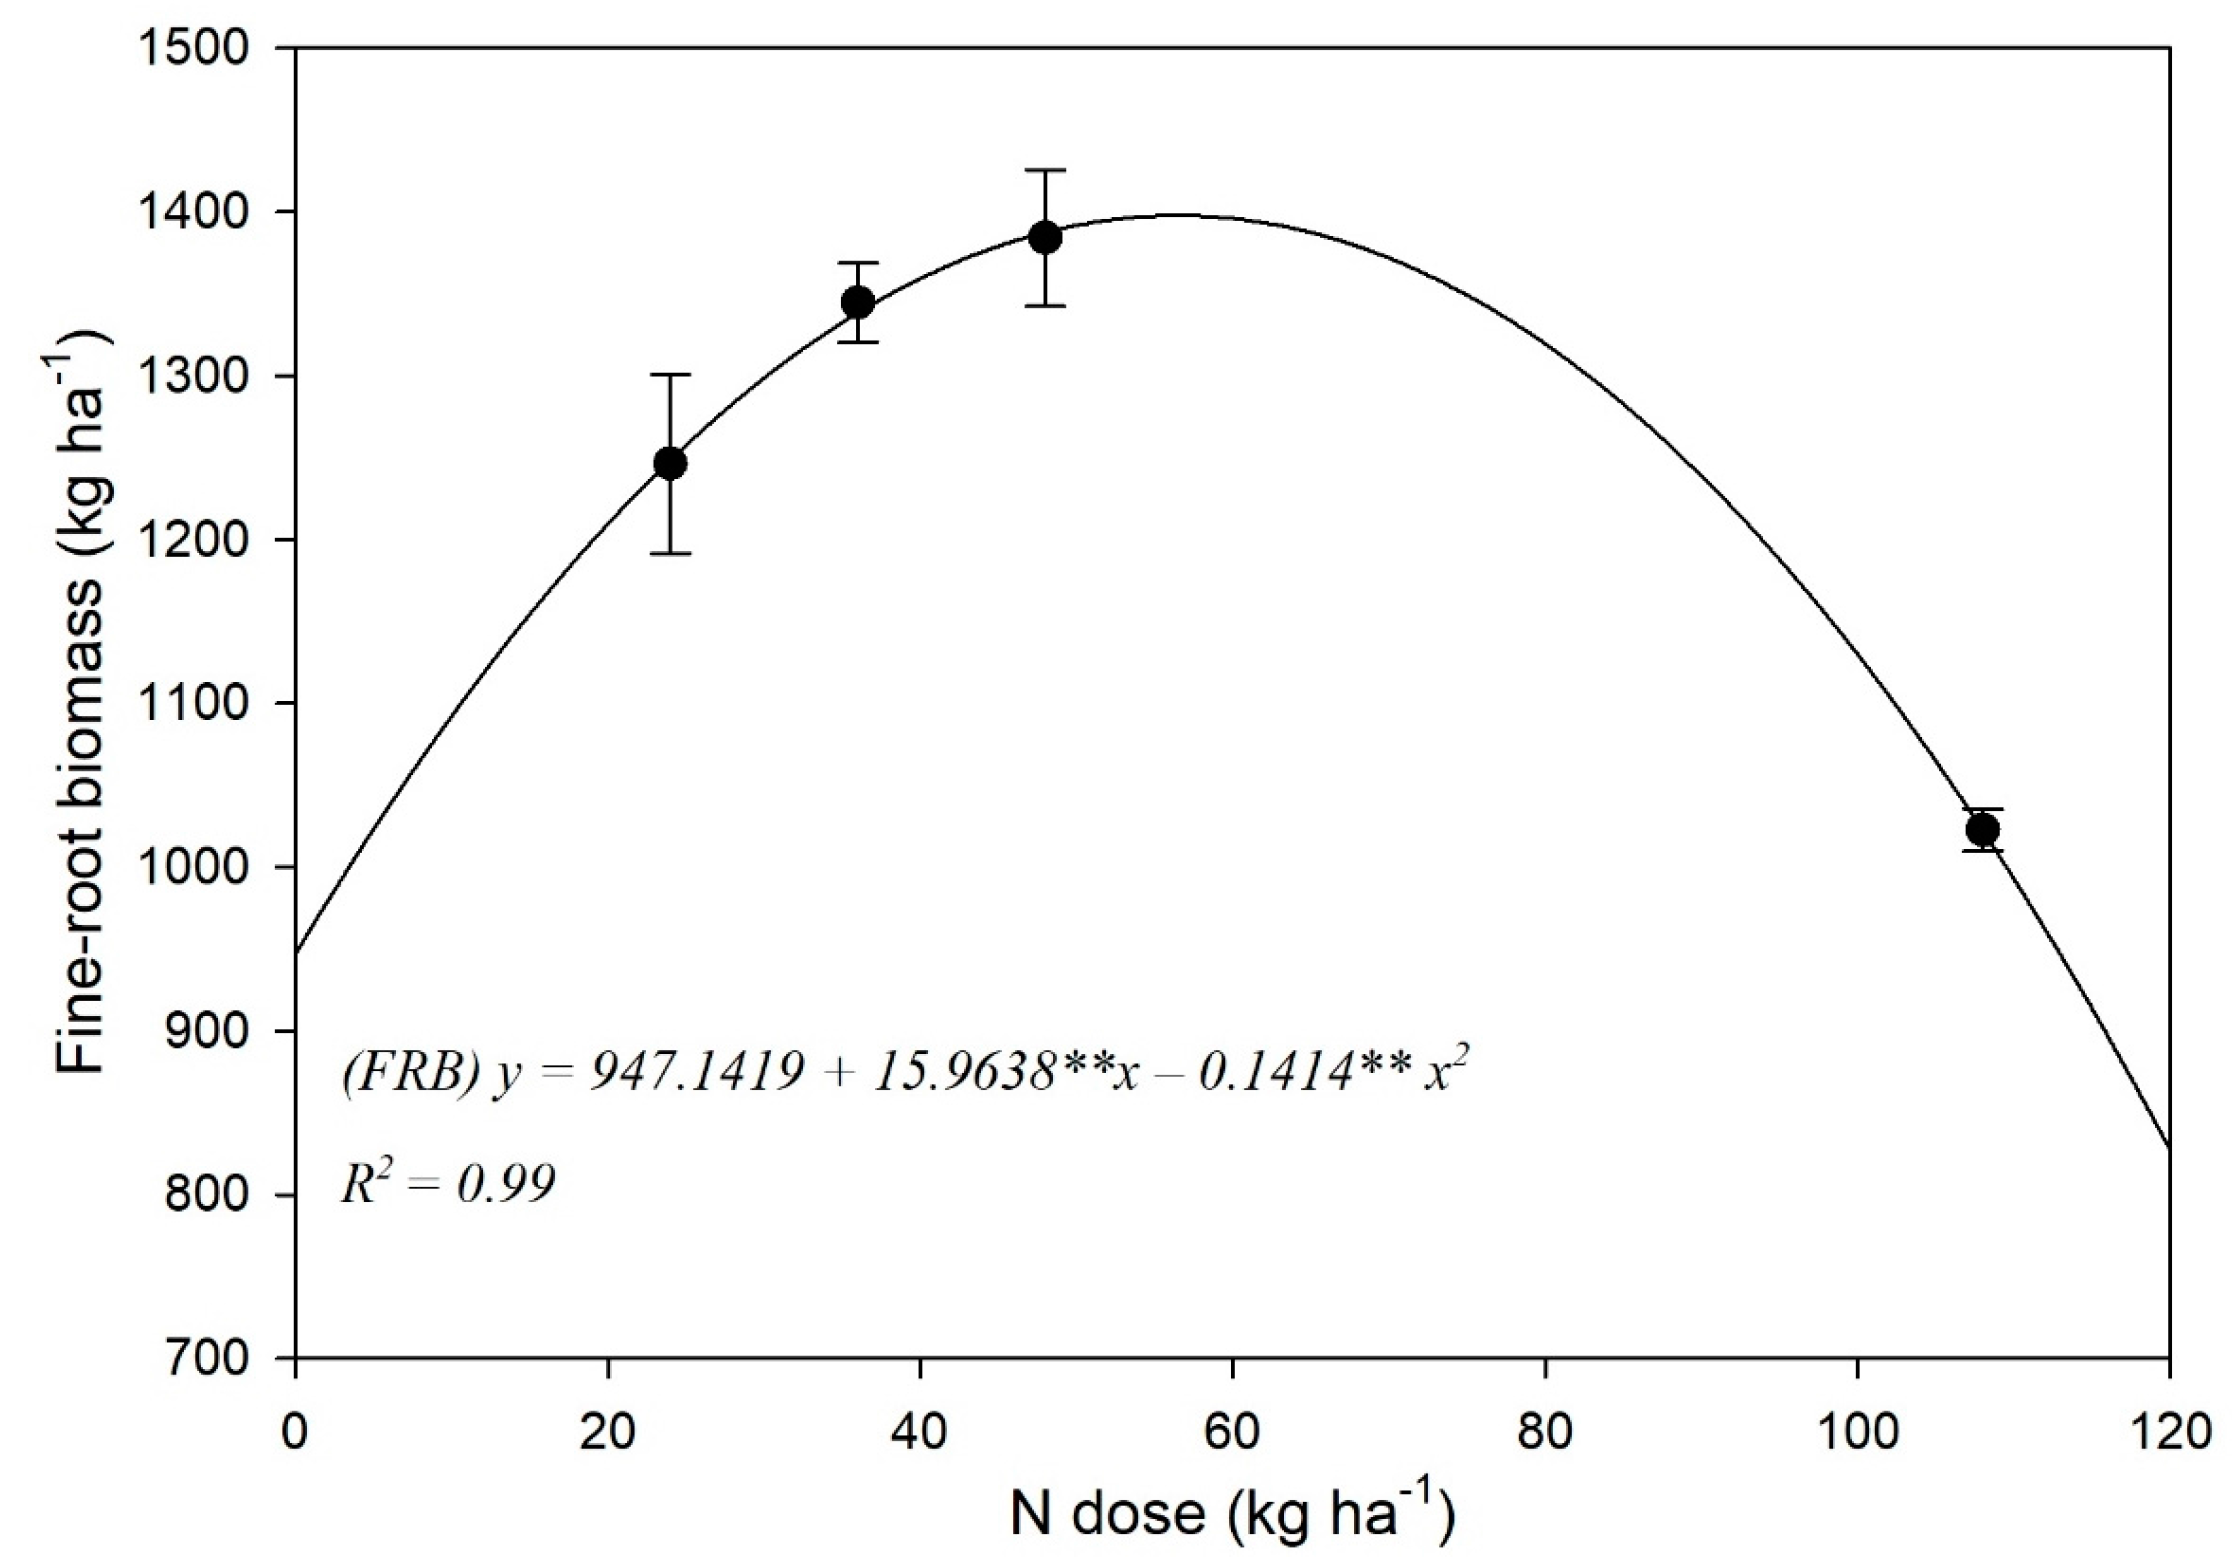
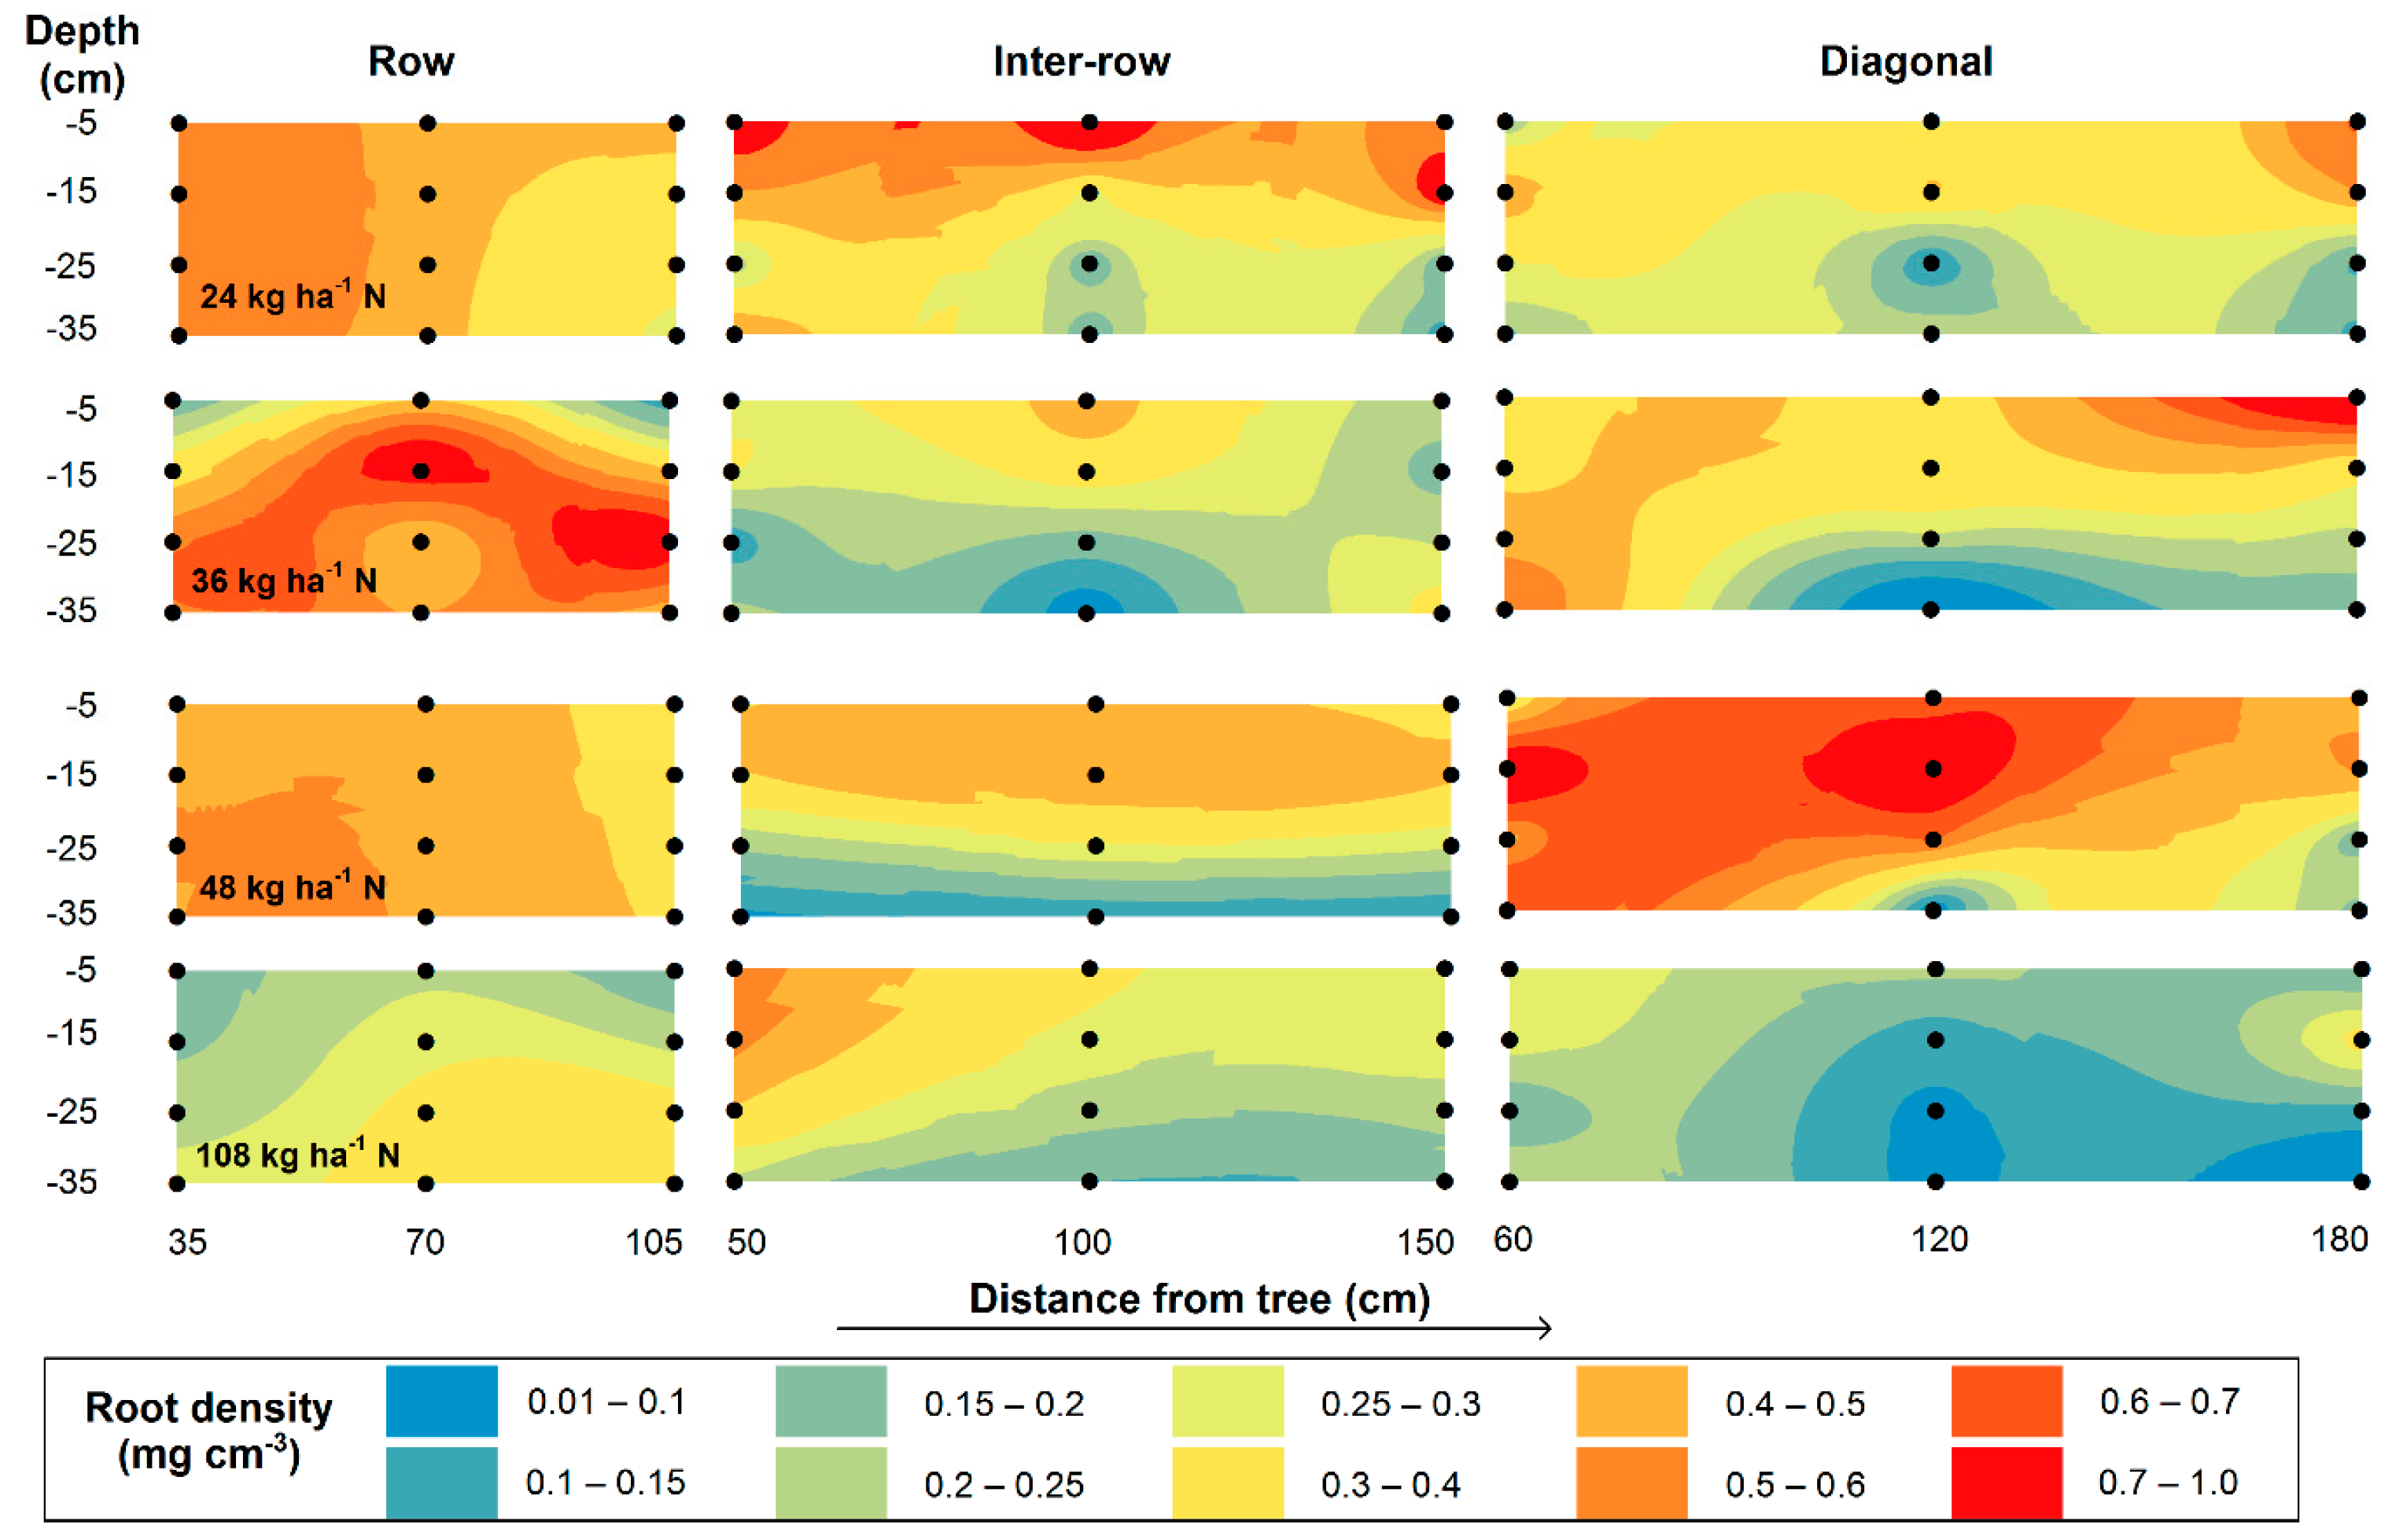
3.2. Fine-Root Biomass (FRB) and Spatial Distribution
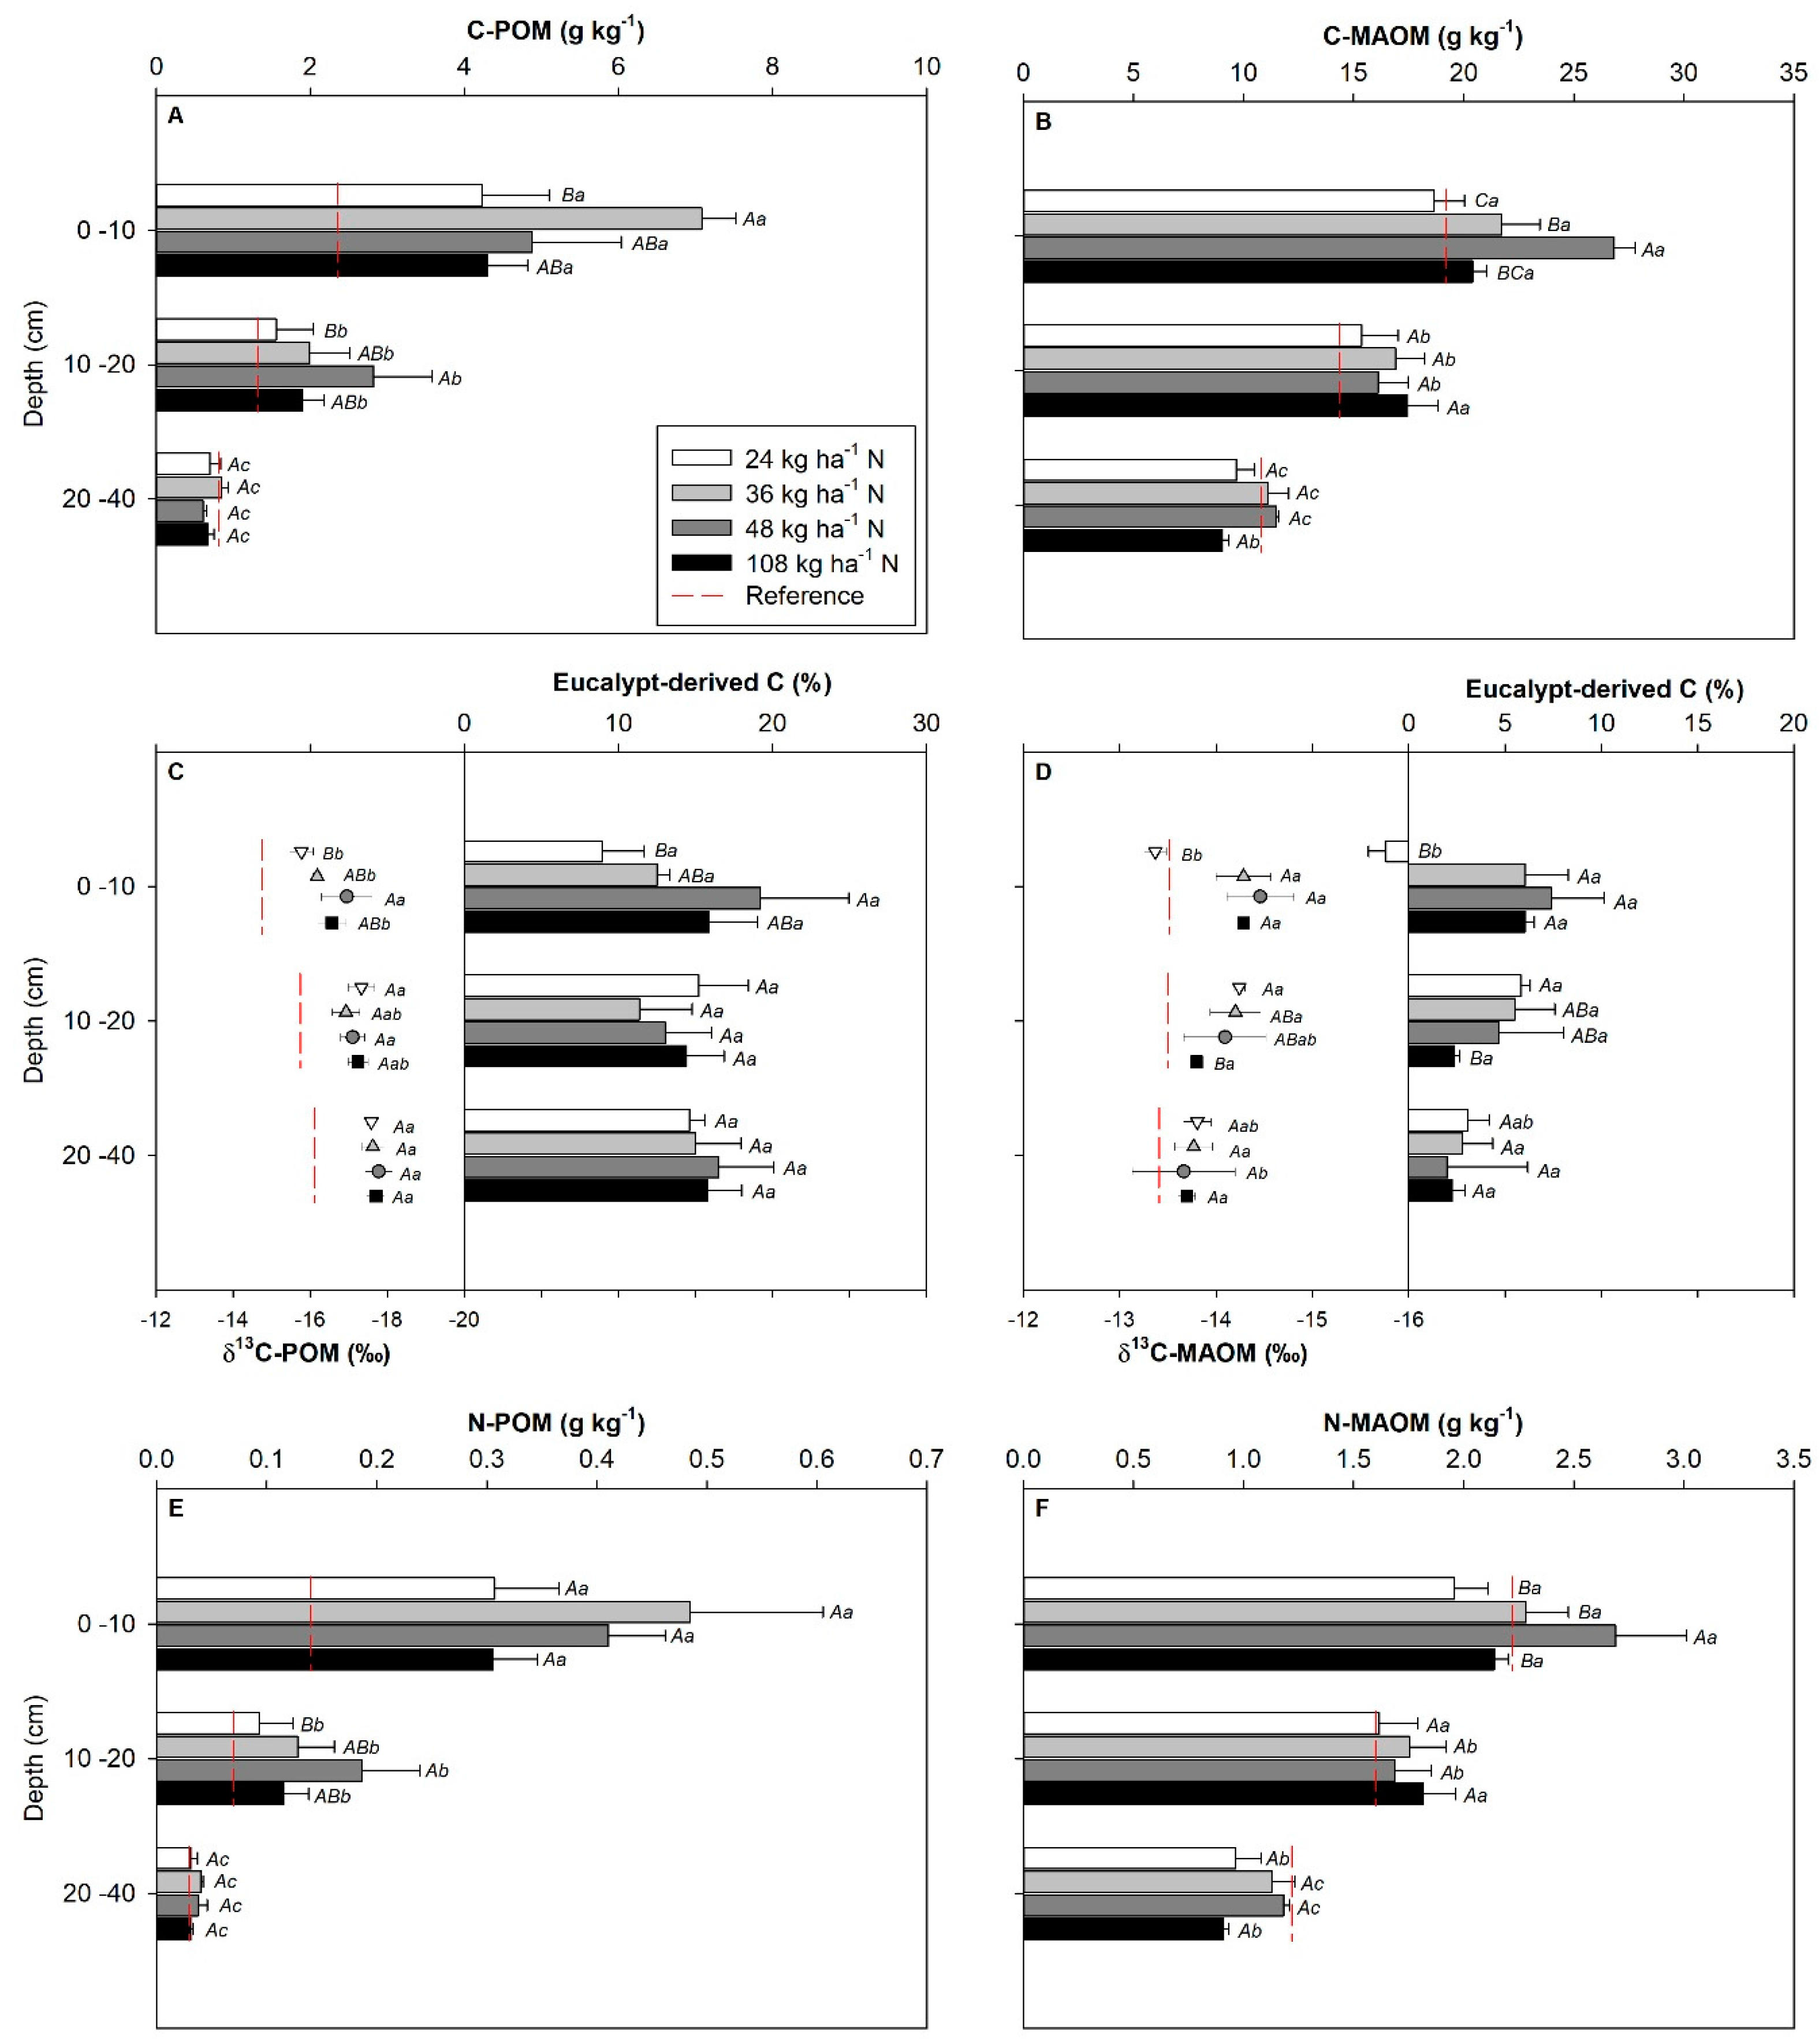
3.3. C and N Associated with SOM Fractions as Affected by N Level
4. Discussion
4.1. Tree Growth
4.2. Fine-Root Biomass and Spatial Distribution
4.3. SOM Properties as Affected by N Levels
5. Conclusions
Supplementary Materials
Acknowledgments
Author Contributions
Conflicts of Interest
References
- Indústria Brasileira de Árvores (IBÁ). Brazilian Tree Industry Report; IBÁ: Brasília, DF, Brazil, 2015; p. 77. [Google Scholar]
- Associação Brasileira de Produtores de Florestas Plantadas (ABRAF). Anuário Estatístico; ABRAF: Brasília, DF, Brazil, 2013; p. 148. [Google Scholar]
- Alvares, C.A.; Stape, J.L.; Sentelhas, P.C.; Gonçalves, J.L.M.; Sparovek, G. Köppen’s climate classification map for Brazil. Meteorol. Z. 2013, 22, 711–728. [Google Scholar] [CrossRef]
- Gonçalves, J.L.M.; Alvares, C.A.; Higa, A.R.; Silva, L.D.; Alfenas, A.C.; Stahl, J.; de Barros Ferraz, S.F.; Lima, W.D.P.; Brancalion, P.H.S.; Hubner, A.; et al. Integrating genetic and silvicultural strategies to minimize abiotic and biotic constraints in Brazilian eucalypt plantations. For. Ecol. Manag. 2013, 301, 6–27. [Google Scholar] [CrossRef]
- Jovanovic, T.; Arnold, R.; Booth, T. Determining the climatic suitability of Eucalyptus dunnii for plantations in Australia, China and Central and South America. New For. 2000, 19, 215–226. [Google Scholar] [CrossRef]
- Floriani, M.M.P.; Steffens, C.A.; Chaves, D.M. Rustificação de plantas de Eucalyptus dunnii Maiden e a relação entre as concentrações de carboidratos solúveis totais e de prolina foliar e a tolerância ao frio. Rev. Árvore 2011, 35, 21–29. [Google Scholar] [CrossRef]
- Hernández, J.; del Pino, A.; Salvo, L.; Arrarte, G. Nutrient export and harvest residue decomposition patterns of a Eucalyptus dunnii Maiden plantation in temperate climate of Uruguay. For. Ecol. Manag. 2009, 258, 92–99. [Google Scholar] [CrossRef]
- Guimaraes, C.C.; Schumacher, M.V.; Witshoreck, R.; Souza, H.P.; Santo, J.C. Biomassa e nutrientes em povoamento de Eucalyptus dunnii Maiden no Pampa Gaúcho. Rev. Árvore 2015, 39, 873–882. [Google Scholar] [CrossRef]
- Higa, R.C.V.; Iga, A.R.; Trevisan, R. Resistência e resiliência a geadas em Eucalyptus dunnii Maiden plantados em Campo do Tenente, PR. Embrapa Florestas Artigo Periód. Indexado 2000, 40, 67–76. [Google Scholar]
- Stape, J.L.; Binkley, D.; Ryan, M.G.; Fonseca, S.; Loos, R.A.; Takahashi, E.N.; Silva, C.R.; Silva, S.R.; Hakamada, R.E.; Ferreira, J.M. The Brazil Eucalyptus Potential Productivity Project: Influence of water, nutrients and stand uniformity on wood production. For. Ecol. Manag. 2010, 259, 1684–1694. [Google Scholar] [CrossRef]
- Gonçalves, J.L.M.; Stape, J.L.; Laclau, J.P.; Bouillet, J.P.; Ranger, J. Assessing the effects of early silvicultural management on long-term site productivity of fast-growing eucalypt plantations: The Brazilian experience. South. For. 2008, 70, 105–118. [Google Scholar] [CrossRef]
- Stape, J.L.; Binkley, D.; Jacob, W.S.; Takahashi, E.N. A twin-plot approach to determine nutrient limitation and potential productivity in Eucalyptus plantations at landscape scales in Brazil. For. Ecol. Manag. 2006, 223, 358–362. [Google Scholar] [CrossRef]
- Barros, N.F.; Comerford, N.B. Sustentabilidade da produção de florestas plantadas na região tropical. In Tópicos em Ciência do Solo; Alvarez, V.H., Schaefer, C.E., Barros, N.F., Mello, J.W.V., Costa, L.M., Eds.; Sociedade Brasileira de Ciência do Solo: Viçosa, MG, Brazil, 2002; pp. 487–592. [Google Scholar]
- Pulito, A.P.; Gonçalves, J.L.M.; Smethurst, P.J.; Junior, J.C.A.; Alvares, C.A.; Rocha, J.H.T.; Hübner, A.; Moraes, L.F.; Miranda, A.C.; Kamogawa, M.Y.; et al. Available nitrogen and responses to nitrogen fertilizer in Brazilian eucalypt plantations on soils of contrasting texture. Forests 2015, 6, 973–991. [Google Scholar] [CrossRef]
- De Jesus, G.L.; de Barros, N.F.; Ribeiro da Silva, I.; Lima Neves, J.C.; Pinheiro Henriques, E.; Campos Lima, V.; Vaz Fernandes, L.; Barros Soares, E.M. Doses e fontes de nitrogênio na produtividade do eucalipto e nas frações da matéria orgânica em solo da região do cerrado de Minas Gerais. Rev. Bras. Ciênc. Solo 2012, 36, 201–214. [Google Scholar] [CrossRef]
- Da Silva, P.H.M.; Poggiani, F.; Libardi, P.L.; Gonçalves, A.N. Fertilizer management of eucalypt plantations on sandy soil in Brazil: Initial growth and nutrient cycling. For. Ecol. Manag. 2013, 301, 67–78. [Google Scholar] [CrossRef]
- Melo, E.A.; Gonçalves, J.L.; Rocha, J.H.; Hakamada, R.E.; Bazani, J.H.; Wenzel, A.V.; Arthur, J.C.; Borges, J.S.; Malheiros, R.; Lemos, C.C. Responses of clonal eucalypt plantations to N, P and K fertilizer application in different edaphoclimatic conditions. Forests 2016, 7, 2. [Google Scholar] [CrossRef]
- Gazola, R.N.; Buzetti, S.; Teixeira Filho, M.C.M.; Dinalli, R.P.; Moraes, M.L.T.; Celestrino, T.S.; Silva, P.H.M.; Dupas, E. Doses of N, P and K in the cultivation of eucalyptus in soil originally under Cerrado vegetation. Semin. Ciênc. Agrár. 2015, 36, 1895–1912. [Google Scholar] [CrossRef]
- Smethurst, P.; Holz, G.; Moroni, M.; Baillie, C. Nitrogen management in Eucalyptus nitens plantations. For. Ecol. Manag. 2004, 193, 63–80. [Google Scholar] [CrossRef]
- Smethurst, P.; Baillie, C.; Cherry, M.; Holz, G. Fertilizer effects on LAI and growth of four Eucalyptus nitens plantations. For. Ecol. Manag. 2003, 176, 531–542. [Google Scholar] [CrossRef]
- Gonçalves, J.L.M.; Stape, J.L.; Laclau, J.P.; Smethurst, P.; Gava, J.L. Silvicultural effects on the productivity and wood quality of eucalypt plantations. For. Ecol. Manag. 2004, 193, 45–61. [Google Scholar] [CrossRef]
- Costa, G.S.; Gama-Rodrigues, A.C.; Cunha, G.D. Decomposição e liberação de nutrientes da serapilheira foliar em povoamentos de Eucalyptus grandis no norte fluminense. Rev. Árvore 2005, 29, 563–570. [Google Scholar] [CrossRef]
- Versini, A.; Nouvellon, Y.; Laclau, J.P.; Kinana, A.; Mareschal, L.; Zeller, B.; Ranger, J.; Epron, D. The manipulation of organic residues affects tree growth and heterotrophic CO2 efflux in a tropical Eucalyptus plantation. For. Ecol. Manag. 2013, 301, 79–88. [Google Scholar] [CrossRef]
- Jourdan, C.; Silva, E.V.; Gonçalves, J.L.M.; Ranger, J.; Moreira, R.M.; Laclau, J.-P. Fine root production and turnover in Brazilian Eucalyptus plantations under contrasting nitrogen fertilization regimes. For. Ecol. Manag. 2008, 256, 396–404. [Google Scholar] [CrossRef]
- Neff, J.C.; Townsend, A.R.; Gleixner, G.; Lehman, S.J.; Turnbull, J.; Bowman, W.D. Variable effects of nitrogen additions on the stability and turnover of soil carbon. Nature 2002, 419, 915–917. [Google Scholar] [CrossRef] [PubMed]
- Moran, K.K.; Six, J.; Horwath, W.R.; van Kessel, C. Role of mineral-nitrogen in residue decomposition and stable soil organic matter formation. Soil Sci. Soc. Am. J. 2005, 69, 1730–1736. [Google Scholar] [CrossRef]
- Dijkstra, F.A.; Hobbie, S.E.; Knops, J.M.H.; Reich, P.B. Nitrogen deposition and plant species interact to influence soil carbon stabilization. Ecol. Lett. 2004, 7, 1192–1198. [Google Scholar] [CrossRef]
- Cook, R.L.; Binkley, D.; Stape, J.L. Eucalyptus plantation effects on soil carbon after 20 years and three rotations in Brazil. For. Ecol. Manag. 2016, 359, 92–98. [Google Scholar] [CrossRef]
- Lima, A.M.N.; Silva, I.R.; Neves, J.C.L.; Novais, R.F.; Barros, N.F.; Mendonça, E.S.; Smyth, T.J.; Moreira, M.S.; Leite, F.P. Soil organic carbon dynamics following afforestation of degraded pastures with eucalyptus in southeastern Brazil. For. Ecol. Manag. 2006, 235, 219–231. [Google Scholar] [CrossRef]
- Santana, G.S.; Knicker, H.; González-Vila, F.J.; González-Pérez, J.A.; Dick, D.P. The impact of exotic forest plantations on the chemical composition of soil organic matter in Southern Brazil as assessed by Py–GC/MS and lipid extracts study. Geoderma Reg. 2015, 4, 11–19. [Google Scholar] [CrossRef]
- Li, D.; Niu, S.; Luo, Y. Global patterns of the dynamics of soil carbon and nitrogen stocks following afforestation: A meta-analysis. New Phytol. 2012, 195, 172–181. [Google Scholar] [CrossRef] [PubMed]
- Soares, E.M.B.; Silva, I.R.; De Novais, R.F.; Hu, Y.-Y.; Schmidt-Rohr, K. Alterations in molecular composition of humic substances from eucalypt plantation soils assessed by 13C-NMR spectroscopy. Soil Sci. Soc. Am. J. 2013, 77, 293–306. [Google Scholar] [CrossRef]
- Fialho, R.C.; Zinn, Y.L. Changes in soil organic carbon under Eucalyptus plantations in Brazil: A comparative analysis. Land Degrad. Dev. 2014, 25, 428–437. [Google Scholar] [CrossRef]
- Roesch, L.F.W.; Vieira, F.C.B.; Pereira, V.A.; Schünemann, A.L.; Teixeira, I.F.; Senna, A.J.T.; Stefenon, V.M. The Brazilian Pampa: A fragile biome. Diversity 2009, 1, 182–198. [Google Scholar] [CrossRef]
- Cambardella, C.A.; Elliott, E.T. Particulate soil organic-matter changes across a grassland cultivation sequence. Soil Sci. Soc. Am. J. 1992, 56, 777. [Google Scholar] [CrossRef]
- Lehmann, J.; da Silva Cravo, M.; Zech, W. Organic matter stabilization in a Xanthic Ferralsol of the central Amazon as affected by single trees: Chemical characterization of density, aggregate, and particle size fractions. Geoderma 2001, 99, 147–168. [Google Scholar] [CrossRef]
- Lemos, R.C.; Azolim, M.A.D.; Abrão, P.U.R.; Santos, M.L.C. Levantamento de Reconhecimento dos Solos do Estado do Rio Grande do Sul; MAPA—Ministério da Agricultura, Boletim Técnico no 3: Recife, PE, Brazil, 1973; p. 431. [Google Scholar]
- Soil Survey Staff. Soil Taxonomy: A Basic System of Soil Classification for Making and Interpreting Soil Surveys, 2nd ed.; U.S. Department of Agriculture Handbook # 436; Natural Resources Conservation Services: Washington, DC, USA, 1999.
- Santos, H.; Jacomine, P.; Anjos, L.; Oliveira, V.; Oliveira, J.; Coelho, M.; Lumbreras, J.; Cunha, T. Sistema Brasileiro de Classificação de Solos, 3rd ed.; Embrapa: Rio de Janeiro, Brazil, 2013. [Google Scholar]
- Ruiz, H.A. Incremento da exatidão da análise granulométrica do solo por meio da coleta da suspensão (Silte + Argila). Rev. Bras. Ciênc. Solo 2005, 29, 297–300. [Google Scholar] [CrossRef]
- Assman, E. The Principles of Forest Yield Study; Pergamon Press: Oxford, NY, USA, 1970. [Google Scholar]
- Bouillet, J.P.; Laclau, J.P.; Arnaud, M.; M’Bou, A.T.; Saint-André, L.; Jourdan, C. Changes with age in the spatial distribution of roots of Eucalyptus clone in Congo Impact on water and nutrient uptake. For. Ecol. Manag. 2002, 171, 43–57. [Google Scholar] [CrossRef]
- Rodrigues, F. Crescimento de Eucalipto em Idade Jovem e Movimentação de Cálcio e Magnésio No Solo em Resposta à Aplicação de Calcário e Gesso Agrícola. Ph.D. Thesis, Universidade Federal de Viçosa, Viçosa, Brazil, 2013. [Google Scholar]
- Jorge, L.A.C.; Rodrigues, A.F.O. Safira: Sistema de Análise de Fibras e Raízes, 1st ed.; Boletim de Pesquisa e Desenvolvimento; Embrapa: São Carlos, Portugal, 2008; p. 20. [Google Scholar]
- Ferreira, D.F. SISVAR: A Computer statistical analysis system. Cienc. Agrotecnol. 2011, 35, 1039–1042. [Google Scholar] [CrossRef]
- R Core Team. A Language and Environment for Statistical Computing; R Foundation for Statistical Computing: Vienna, Austria; 2013. [Google Scholar]
- Laclau, J.P.; Ranger, J.; de Moraes Gonçalves, J.L.; Maquere, V.; Krusche, A.V.; M’Bou, A.T.; Nouvellon, Y.; Saint-Andre, L.; Bouillet, J.P.; de Cassia Piccolo, M. Biogeochemical cycles of nutrients in tropical Eucalyptus plantations. For. Ecol. Manag. 2010, 259, 1771–1785. [Google Scholar] [CrossRef]
- Gama-Rodrigues, A.C.; Barros, N.F. Ciclagem de nutrientes em floresta natural e em plantios de eucalipto e de dandá no sudeste da Bahia, Brasil. Rev. Árvore 2002, 26, 193–207. [Google Scholar]
- Binkley, D.; Stape, J.L.; Ryan, M.G.; Barnard, H.R.; Fownes, J. Age-related decline in forest ecosystem growth: An individual-tree, stand-structure hypothesis. Ecosystems 2002, 5, 58–67. [Google Scholar] [CrossRef]
- Beadle, C.L. Dynamics of leaf and canopy development. In Management of Soil, Nutrients and Water in Tropical Plantation Forests; Nambiar, E.K.S., Brown, A.G., Eds.; Australian Centre for International Agricultural Research: Canverra, Australia, 1997; pp. 169–212. [Google Scholar]
- Fabião, A.; Madeira, M.; Steen, E. Development of root biomass in an Eucalyptus globulus plantation under different water and nutrient regimes. Plant Soil 1995, 215–223. [Google Scholar] [CrossRef]
- O’Grady, A.P.; Worledge, D.; Battaglia, M. Temporal and spatial changes in fine root distributions in a young Eucalyptus globulus stand in southern Tasmania. For. Ecol. Manag. 2005, 214, 373–383. [Google Scholar] [CrossRef]
- Teixeira, P.C.; Novais, R.F.; Barros, N.F.; Neves, J.C.L.; Teixeira, J.L. Eucalyptus urophylla root growth, stem sprouting and nutrient supply from the roots and soil. For. Ecol. Manag. 2002, 160, 263–271. [Google Scholar] [CrossRef]
- Witschoreck, R.; Schumacher, M.V.; Caldeira, M.V.W. Estimativa da biomassa e do comprimento de raízes finas em Eucalyptus urophylla S.T. Blake no município de Santa Maria-RS. Rev. Árvore 2003, 27, 177–183. [Google Scholar] [CrossRef]
- Giardina, C.P.; Binkley, D.; Ryan, M.G.; Fownes, J.H.; Senock, R.S. Belowground carbon cycling in a humid tropical forest decreases with fertilization. Oecologia 2004, 139, 545–550. [Google Scholar] [CrossRef] [PubMed]
- Laclau, J.P.; Arnaud, M.; Bouillet, J.P.; Ranger, J. Spatial distribution of Eucalyptus roots in a deep sandy soil in the Congo: Relationships with the ability of the stand to take up water and nutrients. Tree Physiol. 2001, 21, 129–136. [Google Scholar] [CrossRef] [PubMed]
- Laclau, J.P.; da Silva, E.A.; Rodrigues Lambais, G.; Bernoux, M.; le Maire, G.; Stape, J.L.; Bouillet, J.P.; Gonçalves, J.L.D.M.; Jourdan, C.; Nouvellon, Y. Dynamics of soil exploration by fine roots down to a depth of 10 m throughout the entire rotation in Eucalyptus grandis plantations. Front. Plant Sci. 2013, 4, 243. [Google Scholar] [CrossRef] [PubMed] [Green Version]
- Lourenço, H.M. Crescimento e Eficiência Do Uso de Água e Nutrientes em Eucalipto Fertirrigado. Master’s Thesis, Universidade Federal de Viçosa, Viçosa, Brazil, 2009. [Google Scholar]
- Kätterer, T.; Fabião, A.; Madeira, M.; Ribeiro, C.; Steen, E. Fine-root dynamics, soil moisture and soil carbon content in a Eucalyptus globulus plantation under different irrigation and fertilisation regimes. For. Ecol. Manag. 1995, 74, 1–12. [Google Scholar] [CrossRef]
- Laclau, J.P.; Bouillet, J.P.; Ranger, J. Dynamics of biomass and nutrient accumulation in a clonal plantation of Eucalyptus in Congo. For. Ecol. Manag. 2000, 128, 181–196. [Google Scholar] [CrossRef]
- Paul, K.I.; Polglase, P.J.; Nyakuengama, J.G.; Khanna, P.K. Change in soil carbon following afforestation. For. Ecol. Manag. 2002, 168, 241–257. [Google Scholar] [CrossRef]
- Baumann, K.; Marschner, P.; Smernik, R.J.; Baldock, J.A. Residue chemistry and microbial community structure during decomposition of eucalypt, wheat and vetch residues. Soil Biol. Biochem. 2009, 41, 1966–1975. [Google Scholar] [CrossRef]
- Oliveira, F.C. Emissão de Gases de Efeito estufa e Dinâmica da População Microbiana e do Carbono do Solo em Povoamento de Eucalipto Implantado No Bioma Pampa. Ph.D. Thesis, Universidade Federal de Viçosa, Viçosa, Brazil, 2015. [Google Scholar]
- Sinsabaugh, R.L.; Gallo, M.E.; Lauber, C.; Waldrop, M.P.; Zak, D.R. Extracellular enzyme activities and soil organic matter dynamics for northern hardwood forests receiving simulated nitrogen deposition. Biogeochemistry 2005, 75, 201–215. [Google Scholar] [CrossRef]
- Waldrop, M.P.; Zak, D.R.; Sinsabaugh, R.L.; Gallo, M.; Lauber, C. Nitrogen deposition modifies soil carbon storage through changes in microbial enzymatic activity. Ecol. Appl. 2004, 14, 1172–1177. [Google Scholar] [CrossRef]
- Fontaine, S.; Barot, S.; Barré, P.; Bdioui, N.; Mary, B.; Rumpel, C. Stability of organic carbon in deep soil layers controlled by fresh carbon supply. Nature 2007, 450, 277–280. [Google Scholar] [CrossRef] [PubMed]
- Binkley, D.; Resh, S.C. Rapid changes in soils following Eucalyptus afforestation in Hawaii. Soil Sci. Soc. Am. J. 1999, 63, 222–225. [Google Scholar] [CrossRef]
- Binkley, D.; Kaye, J.; Barry, M.; Ryan, M.G. First-rotation changes in soil carbon and nitrogen in a Eucalyptus plantation in Hawaii. Soil Sci. Soc. Am. J. 2004, 1713–1719. [Google Scholar] [CrossRef]


| Depth | pH (1) | SB (2) | ρb (3) | TP (4) | Clay (5) | POM (6) | MAOM (6) | SOM (7) | ||||
|---|---|---|---|---|---|---|---|---|---|---|---|---|
| C | δ13C | N | C | δ13C | N | C:N | ||||||
| cm | - | cmolc dm−3 | g cm−3 | m3 m−3 | g kg−1 | g kg−1 | ‰ | g kg−1 | g kg−1 | ‰ | g kg−1 | - |
| 0–10 | 4.71 | 7.71 | 1.15 | 0.53 | 280 | 2.35 | −14.75 | 0.14 | 19.22 | −13.52 | 2.22 | 9.15 |
| 10–20 | 4.82 | 6.83 | 1.32 | 0.46 | 320 | 1.32 | −15.74 | 0.07 | 14.37 | −13.50 | 1.60 | 9.40 |
| 20–40 | 5.07 | 7.74 | 1.36 | 0.45 | 370 | 0.81 | −16.11 | 0.03 | 10.79 | −13.41 | 1.22 | 9.28 |
| Variables | - | Age (year) | Nitrogen Dose (kg ha−1) | |||
|---|---|---|---|---|---|---|
| 24 | 36 | 48 | 108 | |||
| DBH | cm | 1.08 | 4.35 a (0.11) | 4.44 a (0.12) | 4.47 a (0.10) | 4.55 a (0.11) |
| 1.54 | 7.70 b (0.25) | 7.83 a (0.22) | 7.89 a (0.18) | 8.00 a (0.24) | ||
| 2.33 | 10.89 a (0.20) | 10.97 a (0.18) | 11.03 a (0.10) | 11.11 a (0.10) | ||
| H | m | 1.08 | 3.54 a (0.11) | 3.64 a (0.09) | 3.75 a (0.12) | 3.83 a (0.08) |
| 1.54 | 7.69 b (0.15) | 7.94 a,b (0.05) | 8.09 a (0.10) | 8.20 a (0.11) | ||
| 2.33 | 11.86 b (0.11) | 12.02 ab (0.06) | 12.02 ab (0.05) | 12.21 a (0.03) | ||
| Hd | m | 1.08 | 4.54 a (0.11) | 4.71a (0.08) | 4.79 a (0.14) | 4.79 a (0.18) |
| 1.54 | 8.83 ab (0.33) | 8.51 b (0.26) | 9.17 a (0.16) | 9.15 a (0.27) | ||
| 2.33 | 12.64 a (0.23) | 12.88 a (0.32) | 12.94 a (0.16) | 12.91 a (0.11) | ||
| Survival | % | 1.08 | 94.82 a (1.71) | 95.90 a (1.07) | 95.71 a (1.34) | 95.00 a (1.68) |
| 1.54 | 91.25 a (1.35) | 92.68 a (1.03) | 95.18 a (1.28) | 92.14 a (1.62) | ||
| 2.33 | 92.14 a (0.23) | 90.36 a (0.90) | 91.96 a (1.63) | 89.11 a (1.88) | ||
| G | m2 ha−1 | 1.08 | 1.55 a (0.13) | 1.73 a (0.13) | 1.82 a (0.18) | 1.94 a (0.12) |
| 1.54 | 6.21 a (0.41) | 6.29 a (0.32) | 6.54 a (0.35) | 6.61 a (0.47) | ||
| 2.33 | 12.49 a (0.41) | 12.65 a (0.23) | 13.17 a (0.30) | 13.14 a (0.31) | ||
| LAI | m2 m−2 | 1.54 | 2.50 a (0.31) | 2.72 a (0.13) | 2.73 a (0.23) | 2.78 a (0.30) |
| Leaf N | g kg−1 | 1.54 | 21.68 a (1.32) | 22.08 a (1.52) | 22.33 a (0.99) | 23.07 a (1.31) |
© 2018 by the authors. Licensee MDPI, Basel, Switzerland. This article is an open access article distributed under the terms and conditions of the Creative Commons Attribution (CC BY) license (http://creativecommons.org/licenses/by/4.0/).
Share and Cite
Ferreira, G.W.D.; Oliveira, F.C.C.; Silva, L.O.G.; Souza, J.J.L.L.; Soares, E.M.B.; Araújo, E.F.; Silva, I.R. Nitrogen Alters Initial Growth, Fine-Root Biomass and Soil Organic Matter Properties of a Eucalyptus dunnii Maiden Plantation in a Recently Afforested Grassland in Southern Brazil. Forests 2018, 9, 62. https://doi.org/10.3390/f9020062
Ferreira GWD, Oliveira FCC, Silva LOG, Souza JJLL, Soares EMB, Araújo EF, Silva IR. Nitrogen Alters Initial Growth, Fine-Root Biomass and Soil Organic Matter Properties of a Eucalyptus dunnii Maiden Plantation in a Recently Afforested Grassland in Southern Brazil. Forests. 2018; 9(2):62. https://doi.org/10.3390/f9020062
Chicago/Turabian StyleFerreira, Gabriel W. D., Fernanda C. C. Oliveira, Lucas O. G. Silva, José João L. L. Souza, Emanuelle M. B. Soares, Elias F. Araújo, and Ivo R. Silva. 2018. "Nitrogen Alters Initial Growth, Fine-Root Biomass and Soil Organic Matter Properties of a Eucalyptus dunnii Maiden Plantation in a Recently Afforested Grassland in Southern Brazil" Forests 9, no. 2: 62. https://doi.org/10.3390/f9020062