Changes in Sensitivity of Tree-Ring Widths to Climate in a Tropical Moist Forest Tree in Bangladesh


1
Institute of Geography, Department of Geography and Geosciences, Friedrich-Alexander University Erlangen-Nuremberg, 91058 Erlangen, Germany
2
Department of Forestry and Environmental Science, Shahjalal University of Science and Technology, Sylhet 3114, Bangladesh
*
Author to whom correspondence should be addressed.
Forests 2018, 9(12), 761; https://doi.org/10.3390/f9120761
Submission received: 8 November 2018
/
Revised: 28 November 2018
/
Accepted: 2 December 2018
/
Published: 6 December 2018
(This article belongs to the Section Forest Ecology and Management)
Abstract
:Tree growth in the tropics is strongly influenced by climate. However, reported tree growth responses to climate are largely inconsistent, varying with geographic location, forest type, and tree species. It is thus important to study the growth responses of tropical trees in sites and species that are under-represented so far. Bangladesh, a country influenced by the Asian monsoon climate, is understudied in terms of tree growth response to climate. In the present study, we developed a 121-year-long regional ring-width index chronology of Chukrasia tabularis A. Juss. sampled in two moist forest sites in Bangladesh to investigate tree growth responses to climate in monsoon South Asia. Standard dendrochronological methods were used to produce the ring-width chronologies. The climate sensitivity of C. tabularis was assessed through bootstrap correlation analysis and the stationarity and consistency of climate–growth relationships was evaluated using moving correlation functions and comparing the regression slopes of two sub-periods (1950–1985 and 1986–2015). Tree growth was negatively correlated with the mean, minimum, and maximum temperatures, particularly during the early growing season (March). Likewise, precipitation negatively influenced tree growth in the later growing season (October). Besides, radial growth of Chukrasia sharply ceased in years following strong and moderate El Niño events. In parallel with a significant positive trend in local temperatures, tree growth sensitivity to early growing season (March–April) mean temperatures and July minimum temperatures increased in recent decades. Tree growth sensitivity to October precipitation and April vapor pressure deficit also increased. Overall, climate–growth relationships were stronger during the period 1986–2015 than during 1950–1985. Changes in climate sensitivity might be linked to a warming trend that induced an increase in the dry season length during recent decades. With a further predicted temperature increase at our study sites, our results suggest that radial growth of C. tabularis will further decline in response to climate warming.
1. Introduction
Terrestrial vegetation stores approximately 610 petagrams of carbon, most of which is contained in tropical forests [1,2,3,4,5,6]. Tropical forests are thus a crucial component of the global carbon cycle because of their high sequestration and storage of carbon. Therefore, a small change in net uptake or loss of carbon in tropical forests has large implications for the global carbon cycle [7,8]. However, global climate change may strongly influence growth and survival of trees and alter the dynamics of tropical forests [9,10,11,12,13].
The influence of climate on tree growth has been studied in various forest ecosystems. A growing number of studies documented climate-related variability of tree growth across the tropics. For example, tree growth in many tropical forests has been related to rainfall variability [14,15,16,17,18,19,20,21,22], and increasing temperatures have caused growth decline in a number of tropical tree species [23,24,25,26,27]. The increasing frequency of El Niño events led to severe drought conditions throughout the tropical region, causing tree growth decline [20,28,29,30]. However, tree growth responses to climatic changes are often site- and species-specific, varying with geographic location, forest types, and studied tree functional type.
Tree growth sensitivity to climate can vary over time [31,32]. For example, changes in the temperature response of ring-width and wood density have been observed in many study areas around the world [31,33,34,35,36,37], although the likely mechanisms responsible for these changes may vary from case to case. While an increasing number of studies investigated changes in tree growth sensitivity in the temperate and boreal forests [32,38], such studies are apparently rare in tropical forests.
The forest ecosystems of Bangladesh, a tropical region in South Asia influenced by the Asian monsoon climate, are highly sensitive to climate change, mainly because of high vulnerability to natural disasters like cyclones, flooding, and salt intrusion [39,40]. Regional temperature increased by 1.19 °C over the last 66 years, which is higher than the global mean over 1880–2012 (0.85 °C) [41]. The increasing trends in temperatures [42,43] and severity of droughts in many parts of Bangladesh and adjacent areas in monsoon Southeast Asia [44,45] may have negative effects on tree growth and forest productivity. Higher temperatures reduced tree growth in three functionally different tree species in Bangladesh [46]. To understand the future carbon sequestration potential of regional forests and their resilience to future climatic changes, studying climate–growth relationships and analyzing their stability is crucial.
Reconstruction of long term historical tree growth can be done by monitoring stem growth of marked trees in permanent sample plots (PSPs) or by measurements of ring-width on the cross-sectional surface of stem discs or increment cores [47]. Tree-ring analysis based on increment cores or discs offers the opportunity to obtain individual tree growth data over a longer period and annual resolution. Tree-ring studies are a relatively new discipline in Bangladesh compared with other South Asian countries. The first standard ring-width chronology in Bangladesh was developed for a mangrove species [48]. Recently, ring-width chronologies of three broadleaved rainforest species were developed from a moist forest site in Bangladesh [46]. However, whether trees from different moist forest sites record common environmental signals has not been explored yet.
Growth-ring boundary detection and crossdating within and between trees are difficult because of the presence of wedging rings and false rings in tropical trees [49]. A recent tree-ring study in Bangladesh revealed different levels of clarity of annual growth-ring boundary formation and proved crossdating of ring-width series for 27 moist forest species [50]. Although trees within a site have already been successfully crossdated in a moist forest site in Bangladesh [46], crossdating trees between two moist forest sites has not yet been done successfully. Knowledge about the temporal stability of climate–growth relationships is also missing. In the current study, tree-ring analysis was performed in Chukrasia tabularis sampled from two nature reserves in Bangladesh to evaluate local climate–growth relationships and their temporal stability. C. tabularis was selected because of its fairly distinct growth-ring boundaries and the formation of annual tree rings, its importance as high valued timber, and its wide distribution over the tropics [50]. The main research objectives of the present study are as follows: (a) to investigate if the ring-width series of C. tabularis from different sites could be crossdated between trees within and between sites; (b) to develop a regional ring-width index (RWI) chronology of C. tabularis; (c) to investigate the sensitivity of tree growth to local climate and to the large-scale climate drivers such as Niño 3.4 region sea surface temperature (SST) anomalies; and (d) to evaluate the stationarity and consistency of climate–growth relationships over time. Considering the ongoing climate changes in Bangladesh, we hypothesized that the relationships between radial growth of C. tabularis and climate factors might have changed in strength and with regards to seasonality in the recent decades.
2. Materials and Methods
2.1. Study Site, Tree Species, and Local Climate
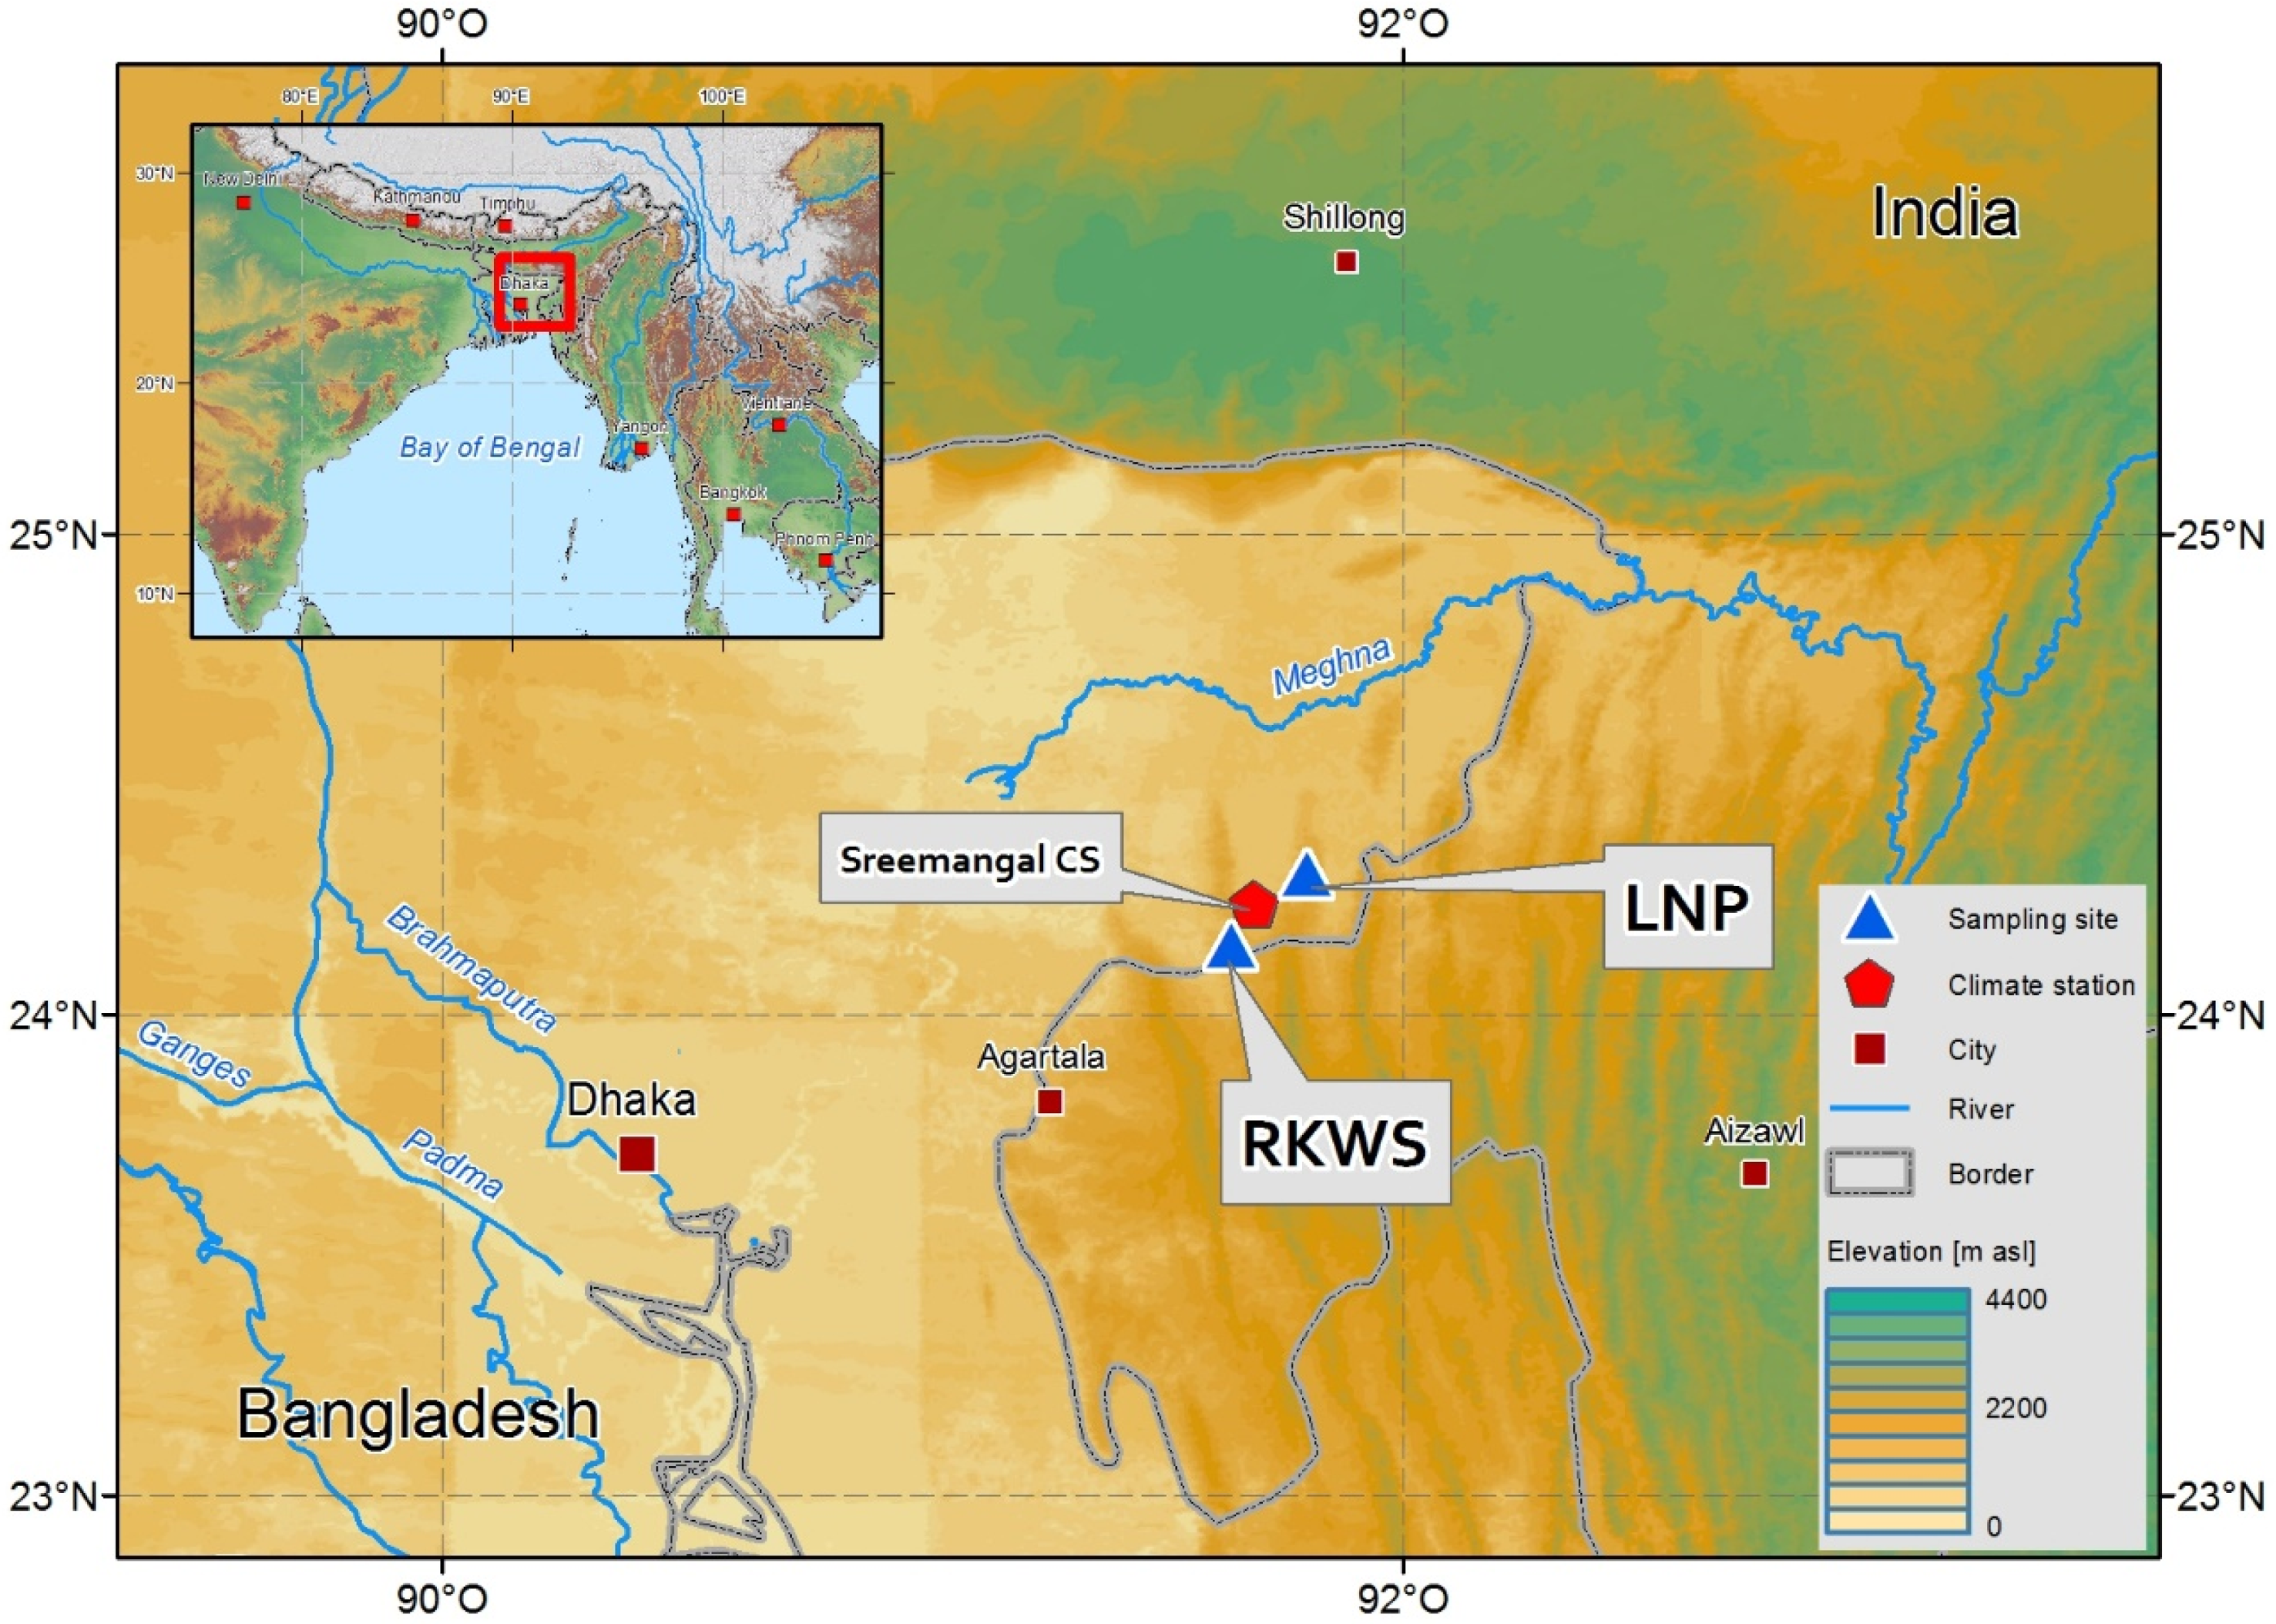
The study was conducted in two nature reserves (Rema-Kalenga Wildlife Sanctuary and Lawachara National Park) in Bangladesh (Figure 1). The Rema-Kalenga Wildlife Sanctuary (RKWS; 24°06′–24°14′ N and 91°36′–91°39′ E) is a part of the Tarap mountain system, bounded on the east and south by Tripura state of India and situated in the bio-ecological zone of the Sylhet Hills along the Indo–Burma biodiversity hotspot [51]. The total area of the sanctuary is 1795 ha and consists of hills of different elevations and low-lying valleys. The soil types vary from clay loam on the relatively level ground or valleys to sandy loam on the hills [52]. The Lawachara National Park (LNP; 24°18′–24°21′ N and 91°45′–91°49′ E) covers a total area of 1250 ha and is part of West Bhanugach Reserve forest, which is one of the most suitable wildlife habitats in Bangladesh [53].
Both study sites are located between 30 and 100 m a.s.l. and are classified as moist tropical forests based on the life zone classification of Holdridge [54]. The forests contain both deciduous canopy and evergreen understory species. The dominant tree species include Dipterocarpus turbinatus, C.F. Gaertn, Tectona grandis L.F., Chukrasia tabularis A. Juss., Toona ciliata M. Roem., Syzygium grandis (Wight) Walp. The undergrowth is comprised of various types of bamboo (Bambusa sp.) species [55]. The middle canopy is mainly composed of Terminalia bellirica (Gaertn.) Roxb., Lagerstroemia speciosa (L.) Pers., Dillenia pentagyna Roxb., as well as different species of Ficus and Albizia. Figure S1 shows the studied forest stands including a C. tabularis tree with its crown in the canopy layer. Both study sites are nature reserves and are managed under a protected area management system [56]. Hence, we assume that the forests are not subjected to intensive human disturbances.
Chukrasia tabularis is a deciduous tree growing up to 40 m in height and up to 120 cm in diameter at breast height (dbh) [57]. It grows in both lowland evergreen and deciduous forests. C. tabularis is a pioneer tree usually occupying the top canopy in natural forests. It is widely distributed in tropical and subtropical regions of Southeast Asia and has been widely planted as an exotic species in Africa, Latin America, and the USA. The species prefers well-drained soil and cannot withstand waterlogging [58]. Leaf shedding starts at the beginning of December and new leaves appear in the middle to end of February. C. tabularis forms distinct growth-ring boundaries delineated by marginal parenchyma bands [26,50,59] (Figure S2). Growth-ring formation is annual, which has been confirmed by cambial wounding experiments [60].
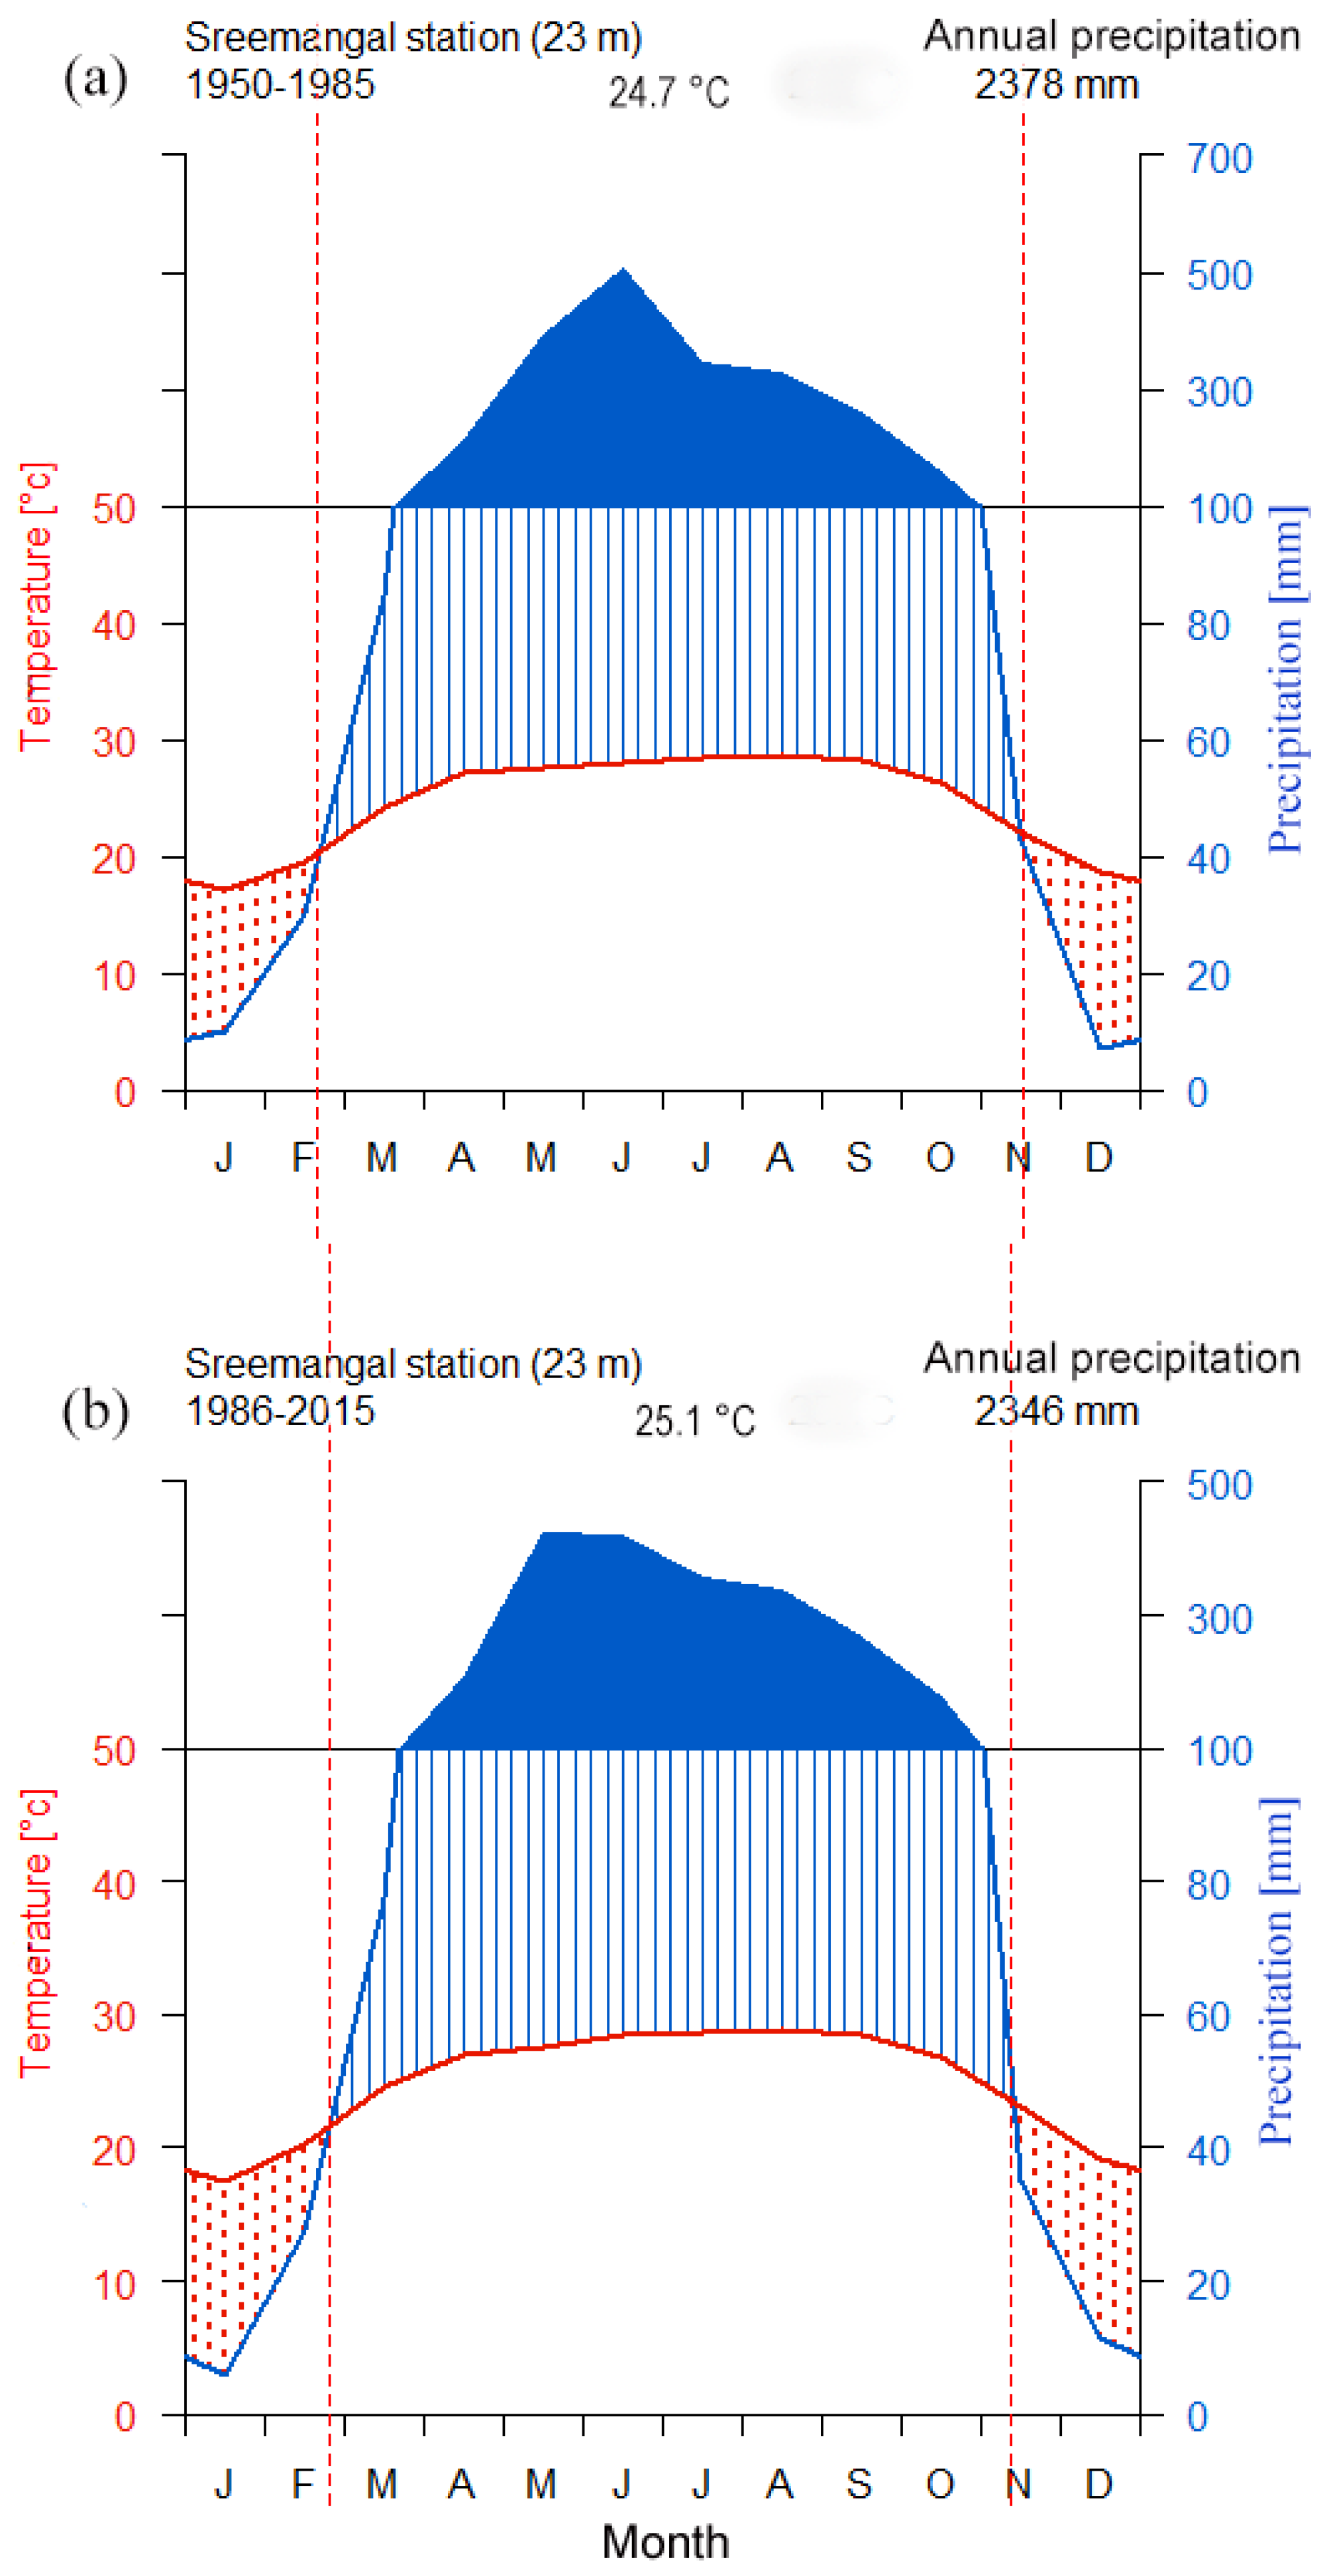
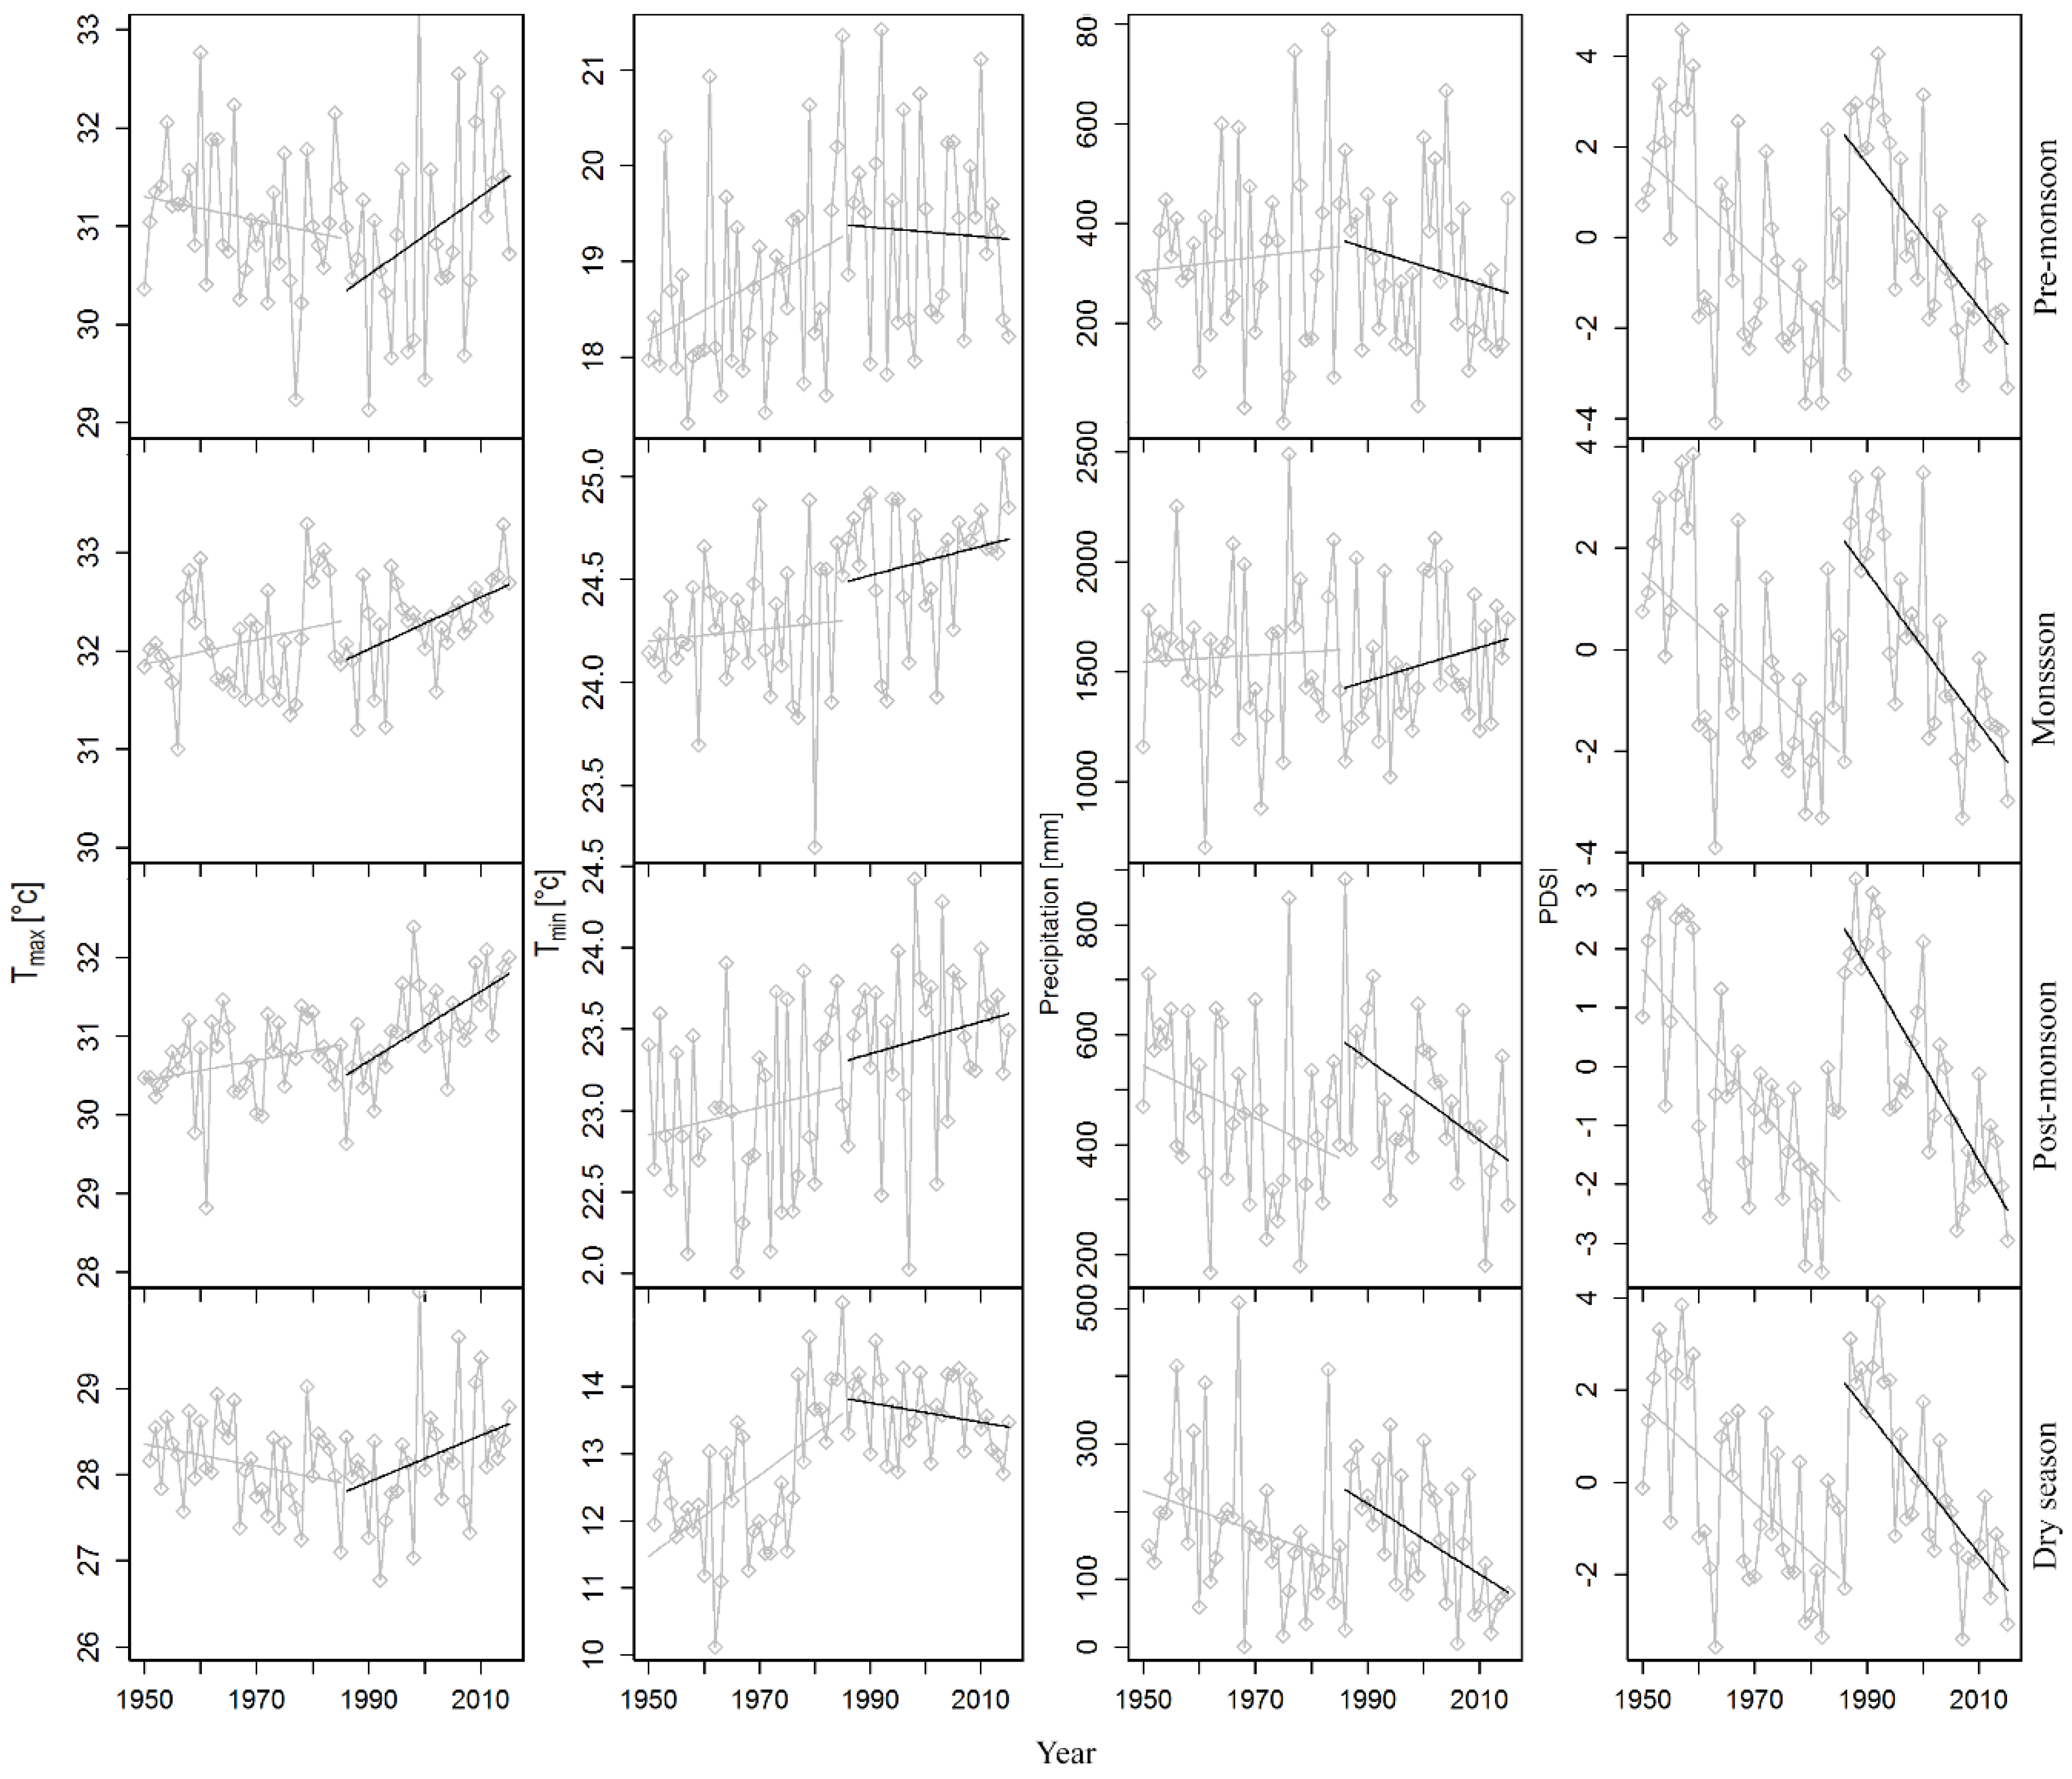
The study area is influenced by the tropical monsoon climate and had a mean annual rainfall of 2363 mm and an average annual temperature of 24.8 °C over 1950–2015. A distinct seasonality is prevalent with a long wet season (April–October) and a relatively short dry season (November–March), in which monthly rainfall amounts of less than 100 mm are recorded. Monthly precipitation from the middle of November until the middle of February amount to <60 mm (Figure 2). Thus, we assume that the cambium cells remain dormant during this relatively dry period [61,62] and that the growing season starts at the end of February and lasts until the middle of November. March to April represents pre-monsoon season (early growing season), May to August represents main monsoon season (main growing season), and September to October represents post-monsoon season (late growing season). Approximately 85% of total annual precipitation occurs during the wet season. There is a significant increasing trend in temperatures, but no trend in precipitation was observed over the period 1950–2015 (Figure S3). However, variable trends in climate variables were observed between the two sub periods from 1950 to 1985 and 1986 to 2015 (Figure 3).
Precipitation, temperature, and relative humidity data of the Sreemangal meteorological station located 23.5 km away from the RKWS and 9 km away from the LNP (24°30′ N and 91°39′ E) were obtained from Bangladesh Meteorological Department (BMD). Because there is a significant increasing trend in annual temperature over 1950–2015 (Figure S3), we detrended them using a cubic smoothing spline function. Sea surface temperature (SST) anomalies of the Niño 3.4 region (the region that represents the equatorial pacific SSTs) were obtained from the Climate Prediction Center (CPC) of the National Oceanic Atmospheric Administration (NOAA). The Hadley Centre and Climate Research Unit (HadCRUH) relative humidity anomalies, the Standardized Precipitation Evapotranspiration Index (SPEI), and Climate Research Unit (CRU) self-calibrating Palmer Drought Severity Index (PDSI) data were accessed through KNMI Climate Explorer (the Royal Netherlands Meteorological Institute; http://climexp.knmi.nl/). Vapor pressure deficit (VPD) was calculated from the instrumental temperature and relative humidity data using the following equation: VPD = ((100 − RH)/100) × SVP, where saturated vapor pressure (SVP) = 0.610exp × ((17.27 × T)/(T + 237.3)), T = temperature, and RH = relative humidity. The Indian Summer Monsoon Index (ISMI) data was obtained from the Asia-Pacific Data Research Center (APDRC) of the International Pacific Research Center (IPRC). The ISMI data set was normalized for the period 1950–2015.
2.2. Wood Sample Collection and Preparation
We collected wood samples (increment cores and a stem disk) of C. tabularis from RKWS sites and LNP sites for tree-ring analysis. From RKWS, we collected 1 stem disk and extracted 60 increment cores from 30 trees. A total of 50 cores from 25 trees were sampled from LNP. Cores were extracted at breast height (~1.3 m) with a 5.0 mm diameter Suunto (Vantaa, Finland) increment borer during July–August 2016. Because the tree-ring of the year 2016 was not yet complete, we limited our analysis to up to 2015. Because C. tabularis grew in patches in the core zone of the nature reserve, we collected all trees >10 cm dbh in randomly selected patches. Trees with highly irregular stems were avoided because growth-ring detection, measurement, and crossdating might be more difficult. Cores were stored in plastic holders in the field and then air dried for 24 h to avoid attack by stain fungi. The increment cores were mounted on wooden holders and sanded with increasingly fine grain paper (80–2000 grit) [63]. Afterwards, the cores were scanned on a high resolution flatbed scanner (Epson Expression 10000XL, Epson America, Inc., Long Beach, CA, USA) at 1600–2000 dpi.
2.3. Crossdating and Chronology Development
Tree-ring width (TRW) measurements were conducted on a Lintab 6 measuring system (Rinntech, Heidelberg, Germany) and CooRecorder (Cybis Elektronik & Data AB, Saltsjöbaden, Sweden) with a precision of 0.01 mm. Tree-ring series were visually and statistically crossdated by comparing measurements from two or three cores/series of the same tree using TSAP-Win (RINNTECH, Heidelberg, Germany). Crossdating within a tree allows one to measure the same number of rings between the different radii of an individual and to identify wedging rings (rings that merge on certain parts of the circumference of the tree) and “false” ring structures (intra-annual growth variations). Afterwards, crossdating between trees was performed. Firstly, we synchronized three ring-width series of the stem disk by taking the mean curve of the disk as a reference, and synchronized the ring-width series of the remaining increment cores. For each site, the quality of crossdating was verified by t-test statistics and Gleichläufigkeit values (GLK). The latter indicates the proportion of agreement/disagreement of inter-annual growth tendencies among the trees [64]. Crossdating accuracy was also checked by the computer program COFECHA [65]. Crossdated tree-ring series were used to establish correctly dated tree-ring chronologies. In order to remove biological growth trends from derived tree-ring chronologies, all individual tree ring series were detrended by fitting a 20-year cubic smoothing spline curve with a 67% frequency response (f = 0.67). This filter length was chosen because it is around two-thirds of the length of the shortest time series, which spans 33 years. The detrending was performed using Dendrochronology Program Library in R (dplR) [66] within the R statistical programming environment [67].
Two site chronologies were developed and merged to a regional RWI chronology because of a significant coherency among both local chronologies. To verify the coherency, we performed a principal component analysis (PCA) with the site chronologies and found that the PC#1 explained 72% of the common variance (Figure S5). The correlation between the score of PC#1 and our regional chronology was 0.96 (p < 0.001), indicating that the mean chronology reliably reflects the common variance shared between the two study sites.
The chronologies were developed with the “chron” (dplR-package) function using the detrended ring-width index (RWI) series with a robust mean to reduce the influence of outliers [68]. The expressed population signal (EPS) indicates the reliability of a chronology as a fraction of the common variance of a theoretical infinite tree population [69]. EPS was calculated from the number of trees and the effective chronology signal (rbar.eff), a statistical parameter indicating chronology strength, which incorporates both within- and between-tree correlations [68].
In order to identify the most reliable part of the regional chronology [70], the recommended threshold of the expressed population signal (EPS > 0.85) [68,71] was used based on a 24-year window with a 12-year overlap. We also calculated mean sensitivity (MS), which is an indicator of the relative changes in ring-width variance between consecutive years and used as a signal strength diagnostic [72]. We further calculated the signal-to-noise ratio (SNR), which evaluates the signal strength of the chronology [70]. Auto-correlation (AC) was calculated to assess the influence of the previous year’s growth upon the current year’s growth [72].
2.4. Data Analyses
Wavelet-based spectral analysis was performed to unravel the periodicity of tree growth for the period 1895–2015 [73]. The main purpose of using this analysis was to test if the periodicities in the wavelet spectra of tree-ring chronologies correspond to the occurrence of El Niño Southern Oscillation Index (ENSO) events. The climate sensitivity of C. tabularis was determined by correlating the regional RWI with meteorological station data of a monthly, annual, and seasonal resolution. Four seasons were classified in the study area depending on the precipitation amount, including pre-monsoon (February–April), monsoon (May–August), post-monsoon (September–November), and dry winter monsoon season (November–March). A 19-month window was used for monthly correlation analysis starting from May in previous year to current year November. The previous year was included in the analysis because the climate in the preceding growing season often influences tree growth in the following year [72]. Such a lagged effect of the climate on tree growth is common for temperate, boreal, and tropical tree species [15,74,75,76,77].
A bootstrap Pearson correlation function was applied to analyze local climate–growth relationships. The method is based on a randomized extraction and replacement of data in order to achieve meaningful confidence interval of the correlation [78]. A simple Pearson correlation analysis was used to evaluate the relationship between tree growth and SST anomalies from the Niño 3.4 region (representing ENSO activity). Furthermore, we applied a superposed epoch analysis (SEA) [79] to study the influence of ENSO events on the radial growth of C. tabularis. SEA was used to test the significance of a tree-ring chronology response to particular climate events within a certain window, considering tree-ring values of two to three years before and after the event [79]. A seasonal correlation analysis was performed using the “seascorr” function in the “treeclim” R-package [80]. We considered a 14-month window in the seasonal analysis, starting in October of the previous growing season and ending in November of the current year (termination of the current growing season). The seasonal correlation analysis was performed only for temperature and precipitation data. In order to measure the stationarity and the consistency of climate–growth relationships over time, we performed a moving correlation analysis using the “treeclim” R-package [80]. For the detection of trends in tree growth–climate associations over time, we used a simple linear regression analysis. According to previous analyses, climate change (temperature rise, frequency of drought) in Bangladesh was most severe in the last three decades (1986–2015) [44,81] (Figure 3). Therefore, we separated this period (1986–2015) from the rest of the available climate data (1950–1985) to compare the climate–growth relationships between these two periods and to test how trees’ responses to climate has been affected by recent climate trends.
3. Results
3.1. Chronology Characteristics
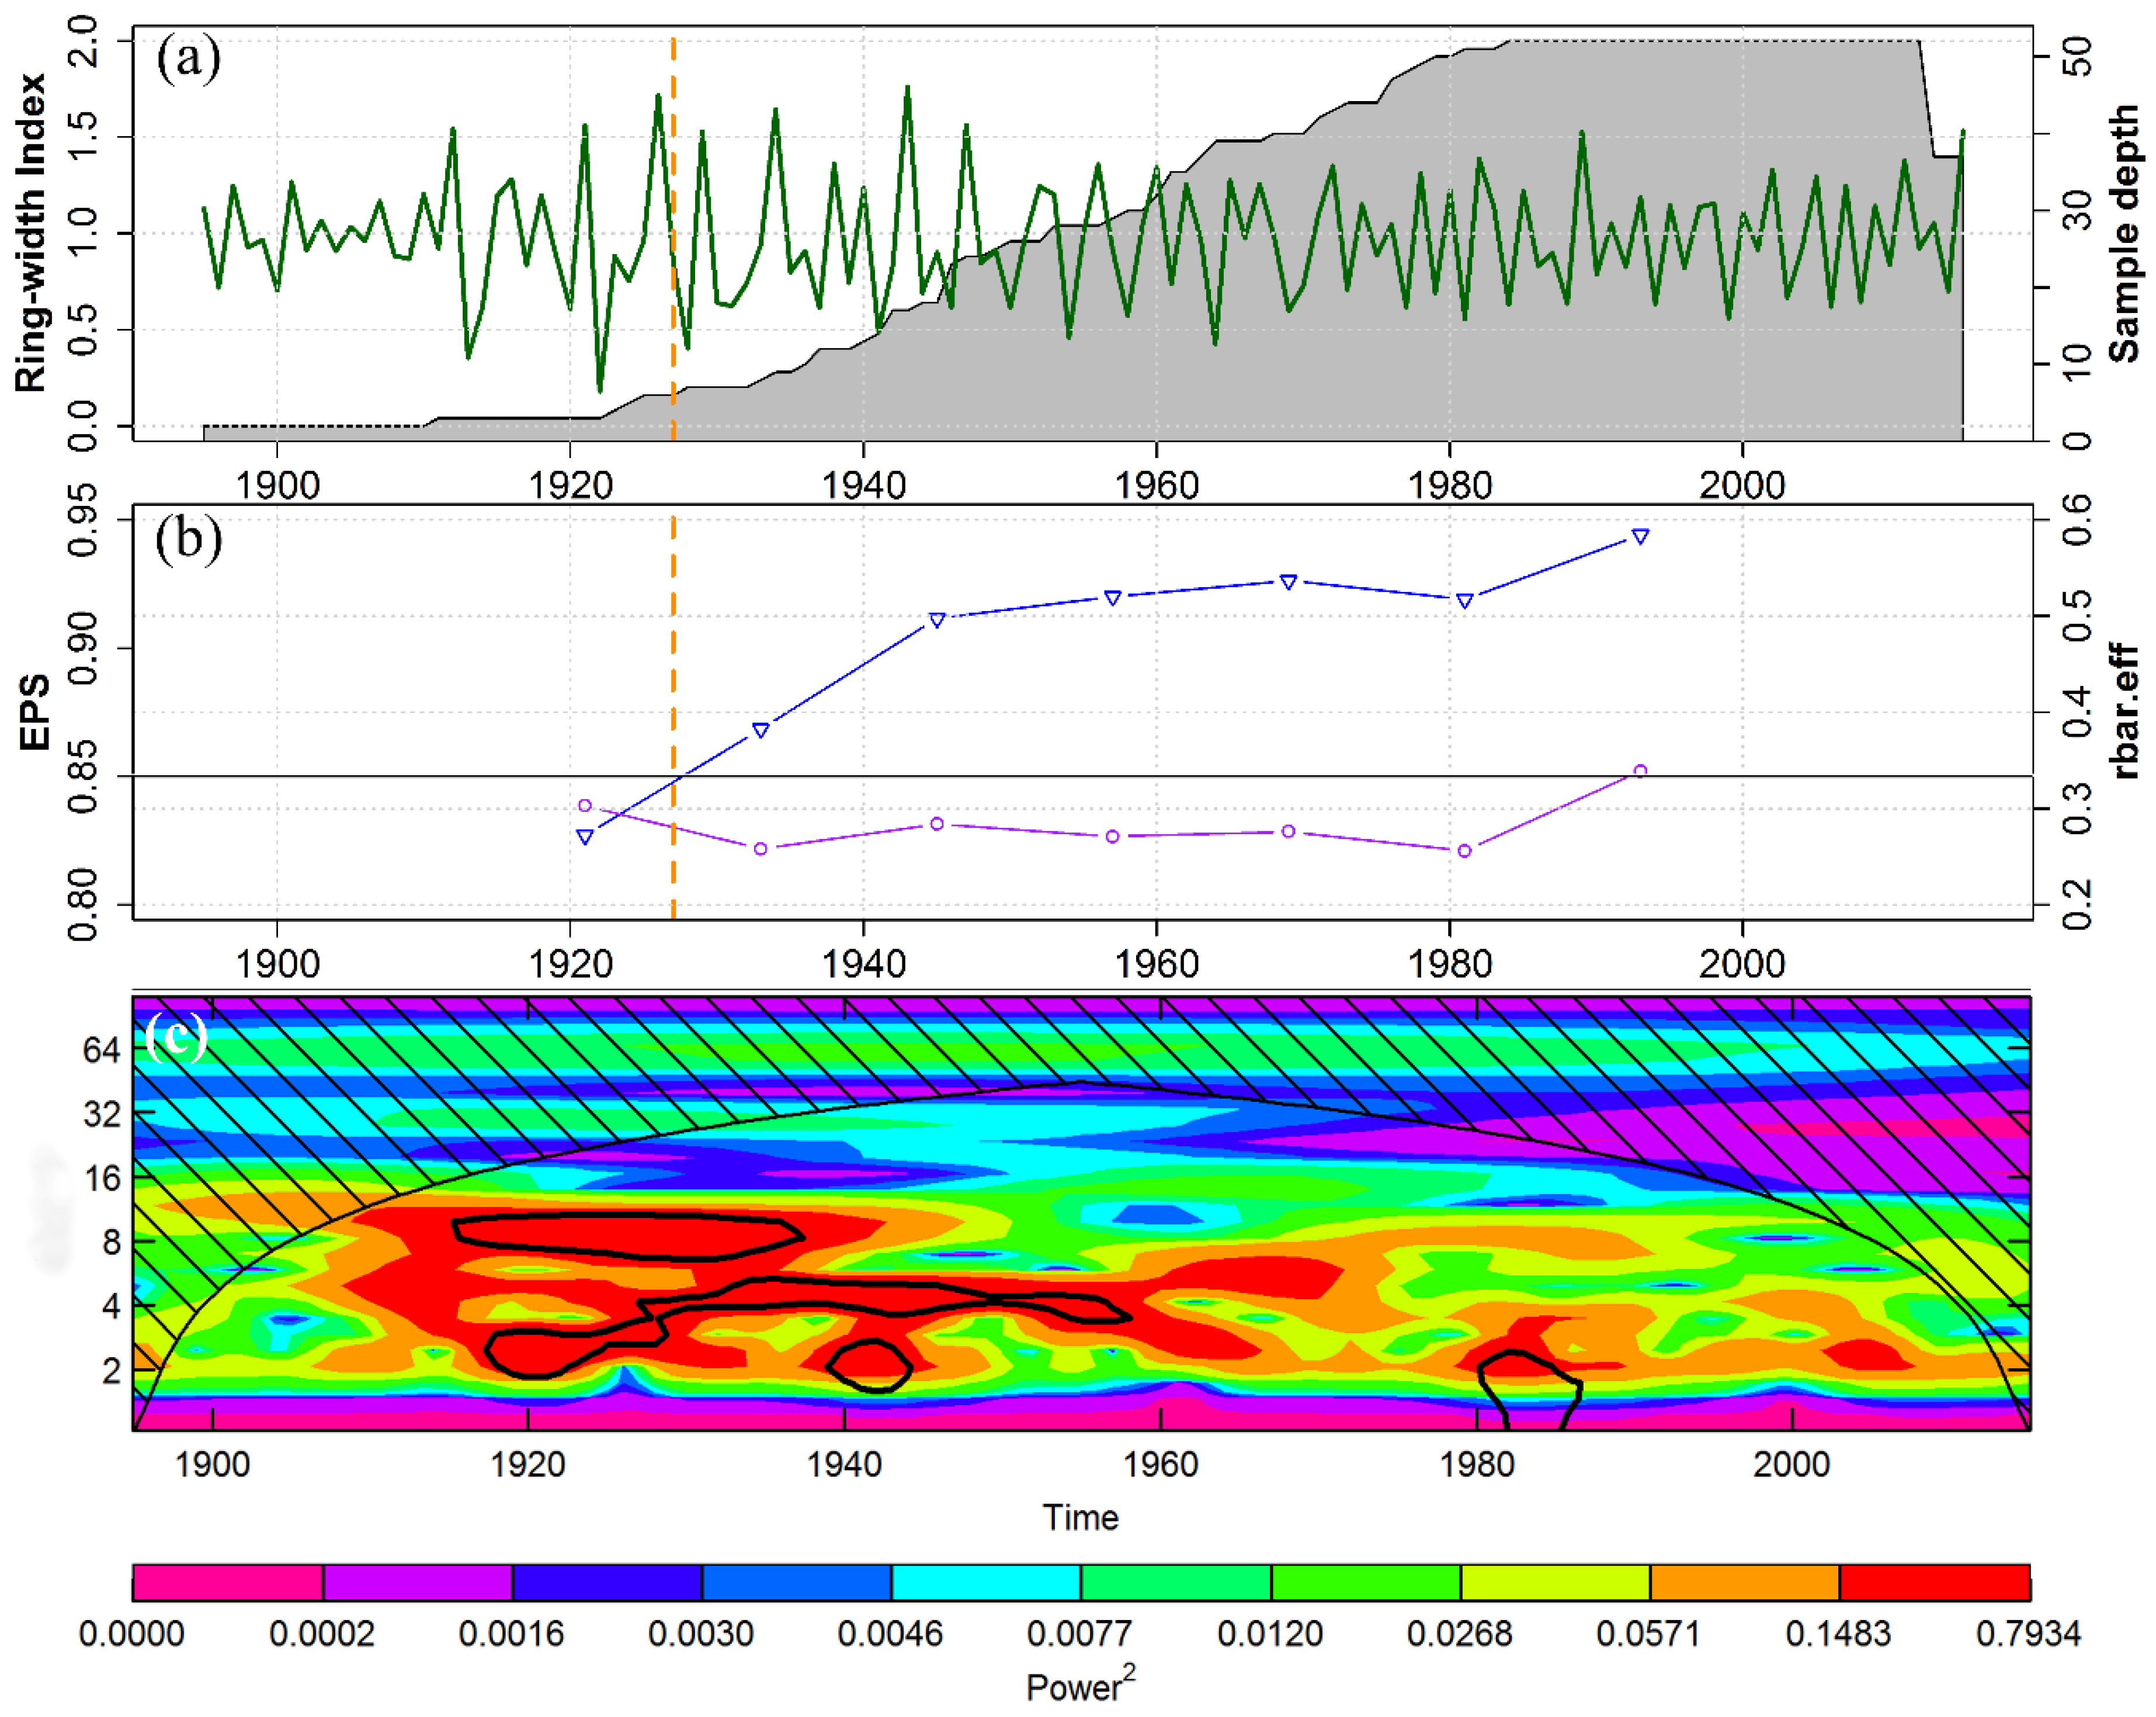
A total of 52 tree-ring series of 33 C. tabularis trees from two sites (37 cores from RKWS and 15 cores from LNP) were successfully crossdated. Based on the well synchronized tree-ring series of each site, two separate site chronologies were developed (Figure S4). The statistical characteristics of the site chronologies are presented in Table S1. The two site chronologies were significantly correlated (r = 0.37, p < 0.001). Hence, we developed a regional RWI chronology spanning 121 years (1895–2015; Figure 4a). The regional RWI chronology shows a strong SNR (SNR = 9.13), indicating a strong common signal among the individual series.
The statistical characteristics of the ring-width series and the statistical parameters indicating the signal strength of the regional RWI chronology are shown in Table 1. Mean EPS was 0.90, which is well above the threshold value (EPS = 0.85) required to produce a statistically robust RWI chronology [69]. However, the EPS dropped below the suggested threshold limit before 1927 (Figure 4b). Thus, the reliable part of the chronology covers the 89-year-long period of 1927–2015. Mean series inter-correlation, MS, SNR, and other statistical parameters indicating the strength of chronology signals were also high, indicating the suitability of our regional chronology for climate–growth analysis. The wavelet-based spectral analysis of RWI chronology showed a significant periodicity of two to four years during 1920–1960 (Figure 4c). However, because of low sample size and EPS in the earlier part of the chronology, we focussed most of the following analyses on the past 66 years (1950–2015).
3.2. Tree Growth Responses to Climate Variables
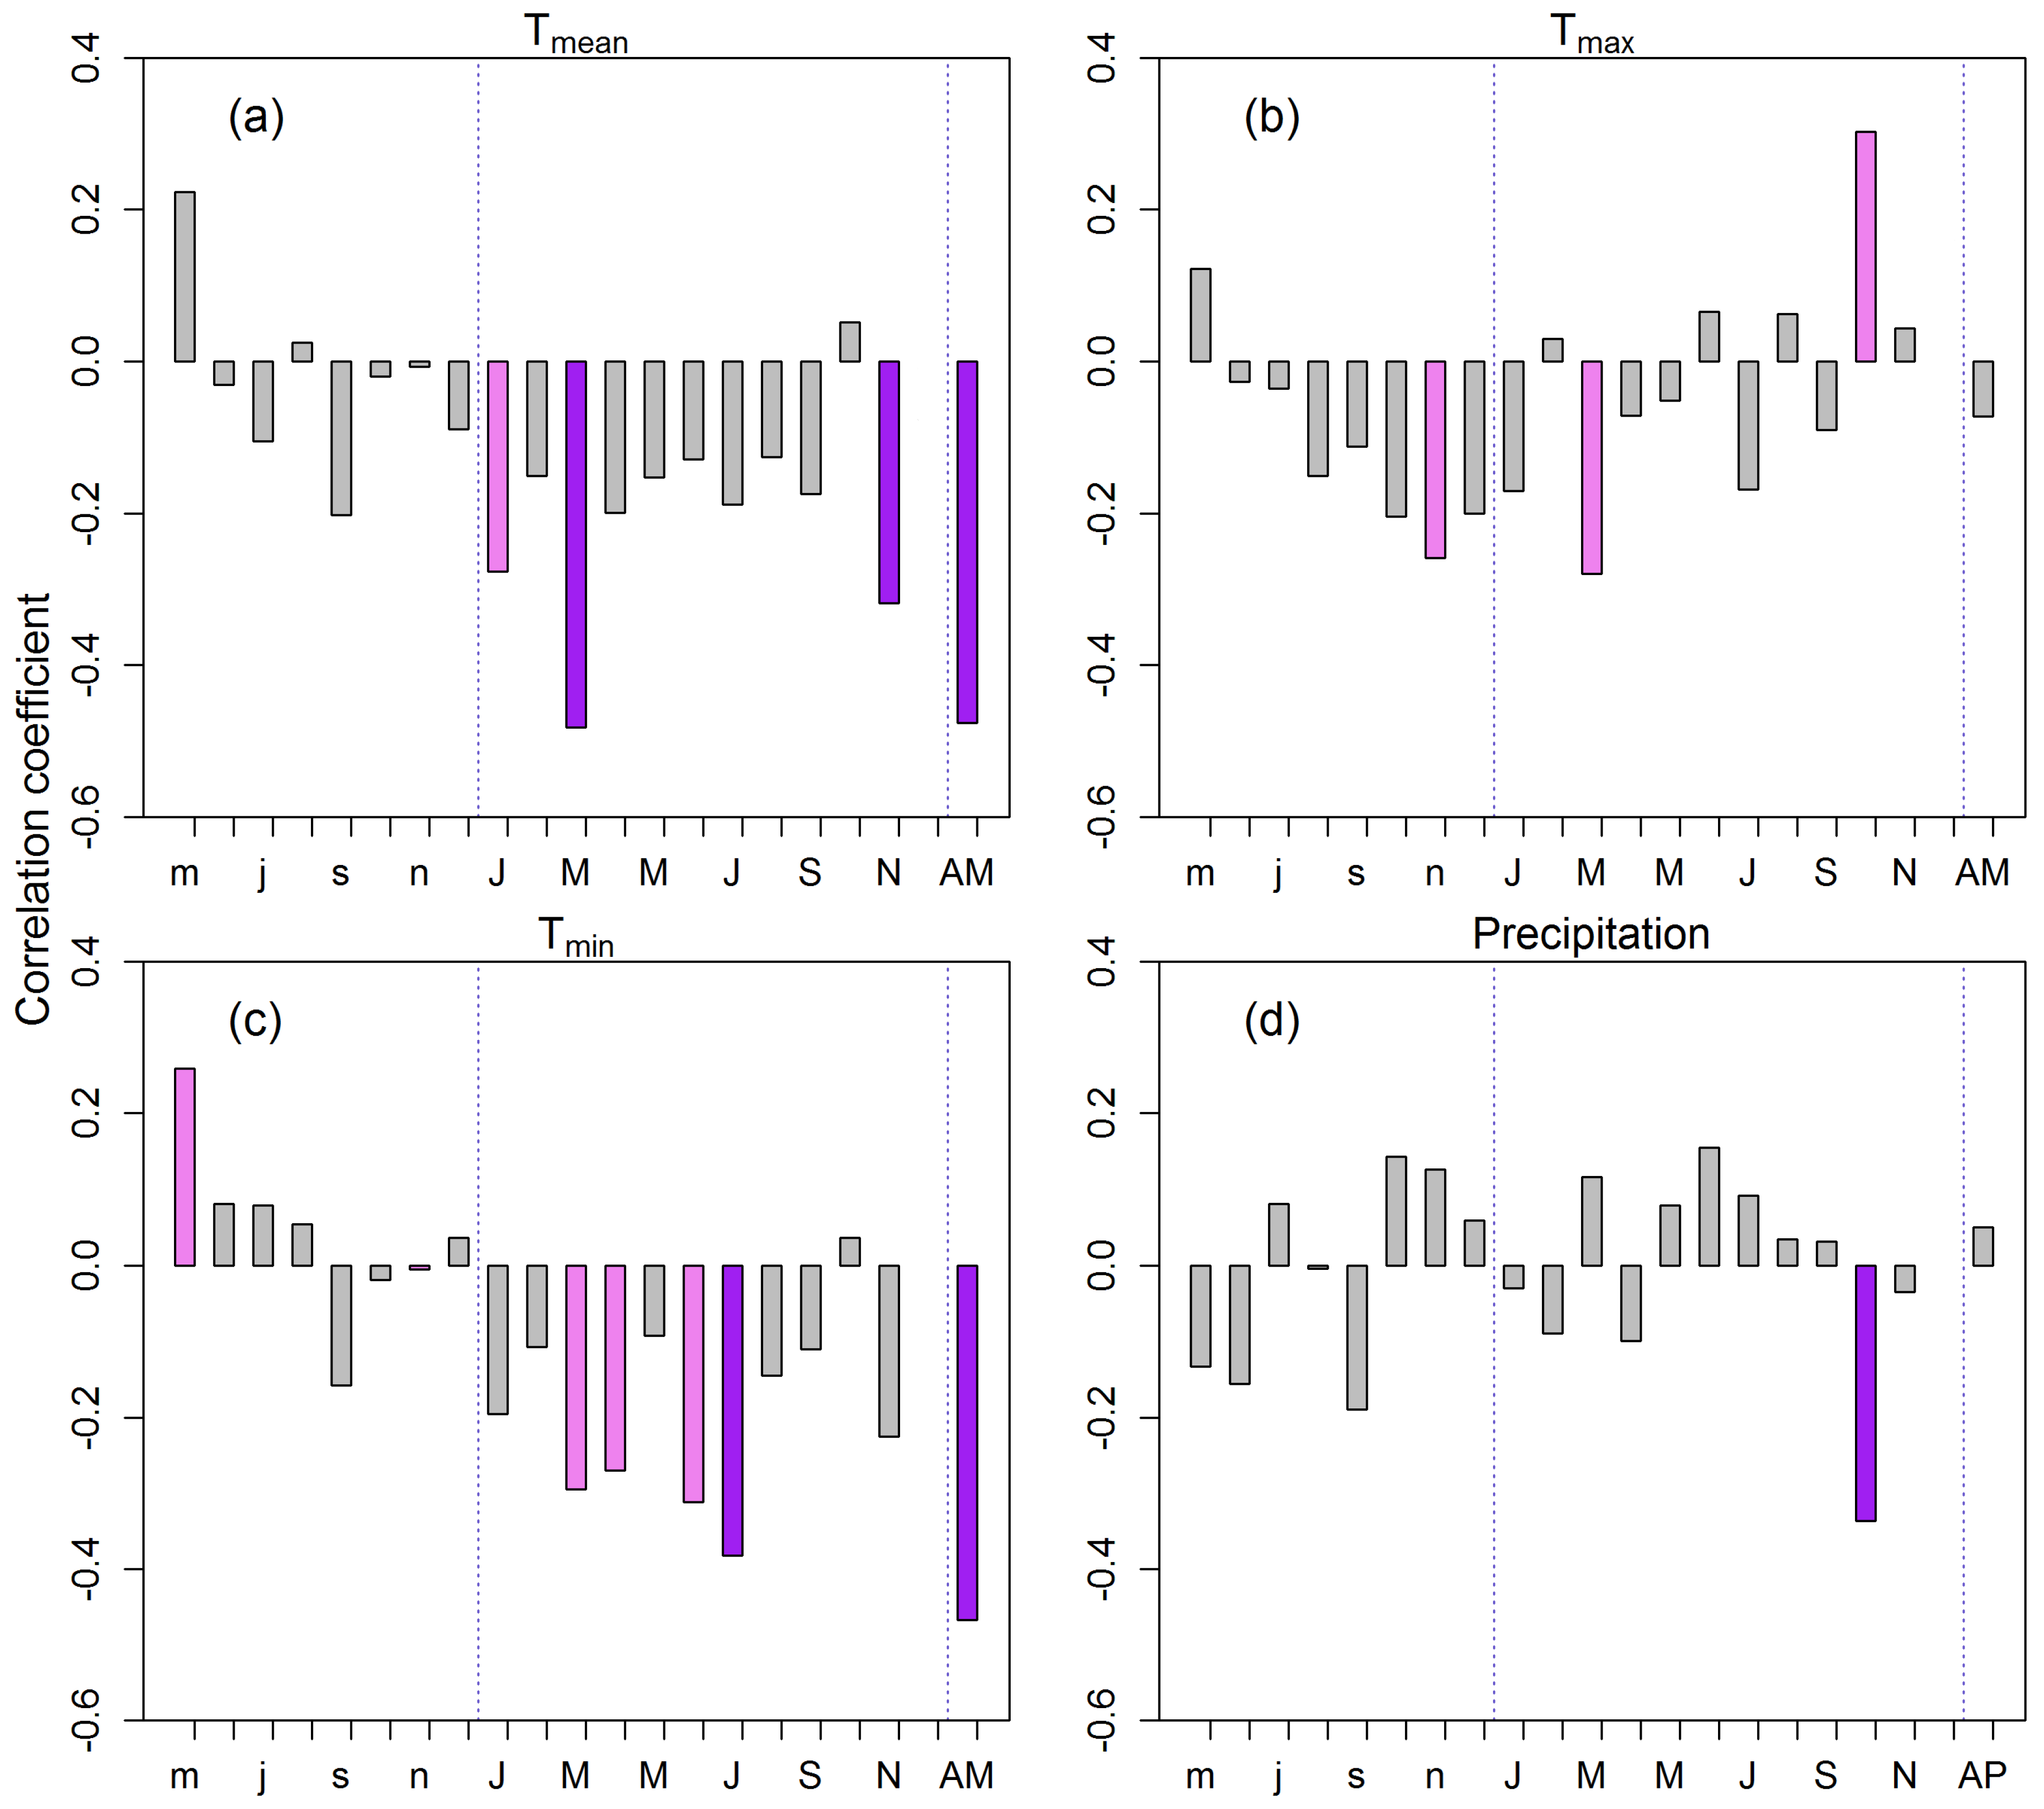
Tree growth was influenced by temperatures mainly during the early growing season. RWI was significantly correlated with monthly mean (Tmean), minimum (Tmin), and maximum (Tmax) temperatures registered at climate station Sreemangal (Figure 5a–c). Tree growth was negatively affected by Tmean in January, March, and November (early and late growing season), with the highest correlation of RWI with March temperature (r = −0.48, p < 0.001) occurring when evapotranspiration was high. Likewise, Tmax reduced tree growth in March, but positively affected tree growth in October. Negative correlations between RWI and Tmin were observed in the early and main growing seasons, particularly in March, April, June, and July. However, the highest correlation between RWI and Tmin was observed with mean annual Tmin (r = −0.47, p < 0.001). Current year October precipitation also negatively influenced tree growth (Figure 5d). Ring width was not correlated with precipitation of any other months of the year. Average annual temperatures (Tmean, Tmin) were strongly negatively correlated with tree growth, whereas annual precipitation sum had no significant influence on Chukrasia growth.
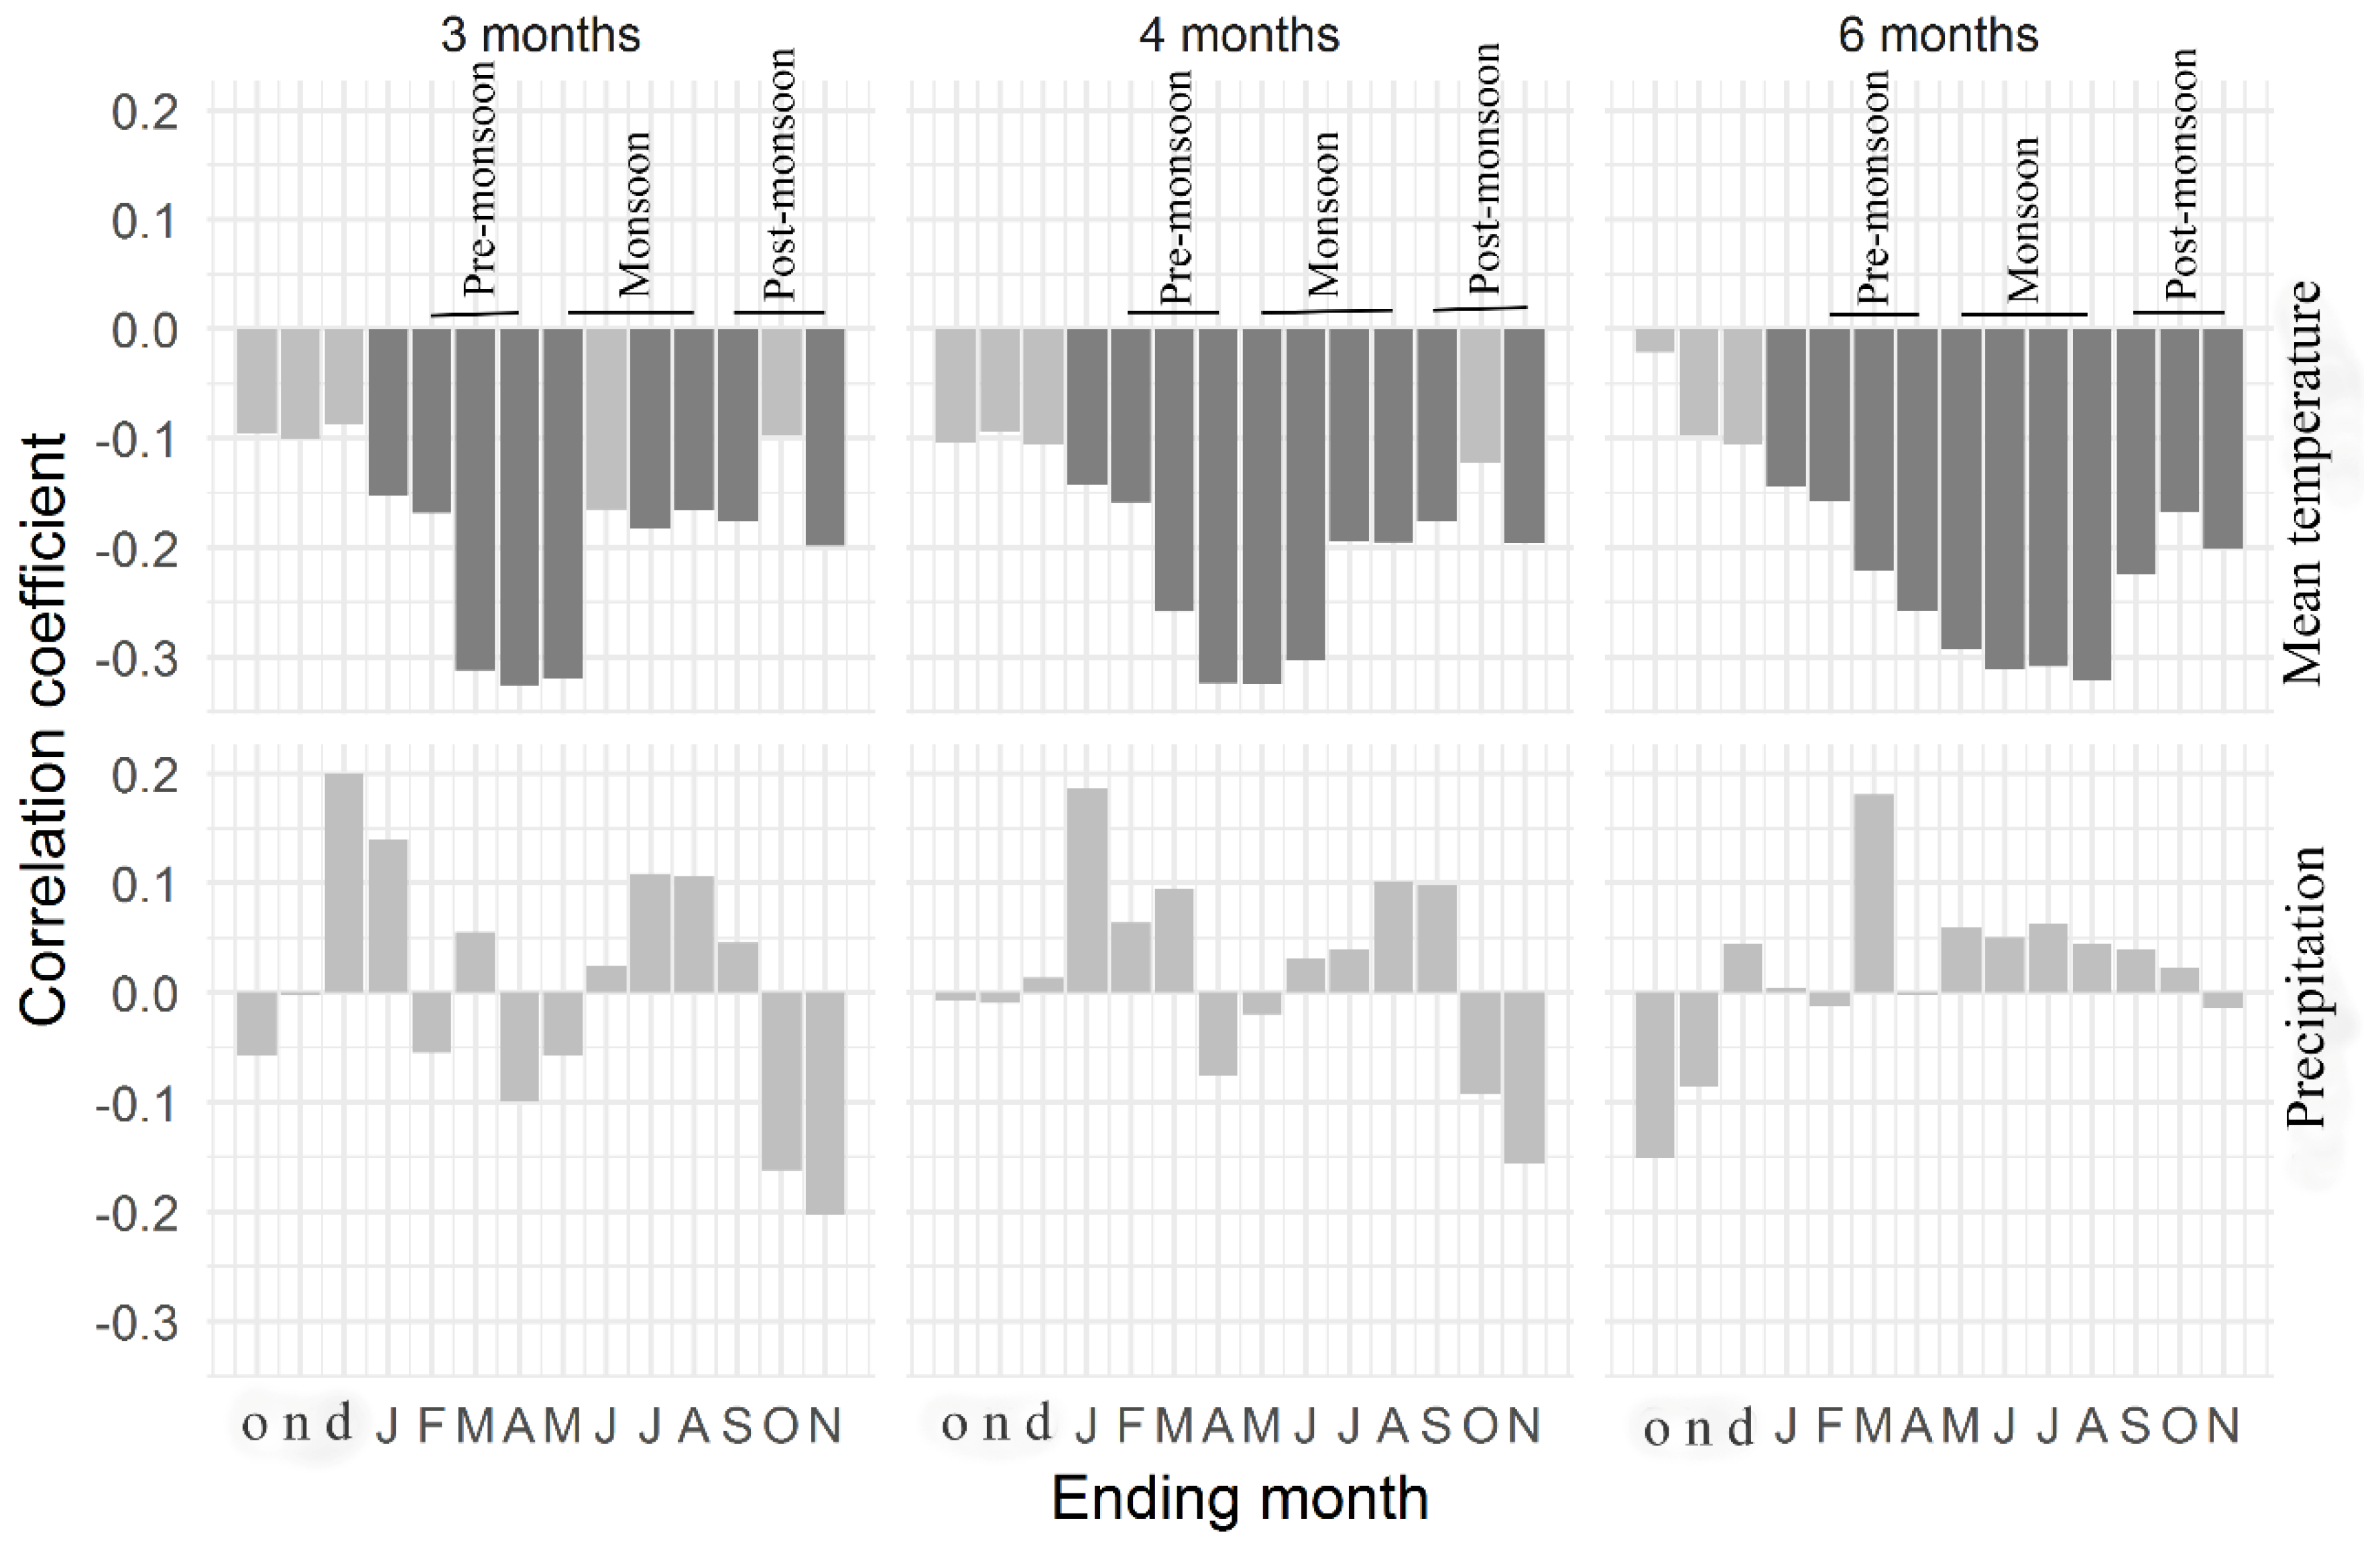
The seasonal correlation analysis showed strong negative correlations of RWI with pre-monsoon and monsoon temperatures (r = −0.34, p < 0.01) (Figure 6). Significant tree growth temperature relationships were observed during the pre-monsoon, monsoon, and post-monsoon season. Nevertheless, no significant correlations were found between RWI and seasonalized precipitation.
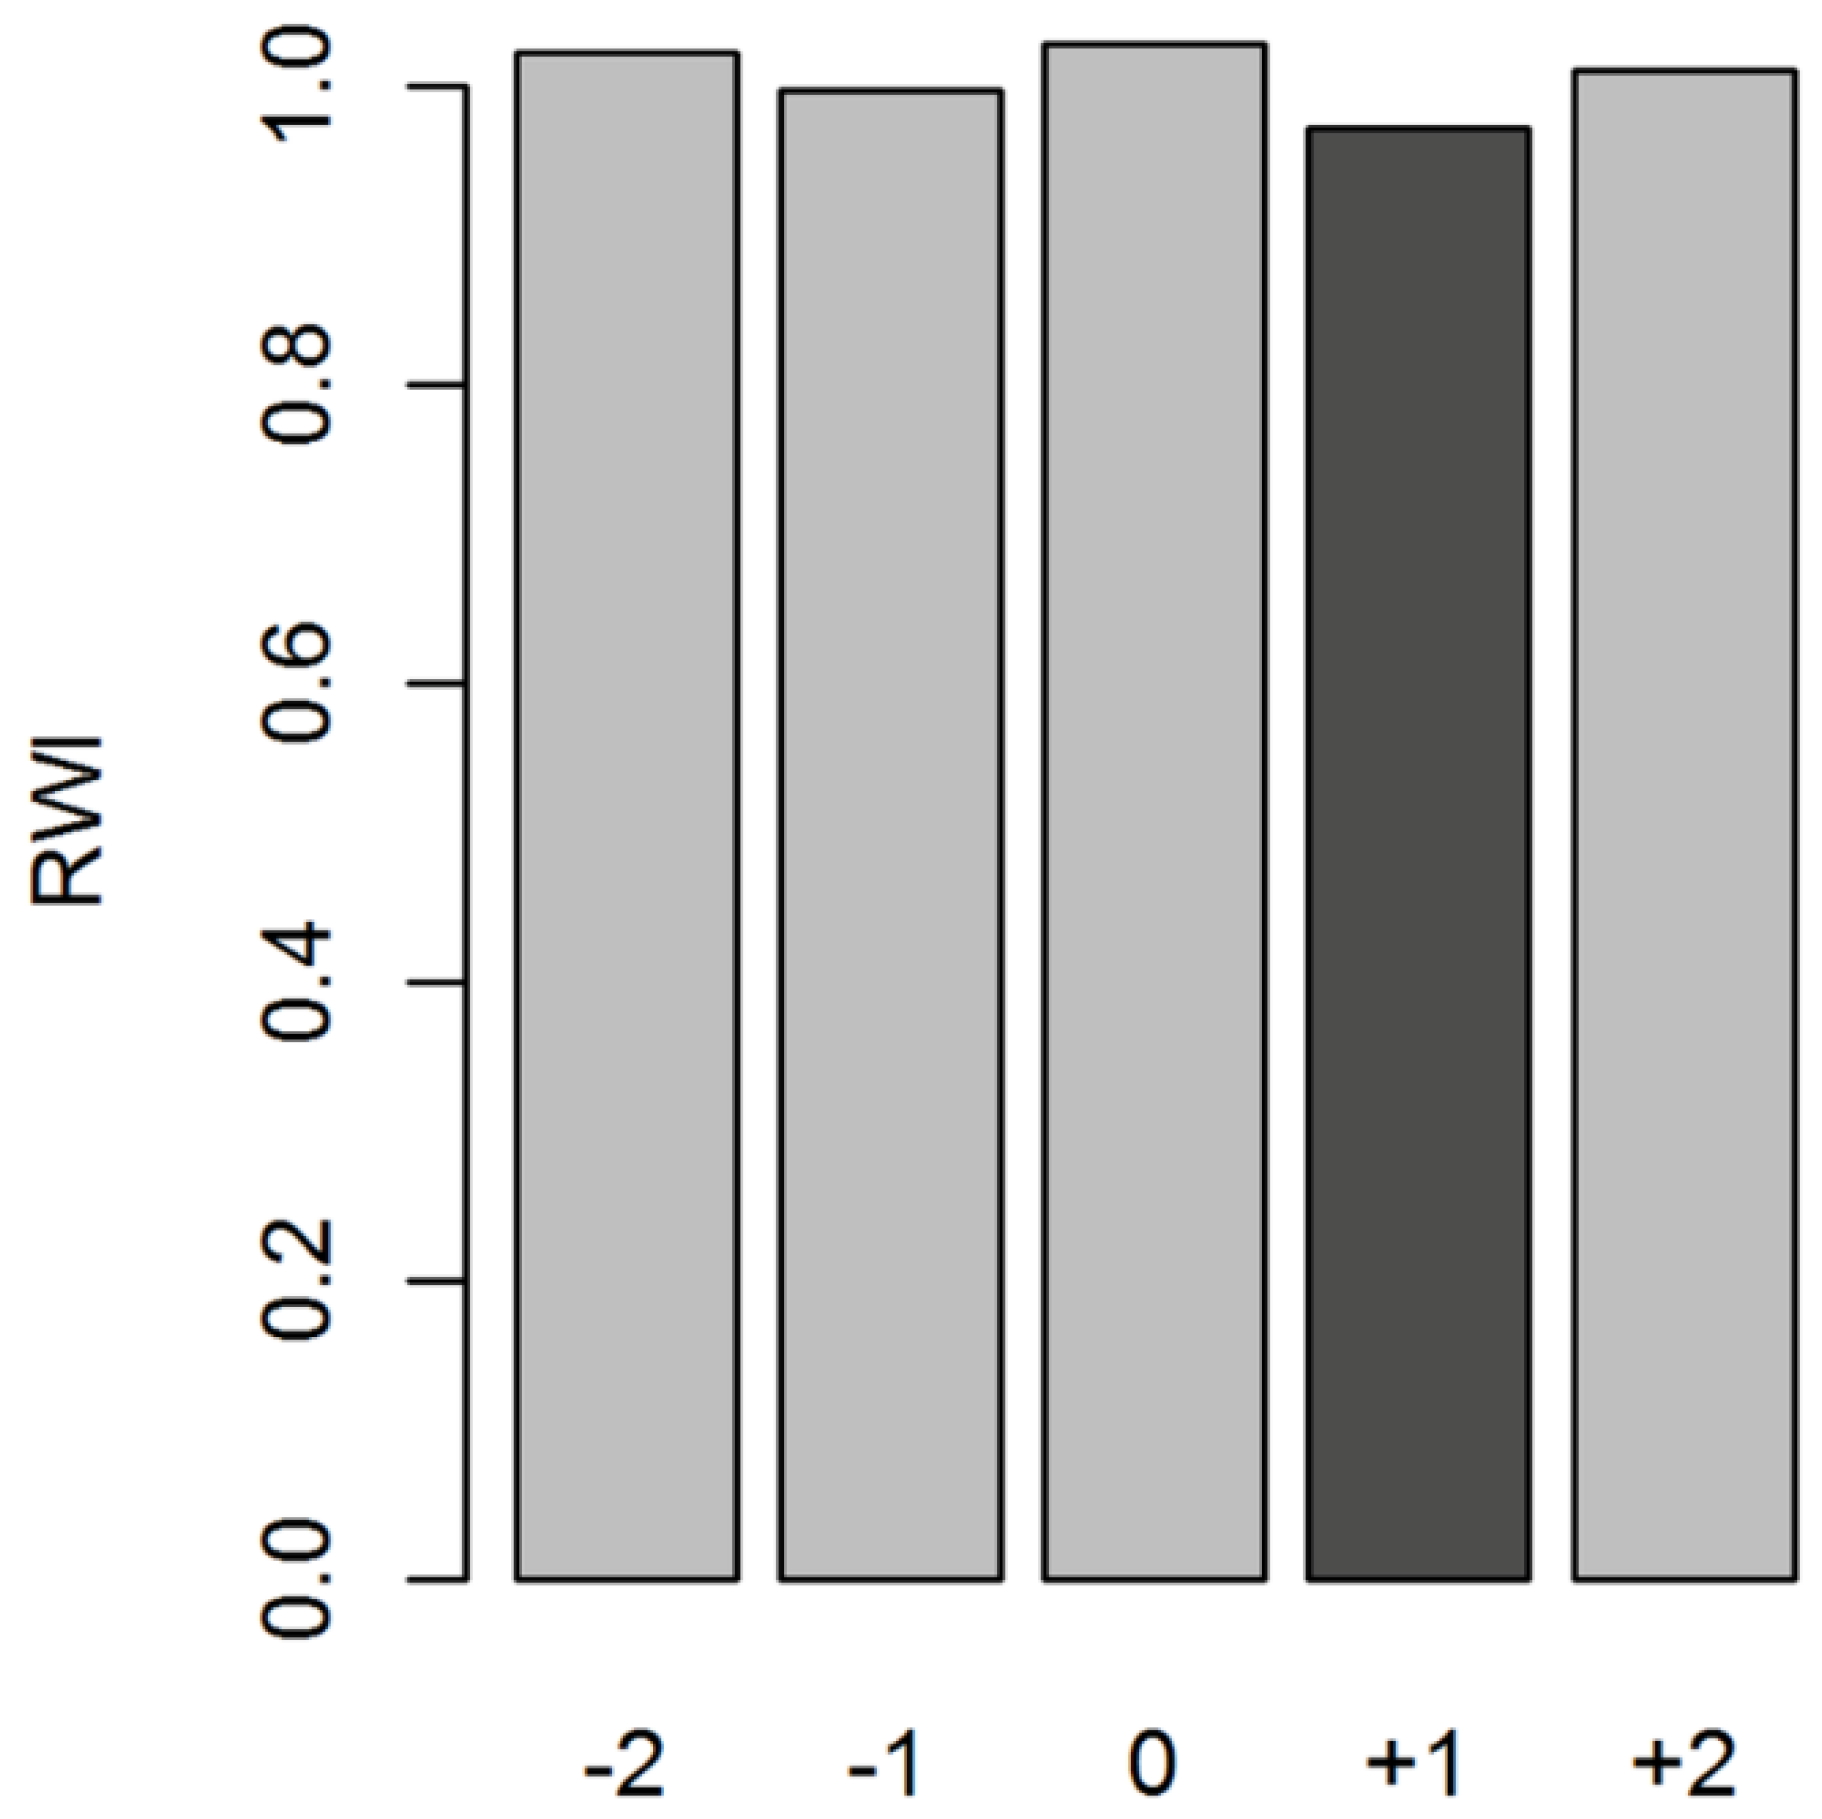
We did not find significant correlations between tree growth and relative humidity, PDSI, SPEI, and ISMI (data not shown). However, VPD was significantly negatively related to radial growth particularly in the early growing season (April) (r = −0.25, p < 0.05). SST anomalies of the Niño 3.4 region over 1950–2015 also showed a significant negative correlation (r = −0.37, p < 0.01) with tree growth in the following year. The influence of ENSO on tree growth is lagged by one year, likely because ENSO had an indirect effect on tree growth. We observed a clear positive relationship between previous year ENSO and current year mean temperature (r = 0.40, p < 0.001) (Figure S6). Thus, ENSO induced temperature rise might have reduced ring-width in our studied species. A superposed epoch analysis (SEA) confirmed the significant relationship of ENSO events and tree growth of C. tabularis in the following year (Figure 7).
3.3. Trends in Tree Growth Sensitivity to Climate Forcing
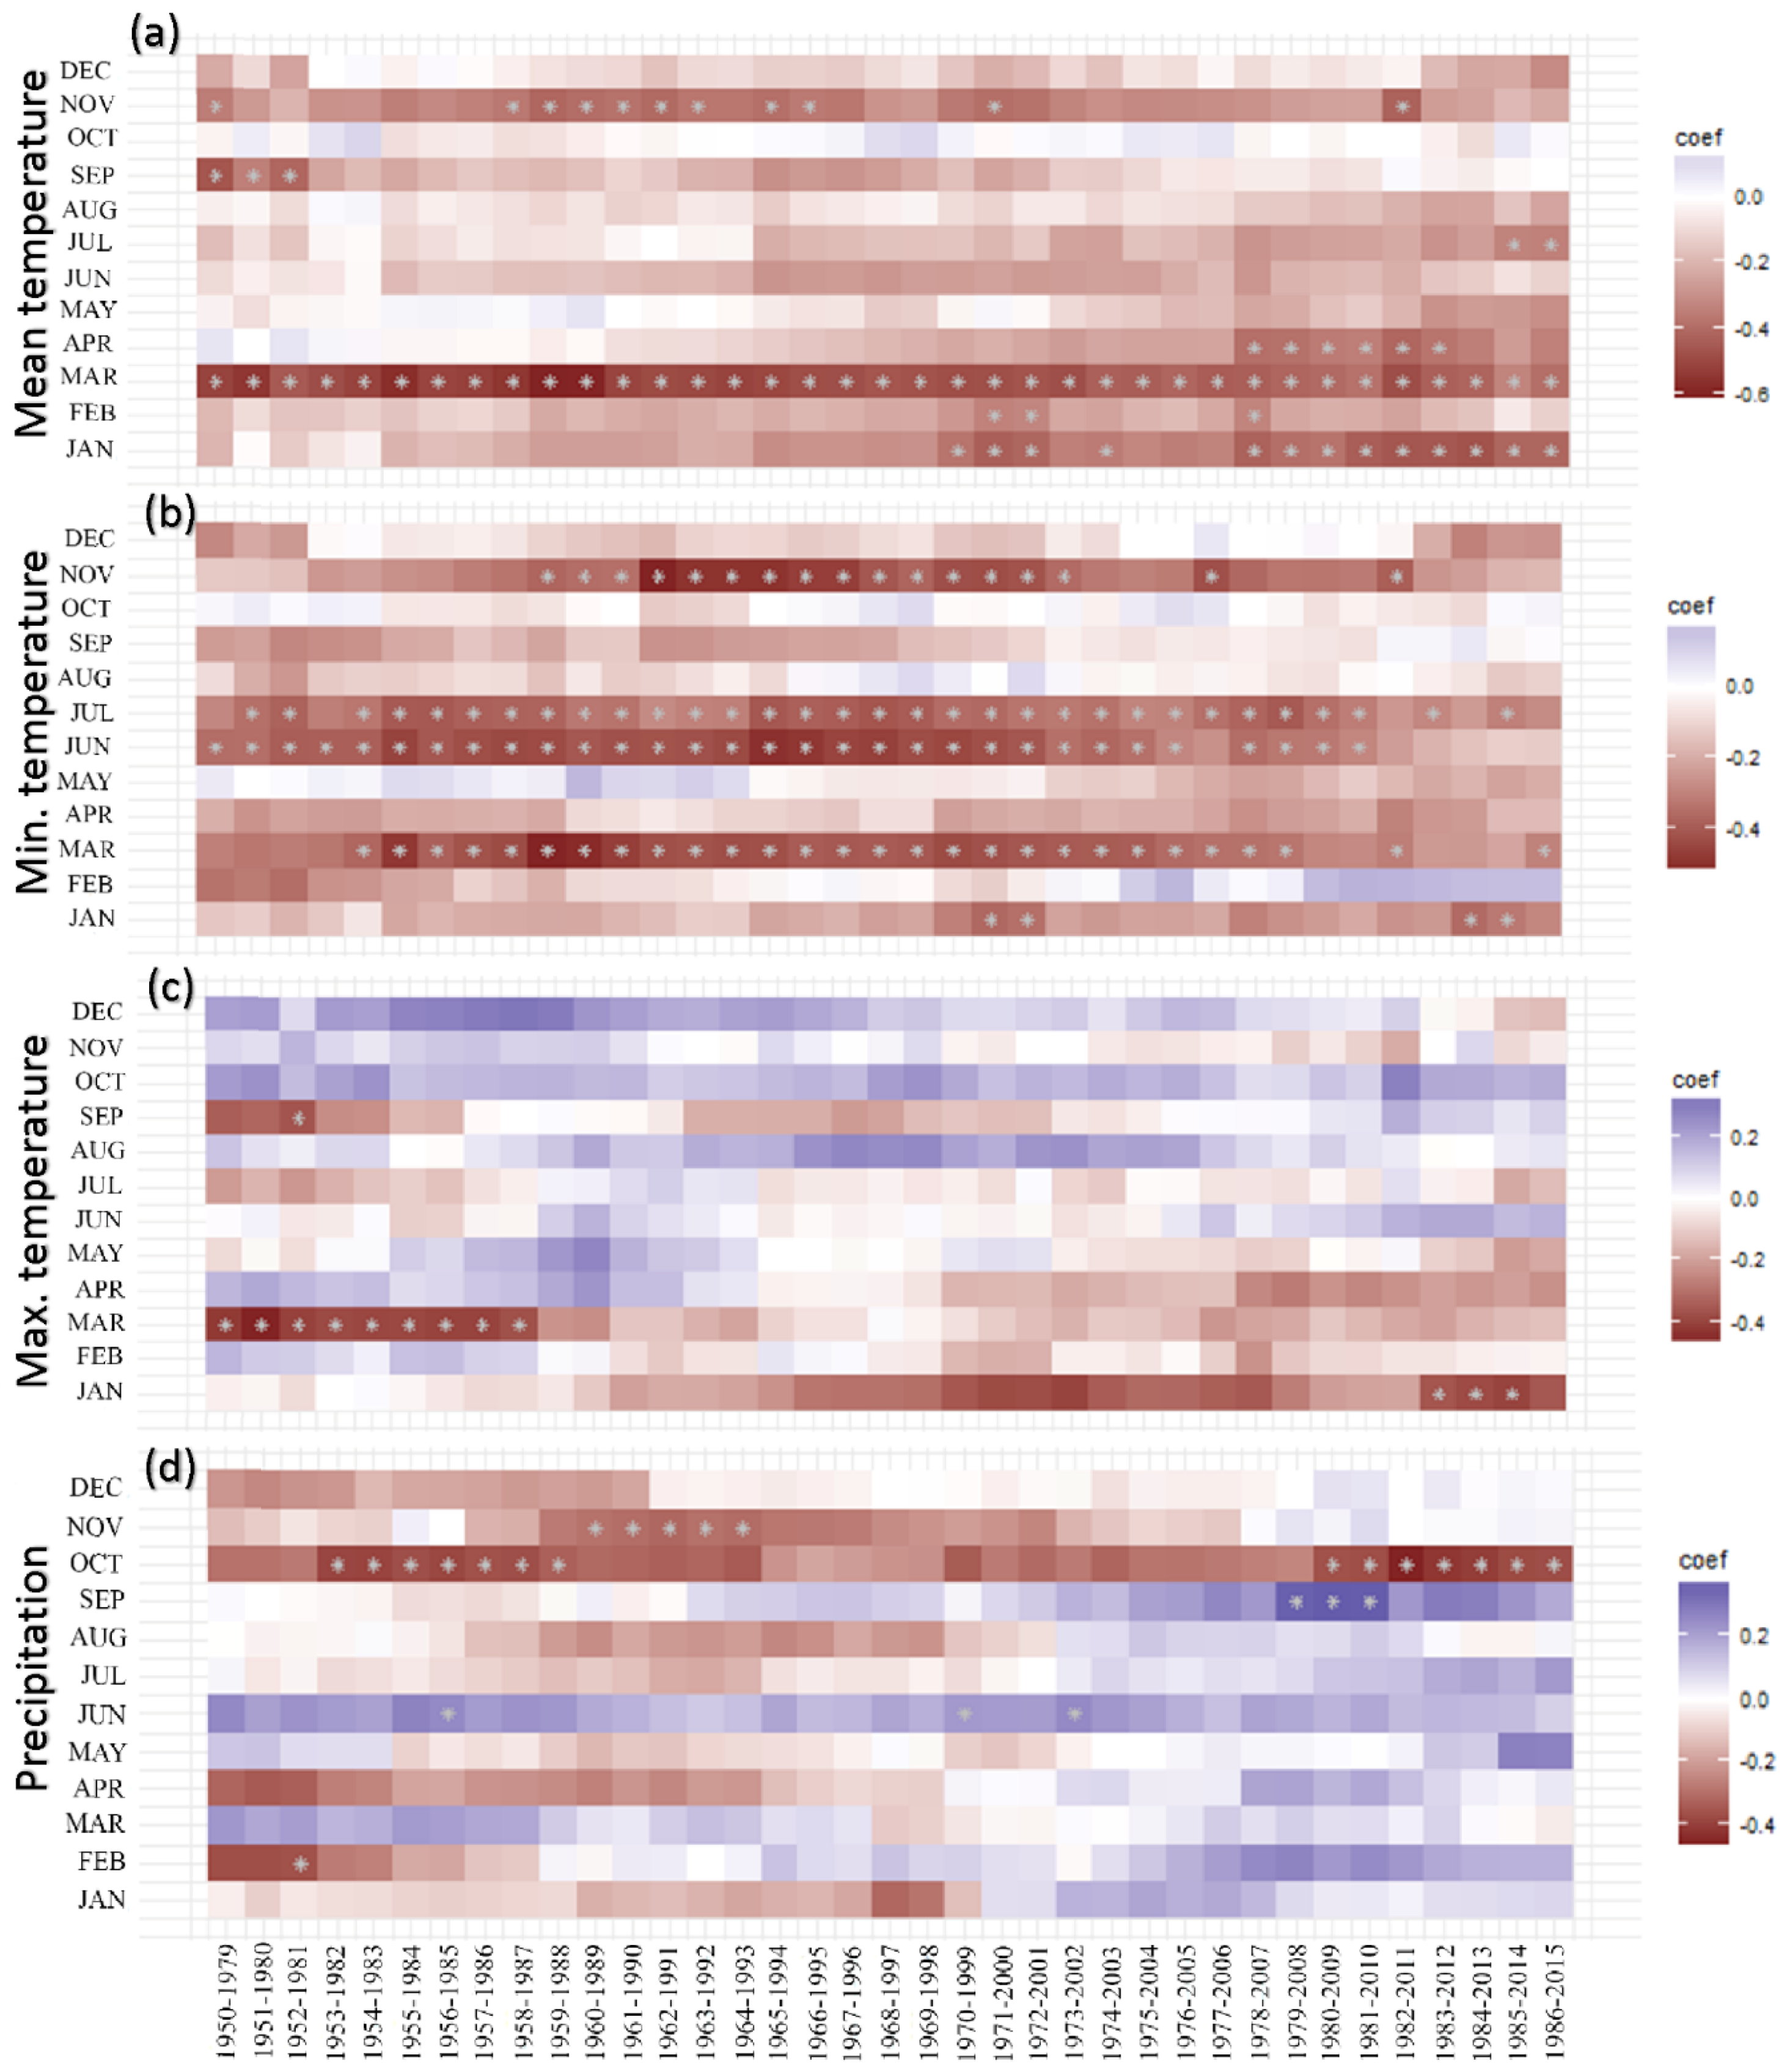
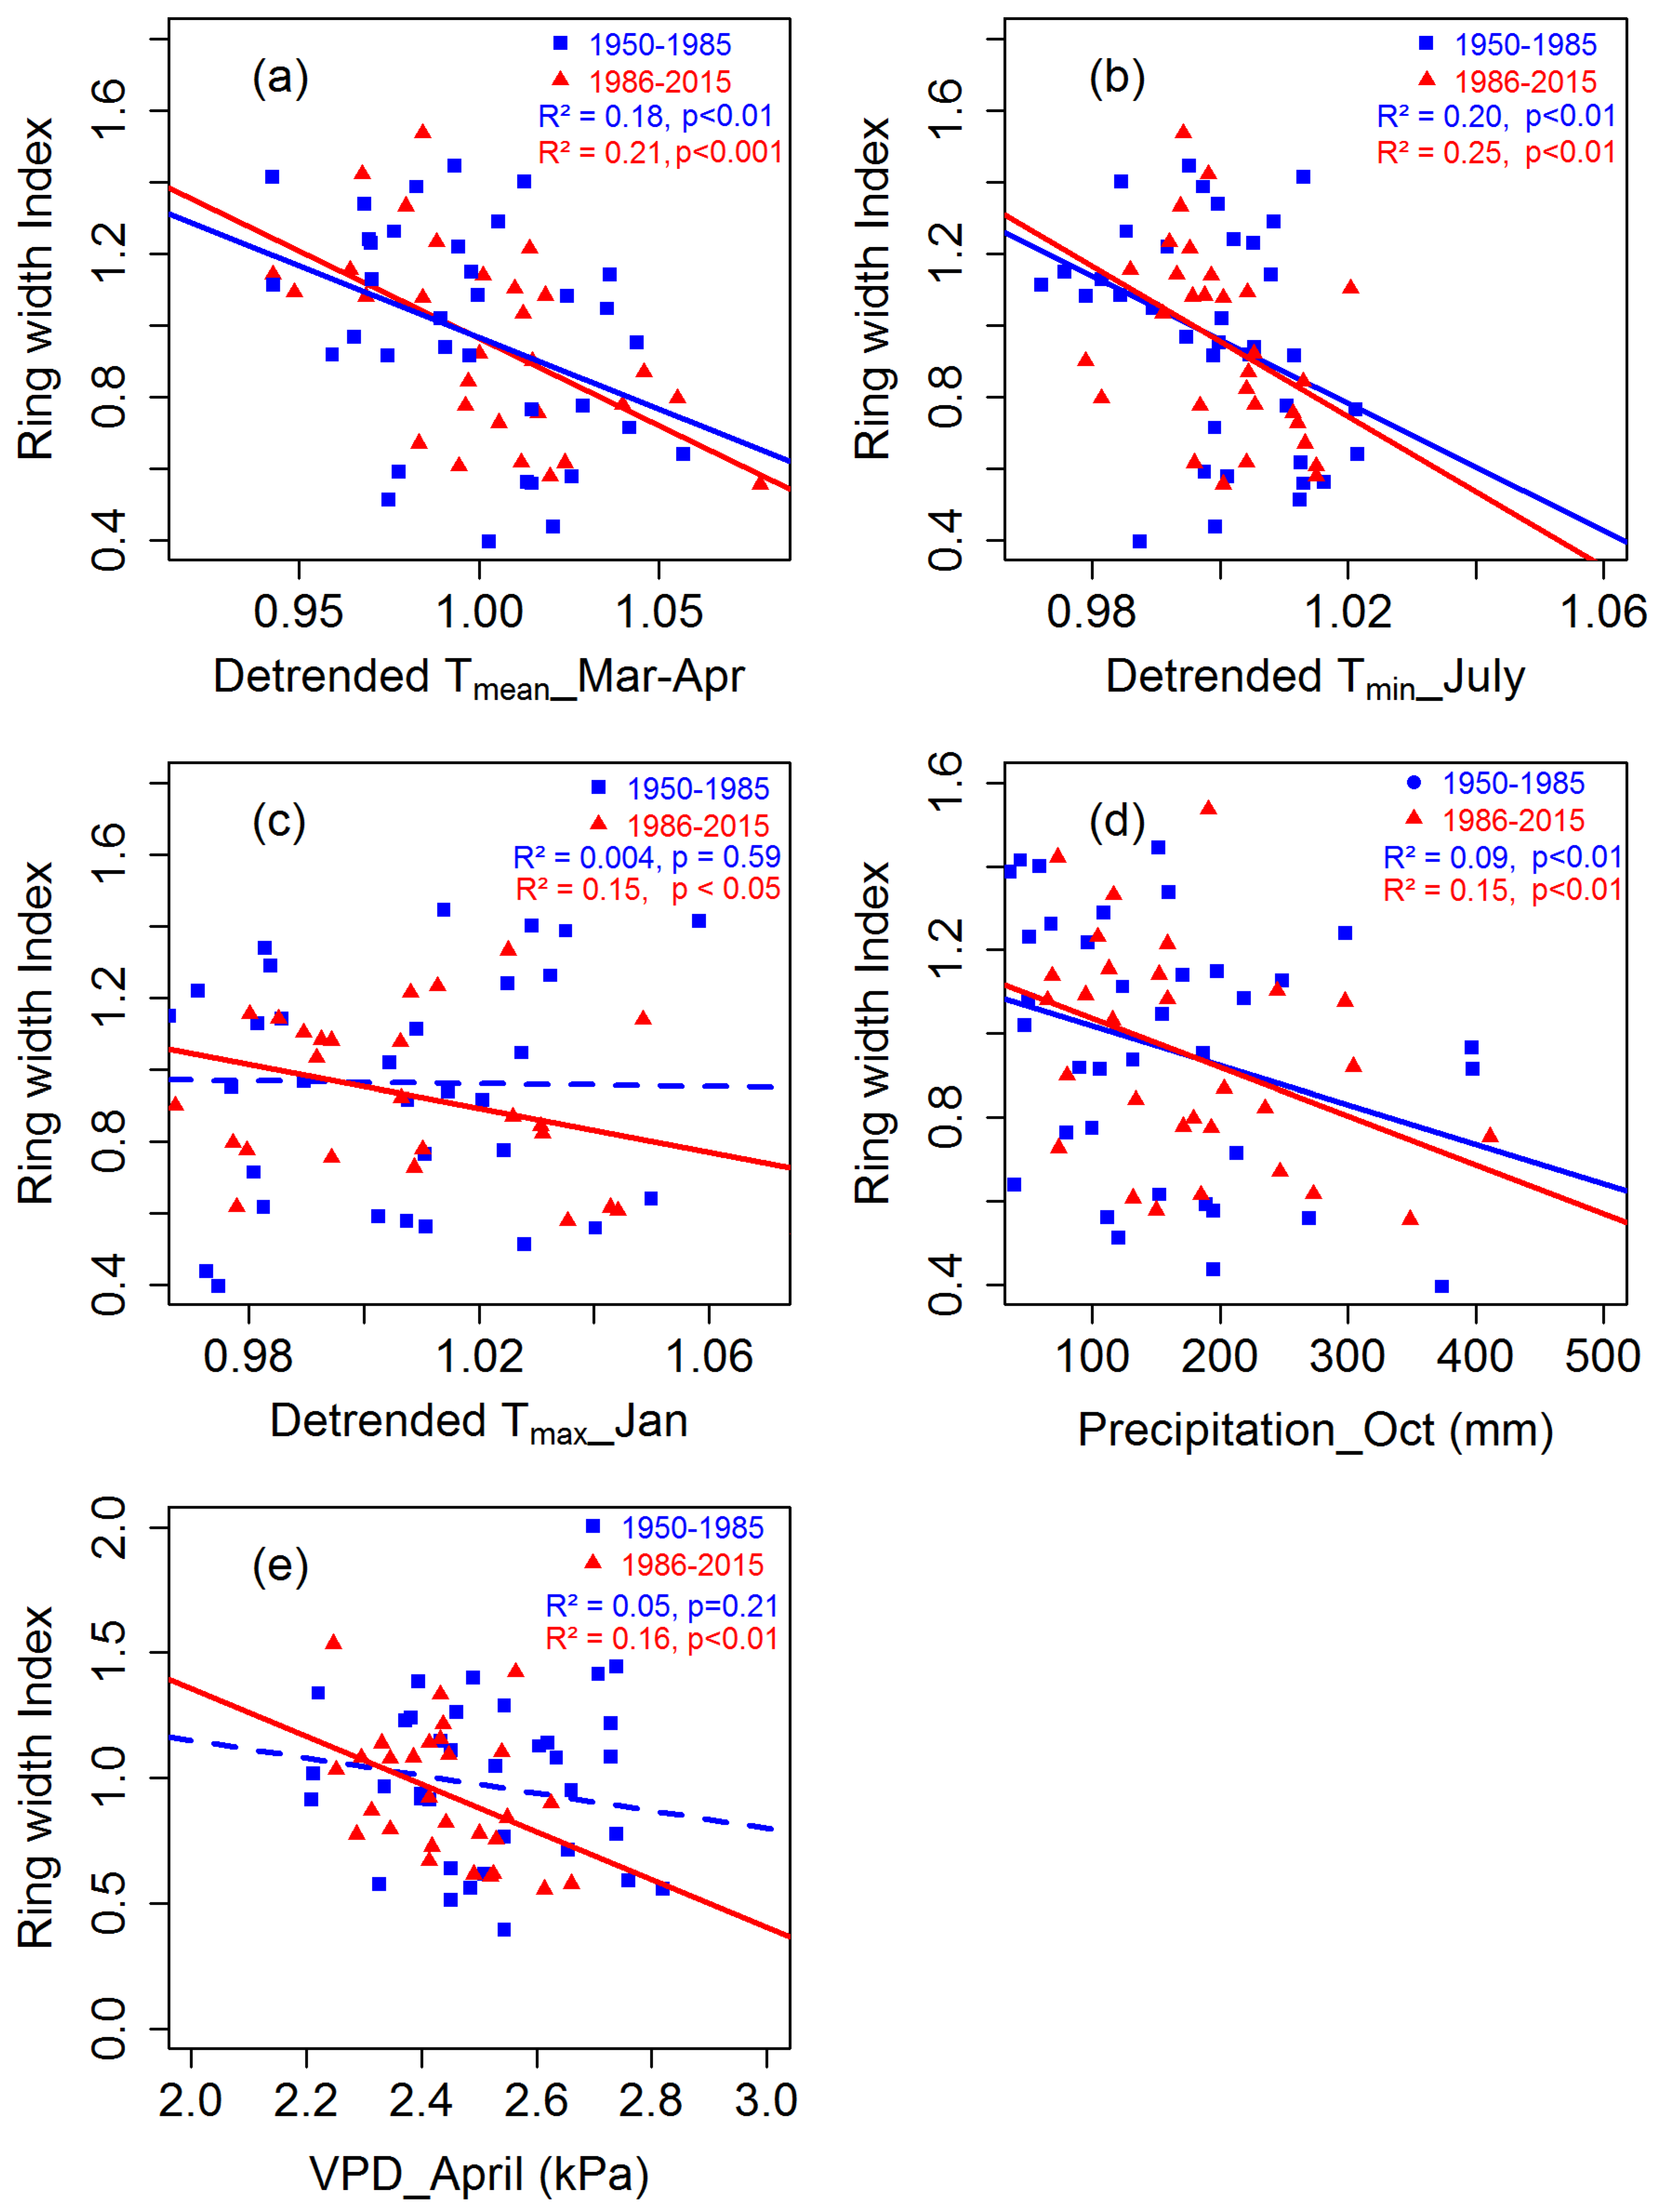
The moving correlation analysis showed an increasing trend in the tree growth sensitivity to climate factors (Figure 8). Tree growth response to March Tmean remained consistent throughout the analyzed period (1950–2015) (Figure 8a). In contrast, tree growth sensitivity to dry season (January–February) and pre-monsoon season (February–April) Tmean increased. The relationship between tree growth and Tmin in the drier months (January and November) was not stable, although the relations remained almost consistent during the wetter months (June–July) (Figure 8b). Overall, the relationships between temperatures (Tmean, Tmin) and tree growth calculated over 1986–2015 were more significant than the relationships calculated over 1950–1985 (Figure 9a,b). Tree growth sensitivity to March Tmax was consistent up to the year 1987 and disappeared afterwards, whereas tree growth/January Tmax correlations during the recent decades became stronger (Figure 8c). Overall, tree growth became more sensitive to Jan Tmax for the period 1986–2015 than for the period 1950–1985 (Figure 9c).
The positive influence of June precipitation on tree growth disappeared, while the positive relationship between tree growth and September precipitation became prominent during the recent years. On the other hand, the negative correlations between tree growth and October precipitation were variable throughout the analyzed period (Figure 8d). Overall, growth sensitivity to October precipitation increased during the recent decades, as illustrated by the more significant relationships in regression analysis (Figure 9d). Growth sensitivity to VPD in March disappeared, but sensitivity to April VPD recently became significant (Figure S7 and Figure 9e).
4. Discussion
4.1. Signal Strength of the RWI Chronology
Chukrasia tabularis trees from two sites were successfully crossdated. Particularly for tropical trees, crossdating is essential to assure annual growth structures rather than tree-ring alike structural xylem features. Crossdating of ring-width time-series between individual trees and between multiple sites in a region provides strong evidence that the growth rings are indeed annual and are not arbitrary structural features of the xylem [82]. Our results are in line with the previous study confirming the annual growth-ring formation of this species [60]. The derived regional RWI chronology contains a strong common environmental signal, as indicated by the statistical parameters series inter-correlation (SIC), EPS, MS, and SNR (Table 1).
The chronology signals, such as SIC, MS, and SNR, reported in this study are of similar magnitude to those reported for other tropical tree species [15,19,20,23,83,84]. However, the running EPS dropped below 0.85 before 1927, thus currently limiting the suitability of our chronology for longer paleoclimatic reconstruction. Because the most important source of variation in EPS is series replication, the reliable part of the chronology could be extended back by adding more old trees to the chronology.
4.2. Climate–Growth Relationships
We observed significant negative correlations between tree growth and temperatures (Tmean, Tmin, and Tmax). Mean and maximum temperatures influenced tree growth mainly in the early growing season (Figure 5). In contrast, tree growth was influenced by Tmin throughout the growing season. A strong growth response to the temperatures (Tmean, Tmax) in the early and later growing season could be explained by the higher evapotranspiration outside the main monsoon season. At the end of the dry season, the environment becomes extremely dry and is characterized by low relative humidity, higher vapor pressure deficit, and low soil moisture content. An increase in temperature during that time further increases water stress, which might limit tree growth [27]. Temperature-driven higher evapotranspiration was reported to cause growth decline in some earlier studies of the same species [26,59]. Negative associations between tree growth and temperatures were reported for many tropical forest sites [19,25,75,85], as well as for circumboreal forests [76,77].
Higher temperatures may reduce air–water potential and increase evapotranspiration and autotrophic respiration [86,87]. All these physiological processes have the potential to reduce carbon assimilation in higher plants [27,86,87,88]. It is claimed that the respiration rate in tropical forests multiplies twice as a response to an increase in temperature of 10 °C [89], and that higher temperatures increase maintenance costs of plant tissue [90]. A very strong negative correlation of ring-width with minimum temperature (night time temperature) indicates evidence of respiration-related growth reduction in our studied species. However, the respiration theory of carbon loss due to higher temperatures is controversially discussed in some studies, concluding that plants can acclimate relatively quickly to such changes [91,92]. Also, higher VPD increases evapotranspiration, creating a drier environment, especially during the pre-monsoon season [93]. It is thus reasonable that with an increase in VPD, radial growth of C. tabularis declined in the early growing season.
We found a significant correlation between tree growth and current year October precipitation. At the end of the monsoon season, the soils are moisture saturated. An increase in precipitation in October may further increases soil moisture in our study sites. C. tabularis trees prefer well drained soils and cannot withstand water saturation due to anoxic root conditions [58]. However, these findings are in contrast with the results of other studies from tropical dry forest ecosystems [15,18,19,20,21,22,94,95] and north latitudinal boreal forests [76,77]. Our study sites are influenced by the tropical monsoon climate with a mean annual rainfall of 2367 mm, and do not allow direct comparison with findings reported in tropical dry forest sites.
Large-scale climate drivers, such as SST anomalies of the Niño 3.4 region, negatively affected tree growth in the year following strong and moderate El Niño events (Figure 7). This result generally implies that El Niño events have a long lasting influence on C. tabularis growth. Such lag effects of ENSO events were also observed in other tropical regions [20]. A significant periodicity of two to four years in the wavelet spectra of tree-ring chronology also provides indirect evidence of a significant influence of the SSTs in the Niño 3.4 region [96]. During the period 1910–1940, a prominent ~6–12 years periodicity was observed, but because of low sample size (<10 cores) and low EPS values, before 1927, we interpret this early part of the chronology with great caution. It is interesting to note that a study on Heritiera fomes in Bangladesh observed no links between tree growth and ENSO events [48]. These contrasting results call for developing additional tree-ring chronologies of different tree functional types and for developing a tree-ring network in the humid tropics to understand spatial variations in the tree-ring climate response patterns.
4.3. Stationarity and Consistency in Tree Growth Sensitivity to Climatic Changes
Tree growth was found to be more sensitive to mean and minimum temperatures during recent decades (1986–2015) when compared with early decades of the last half of the 20th century (1950–1985). We also found a shift in tree growth sensitivity to maximum temperatures and annual precipitation during the recent decades, although these trends were not statistically significant. A clear increasing trend in growth sensitivity to VPD was also observed. Moving correlation functions suggest consistent tree growth sensitivity to March Tmean, but increasing sensitivity to dry periods and pre-monsoon Tmean and Tmin. A trend analysis of the rainfall variability and the length of wet and dry periods in Bangladesh confirmed the increasing trend in the length of dry months in most parts of Bangladesh, including our study region [45]. Increasing dry season length is also obvious in the climate diagram of the two sub-periods (Figure 2). Long-term data on leaf phenology are useful to get insights into possible shifts of the growing season. Unfortunately, such data are absent in our study area. However, according to the observation of forest managers and local people, it is evident that leaf shedding behavior has changed in our studied forests and that the unfolding of new leaves in recent years sets in earlier than before. The evolution of the growth response to Jan Tmax and the disappearance of the correlation with March temperature during the recent decades may also be explained by these seasonal shifts and their influence on tree growth. Thus, the warmer temperatures during the second half of the 20th century seemed to trigger a temperature sensitive period, as well as a moderate lengthening of the growing season.
Increasing tree growth sensitivity to climate reported in our study is consistent with the findings for white spruce in Alaska [36]; Douglas fir in Salmon River valley, Idaho [33]; Abies alba in northern Spain [97]; European larch in the Italian Alps; and pine in Iberian Peninsula [98], but contrasts with the hemisphere-wide decrease in the sensitivity of northern tree growth to summer temperatures in recent decades [31]. In moist tropical forests, change in climatic response has not yet been studied, which does not permit comparison of our results with similar forest types or species. Nevertheless, increasing tree growth sensitivity to average annual mean, minimum, and maximum temperatures reported in this study are in agreement with the increasing trend of these local climate variables (Figure S3). Our study highlights that significantly increasing temperatures may increase the water stress particularly during the early growing season, leading to increasing tree growth sensitivity to recent climate conditions. Investigations of the temporal stability of climate–growth relationships in tropical humid environments are rare, but very important for predicting tree-growth under future climate change. Future modelling studies should consider the stability of climate–growth relationships to reduce the uncertainty of the model output, particularly if prediction of species-specific radial growth is the main objective.
5. Conclusions
Overall, the growth sensitivity of C. tabularis to climate forcing tends to increase over time. Likewise, the trend analysis of climate variables in our study sites showed statistically significant increasing trends in mean, minimum, and maximum temperatures (Figure S3), which is consistent with the observed global temperature trend. As this trend is expected to continue throughout the current century [41], our results suggest that radial growth of C. tabularis will decline in future in Bangladeshi moist tropical forests. This is supported by reports of a warming-induced growth decline in C. tabularis in dry tropical forests in western Thailand [59]. If the declining growth trend continues throughout the current century, it would have influence on the global carbon cycle as a result of reduced atmospheric carbon uptake by tropical trees in the monsoon region. Our study conducted in two South Asian moist tropical forests clearly shows that dendroclimatic studies have the potential to infer long-term tree-growth response to climate change. Such studies should be extended to other moist forest sites to explore how the same species responds to climate change in different tropical environments. In similar ways, growth response of other widely distributed tree species occurring across the tropics should also be tested to get insights into the long-term growth trends of tropical trees in a climate change context.
Supplementary Materials
The following are available online at https://www.mdpi.com/1999-4907/9/12/761/s1, Figure S1: Photographs showing the forest stands of study sites. (a) A forest stand close to the forest boundary in RKWS (b) Forest interior in RKWS (c) A mature C. tabularis tree with the canopy in LNP, Figure S2: (a) High magnification digital microscopic images of C. tabularis showing characteristic wood anatomical features. (b) A portion of stem disk of a C. tabularis tree showing growth ring boundaries and the measurement areas (Darker zones). (c) Scanned sample of an increment core of C. tabularis. White triangles indicate growth-ring boundaries. Arrows indicate growth directions, Figure S3: Trends in climate variables over the period 1950 to 2001, Figure S4: Site chronologies (right panels) and raw ring-width time series (left panels) of C. tabularis from two moist forest sites in Bangladesh. RKWS = Rema-Kalenga Wildlife Sanctuary, LNP = Lawachara National Park, Figure S5: Principal Component Analysis (PCA) of the two site chronologies, Figure S6: Relationship between Nino 3.4 SST anomalies and mean temperatures of years following an ENSO event in the study area, Figure S7: Moving correlations (30 years window) of RWI chronology and vapor pressure deficit (VPD) for the period over 1950–2015, Table S1: Characteristics of Chukrasia tabularis site chronologies from two moist forest sites in Bangladesh.
Author Contributions
M.R. and A.B. conceived and designed the study. M.R. and M.I. performed field and laboratory work, analyzed data, interpreted results, and wrote the manuscript. J.W. prepared the study site map. A.B. supervised this research. A.B. and J.W. provided editorial advice.
Funding
The study was funded by the German Academic Exchange Service (DAAD) (Grant No. 57129429).
Acknowledgments
We are grateful to the Bangladesh Forest Department (BFD) for providing necessary supports during the fieldwork. We sincerely acknowledge the cordial assistance in the field work of Sumon Reza, Rofiqul Islam, Swapan Miah, and many undergraduate students of the Department of Forestry and Environmental Science, Sahjalal University of Science and Technology, Bangladesh. Three anonymous reviewers are sincerely acknowledged for their valuable suggestions to improve the earlier version of the manuscript.
Conflicts of Interest
The authors declare no conflict of interest.
References
- Bonan, G.B. Forests and climate change: Forcings, feedbacks, and the climate benefits of forests. Science 2008, 320, 1444–1449. [Google Scholar] [CrossRef]
- Beer, C.; Reichstein, M.; Tomelleri, E.; Ciais, P.; Jung, M.; Carvalhais, N.; Rodenbeck, C.; Arain, M.A.; Baldocchi, D.; Bonan, G.B.; et al. Terrestrial gross carbon dioxide uptake: Global distribution and covariation with climate. Science 2010, 329, 834–838. [Google Scholar] [CrossRef]
- Grace, J. Understanding and managing the global carbon cycle. J. Ecol. 2004, 92, 189–202. [Google Scholar] [CrossRef] [Green Version]
- Houghton, R.A.; Hall, F.; Goetz, S.J. Importance of biomass in the global carbon cycle. J. Geophys. Res. Biogeosci. 2009, 114. [Google Scholar] [CrossRef] [Green Version]
- Le Quéré, C.; Raupach, M.R.; Canadell, J.G.; Al, G.M. Trends in the sources and sinks of carbon dioxide. Nat. Geosci. 2009, 2, 831–836. [Google Scholar] [CrossRef] [Green Version]
- Brown, S.; Lugo, A.E. Trailblazing the carbon cycle of tropical forests from puerto rico. Forests 2017, 8, 101. [Google Scholar] [CrossRef]
- Djomo, A.N.; Knohl, A.; Gravenhorst, G. Estimations of total ecosystem carbon pools distribution and carbon biomass current annual increment of a moist tropical forest. For. Ecol. Manag. 2011, 261, 1448–1459. [Google Scholar] [CrossRef]
- Pan, Y.; Birdsey, R.A.; Fang, J.; Houghton, R.; Kauppi, P.E.; Kurz, W.A.; Phillips, O.L.; Shvidenko, A.; Lewis, S.L.; Canadell, J.G.; et al. A large and persistent carbon sink in the world’s forests. Science 2011, 333, 988–993. [Google Scholar] [CrossRef] [PubMed]
- Alvarez-Clare, S.; Mack, M.C.; Brooks, M. A direct test of nitrogen and phosphorus limitation to net primary productivity in a lowland tropical wet forest. Ecology 2013, 94, 1540–1551. [Google Scholar] [CrossRef] [PubMed] [Green Version]
- Doughty, C.E.; Metcalfe, D.B.; Girardin, C.A.J.; Amezquita, F.F.; Durand, L.; Huaraca Huasco, W.; Silva-Espejo, J.E.; Araujo-Murakami, A.; da Costa, M.C.; da Costa, A.C.L.; et al. Source and sink carbon dynamics and carbon allocation in the Amazon basin. Glob. Biogeochem. Cycles 2015, 29, 645–655. [Google Scholar] [CrossRef] [Green Version]
- Grace, J.; Mitchard, E.; Gloor, E. Perturbations in the carbon budget of the tropics. Glob. Chang. Biol. 2014, 20, 3238–3255. [Google Scholar] [CrossRef] [Green Version]
- Lewis, S.L.; Lopez-Gonzalez, G.; Sonké, B.; Affum-Baffoe, K.; Baker, T.R.; Ojo, L.O.; Phillips, O.L.; Reitsma, J.M.; White, L.; Comiskey, J.A.; et al. Increasing carbon storage in intact African tropical forests. Nature 2009, 457, 1003–1006. [Google Scholar] [CrossRef]
- Wright, S.J. Tropical forests in a changing environment. Trends Ecol. Evol. 2005, 20, 553–560. [Google Scholar] [CrossRef]
- Brienen, R.J.W.; Lebrija-Trejos, E.; Zuidema, P.A.; Martínez-Ramos, M. Climate-growth analysis for a Mexican dry forest tree shows strong impact of sea surface temperatures and predicts future growth declines. Glob. Chang. Biol. 2010, 16, 2001–2012. [Google Scholar] [CrossRef]
- Brienen, R.J.W.; Zuidema, P.A. Relating tree growth to rainfall in Bolivian rain forests: A test for six species using tree ring analysis. Oecologia 2005, 146, 1–12. [Google Scholar] [CrossRef]
- Couralet, C.; Sterck, F.J.; Sass-Klaassen, U.; Van Acker, J.; Beeckman, H. Species-specific growth responses to climate variations in understory trees of a central african rain forest. Biotropica 2010, 42, 503–511. [Google Scholar] [CrossRef]
- Dünisch, O.; Montóia, V.R.; Bauch, J. Dendroecological investigations on Swietenia macrophylla King and Cedrela odorata L. (Meliaceae) in the central Amazon Abstract. Trees-Struct. Funct. 2003, 17, 244–250. [Google Scholar]
- Gebrekirstos, A.; Mitlöhner, R.; Teketay, D.; Worbes, M. Climate-growth relationships of the dominant tree species from semi-arid savanna woodland in Ethiopia. Trees-Struct. Funct. 2008, 22, 631–641. [Google Scholar] [CrossRef]
- Locosselli, G.M.; Schöngart, J.; Ceccantini, G. Climate/growth relations and teleconnections for a Hymenaea courbaril (Leguminosae) population inhabiting the dry forest on karst. Trees-Struct. Funct. 2016, 30, 1127–1136. [Google Scholar] [CrossRef]
- Pucha-Cofrep, D.; Peters, T.; Bräuning, A. Wet season precipitation during the past century reconstructed from tree-rings of a tropical dry forest in Southern Ecuador. Glob. Planet. Chang. 2015, 133, 65–78. [Google Scholar] [CrossRef]
- Schöngart, J.; Orthmann, B.; Hennenberg, K.J.; Porembski, S.; Worbes, M. Climate-growth relationships of tropical tree species in West Africa and their potential for climate reconstruction. Glob. Chang. Biol. 2006, 12, 1139–1150. [Google Scholar] [CrossRef]
- Trouet, V.; Coppin, P.; Beeckman, H. Annual growth ring patterns in Brachystegia spiciformis reveal influence of precipitation on tree growth. Biotropica 2006, 38, 375–382. [Google Scholar] [CrossRef]
- Battipaglia, G.; Zalloni, E.; Castaldi, S.; Marzaioli, F.; Cazzolla-Gatti, R.; Lasserre, B.; Tognetti, R.; Marchetti, M.; Valentini, R. Long tree-ring chronologies provide evidence of recent tree growth decrease in a central african tropical forest. PLoS ONE 2015, 10, e0126168. [Google Scholar] [CrossRef]
- Chambers, J.; Silver, W. Some aspects of ecophysiological and biogeochemical responses of tropical forests to atmospheric change. Philos. Trans. R. Soc. B Biol. Sci. 2004, 359, 463–476. [Google Scholar] [CrossRef] [Green Version]
- Clark, D.B.; Clark, D.A.; Oberbauer, S.F. Annual wood production in a tropical rain forest in NE Costa Rica linked to climatic variation but not to increasing CO2. Glob. Chang. Biol. 2010, 16, 747–759. [Google Scholar] [CrossRef]
- Rahman, M.; Islam, M.; Bräuning, A. Local and regional climatic signals recorded in tree-rings of Chukrasia tabularis in Bangladesh. Dendrochronologia 2017, 45, 1–11. [Google Scholar] [CrossRef]
- Feeley, K.J.; Wright, S.J.; Supardi, M.N.N.; Kassim, A.R.; Davies, S.J. Decelerating growth in tropical forest trees. Ecol. Lett. 2007, 10, 461–469. [Google Scholar] [CrossRef] [Green Version]
- Brienen, R.J.W.; Zuidema, P.A.; Martínez-Ramos, M. Attaining the canopy in dry and moist tropical forests: Strong differences in tree growth trajectories reflect variation in growing conditions. Oecologia 2010, 163, 485–496. [Google Scholar] [CrossRef]
- Phillips, O.L.; Aragao, L.E.; Lewis, S.L.; Fisher, J.B.; Lloyd, J.; Lopez-Gonzalez, G.; Malhi, Y.; Monteagudo, A.; Peacock, J.; Quesada, C.A.; et al. Drought sensitivity of the Amazon rainforest. Science 2009, 323, 1344–1347. [Google Scholar] [CrossRef] [Green Version]
- Vincent, G.; de Foresta, H.; Mulia, R. Co-occurring tree species show contrasting sensitivity to ENSO-related droughts in planted dipterocarp forests. For. Ecol. Manag. 2009, 258, 1316–1322. [Google Scholar] [CrossRef]
- Briffa, K.R.; Schweingruber, F.H.; Jones, P.D.; Osborn, T.J.; Shiyatov, S.G.; Vaganov, E.A. Reduced sensitivity of recent tree-growth to temperature at high northern latitudes. Nature 1998, 391, 678–682. [Google Scholar] [CrossRef]
- Carrer, M.; Urbinati, C. Long-term change in the sensitivity of tree-ring growth to climate forcing in Larix decidua. New Phytol. 2006, 170, 861–872. [Google Scholar] [CrossRef] [Green Version]
- Biondi, F. Are climate-tree growth relationships changing in North-Central Idaho, USA? Arct. Antarct. Alp. Res. 2000, 32, 111–116. [Google Scholar] [CrossRef]
- Smith, K.T.; Cufar, K.; Levanic, T. Temporal stability and dendroclimatology in silver fir and red spruce. Phyton Ann. Rei Bot. Austria 1999, 39, 117–122. [Google Scholar]
- Solberg, B.O.; Hofgaard, A.; Hytteborn, H. Shifts in radial growth responses of coastal Picea abies induced by climatic change during the 20th century, central Norway. Ecoscience 2002, 9, 79–88. [Google Scholar] [CrossRef]
- Wilmking, M.; Juday, G.P.; Barber, V.A.; Zald, H.S.J. Recent climate warming forces contrasting growth responses of white spruce at treeline in Alaska through temperature thresholds. Glob. Chang. Biol. 2004, 10, 1724–1736. [Google Scholar] [CrossRef]
- Vaganov, E.A.; Hughes, M.K.; Kirdyanov, A.V.; Schweingruber, F.H.; Silkin, P.P. Influence of snowfall and melt timing on tree growth in subarctic Eurasia. Nature 1999, 400, 149–151. [Google Scholar] [CrossRef]
- Tei, S.; Sugimoto, A.; Yonenobu, H.; Ohta, T.; Maximov, T.C. Growth and physiological responses of larch trees to climate changes deduced from tree-ring widths and δ13C at two forest sites in eastern Siberia. Polar Sci. 2014, 8, 183–195. [Google Scholar] [CrossRef]
- Huq, S.; Ayer, J. Climate Change Impacts and Responses in Bangladesh; A Report of European Parliament, IP/A/CLIM/IC/2007-106; European Parliament: Brussels, Belgium, 2008. [Google Scholar]
- Huq, S.; Reid, H.; Konate, M.; Rahman, A.; Sokona, Y.; Crick, F. Mainstreaming adaptation to climate change in Least Developed Countries (LDCs). Clim. Policy 2004, 4, 25–43. [Google Scholar] [CrossRef]
- IPCC Climate Change. The physical science basis. In Contribution of Working Group I to the Fifth Assessment Report of the Intergovernmental Panel on Climate Change; Stocker, T.F., Qin, D., Plattner, G.K., Tignor, M., Allen, S.K., Boschung, J., Nauels, A., Xia, Y., Bex, V., Midgley, P.M., Eds.; Cambridge University Press: Cambridge, UK, 2013; p. 1535. [Google Scholar]
- Basak, J.K.; Titumir, R.A.M.; Dey, N.C. Climate change in Bangladesh: A Historical analysis of temperature and rainfall data. J. Environ. 2013, 2, 41–46. [Google Scholar]
- Rahman, M.R.; Lateh, H. Climate change in Bangladesh: A spatio-temporal analysis and simulation of recent temperature and rainfall data using GIS and time series analysis model. Theor. Appl. Climatol. 2017, 128, 27–41. [Google Scholar] [CrossRef]
- Rahman, M.R.; Lateh, H. Meteorological drought in Bangladesh: Assessing, analysing and hazard mapping using SPI, GIS and monthly rainfall data. Environ. Earth Sci. 2016, 75, 1026. [Google Scholar] [CrossRef]
- Shahid, S. Rainfall variability and the trends of wet and dry periods in Bangladesh. Int. J. Climatol. 2010, 30, 2299–2313. [Google Scholar] [CrossRef] [Green Version]
- Rahman, M.; Islam, M.; Bräuning, A. Tree radial growth is projected to decline in South Asian moist forest trees under climate change. Glob. Planet. Chang. 2018, 170, 106–119. [Google Scholar] [CrossRef]
- Bowman, D.M.J.S.; Brienen, R.J.W.; Gloor, E.; Phillips, O.L.; Prior, L.D. Detecting trends in tree growth: Not so simple. Trends Plant Sci. 2013, 18, 11–17. [Google Scholar] [CrossRef]
- Chowdhury, M.Q.; De Ridder, M.; Beeckman, H. Climatic signals in tree rings of heritiera fomes Buch.-Ham. in the Sundarbans, Bangladesh. PLoS ONE 2016, 11, e0149788. [Google Scholar] [CrossRef]
- Worbes, M. One hundred years of tree-ring research in the tropics—A brief history and an outlook to future challenges. Dendrochronologia 2002, 20, 217–231. [Google Scholar] [CrossRef]
- Islam, M.; Rahman, M.; Bräuning, A. Growth-ring boundary anatomy and dendrochronological potential in a moist triopical forest in Northeastern Bangladesh. Tree-Ring Res. 2018, 74, 76–93. [Google Scholar] [CrossRef]
- Nishat, A.; Huq, S.M.I.; Barua, S.P.; Reza, A.H.M.A.; Khan, A.S.M. (Eds.) Bio-ecological Zones of Bangladesh; IUCN Bangladesh Country Office: Dhaka, Bangladesh, 2002. [Google Scholar]
- Hassan, M. Forest soils of Bangladesh. J. For. Sci. 1994, 23, 1–11. [Google Scholar]
- FSP First Five Year Management Plan for Lawachara National Park; Volume 1: Management Plan; Forest Department, Ministry of Environment and Forests: Dhaka, Bangladesh, 2000.
- Holdridge, L.R. Life Zone Ecology; Tropical Science Center: San Jose, CA, USA, 1967. [Google Scholar]
- Islam, M.; Feeroz, M.M.; Muzaffar, S.B.; Kabir, M.; Begum, S.; Hassan, K.; Mahmud, S.; Chakma, S. Population Status and Conservation of hoolock gibbons Hylobates hoolock Harlan 1834 in Bangladesh. J. Bombay Nat. Hist. Soc. 2008, 105, 19–23. [Google Scholar]
- Islam, M.; Salim, S.H.; Kawsar, M.H.; Rahman, M. The effect of soil moisture content and forest canopy openness on the regeneration of Dipterocarpus turbinatus C.F. Gaertn. (Dipterocarpaceae) in a protected forest area of Bangladesh. Trop. Ecol. 2016, 57, 455–464. [Google Scholar]
- Kalinganire, A.; Pinyopusarerk, K. Chukrasia: Biology, Cultivation and Utilisation; ACIAR Technical Reports No. 49; Australian Centre for International Agriculatural Reasearch: Canberra, Australia, 2000.
- Orwa, C.; Mutua, A.; Kindt, R.; Jamnadass, R.; Anthony, S. Agroforestry Database: A Tree Reference and Selection Guide Version 4.0; World Agroforestry Centre: Nairobi, Kenya, 2009. [Google Scholar]
- Vlam, M.; Baker, P.J.; Bunyavejchewin, S.; Zuidema, P.A. Temperature and rainfall strongly drive temporal growth variation in Asian tropical forest trees. Oecologia 2014, 174, 1449–1461. [Google Scholar] [CrossRef]
- Baker, P.J.; Bunyavejchewin, S.; Oliver, C.D.; Ashton, P.S. Disturbance history and historical stand dynamics of a seasonal tropical forest in western Thailand. Ecol. Monogr. 2005, 75, 317–343. [Google Scholar] [CrossRef]
- Trouet, V.; Mukelabai, M.; Verheyden, A.; Beeckman, H. Cambial growth season of brevi-deciduous brachystegia spiciformis trees from South central Africa restricted to less than four months. PLoS ONE 2012, 7, e47364. [Google Scholar] [CrossRef]
- Worbes, M. Annual growth rings, rainfall-dependent growth and long-term growth patterns of tropical trees from the Caparo Forest Reserve in Venezuela. J. Ecol. 1999, 87, 391–403. [Google Scholar] [CrossRef] [Green Version]
- Stokes, M.A.; Smiley, T.L. An Introduction to Tree-Ring Dating; University of Chicago Press: Chicago, IL, USA, 1968. [Google Scholar]
- Eckstein, D.; Bauch, J. Beitrag zur Rationalisierung eines dendrochronologischen Verfahrens und zur Analyse seiner Aussagesicherheit. Forstwiss. Cent. 1969, 88, 230–250. [Google Scholar] [CrossRef]
- Holmes, R.L. Computer-assisted quality control in tree-ring dating and measurement. Tree Ring Bull. 1983, 43, 69–78. [Google Scholar]
- Bunn, A.G. A dendrochronology program library in R (dplR). Dendrochronologia 2008, 26, 115–124. [Google Scholar] [CrossRef]
- R Development Core Team. R: A Language and Environment for Statistical Computing; R Foundation for Statistical Computing: Vienna, Austria, 2016. [Google Scholar]
- Briffa, K.R.; Jones, P.D. Basic chronology statistics and assessment. In Methods of Dendrochronology: Applications in the Environmental Sciences; Cook, E.R., Kairiuksti, L.A., Eds.; Kluwer Academic Publishers: Dordrecht, The Netherlands, 1990; pp. 137–152. [Google Scholar]
- Wigley, T.M.L.; Briffa, K.R.; Jones, P.D. On the average value of correlated time series, with applications in dendroclimatology and hydrometeorology. J. Clim. Appl. Meteorol. 1984, 23, 201–213. [Google Scholar] [CrossRef]
- Cook, E.R.; Briffa, K.R.; Shiyatov, S.; Mazepa, V.; Jones, P.D. Data analysis. In Methods of Dendrochronology: Applications in the Environmental Sciences; Cook, E.R., Kairiuksti, L.A., Eds.; Kluwer Academic Publishers: Dordrecht, The Netherlands, 1990; pp. 97–162. [Google Scholar]
- Buras, A. A comment on the expressed population signal. Dendrochronologia 2017, 44, 130–132. [Google Scholar] [CrossRef]
- Fritts, H.C. Tree Rings and Climate; Academic Press Inc.: London, UK, 1976. [Google Scholar]
- Torrence, C.; Gilbert, P.C. A Practical Guide to Wavelet Analysis. Bull. Am. Meteorol. Soc. 1998, 79, 61–78. [Google Scholar] [CrossRef] [Green Version]
- Pederson, N.; Cook, E.R.; Jacoby, G.C.; Peteet, D.M.; Griffin, K.L. The influence of winter temperatures on the annual radial growth of six northern range margin tree species. Dendrochronologia 2004, 22, 7–29. [Google Scholar] [CrossRef]
- Buckley, B.M.; Palakit, K.; Duangsathaporn, K.; Sanguantham, P.; Prasomsin, P. Decadal scale droughts over northwestern Thailand over the past 448 years: Links to the tropical Pacific and Indian Ocean sectors. Clim. Dyn. 2007, 29, 63–71. [Google Scholar] [CrossRef]
- Tei, S.; Sugimoto, A. Time lag and negative responses of forest greenness and tree growth to warming over circumboreal forests. Glob. Chang. Biol. 2018, 24, 4225–4237. [Google Scholar] [CrossRef]
- Tei, S.; Sugimoto, A.; Yonenobu, H.; Matsuura, Y.; Osawa, A.; Sato, H.; Fujinuma, J.; Maximov, T. Tree-ring analysis and modeling approaches yield contrary response of circumboreal forest productivity to climate change. Glob. Chang. Biol. 2017, 23, 5179–5188. [Google Scholar] [CrossRef]
- Sideridis, G.D.; Simos, P. What is the actual correlation between expressive and receptive measures of vocabulary? Approximating the sampling distribution of the correlation coefficient using the bootstrapping method. Int. J. Educ. Psychol. Assess. 2010, 5, 117–133. [Google Scholar]
- Grissino-Mayer, H.D.; Romme, W.H.; Floyd, M.L.; Hanna, D.D. Climatic and human influences on fire regimes of the southern San Juan Mountains, Colorado, USA. Ecology 2004, 85, 1708–1724. [Google Scholar] [CrossRef]
- Zang, C.; Biondi, F. Treeclim: An R package for the numerical calibration of proxy-climate relationships. Ecography 2015, 38, 431–436. [Google Scholar] [CrossRef]
- Raihan, F.; Li, G.; Harrison, S.P. Detection of recent changes in climate using meteorological data from South-eastern Bangladesh. J. Climatol. Weather Forecast. 2015, 3, 137. [Google Scholar]
- Stahle, D.W.; Mushove, P.T.; Cleaverland, M.K.; Haynes, G. Management implications of annual growth rings in Ptreocarpus angolensis from Zimbabwe. For. Ecol. Manag. 1999, 124, 217–229. [Google Scholar] [CrossRef]
- Bräuning, A.; Volland-Voigt, F.; Burchardt, I.; Ganzhi, O.; Nauss, T.; Peters, T. Climatic control of radial growth of Cedrela montana in a humid mountain rainforest in southern Ecuador. Erdkunde 2009, 63, 337–345. [Google Scholar] [CrossRef]
- Chen, F.; He, Q.; Bakytbek, E.; Yu, S.; Zhang, R. Climatic signals in tree rings of Juniperus turkestanica in the Gulcha River Basin (Kyrgyzstan), reveals the recent wetting trend of high Asia. Dendrobiology 2015, 74, 35–42. [Google Scholar] [CrossRef] [Green Version]
- Dong, S.X.; Davies, S.J.; Ashton, P.S.; Bunyavejchewin, S.; Supardi, M.N.N.; Kassim, A.R.; Tan, S.; Moorcroft, P.R. Variability in solar radiation and temperature explains observed patterns and trends in tree growth rates across four tropical forests. Proc. R. Soc. B Biol. Sci. 2012, 279, 3923–3931. [Google Scholar] [CrossRef] [Green Version]
- Galbraith, D.; Levy, P.E.; Sitch, S.; Huntingford, C.; Cox, P.; Williams, M.; Meir, P. Multiple mechanisms of Amazonian forest biomass losses in three dynamic global vegetation models under climate change. New Phytol. 2010, 187, 647–665. [Google Scholar] [CrossRef] [Green Version]
- Choat, B.; Jansen, S.; Brodribb, T.J.; Cochard, H.; Delzon, S.; Bhaskar, R.; Bucci, S.J.; Feild, T.S.; Gleason, S.M.; Hacke, U.G.; et al. Global convergence in the vulnerability of forests to drought. Nature 2012, 491, 752–755. [Google Scholar] [CrossRef] [Green Version]
- Clark, D.A. Detecting tropical forests’ responses to global climatic and atmospheric change: Current challenges and a way forward. Biotropica 2007, 39, 4–19. [Google Scholar] [CrossRef]
- Meir, P.; Metcalfe, D.B.; Costa, A.C.L.; Fisher, R.A. The fate of assimilated carbon during drought: Impacts on respiration in Amazon rainforests. Philos. Trans. R. Soc. Lond. B Biol. Sci. 2008, 363, 1849–1855. [Google Scholar] [CrossRef]
- Lloyd, J.; Farquhar, G.D. The CO2 dependence of photosynthesis, plant growth responses to elevated atmospheric CO2 concentrations and their interaction with soil nutrient status. I. General principles and forest ecosystems. Funct. Ecol. 1996, 10, 4–32. [Google Scholar] [CrossRef]
- Lloyd, J.; Farquhar, G.D. Effects of rising temperatures and CO2 on the physiology of tropical forest trees. Philos. Trans. R. Soc. Lond. B Biol. Sci. 2008, 363, 1811–1817. [Google Scholar] [CrossRef]
- Atkin, O.K.; Bruhn, D.; Hurry, V.M.; Tjoelker, M.G. Evans Review No. 2—The hot and the cold: Unravelling the variable response of plant respiration to temperature. Funct. Plant Biol. 2005, 32, 87–105. [Google Scholar] [CrossRef]
- Will, R.E.; Wilson, S.M.; Zou, C.B.; Hennessey, T.C. Increased vapor pressure deficit due to higher temperature leads to greater transpiration and faster mortality during drought for tree seedlings common to the forest-grassland ecotone. New Phytol. 2013, 200, 366–374. [Google Scholar] [CrossRef] [Green Version]
- Fichtler, E.; Trouet, V.; Beeckman, H.; Coppin, P.; Worbes, M. Climatic signals in tree rings of Burkea africana and Pterocarpus angolensis from semiarid forests in Namibia. Trees-Struct. Funct. 2004, 18, 442–451. [Google Scholar] [CrossRef]
- Ram, S.; Borgaonkar, H.P.; Sikder, A.B. Tree-ring analysis of teak (Tectona grandis L.F.) in central India and its relationship with rainfall and moisture index. J. Earth Syst. Sci. 2008, 117, 637–645. [Google Scholar] [CrossRef]
- D’Arrigo, R.; Cook, E.R.; Wilson, R.J.; Allan, R.; Mann, M.E. On the variability of ENSO over the past six centuries. Geophys. Res. Lett. 2005, 32, 1–4. [Google Scholar] [CrossRef]
- Macias, M.; Andreu, L.; Bosch, O.; Camarero, J.J.; Gutiérrez, E. Increasing aridity is enhancing silver fir (Abies alba Mill.) water stress in its south-western distribution limit. Clim. Chang. 2006, 79, 289–313. [Google Scholar] [CrossRef]
- Andreu, L.; Gutiérrez, E.; Macias, M.; Ribas, M.; Bosch, O.; Camarero, J.J. Climate increases regional tree-growth variability in Iberian pine forests. Glob. Chang. Biol. 2007, 13, 804–815. [Google Scholar] [CrossRef]
Figure 1.
Map showing two study sites: Rema-Kalenga Wildlife Sanctuary (RKWS) and Lawachara National Park (LNP), together with the location of the Sreemangal meteorological station.
Figure 1.
Map showing two study sites: Rema-Kalenga Wildlife Sanctuary (RKWS) and Lawachara National Park (LNP), together with the location of the Sreemangal meteorological station.

Figure 2.
Climate diagram for the two sub-periods (a) 1950–1985 and (b) 1986–2015. Solid dark areas represent wet season with monthly precipitation ≥100 mm. Red dotted areas represent dry season. Vertical dashed lines indicate dry season length.
Figure 2.
Climate diagram for the two sub-periods (a) 1950–1985 and (b) 1986–2015. Solid dark areas represent wet season with monthly precipitation ≥100 mm. Red dotted areas represent dry season. Vertical dashed lines indicate dry season length.

Figure 3.
Trends in seasonal temperature, precipitation, and Palmer Drought Severity Index (PDSI) in the study area. Grey trend lines represent data from 1950 to 1985 and black trend lines represent data from 1986 to 2015. Pre-monsoon: March–April, monsoon: May–August, post-monsoon: September–October, dry season: November–March.

Figure 4.
(a) Regional ring-width index (RWI) chronology of Chukrasia tabularis from two moist forest sites in Bangladesh; grey shaded area indicates sample depth; (b) Running expressed population signal (EPS) (blue line) and effective chronology signal (rbar.eff) (purple line) of the regional RWI chronology. Horizontal grey line indicates an EPS of 0.85; vertical dashed line intercepts RWI, EPS, and rbar.eff at 1927, when EPS surpasses 0.85; (c) Wavelet-based spectral analysis of regional RWI chronology; shaded area shows the “cone of influence” where edge effects are important; black contours represent the frequencies significant at the 99% confidence level.

Figure 5.
Bootstrapped Pearson correlations between regional RWI chronology and detrended monthly climate data: (a) mean temperature; (b) maximum temperature; (c) minimum temperature, and (d) precipitation from previous year May to current November for the period 1950–2015. Lower case letters indicate months of previous year. Dotted vertical lines separate previous year from current year. AM represents annual mean, AP represents annual precipitation. Solid pink and purple bars show significant correlations at p < 0.05 and p < 0.01 level, respectively.

Figure 6.
Seasonal correlations of RWI with mean temperature and precipitation for the period 1950–2015. Simple correlations with monthly mean temperature (top) and partial correlations with monthly precipitation (bottom). Each bar in the upper panel represents correlation of RWI with the average temperature of that month and two months before in case of three months’ seasonalized correlation and so on. Solid dark bars show significant correlation at p < 0.05 level.

Figure 7.
Superposed epoch analysis (SEA) result showing the significant influence of ENSO events on tree growth. In the figure, 0 indicates the event year, −1 and −2 and +1 and +2 indicate one year and two years before and following the ENSO events, respectively. The dark colored bar indicates significant growth reduction (p < 0.05).

Figure 8.
Moving correlations (30-year window) between RWI and climate variables: (a) mean temperature; (b) minimum temperature; (c) maximum temperature; and (d) precipitation for the period 1950–2015. Color code represents correlation coefficient. Significant correlations are indicated by white asterisks.

Figure 9.
Changes in growth sensitivity of C. tabularis to climate forcing in Bangladesh. (a) Linear relationships between RWI and March to April mean temperatures. (b) Linear relationships between RWI and July minimum temperatures. (c) Linear relationship between RWI and Jan maximum temperatures. (d) Linear relationships between RWI and October precipitation. (e) Linear relationship between RWI and April vapor pressure deficit (VPD). Blue points represent the period 1950–1985 and red points represent the period 1986–2015. Solid lines indicate significant trends and dashed lines represent non-significant trends. The slopes of trend lines indicate the sensitivity of Chukrasia growth to climate.


Table 1.
Statistical characteristics of the regional ring-width index chronology of Chukrasia tabularis from moist forests in Bangladesh.
Table 1.
Statistical characteristics of the regional ring-width index chronology of Chukrasia tabularis from moist forests in Bangladesh.
| Parameter | Values |
|---|---|
| Time span | 1895–2015 |
| Mean length of series (year) | 64 |
| Trees/cores | 33/52 |
| Mean ring width (mm) ± SD | 3.85 ± 1.33 |
| First order autocorrelation (AC1) | 0.33 |
| Mean GLK * | 0.68 |
| rbar.eff *δ | 0.28 |
| Series inter-correlation (SIC) δ | 0.45 |
| Mean expressed population signal (EPS) | 0.90 |
| Mean sensitivity (MS) | 0.69 |
| Signal-to-noise ratio (SNR) | 9.13 |
* GLK: Gleichläufigkeit (sign test); rbar.eff: effective chronology signal. δ significance level p < 0.05.
© 2018 by the authors. Licensee MDPI, Basel, Switzerland. This article is an open access article distributed under the terms and conditions of the Creative Commons Attribution (CC BY) license (http://creativecommons.org/licenses/by/4.0/).
Share and Cite
MDPI and ACS Style
Rahman, M.; Islam, M.; Wernicke, J.; Bräuning, A. Changes in Sensitivity of Tree-Ring Widths to Climate in a Tropical Moist Forest Tree in Bangladesh. Forests 2018, 9, 761. https://doi.org/10.3390/f9120761
AMA Style
Rahman M, Islam M, Wernicke J, Bräuning A. Changes in Sensitivity of Tree-Ring Widths to Climate in a Tropical Moist Forest Tree in Bangladesh. Forests. 2018; 9(12):761. https://doi.org/10.3390/f9120761
Chicago/Turabian StyleRahman, Mizanur, Mahmuda Islam, Jakob Wernicke, and Achim Bräuning. 2018. "Changes in Sensitivity of Tree-Ring Widths to Climate in a Tropical Moist Forest Tree in Bangladesh" Forests 9, no. 12: 761. https://doi.org/10.3390/f9120761
Note that from the first issue of 2016, this journal uses article numbers instead of page numbers. See further details here.