Genetic Diversity and Population Genetic Structure of Erythrophleum fordii Oliv., an Endangered Rosewood Species in South China


Research Institute of Tropical Forestry, the Chinese Academy of Forestry, Longdong, Guangzhou 510520, China
*
Author to whom correspondence should be addressed.
Forests 2018, 9(10), 636; https://doi.org/10.3390/f9100636
Submission received: 31 August 2018
/
Revised: 4 October 2018
/
Accepted: 10 October 2018
/
Published: 12 October 2018
(This article belongs to the Section Forest Ecology and Management)
Abstract
:Erythrophleum fordii Oliv. is a valuable rosewood species indigenous to the tropical and warm sub-tropical zones of Vietnam, Laos, and South China. The natural forests have been heavily fragmented mostly due to over-exploitation and over-utilization, and alteration to croplands and fast-growing plantations. Therefore, it has been included in the IUCN Red List of Endangered Species as an endangered species. In the present study, genetic diversity and population genetic structure of 11 populations were estimated by SSR makers in South China. Five high polymorphic loci were studied with a total of 34 alleles, among which, seven were private alleles. The mean number of alleles per locus (A), the mean number of efficient alleles per locus (Ae), the observed (Ho) and expected (He) heterozygosity, and Shannon’s index (I) of the 11 populations were 3.40, 2.31, 0.52, 0.56, and 0.90, respectively. Correlation analysis between genetic parameters and geographical factors showed that He and I were in significant negative correlation with longitude, indicating that genetic diversity of E. fordii reduced gradually from West to East in south China. FIS of eight populations with above five samples was on average 0.01, most loci conformed to Hardy-Weinberg equilibrium in these populations; their genetic differentiation coefficient (FST) was 0.18, indicating that genetic differentiation among populations was relatively low and there existed 18% genetic variation among populations. Gene flow (Nm) between these populations was 1.28. The Mantel test showed that genetic distance was not significantly correlated with geographical distance (p > 0.05). It was concluded that populations with high genetic diversity or private alleles, especially Longmen, Wuming and Pingxiang populations should be a priority for in situ conservations, meanwhile more populations and as many families as possible in each population should be collected for ex situ conservations of germplasm resources of this species in the future.
1. Introduction
As increasing attention is being paid to biodiversity, integrity, and stability of ecosystems, biodiversity conservation has become a hot topic of academic research [1,2]. Genetic diversity is an important component of biodiversity, reflecting adaptability of a species to environmental changes [3], and influencing the stability and elasticity of an ecosystem [4,5]. Tropical forests have the richest species diversity and most complex structure on land, and they play an important role in global carbon cycle maintenance, biodiversity conservation, commodity production, and climate regulation [6,7]. During recent decades, natural forest areas have declined due to anthropogenic activities in the tropical and subtropical zones worldwide, leading to habitat fragmentation of many species, directly affecting species distribution, population size, and genetic variation [8,9]. Furthermore, it has resulted in a series of ecological and genetic events, such as inbreeding, drifts, and bottlenecks. These changes might narrow the genetic basis, declining adaptive potential, population viability, and evolutionary potential, which negatively influence long-term maintenance of the species, and even make it extinct, eventually [10]. Habitat fragmentation might not only affect gene flow among populations [11], but also increase problems of population regeneration [12] and lower the resistance of whole population to any disturbance [13].
Erythrophleum fordii Oliv. is a valuable rosewood species indigenous to the tropical and warm sub-tropical zones of Vietnam, Laos, and South China [14,15]. Its pollen is transmitted by insect vectors, and occasionally the species can produce offspring by themselves, but outcrossing is predominant in the mating system. Its timber can be used to make ships, high-grade furniture, solid wood flooring boards, and handicrafts [16]. It is of important medicinal value as well. The seeds, stems and leaves contain alkaloid-cassaine, diterpenoids [17,18,19], and triterpenoids [20], which play roles in heart strengthening, free radical scavenging, and antitumor [21]. In addition, this species has important ornamental value and ecological benefits, and is widely used in the construction of landscape and ecological forests during recent decades.
However, natural forests of E. fordii have been heavily destroyed mostly due to over-exploitation and over-utilization, as well as alteration to croplands and fast-growing plantations, in China and Southeast Asia. The forests have been declining rapidly, and even disappeared in some places [22,23]. In particular, fragmentation of the existing natural forests of this species is very serious in China, with scattered distribution in Guangdong, Guangxi, Fujian, and Taiwan Provinces [16] (see Figure 1 in detail). They mostly exist in the so-called “Geomantic forest” (see Table 1 in detail) beside villages with tens or dozens trees. The species has thus been listed in the China Species Red List [24] and Vietnam Plant Red Data Book [25], and also in the International Union for Conservation of Nature and Natural Resources (IUCN) Red List of Endangered Species [26]. Hence, there is a need to strengthen conservation of its natural habitat and carry out studies on its conservation systematically. In the previous studies, Huang et al. [22] analyzed the reasons of endangering biological and ecological characteristics, population dynamics in natural community, and anthropogenic disturbances. Yi et al. [27] investigated species composition and structure of E. fordii community in Dinghushan Biosphere Reserve. Zhao et al. [15] investigated its geographical distribution and phenotypic variation in the fruits and seeds in South China. Chen et al. [28] carried out a preliminary analysis on the karyotype, and found it to be diploid (2n = 28). Further, Zhu et al. developed ten pairs of SSR primers [29] and studied how an isolated E. fordii population of small size can maintain genetic diversity [30]. However, there is no study on genetic diversity and population genetic structure of this species, which is one of the prerequisites for formulating protective measures [31].
For rare and endangered species, information on genetic variation is important, especially for those species with less statistical information of populations [32]. Simple sequence repeat (SSR) markers are widely used in studies on genetic diversity and population genetic structure towing to their codominant character, high polymorphism, wide distribution in the genome, neutral selection, abundant genetic information, easy detection, good reproducibility, and less demand for DNA templates [33,34]. In the present study, the SSR markers were used to (1) investigate the genetic diversity of sampled populations, and assess potential genetic risks they suffer; (2) reveal population genetic structure, analyze the endangering mechanism of E. fordii; and (3) discuss strategies for efficient conservation of this species. The findings will contribute to the sustainable conservation and utilization of E. fordii and other endangered tree species in the area.
2. Materials and Methods
2.1. Study Sites and Tree Samples
142 individuals were sampled from 11 E. fordii populations in South China (Table 1). Only adult trees bearing fruits were sampled simultaneously taking germplasm resources into consideration, the sampled trees were determined randomly, ensuring that the distance between them was above 50 m. The numbers of sampled individuals in some populations were less than 15 due to their small population size. Fresh leaves were collected from each tree, quickly dried by silica gel (1/10 in weight), and kept for storage at room temperature.
2.2. SSR Analyses
The total DNA was extracted by modified cetyl trimethylammonium bromide (CTAB) method of Zeng et al. [35], and then purified. After purification, the concentration and quality of DNA were determined using NanoDrop 2000 (Thermo Fisher Scientific Inc., Waltham, MA, USA). Five pairs of SSR primers for E. fordii developed by Zhu et al. [29] were applied for SSR analysis with their annealing temperatures all declining 1 °C (Table S1). The PCR system was adopted with a total reaction mixture of 10 µL containing 5.0 µL 2 × PCR plus Mix (Tiangen Biotech, Beijing, China), 0.4 µL 5 µM Primer F, 0.4 µL 5 µM Primer R, 2.0 µL DNA template and 2.2 µL ddH2O. The PCR amplifications were carried out on PTC-100 thermal cycler (Bio-Rad) with the following programs: 4 min for initial denaturation at 94 °C; 31 cycles of 30 s for denaturation at 94 °C, 30 s at annealing temperature and 30 s at 72 °C; and, 10 min at 72 °C. The PCR products were detected using the 3730 XL automatic sequencer (ABI Co., Foster, CA, USA). The products were genotyped with GeneMapper 4.0 software (ABI Co., Foster, CA, USA).
2.3. Statistical Analyses
POPGENE 1.31 [36] was used to estimate the following genetic diversity parameters at species and population levels: number of alleles (A) and effective number of alleles (Ae) per locus; allele frequency; mean observed (Ho) and expected (He) heterozygosity per locus; Shannon’s information index (I). Deviation from Hardy-Weinberg equilibrium (HWE) was then evaluated by a chi-squared test for each population at single locus, and F-statistics (FIS, FIT and FST) values of the genetic divergence and Nei’s genetic distance were assessed at the population level. Gene flow was calculated using the formula: Nm = 0.25(1 − FST)/FST. The genetic structure of E. fordii was analyzed using STRUCTURE 2.0 [37]. The numbers of groups (K) was set between one and eight with ten replicates to estimate the number of discontinuous K, length of burn-in period and the value of Markov Chain Monte Carlo were both set to 100,000 times. The best numbers of K [38] were selected according to the principle of the highest value of ΔK by STRUCTURE Harvester on-line (http:taylor0.biology.ucla.edu/struct_harvest/ [39]). Repeated sampling analysis was performed by CLUMPP 1.1.2 [40], and genetic structural plot was drawn by Distruct 1.1 [41]. NTSYS 2.1 [42] was used to obtain clustering graph of populations based on Nei’s genetic distance by the UPGMA method. The correlation between genetic parameters and geographical factors was analyzed using SPSS 21.0. Mantel test was performed to determine whether genetic differentiation is related to geographical distance [43].
3. Results
3.1. Population Genetic Diversity
3.1.1. SSR Polymorphism
Five loci were obtained using five pairs of SSR primers for E. fordii, and all were polymorphic (Table 2). At each locus four to nine alleles were generated, with 34 alleles in total. Among these alleles, seven were private alleles that appeared only in one population, and three were common alleles that existed in all 11 populations. At locus Gm1048, P1, P2, P3, P9, and P10 populations had the most number of alleles (five), whereas P7 and P8 populations possessed the least number of alleles (two) among 11 populations. P1 and P9 populations owned the most number of alleles (five) whereas P8 had the least number of alleles (two) at locus Gm1052. The numbers of alleles varied from two in P10 to eight in P2 populations and from two in P7 and P8 to five in P6 at locus Gm2065 and Gm4040, respectively. At locus Gm65, P9 population possessed four alleles, and there was only one allele in P11 population. Obviously, among 11 populations P9 owned the most number of alleles (24), followed by P2 (23), and P7 and P8 harboring the least number of alleles (12).
3.1.2. Genetic Diversity
A and Ae of the 11 populations ranged from 1.60 in P5 to 4.80 in P9 and 1.44 in P11 to 3.12 in P1, Ho and He varied from 0.32 in P7 to 0.67 in P6 and 0.33in P5 to 0.73 in P8, and their means were 3.40, 2.31, 0.52, and 0.56, respectively (Table 3). I was calculated for genetic diversity depending on the evenness of allele frequencies, and ranged from 0.36 in P5 to 1.17 in P2 with a mean of 0.90. Obviously, P5 possessed the lowest level of genetic diversity. At the species level, A, Ae, Ho, He, and I were 6.80, 3.12, 0.52, 0.65, and 1.32, respectively (Table 4).
The mean A and Ae of two cultivated populations (P1 and P6) were 4.00 and 2.61, respectively, which were higher than those of the natural populations (3.30 and 2.24). The average Ho and He of the two populations were 0.64 and 0.60, respectively, which were also higher than those of the natural populations (0.49 and 0.55). It was noteworthy that I of all cultivated populations were greater than one.
The correlation analysis between genetic parameters and geographical factors was analyzed for the six natural populations in which at least five individuals were sampled (Table 5). It was showed that He and I were significantly negatively correlated with longitude (p < 0.05).
3.2. Population Genetic Structure
3.2.1. Hardy-Weinberg Equilibrium Detecting
Hardy-Weinberg equilibrium (HWE) detecting was tested for eight populations (six natural and two planted) in which more than five individuals were sampled. The fixation index (F) and chi-square tests of statistical differences from zero for these populations were presented in Table 6. Of the 40 tests, only five cases considerably deviated from HWE as the values of F were significantly greater than zero, indicating that heterozygote deficiency existed in these loci. For loci Gm1048, Gm1052, Gm2065 and Gm4040, all populations conformed to HWE except P4 population at locus Gm1052 (p < 0.01), and only P2, P6 and P10 populations conformed to HWE at locus Gm65. Therefore, all populations were in HWE at the tested loci as a whole (Table 6).
3.2.2. Distribution of Genetic Variation
FIS and FIT reflect the degree to deviation from HWE within and across populations. FIS of eight populations with more than five samples ranged from −0.09 at locus Gm1052 to 0.45 at Gm65 with a mean of 0.01 (Table 7), indicating significant heterozygote deficiency at Gm65, while these populations were in HWE as a whole. This was in agreement with the result of F mentioned above. FST is also known as the population differentiation coefficient, which measures the degree to genetic differentiation among populations. The lowest value of FST was found at locus Gm4040 and the highest at Gm65. The mean of FST was 0.18 That is to say, 18% of the genetic variation existed among these populations. The mean of Nm was 1.28 > 1, indicating that high rate of gene flow occurred within populations [44].
3.3. Genetic Relationship between Populations
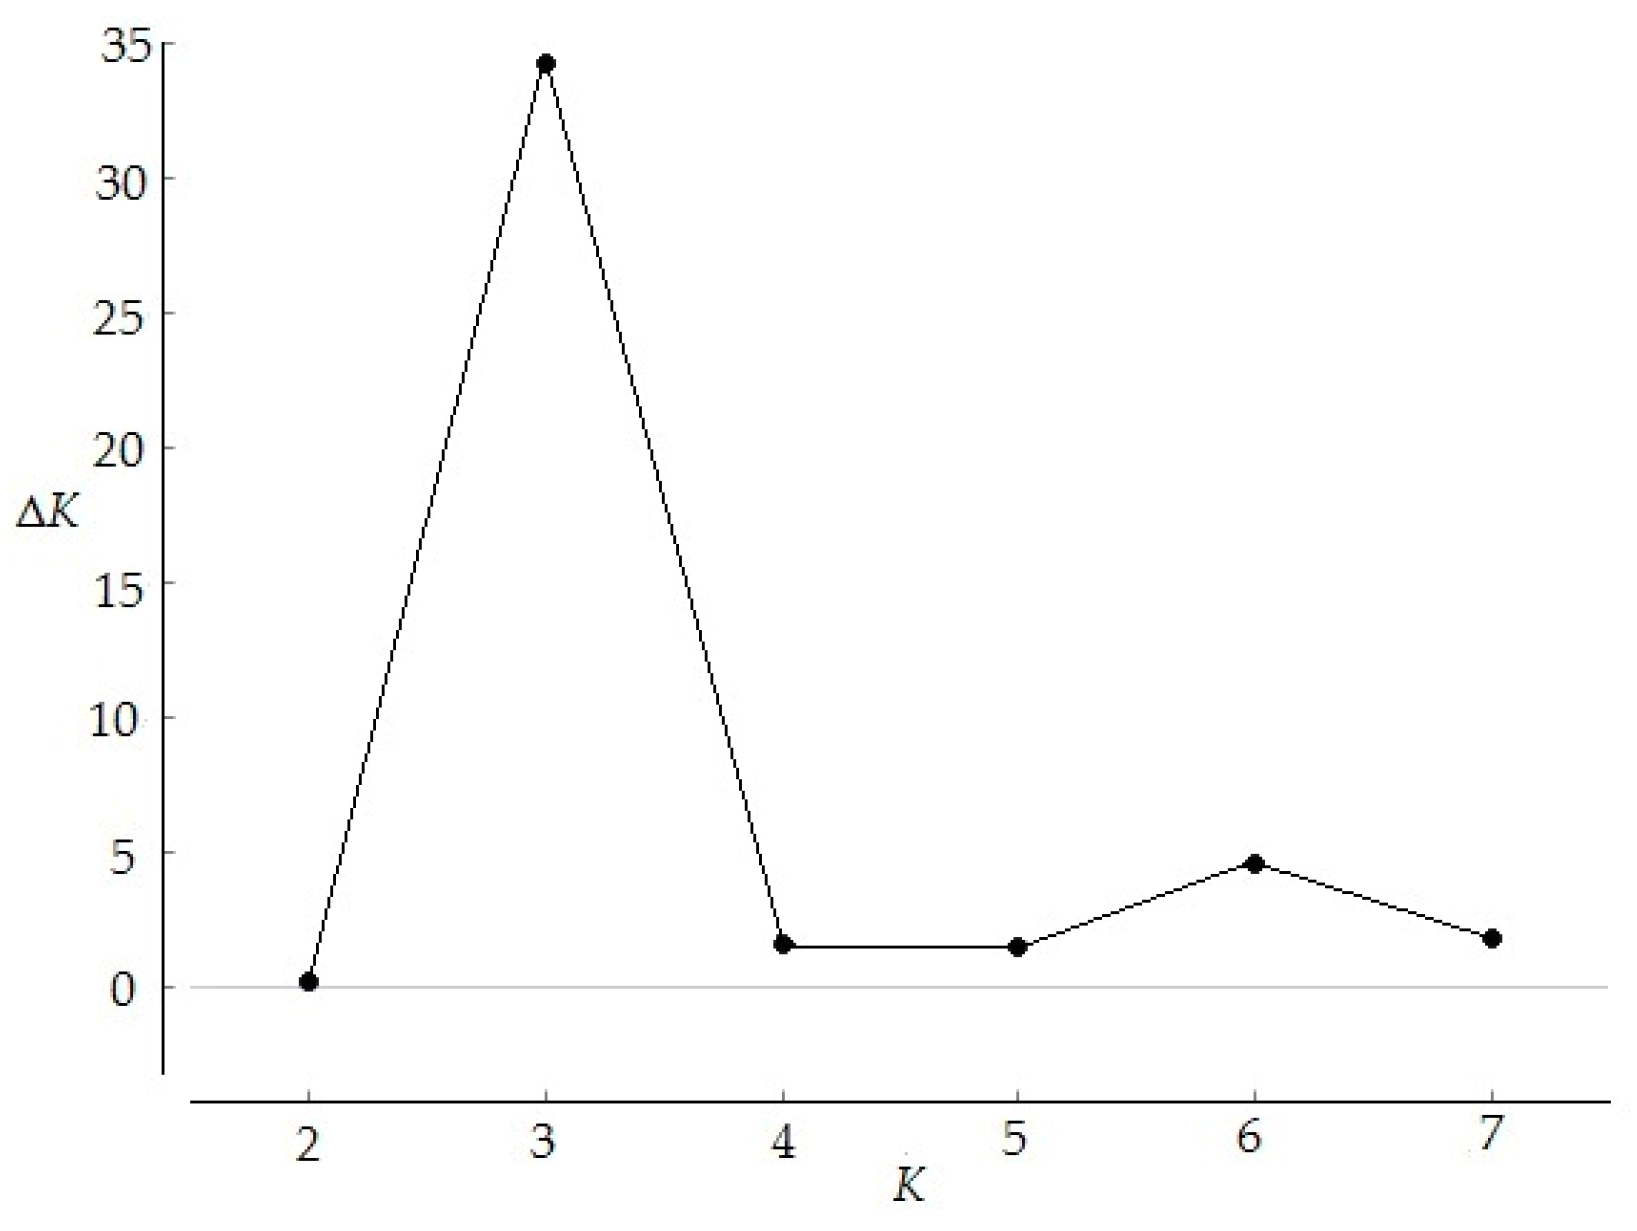
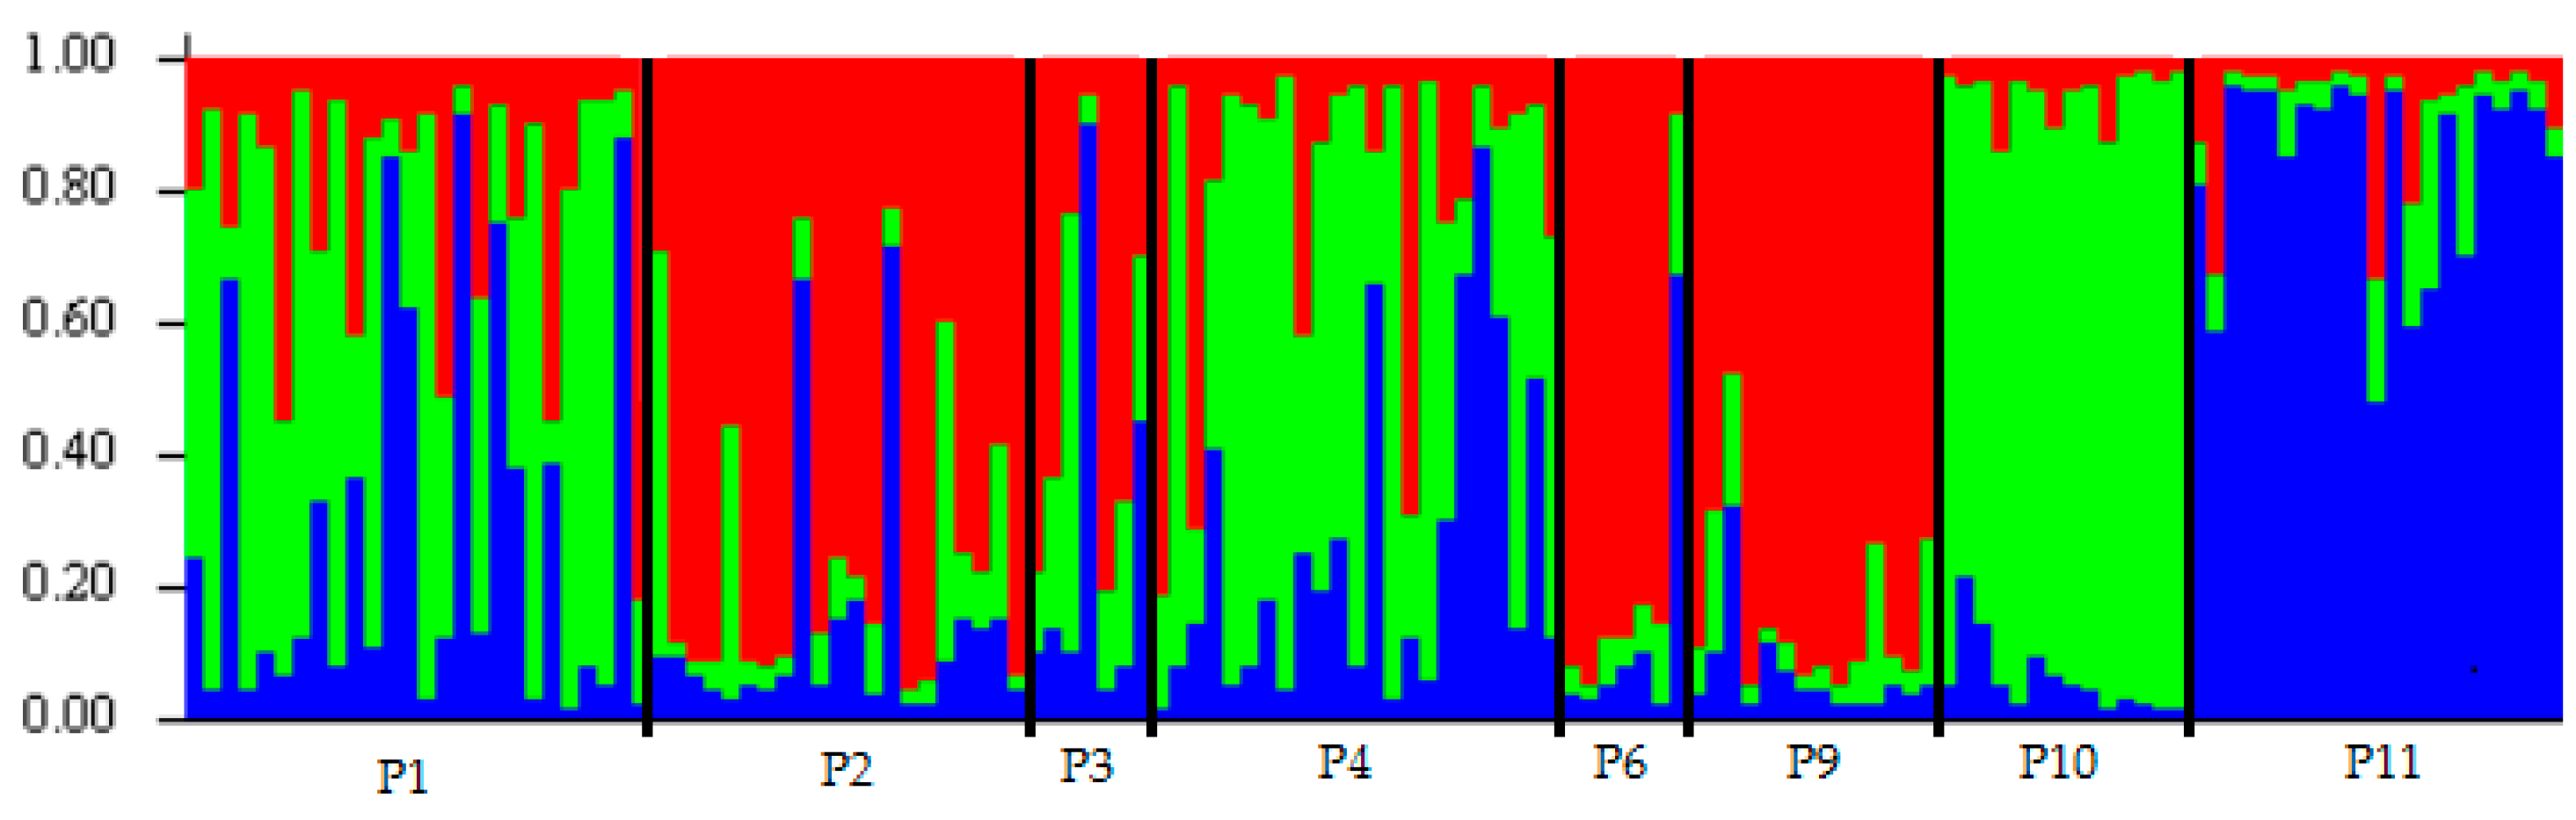
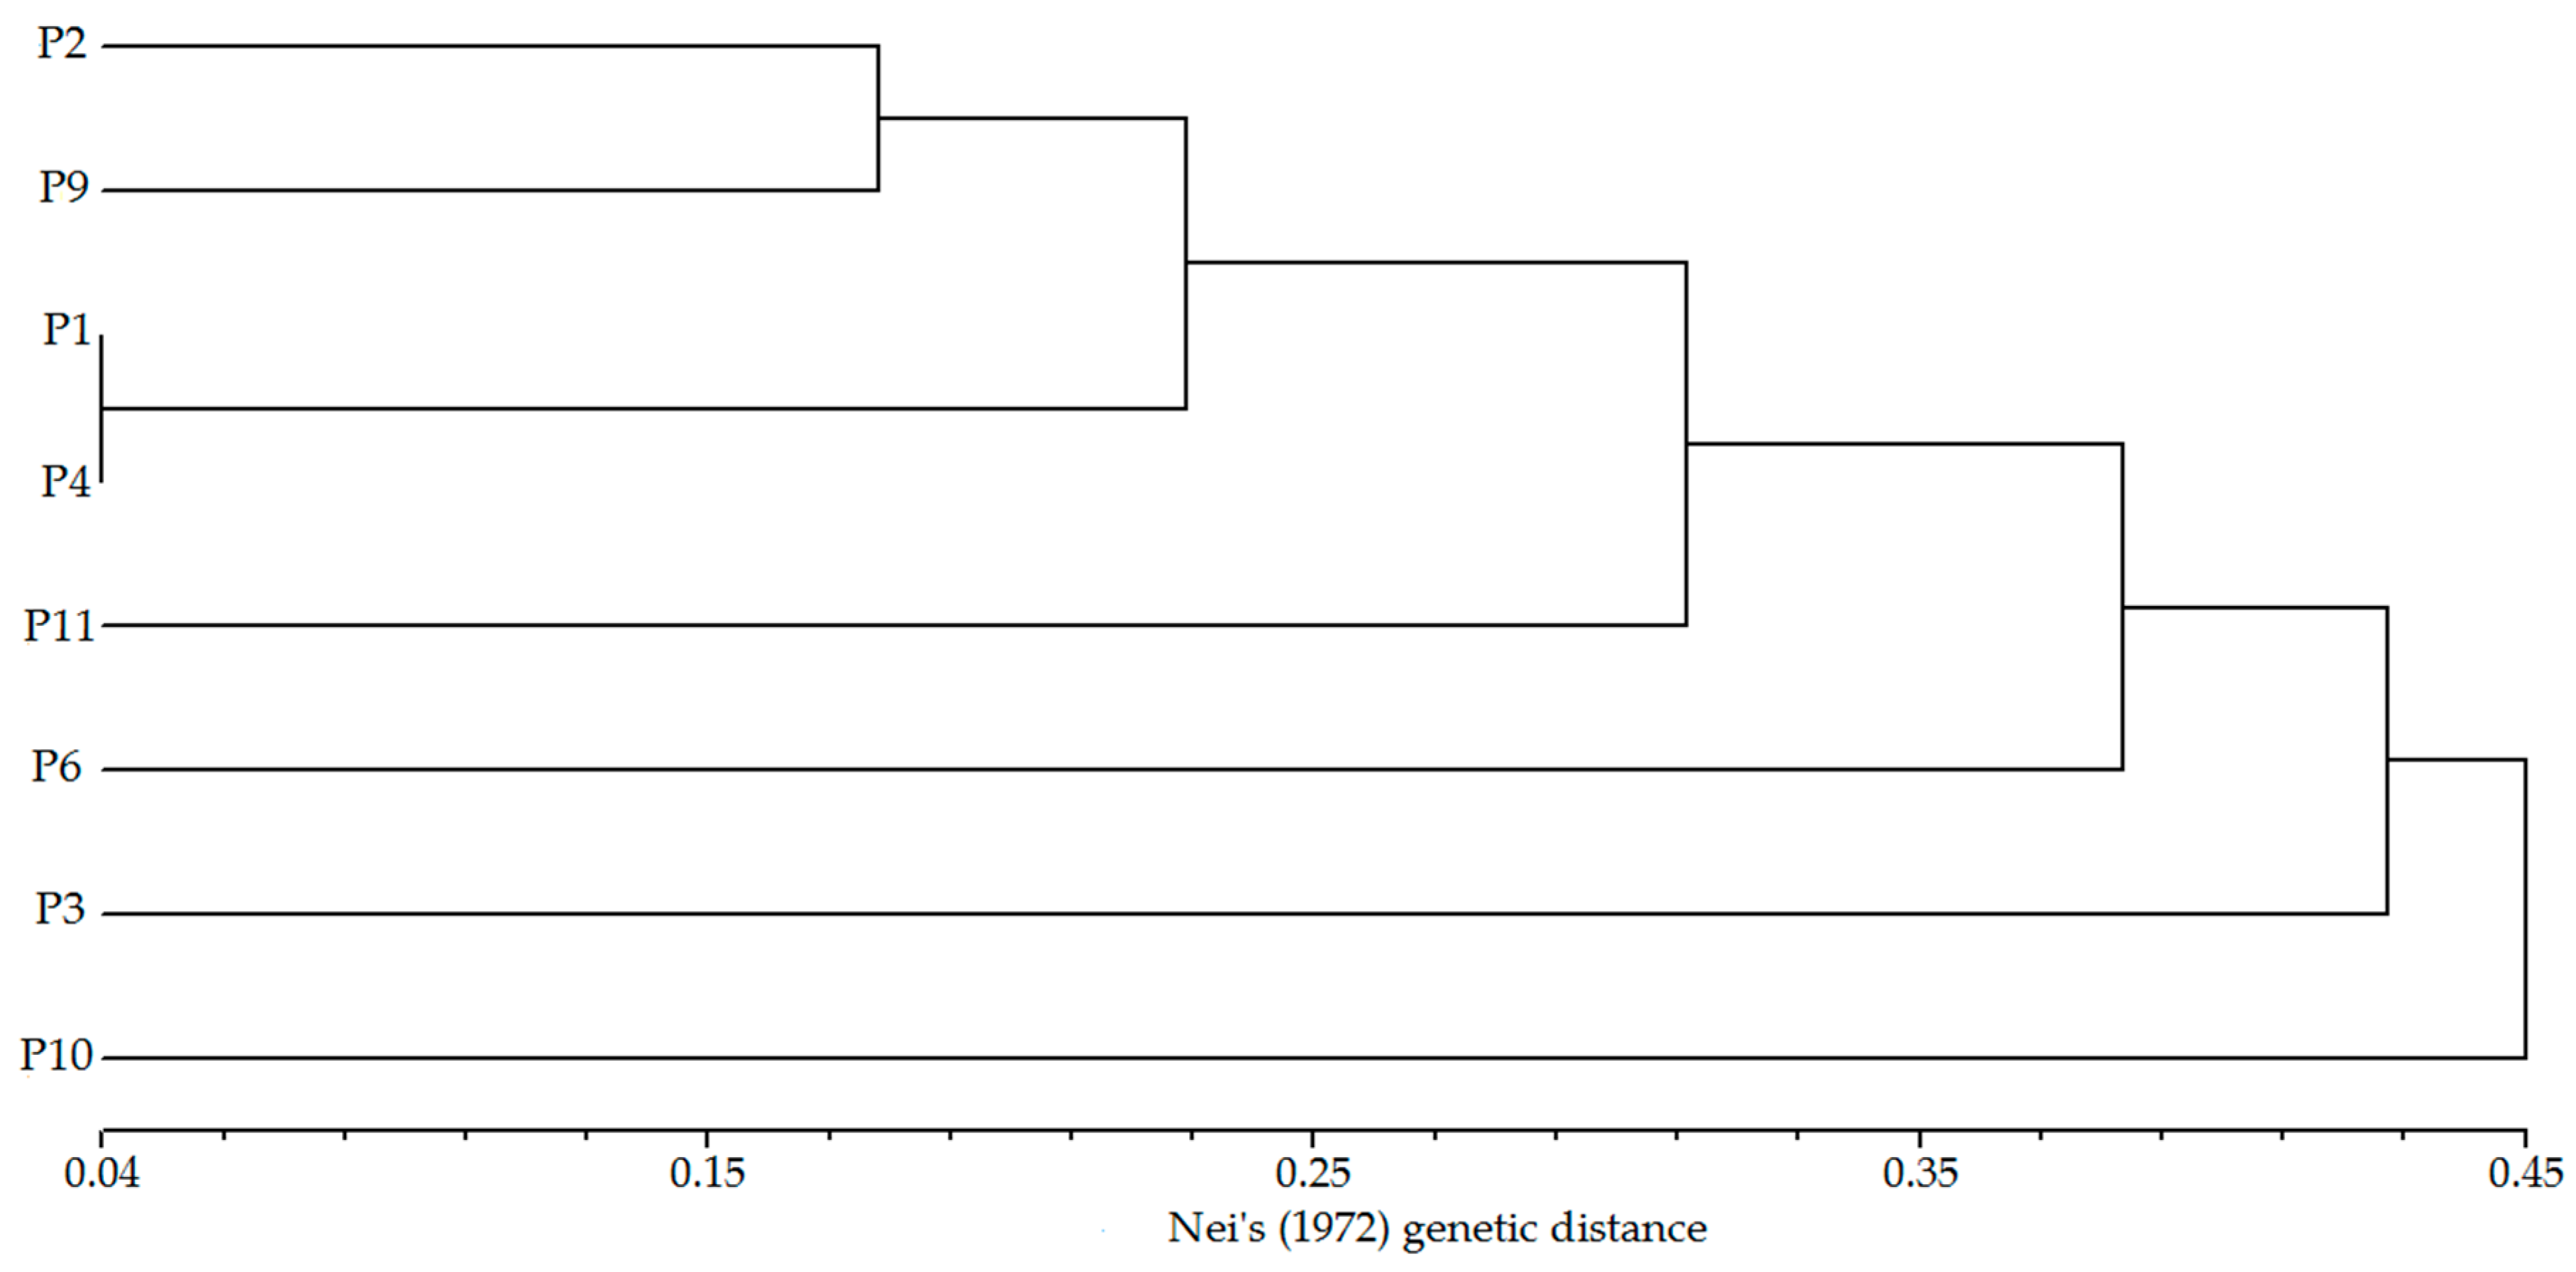
STRUCTURE software was used to analyze the genetic structure of E. fordii populations. ΔK was the highest when K = 3, (Figure 2), indicating that 133 individuals from eight populations with more than five samples were divided into three groups (Figure 3). However, an analysis based on this assumption retrieved only 12 individuals belonging to a particular group with a probability of > 0.95 and 43 individuals dispersing from all eight populations with a probability of > 0.90, indicating extensive mixing of poorly differentiated gene pools. Genetic distances between these populations varied from 0.04 to 0.68 (Table 8). The shortest genetic distance was found between P1 and P4 populations, and the farthest was between P6 and P10 populations. Clustering analysis based on genetic distances showed that these populations could not be clearly divided into several groups (Figure 4). Mantel test showed that correlation between genetic and geographical distances (Table 8) was not significant (p > 0.05), which was consistent with the results of clustering analysis.
4. Discussion
4.1. Population Genetic Diversity
Previously, Zhu et al. [29] developed ten pairs of SSR primers, and estimated genetic diversity of E. fordii in Dinghushan National Natural Reserve (DNNR) at Zhaoqing, Guangdong. Of these primers, four were compounds (at least with two motifs), and five were successfully amplified in the present study. A comparison of both studies indicated that among the 11 populations evaluated in the present study (Table 2), P1, P2, P3, P9, and P10 populations possessed the highest number of alleles at locus Gm1048, P9 population at loci Gm4040 and Gm65, which was same as those of the DNNR population at the three loci. It is noteworthy that the number of alleles at locus Gm65 in 11 populations was the same as that in DNNR population reported by Zhu et al. At loci Gm1052 and Gm2065, allele numbers of DNNR population was a marginally lower than the mean level of all 11 populations in the present study. P6 were introduced from DNNR population, and the total number of alleles (18) at five loci was 14.29% less than that of DNNR (21) due to far less samples, while it is interesting that locus Gm 1052 had just one more allele of P6 than that of DNNR. These could infer that DNNR population has high genetic diversity.
Generally, population genetic diversity is closely related to the degree of disturbance [45,46]. However, in the present study, it seemed that the relationship between genetic diversity and current degree of disturbance was not obvious. Of the four populations seriously disturbed, P2, P4, and P9 maintained high genetic diversity except P11; and among the seven populations under well conservation, P1, P3, and P6 populations possessed higher genetic diversity, whereas P5, P7, P8, and P10 exhibited lower genetic diversity than the mean of all 11 populations. These could be explained by past disturbances. In the present study, the disturbance degree just reflected the current situation, but some populations might have suffered from historical disturbances, although they are well protected now. During the 1990’s, a survey showed that the natural forests of E. fordii had disappeared in approximately 20% of counties and cities [22].
Genetic diversity is normally in positive correlation with population size [47,48], however, this relationship to a certain extent was perturbed by conservation status in the present study. Linking genetic diversity with size and conservation status of natural populations showed that only P3 in five well conserved natural populations of small size had higher genetic diversity than the mean of all 11 populations. Whereas, among the four seriously disturbed natural populations of large or medium size, P2 and P9 possessed higher genetic diversity than the mean of 11population, and P11 had lower genetic diversity than the mean.
The correlation analysis between genetic parameters and geographical factors showed that genetic diversity of this species reduced gradually from west to east in South China, which was in accordance with the observation of Zhao et al., who studied morphological variation of this species [15]. Natural populations P2, P3 and P4 is in the central distribution areas of E. fordii [22], and P11 is far away from the central distribution areas. Perhaps, this was also perhaps a reason why the genetic diversity of P2, P3 and P4 was higher than that of other populations while that of P11 in Fujian Province was lower.
4.2. Population Genetic Structure
According to Wright [49], the genetic differentiation among populations is low when the coefficient of genetic differentiation (FST) is less than 0.25. The F-statistics results of the present study showed that genetic differentiation among six natural populations was relatively low (mean FST = 0.18, Table 7), and the genetic variation mainly existed within populations. This is consistent with the findings of previous studies on endangered species such as Pulsatilla patens (L.) Mill. [5] and Antirrhinum charidemi Lange [50]. Gene flow can effectively prevent genetic differentiation caused by genetic drift when Nm was > 1 [44]. In the present study, the gene flow within E. fordii populations in South China was relatively high (mean Nm = 1.28, Table 7). That is, gene flow to a certain extent can counteract the effects of genetic drift in small population resulted from fragmentation. However, Albaladejo et al’s [51] study demonstrated that even moderate gene flow did not seem to be sufficient to offset the genetic erosion and differentiation caused by long-term habitat destruction. The transmission of E. fordii pollen mainly depends on insects, while increase in isolation distance is bound to reduce pollen flow among the populations because of short spreading distance of pollen for entomophilous plants. In any case, fragmentation might affect long-term genetic and ecological fates of this species.
In the present study, P1 and P4 populations had the nearest genetic distance, since P1 was introduced from Hepu (P1’), bordering Southwest to P4. However, we have no similar discovery between other geographically neighboring populations. The results of STRUCTURE analysis and clustering analysis all revealed that the population structure was not obvious, which was in accordance with insignificant correlation between genetic and geographical distances.
4.3. Conservation Strategies for Erythorphleum fordii
Knowledge of genetic diversity and population genetic structure are essential to elucidate endangering mechanism and identify ways to protect the endangering species [52,53]. The present study showed that the remaining populations of E. fordii still harbor a high level of genetic diversity, although the forests have been severely fragmented because of over-exploitation and alteration to cropland and fast-growing plantation. This might be attributed to the fact that fragmentation has occurred within recent decades, and large-sized adult trees, most being ancient trees, were sampled in the present study. As E. fordii is an insect-pollinated tree species with seed dispersal by gravity, the fragmentation might significantly influence genetic diversity in the subsequent generations due to genetic erosion and genetic drift, especially in small isolated populations. Fortunately, we still have an opportunity to manage and use the remaining genetic resources of this species efficiently and reasonably. It is urgent to carry out in situ conservations for natural populations with high genetic diversity and private alleles, in particular, Wuming, Longmen, Qinzhou, Dinghushan populations should be a priority for conservation. Meanwhile, ancient trees scattered in the distribution areas, for example, Fengkai population should also be in situ conserved as they have specific genetic resources and cultural values. Additionally, Pingxiang population has high genetic diversity, and should also be conserved, although it is introduced from Hepu, as the natural population might have disappeared. Simultaneously, genetic resources should be widely collected, via seeds or branches (for grafting) from the remaining populations and scattered ancient trees, to establish gene pools for ex situ conservation and breeding studies. As observed in the present study, genetic variation mainly existed within populations, and for large-sized populations, as many families or individuals as possible should be collected in each population. In any case, development of plantation is an efficient way to conserve and use the genetic resources of this species.
5. Conclusions
Population genetic diversity was determined using degree of disturbance, population size, and distance from the central distribution area for E. fordii in South China. The relationship between genetic diversity and current degree of disturbance was not obvious, as the disturbance degree reflects just the current situation; some populations might have suffered from historical disturbances, although they are well protected now. Moreover, genetic variation mainly existed within populations of this species, which is consistent with that observed in other endangered tree species. As some of the populations were represented by only a few individuals, we have to increase the number of individuals to verify the results of the present study in the future. Nonetheless, the findings of the present study can still be applied in developing conservation strategies for E. fordii. It was concluded that populations with high genetic diversity or private alleles, especially Longmen, Wuming, and Pingxiang populations should be given preferential in situ conservations, meanwhile more populations and as many families as possible in each population should be collected for ex situ conservation of germplasm resources of this species in the future.
Supplementary Materials
The following are available online at https://www.mdpi.com/1999-4907/9/10/636/s1, Table S1: Description of five SSR primers for Erythrophleum fordi.
Author Contributions
J.-J.G., Z.-G.Z. and J.Z. designed the experiment. Z.-G.Z., J.-J.G., C.-S.W. and J.Z. performed the experiments and collected the data. J.T. and J.-J.G. analyzed the data. J.T., J.-J.G., Z.-G.Z. and J.Z. contributed to writing the manuscript. J.T. and Z.-G.Z. contributed to this work equally.
Funding
This research was funded by the National Nonprofit Institute Research Grant of Chinese Academy of Forestry, China (CAFYBB2018SZ002).
Conflicts of Interest
The authors declare no conflict of interest.
References
- Frankham, R.; Briscoe, D.A. Introduction to Conservation Genetics; Cambridge University Press: London, UK, 2002; pp. 1–3. ISBN 9780521702713. [Google Scholar]
- Trombulak, S.C.; Omland, K.S.; Robinson, J.A.; Lusk, J.J.; Fleischner, T.L.; Brown, G.; Domroese, M. Principles of conservation biology: Recommended guidelines for conservation literacy from the education committee of the society for conservation biology. Conserv. Biol. 2004, 18, 1180–1190. [Google Scholar] [CrossRef]
- Charles, E.F.; Jeremie, B.F.; Hoban, S.; Kathleen, S.K.; Steger, L.; Aubihl, E.; Miquel, A.G.; Forry, S.; Hille, A.; Alejandro, A.R. Optimizing conservation strategies for a threatened tree species: In situ conservation of white ash (Fraxinus americana L.) genetic diversity through insecticide treatment. Forests 2018, 9, 202. [Google Scholar]
- Hughes, A.R.; Inouye, B.D.; Johnson, M.T.J.; Underwood, N.; Vellend, M. Ecological consequences of genetic diversity. Ecol. Lett. 2008, 11, 609–623. [Google Scholar] [CrossRef] [PubMed] [Green Version]
- Szczecińska, M.; Sramko, G.; Wołosz, K.; Sawicki, J. Genetic diversity and population structure of the rare and endangered plant species Pulsatilla patens (L.) Mill in East Central Europe. PLoS ONE 2016, 11, e0151730. [Google Scholar] [CrossRef] [PubMed]
- Detwiler, R.P.; Hall, C.A.S. Tropical forests and the global carbon cycle. Science 1988, 239, 42–47. [Google Scholar] [CrossRef] [PubMed]
- Wright, S.J. Tropical forests in a changing environment. Trends Ecol. Evol. 2005, 20, 553–560. [Google Scholar] [CrossRef] [PubMed]
- Templeton, A.R.; Davis, S.K. The genetic consequences of habitat fragmentation. Ann. Mo. Bot. Gard. 1990, 77, 13–27. [Google Scholar] [CrossRef]
- Young, A.; Boyle, T.; Brown, T. The population genetic consequences of habitat fragmentation for plant. Trends Ecol. Evol. 1996, 11, 413–418. [Google Scholar] [CrossRef]
- Lira, C.F.; Cardoso, S.R.; Ferreira, P.C.; Cardoso, M.A.; Provan, J. Long-term population isolation in the endangered tropical tree species Caesalpinia echinata Lam. revealed by chloroplast microsatellites. Mol. Ecol. 2003, 12, 3219–3225. [Google Scholar] [CrossRef] [PubMed]
- Sebbenn, A.M.; Licona, J.C.; Mostacedo, B.; Degen, B. Gene flow in an overexploited population of Swietenia macrophylla King (meliaceae) in the Bolivian Amazon. Silvae Genet. 2017, 61, 212–220. [Google Scholar] [CrossRef]
- Rottstock, T.; Kummer, V.; Fischer, M.; Joshi, J. Rapid transgenerational effects in Knautia arvensis in response to plant-community diversity. J. Ecol. 2017, 105, 714–725. [Google Scholar] [CrossRef]
- Laurance, W.F. Forest-climate interactions in fragmented tropical landscapes. Philos. Trans. R. Soc. B 2004, 359, 345–352. [Google Scholar] [CrossRef] [PubMed] [Green Version]
- Sein, C.C.; Mitlöhner, R. Erythrophloeum fordii Oliver: Ecology and Silviculture in Vietnam; Center for International Forestry Research (CIFOR): New York, NY, USA, 2011. [Google Scholar]
- Zhao, Z.G.; Guo, J.J.; Sha, E.; Lin, K.; Zeng, J. Geographic distribution and phenotypic variation of fruit and seed of Erythrophleum fordii in china. Chin. Bull. Bot. 2009, 44, 338–344. (In Chinese) [Google Scholar]
- Nguyen, T.D.; Nishimura, H.; Imai, T.; Watanabe, T.; Kohdzuma, Y.; Sugiyama, J. Natural durability of the culturally and historically important timber: Erythrophleum fordii, wood against white-rot fungi. J. Wood Sci. 2018, 15, 1–10. [Google Scholar] [CrossRef]
- Huang, X.; Chen, Z.; Zhou, S.; Huang, P.; Zhuo, Z.; Zeng, S.; Wang, L.; Wang, Y.; Xu, C.; Tian, H. Cassaine diterpenoids from the seeds of Erythrophleum fordii and their cytotoxic activities. Fitoterapia 2018, 127, 245–251. [Google Scholar] [CrossRef] [PubMed]
- Qu, J.; Hu, Y.C.; Yu, S.S.; Chen, X.G.; Li, Y. New cassaine diterpenoid amides with cytotoxic activities from the bark of Erythrophleum fordii. Planta Med. 2006, 72, 442–449. [Google Scholar] [CrossRef] [PubMed]
- Tsao, C.C.; Shen, Y.C.; Su, C.R.; Li, C.Y.; Liou, M.L.; Dung, N.X.; Wu, T.S. New diterpenoids and the bioactivity of Erythrophleum fordii. Bioorgan. Med. Chem. 2008, 16, 9867–9870. [Google Scholar] [CrossRef] [PubMed]
- Li, F.; Gan, S.; Weng, Q.; Xia, Z.; Huang, S.; Li, M.; Chen, S.; Wang, Q.; Shi, F. RAPD and morphological diversity among four populations of the tropical tree species Paramichelia baillonii (Pierre) Hu in China. For. Ecol. Manag. 2008, 255, 1793–1801. [Google Scholar] [CrossRef]
- Qu, J.; Hu, Y.C.; Li, J.B.; Wang, Y.H.; Zhang, J.L.; Abliz, Z.; Yu, S.S.; Liu, Y.B. Structural characterization of constituents with molecular diversity in fractions from Lysidice brevicalyx by liquid chromatography/diode-array detection/electrospray ionization tandem mass spectrometry and liquid chromatography/nuclear magnetic resonance. Rapid Commun. Mass Spectrom. 2008, 22, 755–765. [Google Scholar] [CrossRef] [PubMed]
- Huang, Z.L.; Guo, G.Z.; Zhang, Z.P. Study on the endangered mechanism and propagation characteristics of Erythrophleum fordii Oliv. Acta Ecol. Sin. 1997, 17, 671–676. (In Chinese) [Google Scholar]
- Trung, T.V. Ecosystems of Tropical Forests in Vietnam; Science and Technics Publishing House: Ha Noi, Vietnam, 1998. (In Vietnamese)
- Wang, S.; Xie, Y. China Species Red List, Vol. I, Red List; Higher Education Press: Beijing, China, 2004; p. 344. ISBN 9787040155846. (In Chinese) [Google Scholar]
- Anon. Red Data Book of Vietnam, Vol. II, Plants; Scientific Publishing House: Ha Noi, Vietnam, 1996. (In Vietnamese) [Google Scholar]
- IUCN. IUCN Red List of Threatened Species. Version 2009, 1. Available online: http://www.iucnredlist.org (accessed on 11 June 2009).
- Yi, W.M.; Cao, H.L.; Wang, B.S. The constituent species and structural characteristics of the community in Dinghu Moutain of Erythrophleum fordii. Trop. Subtrop. Plant J. 1999, 7, 7–14. (In Chinese) [Google Scholar]
- Chen, W.X.; Ye, Z.Y. The karyotype of the lattice Erythrophleum fordii. Guihaia 1987, 7, 208–210. (In Chinese) [Google Scholar]
- Zhu, P.; Ye, W.H.; Wang, Z.F.; Cao, H.L.; Zhang, M.; Li, L.; Xiao, W. Isolation and characterization of ten polymorphic microsatellite in the endangered tree Erythrophleum fordii oliv. Conserv. Genet. 2009, 10, 1017–1019. [Google Scholar] [CrossRef]
- Zhu, P.; Wang, Z.F.; Ye, W.H.; Cao, H.L. Maintenance of genetic diversity in a small, isolated population of ancient tree Erythrophleum fordii. J. Syst. Evol. 2013, 51, 722–730. [Google Scholar] [CrossRef]
- Chhajer, S.; Jukanti, A.K.; Bhatt, R.K.; Kalia, R.K. Genetic diversity studies in endangered desert teak [Tecomella undulata, (sm) seem] using arbitrary (RAPD), semi-arbitrary (ISSR) and sequence based (nuclear RDNA) markers. Trees 2018, 4, 1–19. [Google Scholar] [CrossRef]
- Juchum, F.S.; Leal, J.B.; Santos, L.M.; Almeida, M.P.; Ahnert, D.; Corrêa, R.X. Evaluation of genetic diversity in a natural rosewood population (Dalbergia nigra Vell. Allemao ex Benth.) using RAPD markers. Genet. Mol. Res. 2007, 6, 543–553. [Google Scholar] [PubMed]
- Du, Q.; Wang, B.; Wei, Z.; Zhang, D.; Li, B. Genetic diversity and population structure of Chinese White poplar (Populus tomentosa) revealed by SSR markers. J. Hered. 2012, 103, 853–862. [Google Scholar] [CrossRef] [PubMed]
- Taheri, S.; Lee, A.T.; Yusop, M.R.; Hanafi, M.M.; Sahebi, M.; Azizi, P.; Shamshiri, R.R. Mining and development of novel SSR markers using next generation sequencing (NGS) data in plants. Molecules 2018, 23, 399. [Google Scholar] [CrossRef] [PubMed]
- Zeng, J.; Zou, Y.P.; Bai, J.Y.; Zheng, H.S. Preparation of Total DNA from “Recalcitrant Plant Taxa”. Acta Bot. Sin. 2002, 44, 694–697. [Google Scholar]
- Yeh, F.C.; Yang, R.C.; Boyle, T.B.J.; Ye, Z.H.; Mao, J.X.; Yeh, C.; Timothy, B.; Mao, X. POPGENE (Version 1.31), the User-Friendly Shareware for Population Genetic Analysis; Molecular Biology and Biotechnoly Centre, University of Alberta: Edmonton, AL, Canada, 1997. [Google Scholar]
- Pritchard, J.K.; Stephens, M.; Donnelly, P. Inference of population structure using multi locus genotype data. Genetics 2010, 155, 945–959. [Google Scholar]
- Evanno, G.; Regnaut, S.; Goudet, J. Detecting the number of clusters of individuals using the software Structure: A simulation study. Mol. Ecol. 2005, 14, 2611–2620. [Google Scholar] [CrossRef] [PubMed]
- Earl, D.A.; Vonholdt, B.M. Structure Harvester: A website and program for visualizing structure output and implementing the Evan no method. Conserv. Genet. Resour. 2012, 4, 359–361. [Google Scholar] [CrossRef]
- Mattias, J.; Noah, A.R. CLUMPP: A cluster matching and permutation program for dealing with label switching and multimodality in analysis of population structure. Bioinformatics 2007, 23, 1801–1806. [Google Scholar]
- Rosenberg, N.A. Distruct: A program for the graphical display of population structure. Mol. Ecol. Resour. 2010, 4, 137–138. [Google Scholar] [CrossRef]
- Rohlf, F.J. NTSYS-pc numerical taxonomy and multivariate analysis system. Am. Stat. 2000, 41, 330. [Google Scholar] [CrossRef]
- Manel, S.; Schwartz, M.K.; Luikart, G.; Taberlet, P. Landscape genetics: Combining landscape ecology and population genetics. Trends Ecol. Evol. 2003, 18, 189–197. [Google Scholar] [CrossRef]
- Slatkin, M.; Barton, N.H. A comparison of three indirect methods for estimating average levels of gene flow. Evolution 1989, 43, 1349–1368. [Google Scholar] [CrossRef] [PubMed]
- Zoller, S.; Lutzoni, F.; Scheidegger, C. Genetic variation within and among populations of the threatened lichen (Lobaria pulmonaria) in Switzerland and implications for its conservation. Mol. Ecol. 1999, 8, 2049–2059. [Google Scholar] [CrossRef] [PubMed]
- Sala, O.E.; Chapin, F.S.; Armesto, J.J.; Berlow, E.; Bloomfield, J.; Dirzo, R.; Huber-Sanwald, E.; Huenneke, L.F.; Jackson, R.B.; Kinzig, A.; et al. Global biodiversity scenarios for the year 2100. Science 2000, 287, 1770–1774. [Google Scholar] [CrossRef] [PubMed]
- Lammi, A.; Siikamaki, P.; Mustajarvi, K. Genetic diversity, population size, and fitness in central and peripheral populations of a rare plant Lychnis viscaria. Conserv. Biol. 1999, 13, 1069–1078. [Google Scholar] [CrossRef]
- Miao, Y.C.; Zhang, Z.J.; Su, J.R. Low genetic diversity in the endangered Taxus yunnanensis following a population bottleneck, a low effective population size and increased inbreeding. Silvae Genet. 2016, 65, 59–66. [Google Scholar] [CrossRef]
- Wright, S. The interpretation of population structure by F-statistics with special regard to systems of mating. Evolution 1965, 19, 395–420. [Google Scholar] [CrossRef]
- Forrest, A.; Escudero, M.; Heuertz, M.; Wilson, Y.; Cano, E.; Vargas, P. Testing the hypothesis of low genetic diversity and population structure in narrow endemic species: The endangered Antirrhinum charidemi (plantaginaceae). Bot. J. Linn. Soc. 2017, 183, 260–270. [Google Scholar] [CrossRef]
- Albaladejo, R.G.; Carrillo, L.F.; Aparicio, A.; Fernández-Manjarrés, J.F.; González-Varo, J.P. Population genetic structure in Myrtus communis L. in a chronically fragmented landscape in the Mediterranean: Can gene flow counteract habitat perturbation? Plant Biol. 2009, 11, 442–453. [Google Scholar] [CrossRef] [PubMed]
- Petit, R.J.; El Mousadik, A.; Pons, O. Identifying populations for conservation on the basis of genetic markers. Conserv. Biol. 1998, 12, 844–855. [Google Scholar] [CrossRef]
- Vinceti, B.; Loo, J.; Gaisberger, H.; Van Zonneveld, M.J.; Schueler, S.; Konrad, H.; Kadu, C.A.; Geburek, T. Conservation priorites for Prunus africana defined with the aid of spatial analysis of genetic data and climatic variables. PLoS ONE 2013, 8, e59987. [Google Scholar] [CrossRef] [PubMed] [Green Version]
Figure 1.
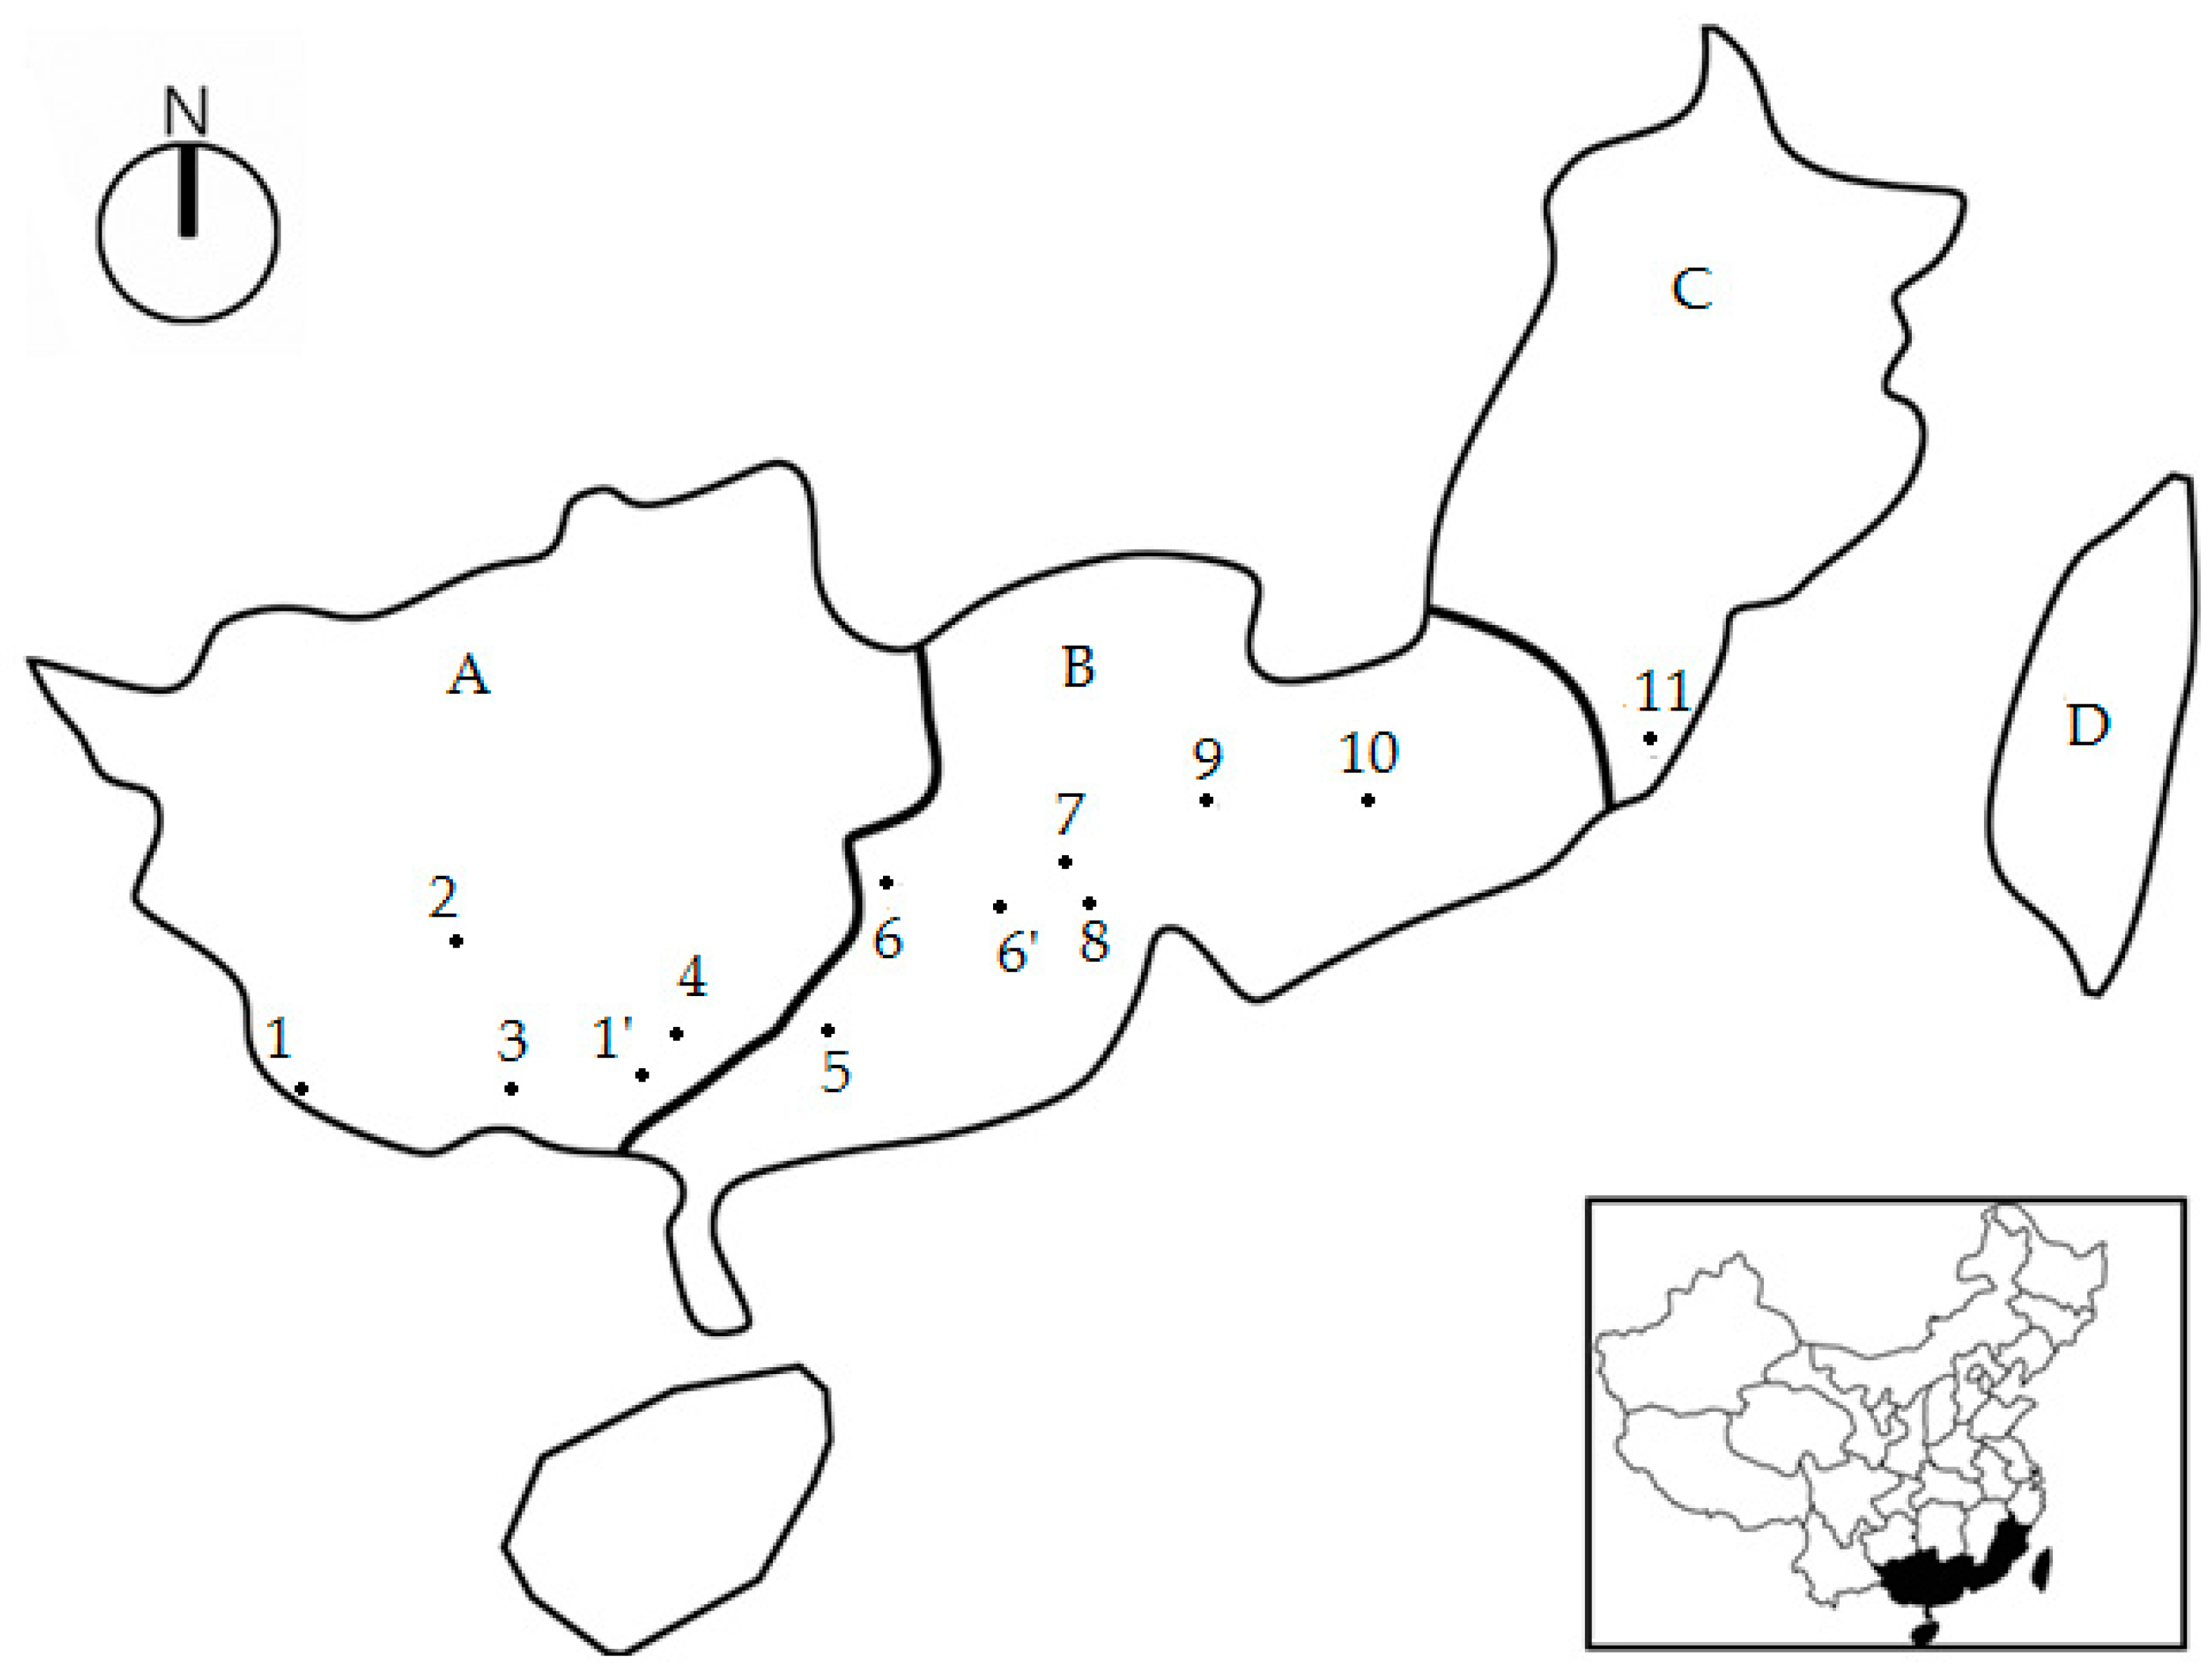
Localities of 11 populations of Erythrophleum fordii Oliv. in China. Notes: A, Guangxi Zhuang Autonomous Region; B, Guangdong Province; C, Fujian Province; D, Taiwan Province. Numbers in Figure 1 were represented the codes of population. P1 introduced from P1’ (Hepu, Guangxi); P6 introduced from P6’ (Dinghushan National Natural Reserve at Zhaoqing, Guangdong).
Figure 1.
Localities of 11 populations of Erythrophleum fordii Oliv. in China. Notes: A, Guangxi Zhuang Autonomous Region; B, Guangdong Province; C, Fujian Province; D, Taiwan Province. Numbers in Figure 1 were represented the codes of population. P1 introduced from P1’ (Hepu, Guangxi); P6 introduced from P6’ (Dinghushan National Natural Reserve at Zhaoqing, Guangdong).

Figure 2.
Relations between the rational groups number K and estimated value ΔK.

Figure 3.
Genetic structural plot of eight Erythrophleum fordii populations based on STRUCTURE analysis. Blue, red and green represent different groups.
Figure 3.
Genetic structural plot of eight Erythrophleum fordii populations based on STRUCTURE analysis. Blue, red and green represent different groups.

Figure 4.
Genetic divergence among eight Erythrophleum fordii populations based on UPGMA clustering analysis.
Figure 4.
Genetic divergence among eight Erythrophleum fordii populations based on UPGMA clustering analysis.


Table 1.
Sampling sizes and general situation of 11 Erythrophleum fordii Oliv. populations.
| Code | Population | Longitude (° E) | Latitude (° N) | Altitude (m) | MAT (°C) | MAR (mm) | Origin | Forest Type | Population Size | Degree of Disturbance | No. of Individuals |
|---|---|---|---|---|---|---|---|---|---|---|---|
| P1 | Pingxiang, Guangxi | 106.8 | 22.1 | 260 | 22.0 | 1417 | Introduced1 | Commercial timber forest | Large | Planned thinning | 25 |
| P2 | Wuming, Guangxi | 108.0 | 23.5 | 375 | 20.0 | 2630 | Natural | Water resources conservation forest | Large | Seriously disturbed | 20 |
| P3 | Qinzhou, Guangxi | 108.3 | 22.6 | 45 | 22.0 | 2080 | Natural | Water resources conservation forest | Small | Well protected | 8 |
| P4 | Bobai, Guangxi | 109.6 | 22.1 | 105 | 22.9 | 1756 | Natural | Water resources conservation forest | Large | Seriously disturbed | 24 |
| P5 | Xinyi, Guangdong | 111.0 | 22.1 | 200 | 22.0 | 1650 | Natural | Geomantic forest | Small | Well protected | 2 |
| P6 | Fengkai, Guangdong | 111.8 | 23.7 | 60 | 20.3 | 1556 | Introduced2 | Geomantic forest | Small | Well protected | 6 |
| P7 | Huadu, Guangzhou, Guangdong | 113.3 | 23.4 | 30 | 21.7 | 1737 | Natural | Geomantic forest | Small | Well protected | 4 |
| P8 | Tianhe, Guangzhou, Guangdong | 113.4 | 23.2 | 90 | 21.9 | 1800 | Natural | Water resources conservation forest | Small | Well protected | 3 |
| P9 | Longmen, Guangdong | 114.7 | 23.6 | 25 | 20.8 | 2267 | Natural | Water resources conservation forest | Middle | Seriously disturbed | 15 |
| P10 | Zijin, Guangdong | 115.6 | 23.4 | 40 | 20.5 | 1761 | Natural | Geomantic forest | Small | Well protected | 14 |
| P11 | Yunxiao, Fujian | 117.4 | 24.1 | 35 | 21.3 | 1730 | Natural | Geomantic forest | Middle | Seriously disturbed | 21 |
Table 2.
Allele frequencies in 11 populations of Erythrophleum fordii.
| Loci | Allele | Population 1 | ||||||||||
|---|---|---|---|---|---|---|---|---|---|---|---|---|
| 1 | 2 | 3 | 4 | 5 | 6 | 7 | 8 | 9 | 10 | 11 | ||
| Gm1048 | a | 0 | 0.38 | 0.19 | 0 | 0 | 0 | 0 | 0 | 0.60 | 0.04 | 0 |
| b | 0.26 | 0.28 | 0 | 0.27 | 0 | 0.25 | 0 | 0 | 0.17 | 0.43 | 0.26 | |
| c | 0.06 | 0 | 0 | 0 | 0 | 0 | 0 | 0 | 0 | 0.04 | 0.02 | |
| d | 0.04 | 0.20 | 0.50 | 0 | 0.25 | 0.33 | 0 | 0.50 | 0.03 | 0 | 0.24 | |
| e | 0.24 | 0.13 | 0.19 | 0.29 | 0.75 | 0.33 | 0.75 | 0.50 | 0.10 | 0.04 | 0.48 | |
| f | 0.40 | 0.03 | 0.06 | 0.44 | 0.00 | 0.08 | 0.25 | 0.00 | 0.10 | 0.46 | 0 | |
| g | 0 | 0 | 0.06 | 0 | 0 | 0 | 0 | 0 | 0 | 0 | 0 | |
| Gm1052 | a | 0.02 | 0.33 | 0 | 0.04 | 0.75 | 0.08 | 0 | 0 | 0.03 | 0 | 0.05 |
| b | 0.24 | 0.10 | 0.19 | 0.15 | 0.25 | 0.08 | 0 | 0.17 | 0.33 | 0.07 | 0.58 | |
| c | 0.67 | 0.53 | 0.75 | 0.72 | 0 | 0.68 | 0 | 0.33 | 0.50 | 0.46 | 0.38 | |
| d | 0.02 | 0 | 0 | 0 | 0 | 0.17 | 0.67 | 0.50 | 0.03 | 0.25 | 0 | |
| e | 0.04 | 0.05 | 0.06 | 0.09 | 0 | 0 | 0.33 | 0 | 0.10 | 0.21 | 0 | |
| Gm2065 | a | 0.02 | 0.08 | 0.19 | 0.06 | 1.00 | 0.50 | 0.13 | 0.17 | 0.17 | 0 | 0 |
| b | 0.02 | 0.20 | 0.06 | 0 | 0 | 0 | 0 | 0 | 0 | 0 | 0.02 | |
| c | 0.41 | 0.23 | 0.19 | 0.19 | 0 | 0.08 | 0.38 | 0.33 | 0.47 | 0 | 0.21 | |
| d | 0 | 0.05 | 0 | 0 | 0 | 0.25 | 0.38 | 0 | 0.03 | 0 | 0 | |
| e | 0.15 | 0.25 | 0 | 0.10 | 0 | 0 | 0 | 0 | 0 | 0 | 0 | |
| f | 0 | 0.03 | 0 | 0 | 0 | 0 | 0 | 0 | 0 | 0 | 0 | |
| g | 0 | 0 | 0 | 0 | 0 | 0 | 0 | 0 | 0.20 | 0.04 | 0 | |
| h | 0.33 | 0.15 | 0.50 | 0.58 | 0 | 0.17 | 0.13 | 0.50 | 0.13 | 0.96 | 0.71 | |
| i | 0.07 | 0.03 | 0.06 | 0.06 | 0 | 0 | 0 | 0 | 0 | 0 | 0.05 | |
| Gm4040 | a | 0 | 0 | 0 | 0 | 0 | 0 | 0 | 0 | 0 | 0 | 0.29 |
| b | 0 | 0 | 0 | 0 | 0 | 0.33 | 0 | 0 | 0 | 0 | 0 | |
| c | 0 | 0 | 0 | 0 | 0 | 0 | 0 | 0 | 0.03 | 0 | 0 | |
| d | 0 | 0.05 | 0.06 | 0 | 0 | 0.25 | 0 | 0 | 0.64 | 0.25 | 0 | |
| e | 0.46 | 0.33 | 0.25 | 0.52 | 0 | 0 | 0 | 0 | 0.27 | 0.64 | 0.52 | |
| f | 0.02 | 0 | 0 | 0 | 0 | 0 | 0 | 0 | 0 | 0 | 0.07 | |
| g | 0.50 | 0.60 | 0.63 | 0.44 | 0.50 | 0.17 | 0.83 | 0.50 | 0.43 | 0.11 | 0.12 | |
| h | 0 | 0 | 0 | 0 | 0 | 0 | 0 | 0 | 0.20 | 0 | 0 | |
| i | 0.02 | 0.03 | 0.06 | 0.04 | 0.50 | 0.25 | 0.17 | 0.50 | 0 | 0 | 0 | |
| Gm65 | a | 0 | 0 | 0.25 | 0.08 | 0 | 0 | 0 | 0 | 0.08 | 0 | 0 |
| b | 0.36 | 0.35 | 0.63 | 0.19 | 0 | 0.10 | 0.33 | 0.33 | 0.08 | 0.54 | 0 | |
| c | 0.64 | 0.65 | 0.13 | 0.73 | 1.00 | 0.90 | 0.67 | 0.67 | 0.79 | 0.46 | 1.00 | |
| d | 0 | 0 | 0 | 0 | 0 | 0 | 0 | 0.04 | 0 | 0 | ||
Notes: 1, See Table 1 for population code.
Table 3.
Genetic diversity of 11 populations of Erythorphleum fordii.
| Population Code | A | Ae | Ho | He | I |
|---|---|---|---|---|---|
| P1 | 4.4 | 2.54 | 0.61 | 0.59 | 1.03 |
| P2 | 4.6 | 3.12 | 0.54 | 0.64 | 1.17 |
| P3 | 4.0 | 2.41 | 0.53 | 0.60 | 1.05 |
| P4 | 3.6 | 2.22 | 0.48 | 0.55 | 0.95 |
| P5 | 1.6 | 1.44 | 0.40 | 0.33 | 0.36 |
| P6 | 3.6 | 2.67 | 0.67 | 0.61 | 1.03 |
| P7 | 2.4 | 1.96 | 0.32 | 0.54 | 0.71 |
| P8 | 2.4 | 2.19 | 0.67 | 0.73 | 0.81 |
| P9 | 4.8 | 2.65 | 0.52 | 0.61 | 1.15 |
| P10 | 3.2 | 2.13 | 0.54 | 0.49 | 0.80 |
| P11 | 3.2 | 2.08 | 0.41 | 0.46 | 0.7827 |
| Mean | 3.40 | 2.31 | 0.52 | 0.56 | 0.90 |
Note: A, the mean number of alleles per locus; Ae, the mean number of efficient alleles per locus; Ho and He, the expected and observed heterozygosity; I, Shannon’s diversity index.
Table 4.
Genetic diversity of 11 populations of Erythorphleum fordii at species level.
| Loci | A | Ae | Ho | He | I |
|---|---|---|---|---|---|
| Gm1048 | 7 | 4.82 | 0.71 | 0.80 | 1.65 |
| Gm1052 | 5 | 2.49 | 0.48 | 0.60 | 1.17 |
| Gm2065 | 9 | 3.56 | 0.62 | 0.72 | 1.59 |
| Gm4040 | 9 | 3.05 | 0.60 | 0.68 | 1.40 |
| Gm65 | 4 | 1.92 | 0.21 | 0.48 | 0.81 |
| Mean | 6.80 | 3.12 | 0.52 | 0.65 | 1.32 |
Note: A, the mean number of alleles per locus; Ae, the mean number of efficient alleles per locus; Ho and He, the expected and observed heterozygosity; I, Shannon’s diversity index.
Table 5.
Correlation between genetic diversity index and geographical factors.
| Index | Longitude | Latitude | Altitude |
|---|---|---|---|
| A | −0.58 | −0.24 | 0.17 |
| Ae | −0.54 | 0.05 | 0.40 |
| Ho | −0.33 | −0.07 | 0.26 |
| He | −0.68 * | −0.21 | 0.39 |
| I | −0.60 * | −0.19 | 0.28 |
Note: *, p < 0.05; P2, P3, P4, P9, P10 and P11 natural populations with at least five samples were analyzed.
Table 6.
Fixation index (F) and Hardy-Weinberg equilibrium chi-square tests of all loci in populations of Erythrophleum fordii.
Table 6.
Fixation index (F) and Hardy-Weinberg equilibrium chi-square tests of all loci in populations of Erythrophleum fordii.
| Loci | P1 | P2 | P3 | P4 | P6 | P9 | P10 | P11 |
|---|---|---|---|---|---|---|---|---|
| Gm1048 | −0.07 | 0.18 | 0.07 | −0.09 | −0.18 | −0.13 | −0.32 | −0.25 |
| Gm1052 | 0.11 | 0.09 | −0.25 | 0.33 ** | 0.01 | 0.15 | −0.17 | 0.33 |
| Gm2065 | −0.19 | 0.02 | −0.12 | −0.03 | −0.28 | −0.05 | −0.04 | 0.24 |
| Gm4040 | −0.39 | 0.15 | −0.39 | 0.14 | −0.36 | 0.14 | −0.11 | 0.09 |
| Gm65 | 0.41 * | 0.34 | 1.00 ** | 0.32 ** | −0.11 | 0.77 ** | 0.07 | - |
| Mean | −0.03 | 0.16 | 0.06 | 0.13 | −0.18 | 0.17 | −0.11 | 0.08 |
Notes: **, p < 0.01; *, p < 0.05. -, no fixation index was obtained since only one allele was detected in P11 population at locus Gm65.
Table 7.
F-statistics and Nm of Erythrophleum fordii populations.
| Loci | FIS | FIT | FST | Nm |
|---|---|---|---|---|
| Gm1048 | −0.09 | 0.10 | 0.17 | 1.18 |
| Gm1052 | −0.09 | 0.09 | 0.17 | 1.25 |
| Gm2065 | −0.07 | 0.15 | 0.20 | 0.97 |
| Gm4040 | 0.08 | 0.17 | 0.10 | 2.22 |
| Gm65 | 0.45 | 0.58 | 0.24 | 0.78 |
| Mean | 0.01 | 0.19 | 0.18 | 1.28 |
Note: Nm, Gene flow = 0.25(1 − FST)/FST; P1, P2, P3, P4, P6, P9, P10 and P11 populations were analyzed in this table.
Table 8.
Nei’s (1972) genetic distance between eight Erythrophleum fordii populations.
| Population Code | P1 | P2 | P3 | P4 | P6 | P9 | P10 |
|---|---|---|---|---|---|---|---|
| P2 | 0.16 | ||||||
| P3 | 0.28 | 0.29 | |||||
| P4 | 0.04 | 0.22 | 0.32 | ||||
| P6 | 0.39 | 0.37 | 0. 56 | 0.35 | |||
| P9 | 0.23 | 0.17 | 0.49 | 0.28 | 0.40 | ||
| P10 | 0.27 | 0.52 | 0.45 | 0.18 | 0.68 | 0.65 | |
| P11 | 0.27 | 0.41 | 0.27 | 0.61 | 0.40 | 0.36 | 0.38 |
© 2018 by the authors. Licensee MDPI, Basel, Switzerland. This article is an open access article distributed under the terms and conditions of the Creative Commons Attribution (CC BY) license (http://creativecommons.org/licenses/by/4.0/).
Share and Cite
MDPI and ACS Style
Tan, J.; Zhao, Z.-G.; Guo, J.-J.; Wang, C.-S.; Zeng, J. Genetic Diversity and Population Genetic Structure of Erythrophleum fordii Oliv., an Endangered Rosewood Species in South China. Forests 2018, 9, 636. https://doi.org/10.3390/f9100636
AMA Style
Tan J, Zhao Z-G, Guo J-J, Wang C-S, Zeng J. Genetic Diversity and Population Genetic Structure of Erythrophleum fordii Oliv., an Endangered Rosewood Species in South China. Forests. 2018; 9(10):636. https://doi.org/10.3390/f9100636
Chicago/Turabian StyleTan, Jing, Zhi-Gang Zhao, Jun-Jie Guo, Chun-Sheng Wang, and Jie Zeng. 2018. "Genetic Diversity and Population Genetic Structure of Erythrophleum fordii Oliv., an Endangered Rosewood Species in South China" Forests 9, no. 10: 636. https://doi.org/10.3390/f9100636
Note that from the first issue of 2016, this journal uses article numbers instead of page numbers. See further details here.