Detecting Shoot Beetle Damage on Yunnan Pine Using Landsat Time-Series Data


Key Laboratory for Silviculture and Conservation of Ministry of Education, Beijing Forestry University, Beijing 100083, China
*
Authors to whom correspondence should be addressed.
Forests 2018, 9(1), 39; https://doi.org/10.3390/f9010039
Submission received: 6 December 2017
/
Revised: 11 January 2018
/
Accepted: 13 January 2018
/
Published: 22 January 2018
(This article belongs to the Special Issue Disturbance, Succession, and Development of Forests)
Abstract
:Tomicus yunnanensis and Tomicus minor have caused serious shoot damage in Yunnan pine forests in the Yunnan Province of China. However, very few remote sensing studies have estimated the shoot damage ratio (SDR). Thus, we used multi-date Landsat satellite imagery to quantify SDRs and assess the possibility of using spectral indices to determine the beetle outbreak time and spread direction. A new threshold-based classification method was proposed to identify damage levels (i.e., healthy, slightly to moderately infested, and severely infested forests) using time series of moisture stress index (MSI). Permanent plots and temporal field inspection data were both used as references for training and evaluation. Results show that a single threshold value can produce a total classification accuracy of 86.38% (Kappa = 0.80). Furthermore, time series maps detailing damage level were reconstructed from 2004 to 2016. The shoot beetle outbreak year was estimated to be 2013. Another interesting finding is the movement path of the geometric center of severe damage, which is highly consistent with the wind direction. We conclude that the time series of shoot damage level maps can be produced by using continuous MSI images. This method is very useful to foresters for determining the outbreak time and spread direction.
1. Introduction
Yunnan pine (Pinus yunnanensis Franch) is a local afforestation tree species in southwest (SW) China. It covers around five million hectares of land surface, which accounts for 52% of the forest area in Yunnan Province [1,2,3]. More than one-fourth of the territory of the Yunnan Province belongs to the Karst landform. Rock desertification areas have continually expanded in recent years. Because of these reasons, it is very important to preserve the current vegetation cover and to protect Yunnan pine forests [4,5,6,7].
However, due to global climate change, the growth of the Yunnan pine in Yunnan Province has been poor in recent decades [8,9,10,11,12]. In 2009, widespread drought occurred in Yunnan Province, which continuously weakened the trees [13,14,15,16,17]. Serious defoliator and woodborer pest damage then followed. Major impacted cities include Kunming, Yuxi, Chuxiong, Qujing, and Dali. Massive death of the Yunnan pine led to huge losses in the forestry industry and reduced ecological function. Because the damage mechanism of defoliators is clear, their monitoring and control are relatively successful [18,19,20,21]. Meanwhile, the attacking process of woodborers is still vague and complex. As a result, there are fewer successful case studies to monitor and control these pests. One of these studies focused on the mountain pine beetle (MPB), which attacks only the trunks of pine. Based on canopy color, the damage stages caused by MPB are classified into green, yellow, red, and gray stages [22]. Therefore, MPB outbreak time could be reported by aerial detection surveys or field surveys from local agencies, such as the USDA (United States Department of Agriculture) Forest Service [23,24,25]. Due to their clear life cycle and detailed field data, the monitoring accuracy of MPB using remote sensing technology is acceptable [26,27,28,29,30,31,32].
In Yunnan Province, Tomicus spp. are considered to have been responsible for destroying 1.5 million hectares of Yunnan pine forests in SW China over the past 20 years [33,34,35,36]. Therefore, it is urgent and crucial to develop an effective method to monitor Tomicus spp. Two members of the Tomicus genus, (1) Tomicus yunnanensis Kirkendall and Faccoli and (2) Tomicus minor Hartig, are the most destructive pests of Yunnan pine in Yunnan Province. To our knowledge, unlike MPB, the life cycle of Tomicus spp. is unclear. It can be roughly divided into two stages: the trunk-shoot stage and the shoot-trunk stage. In the trunk-shoot stage, beetles coming out of trunks attack the fresh shoots of Yunnan pines from May to November. The attacked shoot needles gradually change from green to yellow and red. Correspondingly, the spectral reflectance of the needles changes. In severely infested forests, the beetles may harm whole shoots of Yunnan pine and represent the direct cause of tree mortality. During December, the sexually mature beetles begin to migrate from the shoots to the trunks of weak trees. In the trunk, they mate and lay eggs. During May of the second year, a new trunk-shoot stage begins. New adults drill out of the trunk and move to the shoots for feeding [37,38,39,40,41,42]. Because of this complex life cycle, the damage trend of T. yunnanensis and T. minor cannot be effectively mitigated despite many efforts to control its initiation and the spread of the beetles. As a result, it is urgent to gain additional knowledge on the attacking stages of these species.
Remote sensing (RS) is useful in detecting forest disturbances. Therefore, we tried to use RS methods to monitor the damage caused by these shoot beetles. Compared to single-date RS data, time series of Landsat images contain more information to detect pest disturbances, especially disturbances caused by bark beetles. For example, a Landsat time series change detection algorithm (LandTrendr) was used to draw spectral trajectories associated with pest disturbances of different times and severities, as well as to investigate the relationship between these trajectories and ground-based measurements of tree mortality and surface fuels in the Cascade Range of Oregon, USA [43]. The researchers found that spectral changes were linked to tree basal area mortality (Adj. R2 = 0.40) and coarse woody detritus (Adj. R2 = 0.29). Hais et al. [44] used Landsat imagery to identify the differences in spectral responses between the two types of forest disturbances (i.e., bark beetle outbreak and clear-cuts) and their temporal dynamics in the central part of the Šumava Mountains, at the border between the Czech Republic and Germany in Central Europe. They found that DI (Disturbance Index), wetness, and brightness indices were connected with both forest disturbance types. In addition, the multi-temporal analysis could distinguish different stages of development. Meddens et al. [45] used both single-date (using maximum likelihood classification) and multi-date (using time series of spectral indices) classification methods of Landsat imagery to investigate the change of accuracy in mortality severity in a study monitoring coniferous forests across North America. Results show that the overall accuracy is 91.0% and 89.6% for the single-date image classification (using the tasseled cap transformation indices) and the multi-date analysis (using the Band5/Band4 anomaly), respectively. Therefore, multi-date RS data have the potential to enhance the monitoring accuracy for shoot beetles.
However, since most studies are focused on tree mortality, it is not sufficient to define the shoot damage process. To our knowledge, there has been no previous study using multi-date Landsat imagery to investigate tree shoot damage. As a result, the time series method should be re-evaluated for the monitoring of Yunnan pine. To address this gap, the main objectives of this study were (1) to investigate the capacity of multi-date Landsat satellite imagery to classify damage levels following T. yunnanensis and T. minor attack and (2) to explore the efficacy of spectral indices to detect the beetles’ outbreak time and spread direction.
2. Materials and Methods
2.1. Study Area
The study area (5248 hectares) is located in Pupeng town of Dali City in Yunnan Province (Figure 1). In this area, a major T. yunnanensis and T. minor outbreak was recorded in 2013. The two beetle species have caused extensive shoot damage ratios in the study area. The area undergoes two seasons: the dry season (i.e., November–May) and the wet season (i.e., June–October). The mean average annual precipitation is 783.7 mm, and the average annual temperature is 14.7 °C. The average monthly maximum and minimum temperatures are 27 and 7.6 °C [46], respectively. The elevation ranges from 1720 m (Yunlichang Valley) to 2745 m (Yingge Mountains).
2.2. Field Experiments
Forty permanent field plots (30 m × 30 m) were set up in 2016 and distributed as evenly as possible over the study area (see Figure 1c). The geographic coordinates for all plots were measured using differential GPS. At each plot, we sampled all trees with a diameter at breast height (DBH) greater than 4 cm. Three major parameters were measured including DBH, height (H), and the shoot damage ratio (SDR) of each tree. The plot SDR was the averaged shoot damage ratio of single trees (pi). The average equally treats all trees without considering tree size with regards to weight. The plot size of 30 m × 30 m was to match the spatial resolution of Landsat images.
where p is the single tree damage ratio, ni is the number of damaged shoots, Ni is the number of total shoots, and SDR is the averaged plot damage ratio of ntree trees.
Each SDR is between 0% and 100%. We grouped the SDRs into two groups: that of an infested tree (0% < SDR < 100%), and a “red-attack” tree or a “gray-attack” tree (SDR = 100%). Based on the classification standard (Standard of Forest Pests Occurrence and Disaster LY/T 1681–2006) and considering the local damage situation, we divided the forests into three damage levels: healthy forest (0% ≤ SDR < 10%), slightly to moderately infested forest (10 ≤ SDR ≤ 50%), and severely infested forest (50% < SDR) (Table 1).
Based on the field plots, the boundaries of the three different damage level areas (healthy, slightly to moderately infested, and severely infested) were delineated through field inspections, surveyed with GPS, and marked on an ortho-photo from 2016 (see Figure 1c). We then used these specified areas to assess the spectral response of the different SDRs from attacks by the beetles.
2.3. Landsat Data Preparation
Seven archived Landsat Thematic Mapper (TM) 5, ten Landsat Enhanced Thematic Mapper (ETM+) 7, and five Landsat Operational Land Imager (OLI) images from 2004 to 2016 were downloaded from the USGS GLOVIS (United States Geological Survey Global Visualization Viewer) website [47] (Table 2). The chosen images were acquired at time periods close to the end of shoot damage by these beetles (i.e., in November/December) and with minimal cloud cover. If there was significant cloud cover and SLC (Scan Lines Corrector)-off areas in a scene, we attempted to find other images within that same year to fill cloudy areas and SLC-off areas in the priority image. Using visual inspection, we noted that Landsat data from path/row 130/42, 130/43, and 131/42 were terrain-corrected (processing level: L1T) which resulted in high geo-registration accuracy between the images. The satellite scenes were orthorectified into the coordinate system and a DEM (Digital Elevation Model) was created from the contour lines (1:25,000). The calibration and atmospheric correction model (FLAASH) were applied to the images to convert digital number (DN) values into values for sensor radiance and reflectance at the bottom of the atmosphere.
2.4. Spectral Indices
The spectral regions of Landsat sensors are shown in Table 3. We calculated four spectral indices to aid in image classification (Table 4): the red-green index (RGI), normalized difference vegetation index (NDVI), normalized difference moisture index (NDMI), and moisture stress index (MSI). These four spectral indices were used to detect SDR because they have been successfully used to identify pest disturbances in previous research [48,49,50,51,52,53].
2.5. Multi-Date Classification Method
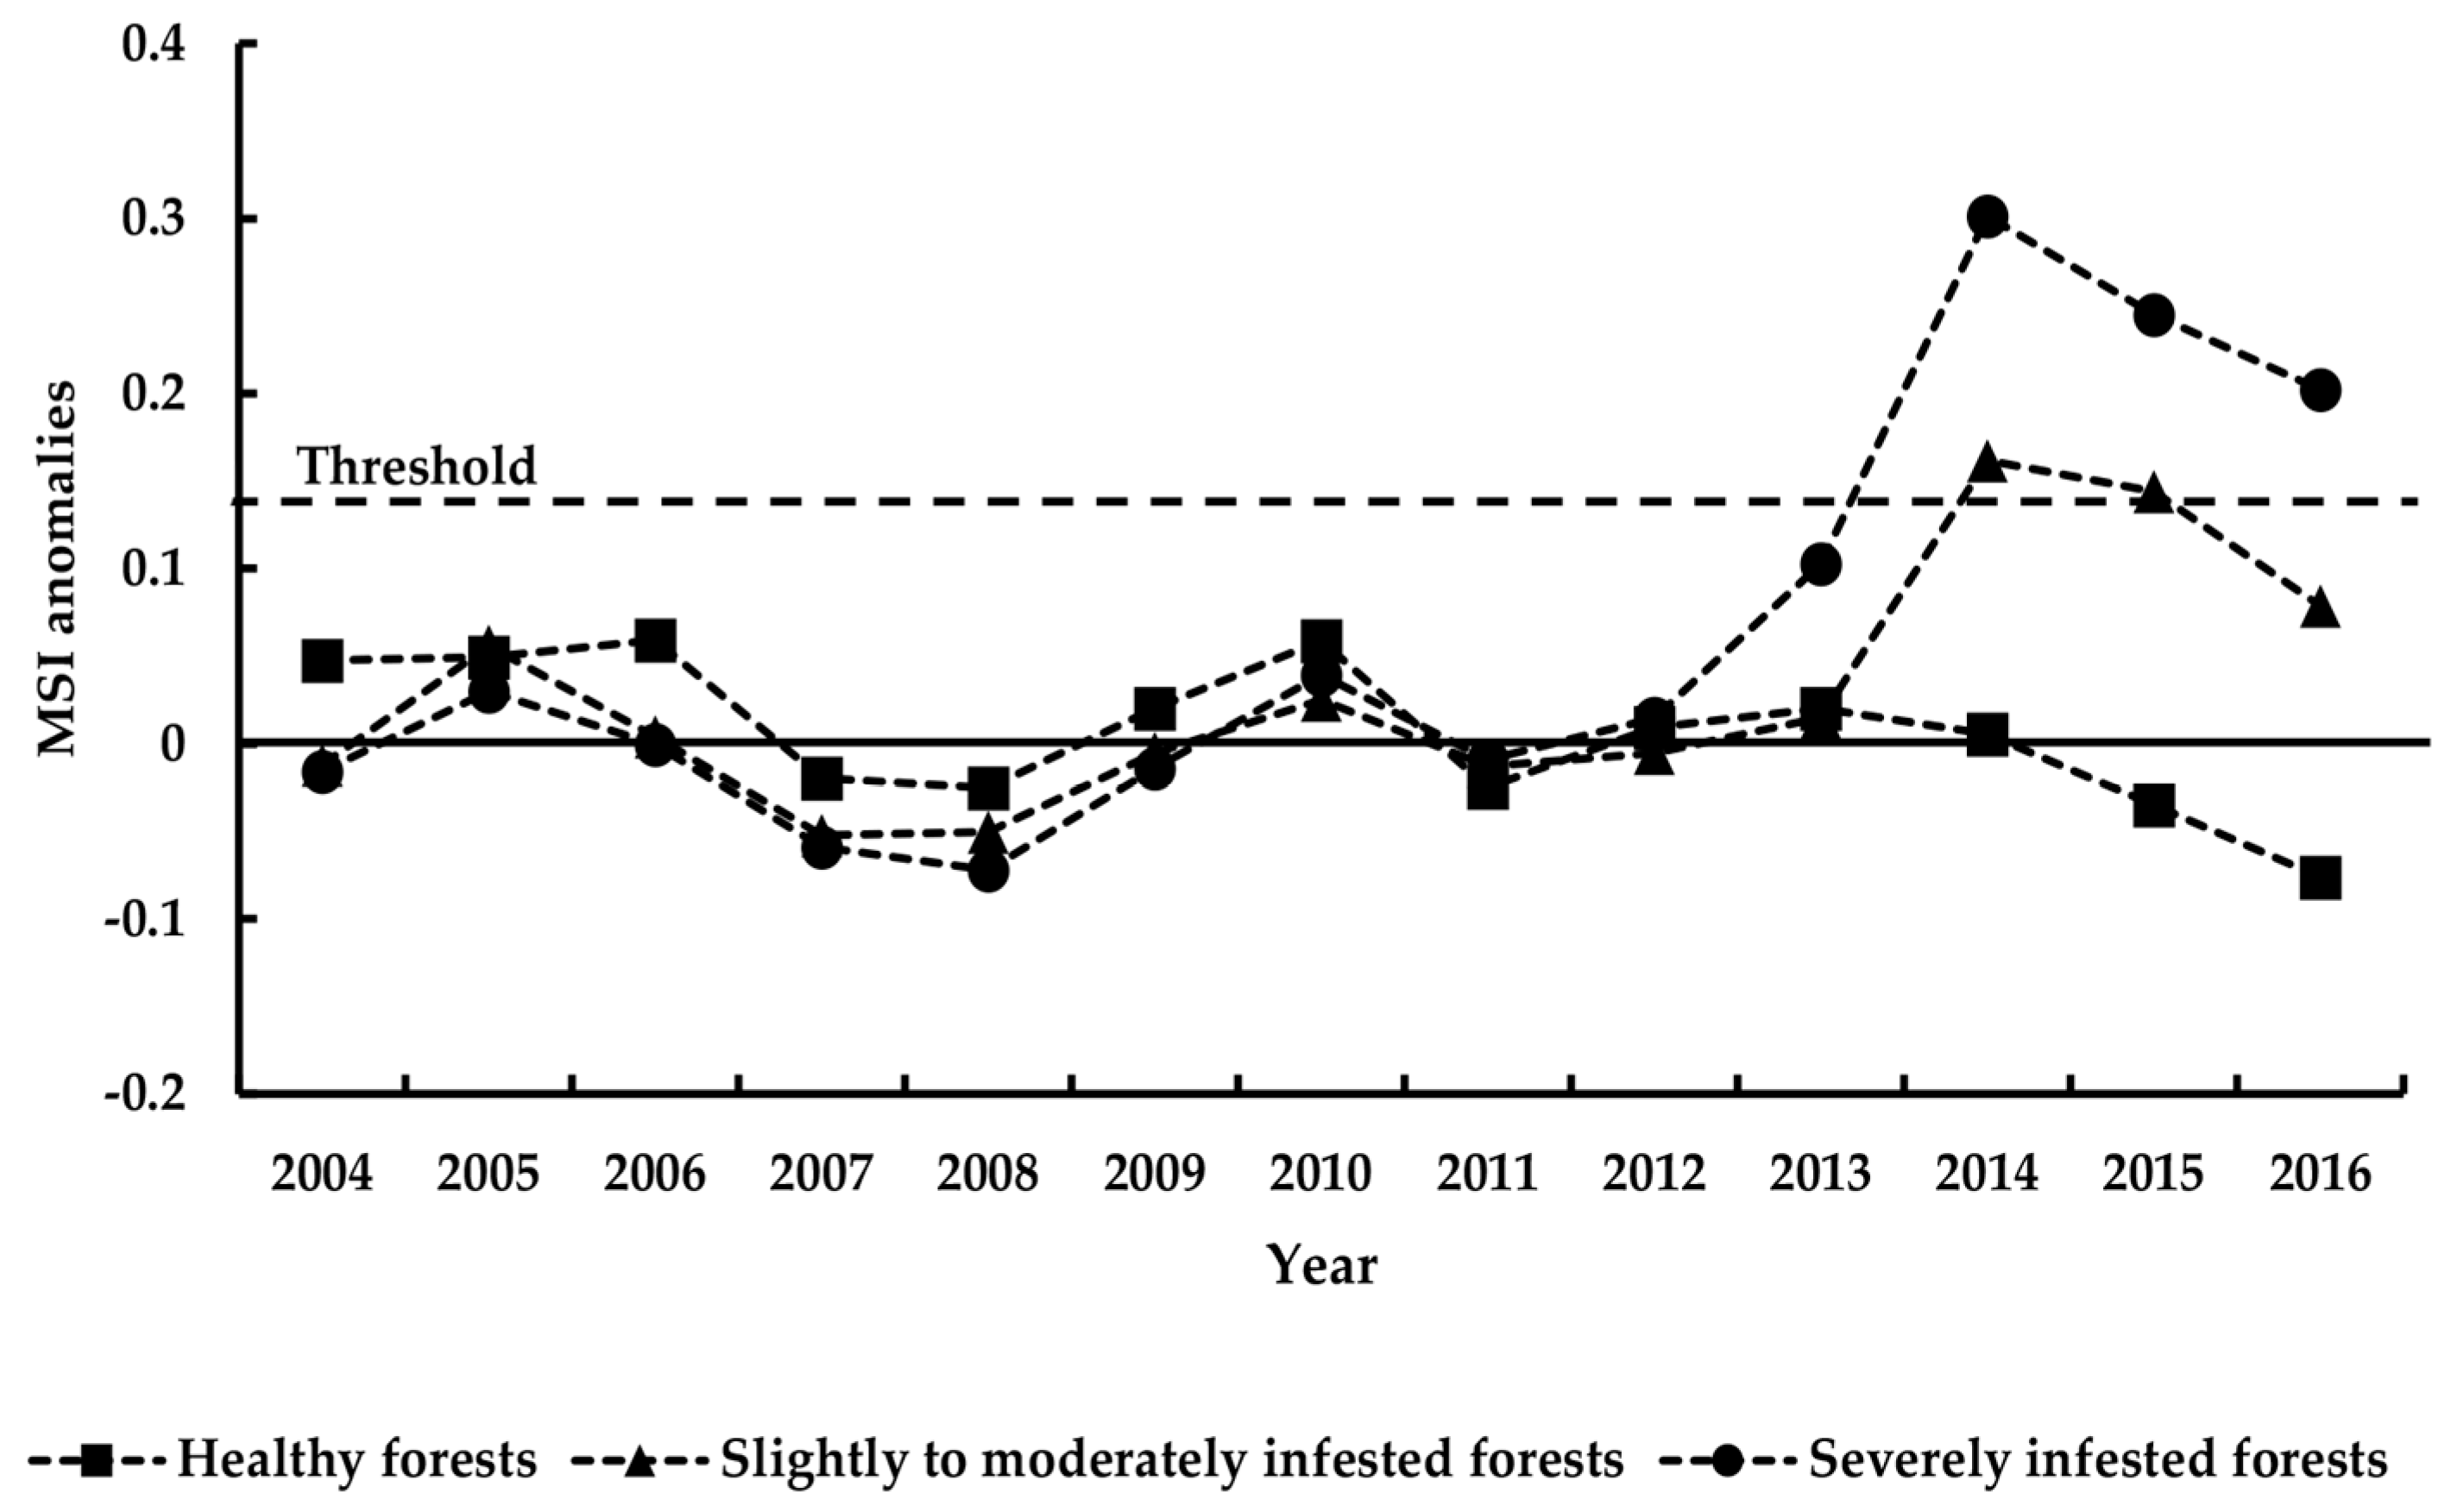
Our study employed a Landsat time series change detection algorithm, which is similar to the one used by Meddens et al. [45]. A temporal anomaly is a straightforward anomaly approach to reflect the difference of a spectral index value between a given time and the multi-temporal, undisturbed mean. If a bias threshold is defined away from the temporal undisturbed mean, temporal anomalies of the spectral indices (RGI, NDVI, NDMI, and MSI) can be detected in any given year if the bias is greater than the threshold value. Figure 2 shows the example of using MSI time series data to detect the anomaly years, where the temporal undisturbed mean is near 0 and the threshold line is around 0.13. If the MSI of one year is greater than 0.13, this year is highly likely to be an anomalous year.
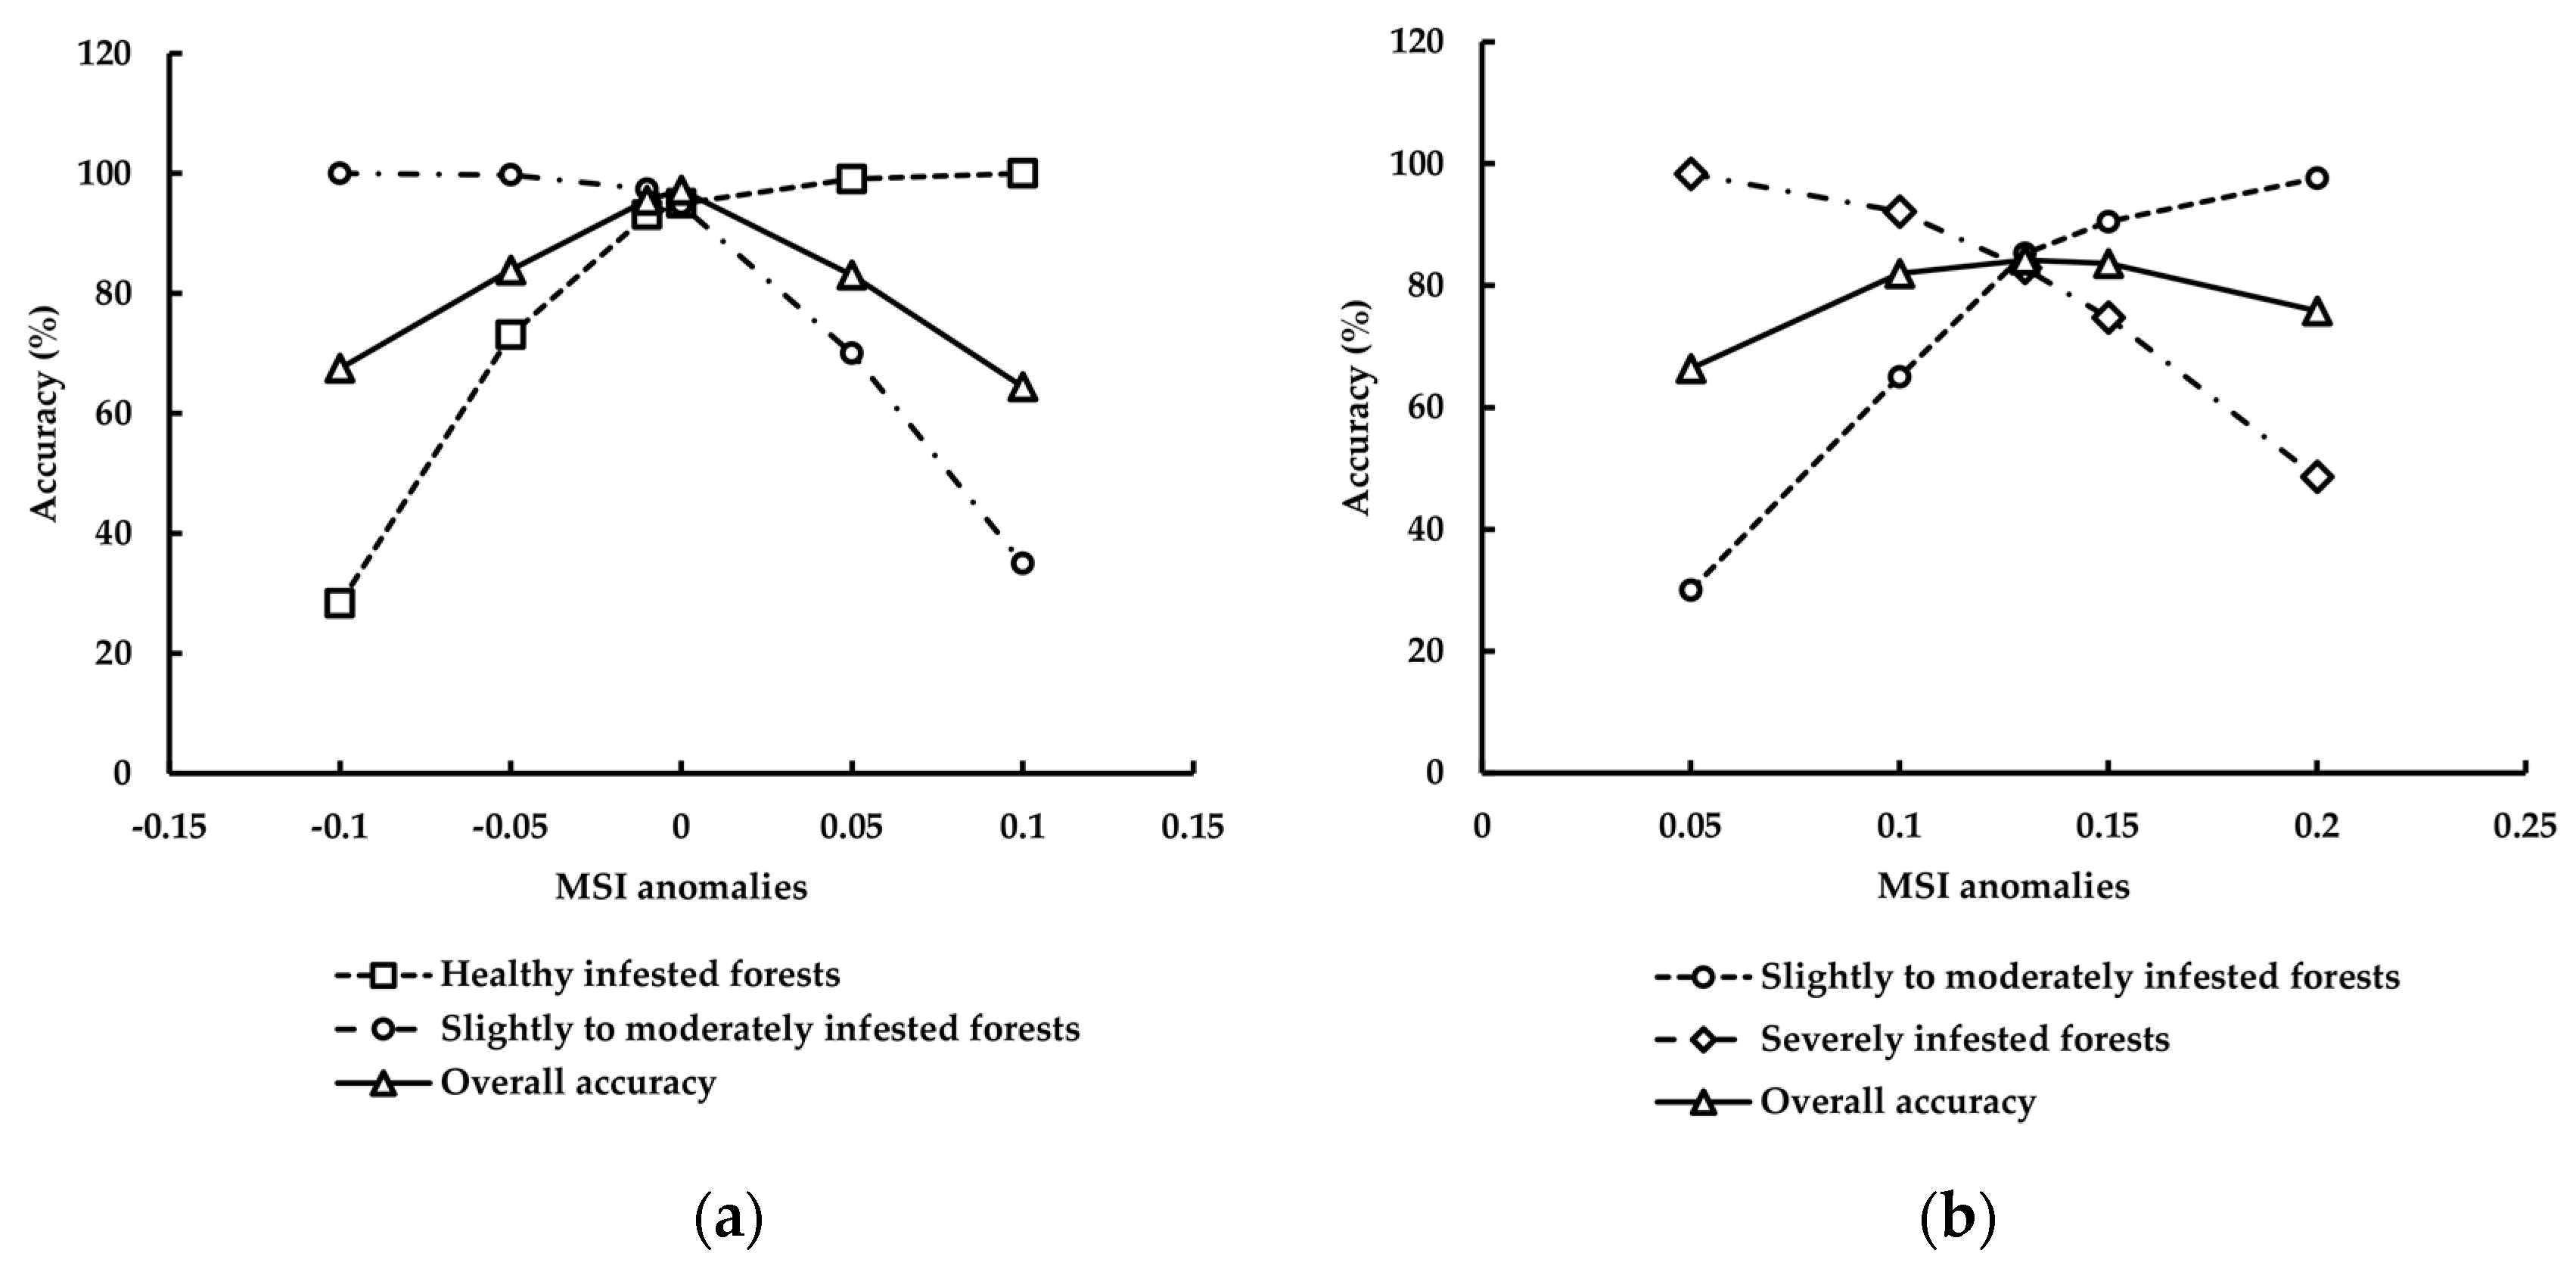
In this study, we randomly selected 70% of the pixels from the healthy forest, slightly to moderately infested forest, and severely infested forest (n = 420 per class) to use as training data to determine the optimal threshold values when the maximum overall classification accuracy has been reached (Figure 3). For example, in Figure 3b, overall accuracy decreased when the value was above or below this threshold. Values above this threshold identified more forests with slight to moderate infestation than forests with severe infestation; in values below this threshold, the opposite was true. The remaining 30% of the pixels were used for validation (n = 180 per class). Using different anomaly threshold values, we generated confusion matrices [54] for each spectral anomaly. For each spectral index anomaly, we identified the highest overall accuracy across this range of thresholds in separating different beetle infestation locations.
2.6. Outbreak Time and Direction Spread Estimation
Except for a general record on whether there are outbreaks of beetles in each year, there are no historical records on the spatial and temporal information of beetle outbreaks. Therefore, we used the classification method and optimal threshold values to classify images from 2004 to 2016 and reconstruct the progression of beetle spread. The outbreak time for each pixel is defined as the year where an abrupt change larger than the threshold value occurred. It should be noted that one pixel may have an outbreak more than once.
By estimating the geometrical centroid of all outbreak pixels, the outbreak source for each year can be identified. The pixels of severely infested forests were screened as the outbreak forests. When all the outbreak source points by year were plotted, the moving or spreading path of shoot beetles could be extracted. Since there was no beetle outbreak before 2010, the outbreak sources from 2011 to 2016 were calculated in ESRI ArcGIS. Otherwise, in order to explore the vector that could explain the spread direction of beetles, we calculated the percentage for wind direction in the study area from 2011 to 2017 [55].
3. Results
3.1. Field Survey
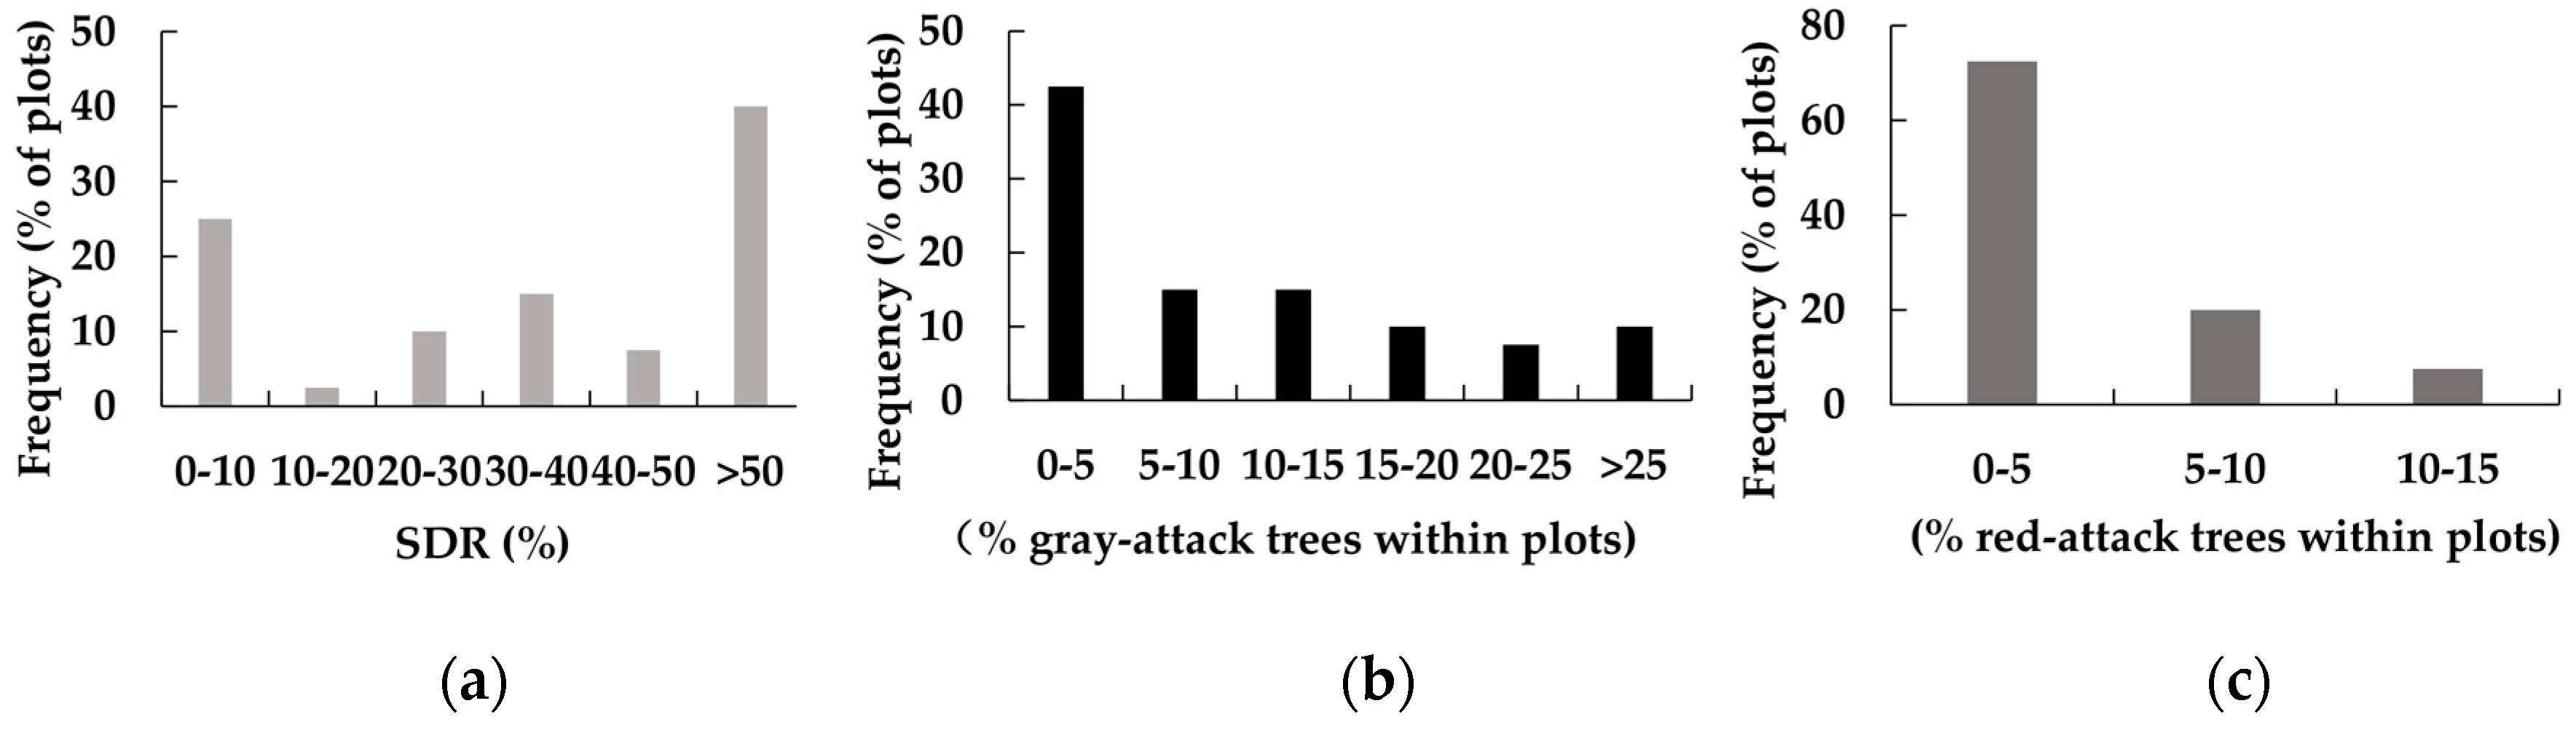
Of our 40 permanent field plots, 10% had a tree mortality (or gray-attack trees) of >25% in the canopy within a pixel, more than 40% had a tree mortality of <5%, and almost 50% had a tree mortality from 5% to 25% (Figure 4b). The frequency of red-attack trees within plots is shown in Figure 4c. Red-attack tree frequencies of 0–5%, 5–10%, and 10–15% account for 72.5%, 20%, and 7.5% of plots, respectively. According to field plots, we found that a tree mortality of >25% and a red-attack tree percentage of >10% did not occupy a large proportion of the plots. The results showed that using percentages of tree mortality and red-attack trees to reflect damage levels was not suitable for Tomicus spp. because it neglects shoot damage. On the other hand, healthy forest (0 ≤ SDR ≤ 10%), slightly to moderately infested forest (10 ≤ SDR ≤ 50%), and severely infested forest (50% < SDR) account for 25%, 35%, and 40% of plots, respectively (Figure 4a). Based on the classification standard (Standard of Forest Pests Occurrence and Disaster LY/T 1681–2006), we found that shoot damage ratios could clearly classify the damage levels in these field plots. The results showed that for Tomicus spp., SDR was better than tree mortality or red-attack trees to reflect the damage degrees of forests.
3.2. Classification of Damage Degree
The spectral anomaly of MSI resulted in the highest classification performance among all the spectral anomalies analyzed (i.e., RGI, NDVI, NDMI, and MSI) (Table 5). The classification accuracy of the MSI threshold value is shown in Figure 3. Using the threshold value of 0 for MSI, we distinguished slightly to moderately infested forests from healthy forests. Using the threshold value of 0.13 for MSI, we distinguished slightly to moderately infested forests from severely infested forests. The overall classification accuracy for the 2016 Landsat classification is 86.38% (Kappa = 0.80) with accuracies across all classes (Table 6). The healthy forest class has the highest classification accuracies (e.g., producer’s accuracy was 96.7%) while the greatest confusion existed between the slightly to moderately infested forest and the severely infested forest. The omission error for the severely infested forest class multi-date classification was 13.3% and the commission error was 17.5%. The omission error for the slightly to moderately infested forest class multi-date classification was 23.9% and the commission error was 18.0%. As a result, the classification using MSI was used in further analyses.
3.3. Outbreak Time and Spread Path Estimation
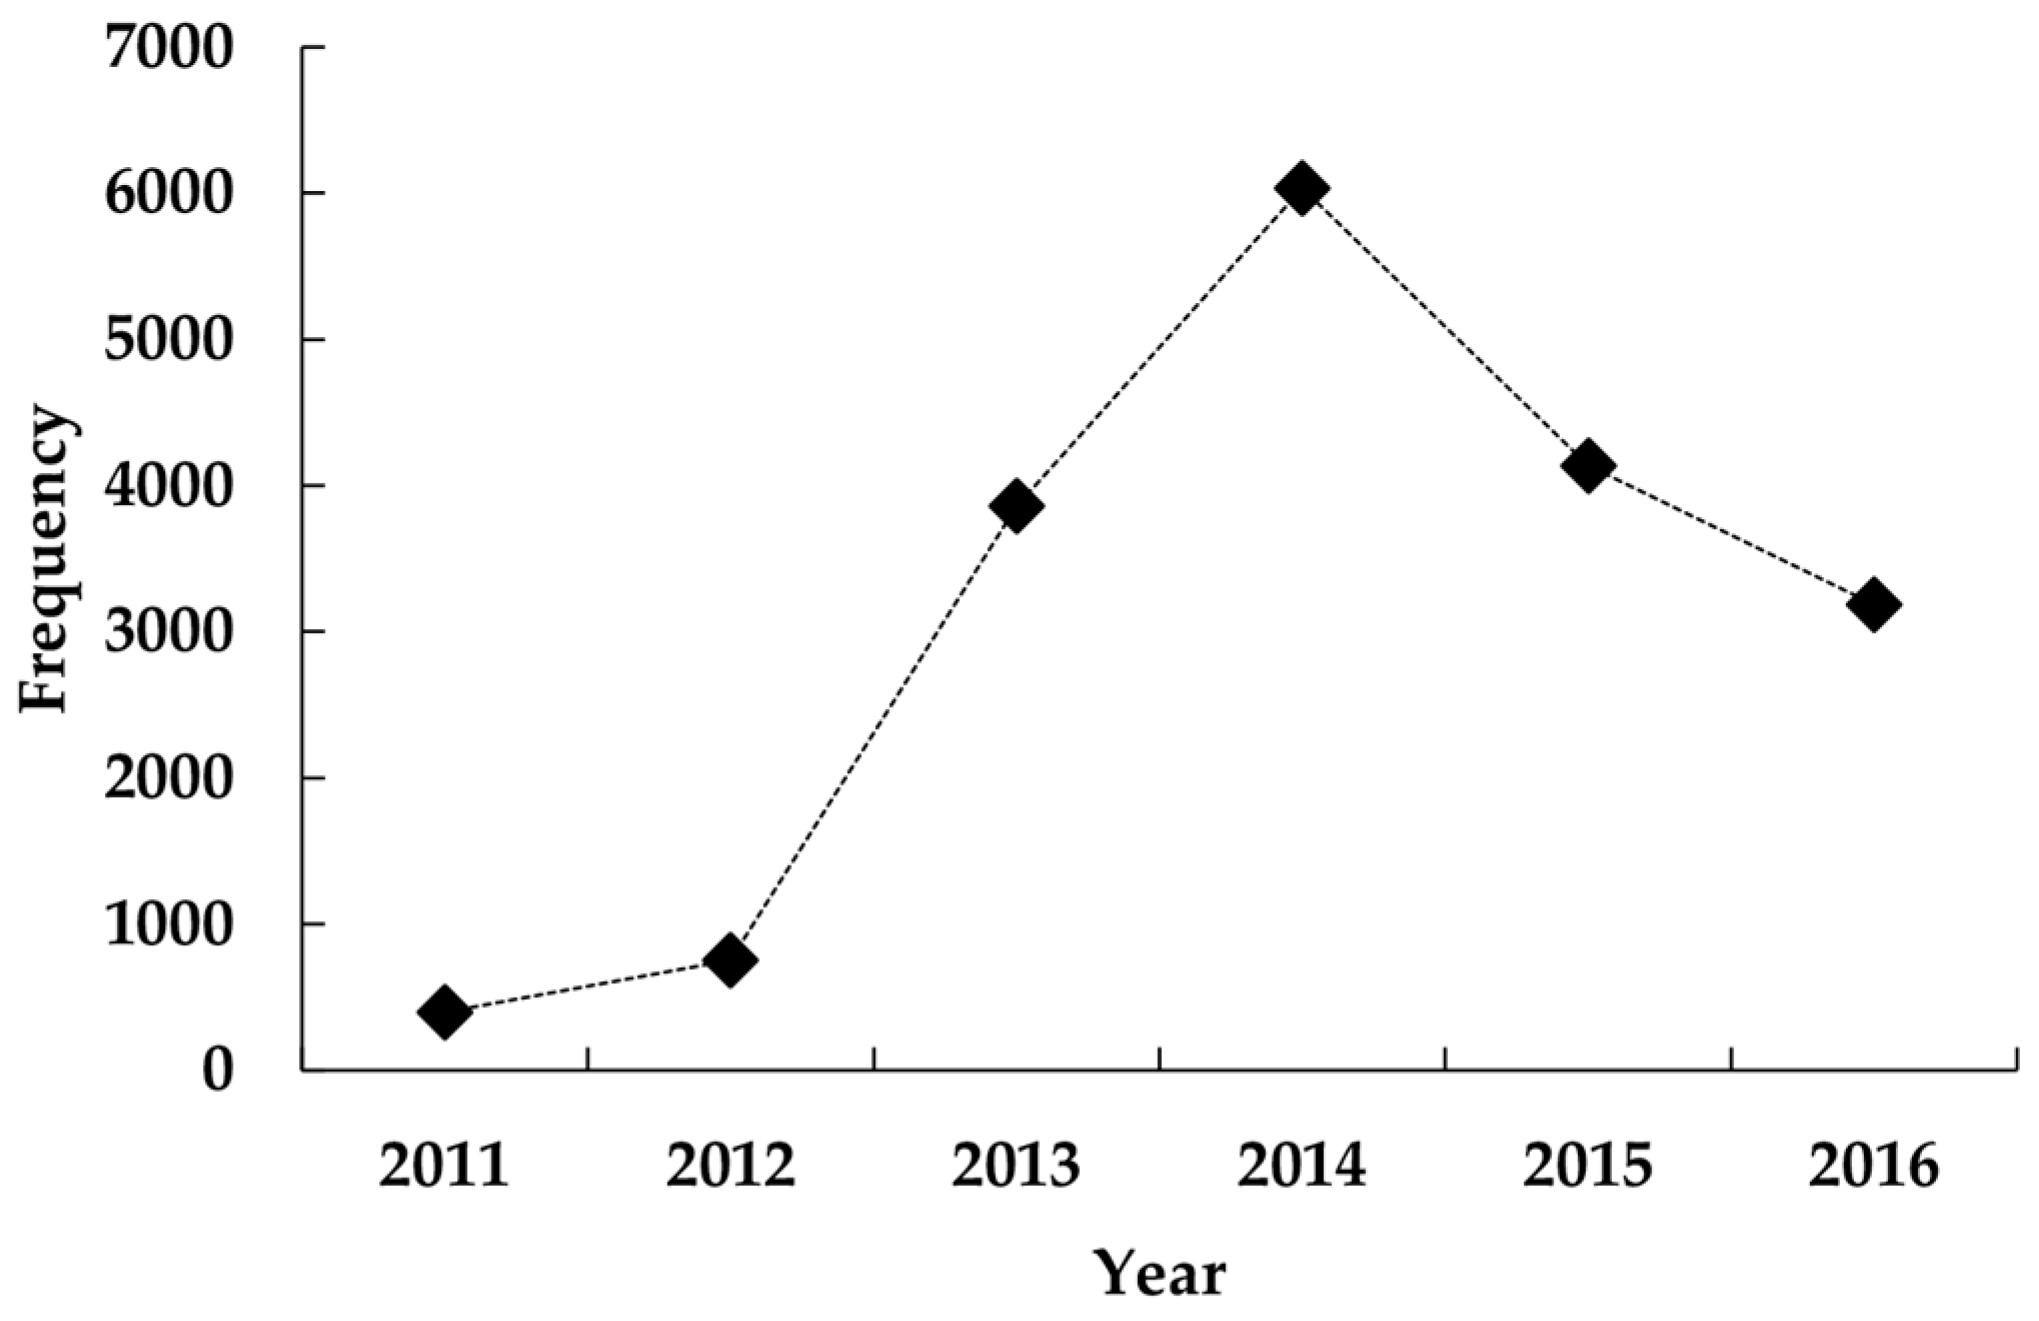
The frequency distribution of severely infested pixels within 30 m resolution of pixels generated from MSI threshold values is shown in Figure 5. The number of severely infested pixels show an abrupt jump from 2012 to 2013, which indicates a beetle outbreak in 2013. Based on the records of the local forestry station, the Yunnan pine suffered from serious shoot beetle damage in 2013. The outbreak area increased and reached its peak in 2014, then subsequently declined.
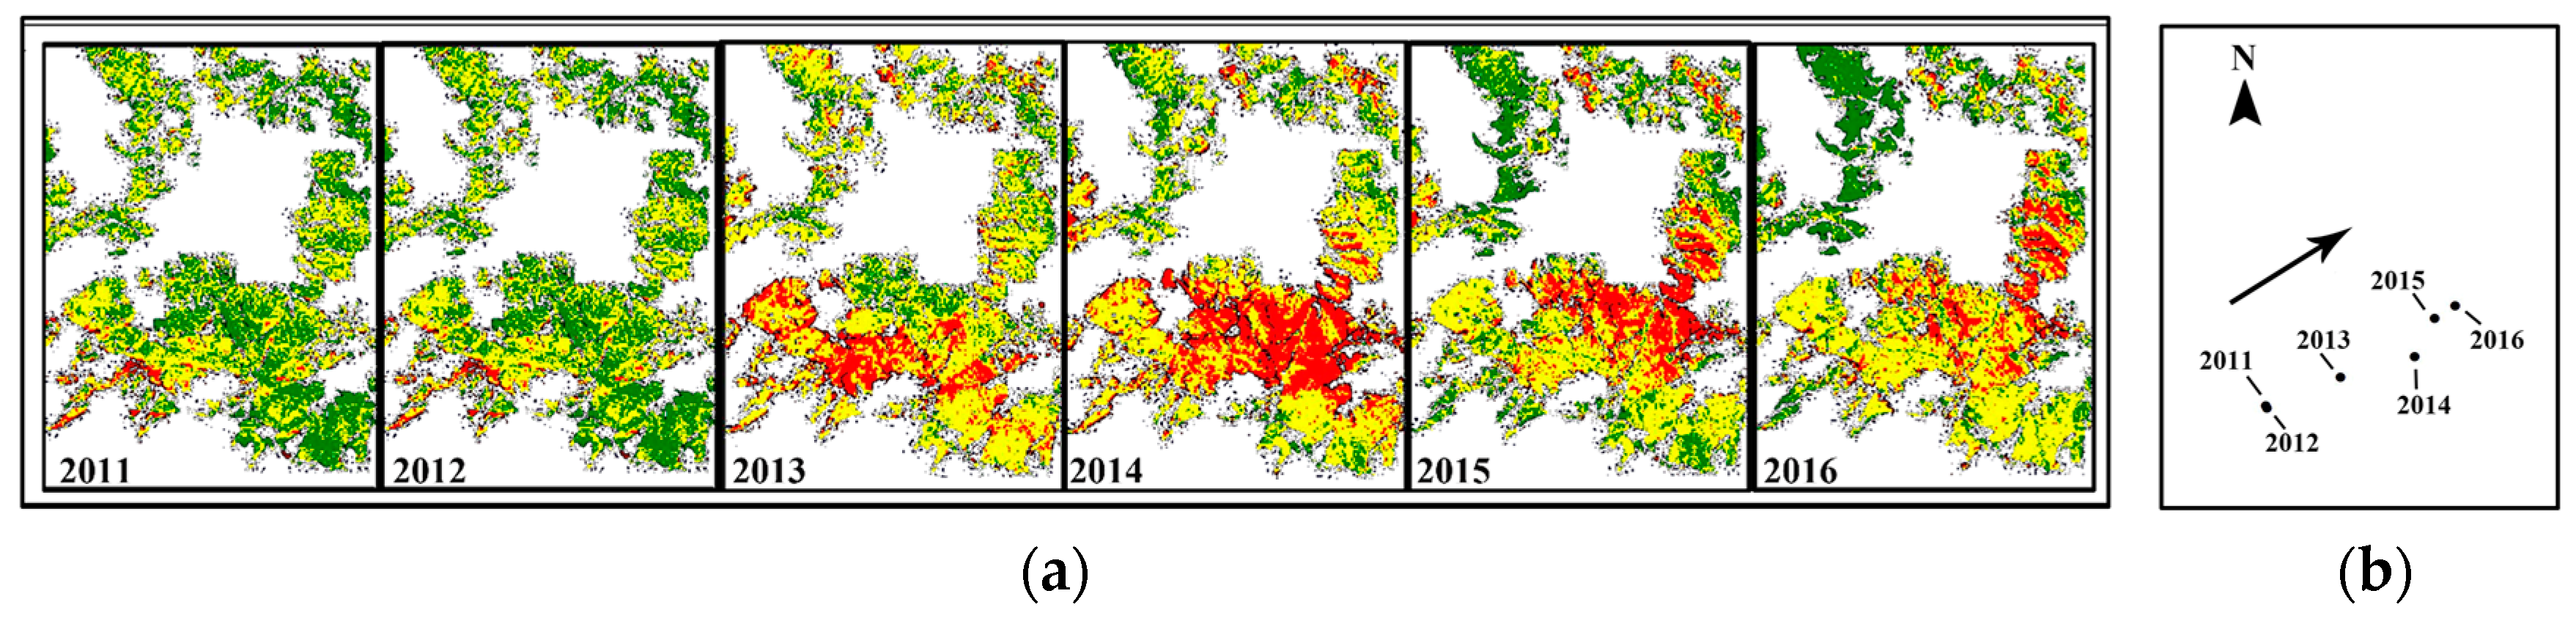
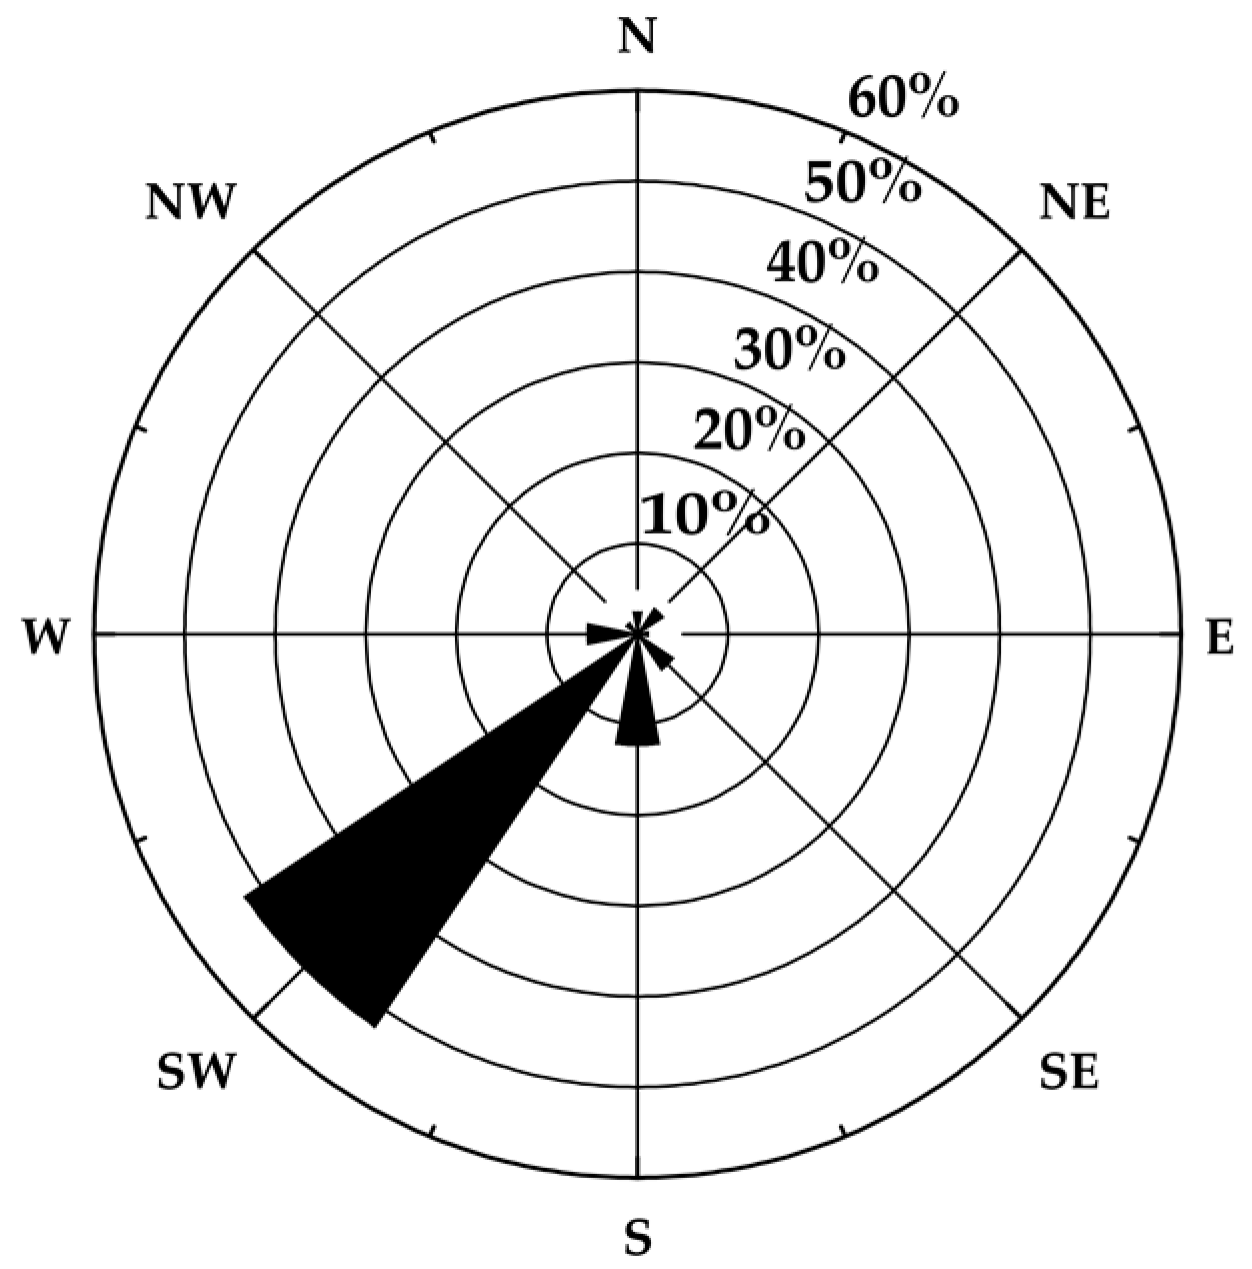
Beetle damage maps based on MSI threshold values from 2011 to 2016 are shown in Figure 6a. The movement of the outbreak center is shown in Figure 6b. We found that from 2011 to 2016, the centers of severely infested forests have a significant trend going from a southwest to northeast direction. Furthermore, the southwest wind direction is the dominant wind direction in Pupeng Town (Figure 7), and it seems that wind direction may affect the moving direction of the beetles.
4. Discussion
Classification using MSI produced the highest accuracy for the multi-date approach. MSI is sensitive to water content and, thus, drought. As such, it is highly related to the weakness or vulnerability of the Yunnan pine. This can explain the good performance of MSI. However, the accuracy varies with SDR. High classification accuracies were obtained for high SDRs within pixels, however, there was low accuracy for lower SDRs. Our findings indicate the usefulness of multi-date Landsat imagery for detecting severe beetle disturbance (i.e., SDR > 50% within a pixel). However, there is still difficulty in accurately differentiating slightly to moderately infested forests (i.e., 10% ≤ SDR ≤ 50% within a pixel).
SDR is a good indicator for detecting forest disturbances caused by the beetles. Meddens et al. [45] found that Landsat is useful for detecting severe tree mortality (i.e., death of more than approximately 25% of trees in the canopy within a pixel) but cannot detect slowly progressing disturbances within a pixel (i.e., as fewer than 25% red trees at any one time) with high accuracy. In our 40 permanent field plots, tree mortality (gray-attack trees) of more than 25% in the canopy within a pixel account for 10% of plots, and red-attack trees of >10% within a pixel also account for less than 10% of plots. Thus, if we use gray-attack or red-attack tree percentages to reflect the damage degrees of forests, the detection accuracies would be low. According to the research of Meddens et al. [45] and the special damage characteristics of the beetles, we chose the SDR to define the damage degrees instead of tree mortality.
Our methods use a time window from November to December to detect beetle disturbance. This is different from previous studies which use the middle of the growing season (July or August) as a time window [45,56,57]. A major reason for this is (1) the two stages of the life cycle for shoot beetles. They attack shoots from May to November, thus, the number of damaged shoots enters a rising trend in this time periods. The amount of shoot damage would reach its maximum peak sometime in November to December. After that, these beetles begin to transfer from the shoot to the trunks of trees. The color of the damage shoots would turn from green to red in November–December. This largely influences spectral reflectance, making it easier for RS to detect. Another major reason is (2) climate. Our study area has a clear dry and wet season. The rainy season is from June to October, which is within the growing season. The significant cloud cover during July and August is not good for optical remote sensing.
Lacking historical monitoring data, it was difficult to study the previous and current state of the forests. In this study, we utilized multi-date Landsat imagery and successfully predicted the outbreak year (i.e., 2013) and reconstructed the locations of severely infested forests from 2011 to 2016. Although we could not truly evaluate the accuracy of beetle-disturbed regions before 2016, our study could detect the beetle disturbance to some degree, especially in severely infested forests. This method will be useful for similar regions without historical records.
Another interesting finding is that shoot beetles moved from the southwest to northeast direction from 2011 to 2016. Based on previous research, MPBs attack surrounding injured or diseased trees stressed by moisture limitation or disturbances during the period in that spot growth or areas within 2 km [58,59,60]. Additionally, MPBs are transported long distances by the wind [61]. Because T. yunnanensis and T. minor transfer between shoots during the shoot-feeding time period, their time exposed to air would be longer than MPBs. Ye et al. [39] found that the spread of T. piniperda was also greatly influenced by the wind. The number of beetles downwind of the bole mass of the attacked tree were greater than that upwind. This shows that wind is a vector for spread. In our study, the movement of the center of the severely infested forests from 2011 to 2016 was more than 2 km. Combining our findings with previous research, we speculate wind to be a vector for long-distance dispersal of Tomicus spp.
The rising and decreasing trends of severely infested forests from 2011 to 2016 appears strange. The major reasons for this include climate and human factors. Since 2009, widespread drought (i.e., the average annual precipitation from 2010 to 2014 was 810 mm) in Yunnan Province weakened trees, making it suitable for beetles to attack trunks. However, the precipitation rose after 2014 (i.e., the average annual precipitation from 2015 to 2016 was 1085 mm), which increased the resistance of Yunnan pine to beetles. This could partially explain the declining trend of pixels of severely infested forest from 2014 to 2016. Harvesting is the main human activity affecting this trend. During the investigation time, we found that villagers harvested infested trees to use as fire-wood, especially the red-attack trees which contain numerous adult beetles. This behavior reduced beetle density and the area of severely infested forests. However, further research needs to determine the other specific drivers of beetle spread besides wind.
5. Conclusions
Multi-data derived from time series data such as Landsat provide rich information for detecting forest disturbances such as T. yunnanensis and T. minor outbreaks in Yunnan Province. From our study, we can conclude two major points:
- (1)
- The SDR was a better measure than tree mortality for monitoring shoot beetle damage.
- (2)
- Reconstructed SDR can be used to predict outbreak time and beetle moving patterns.
These results are important for the forest industry to implement forestry operations that could reduce the economic and ecological impacts of beetle attacks. Therefore, we discussed the relationship between the change trends of the severely infested forests and the precipitation from 2011 to 2016. These suggest that the beetle outbreak may be connected to the drought that occurred in the area during 2009. In future research, we will study the response of the beetle outbreaks to climate change.
Acknowledgments
This study was supported by Special Project for Scientific Research of Forestry Commonweal Industry of National Forestry Bureau (201404401) and Chinese Natural Science Foundation Project (41571332).
Author Contributions
L.Y., S.Z., H.H., and Y.L. conceived and designed the experiments; L.Y., S.Z., and H.H. conducted the field experiments; L.Y., J.H., and H.H. analyzed the data; L.Y., H.H., and Y.L. wrote the paper.
Conflicts of Interest
The authors declare no conflict of interest.
References
- Dai, K.J.; He, F.; Shen, Y.X.; Zhou, W.J.; Li, Y.P.; Tang, L. Advances in the research on Pinus yunnanensis forest. J. Cent. South For. Univ. 2006, 26, 138–142. [Google Scholar] [CrossRef]
- Jin, Z.Z.; Peng, J. Pinus Yunnanensis; Yunnan Science and Technology Publishing Press: Kunming, China, 2004; pp. 5–13. ISBN 7-5416-1956-6. [Google Scholar]
- Luo, F.S.; Wan, G.H.; Pi, W.L. Studies on the geographical provenance of Pinus yunnanensis I. Seeding test. Acta Bot. Yunnanica 1987, 9, 427–435. [Google Scholar]
- Wang, N.; Zhang, G. On the desertification and genesis of karst stone mountain area in east Yunnan. Adv. Earth Sci. 2003, 18, 933–938. [Google Scholar] [CrossRef]
- Liu, F.; Wang, S.J.; Liu, Y.S.; He, T.B.; Luo, H.B.; Long, J. Changes of soil quality in the process of karst rocky desertification and evaluation of impact on ecological environment. Acta Ecol. Sin. 2005, 25, 639–644. [Google Scholar] [CrossRef]
- Si, B.; Yao, X.H.; Ren, H.D.; Li, S.; He, B.H. Species Diversity in the Process of Vegetation Succession in the Karst Area in Eastern Yunnan. J. Southwest Univ. (Nat. Sci. Ed.) 2009, 31, 132–139. [Google Scholar] [CrossRef]
- Guo, H. Research on Forest Ecosystem Horological Process in the Southeast of Yunnan Hu Pen District Hills. Ph.D. Thesis, Yunnan Normal University, Kunming, China, 2016. [Google Scholar]
- Cai, N.H.; Li, G.Q.; Lu, Y.C. Discuss on the approaching nature forestry management of Pinus yunnanensis pure forests. J. Northwest For. Univ. 2006, 21, 85–88. [Google Scholar] [CrossRef]
- Cai, N.H.; Li, G.Q.; Zhu, C.F.; Huang, Y.X.; Li, J.N.; Zhao, W.D. A comparison study on the community structure between artificial and natural forests of Pinus yunnanensis. J. Northwest For. Univ. 2007, 22, 1–4. [Google Scholar] [CrossRef]
- Chen, F.; Wang, J.M.; Sun, B.G.; Chen, X.M.; Yang, Z.X.; Duan, Z.Y. Relationship between geographical distribution of Pinus yunnanensis and climate. For. Res. 2012, 25, 163–168. [Google Scholar] [CrossRef]
- Zhao, L.Z.; Cai, N.H.; Xia, Q.Z.; He, R.X.; Xu, Y.L. Effect of Drought Stress on Seed Germination and Osmotic Regulating Substances of Pinus yunnanensis. J. Northwest For. Univ. 2012, 32, 21–25. [Google Scholar] [CrossRef]
- Zhao, J.X.; Wang, S.J.; Chen, Q.B.; Wang, Y.X.; Shu, J.J. Study on soil respiration under natural and artificial forests of Pinus yunnanensis in middle Yunnan plateau, China. J. Cent. South Univ. For. Technol. 2014, 38, 96–103. [Google Scholar] [CrossRef]
- Lv, J.M.; Ju, J.H.; Ren, J.Z.; Gan, W.W. The influence of the Madden-Julian Oscillation activity anomalies on Yunnan’s extreme drought of 2009–2010. Sci. China Earth Sci. 2012, 55, 98–112. [Google Scholar] [CrossRef]
- Tao, Y.; Zhang, W.C.; Duan, C.C.; Chen, Y.; Ren, J.Z.; Xing, D.; He, Q. Climatic causes of continuous drought over Yunnan Province from 2009 to 2012. J. Yunnan Univ. 2014, 36, 866–874. [Google Scholar] [CrossRef]
- Yan, H.M.; Chen, J.G.; Zheng, J.M.; Zhou, J.Q. The climate cause of heavy drought in Yunnan in autumn 2009. Trans. Atmos. Sci. 2012, 35, 229–239. [Google Scholar] [CrossRef]
- Yang, H.; Song, J.; Yan, H.M.; Li, C.Y. Cause of the severe drought in Yunnan province during winter of 2009 to 2010. Clim. Environ. Res. 2012, 17, 315–326. [Google Scholar] [CrossRef]
- Zhang, H.; Huang, W.; Zheng, J.M. Comparative analysis of the autumn–winter–spring drought in 2009/2010 and other sustained drought in Yunnan province. J. Yunnan Univ. 2011, 33, 172–177. [Google Scholar]
- Guo, W.H.; Shen, Y.X.; Chai, S.Q. Research progress on monitoring and management of Dendrolinus houi Lajonquire in China. For. Pest Dis. 2003, 22, 28–31. [Google Scholar] [CrossRef]
- Hu, G.H.; Lei, W.; Huai, K.Y.; Zhang, J.B.; Chen, H.W.; Zhou, Y. Life history of Retinia cristata in Yunnan Province and its damage on Pinus kesiya var. langbianensis. For. Pest Dis. 2005, 24, 13–15. [Google Scholar] [CrossRef]
- Zhang, J.S.; Yin, A.L.; Xu, G.L.; Yang, C.Z. Research on control indicators of Dendrolinus houi Lajonquire. For. Sci. Technol. 2005, 30, 21–24. [Google Scholar] [CrossRef]
- Wang, L.P.; Tang, C.C.; Su, S.C.; Lian, P.H. Studies on natural population life table of Dendrolimus houi Lajonquiere. J. Fujian For. Sci. Technol. 2007, 34, 36–40. [Google Scholar] [CrossRef]
- Amman, G.D. The Mountain Pine Beetle—Identification, Biology, Causes of Outbreaks, and Entomological Research Needs. In Proceedings of the Joint Canada/USA Workshop on Mountain Pine Beetle Related Problems in Western North America; Shrimpton, D.M., Ed.; Information Report BC-X-230; Environment Canada, Canadian Forestry Service, Pacific Forest Research Centre: Victoria, BC, Canada, 1982; pp. 7–12. [Google Scholar]
- Assal, T.J.; Sibold, J.; Reich, R. Modeling a historical mountain pine beetle outbreak using landsat MSS and multiple lines of evidence. Remote Sens. Environ. 2014, 155, 275–288. [Google Scholar] [CrossRef]
- Walter, J.A.; Platt, R.V. Multi-temporal analysis reveals that predictors of mountain pine beetle infestation change during outbreak cycles. For. Ecol. Manag. 2013, 302, 308–318. [Google Scholar] [CrossRef]
- West, D.R.; Briggs, J.S.; Jacobi, W.R.; Negrón, J.F. Mountain pine beetle-caused mortality over eight years in two pine hosts in mixed-conifer stands of the southern rocky mountains. For. Ecol. Manag. 2014, 334, 321–330. [Google Scholar] [CrossRef]
- Chen, J.M. Combining land surface temperature and shortwave infrared reflectance for early detection of mountain pine beetle infestations in western Canada. J. Appl. Remote Sens. 2011, 5, 1105–1113. [Google Scholar] [CrossRef]
- Duncan, J.P.; Powell, J.A.; Gordillo, L.F.; Eason, J. A model for mountain pine beetle outbreaks in an age-structured forest: Predicting severity and outbreak-recovery cycle period. Bull. Math. Biol. 2015, 77, 1256–1284. [Google Scholar] [CrossRef] [PubMed]
- Gartner, M.H.; Veblen, T.T.; Leyk, S.; Wessman, C.A. Detection of mountain pine beetle-killed ponderosa pine in a heterogeneous landscape using high-resolution aerial imagery. Int. J. Remote Sens. 2015, 36, 5353–5372. [Google Scholar] [CrossRef]
- Niemann, K.O.; Quinn, G.; Stephen, R.; Visintini, F.; Parton, D. Hyperspectral remote sensing of mountain pine beetle with an emphasis on previsual assessment. Can. J. Remote Sens. 2015, 41, 191–202. [Google Scholar] [CrossRef]
- White, J.C.; Wulder, M.A.; Brooks, D.; Reich, R.; Wheate, R.D. Detection of red attack stage mountain pine beetle infestation with high spatial resolution satellite imagery. Remote Sens. Environ. 2005, 96, 340–351. [Google Scholar] [CrossRef]
- White, J.C.; Coops, N.C.; Hilker, T.; Wulder, M.A.; Carroll, A.L. Detecting mountain pine beetle red attack damage with EO-1 hyperion moisture indices. Int. J. Remote Sens. 2007, 28, 2111–2121. [Google Scholar] [CrossRef]
- Wulder, M.A.; White, J.C.; Bentz, B.; Alvarez, M.F.; Coops, N.C. Estimating the probability of mountain pine beetle red-attack damage. Remote Sens. Environ. 2006, 101, 150–166. [Google Scholar] [CrossRef]
- Ye, H. On the bionomy of Tomicus piniperda (L.) (Col., Scolytidae) in the Kunming region of China. J. Appl. Entomol. 1991, 112, 366–369. [Google Scholar] [CrossRef]
- Lieutier, F.; Ye, H.; Yart, A. Shoot damage by Tomicus sp. (Coleoptera: Scolytidae) and effect on Pinus yunnanensis resistance to subsequent reproductive attacks in the stem. Agri. For. Entomol. 2015, 5, 227–233. [Google Scholar] [CrossRef]
- Duan, Y. Genetic Structuration and Host Tree Preference of T. piniperda Populations in Southwestern China, with Comparison to the French Population from Scots Pine. Ph.D. Thesis, University of Orleans, Orleans, France, Yunnan University, Kunming, China, 2003. [Google Scholar]
- Ji, M.; Dong, X.Q.; Liu, H.P.; Li, L.S.; Xu, H.; Yang, X.P.; Li, H.R.; Ze, S.Z. Preliminary study on remote sensing detection of Yunnan pine forest damaged by Tomicus piniperda. J. West China For. Sci. 2007, 36, 87–90. [Google Scholar] [CrossRef]
- Långström, B.; Li, L.S.; Liu, H.P.; Cao, P.; Liu, H.R.; Hellqvist, C.; Lieutier, F. Shoot feeding ecology of Tomicus piniperda, and T. minor, (Col. scolytidae) in Southern China. J. Appl. Entomol. 2002, 126, 333–342. [Google Scholar] [CrossRef]
- Li, L.S.; Wang, H.L.; Chai, X.S.; Wang, Y.X.; Shu, N.B.; Yang, D.S. Study on the biological characteristics of Tomicus piniperda and its damage. Yunnan For. Technol. 1993, 6, 14–20. [Google Scholar] [CrossRef]
- Ye, H.; Li, L.S. The distribution of Tomicus piniperda (L.) population in the crown of Yunnan pine during the shoot feeding period. Acta Entomol. Sin. 1994, 37, 311–316. [Google Scholar] [CrossRef]
- Ye, H. Studies on the biology of Tomicus piniperda (Col., Scolytidae) in the shoot-feeding period. Acta Entomol. Sin. 1996, 39, 58–62. [Google Scholar] [CrossRef]
- Ye, H. Mass attack by Tomicus piniperda L. (Col., Scolytidae) on Pinus yunnanensis tree in the Kunming region, Southwestern China. In Proceedings: Integrating Cultural Tactics into the Management of Bark Beetles and Reforestation Pests; Gregoire, J.C., Liebhold, F.M., Stephen, F.M., Day, K.R., Salom, S.M., Eds.; General Technical Report NE-236; USDA Forest Service: Radnor, PA, USA, 1997; pp. 225–227. [Google Scholar]
- Hui, Y.C.; Lieutier, F. Shoot aggregation by Tomicus piniperda L. (Coleoptera: Scolytidae). Southwestern China. Ann. Sci. For. 1997, 54, 635–641. [Google Scholar] [CrossRef]
- Meigs, G.W.; Kennedy, R.E.; Cohen, W.B. A landsat time series approach to characterize bark beetle and defoliator impacts on tree mortality and surface fuels in conifer forests. Remote Sens. Environ. 2011, 115, 3707–3718. [Google Scholar] [CrossRef]
- Hais, M.; Jonášová, M.; Langhammer, J.; Kučera, T. Comparison of two types of forest disturbance using multitemporal landsat TM/ETM+ imagery and field vegetation data. Remote Sens. Environ. 2009, 113, 835–845. [Google Scholar] [CrossRef]
- Meddens, A.J.H.; Hicke, J.A.; Vierling, L.A.; Hudak, A.T. Evaluating methods to detect bark beetle-caused tree mortality using single-date and multi-date landsat imagery. Remote Sens. Environ. 2013, 132, 49–58. [Google Scholar] [CrossRef]
- China Meteorological Data Service Center. Available online: http://data.cma.cn/ (accessed on 2006).
- USGS Global Visualization Viewer. Available online: http://glovis.usgs.gov (accessed on 2001).
- Cohen, W.B.; Fiorella, M.; Gray, J.; Helmer, E.; Anderson, K. An efficient and accurate method for mapping forest clearcuts in the Pacific Northwest using landsat imagery. Photogram. Eng. Remote Sens. 1998, 64, 293–300. [Google Scholar]
- Coops, N.C.; Johnson, M.; Wulder, M.A.; White, J.C. Assessment of QuickBird high spatial resolution imagery to detect red attack damage due to mountain pine beetle infestation. Remote Sens. Environ. 2006, 103, 67–80. [Google Scholar] [CrossRef]
- Jin, S.; Sader, S.A. Comparison of time series tasseled cap wetness and the normalized difference moisture index in detecting forest disturbances. Remote Sens. Environ. 2005, 94, 364–372. [Google Scholar] [CrossRef]
- Tucker, C.J. Red and photographic infrared linear combinations for monitoring vegetation. Remote Sens. Environ. 1979, 8, 127–150. [Google Scholar] [CrossRef]
- Wilson, E.H.; Sader, S.A. Detection of forest harvest type using multiple dates of landsat TM imagery. Remote Sens. Environ. 2002, 80, 385–396. [Google Scholar] [CrossRef]
- Rock, B.N.; Vogelmann, J.E.; Williams, D.L. Field and airborne spectral characterization of suspected damage in red spruce (Picea rubens) from vermont. In Proceedings of the 11th International Symposium on Machine Processing of Remotely Sensed Data; Purdue University: West Lafayette, IN, USA, 1985; pp. 71–81. [Google Scholar]
- Congalton, R. A review of assessing the accuracy of classifications of remotely sensed data. Remote Sens. Environ. 1991, 37, 35–46. [Google Scholar] [CrossRef]
- The weather network. Available online: http://lishi.tianqi.com/xiangyun/index.html.
- Derose, R.J.; Long, J.N.; Ramsey, R.D. Combining dendrochronological data and the disturbance index to assess engelmann spruce mortality caused by a spruce beetle outbreak in Southern Utah, USA. Remote Sens. Environ. 2011, 115, 2342–2349. [Google Scholar] [CrossRef]
- Kennedy, R.E.; Yang, Z.Q.; Cohen, W.B. Detecting trends in forest disturbance and recovery using yearly landsat time series: 1. Landtrendr—Temporal segmentation algorithms. Remote Sens. Environ. 2010, 114, 2897–2910. [Google Scholar] [CrossRef]
- Robertson, C.; Nelson, T.A.; Jelinski, D.E.; Michael, A.W.; Barry, B. Spatial–temporal analysis of species range expansion: The case of the mountain pine beetle, Dendroctonus ponderosae. J. Biogeogr. 2010, 36, 1446–1458. [Google Scholar] [CrossRef]
- Jackson, P.L.; Straussfogel, D.; Lindgren, B.S.; Mitchell, S.; Murphy, B. Radar observation and aerial capture of mountain pine beetle, Dendroctonus ponderosae Hopk. (Coleoptera: Scolytidae) in flight above the forest canopy. Can. J. For. Res. 2008, 38, 2313–2327. [Google Scholar] [CrossRef]
- Safranyik, L.; Linton, D.; Silversides, R.; McMullen, L. Dispersal of released mountain pine beetles under the canopy of a mature lodgepole pine stand. J. Appl. Entomol. 1992, 113, 441–450. [Google Scholar] [CrossRef]
- Furniss, M.M.; Furniss, R.L. Scolytids (Coleoptera) on snowfields above timberline in Oregon and Washington. Can. Entomol. 1972, 104, 1471–1478. [Google Scholar] [CrossRef]
Figure 1.
(a) Yunnan Province in China; (b) The 2016 Landsat image with the study area in the right corner of the image; (c) Study area location.
Figure 1.
(a) Yunnan Province in China; (b) The 2016 Landsat image with the study area in the right corner of the image; (c) Study area location.
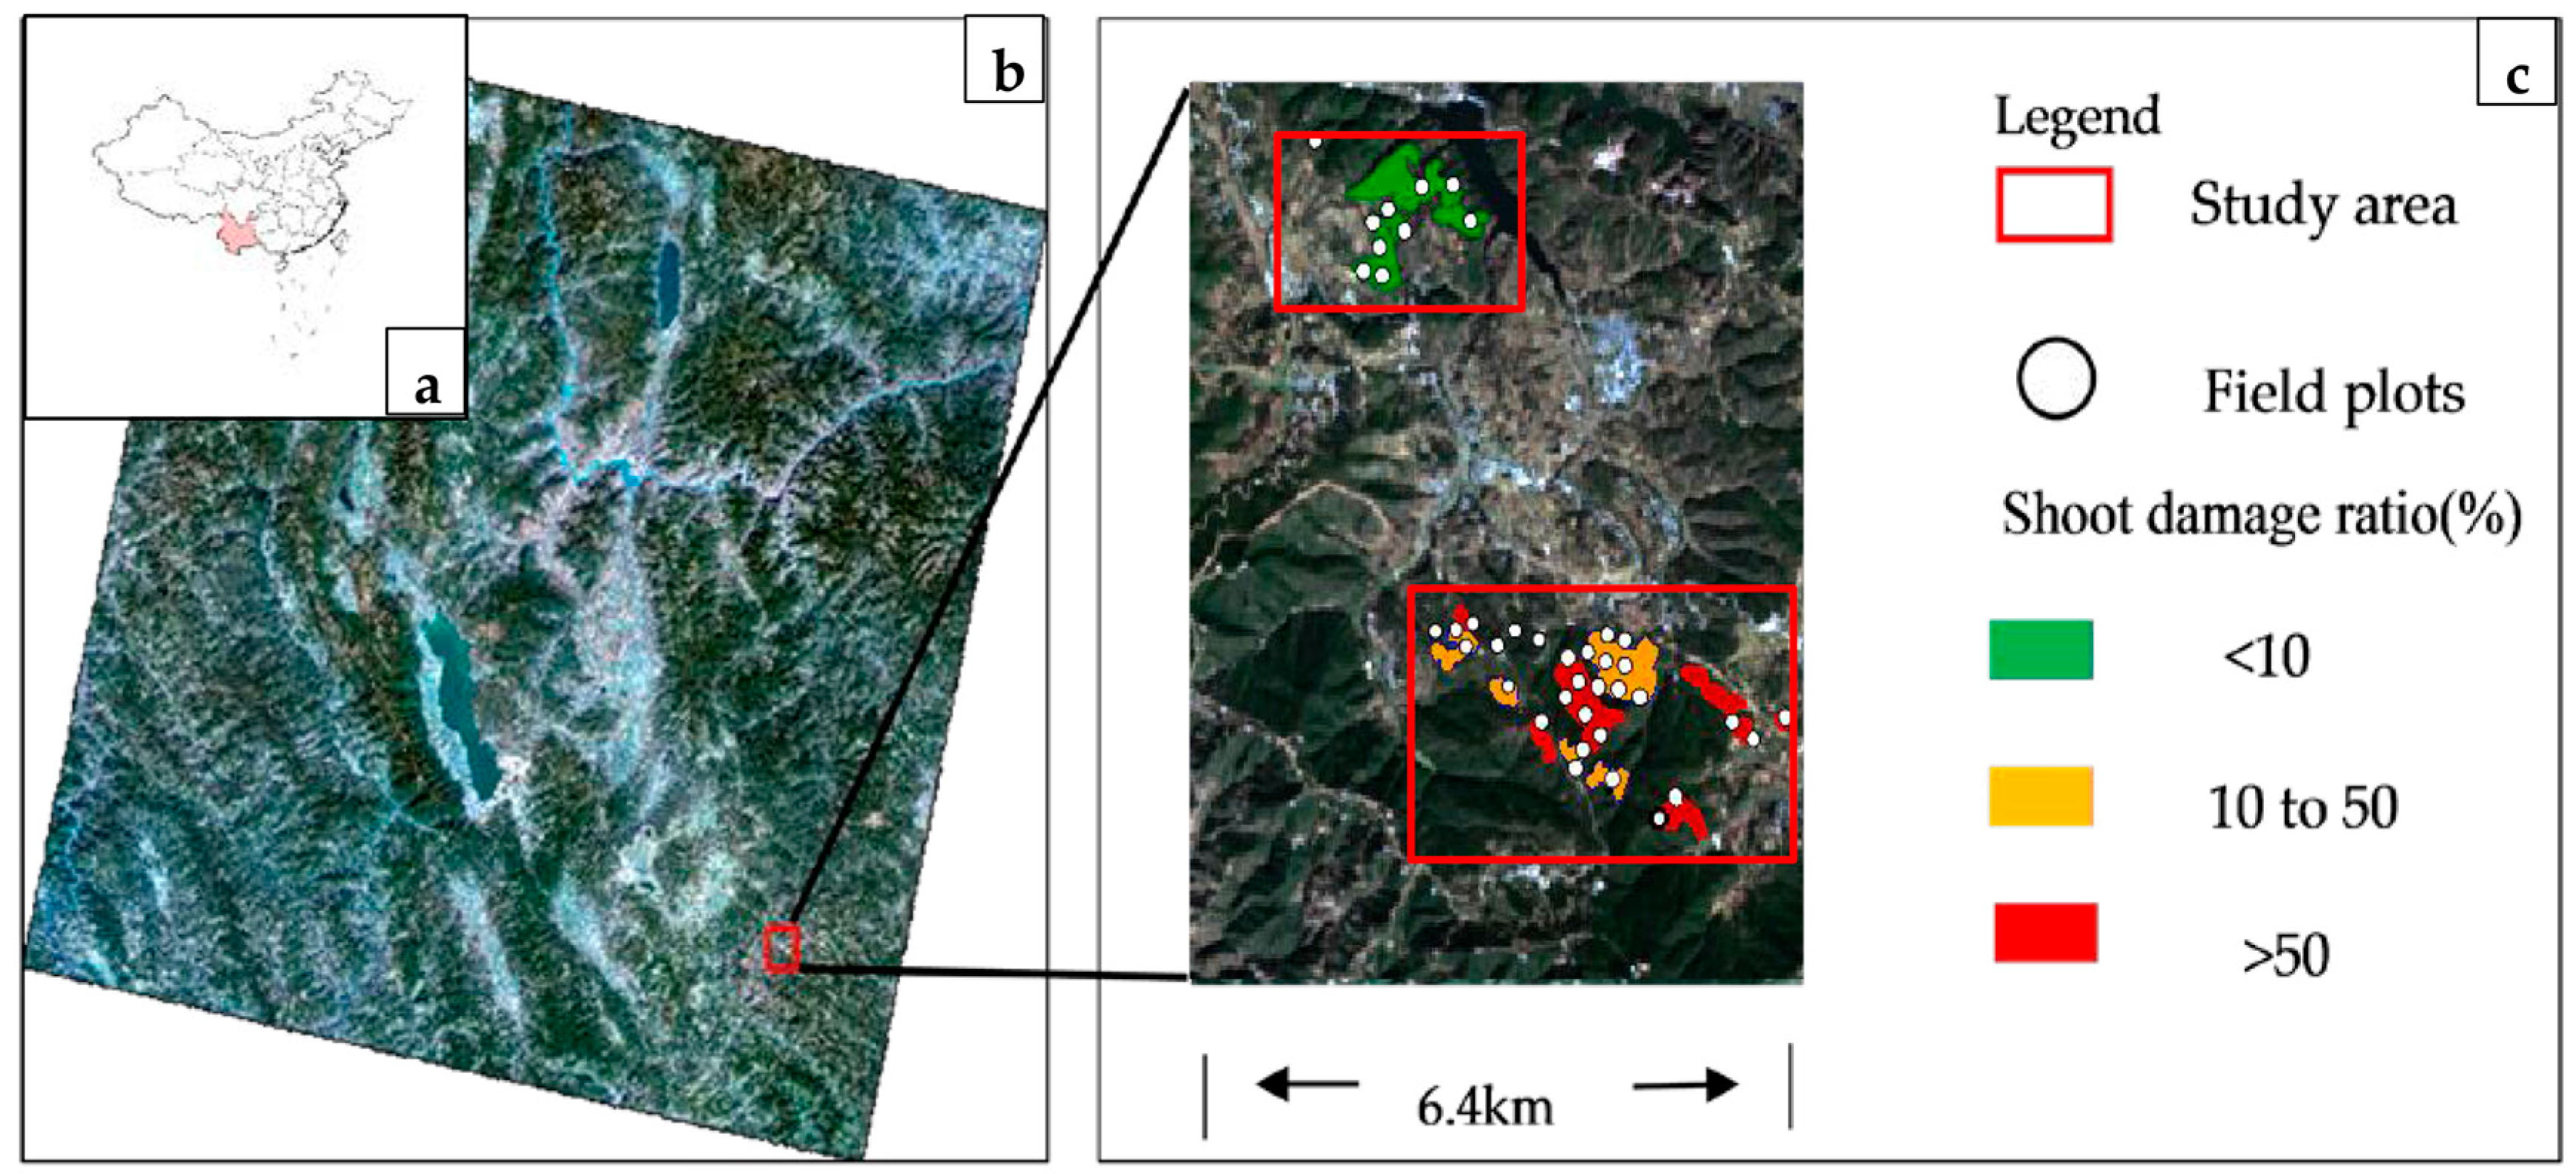
Figure 2.
Examples of temporal pixel trajectories representing MSI anomalies from the healthy forests, slightly to moderately infested forests, and severely infested forests. Dash straight line represents the threshold value (MSI anomalies = 0.13).
Figure 2.
Examples of temporal pixel trajectories representing MSI anomalies from the healthy forests, slightly to moderately infested forests, and severely infested forests. Dash straight line represents the threshold value (MSI anomalies = 0.13).

Figure 3.
Overall accuracy, healthy forest class accuracy, slightly to moderately infested forest class accuracy, and severely infested forest class accuracy from confusion matrices with different MSI threshold values used to (a) separate the healthy class from the slightly to moderately infested class and to (b) separate the slightly to moderately infested forest class from the severely infested class.

Figure 4.
(a) The frequency of shoot damage ratios within plots; (b) The frequency of gray-attack trees within plots; (c) The frequency of red-attack trees within plots.
Figure 4.
(a) The frequency of shoot damage ratios within plots; (b) The frequency of gray-attack trees within plots; (c) The frequency of red-attack trees within plots.

Figure 5.
Frequency distribution of severely infested pixels (30 m resolution) generated from MSI threshold values.
Figure 5.
Frequency distribution of severely infested pixels (30 m resolution) generated from MSI threshold values.

Figure 6.
(a) The damage locations from 2011 to 2016 were speculated using the MSI threshold values (green corresponds to healthy forests, yellow corresponds to slightly to moderately infested forests, and red corresponds to severely infested forests); (b) The median center from 2011 to 2016 was calculated using ARCGIS.

Figure 7.
The percentage of wind directions from 1 January 2011 to 31 May 2017.


Table 1.
Three classes of Tomicus spp. severity using shoot damage ratios.
| Class Number | Class Name | (Shoot Damage Ratios, %) |
|---|---|---|
| 1 | Healthy forests | 0–10 |
| 2 | Slightly to moderately infested forests | 10–50 |
| 3 | Severely infested forests | >50 |
Table 2.
Dates, sensors, and cloud covers of Landsat images from 2004 to 2016 used in this study.
| Year | Month/Day | Day of Year | Sensor | Approximate Cloud Cover | |
|---|---|---|---|---|---|
| 1 | 2004 | December 5 | 340 | TM5 | 0% |
| 2 | 2005 | November 6 | 310 | TM5 | 0% |
| 3 | 2006 | December 11 | 345 | TM5 | 0% |
| 4 | 2007 | November 17 | 317 | ETM+ | 0% |
| 5 | 2007 a | November 20 | 324 | ETM+ | 0% |
| 6 | 2007 | December 6 | 340 | ETM+ | 6% |
| 7 | 2007 | December 15 | 349 | ETM+ | 7% |
| 8 | 2007 | December 22 | 356 | ETM+ | 9% |
| 9 | 2008 | November 23 | 328 | TM5 | 4% |
| 10 | 2009 | December 12 | 346 | TM5 | 0% |
| 11 | 2010 | December 22 | 356 | TM5 | 0% |
| 12 | 2011 | November 15 | 319 | ETM+ | 14% |
| 13 | 2011 a | November 16 | 320 | TM5 | 11% |
| 14 | 2012 | November 1 | 306 | ETM+ | 13% |
| 15 | 2012 | November 10 | 315 | ETM+ | 0% |
| 16 | 2012 | December 19 | 354 | ETM+ | 0% |
| 17 | 2012 a | December 28 | 363 | ETM+ | 0% |
| 18 | 2013 | December 23 | 357 | OLI | 23% |
| 19 | 2014 | November 24 | 328 | OLI | 0% |
| 20 | 2015 | December 13 | 347 | OLI | 1% |
| 21 | 2015 a | December 20 | 354 | OLI | 12% |
| 22 | 2016 | November 20 | 325 | OLI | 0% |
a Priority image for that year. Other images in same year were used to fill cloudy areas and SLC (Scan Lines Corrector)-off areas in the priority image. TM5: The matic Mapper 5; ETM+: Enhanced Thematic Mapper; OLI: Operational Land Imager.
Table 3.
Spectral regions of Landsat TM5, ETM+, and OLI sensors.
| TM5 (Landsat 5) | ETM+ (Landsat 7) | OLI (Landsat 8) | ||
|---|---|---|---|---|
| Spectral Regions (μm) | Spectral Regions (μm) | |||
| Band 1 (Coastal) | 0.43–0.45 | |||
| Band 1 (Blue) | 0.45–0.52 | 0.45–0.515 | Band 2 (Blue) | 0.45–0.51 |
| Band 2 (Green) | 0.52–0.60 | 0.525–0.605 | Band 3 (Green) | 0.53–0.59 |
| Band 3 (Red) | 0.63–0.69 | 0.63–0.69 | Band 4 (Red) | 0.64–0.67 |
| Band 4 (NIR) | 0.76–0.90 | 0.75–0.90 | Band 5 (NIR) | 0.85–0.88 |
| Band 5 (SWIR 1) | 1.55–1.75 | 1.55–1.75 | Band 6 (SWIR 1) | 1.57–1.65 |
| Band 6 (thermal) | 10.40–12.50 | 10.40–12.50 | Band 7 (SWIR 2) | 2.11–2.29 |
| Band 7 (SWIR 2) | 2.08–2.35 | 2.09–2.35 | Band 8 (Pan) | 0.50–1.38 |
| Band 8 (Pan) | 0.52–0.90 | Band 9 (Cirrus) | 1.36–1.39 | |
| Band 10 (TIRS 1) | 10.60–11.19 | |||
| Band 11(TIRS 2) | 11.50–12.51 | |||
NIR: Near Infrared; SWIR: Short Wave Infrared; Pan: Panchromatic; TIRS: Thermal Infrared Sensor.
Table 4.
Landsat-derived spectral indices considered in the classification.
| Index | Abbrev. | Formula | Notes | References |
|---|---|---|---|---|
| Red-green index | RGI | RED/GREEN | Useful for identifying red-stage conifer | Coops et al. [49] |
| Normalized difference vegetation index | NDVI | (NIR − RED)/(NIR + RED) | Sensitive to the differences between live and dead/red-attack vegetation | Tucker [51] |
| Normalized difference moisture index | NDMI | (NIR − MIR)/(NIR + MIR) | Sensitive to leaf water content | Wilson and Sader [52] |
| Moisture Stress Index | MSI | MIR/NIR | Sensitive to relative leaf/canopy water content | Rock et al. [53] |
Table 5.
Overall accuracy for different spectral anomalies used in the 2016 evaluation of Landsat multi-date classifications.
Table 5.
Overall accuracy for different spectral anomalies used in the 2016 evaluation of Landsat multi-date classifications.
| Spectral Anomaly | Reference Data with 70% Class Proportion (%) |
|---|---|
| MSI | 86.38 |
| NDMI | 84.13 |
| RGI | 71.58 |
| NDVI | 78.55 |
Table 6.
Confusion matrix of the 2016 multi-data image classification using MSI indices and pixel locations from aggregated classified aerial imagery with >70% class proportions.
Table 6.
Confusion matrix of the 2016 multi-data image classification using MSI indices and pixel locations from aggregated classified aerial imagery with >70% class proportions.
| Reference Data (>70% Class Proportions) | |||||
|---|---|---|---|---|---|
| Healthy Forest | Slightly to Moderately Infested Forest | Severely Infested Forest | Total | User acc. (%) | |
| Healthy forest | 174 (96.7%) | 10 (5.6%) | 0 (0%) | 182 | 94.6% |
| Slightly to moderately infested forest | 6 (3.3%) | 137 (76.1%) | 24 (13.3%) | 180 | 82.0% |
| Severely infested forest | 0 (0%) | 33 (18.3%) | 156 (86.7%) | 178 | 82.5% |
| Total | 180 | 180 | 180 | 540 | |
| Pro acc. (%) | 96.7% | 76.1% | 86.7% | Overall acc. | 86.38% |
| Kappa | 0.80 | ||||
© 2018 by the authors. Licensee MDPI, Basel, Switzerland. This article is an open access article distributed under the terms and conditions of the Creative Commons Attribution (CC BY) license (http://creativecommons.org/licenses/by/4.0/).
Share and Cite
MDPI and ACS Style
Yu, L.; Huang, J.; Zong, S.; Huang, H.; Luo, Y. Detecting Shoot Beetle Damage on Yunnan Pine Using Landsat Time-Series Data. Forests 2018, 9, 39. https://doi.org/10.3390/f9010039
AMA Style
Yu L, Huang J, Zong S, Huang H, Luo Y. Detecting Shoot Beetle Damage on Yunnan Pine Using Landsat Time-Series Data. Forests. 2018; 9(1):39. https://doi.org/10.3390/f9010039
Chicago/Turabian StyleYu, Linfeng, Jixia Huang, Shixiang Zong, Huaguo Huang, and Youqing Luo. 2018. "Detecting Shoot Beetle Damage on Yunnan Pine Using Landsat Time-Series Data" Forests 9, no. 1: 39. https://doi.org/10.3390/f9010039
Note that from the first issue of 2016, this journal uses article numbers instead of page numbers. See further details here.