Growing Season Stem Water Status Assessment of Qinghai Spruce through the Sap Flow and Stem Radial Variations in the Qilian Mountains of China

Abstract
:1. Introduction
2. Materials and Methods
2.1. Study Area
2.2. Sap Flow Measurements and Related Parameters
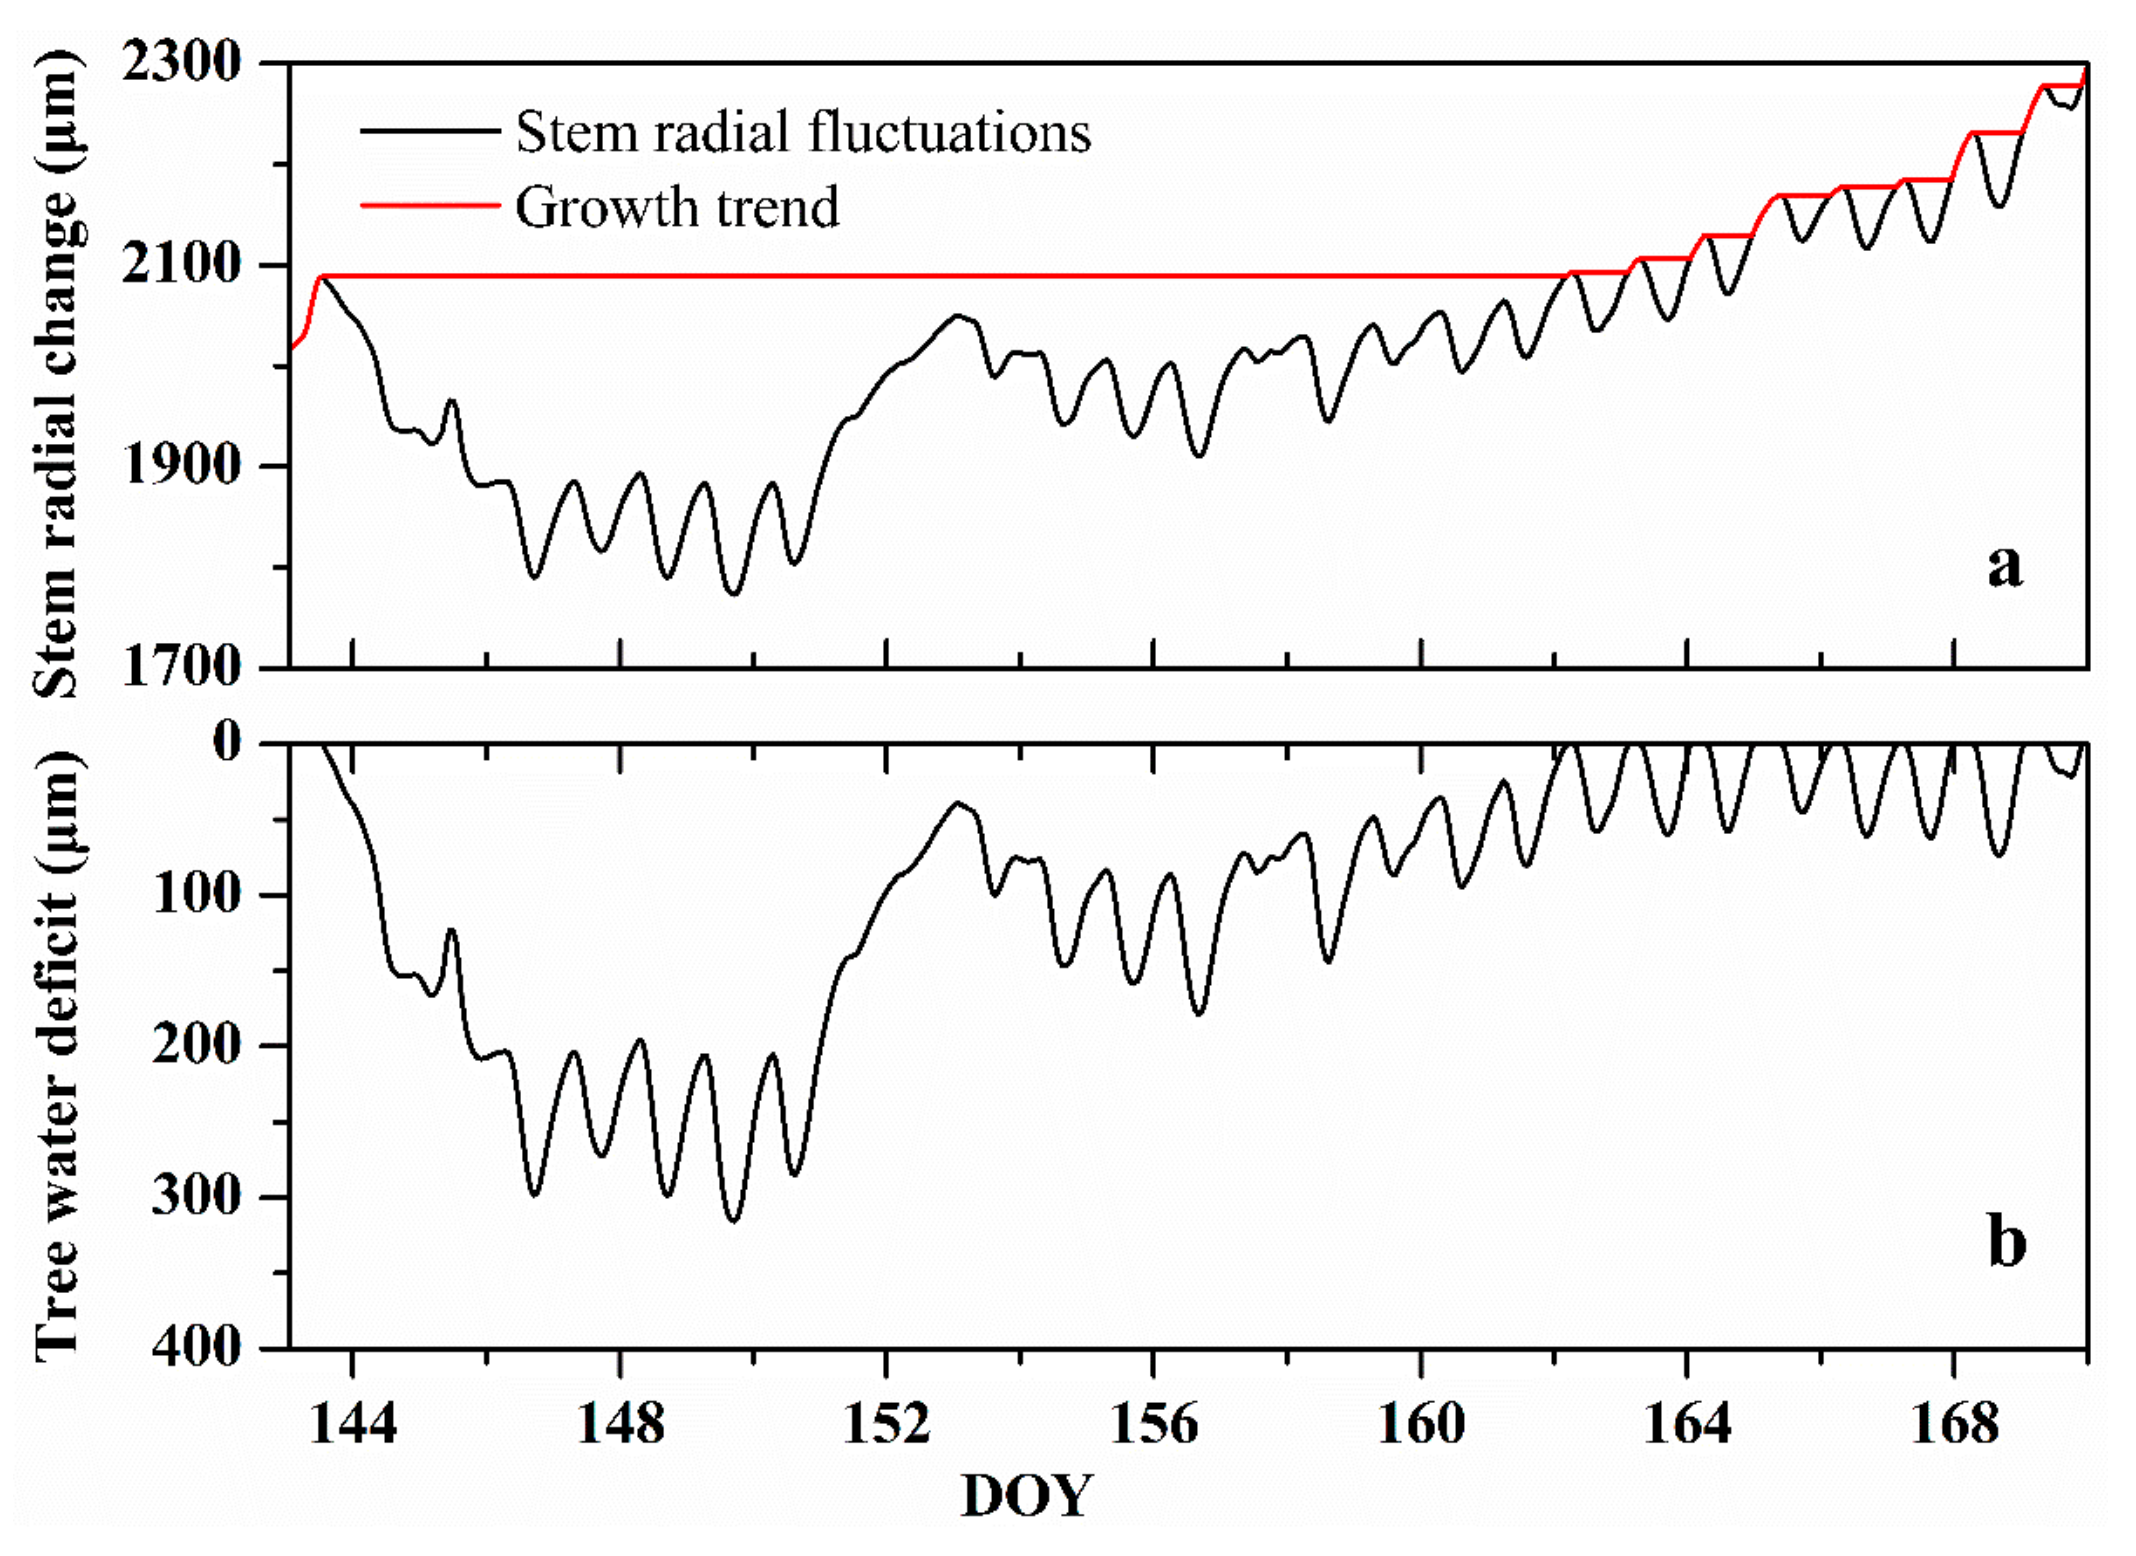
2.3. Stem Radial Change Measurements and Related Parameters
2.4. Environmental Records
2.5. Data Analysis
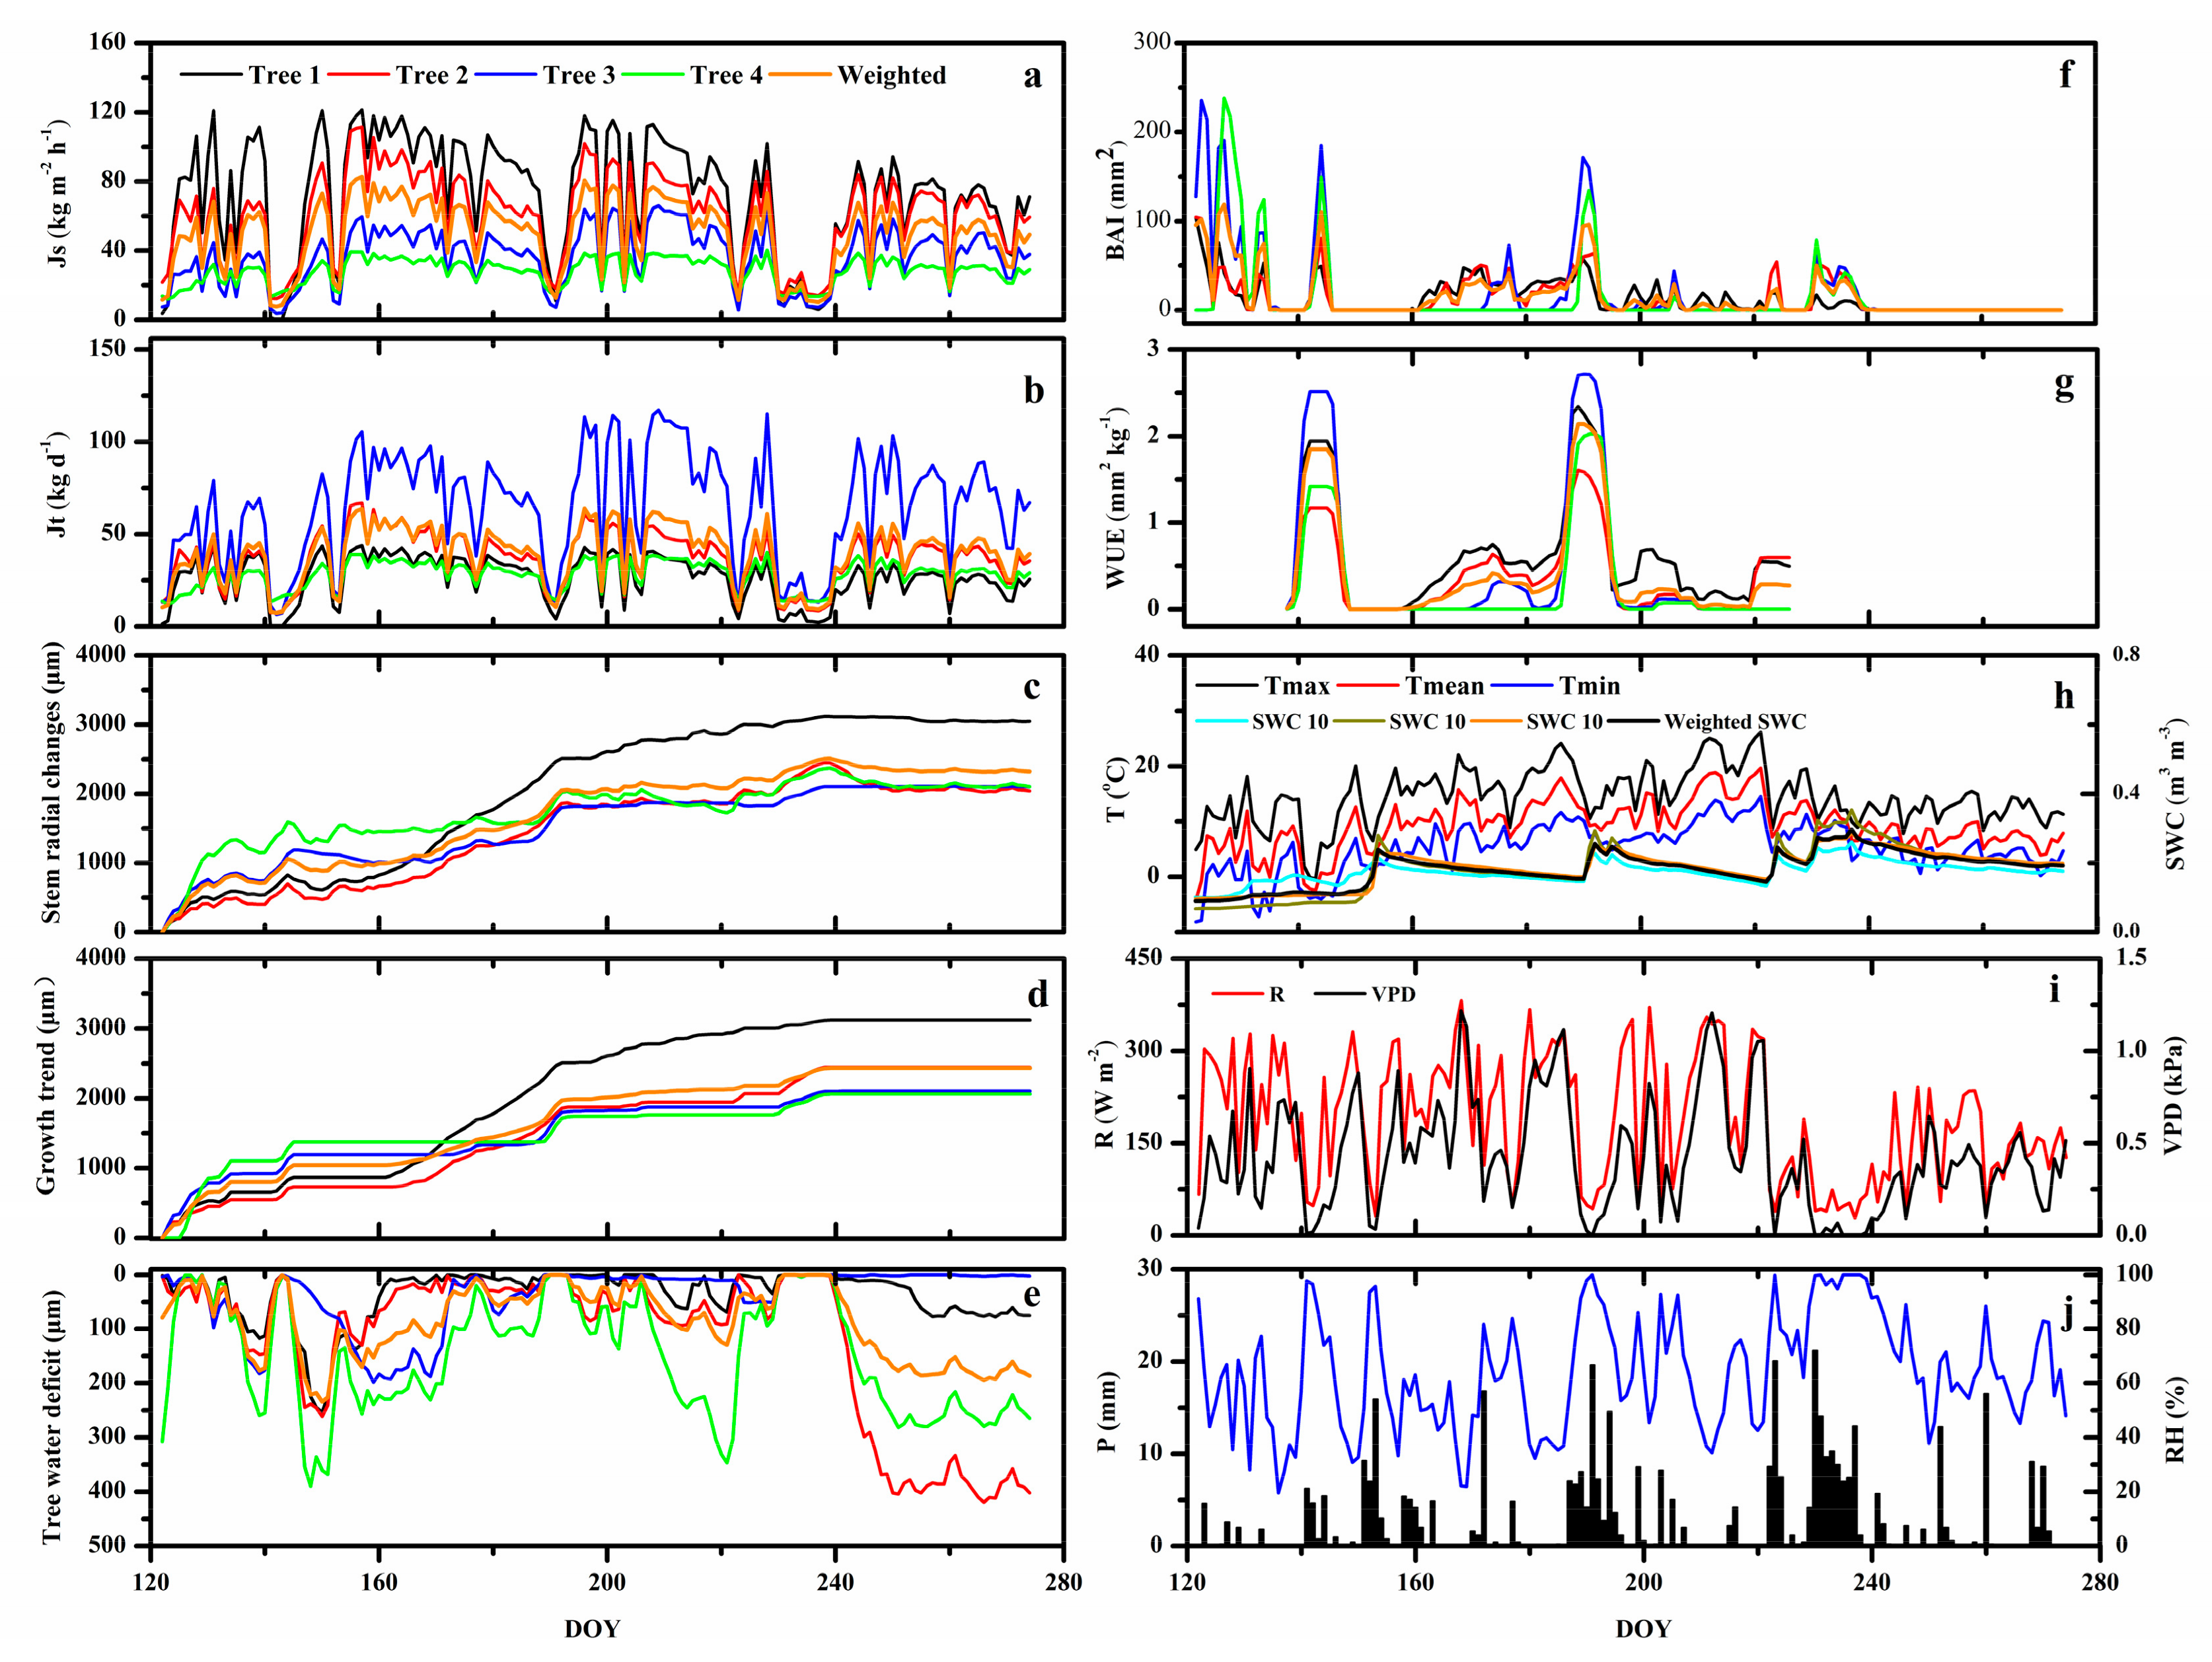
3. Results
3.1. Environmental Variables
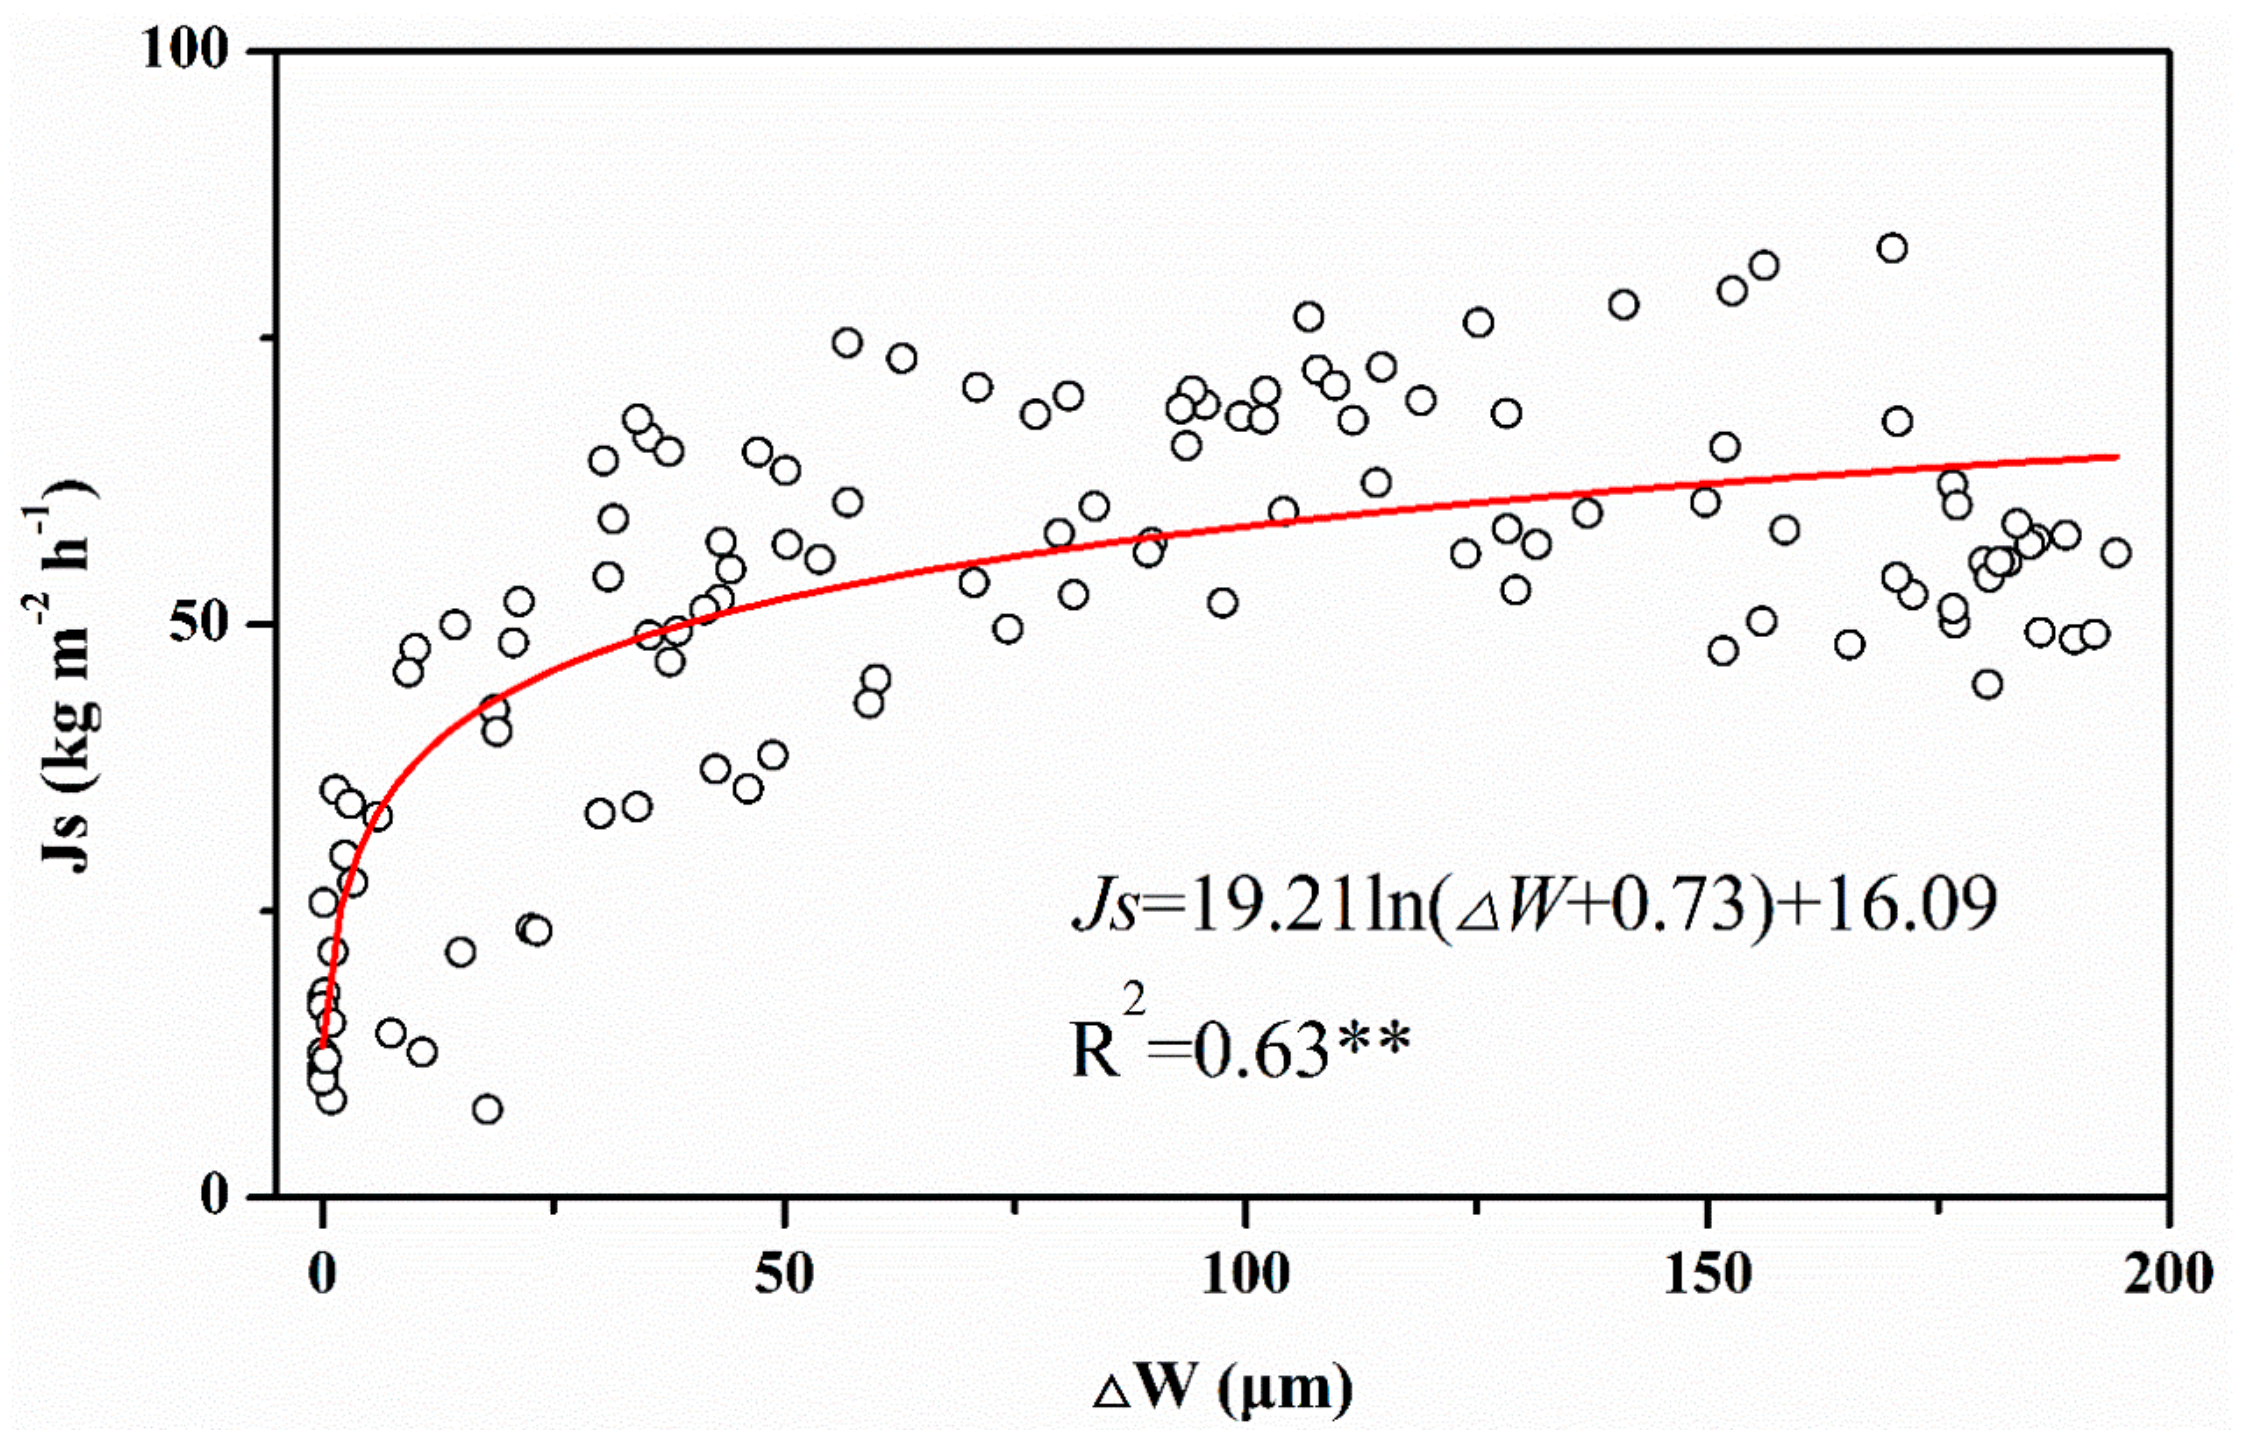
3.2. WUE and the Relationship between Sap Flow Density and Tree Water Deficit
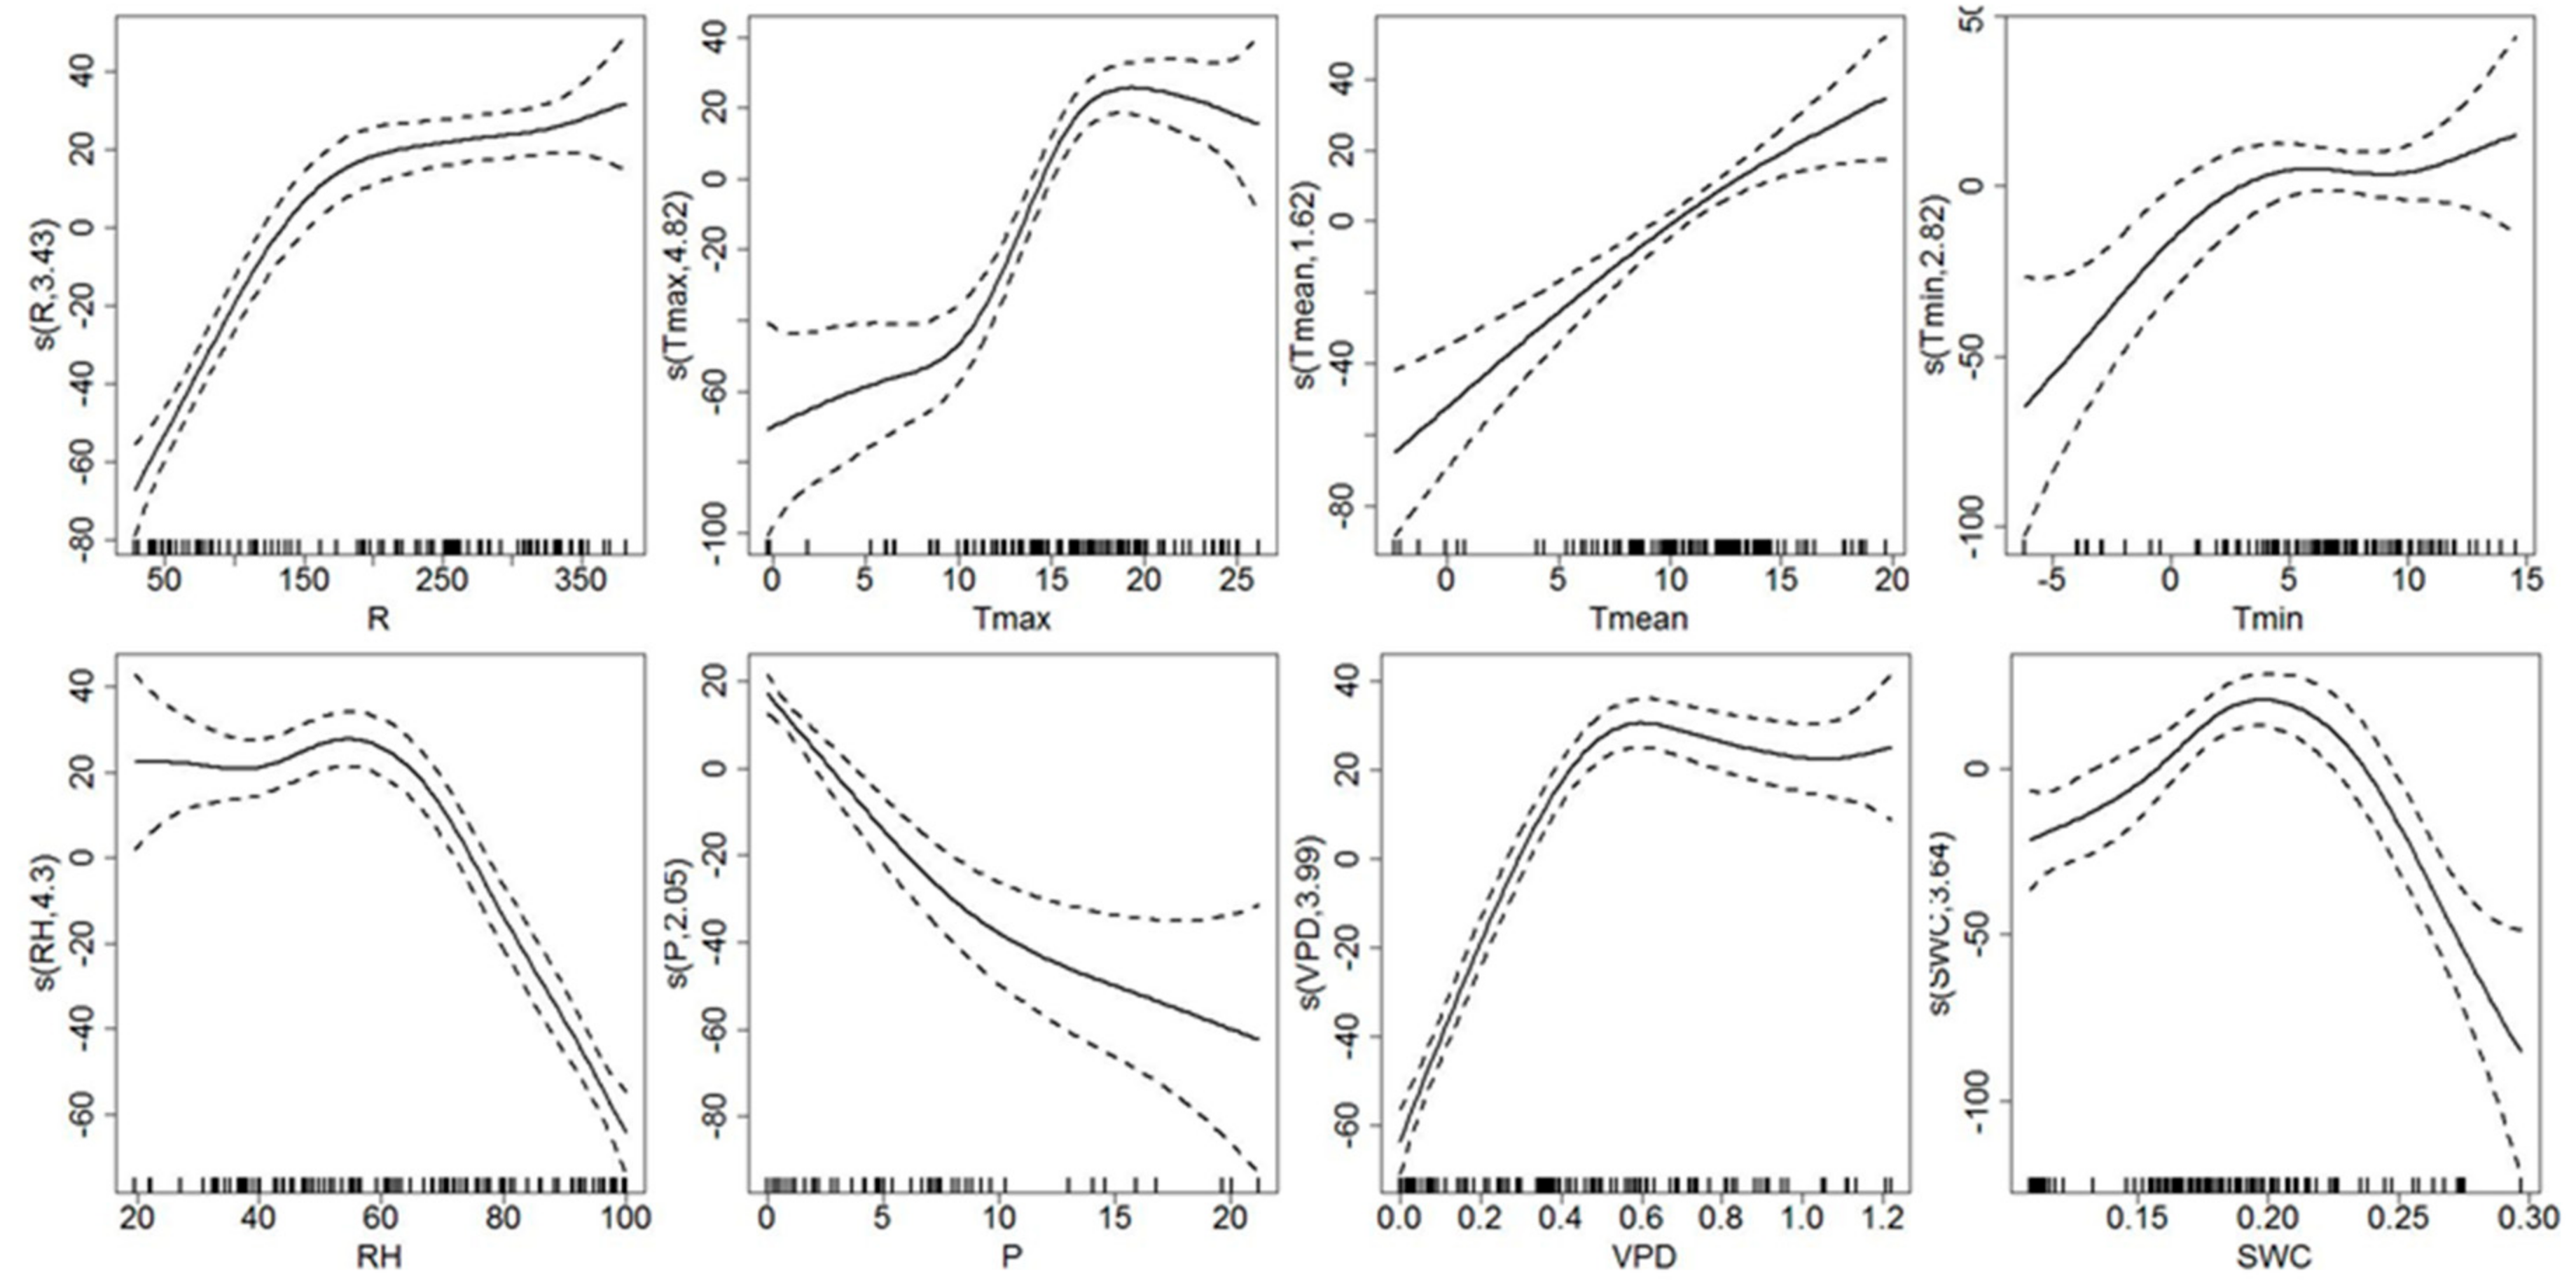
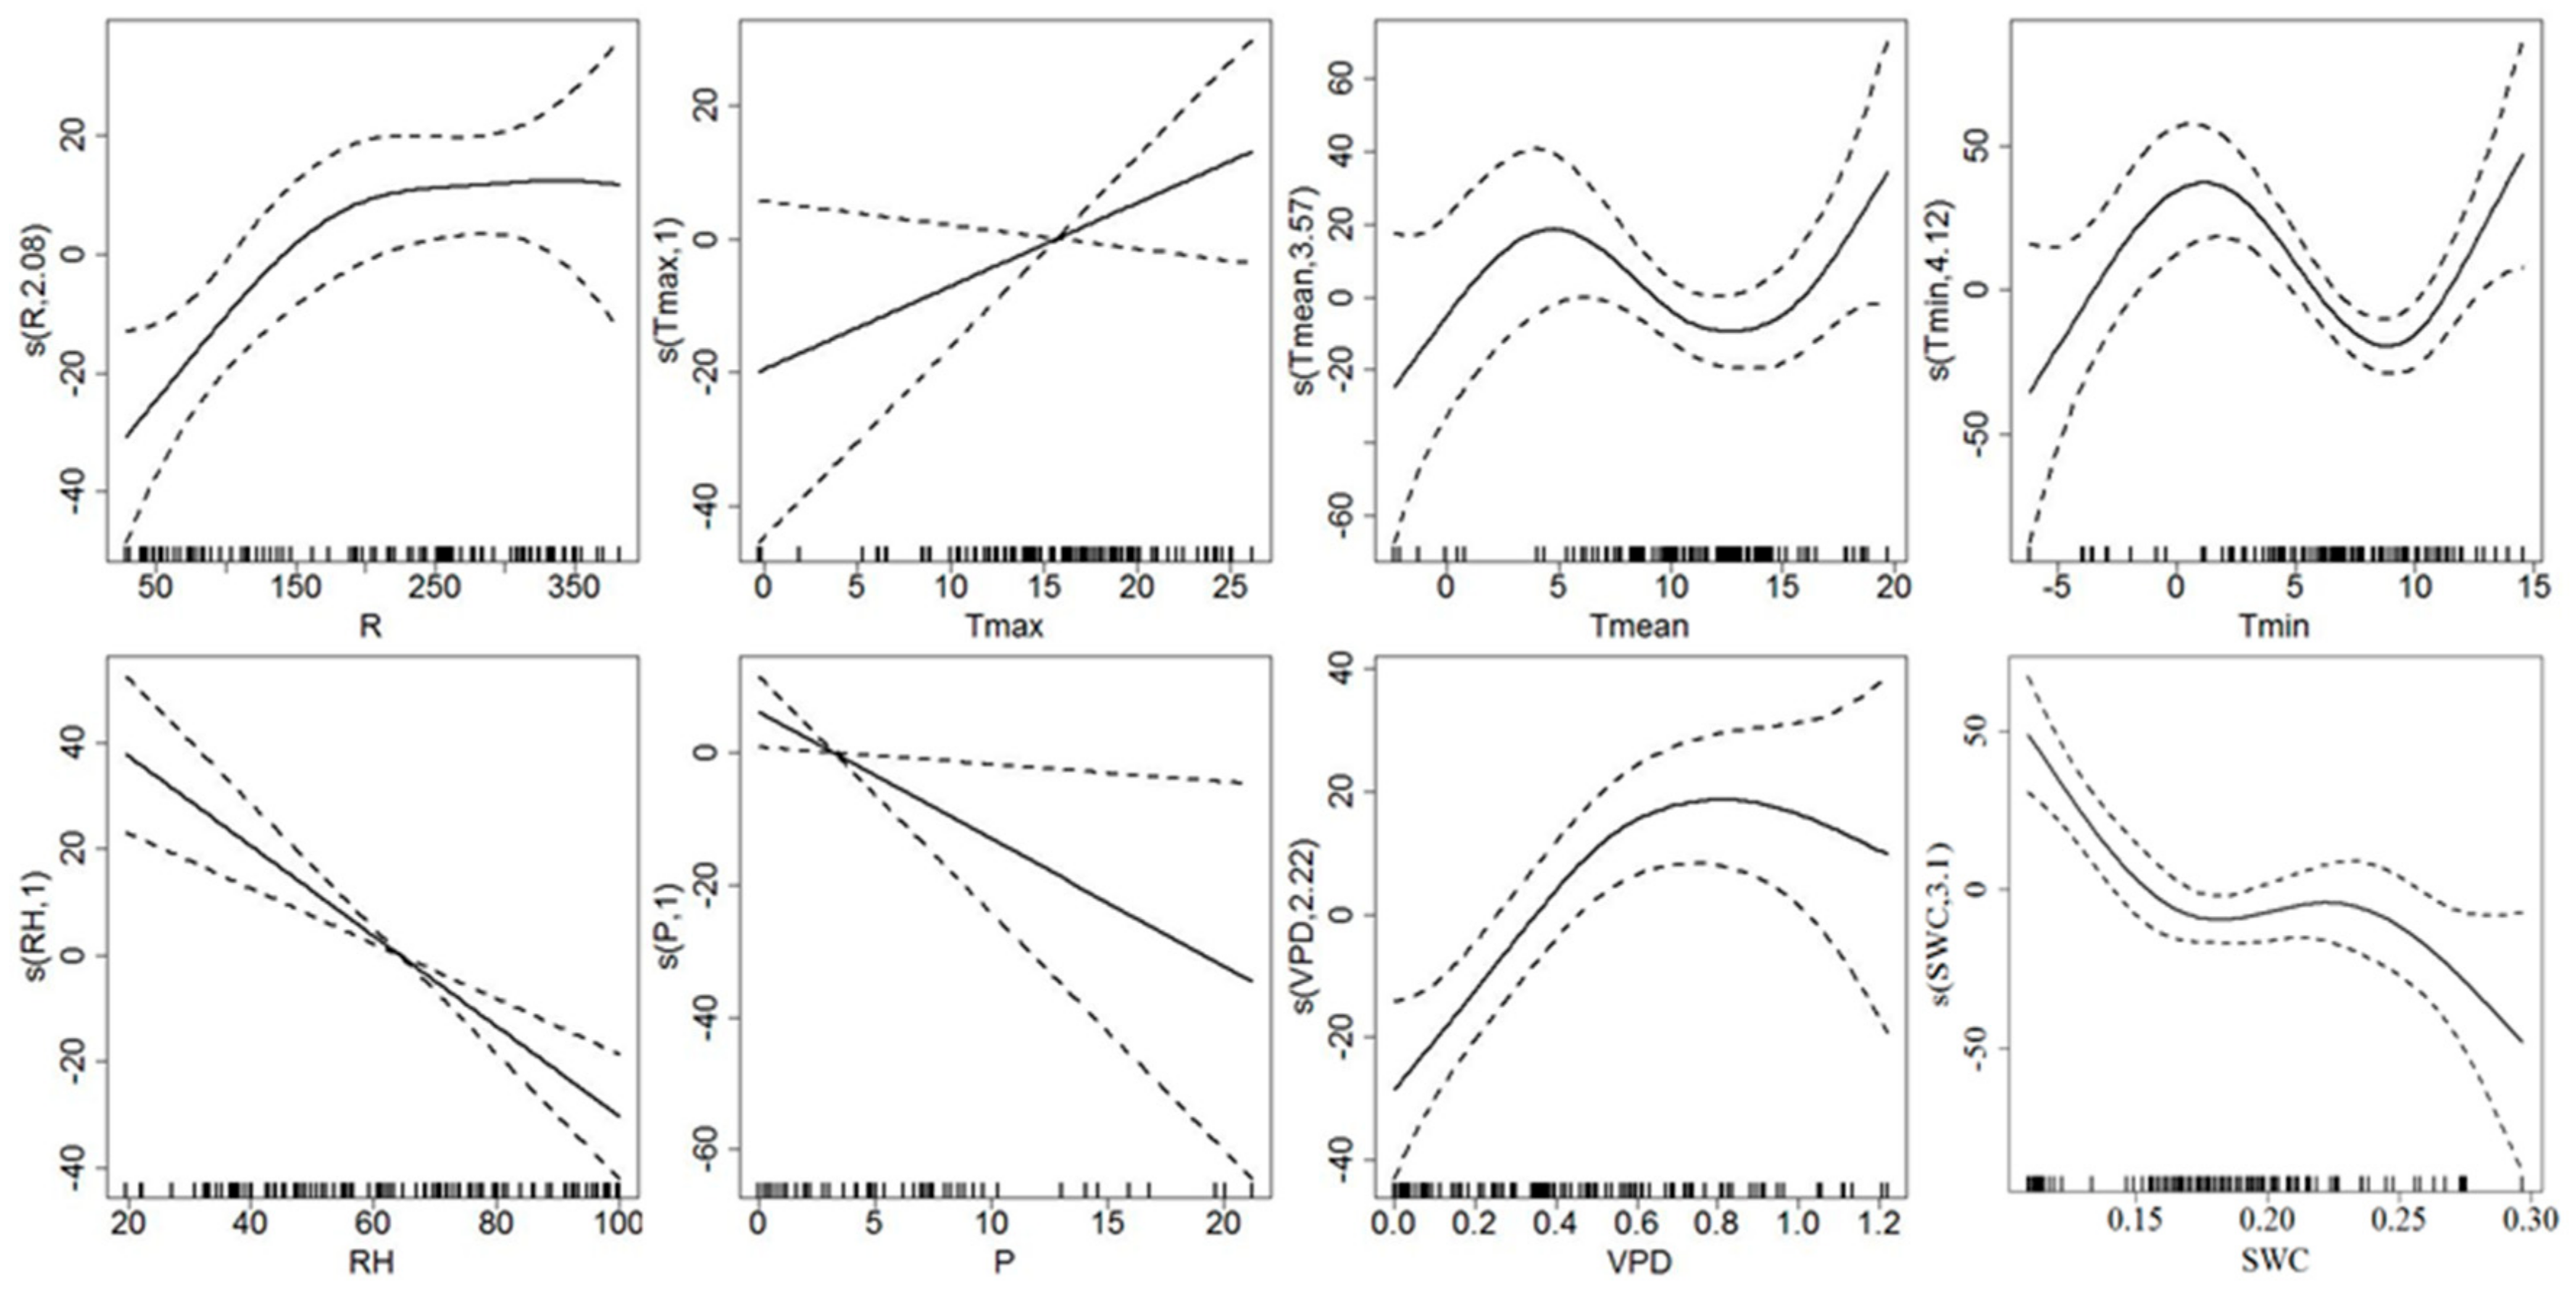
3.3. Response of Sap Flow Density and Tree Water Deficit to Environmental Variables
4. Discussion
4.1. Seasonal Course of Sap Flow Density and Tree Water Deficit
4.2. Environmental Control on Sap Flow Density and Tree Water Deficit
4.3. Effects of Environmental Variables on Water Use Efficiency
5. Conclusions
Acknowledgments
Author Contributions
Conflicts of Interest
References
- Boisvenue, C.; Running, S.W. Impacts of climate change on natural forest productivity-evidence since the middle of the 20th century. Glob. Chang. Biol. 2006, 12, 862–882. [Google Scholar] [CrossRef]
- Zeppel, M.J.B.; Wilks, J.V.; Lewis, J.D. Impacts of extreme precipitation and seasonal changes in precipitation on plants. Biogeosciences 2014, 11, 3083–3093. [Google Scholar] [CrossRef]
- Brinkmann, N.; Eugster, W.; Zweifel, R.; Buchmann, N.; Kahmen, A. Temperate tree species show identical response in tree water deficit but different sensitivities in sap flow to summer soil drying. Tree Physiol. 2016, 36, 1508–1519. [Google Scholar] [CrossRef] [PubMed]
- IPCC. Climate Change 2013: The Physical Science Basis; Stocker, T.F., Qin, D., Plattner, G.-K., Tignor, M., Allen, S.K., Boschung, J., Nauels, A., Xia, Y., Bex, V., Midgley, P.M., Eds.; Cambridge University Press: Cambridge, UK; New York, NY, USA, 2013; p. 1535. [Google Scholar]
- Bennett, A.C.; McDowell, N.G.; Allen, C.D.; Anderson-Teixeira, K.J. Larger trees suffer most during drought in forests worldwide. Nat. Plants 2015, 1, 15139. [Google Scholar] [CrossRef] [PubMed]
- Chang, X.; Zhao, W.; He, Z. Radial pattern of sap flow and response to microclimate and soil moisture in Qinghai spruce (Picea crassifolia) in the upper Heihe River Basin of arid Northwestern China. Agric. For. Meteorol. 2014, 187, 14–21. [Google Scholar] [CrossRef]
- Liu, B.; Ming, X.; Mark, H.; Ye, Q. Observed trends of precipitation amount, frequency, and intensity in China, 1960–2000. J. Geophys. Res. 2005. [Google Scholar] [CrossRef]
- Lin, P.; He, Z.; Du, J.; Chen, L.; Zhu, X.; Li, J. Recent changes in daily climate extremes in an arid mountain region, a case study in northwestern China’s Qilian Mountains. Sci. Rep. 2017, 7, 2245. [Google Scholar] [CrossRef] [PubMed]
- Urrutia-Jalabert, R.; Rossi, S.; Deslauriers, A.; Malhi, Y.; Lara, A. Environmental correlates of stem radius change in the endangered Fitzroya cupressoides forests of southern Chile. Agric. For. Meteorol. 2015, 200, 209–221. [Google Scholar] [CrossRef]
- Duchesne, L.; Houle, D.; D’Orangeville, L. Influence of climate on seasonal patterns of stem increment of balsam fir in a boreal forest of Québec, Canada. Agric. For. Meteorol. 2012, 162–163, 108–114. [Google Scholar] [CrossRef]
- Du, S.; Wang, Y.; Kume, T.; Zhang, J.; Otsuki, K.; Yamanaka, N.; Liu, G. Sapflow characteristics and climatic responses in three forest species in the semiarid Loess Plateau region of China. Agric. For. Meteorol. 2011, 151, 1–10. [Google Scholar] [CrossRef]
- Sánchez-Costa, E.; Poyatos, R.; Sabaté, S. Contrasting growth and water use strategies in four co-occurring Mediterranean tree species revealed by concurrent measurements of sap flow and stem diameter variations. Agric. For. Meteorol. 2015, 207, 24–37. [Google Scholar] [CrossRef]
- Steppe, K.; De Pauw, D.J.; Lemeur, R.; Vanrolleghem, P.A. A mathematical model linking tree sap flow dynamics to daily stem diameter fluctuations and radial stem growth. Tree Physiol. 2006, 26, 257–273. [Google Scholar] [CrossRef] [PubMed]
- Beedlow, P.A.; Waschmann, R.S.; Lee, E.H.; Tingey, D.T. Seasonal patterns of bole water content in old growth Douglas-fir (Pseudotsuga menziesii (Mirb.) Franco). Agric. For. Meteorol. 2017, 242, 109–119. [Google Scholar] [CrossRef]
- Čermák, J.; Kucera, J.; Bauerle, W.; Phillips, N.; Hinckley, T.M. Tree water storage and its diurnal dynamics related to sap flow and changes in stem volume in old-growth Douglas-fir trees. Tree Physiol. 2007, 27, 181–198. [Google Scholar] [CrossRef] [PubMed]
- Zweifel, R.; Zimmermann, L.; Zeugin, F.; Newbery, D.M. Intra-annual radial growth and water relations of trees: Implications towards a growth mechanism. J. Exp. Bot. 2006, 57, 1445–1459. [Google Scholar] [CrossRef] [PubMed]
- Da Silva Sallo, F.; Sanches, L.; de Morais Dias, V.R.; da Silva Palácios, R.; de Souza Nogueira, J. Stem water storage dynamics of Vochysia divergens in a seasonally flooded environment. Agric. For. Meteorol. 2017, 232, 566–575. [Google Scholar] [CrossRef]
- Oberhuber, W.; Kofler, W.; Schuster, R.; Wieser, G. Environmental effects on stem water deficit in co-occurring conifers exposed to soil dryness. Int. J. Biometeorol. 2015, 59, 417–426. [Google Scholar] [CrossRef] [PubMed]
- Oberhuber, W.; Hammerle, A.; Kofler, W. Tree water status and growth of saplings and mature Norway spruce (Picea abies) at a dry distribution limit. Front. Plant Sci. 2015. [Google Scholar] [CrossRef] [PubMed]
- Jiang, Y.; Wang, B.; Dong, M.; Huang, Y.; Wang, M.; Wang, B. Response of daily stem radial growth of Platycladus orientalis to environmental factors in a semi-arid area of North China. Trees 2015, 29, 87–96. [Google Scholar] [CrossRef]
- Drew, D.M.; Richards, A.E.; Downes, G.M.; Cook, G.D.; Baker, P. The development of seasonal tree water deficit in Callitris intratropica. Tree Physiol. 2011, 31, 953–964. [Google Scholar] [CrossRef] [PubMed]
- Oberhuber, W.; Gruber, A. Climatic influences on intra-annual stem radial increment of Pinus sylvestris (L.) exposed to drought. Trees 2010, 24, 887–898. [Google Scholar] [CrossRef] [PubMed]
- Zweifel, R. Radial stem variations—A Source of tree physiological information not fully exploited yet. Plant Cell Environ. 2016, 39, 231–232. [Google Scholar] [CrossRef] [PubMed]
- Zweifel, R.; Haeni, M.; Buchmann, N.; Eugster, W. Are trees able to grow in periods of stem shrinkage? New Phytol. 2016, 211, 839–849. [Google Scholar] [CrossRef] [PubMed]
- Molina, A.J.; Aranda, X.; Carta, G.; Llorens, P.; Romero, R.; Savé, R.; Biel, C. Effect of irrigation on sap flux density variability and water use estimate in cherry (Prunus avium) for timber production: Azimuthal profile, radial profile and sapwood estimation. Agric. Water Manag. 2016, 164, 118–126. [Google Scholar] [CrossRef]
- Looker, N.; Martin, J.; Jencso, K.; Hu, J. Contribution of sapwood traits to uncertainty in conifer sap flow as estimated with the heat-ratio method. Agric. For. Meteorol. 2016, 223, 60–71. [Google Scholar] [CrossRef]
- Patankar, R.; Quinton, W.L.; Hayashi, M.; Baltzer, J.L. Sap flow responses to seasonal thaw and permafrost degradation in a subarctic boreal peatland. Trees 2014, 29, 129–142. [Google Scholar] [CrossRef]
- Van de Wal, B.A.E.; Guyot, A.; Lovelock, C.E.; Lockington, D.A.; Steppe, K. Influence of temporospatial variation in sap flux density on estimates of whole-tree water use in Avicennia marina. Trees 2014, 29, 215–222. [Google Scholar] [CrossRef]
- Chang, X.; Zhao, W.; Liu, H.; Wei, X.; Liu, B.; He, Z. Qinghai spruce (Picea crassifolia) forest transpiration and canopy conductance in the upper Heihe River Basin of arid Northwestern China. Agric. For. Meteorol. 2014, 198, 209–220. [Google Scholar] [CrossRef]
- Kume, T.; Otsuki, K.; Du, S.; Yamanaka, N.; Wang, Y.; Liu, G. Spatial variation in sap flow velocity in semiarid region trees: Its impact on stand-scale transpiration estimates. Hydrol. Process. 2012, 26, 1161–1168. [Google Scholar] [CrossRef]
- Hernandez-Santana, V.; Fernández, J.E.; Rodriguez-Dominguez, C.M.; Romero, R.; Diaz-Espejo, A. The dynamics of radial sap flux density reflects changes in stomatal conductance in response to soil and air water deficit. Agric. For. Meteorol. 2016, 218–219, 92–101. [Google Scholar] [CrossRef]
- Chen, D.; Wang, Y.; Liu, S.; Wei, X.; Wang, X. Response of relative sap flow to meteorological factors under different soil moisture conditions in rainfed jujube (Ziziphus jujuba Mill.) plantations in semiarid Northwest China. Agric. Water Manag. 2014, 136, 23–33. [Google Scholar] [CrossRef]
- Kocher, P.; Horna, V.; Leuschner, C. Stem water storage in five coexisting temperate broad-leaved tree species: Significance, temporal dynamics and dependence on tree functional traits. Tree Physiol. 2013, 33, 817–832. [Google Scholar] [CrossRef] [PubMed]
- Scholz, F.C.; Bucci, S.J.; Goldstein, G.; Meinzer, F.C.; Franco, A.C.; Miralles-Wilhelm, F. Temporal dynamics of stem expansion and contraction in savanna trees: Withdrawal and recharge of stored water. Tree Physiol. 2008, 28, 469–480. [Google Scholar] [CrossRef] [PubMed]
- Bréda, N.; Granier, A. Intra-and interannual variations of transpiration, leaf area index and radial growth of a sessile oak stand (Quercus petraea). Ann. For. Sci. 1996, 53, 521–536. [Google Scholar] [CrossRef]
- Knight, C.A.; Vogel, H.; Kroymann, J.; Shumate, A.; Witsenboer, H.; Mitchell-Olds, T. Expression profiling and local adaptation of Boechera holboellii populations for water use efficiency across a naturally occurring water stress gradient. Mol Ecol. 2006, 15, 1229–1237. [Google Scholar] [CrossRef] [PubMed]
- Zhao, C.; Nan, Z.; Cheng, G.; Zhang, J.; Feng, Z. GIS-assisted modelling of the spatial distribution of Qinghai spruce (Picea crassifolia) in the Qilian Mountains, Northwestern China based on biophysical parameters. Ecol. Model. 2006, 191, 487–500. [Google Scholar] [CrossRef]
- Tian, Q.; He, Z.; Xiao, S.; Peng, X.; Ding, A.; Lin, P. Response of stem radial growth of Qinghai spruce (Picea crassifolia) to environmental factors in the Qilian Mountains of China. Dendrochronologia 2017, 44, 76–83. [Google Scholar] [CrossRef]
- Wang, W.; Liu, X.; An, W.; Xu, G.; Zeng, X. Increased intrinsic water-use efficiency during a period with persistent decreased tree radial growth in Northwestern China: Causes and implications. For. Ecol. Manag. 2012, 275, 14–22. [Google Scholar] [CrossRef]
- Marshall, D.C. Measurement of sap flow in conifers by heat transport. Plant Physiol. 1958, 33, 385–396. [Google Scholar] [CrossRef] [PubMed]
- Burgess, S.S.O.; Adams, M.A.; Turner, N.C.; Beverly, C.R.; Ong, C.K.; Khan, A.A.H.; Bleby, T.M. An improved heat pulse method to measure low and reverse rates of sap flow in woody plants. Tree Physiol. 2001, 21, 589–598. [Google Scholar] [CrossRef] [PubMed]
- Barrett, D.J.; Hatton, T.J.; Ash, J.E.; Ball, M.C. Evaluation of the heat pulse velocity technique for measurement of sap flow in rainforest and eucalypt forest species of South-Eastern Australia. Plant Cell Environ. 1995, 18, 463–469. [Google Scholar] [CrossRef]
- Zweifel, R.; Zimmermann, J.; Newbery, D.M. Modeling tree water deficit from microclimate: An approach to quantifying drought stress. Tree Physiol. 2005, 25, 147–156. [Google Scholar] [CrossRef] [PubMed]
- Wood, S.N. Generalized Additive Models: An Introduction with R; CRC Press: Boca Raton, FL, USA, 2017. [Google Scholar]
- Vieira, J.; Rossi, S.; Campelo, F.; Freitas, H.; Nabais, C. Seasonal and daily cycles of stem radial variation of Pinus pinaster in a drought-prone environment. Agric. For. Meteorol. 2013, 180, 173–181. [Google Scholar] [CrossRef]
- Scholz, F.G.; Phillips, N.G.; Bucci, S.J.; Meinzer, F.C.; Goldstein, G. Hydraulic Capacitance: Biophysics and Functional Significance of Internal Water Sources in Relation to Tree Size; Springer: Rotterdam, The Netherlands, 2011; pp. 341–361. [Google Scholar]
- Peng, X.; Fan, J.; Wang, Q.; Warrington, D. Discrepancy of sap flow in Salix matsudana grown under different soil textures in the water-wind erosion crisscross region on the Loess Plateau. Plant Soil 2014, 390, 383–399. [Google Scholar] [CrossRef]
- Wullschleger, S.D.; Wilson, K.B.; Hanson, P.J. Environmental control of whole-plant transpiration, canopy conductance and estimates of the decoupling coefficient for large red maple trees. Agric. For. Meteorol. 2000, 104, 157–168. [Google Scholar] [CrossRef]
- Asbjornsen, H.; Tomer, M.D.; Gomez-Cardenas, M.; Brudvig, L.A.; Greenan, C.M.; Schilling, K. Tree and stand transpiration in a Midwestern bur oak savanna after elm encroachment and restoration thinning. Agric. For. Meteorol. 2007, 247, 209–219. [Google Scholar] [CrossRef]
- Wieser, G.; Gruber, A.; Oberhuber, W. Sap flow characteristics and whole-tree water use of Pinus cembra across the treeline ecotone of the Central Tyrolean Alps. Eur. J. For. Res. 2014, 133, 287–295. [Google Scholar] [CrossRef]
- Wieser, G.; Grams, T.E.; Matyssek, R.; Oberhuber, W.; Gruber, A. Soil warming increased whole-tree water use of Pinus cembra at the treeline in the Central Tyrolean Alps. Tree Physiol. 2015, 35, 279–288. [Google Scholar] [CrossRef] [PubMed]
- Pataki, D.E.; Oren, R. Species differences in stomatal control of water loss at the canopy scale in a mature bottomland deciduous forest. Adv. Water Resour. 2003, 26, 1267–1278. [Google Scholar] [CrossRef]
- Leo, M.; Oberhuber, W.; Schuster, R.; Grams, T.E.E.; Matyssek, R.; Wieser, G. Evaluating the effect of plant water availability on inner alpine coniferous trees based on sap flow measurements. Eur. J. For. Res. 2013, 133, 691–698. [Google Scholar] [CrossRef]
- Wieser, G.; Leo, M. Whole-tree water use by Pinus cembra at the treeline in the Central Tyrolean Alps. Plant Ecol. Divers. 2012, 5, 81–88. [Google Scholar] [CrossRef]
- Wieser, G. Ozone. In Trace Gas Exchange in Forest Ecosystems; Springer: New York, NY, USA, 2002; pp. 211–226. [Google Scholar]
- O’Brien, J.J.; Oberbauer, S.F.; Clark, D.B. Whole tree xylem sap flow responses to multiple environmental variables in a wet tropical forest. Plant Cell Environ. 2004, 27, 551–567. [Google Scholar] [CrossRef]
- Liu, X.; Zhang, B.; Zhuang, J.; Han, C.; Zhai, L.; Zhao, W.; Zhang, J. The relationship between sap flow density and environmental factors in the Yangtze River delta region of China. Forests 2017, 8, 74. [Google Scholar] [CrossRef]
- Li, W.; Si, J.; Yu, T.; Li, X. Response of Populus euphratica Oliv. sap flow to environmental variables for a desert riparian forest in the Heihe River Basin, Northwest China. J. Arid Land 2016, 8, 591–603. [Google Scholar] [CrossRef]
- Zhao, C.Y.; Si, J.H.; Feng, Q.; Yu, T.F.; Li, P.D. Comparative study of daytime and nighttime sap flow of Populus euphratica. Plant Growth Regul. 2017, 82, 353–362. [Google Scholar] [CrossRef]
- Si, J.; Feng, Q.; Yu, T.; Zhao, C. Nighttime sap flow and its driving forces for Populus euphratica in a desert riparian forest, Northwest China. J. Arid Land 2015, 7, 665–674. [Google Scholar] [CrossRef]
- Devine, W.D.; Harrington, C.A. Factors affecting diurnal stem contraction in young Douglas-fir. Agric. For. Meteorol. 2011, 151, 414–419. [Google Scholar] [CrossRef]
- King, G.; Fonti, P.; Nievergelt, D.; Büntgen, U.; Frank, D. Climatic drivers of hourly to yearly tree radius variations along a 6 °C natural warming gradient. Agric. For. Meteorol. 2012, 168, 36–46. [Google Scholar] [CrossRef]
- Deslauriers, A.; Rossi, S.; Anfodillo, T. Dendrometer and intra-annual tree growth: What kind of information can be inferred? Dendrochronologia 2007, 25, 113–124. [Google Scholar] [CrossRef]
- Wang, Z.; Yang, B.; Deslauriers, A.; Qin, C.; He, M.H.; Shi, F.; Liu, J. Two phases of seasonal stem radius variations of Sabina przewalskii Kom. in northwestern China inferred from sub-diurnal shrinkage and expansion patterns. Trees 2012, 26, 1747–1757. [Google Scholar] [CrossRef]
- Zhang, R.; Yuan, Y.; Gou, X.; Zhang, T.; Zou, C.; Ji, C.; Fan, Z.; Qin, L.; Shang, H.; Li, X. Intra-annual radial growth of Schrenk spruce (Picea schrenkiana Fisch. et Mey) and its response to climate on the northern slopes of the Tianshan Mountains. Dendrochronologia 2016, 40, 36–42. [Google Scholar] [CrossRef]


| Tree | Height (m) | Diameter at Breast Height (cm) | Tree Age (years) | Bark Depth (cm) | Sapwood Depth (cm) | Sapwood Area-Out (cm2) | Sapwood Area-In (cm2) |
|---|---|---|---|---|---|---|---|
| Tree1 | 11 | 18.6 | 95 | 0.6 | 3.43 | 74.93 | 75.55 |
| Tree2 | 13 | 25 | 104 | 0.6 | 4.02 | 105.09 | 144.87 |
| Tree3 | 19 | 44 | 133 | 0.6 | 6.47 | 194.62 | 543.75 |
| Tree4 | 17 | 33 | 117 | 0.6 | 4.91 | 142.79 | 272.26 |
| Observation | Statistics Variable | R | Tmax | Tmean | Tmin | RH | P | VPD | SWC |
|---|---|---|---|---|---|---|---|---|---|
| Js | edf | 3.43 | 4.825 | 1.623 | 2.819 | 4.3 | 2.051 | 3.992 | 3.635 |
| F | 60.3 | 26.74 | 22.01 | 4.916 | 56.13 | 26.14 | 91.3 | 13.38 | |
| p-value | 0.000 ** | 0.000 ** | 0.000 ** | 0.000 ** | 0.000 ** | 0.000 ** | 0.000 ** | 0.000 ** | |
| R2-adj | 0.71 | 0.598 | 0.293 | 0.139 | 0.738 | 0.382 | 0.812 | 0.364 | |
| Dev | 72% | 61.70% | 30.40% | 16.20% | 74.90% | 39.40% | 81.90% | 38.60% | |
| △W | edf | 2.08 | 1 | 3.567 | 4.121 | 1 | 1 | 2.224 | 3.097 |
| F | 5.64 | 2.422 | 2.049 | 5.841 | 26.57 | 5.363 | 7.176 | 9.686 | |
| p-value | 0.002 ** | 0.123 | 0.0824 | 0.000 ** | 0.000 ** | 0.022 * | 0.000 ** | 0.000 ** | |
| R2-adj | 0.12 | 0.013 | 0.074 | 0.229 | 0.196 | 0.039 | 0.16 | 0.237 | |
| Dev | 13.80% | 2.28% | 10.60% | 25.90% | 20.40% | 4.90% | 17.80% | 26.00% |
| Observation | Environmental Variables | edf | F | p-Value | R2-adj | Dev |
|---|---|---|---|---|---|---|
| Js | R | 3.409 | 4.641 | 0.001 ** | 0.956 | 96.90% |
| Tmax | 4.364 | 2.848 | 0.017 * | |||
| Tmean | 1 | 1.592 | 0.211 | |||
| Tmin | 3.897 | 3.842 | 0.004 ** | |||
| RH | 1 | 0.849 | 0.359 | |||
| P | 4.484 | 3.426 | 0.006 ** | |||
| VPD | 3.455 | 6.782 | 0.000 ** | |||
| SWC | 8.59 | 9.134 | 0.000 ** | |||
| △W | R | 1 | 0.479 | 0.491 | 0.781 | 84.20% |
| Tmax | 3.55 | 0.96 | 0.434 | |||
| Tmean | 1 | 0.276 | 0.601 | |||
| Tmin | 4.835 | 8.093 | 0.000 ** | |||
| RH | 3.386 | 1.672 | 0.159 | |||
| P | 1 | 0.344 | 0.559 | |||
| VPD | 6.366 | 0.947 | 0.345 | |||
| SWC | 8.213 | 14.117 | 0.000 ** |
| Observation | Environmental Variables | edf | F | p-Value | R2-adj | Dev |
|---|---|---|---|---|---|---|
| Js | R | 3.637 | 4.152 | 0.003 ** | 0.956 | 96.80% |
| Tmax | 4.536 | 2.702 | 0.024 * | |||
| Tmin | 3.907 | 3.745 | 0.004 ** | |||
| P | 4.525 | 3.157 | 0.011 * | |||
| VPD | 3.805 | 10.569 | 0.000 ** | |||
| SWC | 8.503 | 10.274 | 0.000 ** | |||
| △W | Tmin | 5.354 | 14.29 | 0.000 ** | 0.668 | 71.20% |
| SWC | 8.432 | 15.58 | 0.000 ** |
© 2017 by the authors. Licensee MDPI, Basel, Switzerland. This article is an open access article distributed under the terms and conditions of the Creative Commons Attribution (CC BY) license (http://creativecommons.org/licenses/by/4.0/).
Share and Cite
Tian, Q.; He, Z.; Xiao, S.; Du, J.; Peng, X.; Chen, L.; Lin, P.; Zhu, X.; Ding, A. Growing Season Stem Water Status Assessment of Qinghai Spruce through the Sap Flow and Stem Radial Variations in the Qilian Mountains of China. Forests 2018, 9, 2. https://doi.org/10.3390/f9010002
Tian Q, He Z, Xiao S, Du J, Peng X, Chen L, Lin P, Zhu X, Ding A. Growing Season Stem Water Status Assessment of Qinghai Spruce through the Sap Flow and Stem Radial Variations in the Qilian Mountains of China. Forests. 2018; 9(1):2. https://doi.org/10.3390/f9010002
Chicago/Turabian StyleTian, Quanyan, Zhibin He, Shengchun Xiao, Jun Du, Xiaomei Peng, Longfei Chen, Pengfei Lin, Xi Zhu, and Aijun Ding. 2018. "Growing Season Stem Water Status Assessment of Qinghai Spruce through the Sap Flow and Stem Radial Variations in the Qilian Mountains of China" Forests 9, no. 1: 2. https://doi.org/10.3390/f9010002