Provenance Variation in Phenology and Frost Tolerance in Subalpine Fir (Abies lasiocarpa) Planted in Denmark and Iceland †


1
Icelandic Forest Research, Krókeyri, 600 Akureyri, Iceland
2
Department of Geosciences and Natural Resource Management, University of Copenhagen, Rolighedsvej 23, 1958 Frederiksberg, Denmark
*
Author to whom correspondence should be addressed.
†
This paper is part of Brynjar Skulason’s PhD thesis—Provenance variation in subalpine fir grown as an exotic tree species in Denmark and Iceland, from the Department of Geosciences and Natural Resource Management, Faculty of Science, University of Copenhagen, Denmark; delivered in February 2017.
Forests 2018, 9(1), 17; https://doi.org/10.3390/f9010017
Submission received: 28 November 2017
/
Revised: 15 December 2017
/
Accepted: 28 December 2017
/
Published: 2 January 2018
(This article belongs to the Special Issue Selected Papers from the IUFRO 2.02.09—Christmas Tree Working Group Meeting)
Abstract
:In Iceland and Denmark, there is an interest in planting Abies lasiocarpa for use as Christmas trees. To search for usable genetic material for both countries, 26 provenances of subalpine fir, covering most of its natural range, were planted in eastern Iceland and Jutland, Denmark. Flushing, bud set and survival rates were assessed. Artificial freezing of twigs, from field trials in eastern Iceland and Denmark, was done to rank the provenances for frost tolerance in the spring and autumn. The northernmost provenances showed earliest bud set, highest autumn frost tolerance and a latitudinal cline was delineated. Differences between provenances in flushing and spring frost tolerance were less than that found for bud set and autumn frost tolerance. The southernmost provenances showed earliest flushing and the most spring frost damage on buds. Mortality of single provenances in the field tests could not be attributed to low freezing tolerances in the autumn or spring. The southernmost provenances of Abies lasiocarpa from New Mexico and Arizona showed the highest survival rate in the field trial in East Iceland, while the eastern provenances showed a low survival rate except for two provenances from Utah and Wyoming. The western provenances from Washington state showed the best survival in Denmark, followed by the southernmost provenances.
1. Introduction
Subalpine fir (Abies lasiocarpa (Hook.) Nutt.) is grown as an exotic tree species in the Nordic countries. In Iceland and Denmark, there has been increasing interest in production of this fir as a Christmas tree. The first documented planting of subalpine fir in Denmark was in 1866 at Knuthenborg [1] but the species is still uncommon in plantations, parks and gardens [2]. Subalpine fir was introduced to Iceland from Denmark between 1903 and 1906 [3]. In Iceland and Denmark there is a long history of the use of exotic species in forestry [3,4]. Many of these species originated from North America or other parts of Europe [5]. Noble fir (Abies procera Rehder) and Nordmann fir (Abies nordmanniana (Steven) Spach) were initially introduced to Danish forests for timber production, but have become important in the production of Christmas trees and greenery [6,7,8]. In Denmark, subalpine fir could serve as an alternative Christmas tree species on exposed sites where production of Nordmann fir is unsuitable because of frost and as a niche product on the Danish market [9]. Also in Iceland the interest for subalpine fir is primarily related to Christmas tree production.
Subalpine fir is widely distributed in western North America, ranging in latitude from approximately 32° N to 64° N and growing in the coolest and wettest forests on the continent [10]. The distribution area is confined within a climatic envelope with a mean annual temperature of 3.4 to 4.8 °C, a mean temperature of the warmest month from 10.9 to 16.1 °C, a mean temperature of the coldest month of −23.2 to −5.9 °C, a mean annual precipitation of 365 to 1250 mm, and with degree days (DD) > 5 °C of 500 to 1200 DD [11]. Two varieties of subalpine fir are recognized. The common variety (A. lasiocarpa var. lasiocarpa (Hook.) Nutt.) is found north of Colorado, while corkbark fir (A. lasiocarpa var. arizonica (Merriam) Lemmon) grows in southern Colorado, Arizona and New Mexico. The large distribution area of subalpine fir indicates that the species can grow in a broad range of climatic conditions and might have large genetic and phenotypic variation [12]. The characteristics of a population may reflect adaptation to both present and past environments [13]. Alexander et al. [10] divided the distribution area of subalpine fir into four main regions, based on climatological data. The present distribution area may not yet have reached equilibrium with the climatic niche of the species after the last glacial maximum. Roberts and Hamann [14] reconstructed the refugial history of western North American trees and divided subalpine fir into 6 different refugia. Each provenance might have adapted partly to the present local climate, but the opportunity for adaptation may be constrained by evolution and dispersal from these refugia as well as genetic bottlenecks. Hansen et al. [15] used canonical variates analysis, based on 15 characteristics, to divide the 26 provenances into six groups. These groups show a strong relationship to the classification by Alexander et al. [10] and Roberts and Hamann [14].
In boreal forest trees, adaptation to seasonal climatic conditions is essential. Boreal tree species such as subalpine fir can tolerate extremely low temperatures (−80 °C) during winter dormancy [16], but temperatures slightly below freezing during the growing period can be lethal. The risk of cold injury is highest when trees are actively growing and frosts occur, for example a late spring frost around time of bud flush or in the early autumn during bud set before full cold acclimation [17,18,19].
The climate in Iceland is oceanic with rather mild winters and cool summers. The mean temperature in the coldest month of the year along the coast from southwest to southeast is above 0 °C. In low laying inland areas, especially in northern and eastern Iceland, frost can occur in all months [20]. The climate is highly variable and mean monthly temperatures can vary substantially between years. This variation is greater in the winter months than in the summer and increases with distance from the sea, especially in northern Iceland. The challenge facing Icelandic forestry is to choose genetic material that tolerates late spring frosts following mild winters as well as cool summers and early autumn frosts [21].
Compared to Iceland, Denmark generally has a higher annual mean temperature, a longer growing season and greater temperature differences between summer and winter (a more continental climate). Winter damage occurs occasionally in Christmas tree plantations of Noble fir and Nordmann fir [22,23]. In Denmark, because of the long growing seasons, autumn frosts are unlikely to damage subalpine fir, except for hallow inland areas. Mild weather in late winter followed by frost, is more likely to damage subalpine fir under Danish conditions.
In 1999, a Nordic project named “Abies lasiocarpa for Christmas tree production in the Nordic countries” was initiated. The broad objectives were to identify suitable provenances and develop cultivation methods to produce valuable Christmas trees of subalpine fir [9]. The results after three years in the field from provenance trials in Denmark, Norway and Iceland were published by Hansen et al. [15]. Part of this project was to identify variability in frost hardiness between provenances of subalpine fir and identify those provenances that are sensitive to spring and/or autumn frost [9].
The study presented here focused on the growth rhythms of the 26 provenances of subalpine fir in the Nordic project, originating from latitudes from 61° N in the Yukon to 34° N in New Mexico, thereby covering a large part of the species distribution. The following issues were examined and discussed:
- Provenance phenology for flushing and bud set
- Provenance ranking in frost sensitivity in late spring and early autumn based on tests in freezing chambers
- Relationships between date of flushing, spring frost tolerance, survival rates and the geographical origin of provenances
- Relationships between bud set, autumn frost tolerance, survival rates and the geographical origin of provenances.
2. Materials and Methods
2.1. Provenances and Sites
In the years 1991 to 1993, seeds of the 26 subalpine fir provenances (Table 1) currently evaluated were obtained from the USA and Canada [9]. These were cultivated at the Danish Tree Improvement Station at Humlebæk, Zealand, Denmark (Danish Nature Agency) as 3 + 2 bare-root plants (three years in seedbed after sowing and two years as transplants in a transplant line), and planted in provenance trials in three Nordic countries in spring 1999. The four trial sites in this study were established in Hallormsstadur, Iceland (65°14′ N, 14°67′ W, 35 meters above sea level (m a.s.l.)), Vilsbøl (55°10′ N, 8°57′ W, 48 m a.s.l.). Hønning (57°01′ N, 8°35′, 27 m a.s.l.) and Thorsø (56°09′ N, 9°32′ W, 100 m a.s.l.). The three latter sites are in Jutland, Denmark. Each trial contained 48 blocks with 28 single tree plots in each block—a total of initially 1344 seedlings at each site. Twenty-four provenances were represented once and two provenances represented twice in each block.
2.2. Phenology
In the spring (April) of 2000 and 2010 flushing was scored once in the field trials in a) Hallormsstadur and Thorsø (earlier published by Hansen et al. [15]) and b) Vilsbøl and Hønning, respectively, analyzed as datasets from four sites (not averaged). Scoring was done following a scale developed by Langlet [24] (0: dormant buds; 1: buds slightly swollen; 2: buds more or less green; 3: burst of bud scales; 4: budscales have been shed, needles still turned forward like a brush; 5: incipient shoot elongation, shoots and needles still soft; 6: shoots elongated, needles in final position).
In the autumn (August, September) of 2001, bud set was scored twice at each site, in Hallormsstadur and Thorsø [15], using the method described by Johnsen and Apeland [25] and Skrøppa [26] (0: no terminal bud; 1: tiny, white terminal bud; 2: terminal bud light brown, needles slightly darker green than the plants in class 1; 3: well developed budscales, terminal buds larger than on plants in class 2). The data was analyzed as four datasets (two sites and two monitoring dates within sites, not averaged).
2.3. Survival
Survival was assessed in Hallormsstadur in 2011, 12 growing seasons after establishment and in Hønning in 2008, 10 growing seasons after establishment. The other two sites in Denmark showed low mortality and therefore are not as suitable as Hønning for analysis of survival.
2.4. Freezing Tests
For the first freezing tests in 2001, twigs were collected from the two-year-old provenance field trial (7 years from seed) in Hallormsstadur, Iceland. The timing of the collection and value of the freezing test temperatures were chosen to identify the maximum variation in freezing tolerances for all the material. On 7 May 2001, twigs were collected when the buds were swelling. Calculated degree days (>5 °C) from 1 January to date of collection in the spring were 33.5 for Hallormsstadur (data for Egilsstadir, from the Icelandic Meteorological Office in Reykjavík, Iceland). The twigs were about 7 cm long and taken from the current year’s growth. Four twigs were taken from the second whorl from the top of each tree, one for each freezing treatment. Usually 15 trees from each provenance were sampled in this way. The twigs were kept in cold storage (approximately +6 °C) until the freezing tests were carried out on 9 May. Provenance Nos. 167, 216 and 164 were not included in the spring frost test due to lack of trees.
On 20 October 2012, a collection was done in Vilsbøl, Denmark. The twigs were the same size as those collected in Hallormsstadur (about 7 cm) and were taken from the green upper part of the crown. Usually 16 trees from each provenance were sampled. Five twigs from each tree were taken, corresponding to five freezing test temperatures, and kept in plastic bags in cold storage until freezing tests were carried out. Calculated photoperiod (day length, including civil twilight when the sun is geometrically 6 degrees below the horizon) when collection of twigs was made in Vilsbøl, was 11 h and 25 min according to the website of Astronomical Applications—Department of the U.S. Naval Observatory [27]. As no frost occurred in the field during the autumn 2012 the observed freezing damage was from the test.
The twigs were placed into wet fresh sphagnum moss in the spring frost test 2001 and sprayed with water to prevent drying during the freezing process. Same method was used in the autumn frost test 2012 but then the twigs were placed into Sphagnum peat (M6, Kekkilä Oy, Tuusula, Finland). Twigs collected from Hallormsstadur in 2001 were frozen to −4, −8, −12 and −16 °C in 4 computer-controlled freezers where the temperature was lowered 2 °C per hour until the minimum temperature was reached. Because of the small amount of parent material (small trees), no control was collected and included. The lowest temperature was maintained for 3 h and then raised 2 °C per hour. After thawing, the twigs were kept in high vapor, constant light and a temperature of about 20 °C. Scoring of the damage was done 2–3 weeks after freezing when the damage became visible. The same method was used for the twigs collected at Vilsbøl in the autumn of 2012 using freezing temperatures of −6, −12, −18, −24 °C and one treatment was maintained at 6 °C as a control.
Damage to cambium, needles and buds was scored visually by splitting the twigs lengthwise using a sharp knife. The damage to needles and/or cambium was assessed separately using the proportion of discolored and necrotic tissue rated on a scale developed by Johnsen [28] (0: no discoloration of needles or cambium; 1: up to ten per cent brown and/or discolored needles or cambium; 2–10: ten per cent intervals between classes of brown and/or discolored needles or cambium; 11: all needles or cambium completely brown). Freezing damage on buds was also evaluated by using a scale from 0 to 3 (0: no damage; 1: damage in the lateral buds; 2: damage in the terminal bud; 3: damage to both lateral and terminal buds).
2.5. Statistical Analysis
Statistical analysis was done using the statistical program R, version 3.0.1 [29]. The following model was used for an analysis to determine grade of flushing:
where Y is the observation of flushing on individual trees. Site and Block (Site) were assumed fixed effects, whereas Provenance, Provenance × Site and Error were considered random. Another model was used to determine grade of bud set:
where Y is the observation of bud set for individual trees. Site, Block (Site) and Time (Site) were assumed fixed effects, whereas Provenance, Provenance × Site and Error were considered random. The “lmer” and “ranef” functions from the lme4 package [30] and the “anova” function from the lmerTest package [31] were used to predict flushing and bud set through best linear unbiased prediction (BLUP) values and to analyze the statistical model.
Homogeneity of variance was tested by Levene’s test and residual plots in R. Normal distribution was tested using the Shapiro-Wilks test and Q–Q plots. Flushing and bud set showed some deviation from normal distribution and some lack of homogeneity. Skewness and kurtosis for the distribution of flushing were −0.672 and 1.139, respectively. Corresponding values for bud set were 0.153 and −0.308, respectively. The conclusion was that the deviation from normal distribution did not affect the main results to any meaningful extent.
The data from the freezing tests consisted mostly of twigs with no damage within current tissue type or those totally damaged. Frost damage was therefore analyzed as binomial data (damaged or undamaged). The maximum likelihood logit model was used to estimate the probability of frost damage for the provenances within each freezing test and tissue type. Only results from each freezing temperature showing closest to 50% damage were used for the estimation of the BLUP values. The following maximum likelihood logit model:
was used for the data from 2012. In the model, P is the probability of damage on a twig depending on Block as a fixed factor and Provenance as a random factor. A similar model was used to estimate survival in the field trials in Hallormsstadur in the year 2011 and in Hønning 2008, where P is the probability of survival of the tree in the trial. Freezing data from the year 2001 (twigs collected from Hallormsstadur) had Provenance as a random factor with 15 replications within each provenance but no blocks. The “glmer” and “ranef” functions in the lme4 package [30], “glm” and “anova” from the stats package [32] and “Anova” from the car package [33] were used to calculate the significance of factors and predict values for the provenances. Q–Q plots were acceptable for all binomial variables. All values presented in the results section are best linear unbiased predicted (BLUP) values except Table 2 which are mean values. Predicted values from the logit model were back-transformed to per cent frost damaged scions before being presented as result values.
3. Results
3.1. Phenology
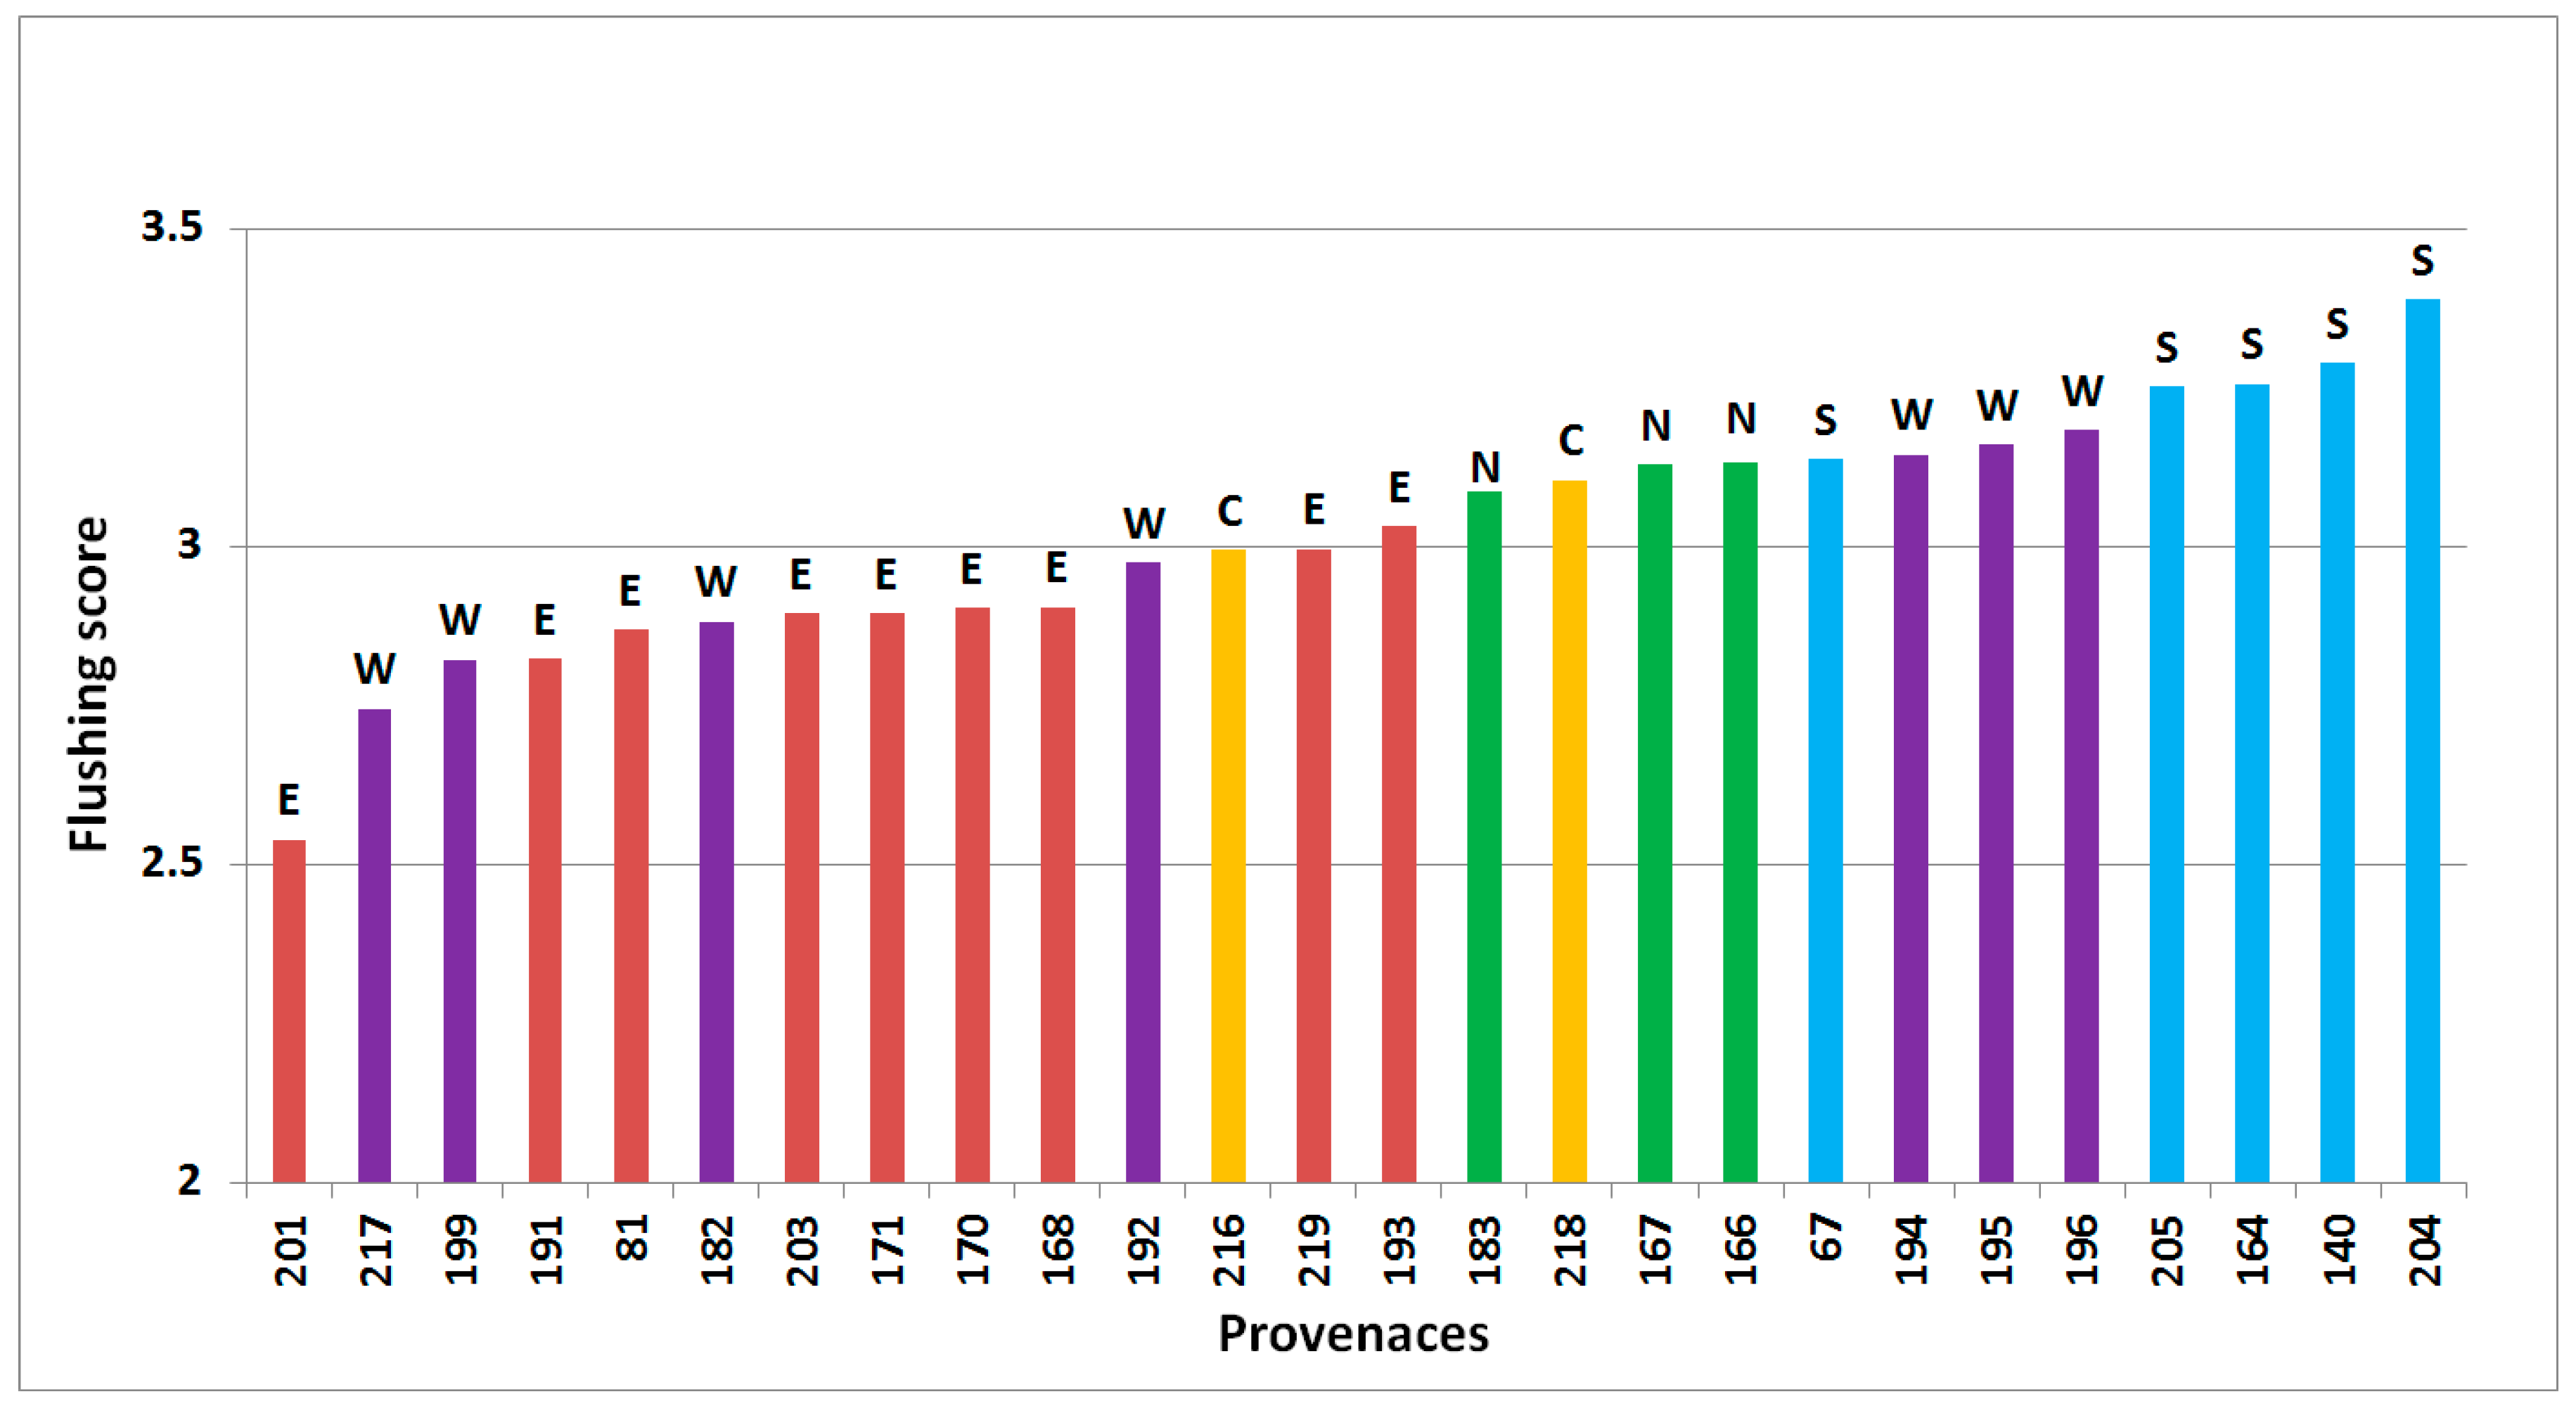
Time of flushing varied significantly between site, provenance, block within site and interaction between site and provenance with p < 0.001 (Figure 1). Flushing scores (scale developed by Langlet [24]) by provenance were significantly correlated across sites (p < 0.05, Pearson’s correlation coefficients 0.31 to 0.82) with one exception, between Hallormsstadur and Thorsø. No single provenance was a clear outlier.
Bud set was significantly different between all tested factors of site, block within site, time of assessment within site, provenance and interaction between site and provenance (all p < 0.001, Figure 2). The Pearson’s correlation coefficients between provenances means across sites and time of assessment were significant (p < 0.05) and varied from 0.71 to 0.92.
3.2. Survival
Overall average survival in Hallormsstadur for all provenances was down to 41% by 2011 (12 growing seasons after establishment). In the three Danish field trials the survival rate was much higher than in Hallormsstadur. Hønning showed the lowest survival rate with an average of 88 % (10 growing seasons after establishment).
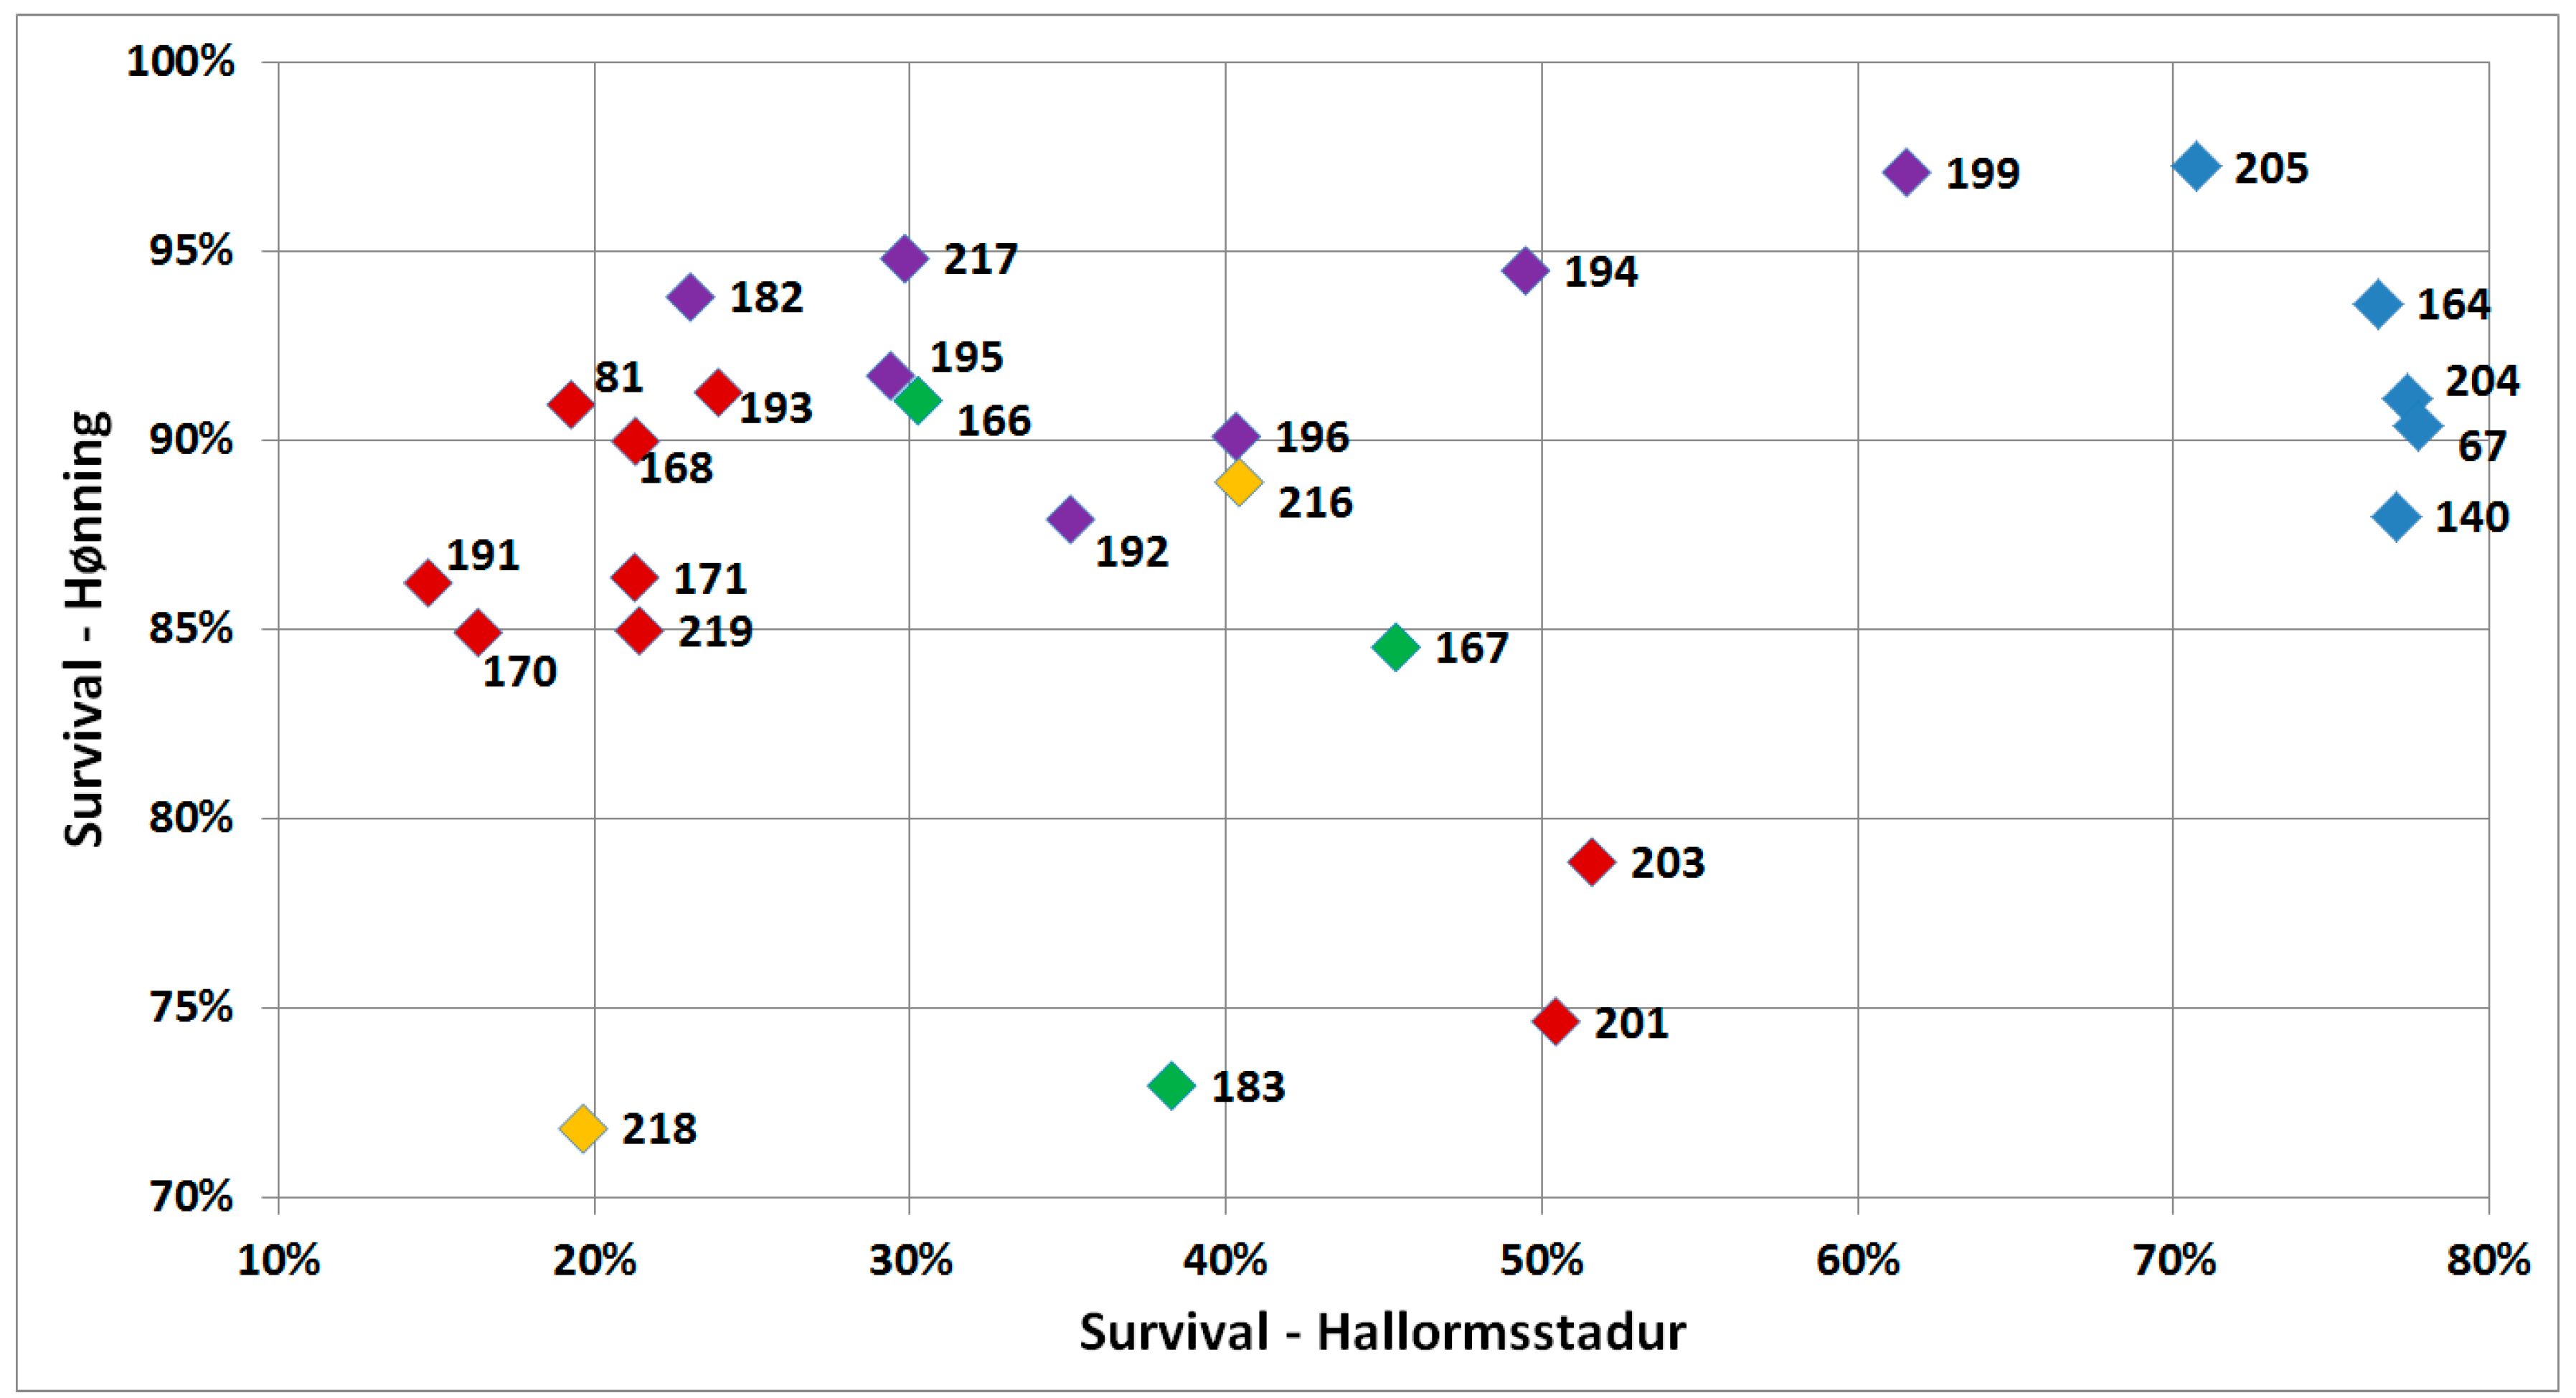
Differences in survival between provenances were highly significant (p < 0.001) within the sites, Hallormsstadur and Hønning. However, survival was not significantly correlated (r = 0.24, p = 0.244) between the sites (Figure 3). The southernmost provenances of corkbark fir, showed the highest survival rates in Hallormsstadur, while the eastern group showed the lowest survival rate with the except of the two southeastern provenances Nos. 201 and 203 from Utah and Wyoming. These two provenances (201 and 203) showed on the other hand poorest survival in Hønning together with No. 183 from Alaska and No. 218 from British Columbia (Figure 3).
3.3. Freezing Tests
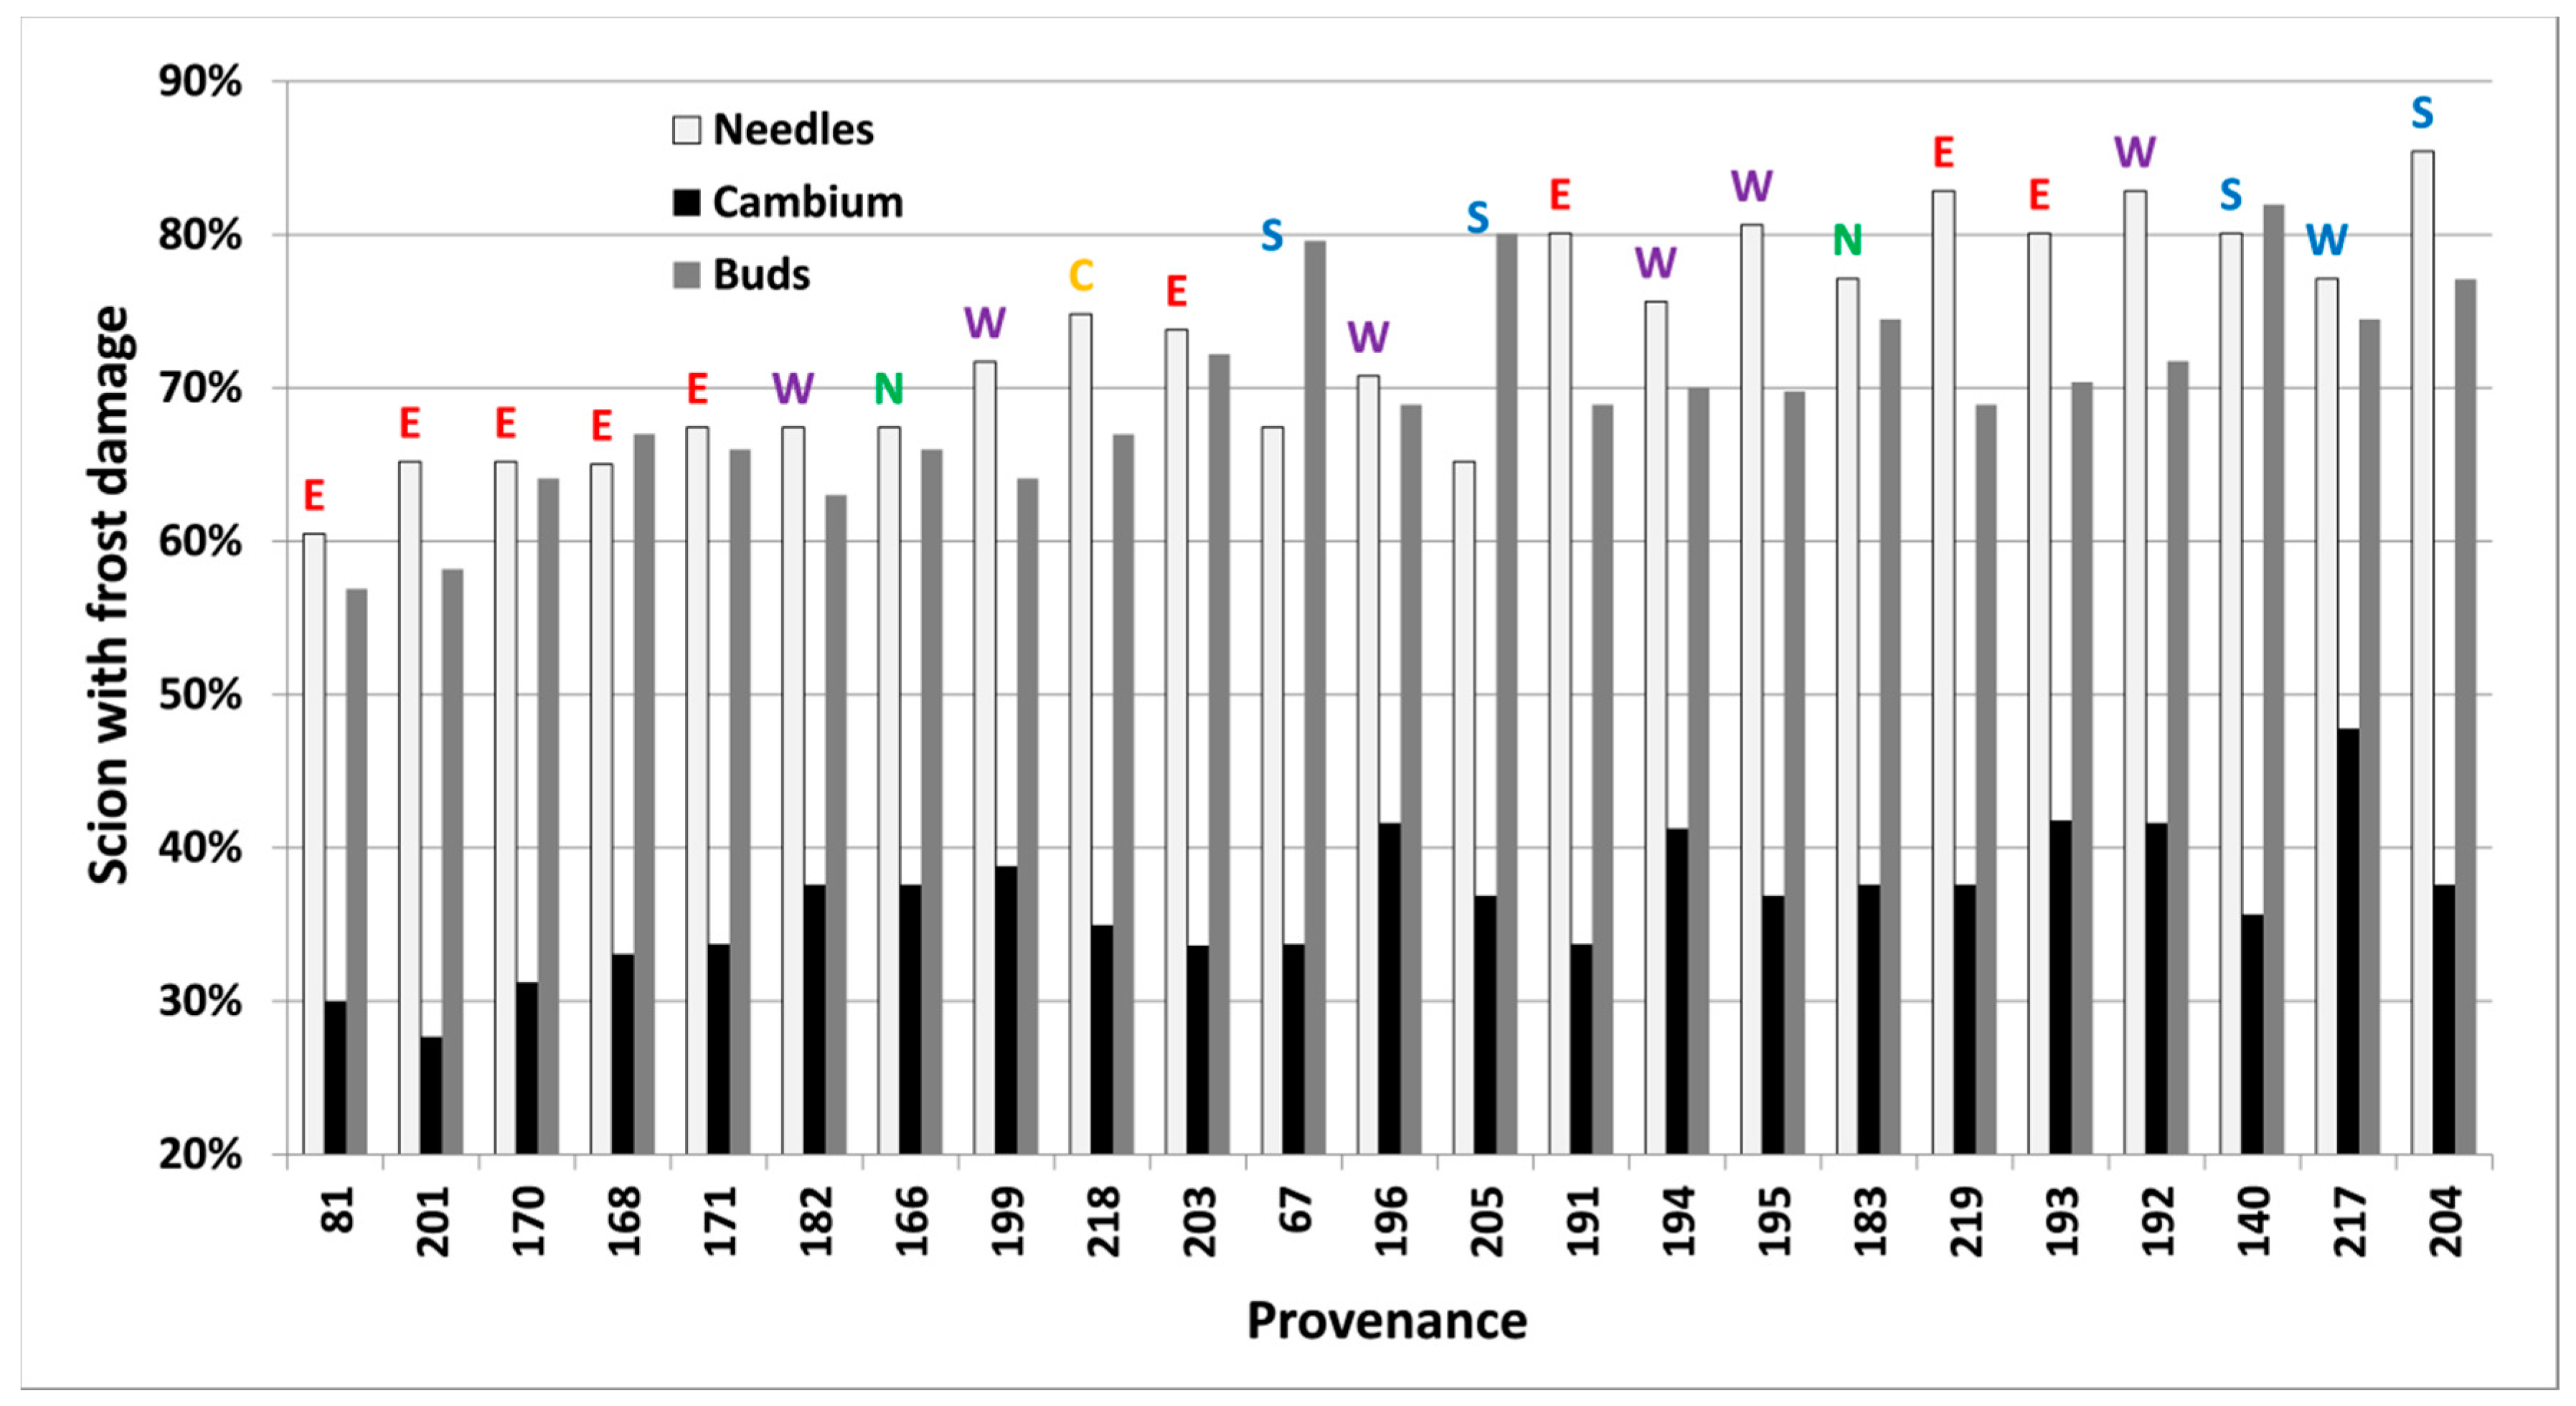
Frost damage both in spring and autumn differed significantly (p < 0.05) between provenances, freezing temperatures and types of tissue in each freezing test. Buds were less frost resistant than needles and cambium in the autumn of 2012. Results closest to 50% within each test (Table 2, bold letters) were used to rank provenances further (Figure 4 and Figure 5).
3.4. Correlations
Correlation of frost damage in the spring (Table 3) between various tissue types was positive but not always significant (p < 0.05). Flushing and freezing damage on buds was positive and significantly correlated (p < 0.05), indicating that early flushing increases the risk of frost damage on buds in the late spring. Provenances that flush early also showed significantly higher survival rates (p < 0.05) in Hallormsstadur, indicating that spring frost damage was not responsible for the mortality in the field tests. Provenances from higher elevations flushed earlier and had more frost damage on their buds.
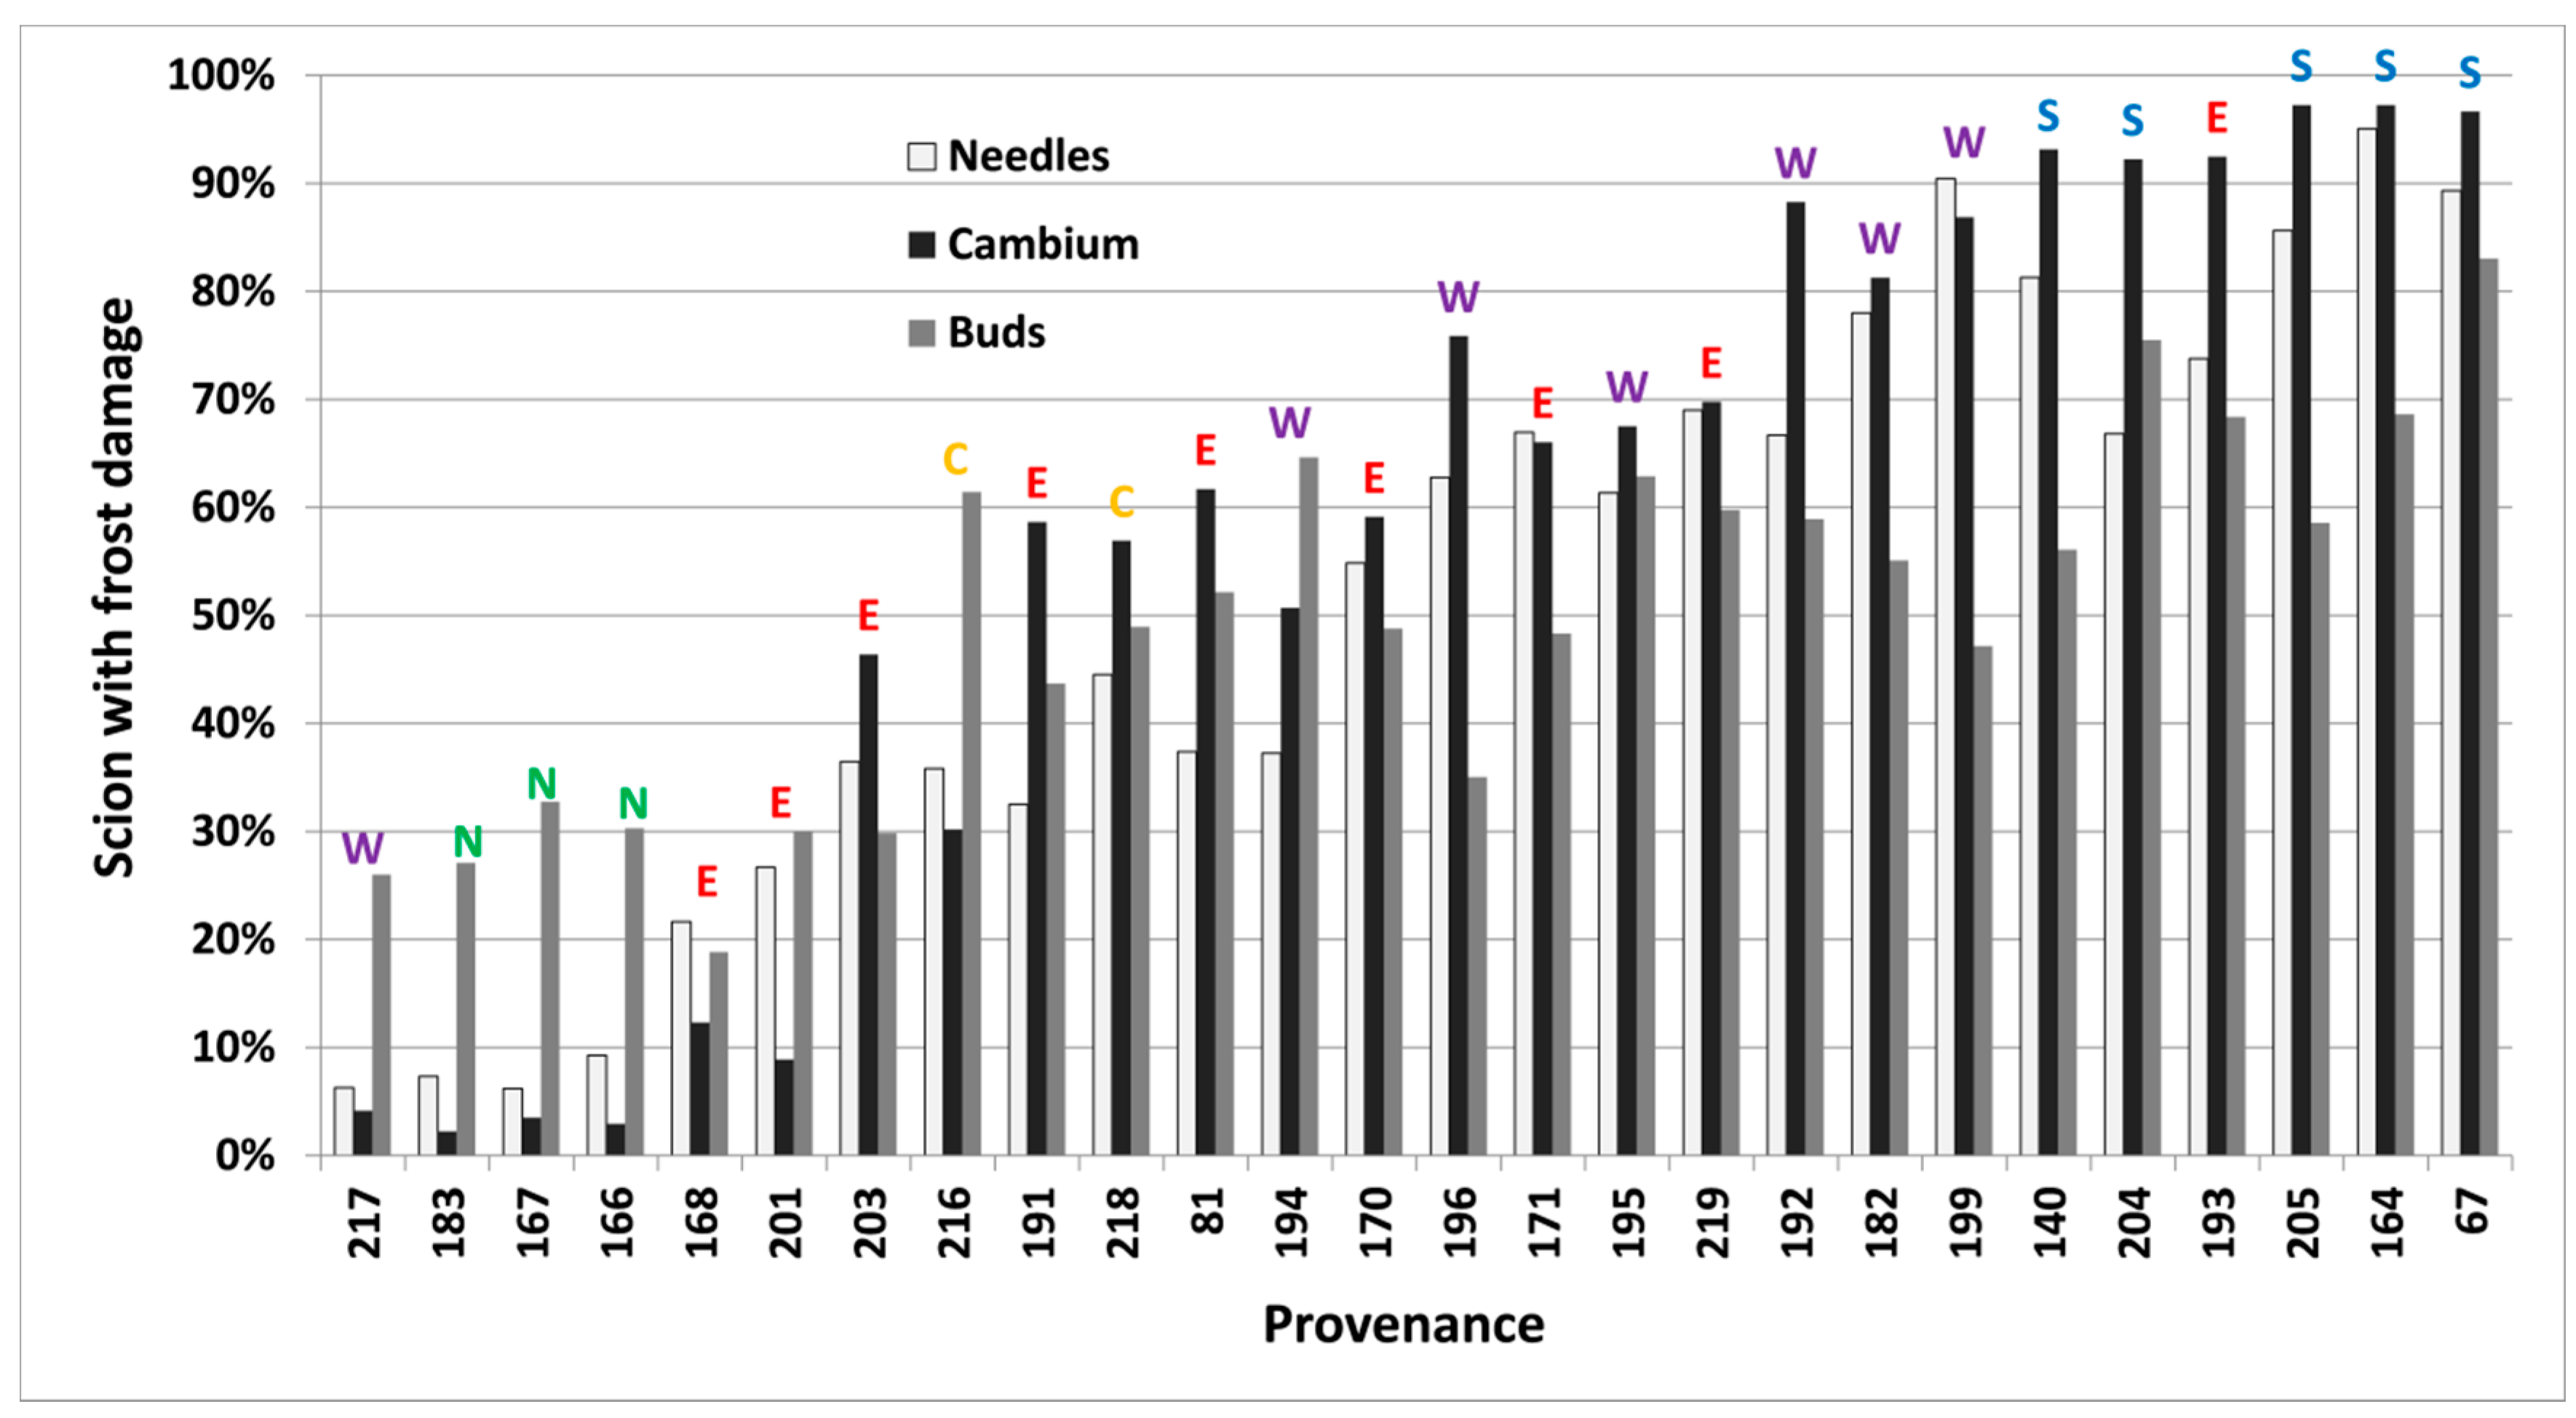
Frost damage on various tissue types in the autumn of 2012 (Table 4) were all significantly correlated (p < 0.05). The damage on all tissue types was also significantly and negatively correlated with bud set as expected (earlier bud set results in less autumn frost damage). Provenances originating from high latitudes showed significantly less frost damage in autumn and earlier bud set. Surprisingly, survival at both sites had a positive correlation with tissue damage and negative correlation with bud set, indicating that autumn frost hardiness is not an important characteristic for survival in Hallormsstadur and Hønning. Bud set and frost damage in all tissue types in autumn showed a high correlation with latitude, longitude and elevation, indicating that northern provenances have early bud set and high freezing tolerance in autumn.
4. Discussion
4.1. Methods and Assessment
The timing and methods employed in freezing tests are critical to the possibility of ranking the provenances based on frost resistance in spring and autumn. In full dormancy, subalpine fir tolerates much lower temperatures than can be expected in Iceland and Denmark [16], but in the active growing period it only tolerates a few degrees below freezing [34]. When the goal of the testing is to rank the provenances, it is desirable to use data for which the mean is closest to 50% of the twigs damaged, in order to obtain the maximum resolution of measurements using the scale. The analyzed freezing tests in the spring of 2001 and autumn of 2012 showed results with an average close to 50% damage, especially in the autumn (Table 2). Because a control was not included in the freezing test in 2001, some minor older damage on some scions before freezing cannot be precluded.
Flushing and bud set were assessed directly on the trees in the field, but for practical reasons twigs from trees in the field were used in artificial freezing to study frost tolerance in spring and autumn. Vitasse and Basler [35] compared budburst in adult trees, seedlings and twigs of three tree species (Carpinus betulus L., Acer pseudoplatanus L., Fagus sylvatica L.). They found that the twigs were better surrogates than juvenile trees to assess the phenology of adult trees, but all three methods gave similar results. Cold hardiness is under strong genetic control. It is common to use relative methods to screen for cold hardiness and it is considered to have a high correlation with field performance [36]. For instance, twigs were used by Basler and Körner [37] in a study of budburst in 14 temperate forest tree species in growth chambers. Eysteinsson et al. [38] used twigs to rank provenances of four species of larch (Larix sukaczewii Dyl., L. sibirica Ledeb., L. gmelinii Rupr. and L. cajanderi Mayr.) for cold hardiness in spring and autumn. Beuker et al. [39] used twigs to map seasonal variation in frost hardiness in various provenances of Scots pine (Pinus sylvestris L.) and Norway spruce (Picea abies (L.) Karst.) and Nielsen [40] also used twigs when testing for cold hardiness for various provenances of Nordmann fir (Abies nordmanniana).
4.2. Bud Set and Autumn Frost Hardiness
A significant relationship was found between bud set and frost damage to various tissue types in autumn (Table 4). All data from the autumn showed clear differences between provenances and an obvious geographical cline. The provenances originating from higher latitudes and lower temperatures in winter showed earlier bud set and increasing autumn frost hardiness. This is a general tendency in North American tree species where the northernmost areas are coldest with short growing seasons and the earliest bud set [41]. This relationship between latitude, low winter temperatures and time of bud set is common in the boreal zone among conifers with large distribution areas, for example Douglas fir (Pseudotsuga menziesii Mirb.) [42], Lodgepole pine (Pinus contorta Dougl. var. latifolia Engelm.) [43] and Siberian larch (Larix sibirica) [38]. Generally, needles and cambium were hardier than buds in both tests (Table 2). Burr et al. [44] found a similar pattern for ponderosa pine (Pinus ponderosa P. and C. Lawson), Douglas fir and Engelmann spruce (Picea engelmannii Parry ex Engelm.) where buds were consistently the least cold hardy of the three tissue types. Sakai and Weiser [41] found the winter hardiness of buds of subalpine fir and white fir (Abies concolor (Gordon) Lindl. ex Hildebr.) only reached −40 °C, but corresponding tolerance for needles and cambium was below −80 °C. Ranking of tissue types by cold hardiness may vary during the annual growth cycle and it is important to assess these separately [41,45]. Early bud set might be an essential characteristic in interior areas of Iceland where the growing season is short and first frosts occur early. Early autumn frosts should be less of a problem in Denmark than in Iceland because the growing season is typically longer with exception for unusual frost exposed areas.
4.3. Flushing and Spring Frost Hardiness
Compared to other fir species, subalpine fir is known for early budbreak and is easily damaged by late frosts in spring, especially in an environment with fluctuating winter temperatures [46,47]. In the oceanic climates of Iceland and Denmark, an unseasonable flushing with high risks of spring frost damage would be expected because of high winter temperatures when compared to the climate to which subalpine fir is adapted [11]. The correlation between spring frost tolerance and flushing was positive, but only significant for damage on the buds. Later freezing might have produced greater differences in frost damage between provenances. The result for flushing and spring frost damage showed less difference between provenances compared to the results for bud set and autumn frost damage. Barney et al. [48] assessed flushing dates on both common subalpine fir (var. lasiocarpa) and corkbark fir (var. arizonica) for three years. They found that the former broke bud less than 1.5 days earlier than corkbark fir, indicating only a small difference between the two. In our study, the corkbark fir provenances flushed first, then three provenances originating from Okanogan N.F. in the Cascade Range and thereafter the northern group. Provenance No. 201 flushed latest and was the most frost tolerant in the spring for all tissue types.
Generally, cold hardiness and bud set phenology in autumn show stronger population differentiation and clines along provenance thermal gradients with less phenotypic plasticity than flushing and spring frost tolerance [13,49,50,51]. Flushing is dependent upon the interaction of the accumulation of cold sums and temperature sums above a specific threshold value. Critical temperature sums and thresholds for flushing vary among species and populations within the species [47,51,52]. Photoperiod length may also influence the timing of flushing [37]. Worrall [47] studied flushing in subalpine fir at various elevations and found that both the required heat sum and threshold value for flushing is low for this species. He also found that the threshold values are lower in populations from high elevations (2.4 °C) as compared to populations from low elevations (2.8 °C) in the same region. Green [53] also found subalpine fir from high elevations flushed earlier than populations from lower elevations, when they were exposed to the same temperatures. Low threshold values with changing elevations is important in oceanic climates similar to those in Iceland and Denmark, where temperatures in late winter commonly fluctuate between 0 and 5 °C. Green [53,54] compared flushing and growth in interior spruces (white spruce and Engelmann spruce), lodgepole pine and subalpine fir from various elevations, cultivated in greenhouses and in the field. The timing of growth initiation for subalpine fir was intermediate between lodgepole pine (earliest) and interior spruce in the field, but similar to interior spruce when cultivated in a greenhouse. Higher temperature sums were required for flushing in the greenhouse than in the field for subalpine fir, indicating photoperiodic control of flushing for the species. Basler and Körner [37] also found an effect of long day treatment of silver fir (Abies alba Mill.) on early flushing. Requirements for chilling may delay flushing in many boreal tree species when winter temperatures become warmer or when a tree species or provenance is moved into a new environment with warmer winter temperatures [51,52,55]. Harrington and Gould [56] studied chilling requirements of Pacific Northwest tree species and found Pacific silver fir (Abies amabilis Douglas ex J.Forbes), grand fir (Abies grandis (Douglas ex D.Don) Lindl.) and noble fir all had obligate chilling requirements. The same may apply to subalpine fir.
The variation in spring frost tolerance in subalpine fir based on our study and the discussion above reflects complex patterns of local adaption in spring. New freezing tests done in the spring after 50–70 degree days (>5 °C) with shorter intervals between freezing temperatures might identify further differences between and within provenances that makes selection and breeding for this important characteristic more effective.
4.4. Frost Hardiness and Survival
Surprisingly, provenances demonstrating frost hardiness in the late spring or early autumn did not show higher survival rates in either Hallormsstadur or Hønning. A crown shelter of Siberian larch at Hallormsstadur may have prevented frost damage in the trial plants. The field trials in both countries might have avoided from early autumn frosts during the test period or the interplay between high winter temperatures and damaging spring frosts. The relationship between survival and spring frost hardiness may be different in even more oceanic climates. There may also be a positive correlation between survival and autumn frost hardiness when the growing period is shorter, with earlier autumn frost or at more frost exposed sites than at our test sites. Varying chilling requirements of the provenances were not tested in this research, but could prove an important factor for avoiding premature flushing in winter in areas with oceanic climates.
Survival in refugia in the past and migration pathways after the last glacial retreat may be important factors in forming populations with differing characteristics. The results in our trials for survival, flushing and bud set showed similar geographical groupings as those found by Hansen et al. [15]. There were also similarities with the division into refugia done by Roberts and Hamann [14]. Taken together, this indicates that the selection of favorable genetic material for use in Iceland and Denmark should concentrate on geographical groups of provenances from certain refugia rather than frost hardiness in spring and autumn. The western provenances from Washington state are recommended for Denmark and the southern provenances from the mountains in New Mexico and Arizona are recommended for Iceland.
5. Conclusions
There was a clear geographical grouping of provenances by flushing, bud set, survival and autumn frost tolerance. The northernmost provenances showed early bud set and greatest autumn frost tolerance. There was a consistent significant correlation between autumn frost tolerance in all tissue types and bud set. Grouping of provenances and correlations between flushing and spring frost tolerance were less defined than results from the autumn. The survival rates in Hallormsstadur and Hønning were not significantly correlated and provenances showing sensitivity for spring or autumn frosts did not show any signs of higher mortality at either site in this study than did more frost hardy provenances.
Acknowledgments
The field trials planted in 1999 were partially financed by Nordic Forest Research (SNS). Further financing was supplied by Danish Forest and Landscape Research Institute, Danish Forest and Nature Agency, the Production Fee Foundation for Christmas trees and Greenery in Denmark, Icelandic Forest Service, Icelandic Research Council (Rannis) and the Agricultural Productivity Fund of Iceland (Framleiðnisjóður Landbúnaðarins). Thanks to Þorbergur Hjalti Jónsson for suggesting revisions in the paper at early stages and also to Sherry Curl for a number of valuable comments and grammatical corrections. Thanks to Øyvind Meland Edvardsen for contribution in designing the field trial in Iceland and contribution in the earlier freezing test. Thanks to the Danish Nature Agency for hosting the field trials in Denmark during the last 16 years and the Iceland Forest Service at Hallormsstadur for hosting the field trial in Iceland.
Author Contributions
U.B.N. and O.K.H. conceived, designed and measured the trials in Denmark while B.S. contributed in the same processes in the Icelandic trial. B.S. collected scions and was responsible for the freezing tests. The paper is part of a PhD study where B.S. analyzed the data and wrote the paper with contribution and assistance from U.B.N. and O.K.H. as supervisors.
Conflicts of Interest
The authors declare no conflict of interest.
References
- Lange, J. Kulturplanternes Indførselshistorie i Danmark: Indtil Midten af 1900-Tallet; DSR Forlag: Fredriksberg, Denmark, 1999; ISBN 9788774324041. (In Danish) [Google Scholar]
- Christensen, K.I. Nåletræer I Danmark og Norden-en Bestemmelseshåndbog; Dansk Dendrologisk Forening: Copenhagen, Denmark, 2009; ISBN 9788799354801. (In Danish) [Google Scholar]
- Blöndal, S.; Gunnarsson, S.B. Íslandsskógar: Hundrað ára; Mál og mynd: Reykjavík, Iceland, 1999; ISBN 9979939982. (In Icelandic) [Google Scholar]
- Christensen, M.; Emborg, J. Biodiversity in natural versus managed forest in Denmark. For. Ecol. Manag. 1996, 85, 47–51. [Google Scholar] [CrossRef]
- Kjær, E.D.; Lobo, A.; Myking, T. The role of exotic tree species in Nordic forestry. Scand. J. For. Res. 2014, 29, 323–332. [Google Scholar] [CrossRef]
- Jakobsen, F. Juletræer og klippegrønt. In Skoven og Dens Dyrkning; Henriksen, H.A., Ed.; Dansk Skovforening: Copenhagen, Denmark, 1988; pp. 607–636. ISBN 9788717059375. (In Danish) [Google Scholar]
- Larsen, J.B.; Nielsen, U.B.; Møller, I.S. Nordmannsgran—Proveniensvariation, forædling og frøkildevalg. In Træarts—og Proveniensvalget i et Bæredygtigt Skovbrug; Larsen, J.B., Ed.; Dansk Skovforening: Copenhagen, Denmark, 1997; pp. 203–213. (In Danish) [Google Scholar]
- Nielsen, U.B. Genetic variation in characters important for noble fir greenery production. Scand. J. For. Res. 2007, 22, 99–109. [Google Scholar] [CrossRef]
- Madsen, S.F.; Sigurgeirsson, A. Abies lasiocarpa/a promising species for Christmas tree production. In Inter-Nordic Research Programme; A report by the SNS Nordic-Network-Group for research and development of subalpine fir, Abies lasiocarpa, for the production of Christmas trees and greenery in the Nordic countries; SNS/Nordic Forest Research Co-operation Committee: Alnarp, Sweden, 1998. [Google Scholar]
- Alexander, R.R.; Shearer, R.C.; Shepperd, W.D. Silvical Characteristics of Subalpine Fir; General Technical Reports; RM-115; USDA Forest Service: Fort Collins, CO, USA, 1984.
- Thompson, R.S.; Anderson, K.H.; Bartlein, P.J. Atlas of Relations between Climatic Parameters and Distributions of Important Trees and Shrubs in North America. U.S. Available online: http://pubs.usgs.gov/pp/p1650-a/ (accessed on 5 March 2016).
- Langlet, O. Patterns and Terms of Intra-Specific Ecological Variability. Nature 1963, 200, 347–348. [Google Scholar] [CrossRef]
- Alberto, F.J.; Aitken, S.N.; Alia, R.; Gonzalez-Martinez, S.C.; Hänninen, H.; Kremer, A.; Lefevre, F.; Lenormand, T.; Yeaman, S.; Whetten, R.; et al. Potential for evolutionary responses to climate change evidence from tree populations. Glob. Chang. Biol. 2013, 19, 1645–1661. [Google Scholar] [CrossRef] [PubMed]
- Roberts, D.R.; Hamann, A. Glacial refugia and modern genetic diversity of 22 western North America tree species. Proc. R. Soc. B. 2015. [Google Scholar] [CrossRef] [PubMed]
- Hansen, O.K.; Nielsen, U.B.; Edvardsen, Ø.M.; Skulason, B.; Skage, J.-O. Nordic provenance trials with Abies lasiocarpa and Abies lasiocarpa var. arizonica: Three-year results. Scand. J. For. Res. 2004, 19, 112–126. [Google Scholar] [CrossRef]
- Bannister, P.; Neuner, G. Frost Resistance and the Distribution of Conifers. In Conifer Cold Hardiness; Bigras, F.J., Colombo, S.J., Eds.; Kluwer Academic Publisher: Boston, MA, USA, 2001; pp. 3–11. ISBN 9780792366362. [Google Scholar]
- Cannell, M.G.R.; Smith, R.I. Spring frost damage on young Picea sitchensis. 2. Predicted dates of budburst and probability of frost damage. Forestry 1984, 57, 177–197. [Google Scholar] [CrossRef]
- Cannell, M.G.R.; Sheppard, L.J.; Smith, R.I.; Murray, M.B. Autumn frost damage on young Picea sitchensis. 2. Shoot frost hardening, and the probability of frost damage in Scotland. Forestry 1985, 58, 145–166. [Google Scholar] [CrossRef]
- Timmis, R.; Flewelling, J.; Talbert, C. Frost injury prediction model for Douglas-fir seedlings in the Pacific Northwest. Tree Physiol. 1994, 14, 855–869. [Google Scholar] [CrossRef] [PubMed]
- Einarsson, M.A. Climate of Iceland. In World Survey of Climatology. Climates of the Oceans; van Loon, H., Ed.; Elsevier: Amsterdam, The Netherlands, 1984; Volume 15, pp. 673–697. [Google Scholar]
- Eysteinsson, T.; Skulason, B. Adaptation of Siberian and Russian larch provenances to spring frosts and cold summers. Icel. Agric. Sci. 1995, 9, 91–97. [Google Scholar]
- Rasmussen, H.N.; Nielsen, C.C.N. Klima og frostskader i nobilis og nordmannsgran. Pyntegrønt Videnblade 2007, 5, 8–10. (In Danish) [Google Scholar]
- Nielsen, C.C.N.; Rasmussen, H.N. Frost hardening and dehardening in Abies procera and other conifers under differing temperature regimes and warm-spell treatments. Forestry 2009, 8, 43–59. [Google Scholar] [CrossRef]
- Langlet, O. Mellaneuropeiska granprovenienser i svenskt skogsbruk. Kungl. Skogs-Lantbruksakad. Tidskr. 1960, 5–6, 259–329. (In Norwegian) [Google Scholar]
- Johnsen, Ø.; Apeland, I. Screening early autumn frost hardiness among progenies from Norway spruce seed orchards. Silva Fenn. 1988, 22, 203–212. [Google Scholar] [CrossRef]
- Skrøppa, T. Within-population variation in autumn frost hardiness and its relationship to bud-set and height growth in Picea abies. Scand. J. For. Res. 1991, 6, 353–363. [Google Scholar] [CrossRef]
- Astronomical Applications Department of the U.S. Naval Observatory. Complete Sun and Moon Data for One Day. Available online: http://aa.usno.navy.mil/data/docs/RS_OneDay.php (accessed on 7 January 2016).
- Johnsen, Ø. Freeze-testing young Picea abies plants. A methodological study. Scand. J. For. Res. 1989, 4, 351–367. [Google Scholar] [CrossRef]
- R Core Team. R: A Language and Environment for Statistical Computing; R Foundation for Statistical Computing: Vienna, Austria, 2015. Available online: http://www.R-project.org/ (accessed on 3 March 2015).
- Bates, D.; Maechler, M.; Bolker, B.; Walker, S. Fitting Linear Mixed-Effects Models Using lme4. J. Stat. Softw. 2015, 67, 1–48. [Google Scholar] [CrossRef]
- Kuznetsova, A.; Brockhoff, P.B.; Christensen, R.H.B. LmerTest: Tests in Linear Mixed Effects Models. R package version 2.0-29. 2015. Available online: http://CRAN.R-project.org/package=lmerTest (accessed on 3 May 2016).
- R Core Team. Stats: The R Stats Package. R package version 3.1.3. Available online: http://www.R-project.org/ (accessed on 3 March 2015).
- Fox, J.; Weisberg, S. An R Companion to Applied Regression, 2nd ed.; Sage Publications: Thousand Oaks, CA, USA, 2011; ISBN 9781412975148. [Google Scholar]
- Bigras, F.J.; Ryyppö, A.; Lindström, A.; Stattin, E. Cold acclimation and deacclimation of shoots and roots of conifer seedlings. In Conifer Cold Hardiness; Bigras, F.J., Colombo, S.J., Eds.; Kluwer Academic Publisher: Boston, MA, USA, 2001; pp. 57–88. ISBN 9780792366362. [Google Scholar]
- Vitasse, Y.; Basler, D. Is the use of cuttings a good proxy to explore phenological responses of temperate forests in warming and photoperiod experiments? Tree Physiol. 2014. [Google Scholar] [CrossRef] [PubMed]
- Aitken, S.N.; Hannerz, M. Genecology and Gene Resource Management Strategies for Conifer Cold Hardiness. In Conifer Cold Hardiness; Bigras, F.J., Colombo, S.J., Eds.; Kluwer Academic Publisher: Boston, MA, USA, 2001; pp. 23–53. ISBN 9780792366362. [Google Scholar]
- Basler, D.; Körner, C. Photoperiod sensitivity of bud burst in 14 temperate forest tree species. Agric. For. Meteorol. 2012, 165, 73–81. [Google Scholar] [CrossRef]
- Eysteinsson, T.; Karlman, L.; Fries, A.; Martinsson, O.; Skulason, B. Variation in spring and autumn frost tolerance among provenances of Russian larches (Larix Mill.). Scand. J. For. Res. 2009, 24, 100–110. [Google Scholar] [CrossRef]
- Beuker, E.; Valtonen, E.; Repo, T. Seasonal variation in the frost hardiness of Scots pine and Norway spruce in old provenance experiments in Finland. For. Ecol. Manag. 1998, 107, 87–98. [Google Scholar] [CrossRef]
- Nielsen, U.B. Frysetest af Nordmannsgran Provenienser og Plustræafkom; Forskningscentret for Skov & Landskab: Copenhangen, Denmark, 2001. (In Danish) [Google Scholar]
- Sakai, A.; Weiser, D.J. Freezing resistance of trees in North America with reference to tree regions. Ecology 1973, 54, 118–126. [Google Scholar] [CrossRef]
- Campbell, R.K.; Sorensen, F.C. Cold-acclimation in seedling Douglas-fir related to phenology and provenance. Ecology 1973, 54, 1148–1151. [Google Scholar] [CrossRef]
- Lindgren, K.; Nilsson, J.-E. Cold acclimation of Pinus sylvestris and Pinus contorta provenances as measured by freezing tolerance of detached needles. Scand. J. For. Res. 1992, 7, 309–315. [Google Scholar] [CrossRef]
- Burr, K.E.; Tinus, R.W.; Wallner, S.J.; King, R.M. Comparison of three cold hardiness tests for conifer seedlings. Tree Physiol. 1990, 6, 351–369. [Google Scholar] [CrossRef] [PubMed]
- Glerum, C. Annual trends in frost hardiness and electrical impedance for seven coniferous species. Can. J. Plant Sci. 1973, 53, 881–889. [Google Scholar] [CrossRef]
- Jones, G.E.; Cregg, B.M. Budbreak and winter injury in exotic firs. HortScience 2006, 41, 143–148. [Google Scholar]
- Worrall, J. Temperature-bud-burst relationships in amabilis and subalpine fir provenance tests replicated at different elevations. Silvae Genet. 1983, 32, 203–209. [Google Scholar]
- Barney, D.L.; Beuer, M.; Jensen, J. Survival, frost susceptibility, growth, and disease resistance of corkbark and subalpine fir grown for landscape and Christmas trees. Horttechnology 2013, 23, 194–200. [Google Scholar]
- Howe, G.T.; Aitken, S.N.; Neale, D.B.; Jermstad, K.D.; Wheeler, N.C.; Chen, T.H.H. From genotype to phenotype: Unraveling the complexities of cold adaptation in forest trees. Can. J. Bot. 2003, 81, 1247–1266. [Google Scholar] [CrossRef]
- Savolainen, O.; Pyhajarvi, T.; Knurr, T. Gene flow and local adaptation in trees. Annu. Rev. Ecol. Evol. Syst. 2007, 38, 595–619. [Google Scholar] [CrossRef]
- Aitken, S.N.; Bemmels, J.B. Time to get moving: Assisted gene flow of forest trees. Evol. Appl. 2016, 9, 271–289. [Google Scholar] [CrossRef] [PubMed]
- Hänninen, H.; Tanino, K. Tree seasonality in a warming climate. Trends Plant Sci. 2011, 16, 312–416. [Google Scholar] [CrossRef] [PubMed]
- Green, D.S. Controls of growth phenology vary in seedlings of three, co-occurring ecologically distinct northern conifers. Tree Physiol. 2007, 27, 1197–1205. [Google Scholar] [CrossRef] [PubMed]
- Green, D.S. Adaptive strategies in seedlings of three co-occurring, ecologically distinct northern coniferous tree species across an elevational gradient. Can. J. For. Res. 2005, 35, 910–917. [Google Scholar] [CrossRef]
- Cannell, M.G.R.; Smith, R.I. Climatic warming, spring budburst and frost damage on trees. J. Appl. Ecol. 1986, 23, 177–191. [Google Scholar] [CrossRef]
- Harrington, C.A.; Gould, P.J. Tradeoffs between chilling and forcing in satisfying dormancy requirements for Pacific Northwest tree species. Front. Plant Sci. 2015, 6, 1–12. [Google Scholar] [CrossRef] [PubMed]
Figure 1.
Predicted flushing of 26 provenances of subalpine fir, based on assessment in Thorsø, Hallormsstadur (spring 2001), Hønning and Vilsbøl (spring 2010), arranged from latest flushing (left) to the earliest (right). Regional division according to Hansen et al. [15] is shown by colored bars and letters above bars (green/N = north, yellow/C = central, red/E = east, purple/W = west, blue/S = south).

Figure 2.
Predicted bud set of 26 provenances of subalpine fir, based on assessment in Thorsø and Hallormsstadur in the autumn of 2001, arranged from latest bud set (left) to the earliest (right). Regional division according to Hansen et al. [15] is shown by colored bars and letters above bars (green/N = north, yellow/C = central, red/E = east, purple/W = west, blue/S = south).
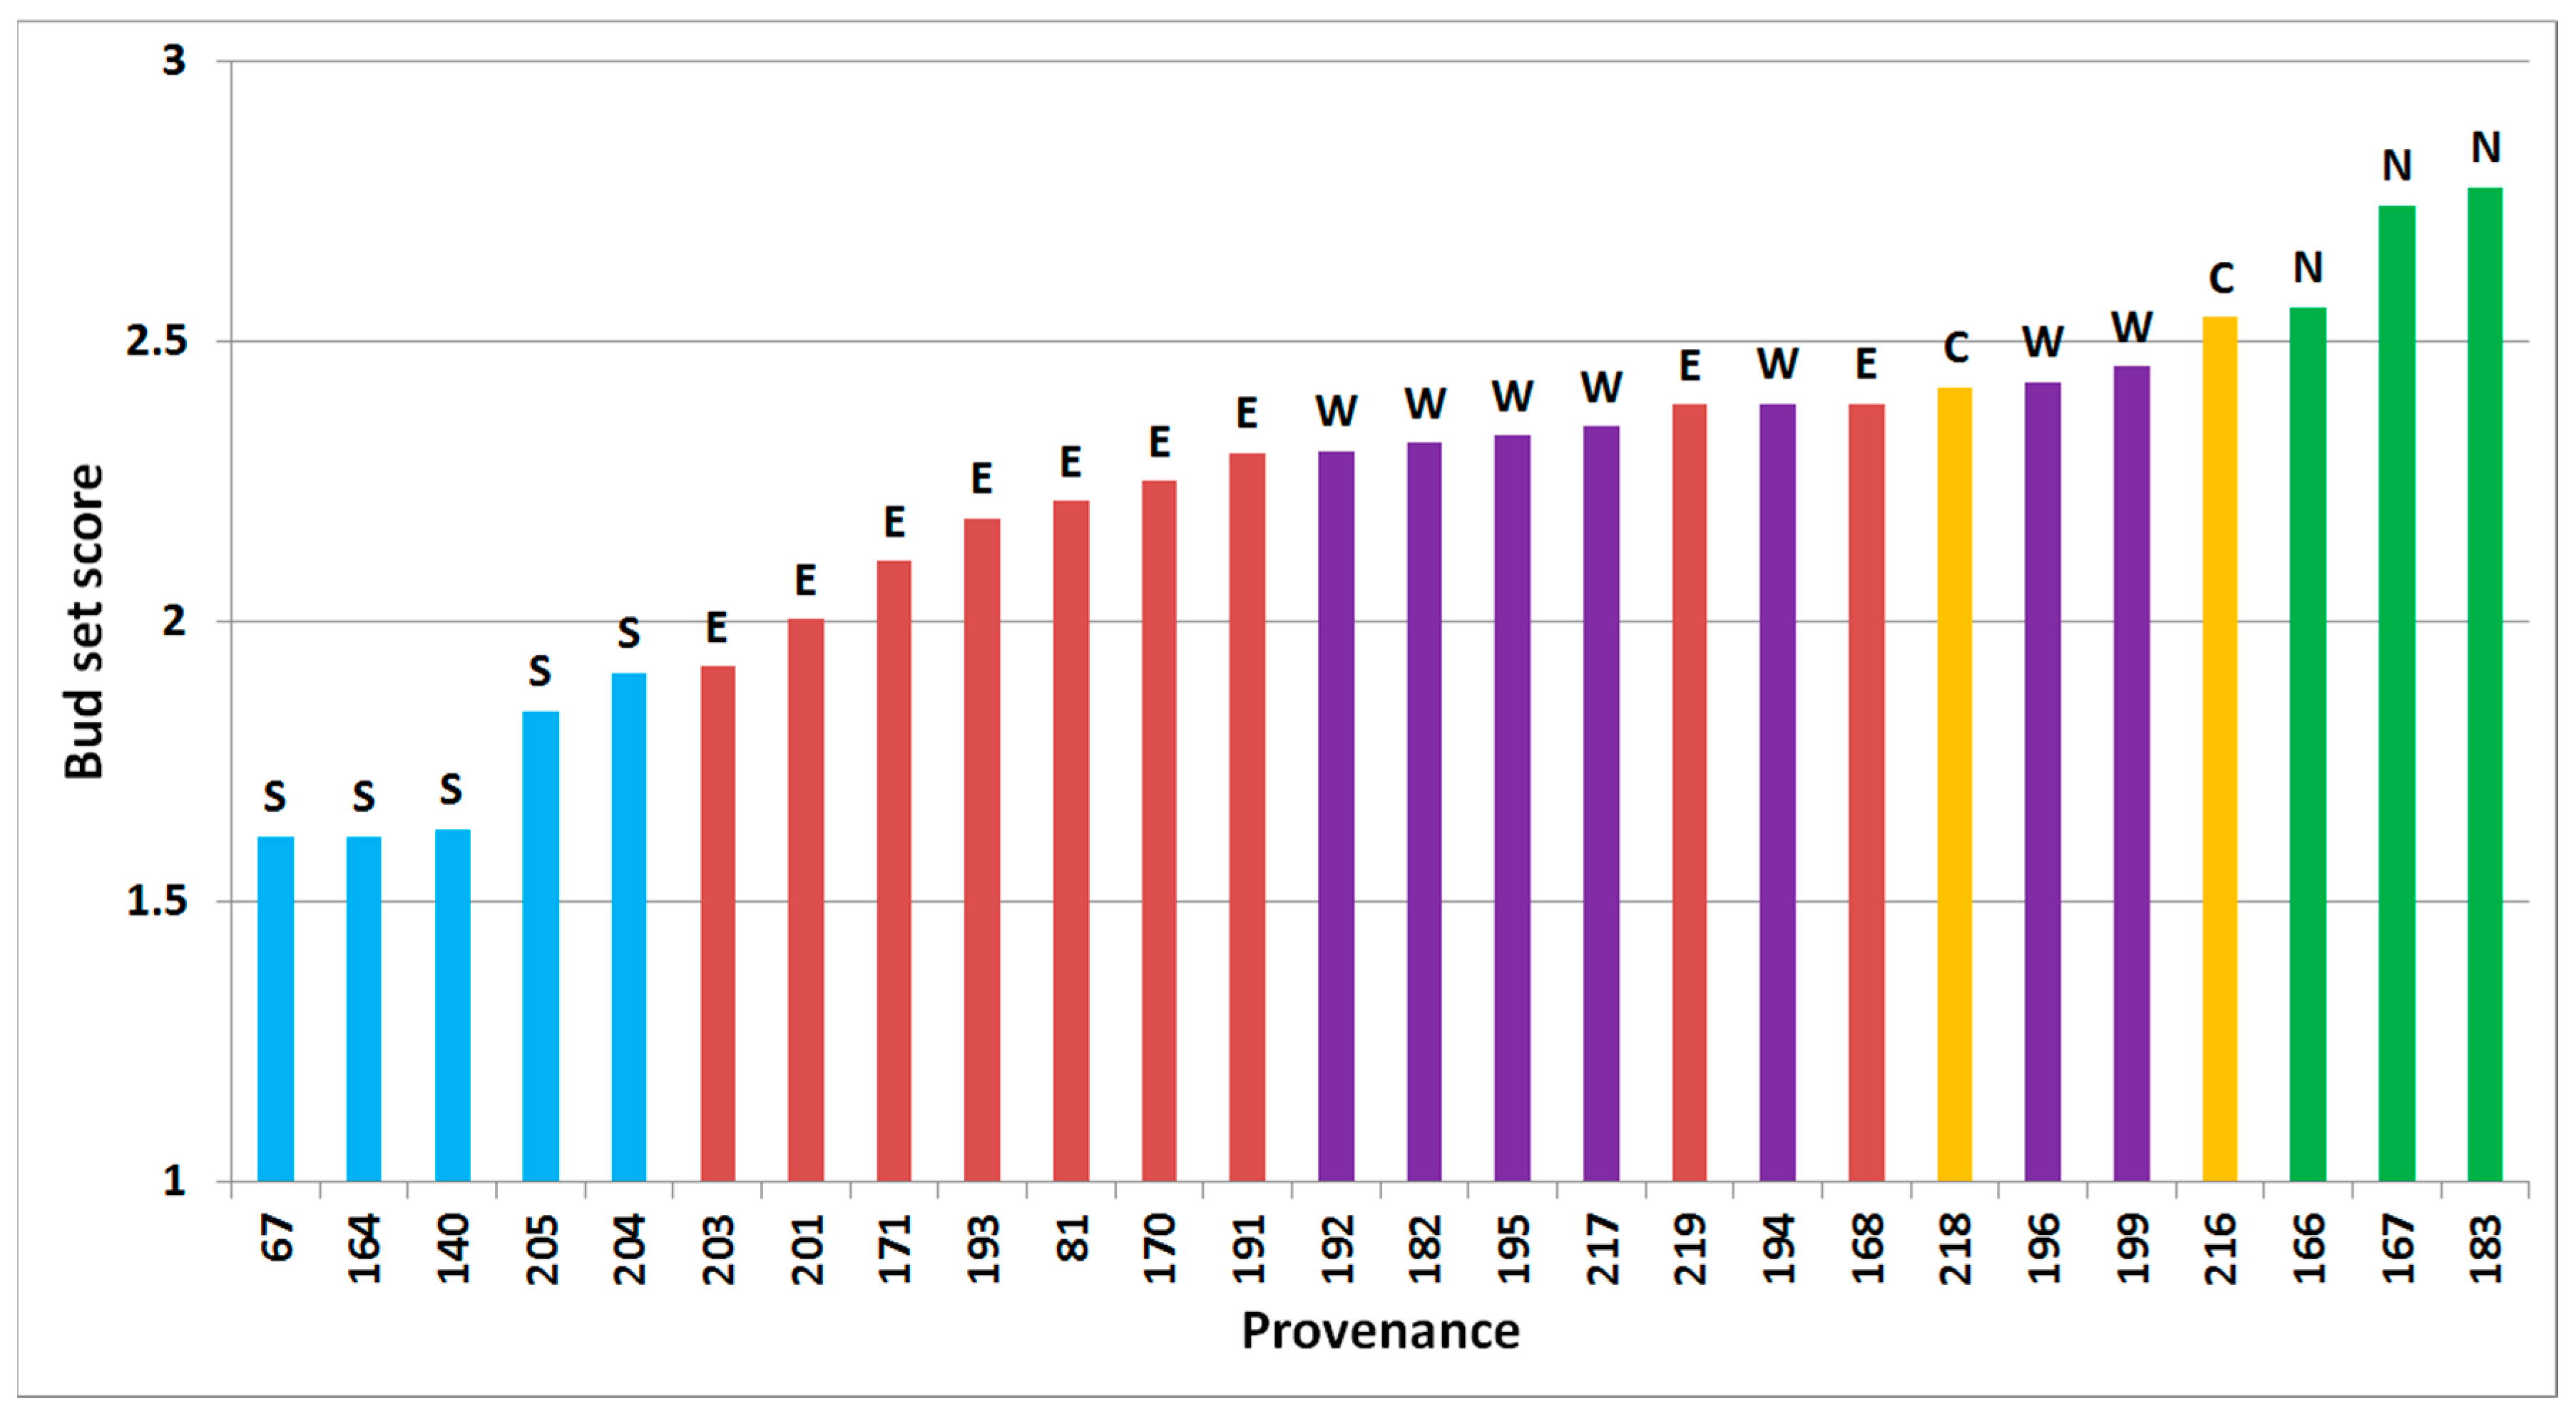
Figure 3.
Predicted survival of various provenances in the field trial in Hønning (10 years after establishment) plotted against survival in Hallormsstadur (12 years after establishment). Regional division according to Hansen et al. [15] is shown by colored symbols (Green = North, Yellow = Central, Red = East, Purple = West, Blue = South).

Figure 4.
Per cent of scions collected in 2001 in Hallormsstadur, with induced frost damage on needles, cambium and buds at −16 °C in spring, for 23 provenances of subalpine fir. Provenances are sorted by their lowest mean predicted proportion of damaged scions (left) across all tissue types to the highest (right). Regional division according to Hansen et al. [15] is shown by colored letters (green/N = north, yellow/C = central, red/E = east, purple/W = west, blue/S = south).

Figure 5.
Per cent of scions collected in 2012 in Vilsbøl, with induced frost damage on needles, cambium and buds (at −24 °C, −24 °C and −18 °C, respectively) in autumn, for 26 provenances of subalpine fir. Provenances are sorted by their lowest mean predicted proportion of damaged scions (left) across all tissue types to the highest (right). Regional division according to Hansen et al. [15] is shown by colored letters (green/N = north, yellow/C = central, red/E = east, purple/W = west, blue/S = south).


Table 1.
The twenty-six provenances included in the joint Nordic provenance test. Provenances are listed in order of latitude, with the most northern provenances at the top. Provenance reference numbers, states from the USA and provinces in Canada, regional division according to Hansen et al. [15], latitude, longitude, elevation above sea level and provenance name are also shown. The provenances from New Mexico and Arizona are of the variety corkbark fir (Abies lasiocarpa var. arizonica).
| Provenance No. | State/Province | Regional Division | Latitude/Longitude | Elevation m a.s.l. | Locality/Provenance |
|---|---|---|---|---|---|
| 167 | Yukon | North | 61°50′/133°00′ | 900 | Canol Road |
| 183 | Alaska | North | 59°50′/135°30′ | 800 | Seed zone A16, Skagway |
| 166 | Br. Col. | North | 59°20′/133°45′ | 800 | Atlin |
| 217 | Br. Col. | West | 55°48′/129°10′ | 320 | White River |
| 168 | Br. Col. | East | 50°50′/119°45′ | 1400 | Adam’s Plateau |
| 218 | Br. Col. | Central | 50°43′/115°27′ | 1525 | Albert River |
| 216 | Br. Col | Central | 49°33′/118°31′ | 1970 | Blue Joint |
| 219 | Br. Col. | East | 49°14′/118°30′ | 1300 | (Name unknown) |
| 196 1 | Wash. | West | 48°37′/120°36′ | 2000 2 | Okanogan N.F., Mile Marker 172, Rt. 20 |
| 194 1 | Wash. | West | 48°29′/119°58′ | 1300 | Okanogan N.F., For. Rd. 42, Looploop Campg Rd. |
| 195 1 | Wash. | West | 48°26′/119°50′ | 1500 | Okanogan N.F., For. Rd. 42, Rt..20 |
| 191 1 | Montana | East | 48°10′/113°30′ | 1200 | Flathead N.F., West of Marias Pass |
| 170 | Montana | East | 48°00′/115°30′ | 1200 2 | Kootenai N.F. |
| 171 | Montana | East | 48°00′/114°15′ | 1100 2 | Flathead N.F. |
| 192 1 | Wash. | West | 47°55′/117°07′ | 1400 | Mount Spokane |
| 193 1 | Wash. | East | 47°55′/117°07′ | 1500 | Mount Spokane |
| 81 | Montana | East | 47°30′/113°30′ | 1800 2 | Flathead N.F., Hungry Horse |
| 199 1 | Wash. | West | 46°47′/121°40′ | 1200 2 | Mt. Rainier N.F., Before Stevens Creek Cross. |
| 182 | Wash. | West | 46°10′/122°15′ | 1300 | Seed zone 440, South-west of Mount St. Helens |
| 203 1 | Wyoming | East | 41°21′/106°32′ | 2400 | Medicine Bow N.F., East of F.S. Work Camp |
| 201 1 | Utah | East | 40°15′/112°00′ | 1500 2 | Wahsatch N.F., Rt. Cottonwood Canyon |
| 204 1 | New Mexico | South | 35°11′/106°25′ | 2900 | Cibola N.F., Sandria Crest |
| 205 1 | New Mexico | South | 35°15′/107°40′ | 2900 | Cibola N.F., Mount Taylor |
| 67 | Arizona | South | 34°00′/109°38′ | 3000 2 | Apache N.F., Hannagan Meadows |
| 140 | Arizona | South | 34°00′/109°38′ | 3000 2 | Apache N.F., Hannagan Meadows + Big Lake |
| 164 | Arizona | South | 34°00′/109°38′ | 3000 2 | Apache N.F., Hannagan Meadows + Big Lake |
1 Number of trees from which seed has been collected is five or fewer. 2 Approximate elevation.
Table 2.
Overall per cent of frost damage to twigs (mean values), depending on tissue type, date of freezing and test temperature. Results written in bold letters indicate the temperature for which data were used for further analyses to estimate freezing damage on various provenances.
Table 2.
Overall per cent of frost damage to twigs (mean values), depending on tissue type, date of freezing and test temperature. Results written in bold letters indicate the temperature for which data were used for further analyses to estimate freezing damage on various provenances.
| Freezing Date | Temperature | Needles % | Cambium % | Buds % |
|---|---|---|---|---|
| Spring 2001 7 May Iceland | −4 | 9.5 | 2.4 | 14.6 |
| −8 | 14.0 | 3.0 | 21.5 | |
| −12 | 22.2 | 3.5 | 28.9 | |
| −16 | 73.2 | 36.7 | 69.7 | |
| Autumn 2012 20 October Denmark | 4 | 1.0 | 1.0 | 1.2 |
| −6 | 0.5 | 0.5 | 0.5 | |
| −12 | 2.9 | 3.9 | 9.5 | |
| −18 | 21.5 | 29.8 | 50.2 | |
| −24 | 52.7 | 58.3 | 99.8 |
Table 3.
Pearson’s correlation coefficients between predicted frost damage for each provenance, tested in spring 2001 at −16 °C, flushing, survival in Hallormsstadur 2011, survival in Hønning 2008 and geographical locations (latitude, longitude and elevation). Bold values are statistically significant (p < 0.05).
| Needles −16 °C | Cambium −16 °C | Buds −16 °C | Flushing | |
|---|---|---|---|---|
| Cambium, −16 °C | 0.52 | |||
| Buds, −16 °C | 0.49 | 0.40 | ||
| Flushing | 0.35 | 0.27 | 0.67 | |
| Survival in Hallormsstadur | 0.11 | 0.04 | 0.63 | 0.50 |
| Survival in Hønning | −0.06 | 0.45 | 0.23 | 0.23 |
| Latitude | 0.01 | 0.32 | −0.40 | −0.27 |
| Longitude | 0.02 | 0.47 | −0.20 | −0.13 |
| Elevation | 0.01 | −0.26 | 0.54 | 0.56 |
Table 4.
Pearson’s correlation coefficients between predicted frost damage for each provenance tested in the autumn of 2012, predictions for bud set, predictions for survival in Hallormsstadur (Hall.) 2011, Hønning 2008 and geographical locations (latitude, longitude and elevation). Bold values are statistically significant (p < 0.05).
| Needles −24 °C | Cambium −24 °C | Buds −18 °C | Bud Set | Survival Hall. | Survival Hønning | |
|---|---|---|---|---|---|---|
| Cambium, −24 °C | 0.95 | |||||
| Buds, −18 °C | 0.73 | 0.78 | ||||
| Bud set | −0.63 | −0.62 | −0.50 | |||
| Survival in Hall. | 0.43 | 0.37 | 0.38 | −0.62 | ||
| Survival in Hønning | 0.42 | 0.42 | 0.38 | −0.19 | 0.24 | |
| Latitude | −0.74 | −0.72 | −0.59 | 0.93 | −0.68 | −0.22 |
| Longitude | −0.61 | −0.66 | −0.52 | 0.84 | −0.40 | −0.05 |
| Elevation | 0.63 | 0.64 | 0.57 | −0.82 | 0.75 | 0.17 |
© 2018 by the authors. Licensee MDPI, Basel, Switzerland. This article is an open access article distributed under the terms and conditions of the Creative Commons Attribution (CC BY) license (http://creativecommons.org/licenses/by/4.0/).
Share and Cite
MDPI and ACS Style
Skulason, B.; Hansen, O.K.; Nielsen, U.B. Provenance Variation in Phenology and Frost Tolerance in Subalpine Fir (Abies lasiocarpa) Planted in Denmark and Iceland. Forests 2018, 9, 17. https://doi.org/10.3390/f9010017
AMA Style
Skulason B, Hansen OK, Nielsen UB. Provenance Variation in Phenology and Frost Tolerance in Subalpine Fir (Abies lasiocarpa) Planted in Denmark and Iceland. Forests. 2018; 9(1):17. https://doi.org/10.3390/f9010017
Chicago/Turabian StyleSkulason, Brynjar, Ole Kim Hansen, and Ulrik Braüner Nielsen. 2018. "Provenance Variation in Phenology and Frost Tolerance in Subalpine Fir (Abies lasiocarpa) Planted in Denmark and Iceland" Forests 9, no. 1: 17. https://doi.org/10.3390/f9010017
Note that from the first issue of 2016, this journal uses article numbers instead of page numbers. See further details here.