Article

Seasonal Dynamics of Litterfall in a Sub-Alpine Spruce-Fir Forest on the Eastern Tibetan Plateau: Allometric Scaling Relationships Based on One Year of Observations

1
Long-Term Research Station of Alpine Forest Ecosystem, Key Laboratory of Ecological Forestry Engineering, Institute of Ecology and Forestry, Sichuan Agricultural University, Chengdu 611130, China
2
Collaborative Innovation Center of Ecological Security in the Upper Reaches of Yangtze River in Sichuan Province, Chengdu 611130, China
*
Author to whom correspondence should be addressed.
Forests 2017, 8(9), 314; https://doi.org/10.3390/f8090314
Submission received: 28 July 2017 / Revised: 17 August 2017 / Accepted: 25 August 2017 / Published: 26 August 2017

Abstract

:
Litterfall is the primary source of carbon and nutrients that determine soil fertility in forest ecosystems. Most current studies have focused on foliar litter, but the seasonal dynamics and allometric scaling relationships among different litter components (e.g., foliar litter, woody litter, reproductive litter, and epiphytic litter) are poorly understood. Here, we investigated the litter production of various litter components in a sub-alpine spruce-fir forest on the eastern Tibetan Plateau based on one year of observations (from August 2015 to July 2016). Our results showed that total litter production (LT) was 2380 kg·ha−1·year−1 (3% of the aboveground forest biomass), of which 73.6% was foliar litter (LF), 15.6% was woody litter (LW), 3.0% was reproductive litter (LR), 1.3% was epiphytic litter (LE), and 6.5% was miscellaneous material (LM). The total litterfall was bimodal (with peaks occurring in April and October) and was dominated by tree species (85.4% of LT, whereas shrubs accounted for 6.8% of LT). The litter production of evergreen species (68.4% of LT) was higher than that of deciduous species (23.8% of LT). Isometric relationships were observed between litter components and the total litter (i.e., LF∝LT0.99≈1 and LR∝LT0.98≈1), and allometric relationships were also found (i.e., LW∝LT1.40>1 and LM∝LT0.82<1). However, because some components did not exhibit obvious seasonal dynamics (i.e., LE), some relationships could not be expressed using allometric equations (i.e., LE versus LT, LF versus LE, LW versus LE, and LE versus LM). Thus, the different litter components showed different seasonal dynamics, and the total litter dynamics were primarily determined by the variation in foliar litter. In addition, the allometric relationships of the forest litterfall varied with the litter components, functional types (evergreen versus deciduous) and vertical structures (tree versus shrub). This study provides basic data and a new insight for future plant litter studies.

1. Introduction

Forest litterfall involves active carbon and nutrient fluxes and represents a key link between tree community composition and the soil [1]; its production and input patterns are important for maintaining the stability of forest ecosystem structure and function [2,3]. Moreover, the annual terrestrial total litter production (5.48 × 10⁹ t), which is 2.0% of the estimated worldwide total detrital soil organic matter [4], is directly related to material circulation and the energy flow of ecosystems [5,6]. Due to low temperatures and frequent geological disasters, coniferous forest ecosystems in high-altitude frigid regions have a thin mineral soil layer and poor soil development [7]; therefore, litterfall is the primary source of nutrients and energy for the soil [8]. However, due to the complex terrain and dynamic climate environment, information on the litter production of coniferous forests in high-altitude frigid regions is inconsistent.
Litter production is a major factor that determines the nutrient return of forest ecosystems [9], and its components affect the efficiency of material circulation [10], the rate of nutrient return [11], and litter decomposition through litter quality and dynamics [12,13]. Simultaneously, litter components show clear seasonal patterns in litter quantities [14]. For example, among deciduous trees, peak foliar litterfall occurs in autumn, peak flower litterfall occurs in spring or summer, peak fruit and seed litterfall occurs in summer and autumn, and peak twig litterfall occurs in spring and autumn [4,15], suggesting that the different organs vary in their response to climate [9,16]. However, in high-altitude frigid regions, litterfall may exhibit different seasonal dynamics mainly due to the short growing season and more complex climate [17,18]. Hence, the different litter components should differ in quantities and dynamics in high-altitude frigid forest ecosystems, but these factors have not received focused attention.
Significant seasonal patterns exist in different types of ecosystems and even for different tree species in the same ecosystems: the seasonal patterns of litterfall are unimodal, bimodal or irregular [9,14]. The seasonal dynamics of deciduous species are more obvious—peak litterfall usually occurs in autumn—whereas evergreen species generally do not show obvious seasonal dynamics [4,6]. However, different results have been observed for evergreen coniferous trees. For example, spruce-fir forest litterfall in the Xiaoxing’an Mountains is unimodal [19], Norway’s spruce forest litterfall is bimodal [20], and spruce-dominated and fir-dominated forests litterfall in the Wanglang Nature Reserve in western China are bimodal [17,18]. These field observations are clearly inconsistent, mostly due to climate factors (e.g., temperature, precipitation, snowfall or wind) or plant ecological characteristics (e.g., species, stand age) [6,8,14], and they result in large uncertainties regarding the temporal changes in coniferous forest litterfall, especially the dynamics among functional types (evergreen versus deciduous) and vertical structures (tree versus shrub).
Allometric relationships exist among different plant organs [21,22] and an allometric equation can summarize the relationship between two variables [23]. Allometric relationships provide a new conceptual understanding for litterfall studies [24]. Previous studies focused mostly on the allometric relationship between litter components, for example, litterfall production shows significant allometric relationships (isometric scaling: scaling exponent β = 1, positive allometric scaling: β > 1, negative allometric scaling: β < 1) among the different components [24,25]. However, all these scaling relationships do not consider the source of the litterfall, and hence, much remains unknown regarding the allometric relationships among different litterfall components, functional types (evergreen versus deciduous) and vertical structures (tree versus shrub).
In the high-altitude frigid region, the sub-alpine coniferous plant community has a clear vertical structure, including the tree layer, shrub layer, herb layer and moss layer [26], and it is dominated by the tree layer. In general, significant differences exist in the forest net primary productivity among the different layers [27], and the litter production of the tree layer is higher than that of the shrub and herb layers. However, few data are available for analysis of the litterfall dynamics of the vertical structure of coniferous forests, which limits the understanding of the spatial composition of litter sources. The spruce-fir forest accouts for the major vegetation type of the sub-alpine coniferous forest on the eastern Tibetan Plateau, a typical high-altitude frigid forest ecosystem, and it is an important ecological barrier in the source region of the Yangtze River Basin [28]. Although litterfall is the first phase of the biogeochemical cycle and returns nutrients to the soil [5], recent studies on litterfall have mainly focused on litter decomposition [29,30]. In contrast, few studies have examined the process and dynamics of litter production in this high-altitude frigid region. The aboveground litter production of 200-year-old fir-dominated forests in the high-altitude frigid region averaged 3483 kg·ha−1·year−1, whereas that of 350-year-old spruce-dominated forests in the same region averaged 1212 kg·ha−1·year−1 [17]. By contrast, the litter production and dynamics of spruce-fir forests are unknown. The existing research has focused on total litter quantity and litter dynamics, but the contributions of the litter components (e.g., foliar litter, woody litter, reproductive litter, and epiphytic litter), evergreen versus deciduous, and tree versus shrub to forest litterfall have not received the necessary attention. Moreover, the majority of current studies have focused on foliar litter, but the seasonal dynamics and allometric scaling relationships among the different litter components, functional types (evergreen versus deciduous) and vertical structures (tree versus shrub) are poorly understood, which has greatly precluded an accurate understanding of soil organic matter accumulation and the circulation of nutrients in high-altitude frigid forest ecosystems.
Based on the above-mentioned facts, we predicted that (1) the different litter components would show different seasonal dynamics, and foliar litter would account for the largest proportion of total litter production; (2) evergreen species should be the main source of forest litterfall, and the tree layer should dominate the seasonal dynamics of litterfall in the sub-alpine spruce-fir forest on the eastern Tibetan Plateau; and (3) the allometric relationships of the forest litterfall should be complex between the litter components, functional types (evergreen versus deciduous) and vertical structures (tree versus shrub). To test these hypotheses, we investigated litter production and dynamics using the litter trap method in a sub-alpine spruce-fir forest on the eastern Tibetan Plateau. Based on one year of observations, our objectives were (1) to quantify forest litterfall and its components; (2) to analyze the contribution and seasonal dynamics of litterfall among different litter components, functional types (evergreen versus deciduous) and vertical structures (tree versus shrub); and (3) to test the allometric relationships of litter production, which many previous studies have not addressed.

2. Materials and Methods
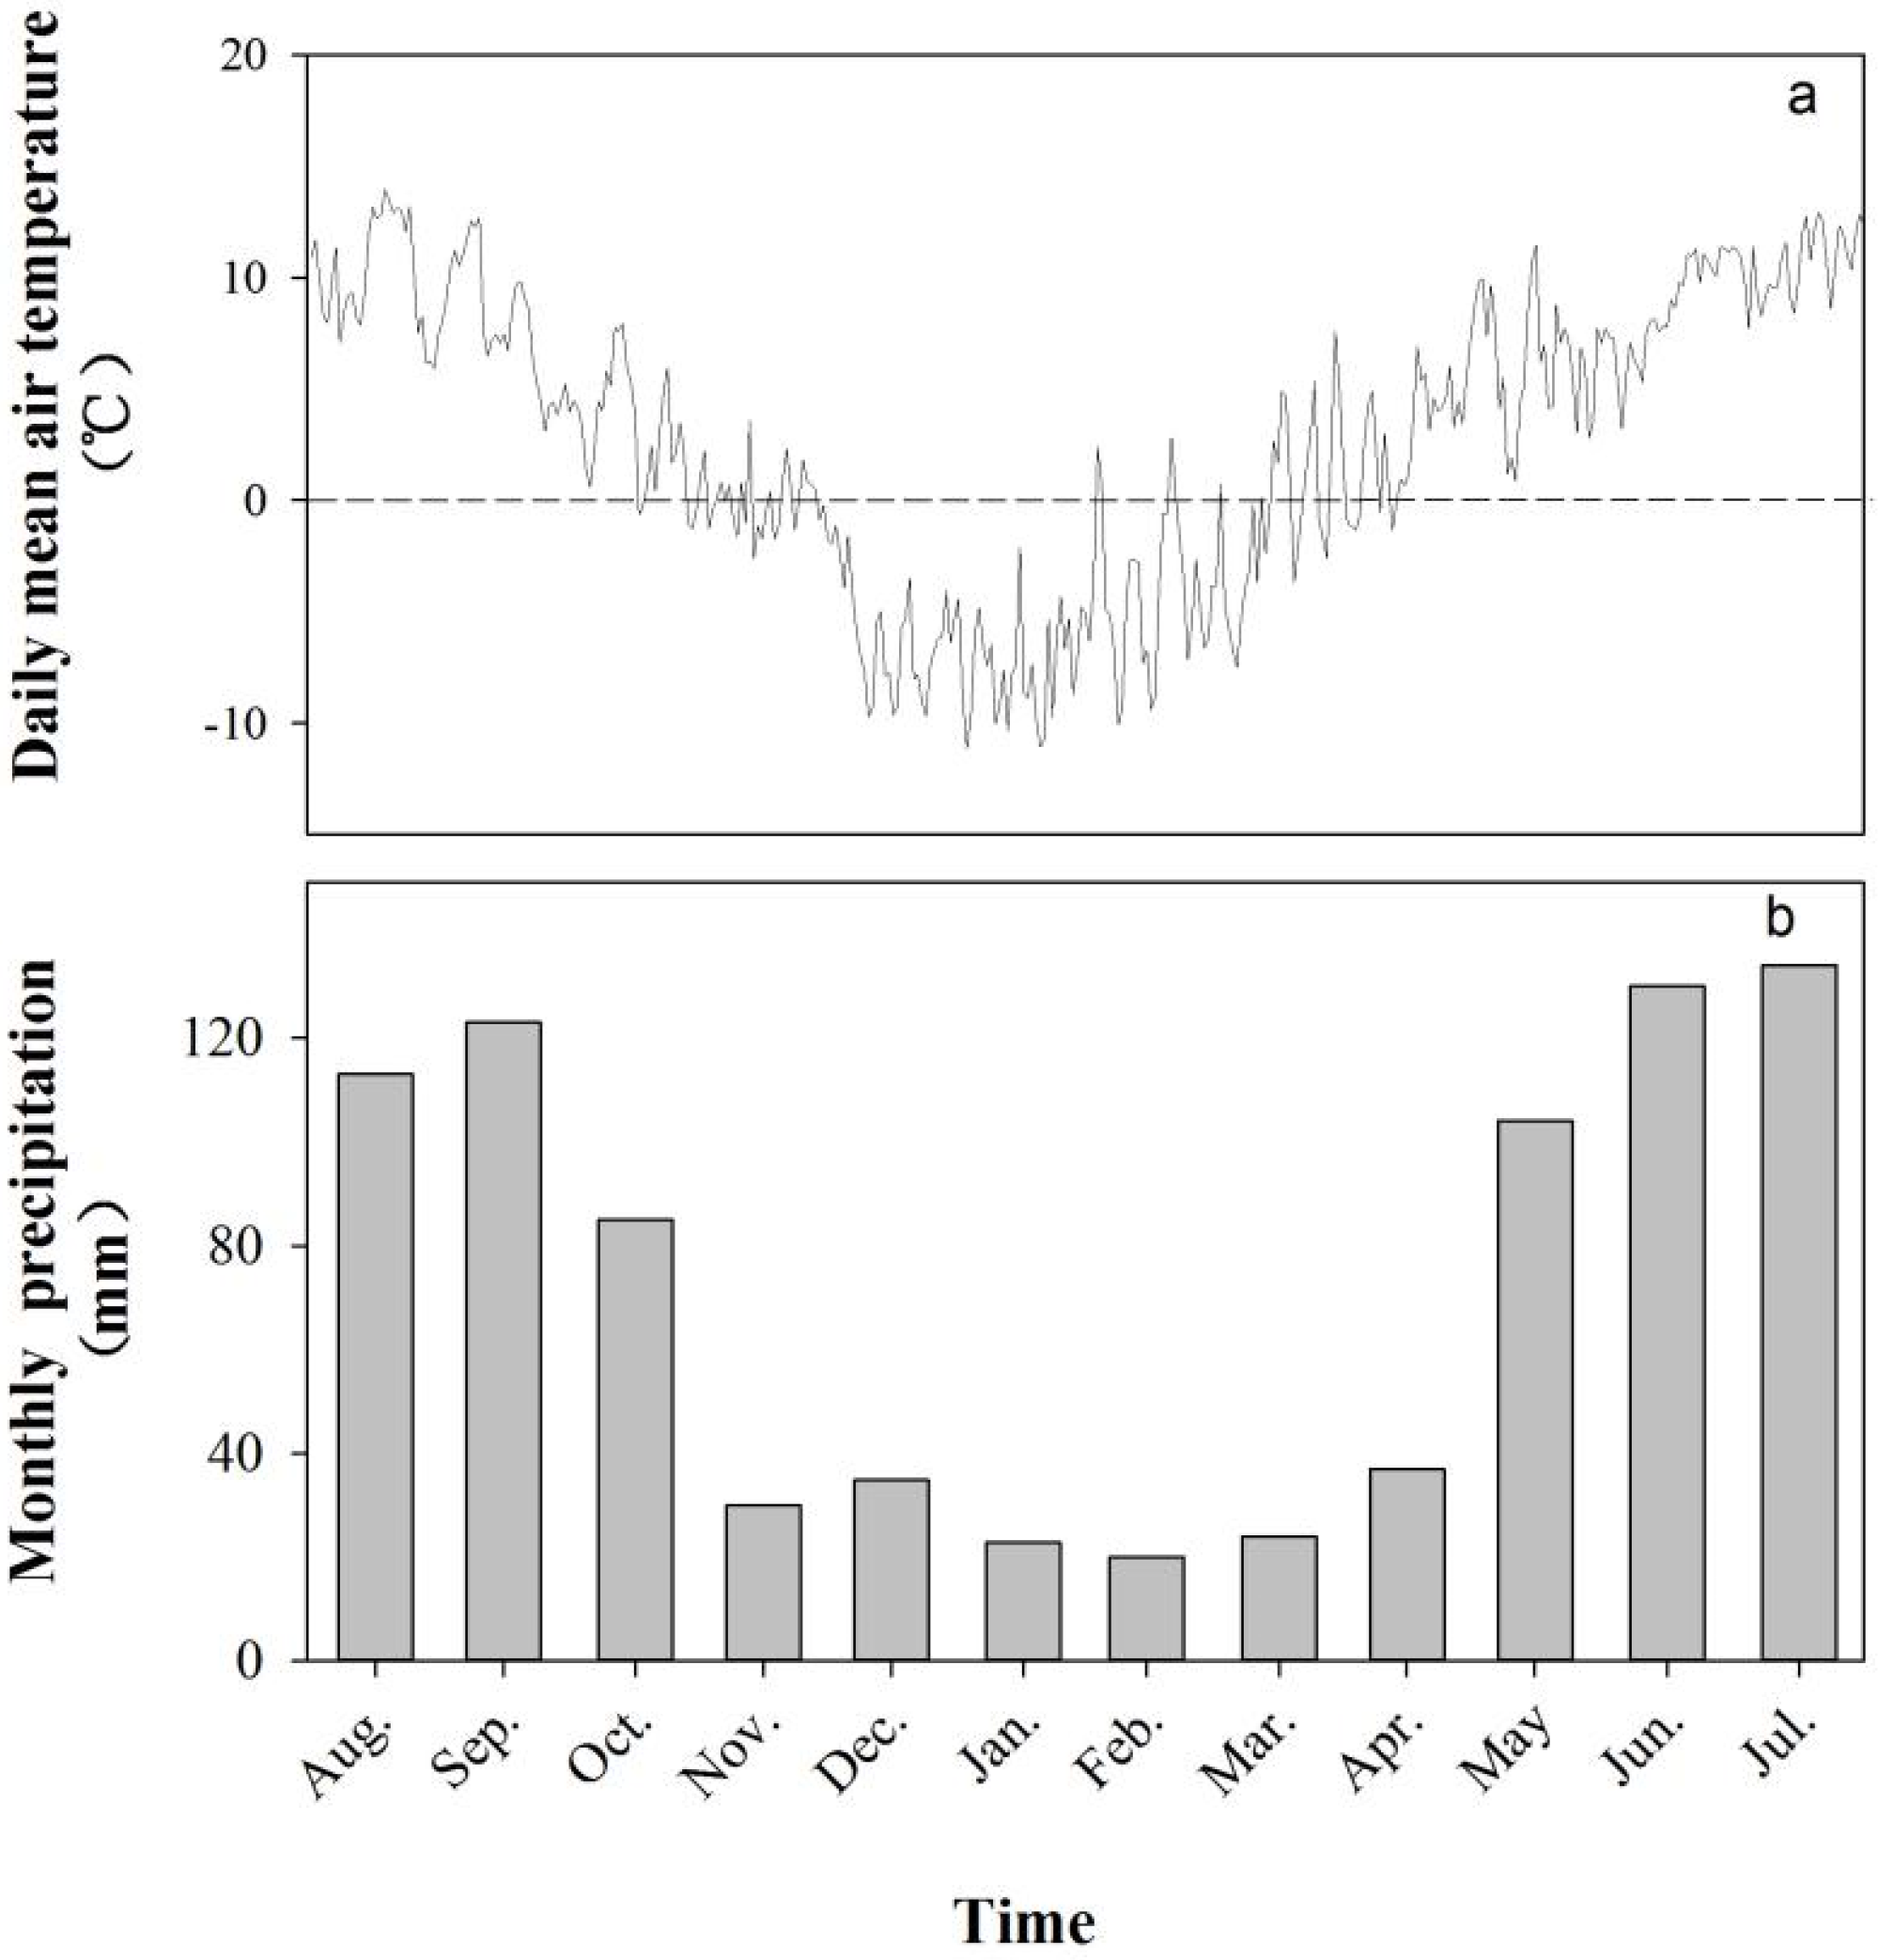
2.1. Study Area

This study was conducted at the Long-term Research Station of Alpine Forest Ecosystems, Bipenggou (31°14′–31°19′ N, 102°53′–102°57′ E, altitude 2458–4619 m), which is located in Lixian County, Sichuan Province, People’s Republic of China [30]. This region is in a transitional zone between the Tibetan Plateau and the Sichuan Basin and is the main area of the Miyaluo Nature Reserve. The mean annual temperature is 2.7 °C, and the absolute maximum and minimum temperatures are 23.7 °C and −18.1 °C, respectively. The mean annual precipitation is 850 mm [29]. According to previous research [29,30] and phenological observations, in this high-altitude frigid region, one year can be divided into six seasonal periods: the snow-formation period (SF, November), the snow-cover period (SC, from early December to late March of the next year), the snow-melting period (ST, April), the early growing season (EG, May and June), the middle growing season (MG, July and August), and the late growing season (LG, September and October). The forest canopy is dominated by Abies faxoniana and Picea balfouriana, and associated species include Cerasus conadenia, Cerasus pleiocerasus, and Sorbus scalaris; the shrub layer is composed of Salix cupularis, Salix paraplesia, Rosa omeiensis, and Berberis silva-taroucana, among others, and the herb layer is composed of Cacalia spp., Cystopteris montana, Carex spp., Cyperus spp., and other species. The most dominant moss species include Thuidium cymbifolium and Hylocomium splendens. The most common lichen species are from the Parmelia genus.
Three 50 × 50-m sites were randomly established in the study area of a 60–180-year-old spruce-fir forest (Table S1). Each site had a homogeneous aspect, slope, and altitude and the sites were at least 50 m apart. 20 circular litter traps were placed randomly throughout each site and were fixed approximately 1 m above the ground [17]. Quadrats (5 × 5 m) were established for shrub community surveys, and each litter trap was positioned in the centre of the quadrat. At each site (50 × 50 m), canopy openness was assessed by visual observation, and tree species, tree density, tree height, stem diameter at breast height (DBH) and crown diameter were recorded. Height was measured using a 15-m calibrated pole, DBH was measured 1.3 m above the soil surface using a measuring tape, and crown diameter was measured in four directions and averaged. In each quadrat (5 × 5 m), shrub species, density, height and shrub coverage were recorded. Rainfall and air temperature were measured daily in the study area using microclimate instrumentation (Figure 1).

2.2. Litter Collection

At each site, forest litter was collected using 20 circular litter traps. The litter traps were funnel shaped with a 1-m diameter opening and a collection area of 0.785 m2. From August 2015 to July 2016, the litter in each trap was collected twice a month during the peak litterfall periods and once a month during other periods (Table S2); however, because heavy snow closed the mountain passes and limited sampling, the litter was collected only once (late March 2016) during the snow-cover period. The collected litter was oven-dried to a constant weight at 65 °C for 4 d and weighed for dry mass determination [1]. Forest litterfall data were collected each month except during the four months of the snow-cover period. During the snow-cover period, plants in the cold temperate and boreal regions undergo a few months of dormancy to endure freezing temperatures and low light availability, which may limit plant growth [6,18], and litter production is relatively low and stable [14]. Hence, monthly litterfall during the snow-cover period can be treated as a constant value and can be calculated based on the average litterfall of the four months.

2.3. Litterfall Component Categories

First, the epiphytic litter (epiphytic mosses and lichens) was removed. Litter from each tree species was then manually sorted into six categories: foliar litter, twig litter (<2.5 cm in diameter), bark litter, flower litter, fruit and seed litter. In addition, some parts that could not be distinguished were considered “Miscellaneous”. Dead roots and coarse woody debris (CWD) were excluded [14]. Total annual litterfall was calculated based on all monthly litterfall data and the litter trap area.

2.4. Statistical Analyses

The pooled sample of the 20 traps on each sample plot was used to analyze annual litter production. Analysis of variance (ANOVA) was used to test the effects of month, species and component on litter production. Paired t-tests were used to analyze significant differences in litter mass between the tree and shrub layers and between the evergreen and deciduous species. General linear models were performed to evaluate relationships among foliar litter production, total litter production and the litter production of the different components. All statistical analyses were performed using SPSS 20.0 for Windows (SPSS, Chicago, IL, USA).
The peak/valley ratio (PVR) throughout the entire year was used to characterize the seasonal variability of litterfall (peak: the highest percentage of monthly litterfall throughout the year; valley: the lowest percentage of monthly litterfall throughout the year) [14]. According to the PVR calculation, the value is positive (greater than or equal to 1). The greater the PVR is, the stronger the seasonal variability of litterfall. If the PVR equals 1, the litter production is constant.
The allometric approach for litterfall describes the production of different components as allometric relationships [24], based on the following equation [23]:
y = γ · x β
where y and x are litter production for different components, γ is a normalization (allometric) constant, and β is the scaling exponent. Conveniently, this equation becomes linear after log10 transformation:
logy = log γ + β log x
Model Type II regression was used to determine the slope (β) and y-intercept (logγ) of log-log linear relationships using the software package “Standardized Major Axis Tests and Routines” [23]. The significance level for testing slope heterogeneity was p < 0.05 (i.e., isometric scaling was rejected if p < 0.05 when testing if β equals a specific value β0 = 1) [21,23]. If the compared regressions have common slopes but different y-intercepts, then the difference in y-intercepts might lead to a significant difference between the common slope and the slope obtained from the data [23].

3. Results

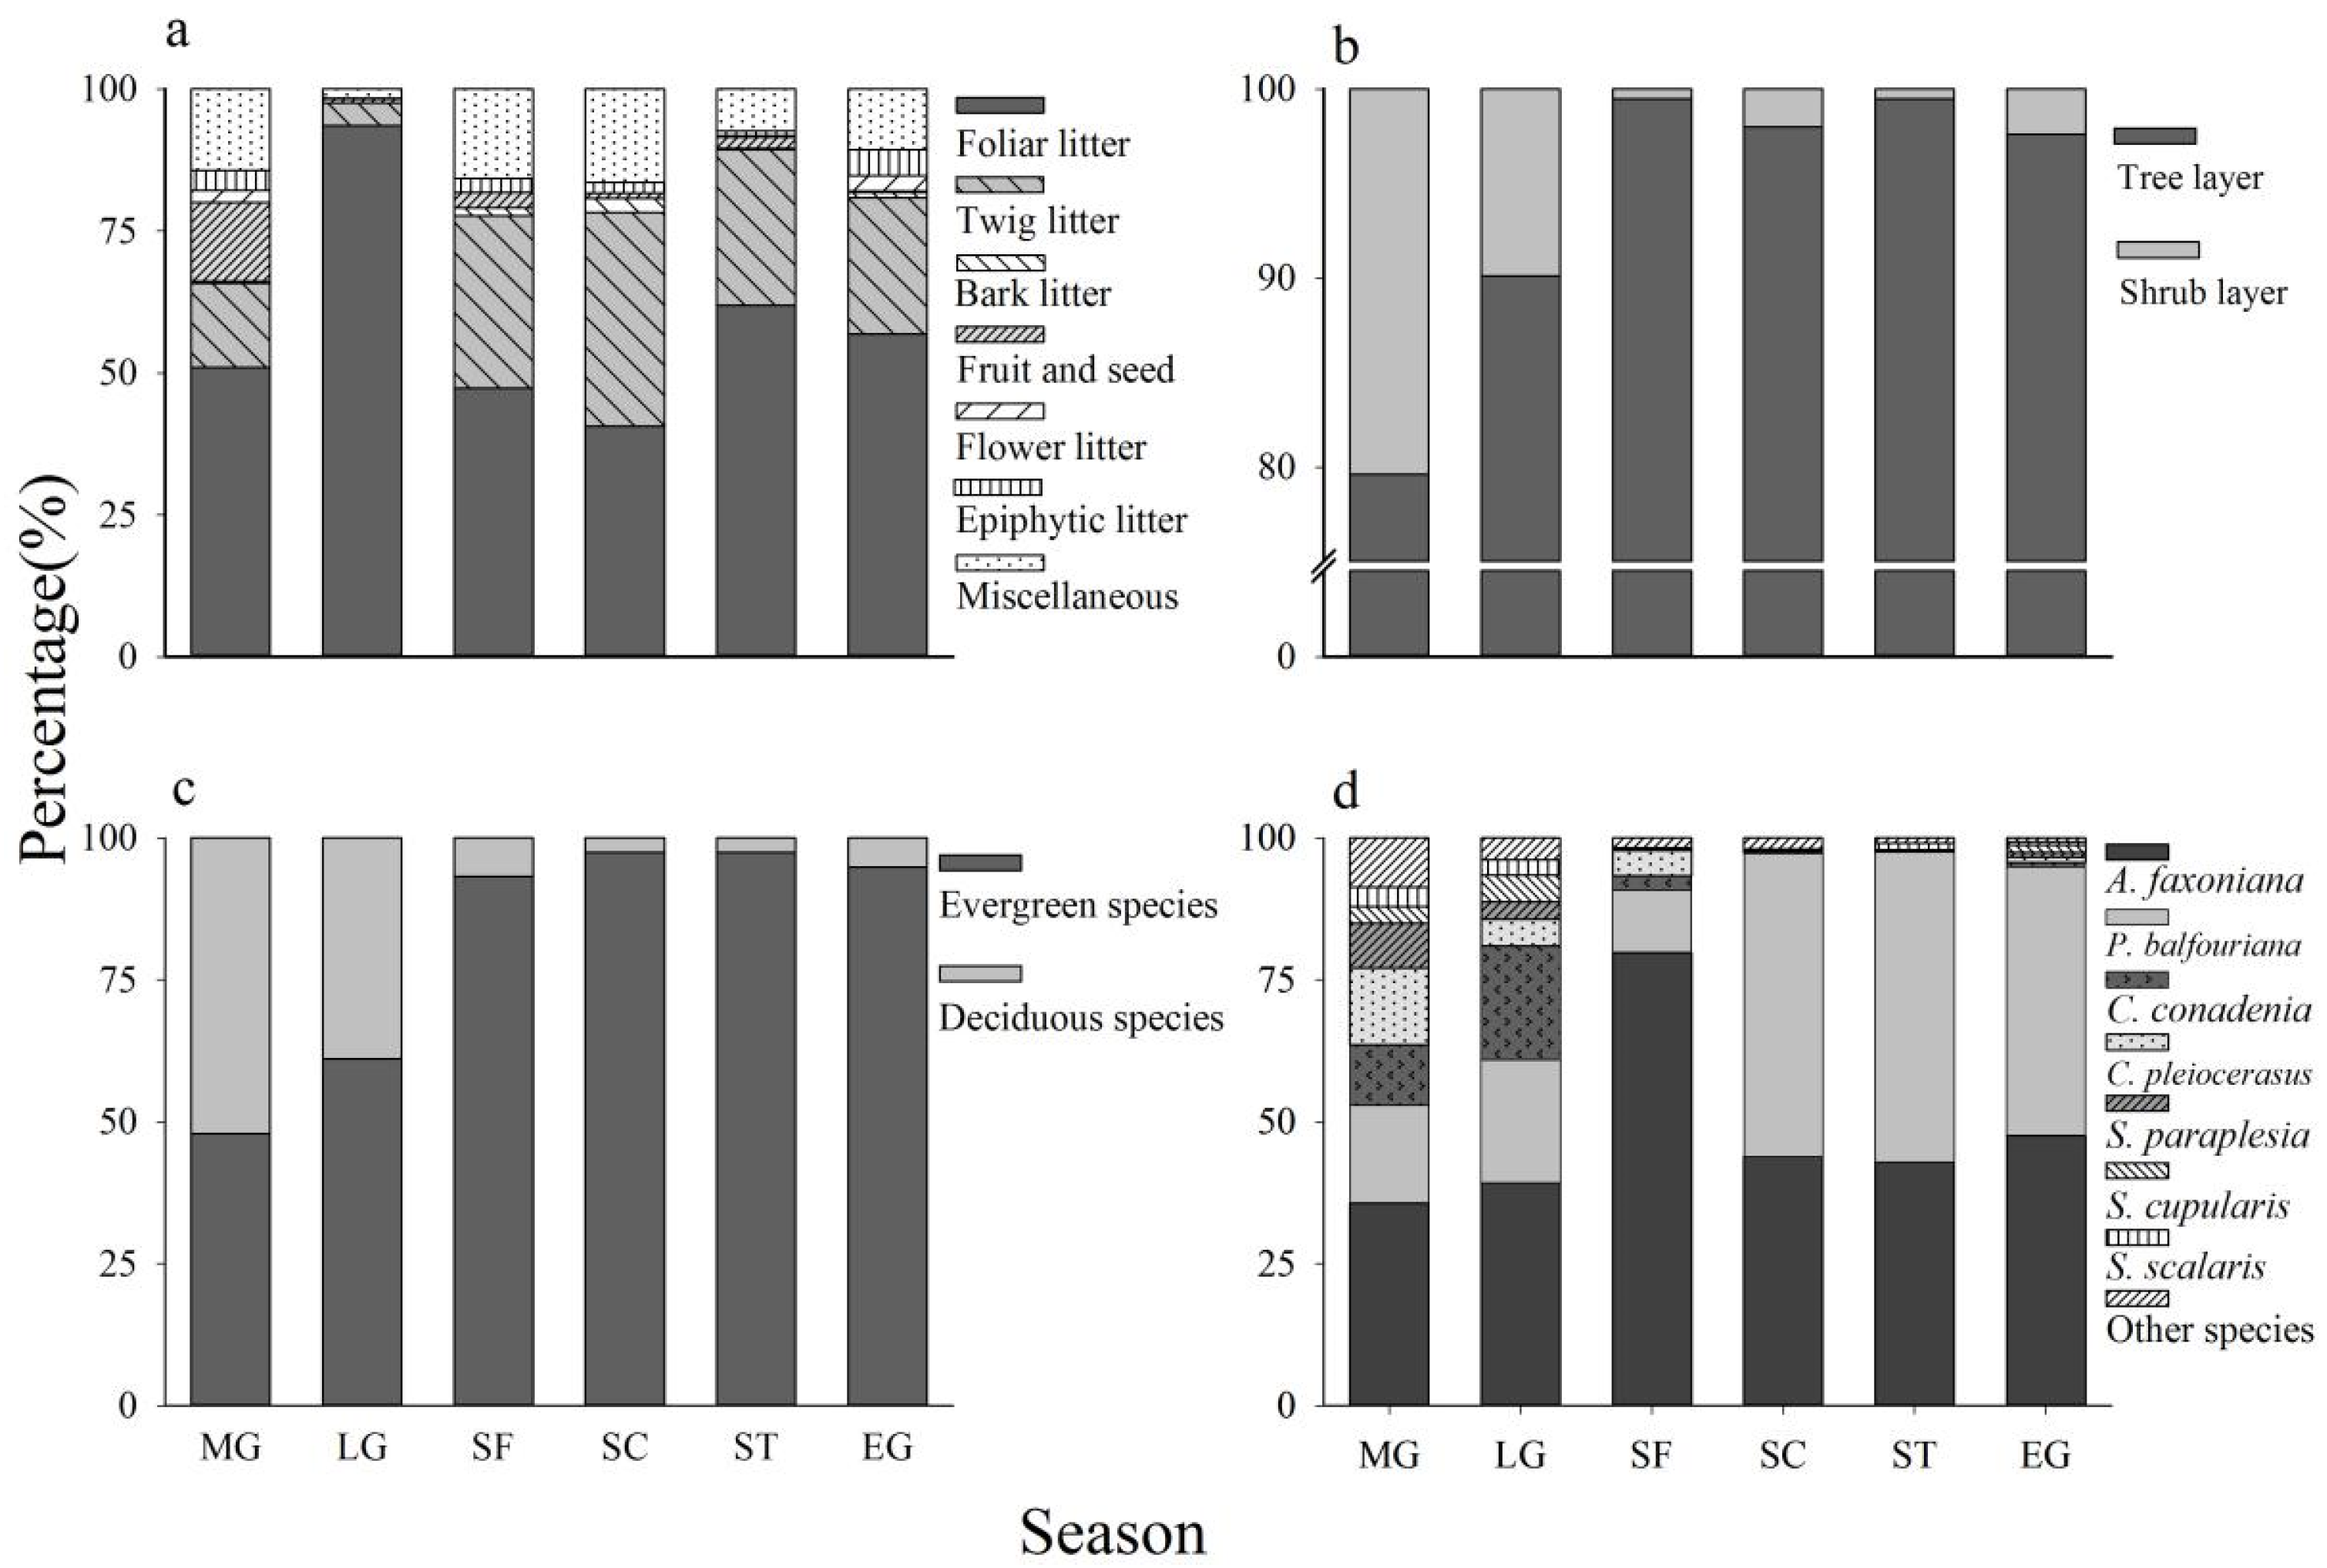
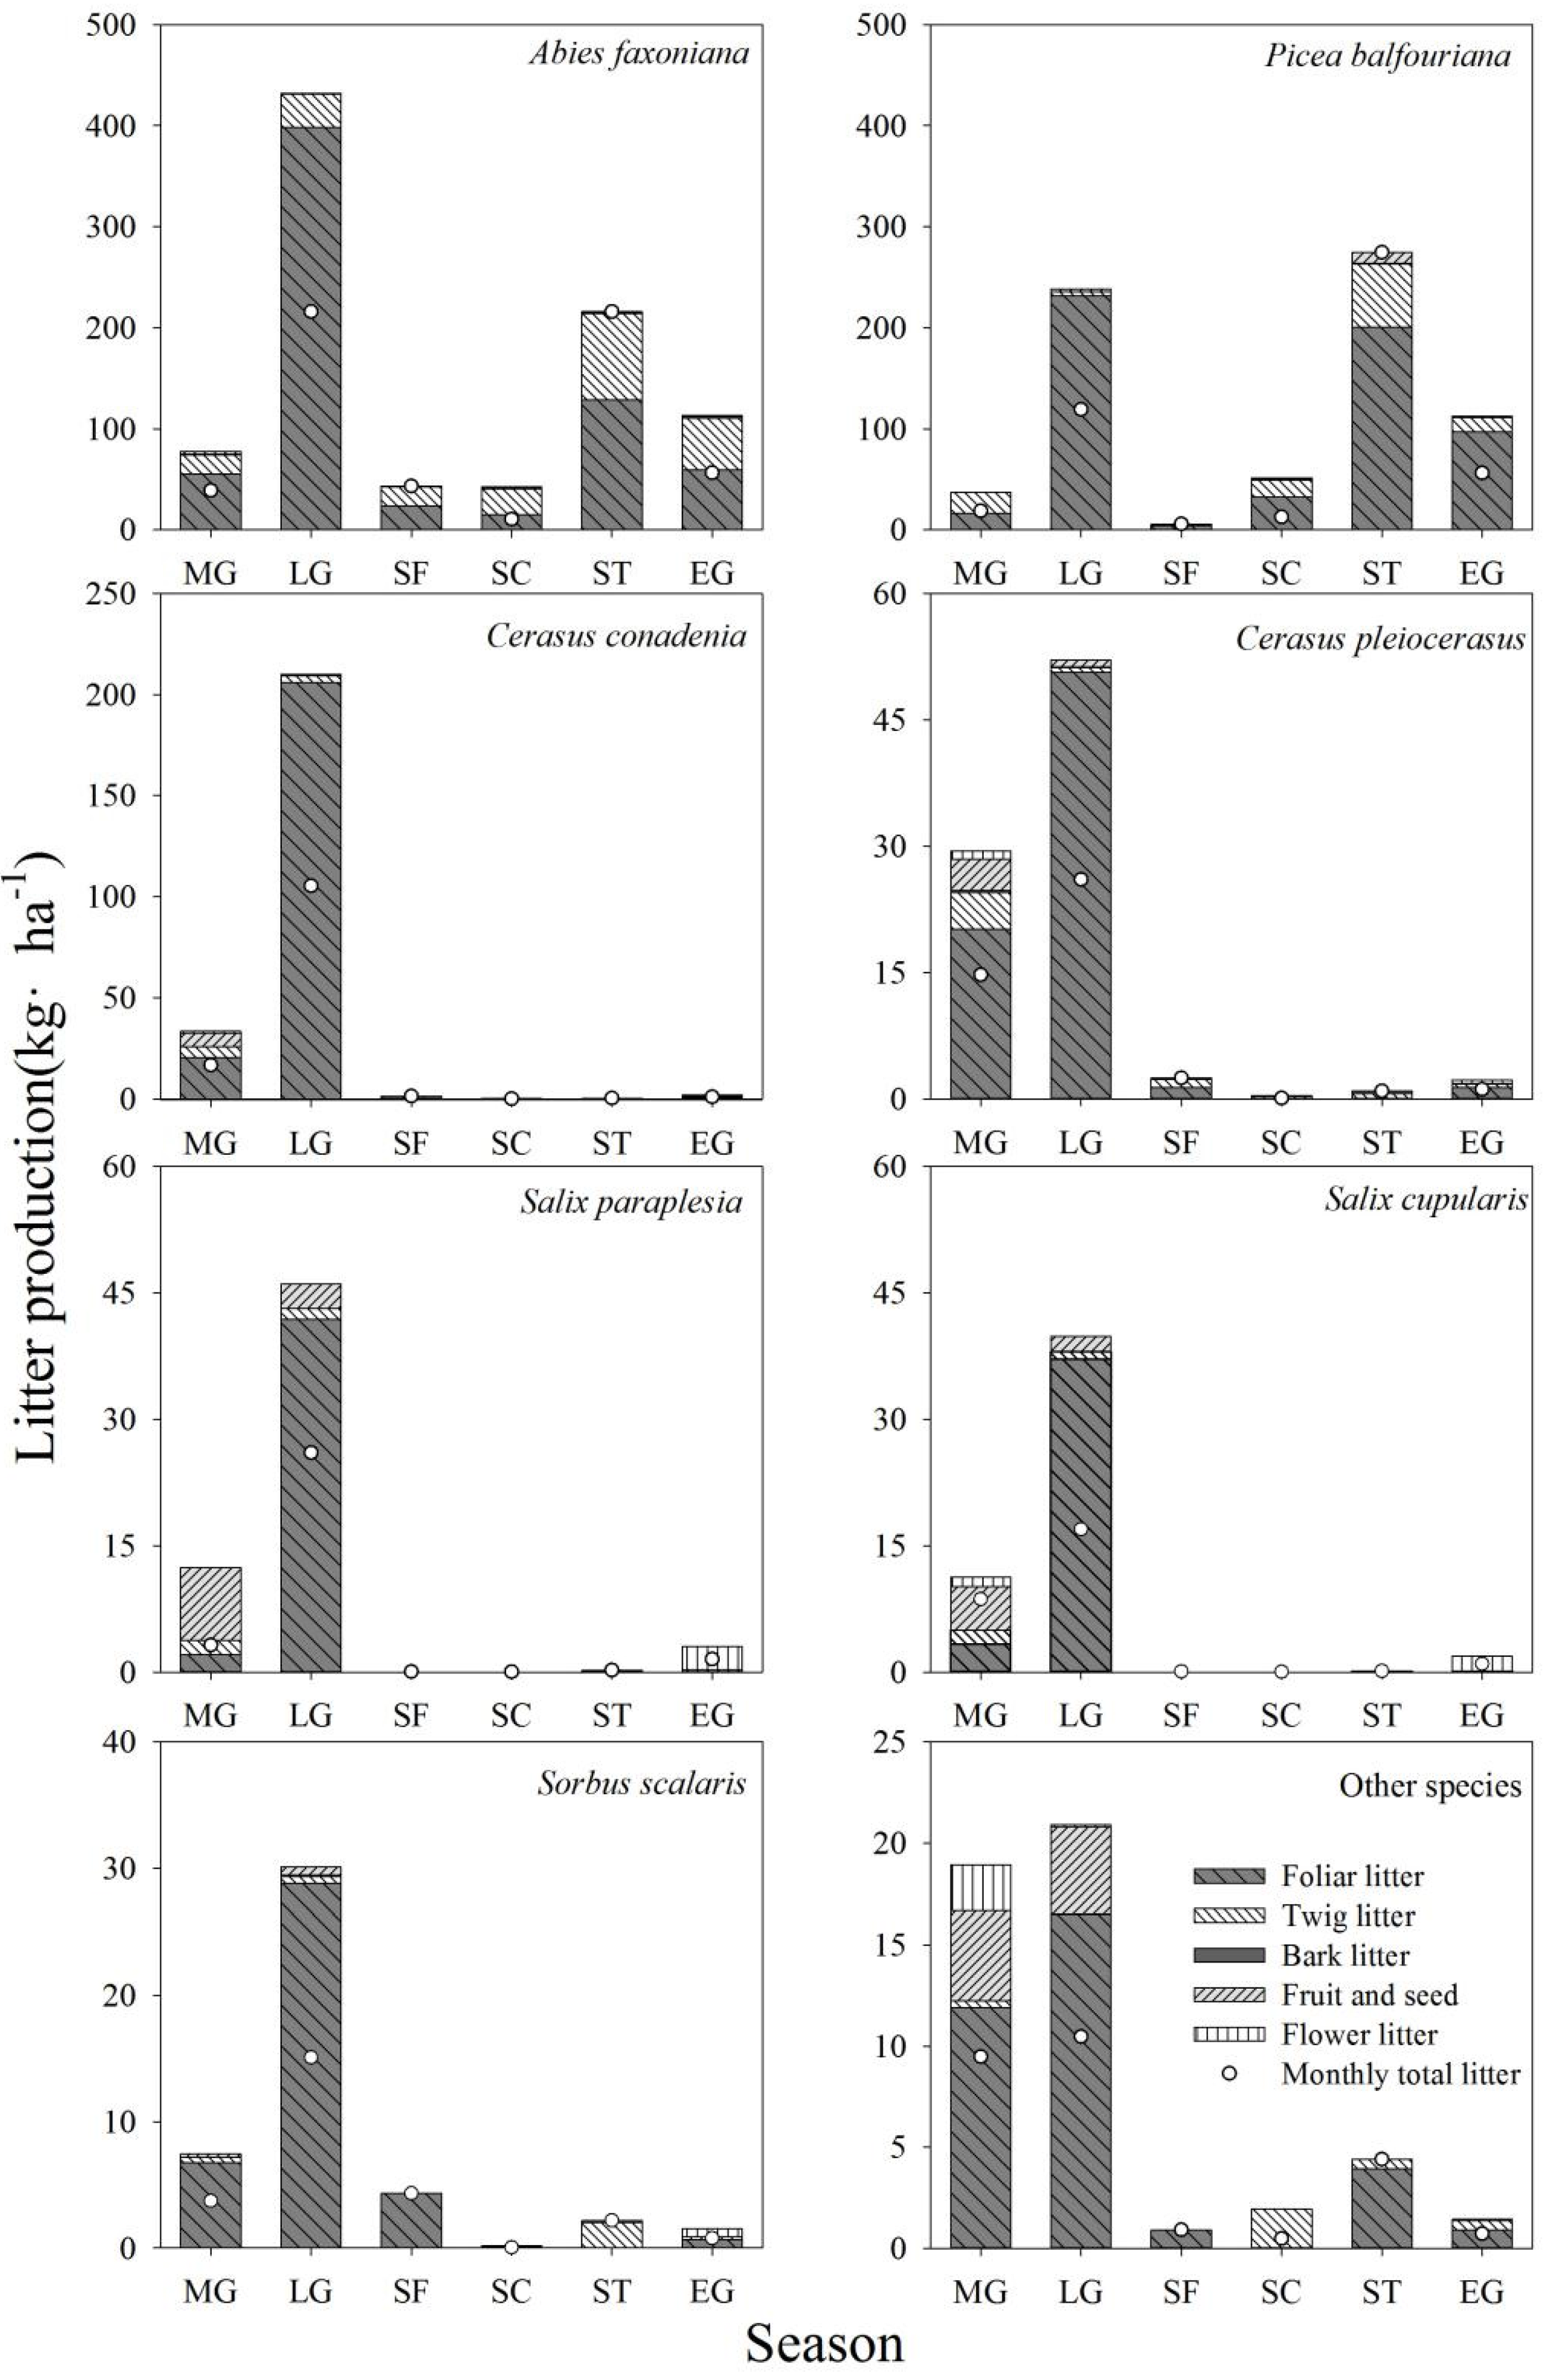
3.1. Litter Production and Litter Components

The total annual litter production was 2380 ± 510 kg·ha−1·year−1 in the study area (Table 1). The production percentage for each litter component varied seasonally (Figure 2a). Foliar litter was the largest component (totalling 73.6%, with 53.1% and 20.5% for needles and leaves, respectively), and foliar litter production was significantly related to total litter production (R2 = 0.91, p < 0.001; Figure S1). Woody litter (twig and bark), reproductive litter (flower, fruit and seed), epiphytic litter and miscellaneous materials accounted for 15.6%, 3.0%, 1.3% and 6.5%, respectively, of the total litter production. The r values of litter production between any two components varied (Table 2).

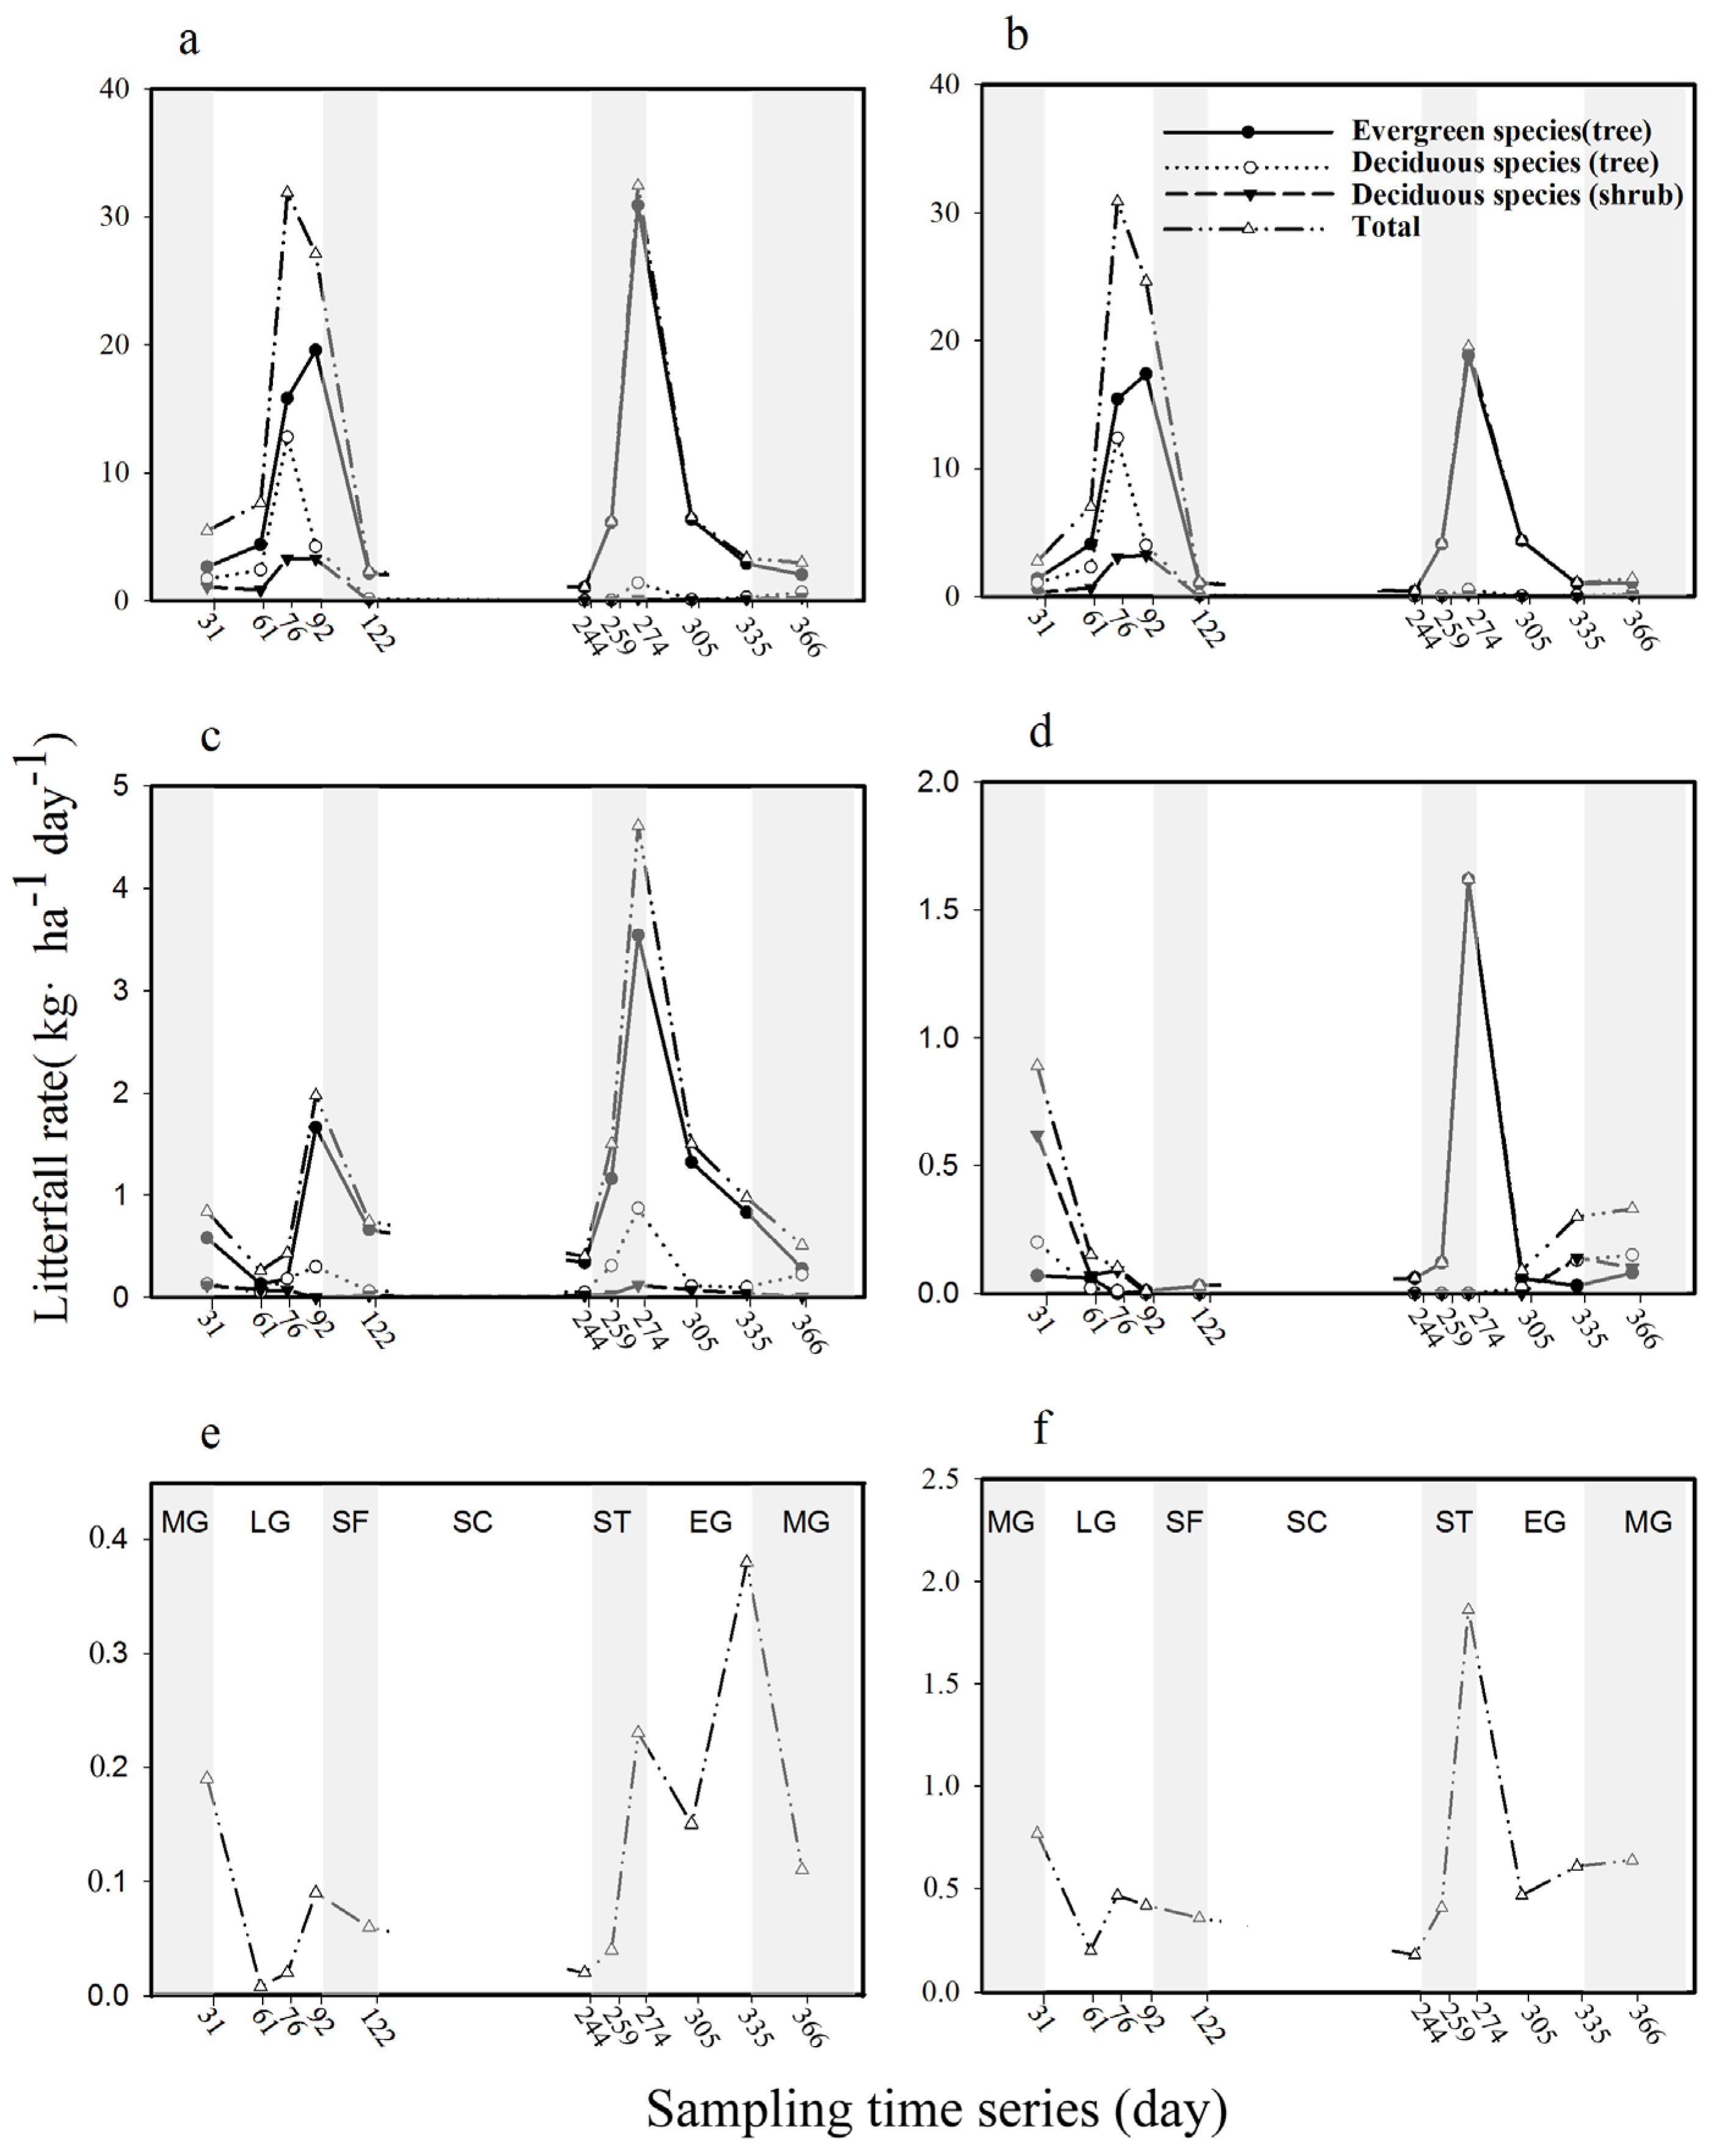
3.2. Litterfall Dynamics

The total litter production was bimodal, with peaks occurring in April and October, and the minimum rate of litterfall occurred in the snow-cover period (Figure 3a).
Foliar litter production had two peaks (Figure 3b): a major peak occurred during the late growing season, and a smaller peak occurred during the snow-melting period. Evergreen needle litter production was not significantly different between the two peaks (p > 0.05), whereas deciduous leaf litter was unimodal, with a peak occurring in October.
Twig litter was the main woody litter component (Table 1) and ranged from 20 to 150 kg·ha−1 during the year. The two peaks in woody litter occurred in April and October (Figure 3c). The interaction between the sampling time and species had significant effects on twig litter production (F = 1.68, p < 0.001; Table 3).
Reproductive litter had two peaks, with a sharp peak occurring in April (Figure 3d), and it mainly occurred during the snow-melting period and the middle growing season. Most conifer cones were collected in April, whereas flower litter was concentrated in June and July; the mature fruit litter of deciduous species was concentrated in August.
Epiphytic litterfall rates did not differ significantly by month (F = 0.04, p = 0.99). Epiphytic litter was not correlated with the other litter components (p > 0.05; Table 2), and the maximum litterfall rate was observed during the early growing season (Figure 3e).
Miscellaneous litterfall rates did not differ significantly by month (F = 0.59, p = 0.82). Miscellaneous litter varied with sampling time; the maximum litterfall rate (2.3 ± 0.9 kg·ha−1·day−1) occurred in April, whereas the minimum rate (0.2 ± 0.1 kg·ha−1·day−1) occurred during the snow-cover period (Figure 3f).

3.3. Evergreen Versus Deciduous

The seven dominant species (Figure 4) accounted for 89% of the total litter production. Evergreen species litter production (1627 kg·ha−1·year−1, 68.36% of the total litter production; Table S3) was greater than that of deciduous species (567 kg·ha−1·year−1, 23.83% of the total litter production).
The peak litter production of all evergreen species occurred in April and October, whereas the lowest litter production occurred during the snow-cover period. The peak litterfall of deciduous species occurred in October (Figure 3a). The PVR of evergreen species (17.5) was lower than that of deciduous species (486.7; Table 4).

3.4. Tree Versus Shrub Litter Production

Tree litter production (2033 kg·ha−1·year−1, 85.4% of the total litter production; Table S3) was significantly (p < 0.05) higher than shrub litter production (161 kg·ha−1·year−1, 6.8% of the total litter production). However, the PVR for shrubs (410.0) was greater than that for trees (25.2; Table 4). The peak litter production of shrubs (3.3 kg·ha−1·day−1) occurred during the late growing season (Figure 3a).

3.5. Allometric Scaling Relationships of Litterfall

Isometric scaling relationships were observed for foliar litter (LF) versus total litter (LT) and reproductive litter (LR) versus total litter (i.e., LF∝LT0.99≈1, 95%CI = 0.95 to 1.03; LR∝LT0.98≈1, 95%CI = 0.79 to 1.22) (Table 5). A positive allometric relationship was observed between woody litter (LW) and total litter (LW∝LT1.40>1, 95%CI = 1.19 to 1.64). Miscellaneous (LM) versus total litter (LT) showed a negative allometric relationship (LM∝LT0.82<1, 95%CI = 0.71 to 0.93). However, no obvious allometric relationship existed between epiphytic litter (LE) and total litter.
Among the litter components, significant isometric scaling relationships (i.e., LF∝LR1.00, LR∝LE1.06 and LR∝LM1.20), and significant allometric relationships (i.e., LF∝LW0.71, LF∝LM1.21, LW∝LR1.42, and LW∝LM1.71) were observed; however, some relationships could not be expressed by allometric equations (i.e., LF versus LE, LW versus LE, and LE versus LM).
Tree litter (Lty) showed an isometric scaling relationship with total litter (Lty∝LT1.05≈1); however, the relationship of shrub litter (Lsy) versus total litter, Lty versus Lsy, could not be expressed by an allometric equation.
Evergreen (Lev) and deciduous (Lde) litter production showed positive allometric relationships with total litter (i.e., Lev∝LT1.14>1 and Lde∝LT1.58>1). The relationship of Lev versus Lde showed a scaling exponent of 0.72 (95%CI = 0.57 to 0.92).

4. Discussion

4.1. Annual Litter Production

Litterfall varies by forest type in cold temperate needle-leaved evergreen forests (from 502 to 8860 kg·ha−1·year−1) and in boreal needle-leaved evergreen forests (from 130 to 5725 kg·ha−1·year−1) [6]. In the coniferous forest ecosystem in the study area, the aboveground forest biomass was 7.3 × 10⁴ kg·ha−1 [31]. Based on one year of observations, the litterfall of the sub-alpine spruce-fir forests on the eastern Tibetan Plateau was 2380 kg·ha−1·year−1 (3% of the aboveground forest biomass), which is similar to that of a spruce-fir forest (2472 kg·ha−1·year−1) in the Changbai Mountain region, China [32] (Table S4). These similar results are mainly due to the homogeneous site conditions and the limitations of low temperatures on litterfall and tree growth [6]. Additionally, the structure of spruce-fir and boreal forests is simple, and plants undergo a few months of dormancy to endure freezing temperatures [18]. Litter production showed similar allocation mechanisms as a result of these factors.
However, the litter production observed in this study was lower than that of the same forest type (3340 kg·ha−1·year−1) in the Xiaoxing’an Mountains [19] (Table S4). The difference can be explained by two facts. First, due to the 2500-m difference in altitude, climatic conditions in high-altitude region are more complex [33]. Second, because of complex conditions and nutrient-poor soil, plants in high-altitude regions grow more slowly, and plant productivity and litter production in this study area are lower than those in low-altitude regions. The results confirm the hypothesis that litter production decreases with increasing latitude [6].
Differences in litter production among different forest types were observed [4,14]. Litter production of a spruce-fir forest in a high-altitude frigid region was lower than that reported for a fir-dominated forest (3483 kg·ha−1·year−1) [17], but higher than that reported for a spruce-dominated coniferous forest (1212 kg·ha−1·year−1) in the same region [17]. The litter production of spruce-fir forests under homogeneous climatic conditions is between that of pure spruce forests and pure fir forests, which suggests that a close relationship exists between litter production and the proportional composition of spruce and fir trees. The inter-site comparison results of this study (Table S4) showed that the litter production of the spruce-fir forest increased with increasing fir tree density. These results are closely related to those observed for the high productivity of fir forests [17,20,26,34].

4.2. Litterfall Dynamics

Litter production varied significantly with season in the study area. Based on a year-long observation (Figure S2), total litterfall was bimodal (Figure 3a). Although the litter from deciduous species exhibited only one litterfall peak during the late growing season, evergreen litterfall showed a bimodal pattern in which litterfall peaks occurred in April and October (Figure 3a). Litterfall peaks occurring in autumn or winter are often caused by low temperatures, and those in spring and summer are primarily related to solar radiation or drought [14,15]. In this high-altitude frigid region, high rates of litterfall occurred during the late growing season (Figure 4) when the daily mean air temperature began to drop to 0 °C, which suggests that the litterfall peak in the late growing season is caused by low temperatures. The other litterfall peak occurred during the snow-melting period, when the daily mean air temperature was higher than 0 °C due to increased solar thermal radiation. However, although temperature and solar radiation can account for this phenomenon, the dynamics of litterfall in other coniferous forests are often bimodal, unimodal, or multimodal [19,20]; therefore, litterfall cannot be characterized by a specific environmental variable [14]. In the present study, the classification of each species and the analysis of the major species (Figure 4) indicated that the peak litterfall occurred during the late growing season due to the abundant foliar litter from all tree species (Figure 2a) and during the snow-melting period because the litterfall was dominated by litter from fir and spruce trees (Figure 2d). The two-way ANOVAs of the effects of sampling time and species on litter production also showed that litter production differed significantly due to the interaction between species and sampling time (Table 3). Therefore, we inferred that the litterfall dynamics in the sub-alpine spruce-fir forest are affected by species-specific eco-physiological factors and by external meteorological factors.

4.3. Evergreen Versus Deciduous, Tree Versus Shrub

In high-altitude frigid regions, coniferous forests have adapted to the cold environment and they dominate the region [35], although deciduous species are also common in sub-alpine coniferous forests. Tree species’ behaviour also significantly affects litter production [36]. The litter production of evergreen coniferous species was significantly higher than that of deciduous species in this study (Table 4). Compared with deciduous angiosperms, evergreen gymnosperms amounted for more than 36.7% of total litterfall. On the one hand, evergreen species are dominant in the coniferous forest [37], and highly dominant species produce more litter per unit area [8,38]. On the other hand, more light energy can be fixed by evergreen species than by deciduous trees [39,40] due to the longer foliage retention time of evergreens under homogeneous climatic conditions [41]; evergreen forests are often considered to be more productive than deciduous forests [6]. Therefore, in our study area, evergreen gymnosperms had greater litterfall inputs than did deciduous angiosperms, which confirmed the results of previous studies [16].
In this study, the lower PVR of litter production for evergreen species compared with that of deciduous species (Table 4) can be explained by the more obvious seasonal dynamics of deciduous compared with evergreen species [6]. In addition, because the forest tree layer was dominated by evergreen species, whereas the shrub layer was dominated by deciduous species in the study region, the PVRs of the litterfall of the shrub layer were higher than those of the tree layer. Additionally, the variation in total litter production in the sub-alpine coniferous forest was dominated by the evergreen species in the tree layer (Figure 2), such as Abies faxoniana and Picea balfouriana (Figure 4a,b). Previous studies have reported similar results [14,17].

4.4. Litter Components and Allometric Scaling Relationships

The allocation strategies of tree species play key roles in the variation in litter production among different components [24,42,43]. Allometric relationships exist among different organs of a given plant [21,22]. In this study, foliar litter was the major component (73.6% of the total litter production), and this percentage was similar to that of boreal needle-leaved forests (73%) [14], but it was higher than the percentages at a global scale (70%) [4], Eurasian scale (71%) [16] or in China (70.6%) [42]. Thus, the proportion of foliar litter in this cold region is higher than that at a larger regional scale. On the one hand, the source of soil nutrition depends strongly on foliar litter elements in barren soil areas of cold regions. However, the litter production and input patterns were affected by the biological and ecological characteristics of the plants [9]. High proportions of foliar litter reflect the evolutionary adaptation of the litter allocation strategies of plants to cold environments.
Foliar litter(LF) versus total litter(LT) showed an isometric scaling relationship (LF∝LT0.99≈1) because, as the main component of litterfall (Table 1), foliar litterfall greatly affected the total litter dynamics in the sub-alpine coniferous forest (Figure S1). During the late growing season, a large number of leaves, especially of deciduous species, senesce and fall (Figure 4) [44] as lower temperatures stimulate abscisic acid synthesis in plant foliage [45]. Therefore, we collected the most foliar litter in October (48% of annual foliar litter production, 35% of annual total litter production, and 94% of total October litter production), which is also when the total foliar litterfall rate peaked (Figure 3b). In addition, the foliar litterfall rate of evergreen species showed another peak in the snow-melting period, coinciding with the budding of new leaves [46]. In this study, the litterfall was mainly from evergreens, indicating their importance as a major component of nutrient cycling in the high-altitude frigid forest ecosystem.
Aboveground woody litter contributed 15.6% to the total litter production in the present study (Table 1), and the scaling exponent (β = 1.40) was higher than that of LF versus LT. Woody litter increased faster than leaf litter as total litter increased. Twigs were the main component of woody litter, and their largest contribution to monthly litter production was 37.2% during the snow-cover period. The peaks in woody litterfall occurred in April and October (Figure 3c). Similar patterns occur in other sub-alpine forests in this region [17]. This intra-annual variability cannot exclusively be a result of twig shrinkage and swelling [14]. Water stress, wind or temperature extremes were probably the major causal factors [47]. Importantly, in this study, branches 2.5 cm in diameter or larger were excluded from woody litter [48]; branches of this size are usually considered coarse woody debris [49,50]. Additionally, dead roots were not included in this study, which are usually studied as the main woody part of belowground litter [6,51,52].
The litter of reproductive organs has rarely been studied despite the key role of these organs in allocating nutrients to offspring [10]. In the present study, the fruit litter of deciduous species occurred mostly in the middle growing season (July and August), and the most conifer cones were collected in the snow-melting period (April). Some of these reproductive organs are often consumed before they fall [53]; hence, our data may be an underestimation. Flower litter was concentrated in June and July and contributed 1.5% to the total litter (Table 1). Flower litter production has been shown to influence nutrient cycling in high-frigid ecosystems [10]. Flower litter showed a significant seasonal pattern as it mainly occurred in the rainy season when temperatures were high and solar radiation was adequate [14].
Epiphytic litterfall rates did not differ significantly by month; thus, no obvious allometric relationship was found between epiphytic litter and total litter. In high-altitude frigid regions, mosses and lichens on tree trunks and branches fall to the ground and enter biological cycles, but only a few studies have quantified the litterfall of epiphytes in this forest ecosystem [17]. Some relationships could not be expressed by allometric equations (i.e., LF versus LE, LW versus LE, and LE versus LM). The results are similar to other studies [17] and suggest that the litterfall of epiphytes is controlled by different micrometeorological factors [54].

5. Conclusions

This study quantified forest litter production in a sub-alpine spruce-fir forest on the eastern Tibetan Plateau. The contribution, dynamics and allometric scaling relationships of litterfall among different litter components, functional types (evergreen versus deciduous) and vertical structures (tree versus shrub) were highlighted. The different litter components showed different seasonal dynamics, and the total litter dynamics were mainly determined by the variation in foliar litter. In addition, the allometric relationships of forest litterfall varied with the litter components, functional types (evergreen versus deciduous) and vertical structures (tree versus shrub). Although one year of litterfall observation allows only a limited understanding of material cycling in the sub-alpine forest, this study provides basic data on the nutrient return from litterfall in the study area, and allometric relationships of litterfall provide a new conceptual understanding for future plant litterfall studies.

Supplementary Materials

The following are available online at www.mdpi.com/1999-4907/8/9/314/s1, Table S1: Some detailed characteristics of the three sites studied in a sub-alpine spruce-fir forest on the eastern Tibetan Plateau, Table S2: Seasonal periods, months, sampling times and the corresponding sampling time series, Table S3: Total annual litter production of each species in a spruce-fir forest on the eastern Tibetan Plateau, Table S4: Comparisons of aboveground litter production based on results from previous studies and the present observations, Figure S1: Relationship between total and foliar litter production, Figure S2: Cumulative data of Litter production of annual total litter (a), foliar litter (b), woody litter (c), reproductive litter (d), epiphytic litter (e) and miscellaneous litter (f) in the sub-alpine forest from August 2015 to July 2016.

Acknowledgments

We are grateful to Mao Ye, Hui Liu, Fan Yang, Hairong Zhao, Haifeng Zheng, Chengming You and Kai Yue for their help with the field sampling and laboratory analyses. This study was financially supported by the National Natural Science Foundation of China (No. 31670526, 31622018 and 31570445), the Specialized Research Fund for Doctoral Programs of Higher Education (20135103110002), and the Sichuan Provincial Science and Technology Project for Youth Innovation Team (2017TD0022).

Author Contributions

F.W. and W.Y. conceived the idea. C.F., F.W. and W.Y. designed the experiment. C.F., B.T., Z.X., Y.Z., J.Y. and X.N. conducted the fieldwork. C.F. collected and analyzed the data. C.F. and F.W. wrote the manuscript. All authors reviewed the manuscript.

Conflicts of Interest

The authors declare no conflicts of interest.

References

  1. Finzi, A.C.; Allen, A.S.; Delucia, E.H.; Ellsworth, D.S.; Schlesinger, W.H. Forest litter production, chemistry, and decomposition following two years of Free-Air CO2 enrichment. Ecology 2001, 82, 470–484. [Google Scholar]
  2. Paudel, E.; Dossa, G.G.O.; Xu, J.; Harrison, R.D. Litterfall and nutrient return along a disturbance gradient in a tropical montane forest. For. Ecol. Manag. 2015, 353, 97–106. [Google Scholar] [CrossRef]
  3. Wiegert, R.G.; Monk, C.D. Litter production and energy accumulation in three plantations of longleaf pine (Pinus palustriis Mill). Ecology 1972, 53, 949–953. [Google Scholar] [CrossRef]
  4. Meentemeyer, V.; Box, E.O.; Thompson, R. World patterns and amounts of terrestrial plant litter production. Bioscience 1982, 32, 125–128. [Google Scholar] [CrossRef]
  5. Ong, C.S.P.; Juan, J.C.; Yule, C.M. Litterfall production and chemistry of Koompassia malaccensis and Shorea uliginosa in a tropical peat swamp forest: Plant nutrient regulation and climate relationships. Trees 2015, 29, 527–537. [Google Scholar] [CrossRef]
  6. Vogt, K.A.; Grier, C.C.; Vogt, D.J. Production, turnover, and nutrient dynamics of above-and belowground detritus of world forests. Adv. Ecol. Res. 1986, 15, 303–377. [Google Scholar]
  7. Yang, W.Q.; Wang, K.Y.; Kellomäki, S.; Zhang, J. Annual and monthly variations in litter macronutrients of three subalpine forests in Western China. Pedosphere 2006, 15, 653–659. [Google Scholar] [CrossRef]
  8. Bray, J.R.; Gorham, E. Litter production in forests of the world. Adv. Ecol. Res. 1964, 2, 101–157. [Google Scholar]
  9. Bigelow, S.W.; Canham, C.D. Litterfall as a niche construction process in a northern hardwood forest. Ecosphere 2015, 6, 117. [Google Scholar] [CrossRef]
  10. Wang, J.N.; Xu, B.; Wu, Y.; Gao, J.; Shi, F.S. Flower litters of alpine plants affect soil nitrogen and phosphorus rapidly in the Eastern Tibetan Plateau. Biogeosciences 2016, 13, 5619–5631. [Google Scholar] [CrossRef]
  11. Hishinuma, T.; Azuma, J.I.; Osono, T.; Takeda, H. Litter quality control of decomposition of leaves, twigs, and sapwood by the white-rot fungus Trametes versicolor. Eur. J. Soil Biol. 2017, 80, 1–8. [Google Scholar] [CrossRef]
  12. Lidman, J.; Jonsson, M.; Burrows, R.M.; Bundschuh, M.; Sponseller, R.A. Composition of riparian litter input regulates organic matter decomposition: Implications for headwater stream functioning in a managed forest landscape. Ecol. Evol. 2017, 7, 1068–1077. [Google Scholar] [CrossRef] [PubMed]
  13. Parsons, S.A.; Congdon, R.A.; Shoo, L.P.; Valdez Ramirez, V.; Williams, S.E. Spatial variability in litterfall, litter standing crop and litter quality in a tropical rain forest region. Biotropica 2014, 46, 378–386. [Google Scholar] [CrossRef]
  14. Zhang, H.C.; Yuan, W.P.; Dong, W.J.; Liu, S.G. Seasonal patterns of litterfall in forest ecosystem worldwide. Ecol. Complex. 2014, 20, 240–247. [Google Scholar] [CrossRef]
  15. Enright, N.J. Litterfall dynamics in a mixed conifer-angiosperm forest in northern New Zealand. J. Biogeogr. 2002, 26, 149–157. [Google Scholar] [CrossRef]
  16. Liu, C.; Ilvesniemi, H. Variation in Litterfall-Climate relationships between coniferous and broadleaf forests in Eurasia. Glob. Ecol. Biogeogr. 2004, 13, 105–114. [Google Scholar] [CrossRef]
  17. Yang, W.Q.; Wang, K.; Kelloma, S.K.; Gong, H.D. Litter dynamics of three subalpine forests in Western Sichuan. Pedosphere 2005, 16, 788–798. [Google Scholar] [CrossRef]
  18. Lin, B.; Liu, Q.; Wu, Y.; He, H. Nutrient and litter patterns in three subalpine coniferous forests of western Sichuan, China. Pedosphere 2006, 16, 380–389. [Google Scholar] [CrossRef]
  19. Hou, L.L.; Mao, Z.J.; Tao, S. Dynamic of litterfall in ten typical community types of Xiaoxing’an Mountain, China. Acta Ecol. Sin. 2013, 33, 1994–2002, (In Chinese with English abstract). [Google Scholar]
  20. Saarsalmi, A.; Starr, M.; Hokkanen, T.; Ukonmaanaho, L.; Kukkola, M.; Nojd, P.; Sievanen, R. Predicting annual canopy litterfall production for Norway spruce (Picea abies (L.) Karst.) stands. For. Ecol. Manag. 2007, 242, 578–586. [Google Scholar] [CrossRef]
  21. Enquist, B.J.; Brown, J.H.; West, G.B. Allometric scaling of plant energetics and population density. Nature 1998, 395, 163–165. [Google Scholar] [CrossRef]
  22. Taylor, J.E.; Ellis, M.V.; Rayner, L.; Ross, K.A. Variability in allometric relationships for temperate woodland Eucalyptus trees. For. Ecol. Manag. 2016, 360, 122–132. [Google Scholar] [CrossRef]
  23. Taskinen, S.; Warton, D.I. Robust estimation and inference for bivariate line-fitting in allometry. Biom. J. 2011, 53, 652–672. [Google Scholar] [CrossRef] [PubMed]
  24. Ma, Y.Z.; Cheng, D.L.; Zhong, Q.L.; Jin, B.J.; Xu, C.B.; Hu, B. Allometric relationships among different components of forest litterfall in China. Chin. J. Plant Ecol. 2014, 37, 1071–1079, (In Chinese with English abstract). [Google Scholar] [CrossRef]
  25. Cheng, D.L.; Ma, Y.Z.; Zhong, Q.L.; Xu, W.F. Allometric scaling relationship between above- and below-ground biomass within and across five woody seedlings. Ecol. Evol. 2014, 4, 3968–3977. [Google Scholar] [CrossRef] [PubMed]
  26. Bossard, C.C.; Cao, Y.; Wang, J.; Tang, Y. New patterns of establishment and growth of Picea abies and Betula tree species in subalpine forest gaps of Jiuzhaigou National Nature Reserve, Sichuan, southwestern China in a changing environment. For. Ecol. Manag. 2015, 356, 84–92. [Google Scholar] [CrossRef]
  27. Swamy, S.L.; Dutt, C.B.S.; Murthy, M.S.R.; Mishra, A.; Bargali, S.S. Floristics and dry matter dynamics of tropical wet evergreen forests of Western Ghats, India. Curr. Sci. 2010, 99, 353–364. [Google Scholar]
  28. Wu, F.Z.; Yang, W.Q.; Zhang, J.; Deng, R.J. Litter decomposition in two subalpine forests during the freeze-thaw season. Acta Oecol. 2010, 36, 135–140. [Google Scholar] [CrossRef]
  29. He, W.; Wu, F.Z.; Yang, W.Q.; Zhang, D.J.; Xu, Z.F.; Tan, B.; Zhao, Y.Y.; Justine, M.F. Gap locations influence the release of carbon, nitrogen and phosphorus in two shrub foliar litter in an alpine fir forest. Sci. Rep. 2016, 6, 22014. [Google Scholar] [CrossRef] [PubMed]
  30. Ni, X.Y.; Yang, W.Q.; Tan, B.; He, J.; Xu, L.Y.; Li, H.; Wu, F.Z. Accelerated foliar litter humification in forest gaps: Dual feedbacks of carbon sequestration during winter and the growing season in an alpine forest. Geoderma 2015, 241–242, 136–144. [Google Scholar] [CrossRef]
  31. Xiao, S.; Wu, F.Z.; Yang, W.Q.; Chang, C.H.; Li, J.; Wang, B.; Cao, Y. Understory biomass and its characteristics as affected by forest gap in the alpine forest ecosystem in west Sichuan. J. Ecol. Environ. Sci. 2014, 23, 1515–1519, (In Chinese with English abstract). [Google Scholar]
  32. Zhang, X.P.; Wang, X.P.; Zhu, B.; Zong, Z.J.; Peng, C.H.; Fang, J.Y. Litter fall production in relation to environmental factors in northeast China’s forests. Chin. J. Plant Ecol. 2008, 32, 1031–1040, (In Chinese with English abstract). [Google Scholar]
  33. Giaccone, E.; Colombo, N.; Acquaotta, F.; Paro, L.; Fratianni, S. Climate variations in a high altitude Alpine basin and their effects on a glacial environment (Italian Western Alps). Atmosfera 2015, 28, 117–128. [Google Scholar] [CrossRef]
  34. Rustad, L.E.; Fernandez, I.J. Soil warming: consequences for foliar litter decay in a Spruce-fir forest in maine, USA. Soil Sci. Soc. Am. J. 1998, 62, 1072–1080. [Google Scholar] [CrossRef]
  35. Fukuda, M.; Koaze, T.; Nogami, M. Physical geography in cold regions: past and present. Geography 2008, 56, 103–111. [Google Scholar] [CrossRef]
  36. Gairola, S.; Rawal, R.S.; Dhar, U. Patterns of litterfall and return of nutrients across anthropogenic disturbance gradients in three subalpine forests of west Himalaya, India. J. For. Res. Jpn. 2009, 14, 73–80. [Google Scholar] [CrossRef]
  37. Miao, N.; Liu, S.R.; Yu, H.; Shi, Z.M.; Moermond, T.; Liu, Y. Spatial analysis of remnant tree effects in a secondary Abies-Betula forest on the eastern edge of the Qinghai-Tibetan Plateau, China. For. Ecol. Manag. 2014, 313, 104–111. [Google Scholar] [CrossRef]
  38. Clark, D.A.; Brown, S.; Kicklighter, D.W.; Chambers, J.Q.; Thomlinson, J.R.; Ni, J.; Holland, E.A. Net primary production in tropical forests: An evaluation and synthesis of existing field data. Ecol. Appl. 2008, 11, 371–384. [Google Scholar] [CrossRef]
  39. Reich, P.B.; Walters, M.B.; Kloeppel, B.D.; Ellsworth, D.S. Different photosynthesis-nitrogen relations in deciduous hardwood and evergreen coniferous tree species. Oecologia 1995, 104, 24–30. [Google Scholar] [CrossRef] [PubMed]
  40. Yoshiyuki, M.; Kyoichi, O. Comparison of sapling-level daily light capture and carbon gain between a temperate deciduous and a co-occurring evergreen tree species in the growing season and in winter. Funct. Plant Biol. 2010, 37, 215–222. [Google Scholar]
  41. Öquist, G.; Huner, N.P.A. Photosynthesis of overwintering evergreen plants. Annu. Rev. Plant Biol. 2003, 54, 329–355. [Google Scholar] [CrossRef] [PubMed]
  42. Jia, B.G.; Zhou, G.S.; Xu, Z.Z. Forest litterfall and its composition: A new data set of observational data from China. Ecology 2016, 97, 1365. [Google Scholar] [CrossRef]
  43. Hennessey, T.C.; Dougherty, P.M.; Cregg, B.M.; Wittwer, R.F. Annual variation in needle fall of a loblolly pine stand in relation to climate and stand density. For. Ecol. Manag. 1992, 51, 329–338. [Google Scholar] [CrossRef]
  44. Bonan, G.B. Forests and climate change: Forcings, feedbacks, and the climate benefits of forests. Science 2008, 320, 1444. [Google Scholar] [CrossRef] [PubMed]
  45. Capell, B.; Dörffling, K. Low Temperature-Induced changes of abscisic acid contents in barley and cucumber leaves in relation to their water status. J. Plant Physiol. 1990, 135, 571–575. [Google Scholar] [CrossRef]
  46. Nihlgård, B. Plant biomass, primary production and distribution of chemical elements in a beech and a planted spruce forest in south Sweden. Oikos 1972, 23, 69–81. [Google Scholar] [CrossRef]
  47. Scoriza, R.N.; Piñarodrigues, F.C.M. Influence of precipitation and air temperature in production of litterfall in stretch of seasonal forest. Floresta 2014, 44, 687–696. [Google Scholar] [CrossRef]
  48. Wei, X.; Kimmins, J.P.; Peel, K.; Steen, O. Mass and nutrients in woody debris in harvested and wildfire-killed lodgepole pine forests in the central interior of British Columbia. Can. J. For. Res. 2011, 27, 148–155. [Google Scholar] [CrossRef]
  49. Samuelson, L.; Stokes, T.; Butnor, J.R.; Johnsen, K.H.; Gonzalez-Benecke, C.A.; Anderson, P.; Jackson, J.; Ferrari, L.; Martin, T.A.; Cropper, W.P. Ecosystem carbon stocks in Pinus palustris forests. Can. J. For. Res. 2014, 44, 476–486. [Google Scholar] [CrossRef]
  50. Woldendorp, G.; Keenan, R.J. Coarse woody debris in Australian forest ecosystems: A review. Austral Ecol. 2006, 30, 834–843. [Google Scholar] [CrossRef]
  51. Do, T.V.; Sato, T.; Saito, S.; Kozan, O. Fine-root production and litterfall: Main contributions to net primary production in an old-growth evergreen broad-leaved forest in southwestern Japan. Ecol. Res. 2015, 30, 921–930. [Google Scholar]
  52. McLaren, J.R.; Buckeridge, K.M.; van de Weg, M.J.; Shaver, G.R.; Schimel, J.P.; Gough, L. Shrub encroachment in Arctic tundra: Betula nana effects on above- and below- ground litter decomposition. Ecology 2017, 98, 1361–1376. [Google Scholar] [CrossRef] [PubMed]
  53. Bebawi, F.F.; Campbell, S.D.; Mayer, R.J. Seed Fall, Seed fall, seed predation, twigging and litter fall of Cascabela thevetia (L.) Lippold. Rangeland J. 2017, 38, 569–577. [Google Scholar] [CrossRef]
  54. Boudreault, C.; Drapeau, P.; Bouchard, M.; Stlaurent, M.H.; Imbeau, L.; Bergeron, Y. Contrasting responses of epiphytic and terricolous lichens to variations in forest characteristics in northern boreal ecosystems. Can. J. For. Res. 2015, 45, 595–606. [Google Scholar] [CrossRef]
Figure 1. Daily mean air temperature (a) and monthly precipitation (b) in the sub-alpine coniferous forest on the eastern Tibetan Plateau from August 2015 to July 2016.
Forests 08 00314 g001
Figure 2. The seasonal dynamics of the production percentage of each litter component (a), tree versus shrub (b), evergreen versus deciduous (c) and the major species (d). MG: middle growing season, LG: late growing season, SF: snow-formation period, SC: snow-cover period, ST: snow-melting period, and EG: early growing season.
Forests 08 00314 g002
Figure 3. Litterfall rate of annual total litter (a), foliar litter (b), woody litter (c), reproductive litter (d), epiphytic litter (e) and miscellaneous litter (f) in the sub-alpine forest from August 2015 to July 2016. MG: middle growing season, LG: late growing season, SF: snow-formation period, SC: snow-cover period, ST: snow-melting period, and EG: early growing season. 1 August 2015, was the first day of the sampling time series. Based on the mass of litterfall (M, kg·ha−1) collected per time and the corresponding sample collection days (T, day; Table S2) of each sample collection period, the average litterfall rate (R, kg·ha−1·day−1) was calculated using this formula R = M/T. Due to heavy snow, the litter was collected only once during the snow-cover period; thus, the figure does not show connecting lines in the “SC” period of each graph. The vertical scale varies from graph to graph.
Forests 08 00314 g003
Figure 4. Litter production of the seven dominant species and other species. MG: middle growing season, LG: late growing season, SF: snow-formation period, SC: snow-cover period, ST: snow-melting period, and EG: early growing season. Monthly total litter is the mean production of total litterfall per month in each season. The vertical axes are different for each graph.
Forests 08 00314 g004
Table 1. Annual litter production by component in a sub-alpine spruce-fir forest on the eastern Tibetan Plateau (values are the mean ± standard deviation, n = 3).
Component CategoriesMean ± SD (kg·ha−1·year−1)Percentage (%)
Foliar litter a †needle1263 ± 7853.1 a
leaf488 ± 23620.5 b
Woody litter btwig363 ± 14515.2 bc
bark9 ± 30.4 d
Reproductive litter bflower14 ± 70.6 cd
fruit and seed57 ± 172.4 cd
Epiphytic litter b\31 ± 181.3 cd
Miscellaneous b\155 ± 406.5 cd
Total\2380 ± 510100.00
Different letters within a column denote significant differences among components at p = 0.05.
Table 2. Relationships among different litter components. Values show Person’s r. n = 60. * indicates p < 0.05, and ** indicates p < 0.01.
Foliar LitterTwigBarkFruit and SeedFlowerEpiphytic LitterMiscellaneous
Twig0.596 **1
Bark0.386 **0.477 **1
Fruit and seed0.349 **0.519 **0.467 **1
Flower0.1570.0970.392 **0.327 *1
Epiphytic litter0.2140.1950.1070.068−0.0421
Miscellaneous0.752 **0.707 **0.465 **0.407 **0.1880.2381
Table 3. F and p values from two-way ANOVAs testing the effects of sampling time and species on litter production.
Litter ComponentsSampling TimeSpeciesSampling Time × Species
F Valuep ValueF Valuep ValueF Valuep Value
Foliar litter5.64<0.0011.920.0092.67<0.001
Twig litter0.450.922.050.0091.68<0.001
Bark litter0.620.801.310.170.611.00
Fruit and seed litter0.600.811.010.441.480.009
Flower litter5.85<0.0018.050.0094.13<0.001
Total litter3.48<0.0012.78<0.0013.35<0.001
Table 4. The seasonal variability of litter production. Peak: the highest percentage of monthly litterfall throughout the year; valley: the lowest percentage of monthly litterfall throughout the year; and PVR: peak/valley ratio. Values are mean ± standard deviations.
SpeciesPeak (%)Valley (%)PVR
Vertical structure
 Tree species32.7 ± 3.21.3 ± 0.825.2 ± 4.5
 Shrub species4.1 ± 1.20.01 ± 0.01410.0 ± 178.1
Functional type
 Evergreen species22.7 ± 4.81.3 ± 0.917.5 ± 6.1
 Deciduous species14.6 ± 3.40.03 ± 0.1486.7 ± 98.5
Table 5. Allometric scaling relationships among different litter components, evergreen versus deciduous and tree versus shrub (LT: total litter; LF: foliar litter; LW: woody litter; LR: reproductive litter; LM: miscellaneous; LE: epiphytic litter; Lty: tree litter; Lsy: shrub litter; Lev: evergreen species litter; and Lde: deciduous species litter). * indicates p < 0.05, and ** indicates p < 0.01.
ComparisonnR2β (95%CI)logγ (95%CI)Test if β Equals a Specific Value (β0 = 1), F
Litter components
LF∝LT600.98 **0.99 (0.95, 1.03)−0.1 (−0.18, −0.01)0.54
LW∝LT600.63 **1.40 (1.19, 1.64)−1.96 (−2.46, −1.47)18.14 **
LR∝LT600.31 **0.98 (0.79, 1.22)−1.66 (−2.14, −1.19)0.03
LE∝LT600.040.93 (0.72, 1.19)−1.88 (−2.42, −1.34)0.36
LM∝LT600.74 **0.82 (0.71, 0.93)−0.71 (−0.95, −0.46)9.15 **
LF∝LW600.53 **0.71 (0.59, 0.84)1.29 (1.11, 1.46)15.64 **
LF∝LR600.28 **1.00 (0.80, 1.25)1.57 (1.39, 1.76)0.001
LF∝LE600.041.06 (0.83, 1.37)1.9 (1.69, 2.11)0.24
LF∝LM600.65 **1.21 (1.03, 1.41)0.76 (0.54, 0.97)5.96 *
LW∝LR600.31 **1.42 (1.15, 1.77)0.40 (0.15, 0.65)10.89 **
LW∝LE600.051.51 (1.17, 1.94)0.87 (0.58, 1.156)10.91 **
LW∝LM600.65 **1.71 (1.46, 2.00)−0.75 (−1.06, −0.45)51.97 **
LR∝LE600.08 *1.06 (0.83, 1.36)0.33 (0.13, 0.52)0.22
LR∝LM600.34 **1.20 (0.97, 1.49)−0.81 (−1.11, −0.51)3.03
LE∝LM600.051.13 (0.88, 1.46)−1.08 (−1.43, −0.51)0.97
Tree versus shrub
Lty∝LT600.96 **1.05 (1.00, 1.11)−0.22 (−0.34, −0.09)3.57
Lsy∝LT600.051.32 (1.03, 1.70)−2.37 (−3.14, −1.60)4.83 *
Lty∝Lsy600.010.80 (0.62, 1.03)1.68 (1.43, 1.93)3.04
Evergreen versus deciduous
Lev∝LT600.83 **1.14 (1.02, 1.27)−0.52 (−0.80, −0.25)5.89 *
Lde∝LT600.35 **1.58 (1.28, 1.94)−2.24 (−2.98, −1.50)19.73 **
Lev∝Lde600.13 *0.72 (0.57, 0.92)1.10 (0.81, 1.38)7.19 *

