C:N:P Stoichiometry and Carbon Storage in a Naturally-Regenerated Secondary Quercus variabilis Forest Age Sequence in the Qinling Mountains, China


1
College of Forestry, Northwest A&F University, Yangling 712100, Shaanxi, China
2
Key Laboratory of Ecosystem Network Observation and Modeling, Qianyanzhou Ecological Station, Institute of Geographic Sciences and Natural Resources Research, Chinese Academy of Sciences, Beijing 100101, China
3
University of Chinese Academy of Sciences, Beijing 100049, China
4
State Key Laboratory of Soil Erosion and Dryland Farming on the Loess Plateau, Northwest A&F University, Yangling 712100, Shaanxi, China
5
Institute of Soil and Water Conservation, Chinese Academy of Sciences and Ministry of Water Resources, Yangling 712100, Shaanxi, China
*
Author to whom correspondence should be addressed.
Forests 2017, 8(8), 281; https://doi.org/10.3390/f8080281
Submission received: 7 June 2017
/
Revised: 28 July 2017
/
Accepted: 4 August 2017
/
Published: 6 August 2017
Abstract
:Large-scale Quercus variabilis natural secondary forests are protected under the Natural Forest Protection (NFP) program in China to improve the ecological environment. However, information about nutrient characteristics and carbon (C) storage is still lacking. Plant biomass and C, nitrogen (N) and phosphorus (P) stoichiometry of tree tissues, shrubs, herbs, litter, and soil were determined in young, middle-aged, near-mature and mature Quercus variabilis secondary forests in the Qinling Mountains, China. Tree leaf N and P concentrations indicated that the N-restricted situation worsened with forest age. The per hectare biomass of trees in decreasing order was near-mature, mature, middle-aged, then young stands. The majority of the biomass was in the stems (44.88–48.15%), followed by roots (24.54–28.68%), and branches (10.15–14.16%), and leaves made up the lowest proportion (2.86–3.55%) of trees. C storage at plant layer increased significantly with age, reaching maximum values in near-mature stand (100.4 Mg·ha−1) and then decreasing in mature stands. Soil C storage at a depth of 0 to 100 cm was 82.8, 96.8, 85.8, 104.2 Mg·ha−1, and C storage of forest ecosystem was 122.8, 163.0, 184.9, 178.3 Mg·ha−1 in young, middle-aged, near-mature, mature stands, respectively. There were significant correlations between biomass and C, N, P stoichiometry in different layers, especially in young stands.
1. Introduction
Carbon (C), nitrogen (N), and phosphorus (P) are key elements to living organisms, and their ratios are a useful indicator of nutrient limitation in terrestrial ecosystems and ecosystem function [1,2]. Nutrient concentrations and their ratios generally change with plant growth, as plants have different photosynthetic capabilities and nutrition requirement at different growth stages [3]. C is fixed through photosynthesis which leads to the accumulation of C storage in plant biomass. Meanwhile, plants take up mineral nutrients rapidly at early stages, which lead to the accumulations of N and P, after which a dilution effect may result in decrease of nutrient concentrations as the plant ages [4,5]. As a consequence, C:N and C:P ratios are important physiological properties that reflect plant growth rate related to the N and P use efficiency [6,7], and N:P ratios can be used to infer potential nutrient limitations on terrestrial primary productivity [8,9]. Such changes have typically been found in some annual species or perennial species which have a growing season or year [3]. However, these changes in perennial species are more complex because of their longer lifespan and continual usage of nutrients. Clarifying how nutrient concentrations change with stand age would help to increase understanding of how perennial plants adapt to their environments.
Forest ecosystems play an important role in mitigating the effect of greenhouse and stabilizing climate through photosynthesis, sequestering atmospheric C in plant biomass, and in soil [10,11]. To understand the process of C cycle and sequestration, it is necessary to accurately determine biomass of trees. Forest ecosystem biomass contains about 80% of aboveground terrestrial C and 40% of belowground C [10]. Thus, tree and stand biomass data are fundamental for finding better measures for the evaluation of the forest ecosystem functioning and for developing good policies that move toward sustainable management [12]. The accurate determination of C concentration and forest ecosystem biomass are the basis of reasonable estimation of C storage and distribution pattern in forest ecosystems. Forest age is considered to be a primary driver for changes in forest structure and function, because as trees age, photosynthetic capacity [13], C storage in live biomass [14], nutrient concentrations and their stoichiometry [15], and C balance [14] all change. Previous studies have reported that tree growth in Eucalyptus plantations declined with forest age and this decline may be associated with changes in stand structure, resource usage efficiency, foliar respiration and gross primary production [16]. However, these studies usually focused on overstory biomass and failed to investigate understory biomass even though understory plants have been recognized as important components of forest ecosystems [17,18]. In addition, the relationships between biomass and C, N, P stoichiometry can provide a better understanding of biogeochemical cycle. Although the relationships between biomass and either nutrient concentrations or N:P ratios are generally weak, unimodal relationships with maximal biomass production at intermediate N:P ratios have been observed occasionally, and there is no relationship between biomass and increasing N:P ratio [19]. Higher biomass production was only found in vegetation with a N:P ratio <15 in herbaceous wetlands [20,21]. Biomass production of road verges was positively correlated with N and P concentration but weakly negatively with N:P ratios [22]. Little research has studied relationships between forest ecosystem biomass in different layers and C, N, P stoichiometry.
Quercus spp. is one of the most widespread and abundant tree genera in the world. This genus is a key stone species in a wide range of habitats from Mediterranean semi-desert wood lands to subtropical rainforest, dominating broad-leaved evergreen forests in Europe, North America and Southeast Asia [23]. Quercus variabilis is the main vegetation tree species in warm temperate zone with elevation lower than 1600 m in China, and attracts much attention because of their value in producing wood, cork, charcoal, and edible fungi. The importance of Quercus variabilis in the international market is second only to Quercus suber, and it plays a significant role in protecting the ecological balance and developing local economy [24]. It is well known that Quercus spp. account for more than 40% of the forest area and is mainly found in the Qinling Mountain area in Shaanxi Province, China. Under the Natural Forest Protection (NFP) program in China, their potential carbon sequestration will be greatly improved. A growing number of studies have addressed C storage and sequestration in key national ecological restoration programs in China [25], such as Three-North Shelterbelt Forest program, the Sloping Land Conversion program, Beijing-Tianjin Sandstorm Source Control program, Changjiang (Yangtze) River Basin Forest Protection program. However, there is still a lack of focus on the NFP program and the biomass and C storage of Quercus variabilis natural secondary forests in the Qinling Mountain area, which is crucial for prediction of the responses of regional and global carbon balance to future climate change.
In this study, we chose 20 Quercus variabilis natural secondary forest stands as sampling sites to reveal stand biomass and C storage allocation across an age sequence in the Qinling Mountain in Shaanxi Province, China. Our objectives were (1) to investigate the variation of C, N and P stoichiometry of the ecosystem components (tree, shrub, herb, litter and soil) across an age sequence; (2) to assess the changes in the size and contribution of these C pools to total ecosystem C stock with increasing stand age; (3) to determine the relationships between biomass and C, N, P stoichiometry in tree, shrub, herb and litter layer with age.
2. Materials and Methods
2.1. Site Description
This study was conducted in Weinan, Baoji, Xi’an, Shangluo, Hanzhong and Ankang Countries of Shaanxi province in northwest China, spanning from 106°51′ to 110°53′ E, 32°6′ to 34°36′ N, located in south and north areas of the Qinling Mountains in China. The Qinling Mountains run east-west and act as an important watershed divider between the Yangtze River and the Yellow River. The study area is situated in the transitional area between the subtropical zone and the warm temperate zone, with mean annual temperature ranged from 8 to 14 °C, and mean annual precipitation from 520 to 1400 mm. The main soil types are brown spots soil and yellow brown soil.
2.2. Field Sampling and Measurements
Based on the “Regulations for age-class and age-group division of main tree-species” formulated by China’s State Forestry Administration in 2011, Quercus variabilis secondary forest was classified in young (≤40 a), middle-aged (41–60 a), near-mature (61–80 a) and mature (80–120 a) stages. Eight young, six middle-aged, three near-mature and three mature stands were selected in July 2012 based on the actual situation and the area’s proportion of different age stages (Figure 1). Three quadrats (20 m by 50 m) were randomly selected within each stand for sampling. The main shrub species in these stands are Lonicera japonica, Lespedeza bicolor, Cotinus coggygria, Viburnum dilatatum, Dalbergia hupeana, and Magnolia multiflora. The main herb species are Carex lancifolia, Calamagrostis epigejos, Spodiopogon sibiricus, Chrysanthemum lavandulifolium.
All trees in each plot were numbered and measured for diameter at breast height (DBH) and height (H). Five standard trees within representative stand-specific DBH range were selected to sample the leaves, branches, stems (including barks) and roots. Mature leaves were picked from east, west, south and north directions of the tree crown. Three branches were cut from the upper, middle and lower canopies in the south direction of the tree crown. Stems were cut from the diameter at DBH. Roots were dug up to the depth of 40 cm, and roots were not classified. The same tissues in each plot were mixed uniformly into one sample and fresh weight was measured, and the subsamples were transported to the lab. The biomass of tree components, including leaves, branches, stems, barks and roots, were generally estimated using different allometric regression models based on DBH or DBH-H [26]. The allometric regression models used in this study were developed in the Shangluo county area in Qinling Mountain area in early August 2013, and the detailed operation process was recorded by Cao Y and Chen YM [25]. The allometric regression models are shown in Table 1.
Shrub and herb biomass in each plot was determined using total harvesting destructive sampling techniques. Three shrub quadrats (2 m by 2 m) and three herb quadrats (1 m by 1 m) along diagonals were selected within each tree plot. Shrubs were separated into leaves, branches and roots components; and herbs were separated into the aboveground and underground components. Litter was sampled by collecting the entire organic material within three quadrats (1 m by 1 m) along diagonals selected within each tree plot. The same component of shrub, herbs and litter were mixed uniformly into one sample and fresh weight was measured, and the subsamples were transported to the lab.
Each vegetation component was oven-dried at 85 °C at least 48 h to a constant mass, and then weighed. The moisture content of subsamples (P) in shrub, herb and litter layers was calculated through Equation (1), and converted to biomass in each quadrat (WD) by Equation (2). Biomass in each quadrat can be converted to biomass per hectare. The carbon storage of tree, shrub, herb, litter was their C concentration multiplied by their biomass.
where P is the moisture content of subsamples; WDS is the dry weight of the subsamples after oven-dried (g); WFS is the fresh weight of the subsamples (g); WD is the dry weight of each quadrat (g); WF is the fresh weight of each quadrat (g).
P = 1 − (WDS/WFS)
WD = WF (1 − P)
Soil samples were taken using a soil corer (4.2 cm in diameter) at depths of 0–10, 10–20, 20–30, 30–50, and 50–100 cm. Three replicate samples were randomly collected in each plot. A soil profile (1 m3) in each plot was dug to measure soil bulk density (g·cm−3). The soil carbon storage at depth of 0–100 cm was the sum of C storage in each soil layer. C storage in each soil layer was calculated using Equation (3):
Si is the C storage of soil in the i-th soil layer (Mg·ha−1); Ci, BDi, and Depthi are the C concentration, soil bulk density, and soil depth of the i-th soil layer, with the units of mg·g−1, g·cm−3, and cm, respectively; and 10−1 is the unit conversion factor.
Si = Ci × BDi × Depthi × 10−1
2.3. Chemical Analysis
Plant samples were sealed in plastic bags, oven dried at 85 °C to constant weight to obtain wet-to-dry mass conversion factors, and then ground with the plant-sample mill (1093 Sample Mill, Hoganas, Sweden) into uniformly fine powder. Plant C and N concentrations were determined by an elemental analyzer (Carlo Erba 1106, Milan, Italy). Total P was determined by the HClO4-H2SO4 colorimetric method. After removing plant roots, fauna and debris by hand, soil samples were air dried at room temperature around 20 °C, and then grounded and passed through a 0.25 mm sieve. C concentration was determined by the K2Cr2O7-H2SO4 method, total N concentration by the Kjeldahl method, and total P by the HClO4-H2SO4 colorimetric method.
2.4. Data Analysis
Total ecosystem C storage was based on the combination of trees, shrubs, herbs, litter and soil pool. One-way analysis of variance (ANOVA) was used to analyze the effect of stand age on C, N, P stoichiometric characteristics, biomass and C storage of each component. Two-way ANOVA was used to determine effects of stand age, plant component or soil depth, and their interactions on plant or soil stoichiometric characteristics. The Pearson correlation was used to determine the relationships between biomass of different layers and C, N, P stoichiometry in tree, shrub, herb leaves and litter among different age classes. All the statistical processing was conducted by SPSS statistics (2010, ver.19.0; SPSS Inc., Chicago, IL, USA).
3. Results
3.1. C, N, P Stoichiometric Characteristics in Quercus variabilis Natural Secondary Forest
C, N, and P stoichiometry in different tissues showed different trends with forest age (Figure 2). For example, branch C concentration in trees significantly increased with age, reaching the maximum in middle-aged stands, and then decreasing; whereas stem P concentration showed the opposite trend. Tree leaf N and P, stem N, and branch P concentration decreased, while root C concentration increased with age. Roots’ N concentration was significant higher in young and near-mature stands than in middle-aged and mature stands (Figure 2a–c). The C:N and C:P ratios in tree leaves and C:N ratio in roots significantly increased with forest age. Stem C:P and N:P ratios significantly increased with age, reaching the maximum in middle-aged stands, and then decreasing; whereas root N:P ratio showed the opposite trend (Figure 2d–f). Within tree tissues, the C, N and P concentrations, and the N:P ratio in leaves had the highest values, whereas the C:N and C:P ratios in leaves had the lowest values compared to other components. Two-way ANOVAs indicated that stand age significantly affected tree N and P concentrations, C:N and C:P. In addition, tree tissue influenced all tree variables (Table 2). Interactions between stand age and tree tissue significantly affected leaf C and N concentrations, and C:N, C:P and N:P ratios (Table 2).
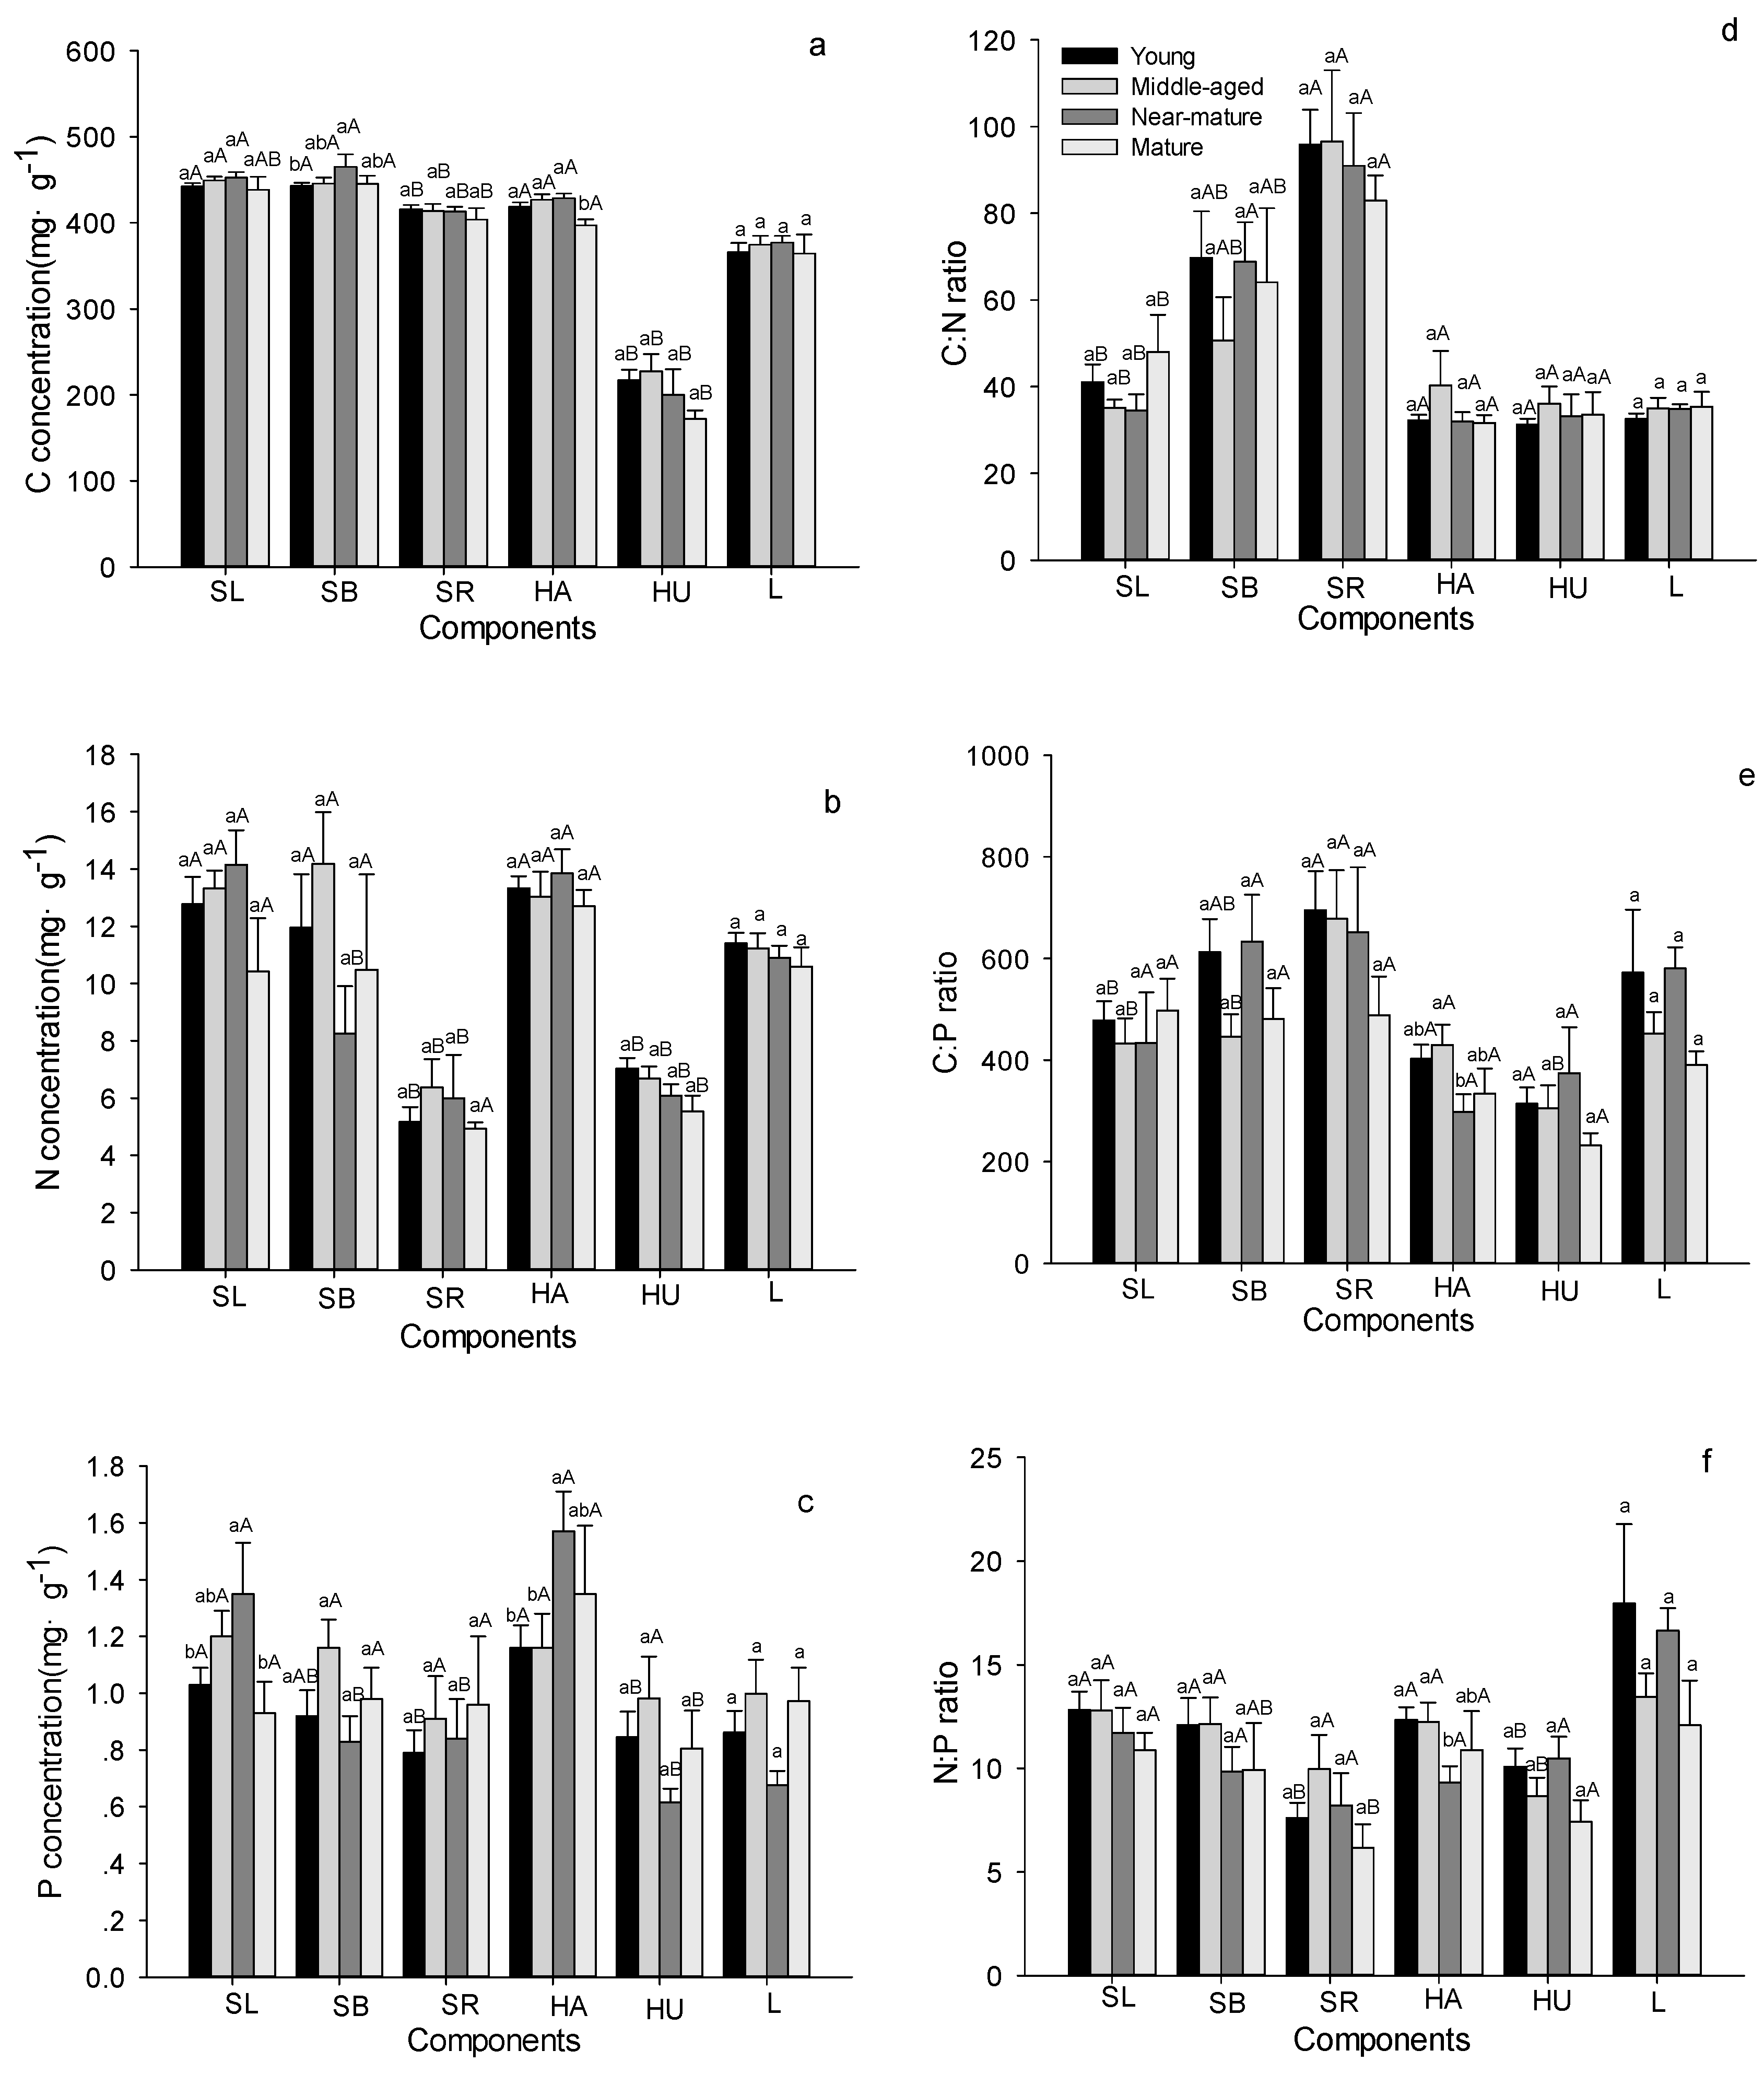
Stand age had no influence on the C, N and P stoichiometry for most shrub and herb tissues (Figure 3 and Table 2). For example, C concentrations in leaves and roots of shrubs, above- and under-ground herbs, and litter, did not show any age-dependent changes except in shrub branches (Figure 3a). The N concentrations and C:N ratios in leaves, branches and roots of shrubs, above- and under-ground herbs and litter did not show any age-dependent changes (Figure 3b,d). P concentrations in branches and roots of shrubs, underground herbs, and litter did not show any age-dependent changes, whereas P concentrations in shrub leaves and aboveground herbs significantly increased with age and reached the maximum values in the near-mature stand (Figure 3c). C:P, N:P ratios in shrubs, underground herbs, and litter did not show any age-dependent changes except in aboveground herbs (Figure 3e,f). Within shrub tissues, the roots had the lowest values of the C and N concentrations and N:P ratio, but had the highest values of the C:N and C:P ratios (Figure 3). Aboveground herbs had significantly higher C, N, P concentration than underground herbs, but there were no significant between them for the C:N, C:P, and N:P ratios (Figure 3).
C concentrations in soil remain unchanged with age in all soil layers (Figure 4a and Table 2). Soil N concentrations significantly increased with age at 30–50 and 50–100 cm depth, but no significant changes were seen at 0–10, 10–20, and 20–30 cm depths (Figure 4b). Soil P concentration remained stable from young to near-mature stands, and then increased significantly to the mature stands (Figure 4c). Soil C:N ratio at 0–10 cm depth was significantly higher in near-mature than in middle-aged stands, but the values significantly decreased with age at 10–20, 20–30, 30–50 and 50–100 cm depth (Figure 4d). Soil C:P and N:P ratios remained stable from young to near-mature stands, then decreased to the mature stand at 0–10, 10–20, 20–30 cm depths, while there were no significant differences among age at 30–50 and 50–100 cm depths (Figure 4e,f). The concentrations of C, N, and P, and their ratios decreased significantly with increasing soil depth (Figure 4 and Table 2).
3.2. Biomass Allocation in Quercus variabilis Natural Secondary Forest
The stand density was significantly higher in young and middle-aged stands than in near-mature and mature stands (Table 3). The single tree biomass increased with age, but the biomass per hectare increased significantly from young to near-mature stands with the maximum values, and then significantly decreased in mature stands.
The biomass of leaves, branches, stems (including barks) and roots increased with age and achieved the maximum value in near-mature stands (Figure 5a). In all four age classes, stems made up the highest proportion of tree biomass (57.61–58.47%), followed by roots (24.54–28.68%) and branches (10.15–14.16%), and leaves made up the lowest proportion (2.86–3.55%) of tree biomass (Figure 5b). The biomass percentage of leaves and roots decreased, while that of branches and stems increased with aging (Figure 5b).
The biomass of trees significantly increased with age, reaching the maximum in near-mature stands (215.01 Mg·ha−1), and then decreasing in mature stands (138.35 Mg·ha−1). The shrub biomass slightly decreased from young (2.49 Mg·ha−1) to middle-aged stands (1.39 Mg·ha−1), and then significantly increased in near-mature stands (6.87 Mg·ha−1), finally decreased to 3.80 Mg·ha−1 in mature stands. The herb biomass significantly decreased from young to middle-aged stands, and then significantly increased with age. The litter biomass did not show age-dependent changes. For the near-mature stands, the biomass distribution among different components was in a decreasing order of tree layer, shrub layer, litter layer, then herb layer. However, the decreasing order for the other aged stands was tree layer, litter layer, shrub layer, then herb layer (Table 4).
3.3. C Storage Allocation and the Relationships between Biomass and C, N, P Stoichiometry
C storage of leaves, branches, stems (including barks), and roots in trees significantly increased with age, achieving maximum value in near-mature stands, and then decreasing (Table 5). The tree C storage among different age classes was in a decreasing order of near-mature (95.90 ± 24.04 Mg·ha−1), middle-aged (59.40 ± 5.93 Mg·ha−1), mature (57.84 ± 12.19 Mg·ha−1), then young stands (37.71 ± 4.05 Mg·ha−1). C storage in shrub and plant layers showed the same trends as tree (Table 5). The herb C storage decreased initially, achieving minimum in middle-aged stands and then increased. The litter C storage did not show any significant differences as forest aged (Table 5).
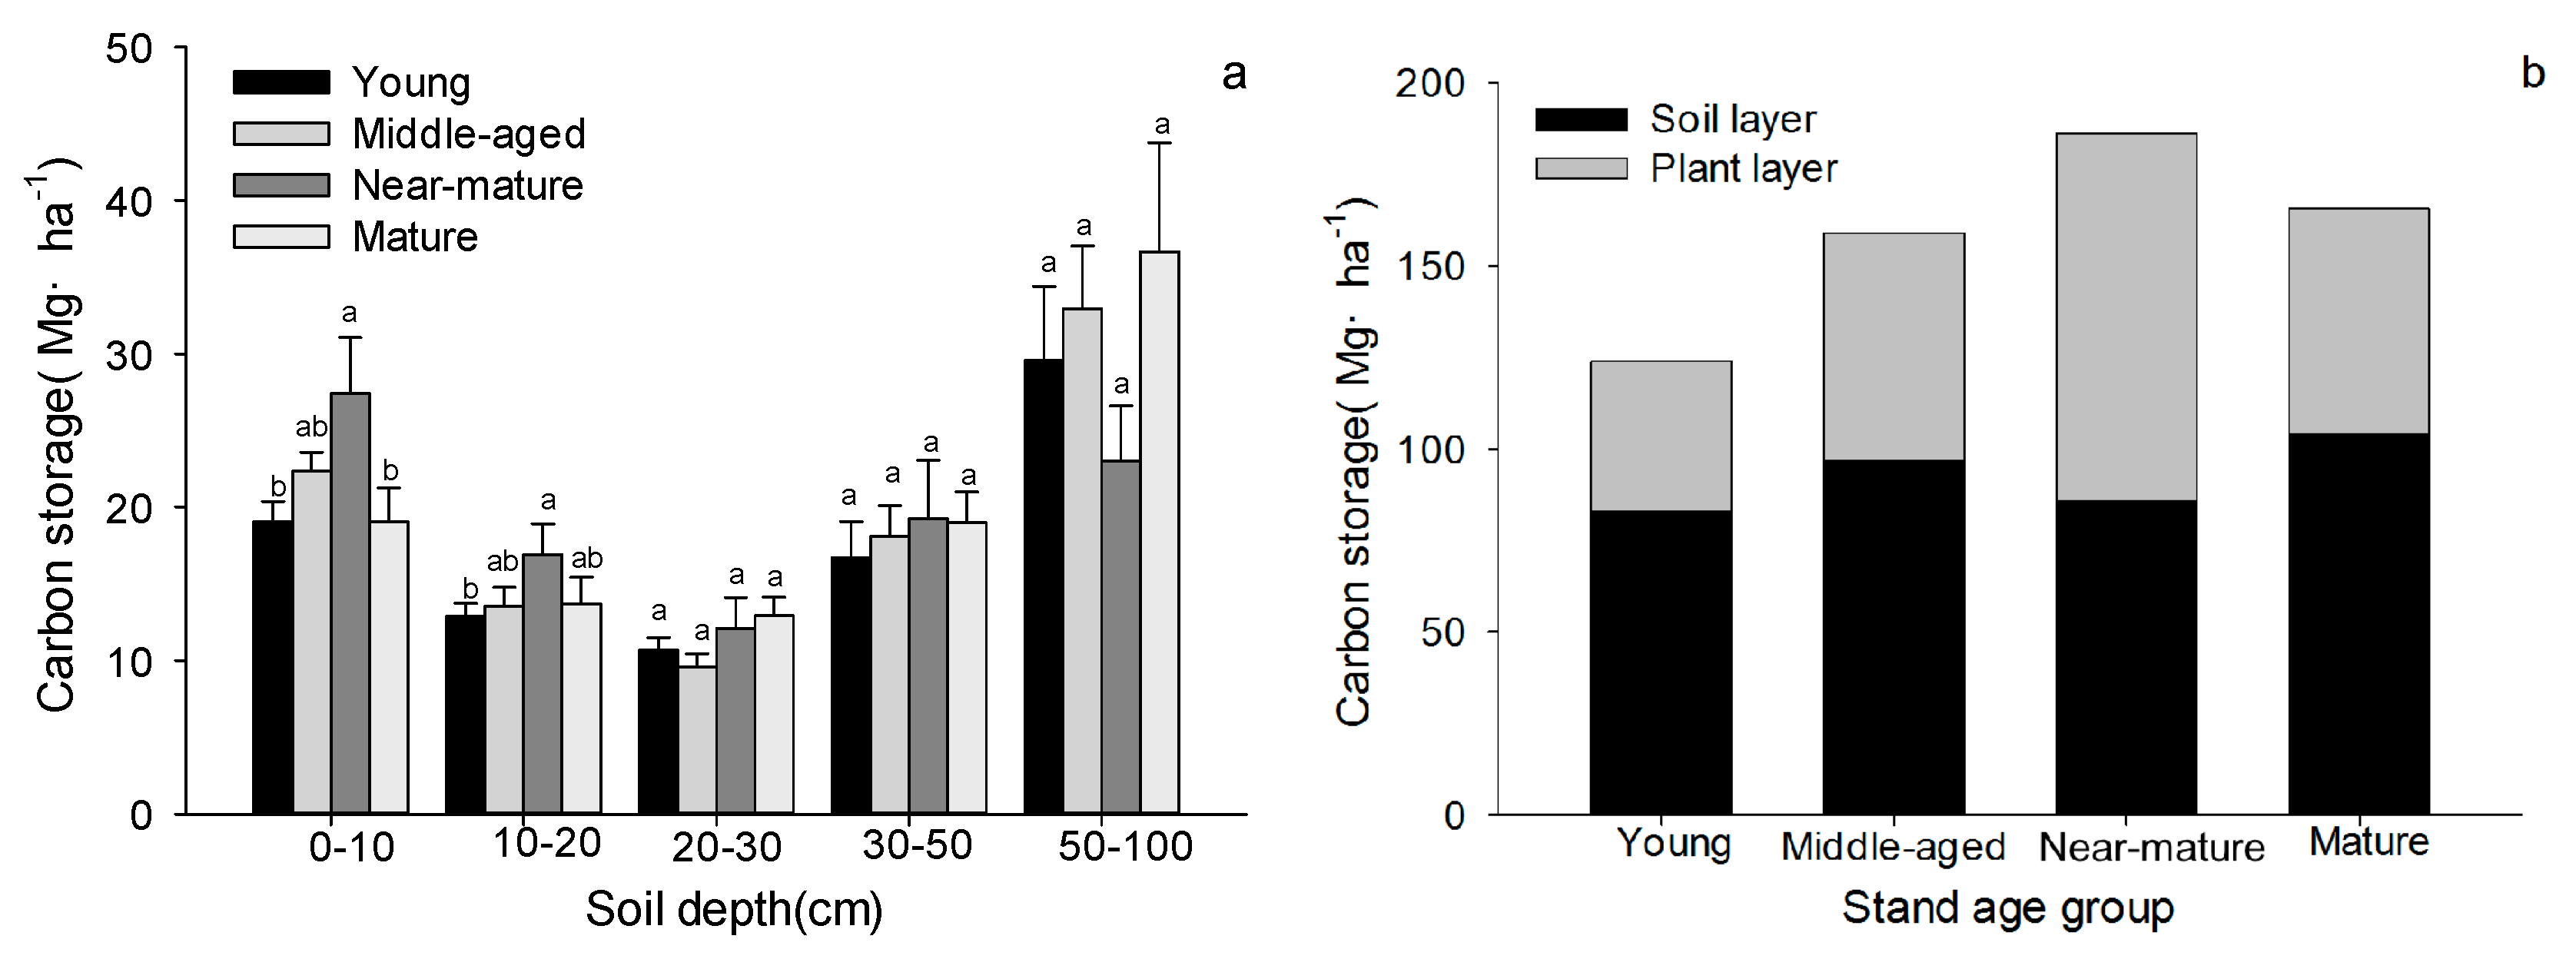
Soil carbon storage increased initially, achieving maximum value in near-mature stand and then decreased at 0–10 and 10–20 cm depths. While there were no significant differences in soil carbon storage at 20–30, 30–50 and 50–100 cm depths among different age classes (Figure 6a). C storage of the total ecosystem and the plant component increased initially, achieving maximum value in near-mature stands and then decreased, while there were no significant differences in soil layer carbon with the forest age (Figure 6b).
In this study, we determined the relationships between biomass of different layers and C, N, P stoichiometry of different components (tree, shrub, herb leaves and litter) among different age classes by Pearson correlation (Table 6). The results showed that the relationships between biomass and C, N, P stoichiometry varied with forest age. In young stands, C and P concentrations and C:P ratio in tree leaves showed significant correlations with tree biomass. Shrub leaves’ C, N and P concentrations showed positive correlations, but C:N, C:P ratios showed negative correlations with shrub biomass. Litter C and C:N showed negative correlations with litter biomass. In middle-aged stands, tree leaves’ C concentration was positively correlated with tree biomass, while herb leaves’ P and litter C concentration were negatively correlated with herb and litter biomass, respectively. In near-mature stands, shrub leaves’ C:N, C:P ratios had positive correlations with shrub biomass. The P concentration and C:P, N:P ratios in litter had significant correlations with litter biomass. In mature group, herb leaves’ N:P and litter C:P ratios had positive correlations with herb and litter biomass, respectively.
4. Discussion
4.1. C, N, P Stoichiometric Characteristics in Quercus Variabilis Natural Secondary Forest
In this study, tree leaf N and P concentration were 18.02 and 1.24 mg·g−1 respectively, which was consistent with the Quercus variabilis leaf N and P concentrations (18.33, 1.18 mg·g−1) of China’s flora [23]. Leaf N concentration was higher, while P concentration was lower than those of 13 Quercus species’ mean N and P concentrations (17.27, 1.54 mg·g−1) in whole China [23]. Tree leaf N and P concentration were lower than those of China’s flora [27] or the global flora [9]. The lower N and P concentration may be caused by woody leaves having lower N, P levels than herb species [27] and lower soil P concentration in study region. In this study, leaf N and P, branch P and stem N concentration in trees all decreased with forest age, and those of young and mature stands were significantly different. It was consistent with the study of Matzek and Vitousek [28] who reported that fast-growing organisms need relatively more phosphorus-rich RNA to support rapid rates of protein synthesis. In this study, there were no significant differences in leaf and branch N:P ratio of different age stands. This contradicts the growth-rate hypothesis that fast-growing organisms have lower N:P ratios. However, this is consistent with the hypothesis that faster-growing plants have higher RNA concentration, higher N and P percentages, and lower protein:RNA ratios, but not consistently lower N:P ratios [28]. This may be due to that plants had functions of storing material and P in RNA accounting for small proportion of total phosphorus in plant, making the growth-rate hypothesis more uncertain in higher plants [29]. In this study, the C:N and C:P ratios increased with forest age, which was consistent with the study of Zhang et al. [30] in Inner Mongolia grassland ecosystem research station. The increased C:N and C:P ratios in tree leaves with forest age was most likely driven by the increasing plant size, which lead to a dilution effect of N and P concentrations [31,32]. Trees in young and middle-aged stands grow quickly and have high metabolic activity, so the demand for nutrients is quite large. While trees in near-mature and mature stands have more structural material in which C accumulated, leading to higher C:N and C:P ratios [30].
In study region, the soil nutrients decreased with soil depth, which may be due to topsoil layers being affected by environmental factors and the nutrient return from litter. This results in soil nutrients being intensively distributed in topsoil layer first, and then shift into subsoil layer with water or other medium. Moreover, the soil C:N ratio decreased with the soil depth among different age classes, which may be explained by the fact that as the decomposition process occurs, easily decomposed material vanished and nitrogen is immobilized in decayed products and microbial biomass, leaving behind more durable material with slower decomposition rates and lower C:N ratio [33]. The organic matter in subsoil layers is more humified and older than that in topsoil layers, thus it is observed in the continually decreasing soil C:N ratio with soil depth [33,34]. There was an inverse relationship between soil organ C:N ratios and its decomposition rate because soil microbes needs both C as energy and N to form their body in the process of metabolism [35]. Plant residues, which have lower C:N ratios, would have a higher decomposition rate, and their mineralization and humification occur more easily. In this study, soil P concentration in mature stands was the highest; while soil C:N ratio in mature stands was the lowest, except for the 0–10cm depth. This may be explained by the fact that there was more litter and higher decomposition rate in the mature forests. On the other hand, it may also be explained by the growth of trees being relatively slower and the synthesis of dry matter slower in mature stands, which leads to the reduction of nutrients absorption, and thus soil nutrients accumulated during this period.
Several researches have showed that: If leaf N concentration >20 mg·g−1 and P concentration >1 mg·g−1, growth is not limited by N and P availability. If leaf N concentration <20 mg·g−1 and P concentration >1 mg·g−1, growth is limited by N. If leaf N concentration >20 mg·g−1 and P concentration <1 mg·g−1, growth is limited by P. If leaf N concentration <20 mg·g−1 and P concentration <1 mg·g−1, the N:P ratios can be used. N:P <14 indicates N limitation and N:P >16 indicates P limitation [7,36,37]. In this study, tree leaf N concentration was lower than 20 mg·g−1 and P concentration was larger than 1 mg·g−1, and the N concentration decreased with the forest age, suggesting that the N-restricted situation worsened with the forest age in Quercus variabilis natural forests.
4.2. Biomass Allocation of Quercus Variabilis Natural Secondary Forest
The biomass of trees among different age classes was in the decreasing order of near-mature, mature, middle-aged, then young stands, showing the trends of first increasing and then decreasing with forest age, which was consistent with the trends of biomass of Picea crassifolia forests in Qilian Mountains [38]. The decreasing order for single tree biomass was mature (248.66 kg·tree−1), near-mature (243.89 kg·tree−1), middle-aged (93.36 kg·tree−1), then young stands (53.22 kg·tree−1), which was consistent with the conclusion that biomass increases with forest age. That the biomass of near-mature group larger than that of mature stands may cause by the stand density of near-mature stands being bigger than that of mature stands. Forest productivity declined with forest age was a well-known phenomenon in forest management, and recent reviews have reported three main causes to explain this decline: decreasing leaf area [39], decreasing photosynthetic rate due to hydraulic limitation and decreasing stomatal or canopy conductance with tree height [40], and decreasing nutrient availability [41].
In the comparison of biomass in specific age class, the biomass in young stands (95.77 Mg·ha−1) was smaller than that of 35 a Quercus variabilis forest (141.17 Mg·ha−1), and the biomass in middle-aged stands (141.11 Mg·ha−1) was smaller than that of 45 a Quercus variabilis forest (167.64 Mg·ha−1) in the Baotianman Natural Reserve [42]. Biomass of all age classes in this study were all larger than that of natural Quercus wutaishanica forest (young and middle-aged stands 76.02 Mg·ha−1, near-mature stands 79.35 Mg·ha−1, mature stands 96.71 Mg·ha−1) in Ziwuling of Loess Plateau [43]. Consistent with previous studies, the biomass of stems accounted for the largest proportion, roots secondly, leaves the least in tree tissues of all age classes [25,42]. The biomass of understory vegetation was 1.99–5.66 Mg·ha−1 in different age classes, and the biomass of understory vegetation and litter accounted for small proportion of the stand biomass (young stands 11.47%, middle-aged stands 5.77%, near-mature stands 6.57%, mature stands 8.06%), which was also consistent with previous studies [25]. This may be associated with forest management, canopy structure, and soil conditions, which affect the growth of understory vegetation by light, nutrition and hydrothermal conditions [26].
4.3. Carbon Storage Allocation and Relationships between Biomass of Different Layers and C, N, and P Stoichiometry in Tree, Shrub, Herb and Litter Layer among Different Age Classes
In this study, the average C storage in tree component was 55.87 Mg·ha−1, larger than 37.52 Mg·ha−1 which was determined by Cui et al. [44] for all Quercus spp. in Shaanxi Province, and it was larger than 31.20 Mg·ha−1 determined by Cao et al. [45] in shaanxi forest ecosystem, and it was close to 59.19 Mg·ha−1 determined by Cao and Chen [25] in Quercus variabilis forest in the south slope of the Qinling Mountains, China. The average C storage in plant components (59.29 Mg·ha−1) was smaller than 65.28 Mg·ha−1 which was determined by Zhou et al. [46] in the plant component of forest ecosystem in China. It suggested that the C sequestration ability of Quercus variabilis vegetation in study area was at a higher level in Shaanxi province, but it was still at a lower level on a national scale. The average forest C storage was lower than that of Quercus spp. (90.44 Mg·ha−1) in South Korea by Nam et al. [47], but larger than in the study by Boulmane et al. [48] in forest stands of Tafachna (53.7 Mg·ha−1) and Reggada (48.3 Mg·ha−1) in the Central Middle Atlas. The carbon storage in plant components increased at first, achieving maximum storage in near-mature stands (100.40 Mg·ha−1) and then decreased in mature stands (61.45 Mg·ha−1). On the one hand, this may be caused by trees coming into the harvestable stage, and then cutting trees out of forest ecosystem. On the other hand, the population biomass could begin to decline due to nutrient limitation, senescing of trees, increasing plant and organ death rate after the stand maturation, and these factors may subsequently cause the decline of carbon storage in plant layer [49]. This was partly consistent with the study about C storage in a black locust forest on the Loess Plateau which showed that tree C storage increased from 5 to 38 years, but remarkably decreased from 38 to 56 years due to high tree mortality showing as an increase in soil C [50]; similarly, the decline of C storage in mature stands in this study could be attributed to the harvest of timber since there was no increase in soil C.
Soil C storage at a depth of 0 to 100 cm was 82.84, 96.76, 85.77 and 104.16 Mg·ha−1 and ecosystem carbon storage was 122.81, 163.03, 184.89 and 178.29 Mg·ha−1 in young, middle-aged, near-mature and mature stands, respectively. This is very close to the study in an age-sequence of Cyclobalanopsis glauca plantations in southwest China [51] in which soil C storage at a depth of 0 to 100 cm was 70.38, 90.84, 84.39, 107.99 Mg·ha−1 and ecosystem C storage was 110.83, 169.09, 174.80, and 222.68 Mg·ha−1 in 8-, 20-, 40-, 70-year old Cyclobalanopsis glauca stands, respectively. The average ecosystem C storage was 155.17 Mg·ha−1, was bigger than 144.86 Mg·ha−1 determined by Cui et al. [44] in Quercus spp. in Shaanxi Province, while it was a little lower than 163.76 Mg·ha−1 determined by Cao and Chen [25] in Quercus variabilis forest in the south slope of the Qinling Mountains, China. But in our study, we did not consider the biomass and C storage of fine roots, so the biomass and C storage may be underestimated.
Relationships between biomass and C, N, P stoichiometry in different layers varied with forest age, contradicting the review by Gusewell [19] which stated that relationships between biomass and either nutrient concentrations or N:P ratio were generally weak, there were significant correlations between biomass and C, N, P stoichiometry in different layers, especially in young stands. Schaffers [22] found that the biomass of road verges negatively correlated with N:P ratios, but there were positive relationships between N:P ratio and litter layer biomass in middle-age stands and herb biomass in mature stands.
5. Conclusions
Our study aimed to determine C, N, P concentration, biomass and carbon storage allocation of different tissues (leaves, branches, stems and roots) of trees and other components (shrubs, herbs, litter and soil) and their variation with forest age, besides the relationships between biomass of different layers and C, N, P stoichiometry in tree, shrub, herb leaves and litter in a naturally-regenerated secondary Quercus variabilis forest age sequence in the Qinling Mountains, China. C, N, P stoichiometry in plant components has different characters with forest age. Soil C, N, P stoichiometry decreased with soil depth in all age classes. The biomass and carbon storage of Quercus variabilis forests increased significantly from young to near-mature stands, and then decreased in mature stands. Stems and roots were the main proportion of total tree biomass across all age classes. Carbon storage in plant layer was 41.2, 62.1, 100.4, 61.4 Mg·ha−1, soil carbon storage at a depth of 0 to 100cm was 82.8, 96.8, 85.8, 104.2 Mg·ha−1, and ecosystem carbon storage was 122.8, 163.0, 184.9, 178.3 Mg·ha−1 in young, middle-aged, near-mature, mature stands, respectively. The C sequestration ability of Quercus variabilis vegetation in study area was at a higher level than in Shaanxi province, but it was still at a lower level than on a national scale. There were significant correlations between biomass and C, N, P stoichiometry in different layers, especially in young stands. This study demonstrated that large-scale Quercus variabilis forests in the Qinling Mountain area would play an important role in C sequestration under the NFP program. But in our study, due to the constraints of time and human resources, we did not consider the biomass and C storage of fine roots, so the biomass and C storage may be underestimated.
Acknowledgments
This work was supported by National Key R&D Program of China [2016YFC0501703]; the National Nature Science Foundation of China [No. 41371506 and 41201088].
Author Contributions
P.P.J. analyzed the data and wrote the paper. Y.M.C. and Y.C. field investigation and sample analyses, and contributed to the draft manuscript.
Conflicts of Interest
The authors declare that they have no conflict of interest. The funding sponsors had no role in the design of the study; in the collection, analyses, or interpretation of data; in the writing of the manuscript, and in the decision to publish the results.
References
- Elser, J.J.; Dobberfuhl, D.R.; MacKay, N.A.; Schampel, J.H. Organism size, life history, and N:P stoichiometry. Bioscience 1996, 46, 674–684. [Google Scholar] [CrossRef]
- Elser, J.J.; Sterner, R.W.; Gorokhova, E.; Fagan, W.F.; Markow, T.A.; Cotner, J.B.; Harrison, J.F.; Hobbie, S.E.; Odell, G.M.; Weider, L.J. Biological stoichiometry from genes to ecosystems. Ecol. Lett. 2000, 3, 540–550. [Google Scholar] [CrossRef]
- Wang, Z.N.; Lu, J.Y.; Yang, M.; Yang, H.M.; Zhang, Q.P. Stoichiometric characteristics of carbon, nitrogen, and phosphorus in leaves of differently aged Lucerne (Medicago sativa) Stands. Front. Plant Sci. 2015, 6, 1–10. [Google Scholar] [CrossRef] [PubMed]
- Markovic, J.; Štrbanovi´c, R.; Cvetkovi´c, M.; An´ąelkovic, B.; Živkovi´c, B. Effects of growth stage on the mineral concentrations in alfalfa (Medicago sativa L.) leaf, stem and the whole plant. Biotechnol. Anim. Husb. 2009, 25, 1225–1231. [Google Scholar]
- Yang, Y.H.; Luo, Y.Q.; Meng, L.; Schädel, C.; Han, W.X. Terrestrial C:N stoichiometry in response to elevated CO2 and N addition: A synthesis of two meta-analyses. Plant Soil 2011, 343, 393–400. [Google Scholar] [CrossRef]
- Agren, G.I. The C:N:P stoichiometry of autotrophs-theory and observations. Ecol. Lett. 2004, 7, 185–191. [Google Scholar] [CrossRef]
- Aerts, R.; Chapin, F.S., III. The mineral nutrition of wild plants revisited: A re-evaluation of processes and patterns. Adv. Ecol. Res. 2000, 30, 1–67. [Google Scholar]
- Campo, J.; Gallardo, J.F.; Herna´ndez, G. Leaf and litter nitrogen and phosphorus in three forests with low P supply. Eur. J. For. Res. 2014, 133, 121–129. [Google Scholar] [CrossRef]
- Reich, P.B.; Oleksyn, J. Global patterns of plant leaf N and P in relation to temperature and latitude. Proc. Natl. Acad. Sci. USA 2004, 101, 11001–11006. [Google Scholar] [CrossRef] [PubMed]
- Dixon, R.K.; Trexler, M.C.; Wisniewski, J.; Brown, S.; Houghton, R.A.; Solomon, A.M. Carbon pools and flux of global forest ecosystems. Science 1994, 263, 185–190. [Google Scholar] [CrossRef] [PubMed]
- Mohanraj, R.; Saravanan, J.; Dhanakumar, S. Carbon stock in Kolli forests, Eastern Ghats (India) with emphasis on above ground biomass, litter, woody debris and soils. iForest 2011, 4, 61–65. [Google Scholar] [CrossRef]
- Xiang, W.H.; Zhou, J.; Ouyang, S.; Zhang, S.L.; Lei, P.F.; Li, J.X.; Deng, X.W.; Fang, X.; Forrester, D.I. Species-specific and general allometric equations for estimating tree biomass components of subtropical forests in southern China. Eur. J. For. Res. 2016, 135, 963–979. [Google Scholar] [CrossRef]
- Zheng, Y.; Zhao, Z.; Zhou, J.J.; Zhou, H.; Liang, Z.S.; Luo, Z.B. The importance of slope aspect and stand age on the photosynthetic carbon fixation capacity of forest: A case study with black locust (Robinia pseudoacacia) plantations on the Loess Plateau. Acta Physiol. Plant. 2011, 33, 419–429. [Google Scholar] [CrossRef]
- Bradford, J.B.; Birdsey, R.A.; Joyce, L.A.; Ryan, M.G. Tree age, disturbance history, and carbon stocks and fluxes in subalpine Rocky mountain forests. Glob. Chang. Biol. 2008, 14, 2882–2897. [Google Scholar] [CrossRef]
- Agren, G.I. Stoichiometry and nutrition of plant growth in natural communities. Annu. Rev. Ecol. Evol. Syst. 2008, 39, 153–170. [Google Scholar] [CrossRef]
- Binkley, D.; Stape, J.; Ryan, M.; Barnard, H.; Fownes, J. Agerelated decline in forest ecosystem growth: An individual-tree, stand-structure hypothesis. Ecosystems 2002, 5, 58–67. [Google Scholar] [CrossRef]
- Nilsson, M.C.; Wardle, D.A. Understory vegetation as a forest ecosystem driver: Evidence from the northern Swedish boreal forest. Front. Ecol. Environ. 2005, 3, 421–428. [Google Scholar] [CrossRef]
- Wu, J.; Liu, Z.; Wang, X.; Sun, Y.; Zhou, L.; Lin, Y.; Fu, S. Effects of understory removal and tree girdling on soil microbial community composition and litter decomposition in two eucalyptus plantations in South China. Funct. Ecol. 2011, 25, 921–931. [Google Scholar] [CrossRef]
- Gusewell, S. N:P ratios in terrestrial plants: Variation and functional significance. New Phytol. 2004, 164, 243–266. [Google Scholar] [CrossRef]
- Venterink, H.O.; van der Vliet, R.E.; Wassen, M.J. Nutrient limitation along a productivity gradient in wet meadows. Plant Soil 2001, 234, 171–179. [Google Scholar] [CrossRef]
- Venterink, H.O.; Wassen, M.; Verkroost, A.W.M.; de Ruiter, P.C. Species richness-productivity patterns differ between N-, P-, and K-limited wetlands. Ecology 2003, 84, 2191–2199. [Google Scholar] [CrossRef]
- Schaffers, A.P. Soil, biomass, and management of semi-natural vegetation. Part I. Interrelationships. Plant. Ecol. 2002, 158, 229–246. [Google Scholar] [CrossRef]
- Wu, T.G.; Dong, Y.; Yu, M.K.; Wang, G.G.; Zeng, D.H. Leaf nitrogen and phosphorus stoichiometry of Quercus species across China. Forest Ecol. Manag. 2012, 284, 116–123. [Google Scholar] [CrossRef]
- Guam, A.J.; Linera, G. Edge effect on acorn removal and oak seedling survival in Mexican lower montane forest fragments. New Forest 2006, 31, 487–495. [Google Scholar]
- Cao, Y.; Chen, Y.M. Biomass, Carbon and Nutrient Storage in a 30-Year-Old Chinese Cork Oak (Quercus Variabilis) Forest on the South Slope of the Qinling Mountains, China. Forests 2015, 6, 1239–1255. [Google Scholar] [CrossRef]
- Peichl, M.; Arain, M.A. Above-and belowground ecosystem biomass and carbon pools in an age-sequence of temperate pine plantation forests. Agric. Forest Meteorol. 2006, 140, 51–63. [Google Scholar] [CrossRef]
- Han, W.X.; Fang, J.Y.; Guo, D.; Zhang, Y. Leaf nitrogen and phosphorus stoichiometry across 753 terrestrial plant species in China. New Phytol. 2005, 168, 377–385. [Google Scholar] [CrossRef] [PubMed]
- Matzek, V.; Vitousek, M.P. N:P stoichiometry and protein: RNA ratios in vascular plants: An evaluation of the growth-rate hypothesis. Ecol. Lett. 2009, 12, 765–771. [Google Scholar] [CrossRef] [PubMed]
- Zeng, D.P.; Jiang, L.L.; Zeng, C.S.; Wang, W.Q.; Wang, C. Reviews on the ecological stoichiometry characteristics and its applications. Acta Ecol. Sin. 2013, 33, 5484–5492, (in Chinese with English abstract). [Google Scholar] [CrossRef]
- Zhang, H.Y.; Wu, H.H.; Yu, Q.; Wang, Z.W.; Wei, C.Z.; Long, M.; Kattge, J.; Smith, M.; Han, X.G. Sampling date, leaf age and roots size: Implications for the study of plant C:N:P stoichiometry. PLoS ONE 2013, 8, e60360. [Google Scholar] [CrossRef] [PubMed]
- Chapin, F.S., III. The mineral nutrition of wild plants. Annu. Rev. Ecol. Evol. Syst. 1980, 11, 233–260. [Google Scholar] [CrossRef]
- McJannet, C.; Keddy, P.; Pick, F. Nitrogen and phosphorus tissue concentrations in 41 wetland plants: A comparison across habitats and functional groups. Funct. Ecol. 1995, 9, 231–238. [Google Scholar] [CrossRef]
- Yang, Y.H.; Fang, J.Y.; Guo, D.L.; Ji, C.J.; Ma, W.H. Vertical patterns of soil carbon, nitrogen and carbon: Nitrogen stoichiometry in Tibetan grasslands. Biogeosci. Discuss. 2010, 7, 1–24. [Google Scholar] [CrossRef]
- Callesen, I.; Raulund-Rasmussen, K.; Westman, C.J.; Tau-Strand, L. Nitrogen pools and C:N ratios in well-drained Nordic forest soils related to climate and soil texture. Boreal. Environ. Res. 2007, 12, 681–692. [Google Scholar]
- Wang, S.Q.; Yu, G.R. Ecological stoichiometry characteristics of ecosystem carbon, nitrogen and phosporus elements. Acta Ecol. Sin. 2008, 28, 3937–3947, (in Chinese with English abstract). [Google Scholar]
- Ellison, A.M. Nutrient limitation and stoichiometry of carnivorous plants. Plant Biol. 2006, 8, 740–747. [Google Scholar] [CrossRef] [PubMed]
- Wu, T.G.; Yu, M.K.; Wang, G.G.; Dong, Y.; Cheng, X.R. Leaf nitrogen and phosphorus stoichiometry across forty-two woody species in Southeast China. Biochem. Syst. Ecol. 2012, 44, 255–263. [Google Scholar] [CrossRef]
- Peng, S.Z.; Zhao, C.Y.; Zheng, X.L.; Xu, Z.L.; He, L. Spatial distribution characteristics of the biomass and carbon storage of Qinghai spruce (Picea crassifolia) forests in Qilian Mountains. Chin. J. Appl. Ecol. 2011, 22, 1689–1694, (in Chinese with English abstract). [Google Scholar]
- Nock, C.A.; Caspersen, J.P.; Thomas, S.C. Large ontogenetic declines in intra-crown leaf area index in two temperate deciduous tree species. Ecology 2008, 89, 744–753. [Google Scholar] [CrossRef] [PubMed]
- Delzon, S.; Sartore, M.; Burlett, R.; Dewar, R.; Loustau, D. Hydraulic responses to height growth in maritime pine trees. Plant Cell Environ. 2004, 27, 1077–1087. [Google Scholar] [CrossRef]
- Simard, M.; Lecomte, N.; Bergeron, Y.; Bernier, P.Y.; Pare, D. Forest productivity decline caused by succession alpaludi-fication of boreal soils. Ecol. Appl. 2007, 17, 1619–1637. [Google Scholar] [CrossRef] [PubMed]
- Liu, Y.C.; Wu, M.Z.; Guo, Z.M.; Jiang, Y.X.; Wang, Z.Y.; Liu, B.D.; Zhu, X.L. Biomass and net productivity of Quercus variabilis forest in Baotianman Natural Reserve. Chin. J. Appl. Ecol. 1998, 9, 11–16, (in Chinese with English abstract). [Google Scholar]
- Wang, J.; Chen, Y.M.; Cao, Y.; Zhou, J.Y.; Hou, L. Carbon concentration and carbon storage in different components of natural Quercus wutaishanica forest in Ziwuling of Loess Plateau, Northwest China. Chin. J. Ecol. 2012, 31, 3058–3063, (in Chinese with English abstract). [Google Scholar]
- Cui, G.Y.; Chen, Y.M.; Cao, Y. Temporal-spatial pattern of carbon stocks in forest ecosystems in Shaanxi, northwest China. PLoS ONE 2015, 10, e0137452. [Google Scholar] [CrossRef] [PubMed]
- Cao, Y.; Chen, Y.M.; Jin, B.; Qu, M. Carbon storage and density of forest vegetation and its spatial distribution pattern in Shaanxi Province. J. Arid Land Resour. Environ. 2014, 28, 69–73, (in Chinese with English abstract). [Google Scholar]
- Zhou, Y.R.; Yu, Z.L.; Zhao, S.D. Carbon storage and budget of major Chinese forest types. Acta Phytoecol. Sin. 2000, 24, 518–522, (In Chinese with English Abstract). [Google Scholar]
- Nam, K.J.; Lee, W.K.; Kim, M.; Kwak, D.A.; Byun, W.H.; Yu, H.N.; Kwak, H.B.; Kwon, T.S.; Sung, J.H.; Chung, D.J.; Lee, S.H. Spatio-temporal change in forest cover and carbon storage considering actual and potential forest cover in South Korea. Sci. China Life Sci. 2015, 58, 713–723. [Google Scholar] [CrossRef] [PubMed]
- Boulmane, M.; Makhloufi, M.; Bouillet, J.P.; Saint-André, L.; Satrani, B.; Halim, M. Estimation du stock de carbone organique dans les Quercus ilex du Moyen Atlas Marocain. Acta Bot. Gallica 2010, 157, 451–467. [Google Scholar] [CrossRef]
- Bunker, D.E.; DeClerck, F.; Bradford, J.C.; Colwell, R.K.; Perfecto, L.; Phillips, O.L.; Sankaran, M.; Naeem, S. Species loss and aboveground carbon storage in atropical forest. Science 2005, 310, 1029–1031. [Google Scholar] [CrossRef] [PubMed]
- Li, T.; Liu, G. Age-related changes in carbon accumulation and allocation in plants and soil of a black locust forest on the loess plateau in Ansai County, Shaanxi Province of China. Chin. Geogr. Sci. 2014, 24, 414–422. [Google Scholar] [CrossRef]
- Zhang, H.; Song, T.Q.; Wang, K.L.; Du, H.; Yue, Y.M.; Wang, G.X.; Zeng, F.P. Biomass and carbon storage in an age-sequence of Cyclobalanopsis glauca plantations in southwest China. Ecol. Eng. 2014, 73, 184–191. [Google Scholar] [CrossRef]
Figure 1.
Distribution of sampling sites. The map was generated by ArcMap software (Version 10, ESRI, RedLands, CA, USA).
Figure 1.
Distribution of sampling sites. The map was generated by ArcMap software (Version 10, ESRI, RedLands, CA, USA).
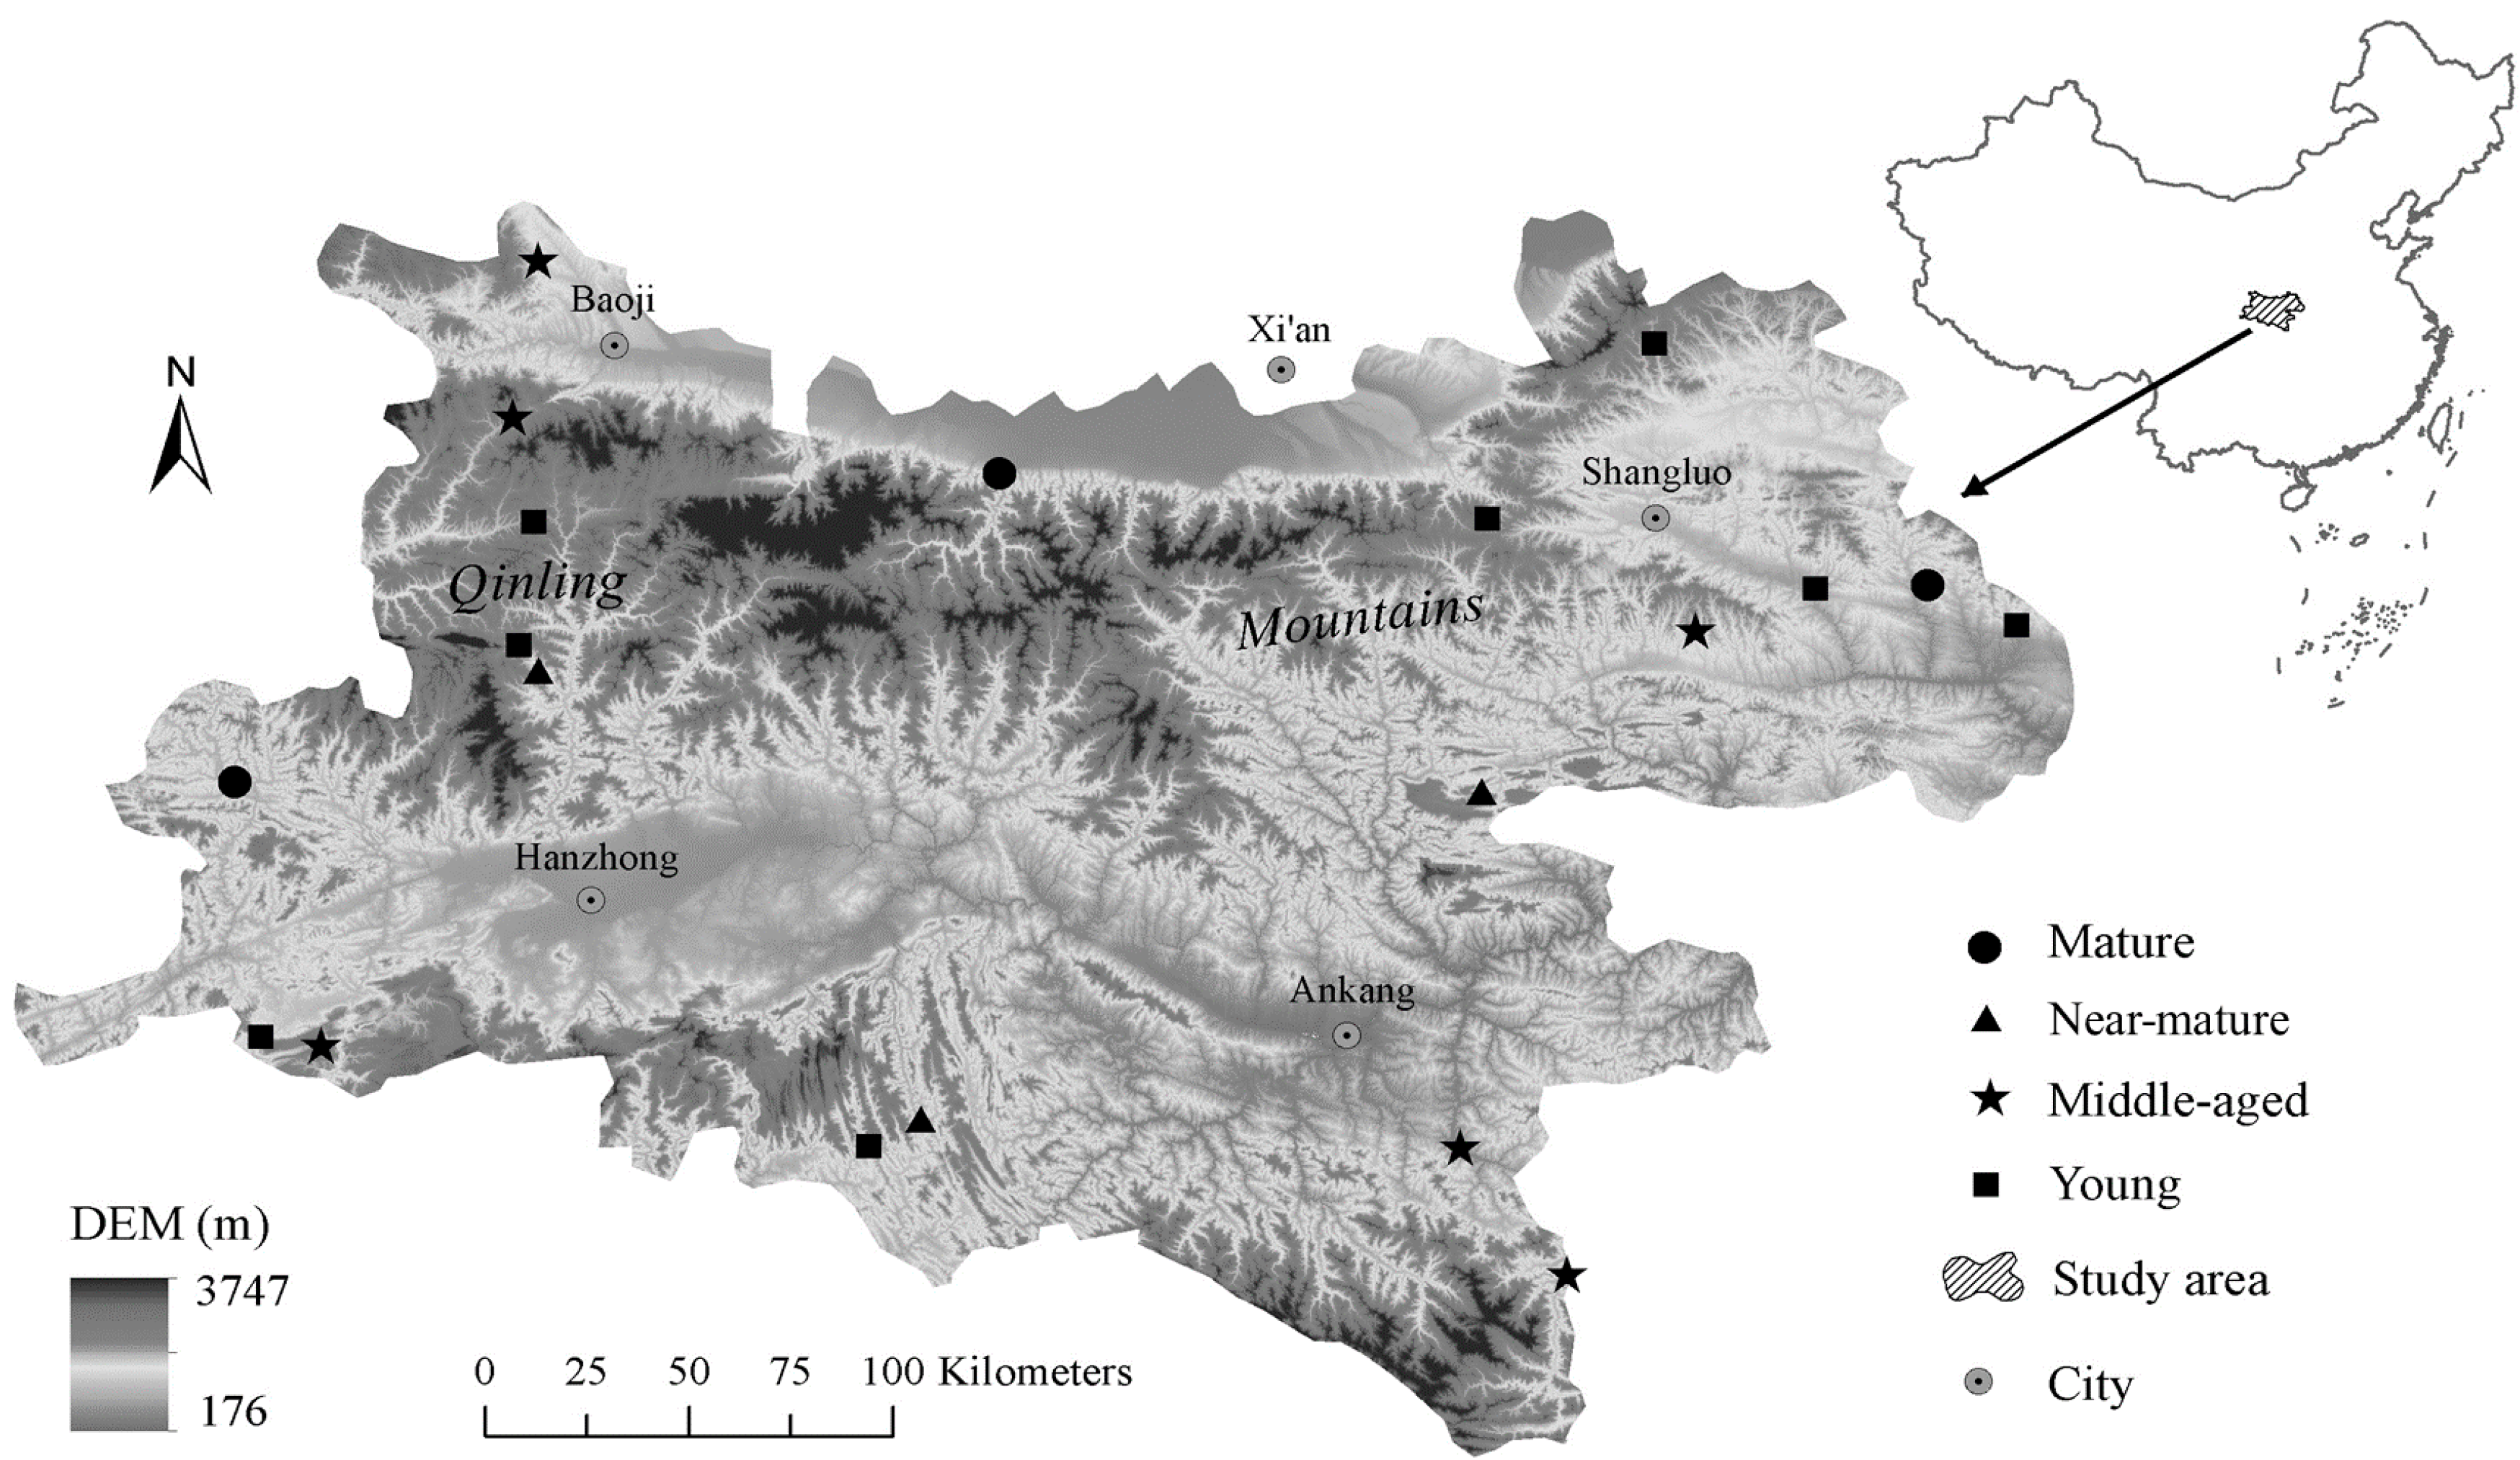
Figure 2.
C, N, and P stoichiometric characteristics in tree layer in Quercus variabilis natural secondary forest of different age classes (Means ± SE, n = 8, 6, 3 and 3 for young, middle-aged, near-mature and mature stands, respectively). (a) C concentration in tree layer of different age classes; (b) N concentration in tree layer of different age classes; (c) P concentration in tree layer of different age classes; (d) C:N ratio in tree layer of different age classes; (e) C:P ratio in tree layer of different age classes; (f) N:P ratio in tree layer of different age classes. Different small letters indicated significant difference in the same indicators among different forest age classes, and different capital letters indicated significant difference among different components in the same forest age classes (p < 0.05).
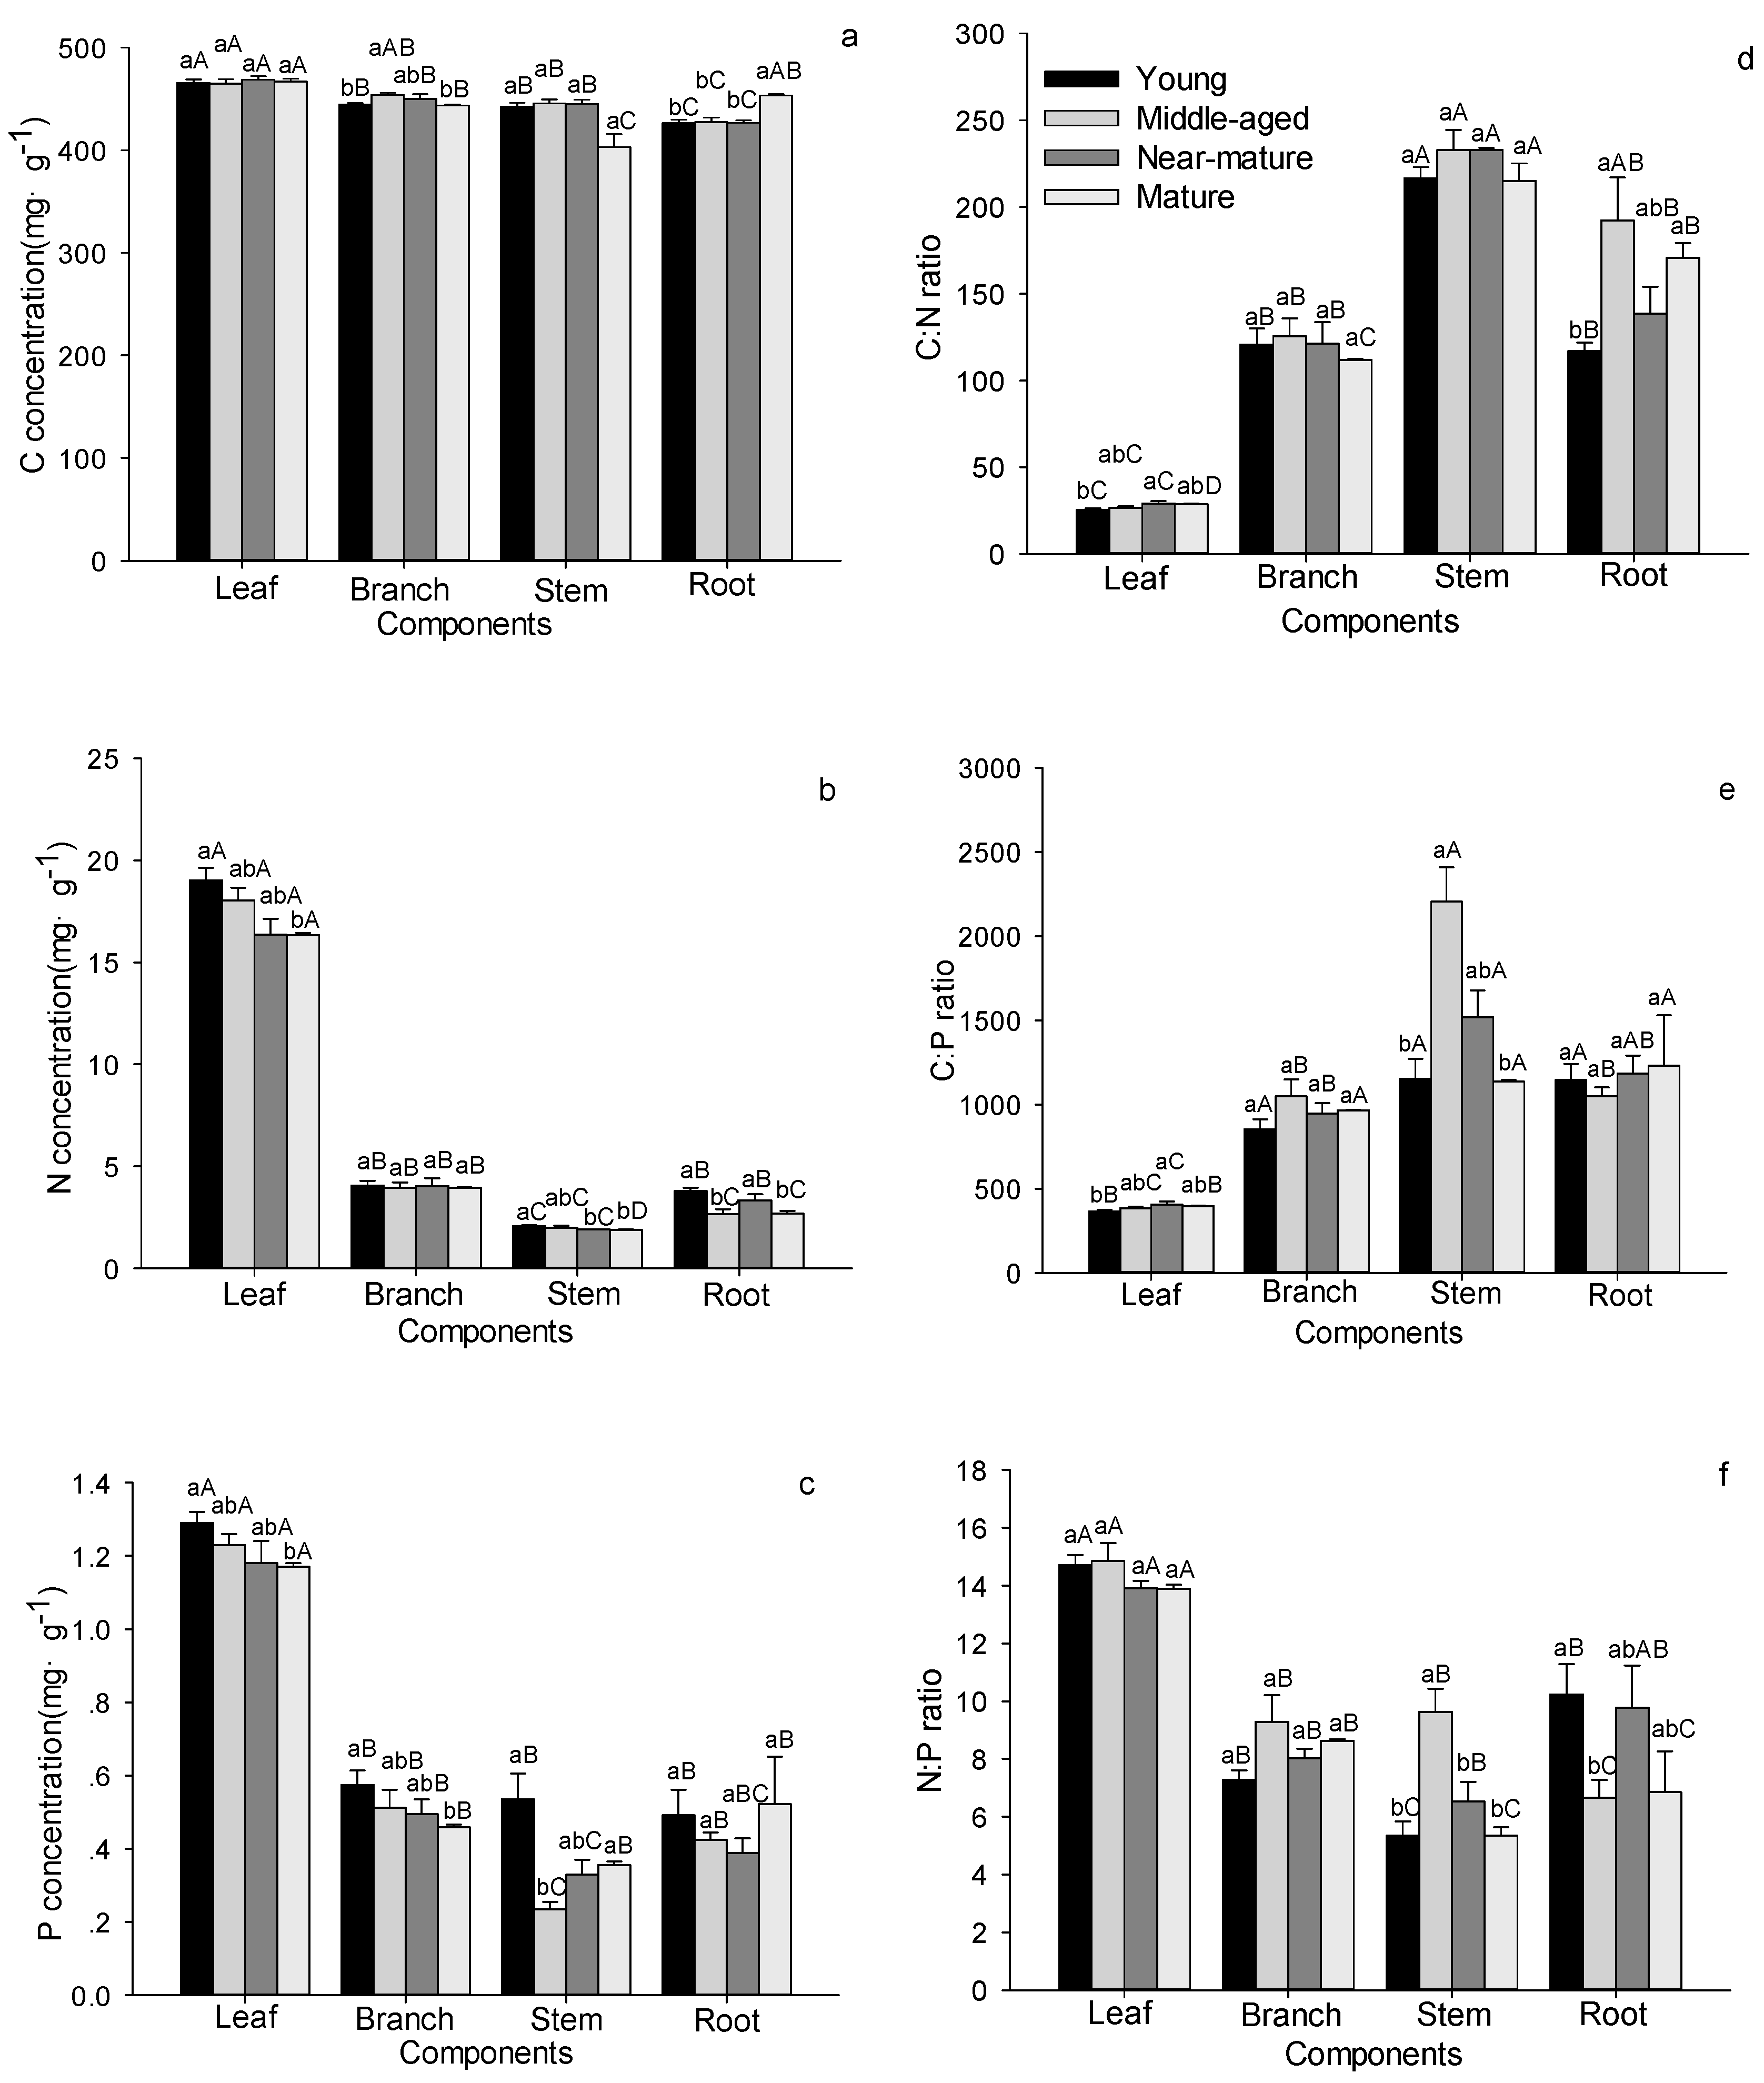
Figure 3.
C, N, and P stoichiometric characteristics in shrub, herb and litter layers in Quercus variabilis natural secondary forest of different age classes (Means ± SE, n = 8, 6, 3 and 3 for young, middle-aged, near-mature and mature stands, respectively). (a) C concentration in shrub, herb and litter layers of different age classes; (b) N concentration in shrub, herb and litter layers of different age classes; (c) P concentration in shrub, herb and litter layers of different age classes; (d) C:N ratio in shrub, herb and litter layers of different age classes; (e) C:P ratio in shrub, herb and litter layers of different age classes; (f) N:P ratio in shrub, herb and litter layers of different age classes. Different small letters indicated significant difference in the same indicators among age classes, and different capital letters indicated significant difference among different components in SL, SB, SR or in HA, HU in the same forest age class (p < 0.05). SL: shrub leaf, SB: shrub branch, SR: shrub roots, HA: herbage aboveground, HU: herbage underground, L: litter.

Figure 4.
C, N, and P stoichiometric characteristics in soil layer in Quercus variabilis natural forest of different age classes (Means ± SE, n = 8, 6, 3 and 3 for young, middle-aged, near-mature and mature stands, respectively). (a) C concentration in soil layer of different age classes; (b) N concentration in soil layer of different age classes; (c) P concentration in soil layer of different age classes; (d) C:N ratio in soil layer of different age classes; (e) C:P ratio in soil layer of different age classes; (f) N:P ratio in soil layer of different age classes. Different small letters indicated significant difference in the same indicators among different forest age classes, and different capital letters indicated significant difference among different components in the same forest age class (p < 0.05).
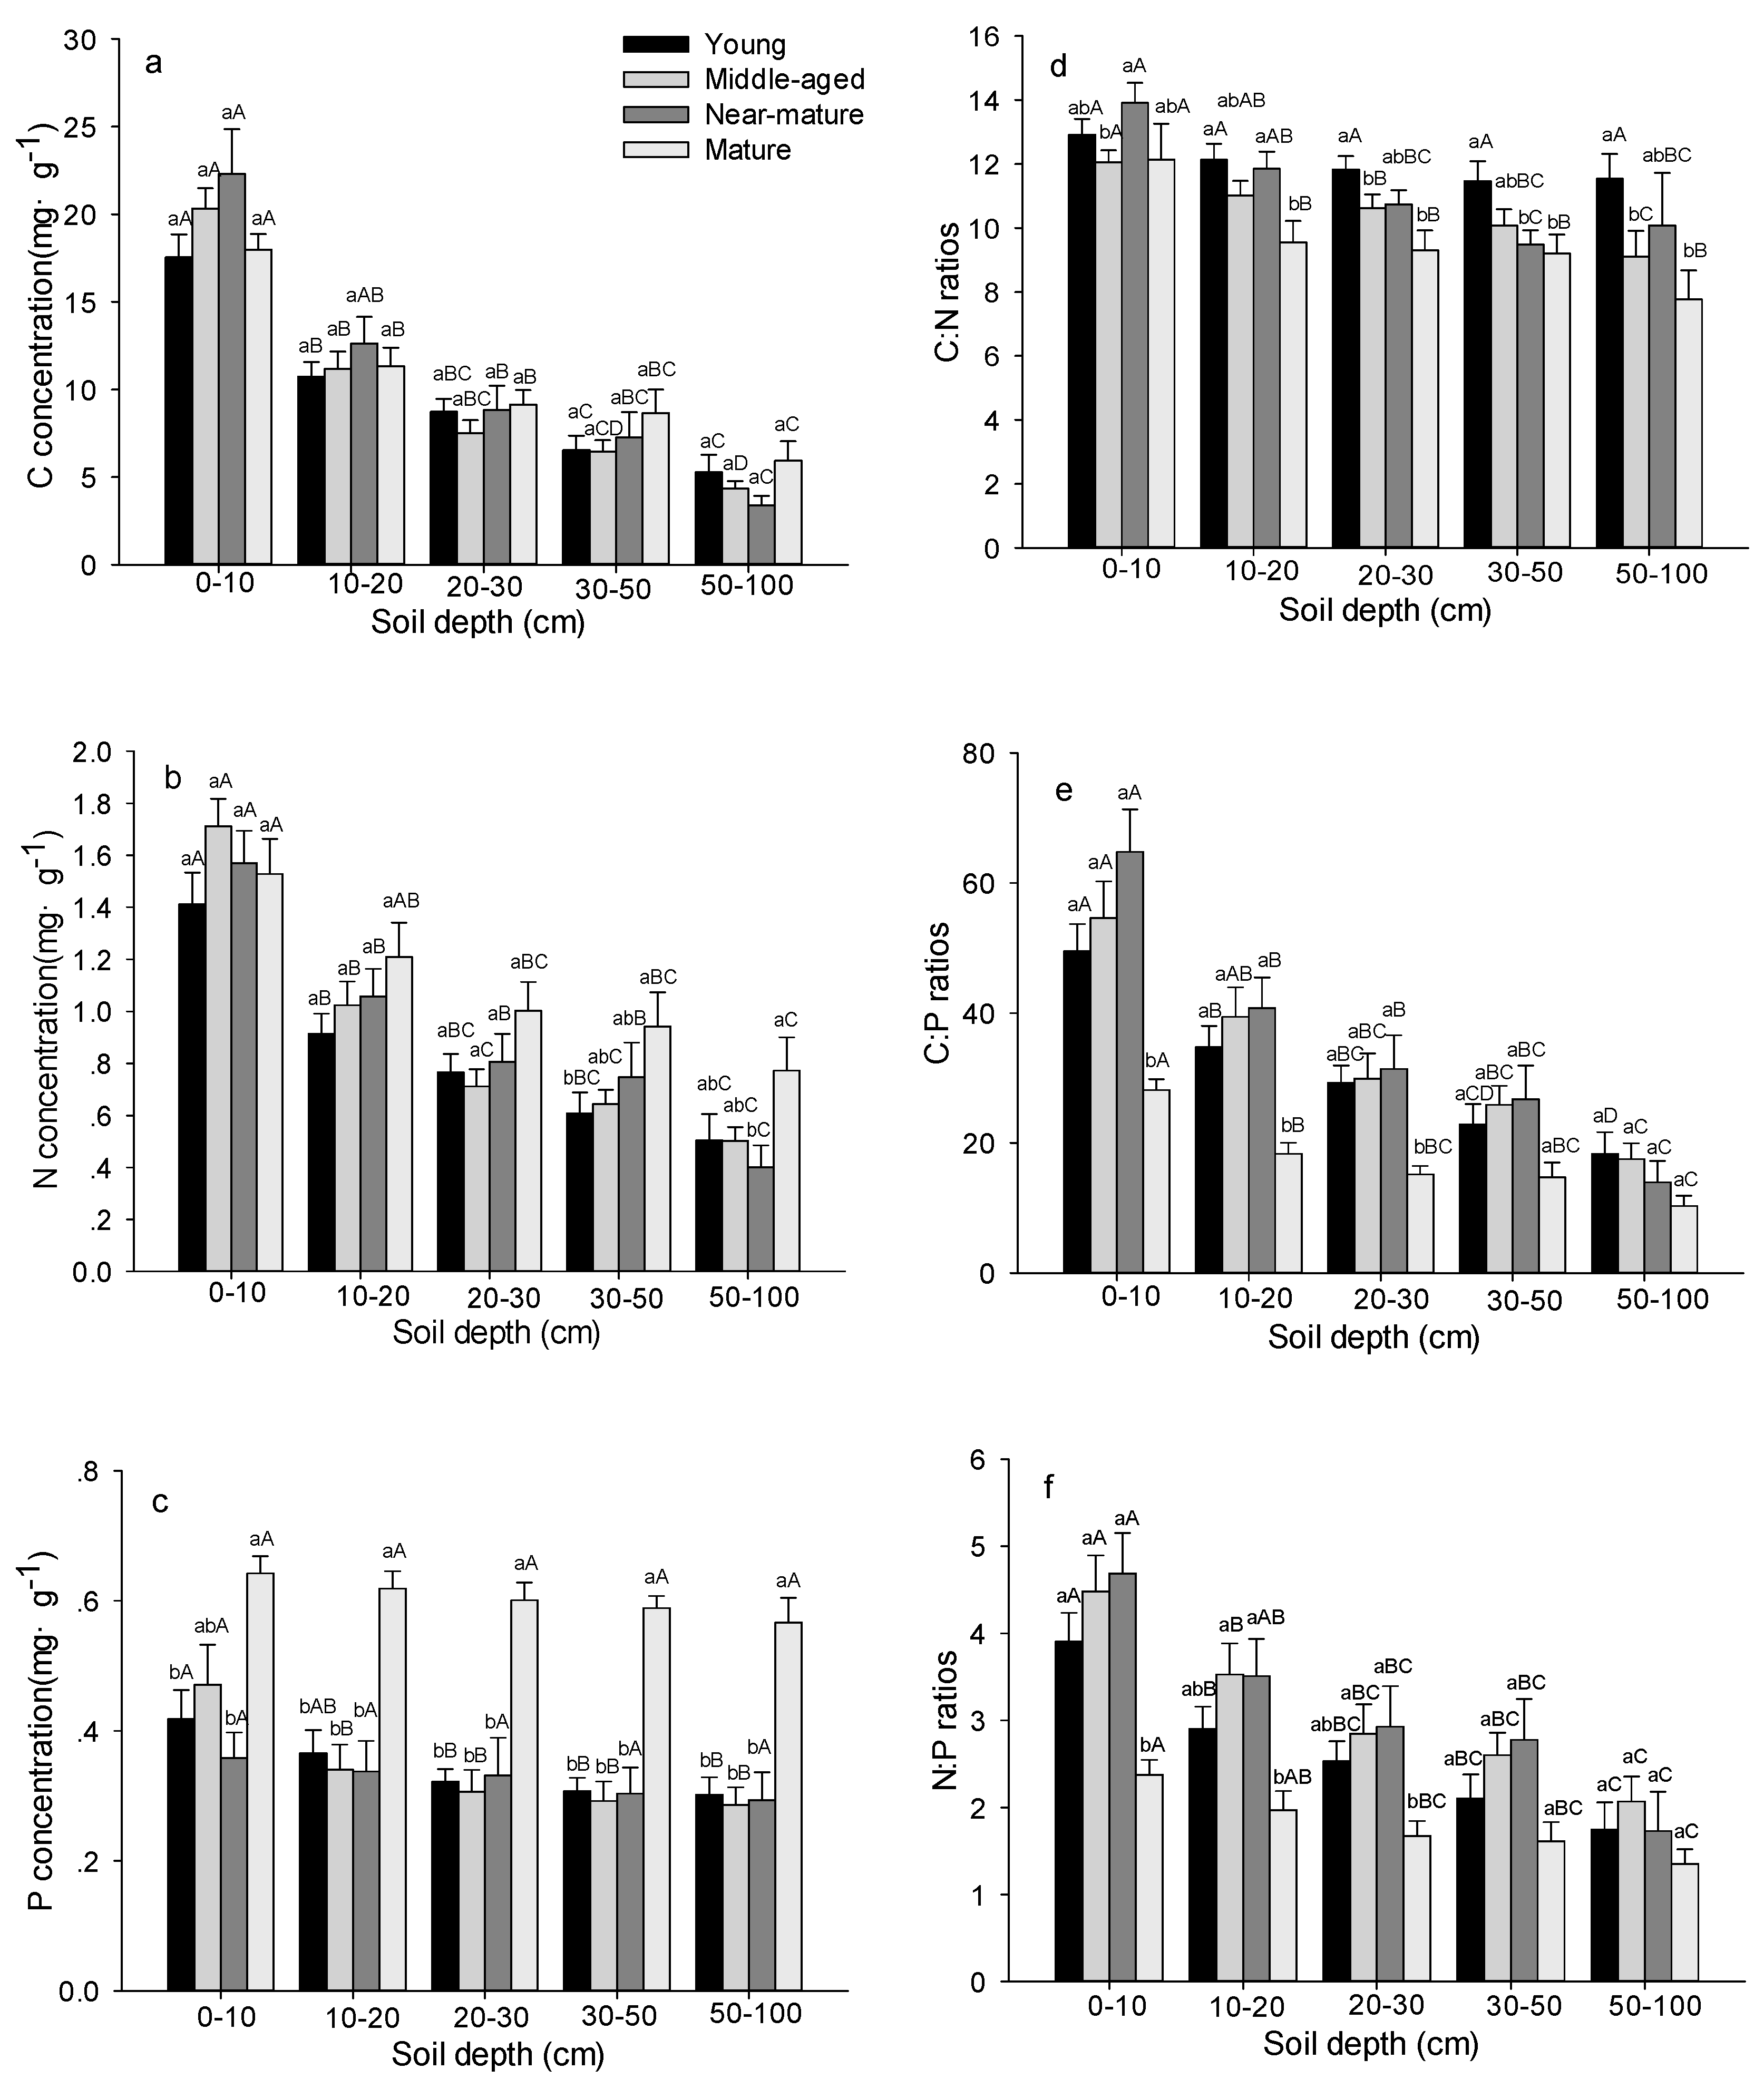
Figure 5.
Biomass and the distribution of tree components in Quercus variabilis stands (Means ± SE, Means ± SE, n = 8, 6, 3 and 3 for young, middle-aged, near-mature and mature stands, respectively). (a) Biomass of each component; (b) percentage of biomass. Different small letters indicated significant difference in the same indicators among different forest age classes.
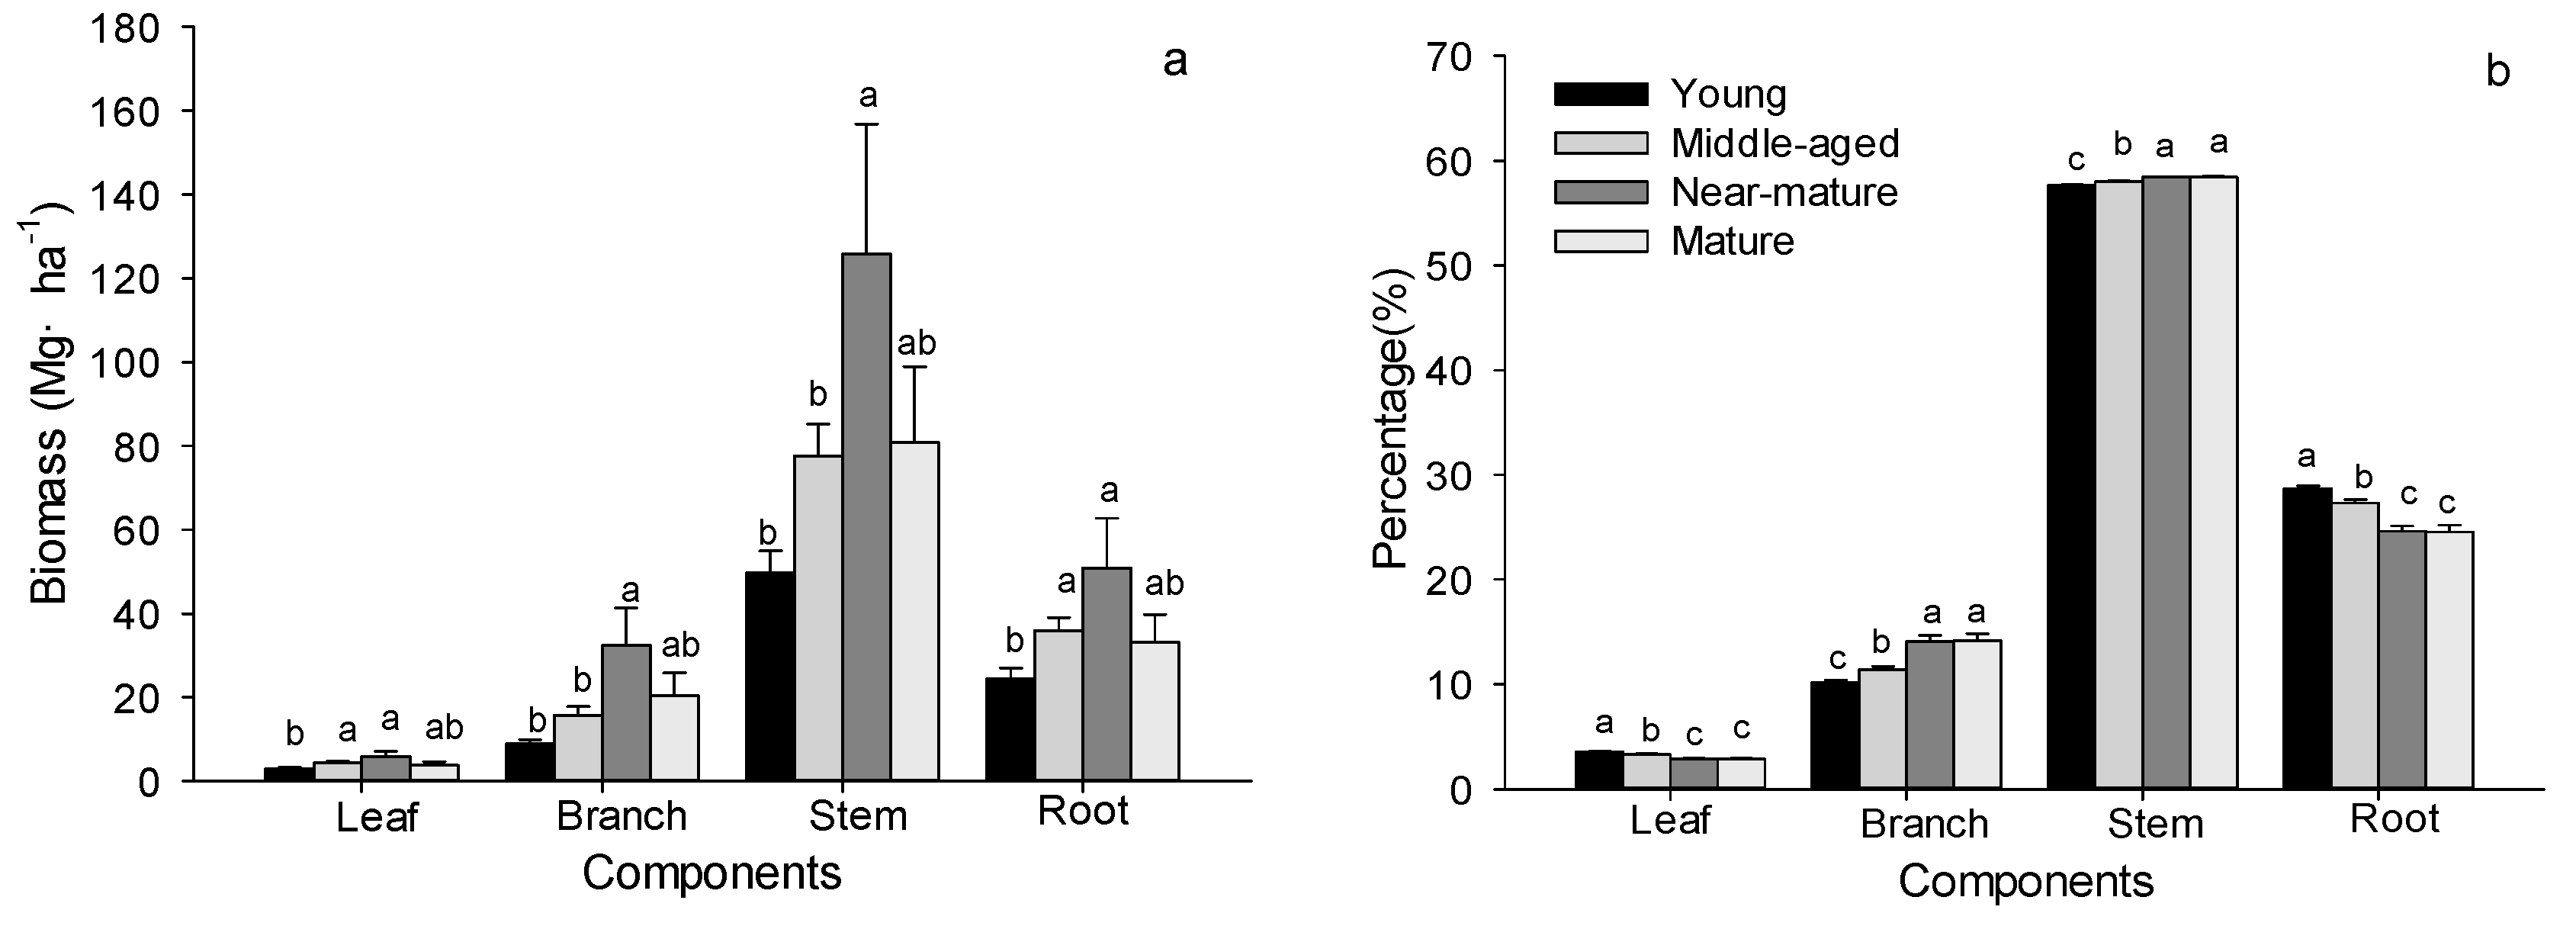
Figure 6.
Carbon storage in soil and plant layer of Quercus variabilis stands (Means ± SE, n = 8, 6, 3 and 3 for young, middle-aged, near-mature and mature stands, respectively). (a) Soil carbon storage at different depth; (b) forest ecosystem carbon storage among different age classes. Different small letters indicated significant difference in the same indicators among different forest age classes.


Table 1.
Estimation equations for tree layer in Quercus variabilis natural forest.
| Components | Equation | R2 |
|---|---|---|
| Leaf | W = 0.012870 × D2.101 | 0.992 |
| Branch | W = 0.004734 × D2.984 | 0.983 |
| Stem | W = 0.055974 × D2.562 | 0.971 |
| Bark | W = 0.045820 × D2.104 | 0.984 |
| Roots | W = 0.083084 × D2.198 | 0.963 |
Table 2.
F and p values for the effects of stand age, tree, shrub, herb tissue and soil depth on plant and soil C:N:P stoichiometric characteristics.
Table 2.
F and p values for the effects of stand age, tree, shrub, herb tissue and soil depth on plant and soil C:N:P stoichiometric characteristics.
| Components | Factors | F (p) Value | |||||
|---|---|---|---|---|---|---|---|
| C | N | P | C:N | C:P | N:P | ||
| Tree layer | Stand age | 1.410 (0.241) | 4.993 (0.002) | 6.032 (0.001) | 4.548 (0.004) | 6.912 (0.000) | 1.651 (0.179) |
| Tree tissue | 46.139 (0.000) | 1003.615 (0.000) | 146.409 (0.000) | 159.632 (0.000) | 52.790 (0.000) | 55.657 (0.000) | |
| Stand age × Tree tissue | 6.518 (0.0000) | 2.420 (0.012) | 1.269 (0.256) | 2.635 (0.007) | 6.017 (0.000) | 4.872 (0.000) | |
| Shrub layer | Stand age | 0.497 (0.685) | 1.549 (0.204) | 1.911 (0.130) | 0.437 (0.727) | 0.774 (0.510) | 1.378 (0.251) |
| Shrub tissue | 30.194 (0.000) | 25.233 (0.000) | 5.135 (0.007) | 20.265 (0.000) | 5.148 (0.007) | 8.245 (0.000) | |
| Stand age × Shrub tissue | 1.096 (0.353) | 1.002 (0.394) | 0.672 (0.571) | 0.652 (0.583) | 0.868 (0.459) | 0.436 (0.728) | |
| Herb layer | Stand age | 1.946 (0.127) | 0.747 (0.526) | 0.261 (0.853) | 1.126 (0.342) | 0.891 (0.448) | 1.305 (0.277) |
| Herb tissue | 347.801 (0.000) | 200.72 (0.000) | 24.823 (0.000) | 0.021 (0.886) | 2.785 (0.098) | 6.583 (0.012) | |
| Stand age × Herb tissue | 0.457 (0.713) | 0.576 (0.632) | 3.092 (0.030) | 0.163 (0.921) | 1.592 (0.196) | 1.827 (0.147) | |
| Soil layer | Stand age | 1.028 (0.381) | 3.561 (0.015) | 27.906 (0.000) | 10.801 (0.000) | 9.846 (0.000) | 9.092 (0.000) |
| Soil depth | 76.843 (0.000) | 44.147 (0.000) | 3.559 (0.008) | 11.902 (0.000) | 28.427 (0.000) | 15.572 (0.000) | |
| Stand age × Soil depth | 1.038 (0.414) | 0.755 (0.696) | 0.382 (0.969) | 0.869 (0.579) | 0.836 (0.614) | 0.389 (0.967) | |
Table 3.
Biomass of tree layer in Quercus variabilis stands.
| Age class | Stand Density (tree·ha−1) | Single Tree Biomass (kg·tree−1) | Biomass Per Hectare (Mg·ha−1) |
|---|---|---|---|
| Young | 1807.89 ± 196.43 a | 53.22 ± 5.37 b | 86.03 ± 9.21 b |
| Middle-aged | 1717.35 ± 178.71 a | 93.36 ± 19.13 b | 133.7 ± 13.06 b |
| Near-mature | 808.16 ± 79.88 b | 243.89 ± 44.81 a | 215.01 ± 53.07 a |
| Mature | 574.98 ± 62.09 b | 248.66 ± 57.48 a | 138.35 ± 30.80 ab |
Different small letters in the same column indicated significant difference among different age classes at 0.05 level.
Table 4.
Biomass and the distribution of Quercus variabilis natural forest.
| Age Class | Tree | Shrub | Herb | Litter | Total | |||||
|---|---|---|---|---|---|---|---|---|---|---|
| Biomass (Mg·ha−1) | Percentage (%) | Biomass (Mg·ha−1) | Percentage (%) | Biomass (Mg·ha−1) | Percentage (%) | Biomass (Mg·ha−1) | Percentage (%) | Biomass (Mg·ha−1) | Percentage (%) | |
| Young | 86.03 ± 9.21 b | 88.53 b | 2.49 ± 0.33 bc | 3.59 a | 1.03 ± 0.13 ab | 1.33 a | 6.21 ± 0.79 a | 6.54 a | 95.77 ± 9.73 b | 100 |
| Middle-aged | 133.7 ± 13.06 b | 94.23 a | 1.39 ± 0.19 c | 1.22 b | 0.60 ± 0.09 c | 0.52 b | 5.42 ± 0.78 a | 4.02 b | 141.11 ± 13.19 b | 100 |
| Near-mature | 215.01 ± 53.07 a | 93.43 a | 6.87 ± 2.26 a | 3.41 ab | 0.67 ± 0.08 bc | 0.45 b | 3.64 ± 0.59 a | 2.71 b | 226.20 ± 52.36 a | 100 |
| Mature | 138.35 ± 30.80 ab | 91.94 ab | 3.80 ± 1.84 ab | 3.11 ab | 1.48 ± 0.30 a | 1.21 a | 4.98 ± 1.25 a | 3.73 b | 148.61 ± 31.25 ab | 100 |
Different small letters in the same column indicated significant difference among different age classes at 0.05 level.
Table 5.
Carbon storage allocation of Quercus variabilis natural forests (Mg·ha−1).
| Age Class | Tree | Shrub | Herb | Litter | Plant | |||
|---|---|---|---|---|---|---|---|---|
| Leaf | Branch | Stem | Root | |||||
| Young | 1.39 ± 0.14 b | 3.95 ± 0.44 b | 21.82 ± 2.32 c | 10.55 ± 1.16 b | 1.07 ± 0.14 b | 0.28 ± 0.03 ab | 2.15 ± 0.24 a | 41.20 ± 4.19 b |
| Middle-aged | 2.04 ± 0.18 a | 7.17 ± 0.97 b | 34.80 ± 3.54 b | 15.40 ± 1.32 ab | 0.60 ± 0.08 b | 0.17 ± 0.02 c | 1.96 ± 0.26 a | 62.13 ± 6.00 b |
| Near-mature | 2.77 ± 0.64 a | 14.80 ± 4.12 a | 56.45 ± 14.14 a | 21.89 ± 5.15 a | 2.94 ± 1.00 a | 0.19 ± 0.02 bc | 1.36 ± 0.22 a | 100.40 ± 23.71 a |
| Mature | 1.78 ± 0.34 ab | 9.08 ± 2.34 ab | 31.99 ± 6.53 bc | 14.89 ± 3.01 ab | 1.56 ± 0.73 ab | 0.33 ± 0.05 a | 1.73 ± 0.40 a | 61.45 ± 12.28 b |
Different small letters in the same column indicated significant difference among different age classes at 0.05 level.
Table 6.
Relationships between biomass of different layers and C, N, and P stoichiometry in tree, shrub, herb leaves and litter among different age classes.
Table 6.
Relationships between biomass of different layers and C, N, and P stoichiometry in tree, shrub, herb leaves and litter among different age classes.
| Age Class | Biomass | C | N | P | C:N | C:P | N:P |
|---|---|---|---|---|---|---|---|
| Young | Tree | −0.507 * | 0.288 | 0.486 * | −0.349 | −0.496 * | −0.057 |
| Shrub | 0.594 ** | 0.542 ** | 0.466 ** | −0.486 * | −0.493 * | 0.059 | |
| Herb | −0.087 | −0.300 | −0.243 | 0.133 | 0.179 | 0.172 | |
| Litter | −0.652 ** | −0.215 | −0.289 | −0.410 * | −0.131 | −0.092 | |
| Middle-aged | Tree | 0.504 * | −0.355 | −0.251 | 0.39 | 0.351 | −0.173 |
| Shrub | −0.122 | −0.282 | 0.036 | 0.268 | −0.042 | −0.107 | |
| Herb | −0.074 | −0.321 | −0.582 * | 0.132 | 0.316 | 0.297 | |
| Litter | −0.487 * | −0.177 | 0.248 | −0.156 | −0.235 | −0.249 | |
| Near-mature | Tree | 0.523 | 0.608 | 0.446 | −0.608 | −0.464 | 0.386 |
| Shrub | 0.003 | −0.608 | −0.556 | 0.722 * | 0.770 * | 0.659 | |
| Herb | −0.047 | 0.115 | 0.113 | −0.063 | −0.213 | −0.093 | |
| Litter | −0.205 | −0.222 | −0.719 * | 0.074 | 0.743 * | 0.790 * | |
| Mature | Tree | −0.526 | 0.725 | −0.526 | −0.762 | −0.526 | 0.766 |
| Shrub | −0.049 | 0.601 | 0.559 | −0.52 | −0.465 | 0.506 | |
| Herb | −0.726 | 0.415 | −0.76 | −0.542 | 0.73 | 0.813 * | |
| Litter | −0.634 | 0.501 | −0.79 | −0.676 | 0.837 * | 0.663 |
* p < 0.05; ** p < 0.01.
© 2017 by the authors. Licensee MDPI, Basel, Switzerland. This article is an open access article distributed under the terms and conditions of the Creative Commons Attribution (CC BY) license (http://creativecommons.org/licenses/by/4.0/).
Share and Cite
MDPI and ACS Style
Jiang, P.; Chen, Y.; Cao, Y. C:N:P Stoichiometry and Carbon Storage in a Naturally-Regenerated Secondary Quercus variabilis Forest Age Sequence in the Qinling Mountains, China. Forests 2017, 8, 281. https://doi.org/10.3390/f8080281
AMA Style
Jiang P, Chen Y, Cao Y. C:N:P Stoichiometry and Carbon Storage in a Naturally-Regenerated Secondary Quercus variabilis Forest Age Sequence in the Qinling Mountains, China. Forests. 2017; 8(8):281. https://doi.org/10.3390/f8080281
Chicago/Turabian StyleJiang, Peipei, Yunming Chen, and Yang Cao. 2017. "C:N:P Stoichiometry and Carbon Storage in a Naturally-Regenerated Secondary Quercus variabilis Forest Age Sequence in the Qinling Mountains, China" Forests 8, no. 8: 281. https://doi.org/10.3390/f8080281
Note that from the first issue of 2016, this journal uses article numbers instead of page numbers. See further details here.