Article

Effects of Environmental Changes on the Occurrence of Oreomunnea mexicana (Juglandaceae) in a Biodiversity Hotspot Cloud Forest

by
Cecilia Alfonso-Corrado
1,
Francisco Naranjo-Luna
2,
Ricardo Clark-Tapia
1,*,
Jorge E. Campos
3,
Octavio R. Rojas-Soto
4,
María Delfina Luna-Krauletz
1,
Barbara Bodenhorn
5,
Montserrat Gorgonio-Ramírez
1 and
Nelly Pacheco-Cruz
3
1
Universidad de la Sierra Juárez, Avenida Universidad S/N, Ixtlán de Juárez, 68725 Oaxaca, Mexico
2
Instituto Tecnológico Superior de Jesús Carranza, Prolongación Miguel Hidalgo 1519, Colonia Centro, Jesús Carranza, 96950 Veracruz, Mexico
3
Laboratorio de Bioquímica Molecular-Unidad de Biotecnología y Prototipos (UBIPRO), FES-Iztacala, UNAM, Avenida de los Barrios 1, Los Reyes Iztacala, Tlalnepantla de Baz, 54090 Estado de México, Mexico
4
Laboratorio de Bioclimatología, Red de Biología Evolutiva, Instituto de Ecología A.C. (INECOL), Carretera antigua a Coatepec, 351, El Haya, Xalapa, 91070 Veracruz, Mexico
5
Division of Social Anthropology, University of Cambridge, Cambridge CB2 1TN, UK
*
Author to whom correspondence should be addressed.
Forests 2017, 8(8), 261; https://doi.org/10.3390/f8080261
Submission received: 29 June 2017 / Revised: 14 July 2017 / Accepted: 18 July 2017 / Published: 26 July 2017

Abstract

:
The tropical montane cloud forests are recognized as one of the most biodiverse ecosystems. In spite of this, they are among the most threatened ecosystems in the world. This study integrates three ecological approaches generally studied separately: climate change scenery, ecological niche and population dynamics of Oreomunnea mexicana (an endangered and relict species), to understand how environmental change affects the population structure in the cloud forest that will allow its conservation. Potential distribution under future climatic scenarios of the species at national and regional levels was generated from the Maxent algorithm. Also, the current abundance, distribution and the ecological niche of the species were analyzed at the regional level. Changes in potential distribution under two climatic models suggest a habitat reduction from 36% to 55% nationally, and 2% to 9% at a regional level, for 2050 and 2070, respectively. The current distribution of the species is fragmented and consists of subpopulations that have spatial structures of aggregated populations and a size structure in reversed “J” form. The ecological niche of the species is highly specialized and sensitive to environmental changes. O. mexicana is a flagship species of biological and cultural importance to the region’s inhabitants and could be fundamental to the conservation of tropical montane cloud forests.

1. Introduction

The tropical montane cloud forests (TMCF) are recognized as one of the most biodiverse ecosystems and a reservoir of endemic species, with a high strategic value for conservation [1] because of their key role in the maintenance of ecosystem services [2,3]. Unfortunately, TMCF are characterized by restrictive environmental requirements and a narrow and fragmented distribution [4]. They are also considered extremely vulnerable to anthropogenic impact [5], and thus are classified among the most endangered ecosystems due to processes of change in land use and climate change [3,6]. For this reason, the United Nations Environment Program (UNEP), World Conservation Monitoring Centre, United Nations Educational, Scientific and Cultural Organization (UNESCO) and International Union for Conservation of Nature and Natural Resources (IUCNN) promote the studies oriented to the identification of population parameters that allow the development and conservation of cloud forests [1].
In Mexico, the TMCF covers less than 1% of the country’s area (≈17,274 km2). It is the most vulnerable ecosystem in the country, because over 50% of its surface showed land-use change (e.g., livestock, agriculture, logging and urban sites) [4]. In particular, scientific studies suggest that anthropogenic disturbance to TMCF has severe effects on the forest structure, composition and species richness [4,6], which have contributed to up to 60% of tree species in TMCF being under threat [7]. In addition, recent studies predicted that by 2050 over 60% of TMCF would be lost because of the effects of climate change, with drastic impacts on the distribution of endemic species [4,8].
Ecological communities in TMCF are composed of arboreal species that tend to dominate the forest canopy and even form monospecific stands [9,10,11]. Many of these trees are tertiary relict species, dating from the late Miocene and early Pliocene era [9], which due to their limited distribution and specific environmental requirements, are potentially the most threatened by a land disturbance and climate change scenario [12]. Some authors suggest that knowledge of relict species can give great insights into ecological and evolutionary processes related to past shifts in the distributions of species [13], where a reliable description of species distribution over time and space can to help identify areas for conservation [14]. However, our knowledge of many threatened species with relictual distribution, small population size, and environmental requirements is still incomplete, despite the fact that such information is essential for the development of effective conservation strategies [10].
One of these species is Oreomunnea mexicana (Standl.) J.F. Leroy (Juglandaceae) a relict species of the Arcto-Tertiary era, included on the Red List of endangered species of Mexican cloud forest trees [7]. This species exhibits a discontinuous distribution in the mountainous areas of Chiapas, Oaxaca, and Veracruz states located in the Southeast of Mexico [15]. For these sites, some authors reported that O. mexicana is a dominant element with monospecific stands in the Mexican TMCF [10,16]. However, for the state of Oaxaca, knowledge of distribution patterns and abundance is very poor, even though this region contains the most extensive cloud forest area as well as the highest degree of conservation in the country [17]. Ecological knowledge of the species is crucial in order to implement conservation strategies for species that are in danger of habitat loss and climate change [18].
A national diagnosis of the vulnerability of cloud forests to climate change indicates that one key area for immediate protection is the Sierra Juárez of Oaxaca [5]. In this region, several fragments of the TMCF are being conserved by the communities, and in some local governments like Santiago Comaltepec, the presence of O. mexicana is remarkably significant for the ongoing conservation strategies due to both its biological and cultural importance to the region’s inhabitants. In order to contribute to the efforts of cloud forest conservation, this study provides an overview about the effects of climate change in the distribution and environmental vulnerability of O. mexicana, which was studied as an outstanding representative of a relict and threatened flora to help demonstrate potential changes in the cloud forest and provide opportunities for its conservation. Therefore, the objectives of this study were: (a) to determine potential distribution and the effects of climate change; (b) to assess the abundance, density, age structure and spatial distributions, and (c) to analyze the ecological niche of O. mexicana.

2. Materials and Methods
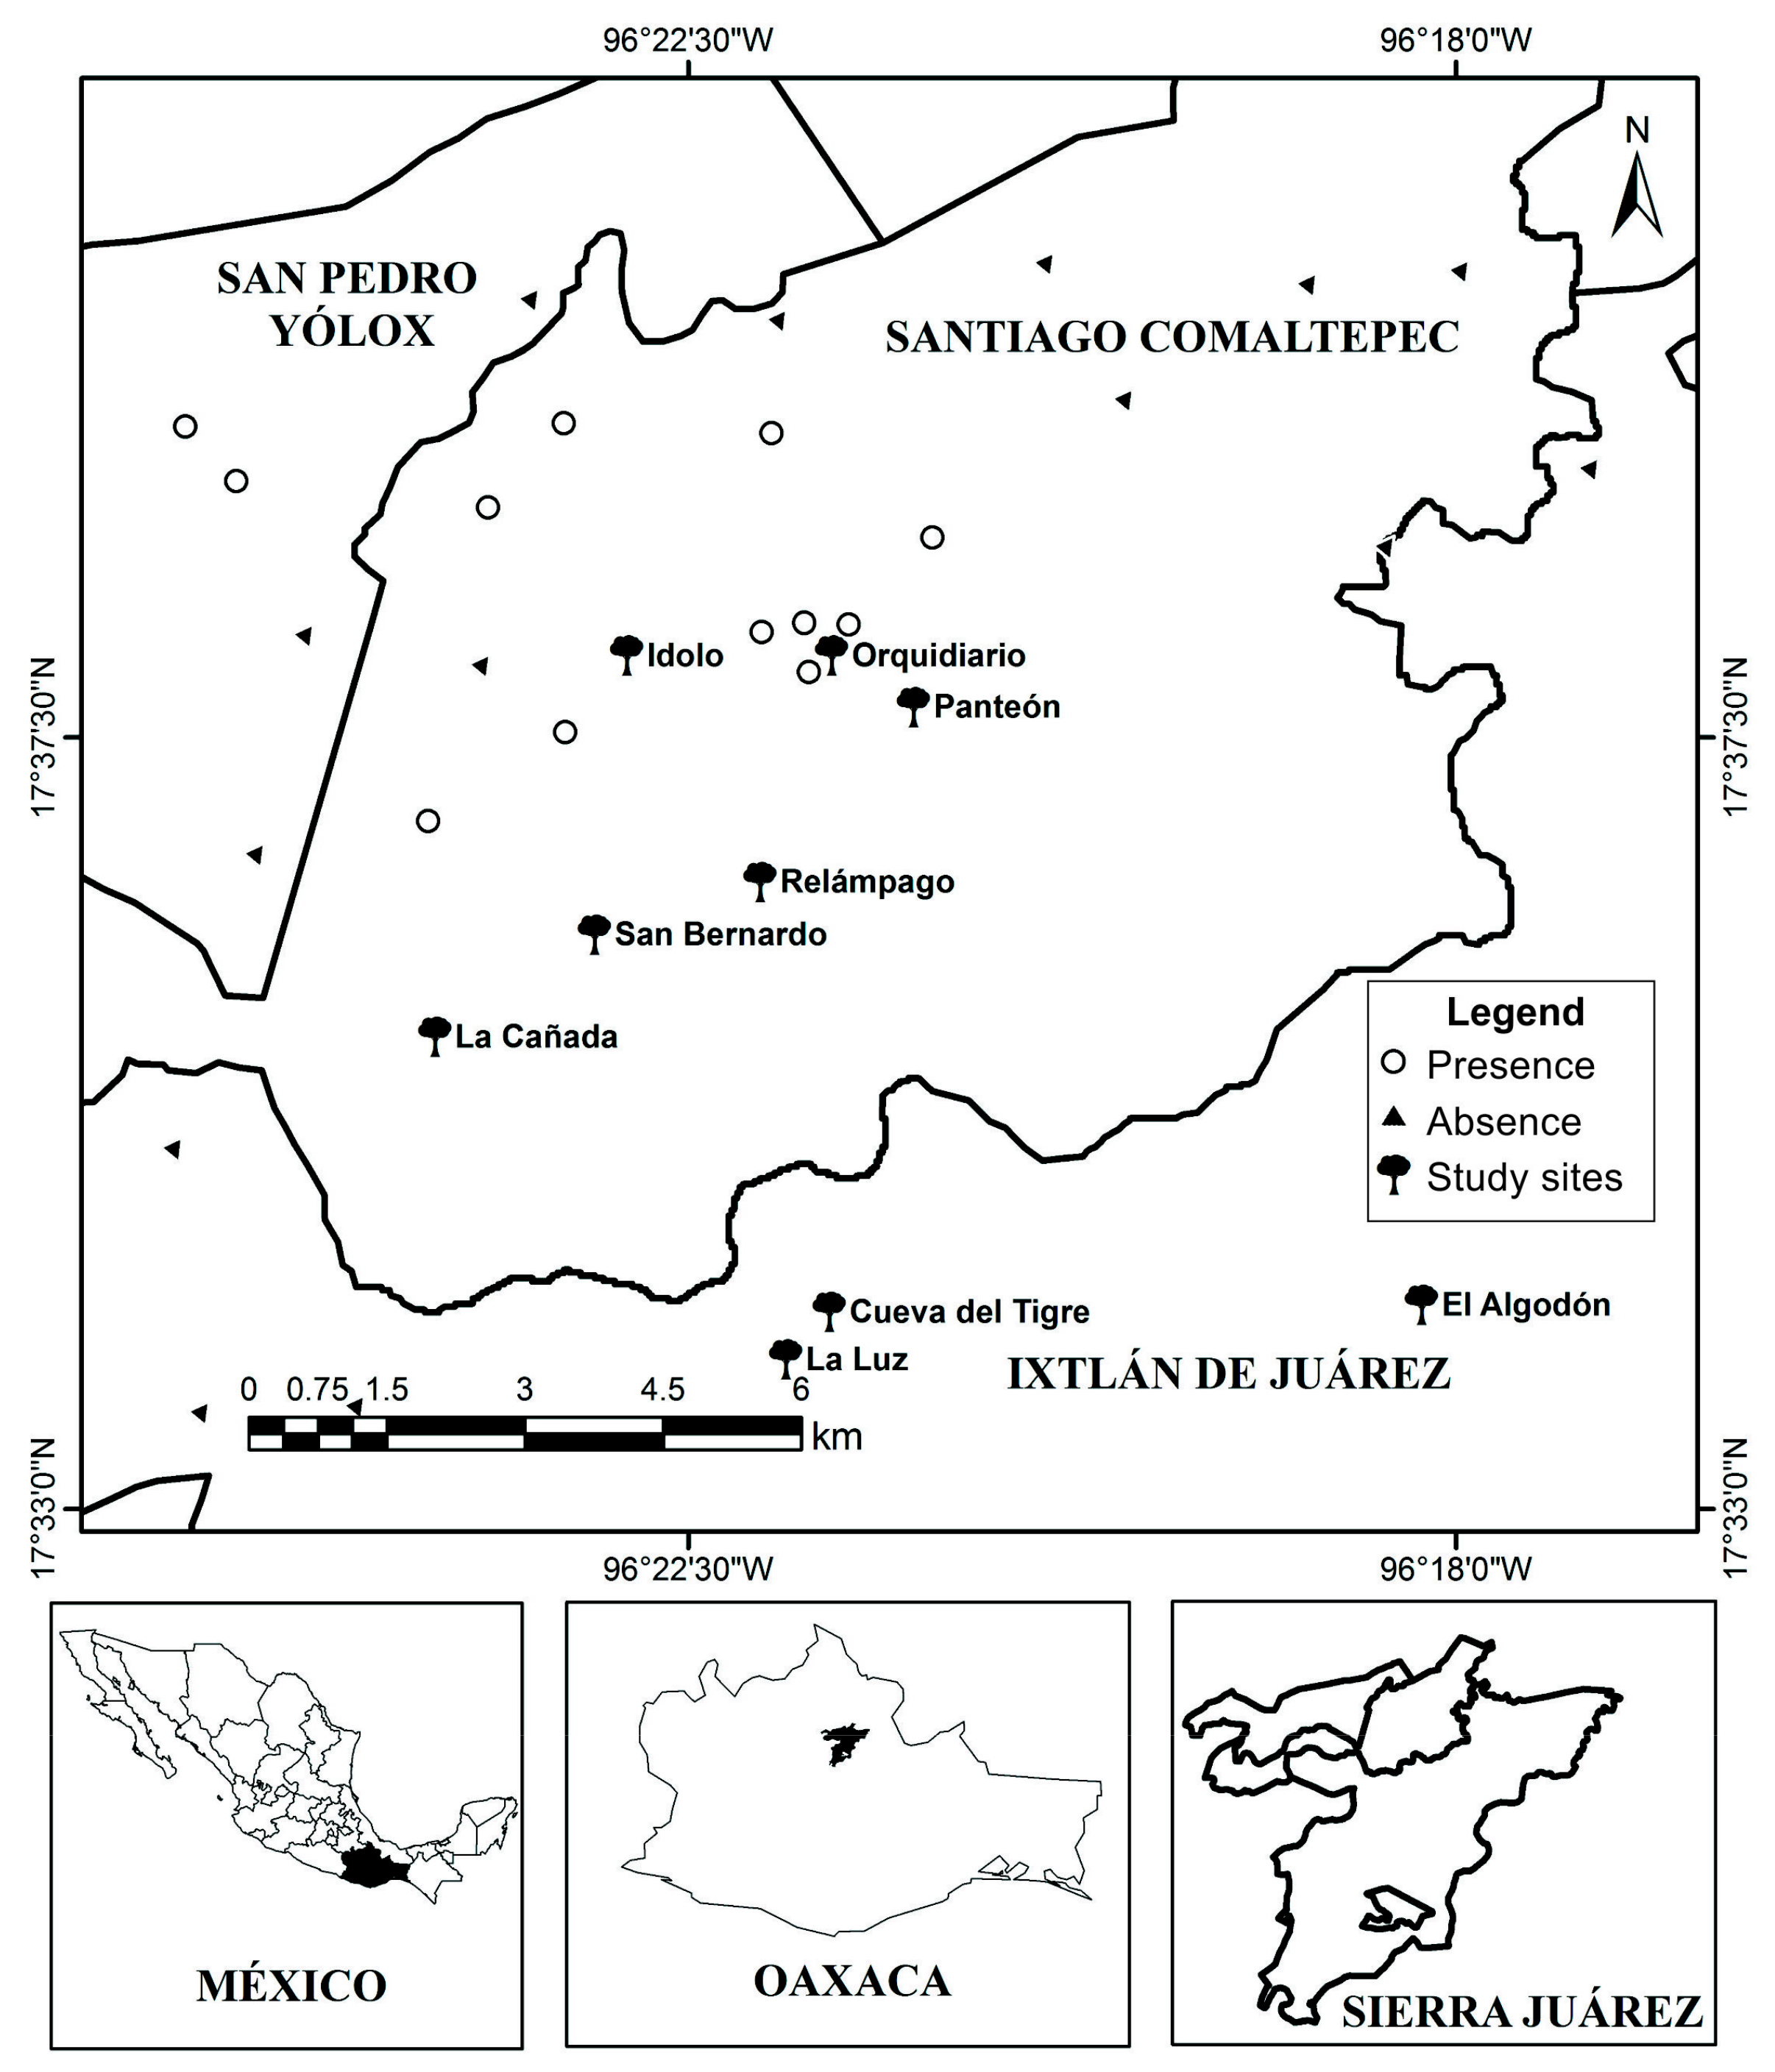
2.1. Study Area

The Sierra Juárez, is a part of the Sierra Madre of Oaxaca, Mexico. Localized between latitude 16°56′ to 17°45′ N, and longitude 97°13′ to 98°48′ W, with an area of 5918.07 km2. The area has a tropical rainy climate; the rainy season is in summer, with a mean annual temperature of 15 °C, and an average annual precipitation of 1500 mm year−1 [19]. In this region, TMCF grows from 750 to 2200 m above sea level. Further down it is replaced by tropical forests, and higher up there are pine-oak forests [20]. Meteorological records show that the Sierra suffers from strong winds periodically (>80 km/h), with negative effects on forest structure [19].

2.2. Study Species

Oreomunnea mexicana (Standl). J.F. Leroy (Common Name: El Caudillo, Chinanteco Name: maá hue loó) is an important tree in some of the cloud forests of the country [20]. It is a tree that can reach up to 40 m high, up to 2.0 m diameter at breast height (DBH), and its stem often sheds its bark. The petioles are short, ranged from four to eight leaflets and arranged in opposite pairs with a white color on the underside. The fruit is a small nut about 0.5 cm in diameter with three lobed bracts, whose central lip are more elongated than its sides. The species is found at altitudes from 1100 to 2000 m above sea level [15]. In Mexico, the species grows in the TMCF of Chiapas, Oaxaca, and Veracruz states located in the Southeast of Mexico.
In Oaxaca, only a monodominant population has been registered in Sierra Juárez. The species is considered a “biological heritage” from the past, of great biological and cultural significance to the Chinanteco and Zapoteco communities of the region, who have implemented environmental policies (e.g., conservation areas, payment for environmental services and ecotourism) taking into consideration the presence of O. mexicana as a fundamental pillar of high conservation value [21].
To understand how environmental change affects the population structure (e.g., abundance, density, occurrence, age structure and spatial distribution) first, we defined the area where niche models predict the species to be present. Second, we sample the abundance of the species at randomly selected sites where it is predicted to exist. Finally, we analyzed the stand density and size-class distributions of the species.

2.3. Potential Distribution and Future Climate Scenarios to Regional and National Level

To develop a predictive model to estimate the potential nationwide distribution, we drew on the works of Villaseñor and Téllez Valdés [22] and Mota-Vargas and Rojas-Soto [23], who have worked on predicting similar distributions for endangered species using as dependent variable the species presence/absence. The model was constructed from three sources, known populations, herbarium collection and a compilation of data developed by the Global Biodiversity Information Facility [24] and the Comisión Nacional para el Conocimiento y Uso de la Biodiversidad [25], these sources cover a specific geographic area of Oaxaca, Puebla, and Veracruz states. Prior to this study, though, the information available about the current distribution of O. mexicana in the Sierra Juárez only consisted of one collected site [16] (Figure 1A); thus the potential distribution can be used as a guide for its current regional distribution.
From 54 historical records (presence sites), available for the species, it was currently present in only 41 points after a reliable data review and cleaning process conducted (22% corresponded to known data from scientific papers or herbarium collections, and 78% to historical data from databases) (Figure 1A). Although the sample size for this study was small, a Jackknife validation test [26] suggests that this did not represent a problem for the modelling performance.
To characterize the niche and to build the model, 19 climatic variables layers were downloaded from the WorldClim database v1.4 [27]: (i) Average annual temperature (Bio1); (ii) Daily temperature oscillations (Bio2); (iii) Isothermality (Bio3); (iv) Seasonal Temperature (Bio4); (v) Maximum average temperature in the warmest period (Bio5); (vi) Minimum average temperature in the warmest period (Bio6); (vii) Annual temperature oscillations (Bio7); (viii) Average temperature in the rainiest trimester (Bio8); (ix) Average temperature in the driest trimester (Bio9); (x) Average temperature in the warmest trimester (Bio10); (xi) Average temperature in the coldest trimester (Bio11); (xii) Annual precipitation (Bio12); (xiii) Precipitation in the rainiest season (Bio13); (xiiii) Precipitation in the driest season (Bio14); (xv) Seasonal precipitation (Bio15); (xvi) Precipitation in the rainiest trimester (Bio16); (xvii) Precipitation in the driest trimester (Bio17); (xviii) Precipitation in the warmest trimester (Bio18); (ixx) Precipitation in the coldest trimester (Bio19), that were downloaded and processed. These databases are available at ≈1 km2 cell size spatial resolution and are interpolated from monthly weather station measurements collected in a period of fifty years: 1950–2000 [27].
Future climate scenarios were also modeled from the WorldClim [27] database based on the fact that maximal and minimal temperatures and precipitation can be particularly useful as they coincide with physiological tolerances at regional scales [28]. A nationwide future distribution was obtained in the context of two climate change scenarios from the Coupled Model Intercomparison Project (CMIP5) provided by the Intergovernmental Panel on Climate Change [29]. The Representative Concentration Pathways (RCP) of greenhouse gases emissions (GHGs: CO2, CH4, N2O and F) includes a concentration and emission routes results in radiative level of 4.5 W/m2 (RCP4.5; from 1.1 °C to 2.6 °C) and a concentration and emission routes in radiative level of 8.5 W/m2 (RCP8.5; from 2.6 °C to 4.8 °C). We used both RCPs for the years 2050 and 2070 scenarios respectively. We analyzed the Community Climate System Model Ver. 4.0 (CCSM4) (Boulder, CO, USA) [27]. The spatial resolution of ~1 km2 cell size was also used for the future climate scenarios, in a context where RCP4.5 (A1) and RCP8.5 (A2) represent an optimistic and a pessimistic scenario [29]. These environmental layers were transformed into ASCII format with the program ArcView 3.2 (Redlands, CA, USA) [30].
The data was analyzed using MAXENT software v3.3.1 [31,32], which is a general-purpose niche modeling algorithm for estimating the probability of potential and projected future probable distributions based on the principle of maximum entropy [31]. We used the MAXENT software for species distribution modeling because this method is particularly effective when species occurrence data comprises single presence records, small samples, and is not a probability-based sample [26,32]. Of the total records, 80% were used for model training and 20% percent for model validation. To provide a test for model predictability, the Jackknife-test by Pearson et al. [26] was applied, because it is designed explicitly for situations with small sample size [33]. The model was evaluated by the receiver operating characteristic curve (ROC) by calculating the area under the curve (AUC) [34]. According to Thuiller et al. [35] AUC values were graded as: poor (AUC < 0.8), fair (0.8 < AUC < 0.9), good (0.9 < AUC < 0.95) and very good (0.95 < AUC < 1). This model produced prediction values ranging from 0 to 1, representing cumulative probabilities of occurrence. Predictions were mapped in ArcView 3.2 (Redlands, CA, USA) [30] and overlaid on satellite imageries of INEGI (Mexico D.F., México) [36] to ascertain the actual habitat condition prevailing in the areas of occurrence.

2.4. Abundance, Density and Spatial and Static Size Stage Distributions at Regional Level

Abundance or population size (number of individual plants), density (number of the individuals per unit of area), age structure (number of individuals in each age group or stage class) and spatial distribution (pattern of the dispersal of individuals: clumped/aggregated, random or uniform) are useful measures for characterizing populations, because these data will change as a result of natural or human disturbance.
In Sierra Juarez, assessment of the actual habitat of the species in the localities of occurrence as well as in the entire predicted potential area was done through aleatory sampling and local knowledge surveys. First, a total of 30 random sampled points of the predicted potential area were explored during 2013, however the species occurrence was found in only 4 (13%). To increase the probability of detection of new sites for the species, local knowledge was incorporated. Residents’ personal observations and experience of their resources is extremely valuable in ecological studies [37]. For this reason, nine residents were identified and invited to participate in this study. Five were from Santiago Comaltepec and four from Ixtlán de Juárez. They identified 18 additional points (22-point total) with possible occurrence of O. mexicana in the Sierra Juárez (Figure 2).
At each site two transects of 1 km were established to verify the presence/absence of O. mexicana, the size of the area of occurrence, and associated tree species. Additionally, each site’s geographic location (latitude and longitude), altitude, slope, elevation index and compound topographic index, temperature and precipitation were recorded. The geographic location and altitude were obtained using a GPS MobileMapper v.10 (Westminster, CO, USA). The slope was measured using a Brunton field clinometer (degrees). Given the lack of climate data for each study site, the temperature (°C) and precipitation (mm) were obtained from WorldClim 1.4 [27].
Of the 22 sites identified, nine sites were selected for ecological studies within the municipalities of Ixtlán de Juárez and Santiago Comaltepec. Three were selected in Ixtlán and six in Comaltepec (Figure 2). At these sites two plots of 400 m2 (20 × 20 m) were established, separated from one another by 1500 m, with the exception of the site of Cueva del Tigre, where only one plot was made due to a small population size. From each sampled plot the following information was obtained: (1) diameter at breast height (DBH) for adult individuals and (2) ground-line diameter for seedlings following Alfonso-Corrado et al. [38]. O. mexicana individuals were classified into five categories of stage size class based on the size range of field data: (1) 0.1–1.0 cm, (2) 1.1–5.0 cm, (3) 5.1–10 cm, (4) 10.1–40 cm and (5) >40.1 cm in diameter. The structures of each population size were compared with the Kruskal–Wallis one-way ANOVA analysis by rank, using the XLSTAT v.501 software (Addinsoft, Paris, France) [39]. In order to identify an environmental basis for community ordination a canonical correspondence analysis (CCA) was performed to evaluate the effect of environmental variables (climatic and geographical) on the age structure at the study sites using XLSTAT v. 5.01 (Addinsoft, Paris, France). CCA is an efficient multivariate method to provide an integrated description of species-environment relationships, and is therefore, more appropriate for analyzing data on community composition and environmental variables than canonical correlation analysis [40].
Additionally, the geographical location of each individual tree in each plot was registered with a high precision sub-meter GPS MobileMapper v.10 (Westminster, CO, USA). With this information, the spatial structure of Ripley´s Lt-function was obtained according to Hammer et al. [41] and each sampled plot and category was sampled using the statistical software Past v. 3.0 (Oslo, Norway) [41]. The category of class five was included in category four, due to the low number of individuals in the studied sites. The expected value of L(t) under a Poisson processes 0: positive values indicate spatial clustering, while negative values indicate spatial segregation.

2.5. Analysis of the O. mexicana Niche

The marginality and amplitude that O. mexicana shows in the Sierra Juárez region was evaluated through the analysis of marginality (Outlying Mean Index, or OMI) according to [40] using the ADE-4 software (Villeurbanne, France) [42]. This analysis determines the position in the niche as the average location of the species in the ambient space. High values of OMI indicate that the species has a marginal or restricted habitat [43]. Additionally, the amplitude of the niche is a measure of specialization over the environmental gradient where the species occurs. Lower values of tolerance indicate that the species has a limited range of conditions, which correspond with specialist species [44].
OMI analysis was conducted by using: (a) the abundance data of the 22 sites where the current distribution of O. mexicana and associated tree species were analyzed, (b) the six geographic variables obtained for each site: latitude (LT), longitude (LG), altitude (ALT), slope (% P), elevation index (MDR) and compound topographic index (CTI) and (c) 19 climatic variables. The analysis used two matrices: one containing botanical abundance of the species (rows) on sites (columns) and the other an environmental matrix (climatic and geographic) containing values of environmental variables (rows) in the same n sites (columns). As a preliminary step, the environmental matrix was analyzed with a principal component analysis (PCA) in order to sort the sites based on environmental variables. The Monte Carlo test was used to compare observed versus marginalized species distribution, through 10,000 random permutations and a significance of P = 0.05, under the null hypothesis that the environment does not affect the abundance of the species.

3. Results

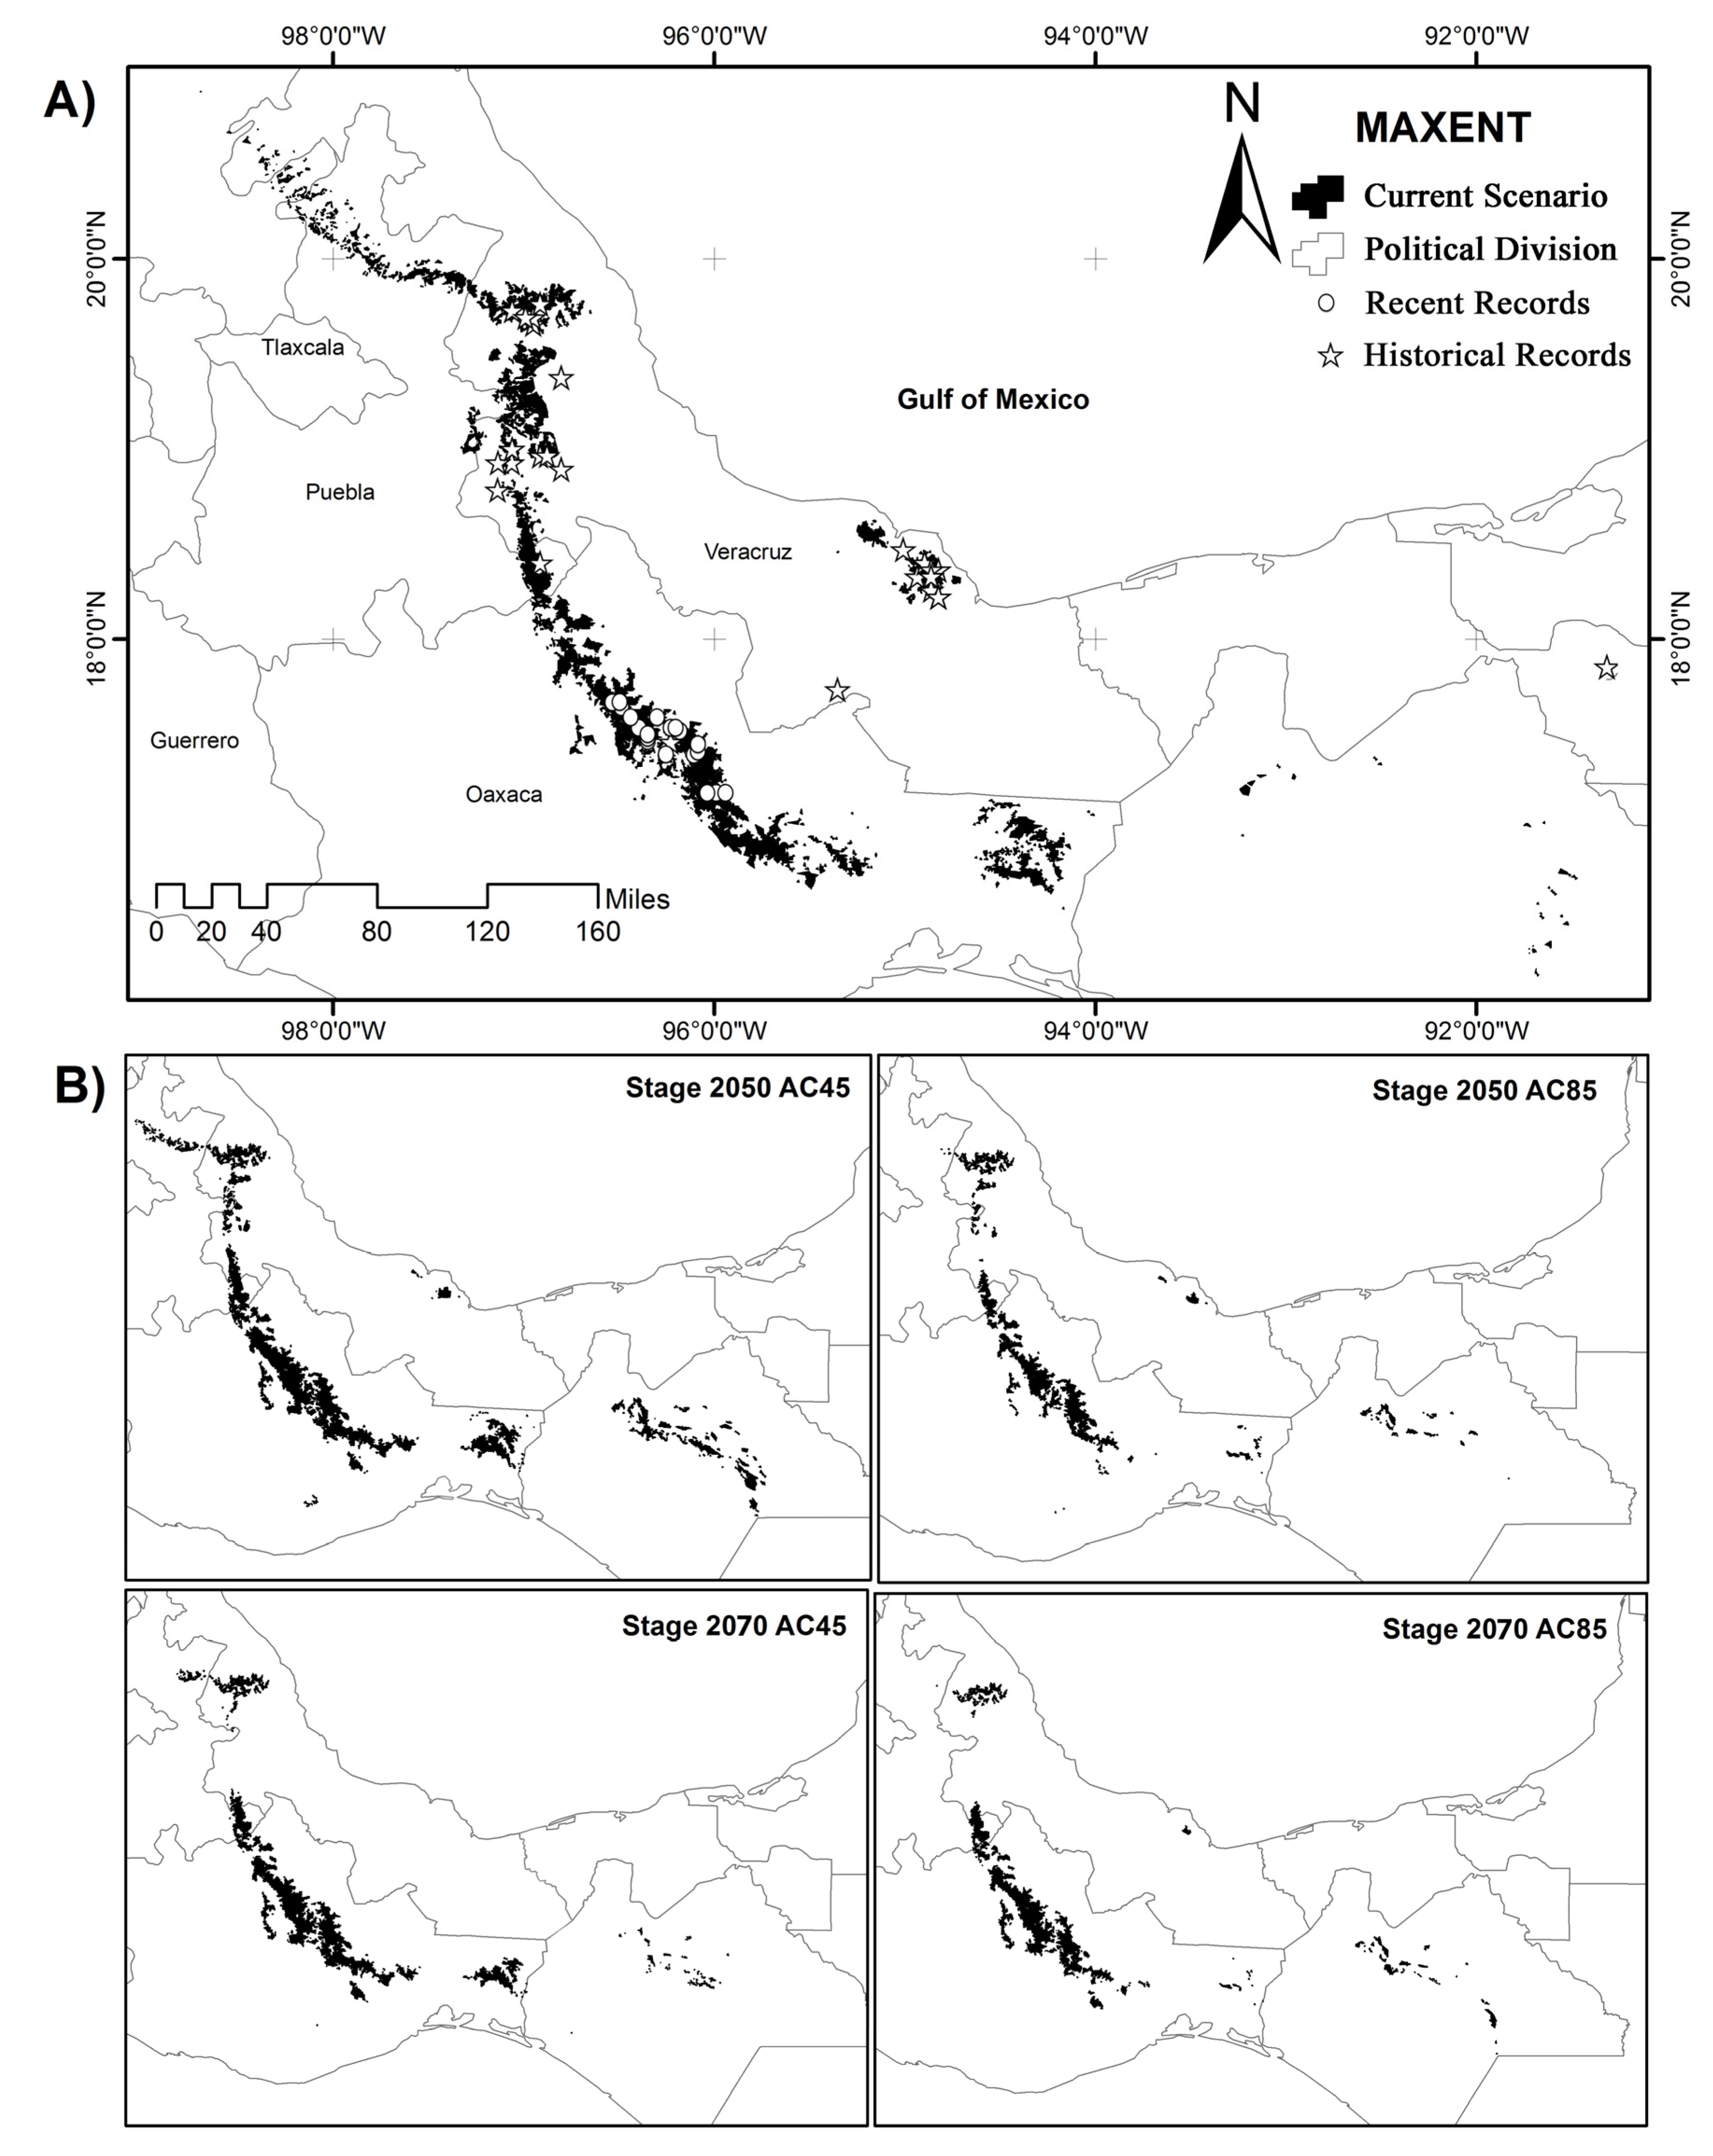
3.1. Potential Distribution and Future Climate Scenarios

The potential niche model exceeded the current range distribution of the species at the national and regional level, and showed that some areas as the central part have been under-sampled, in contrast with others which were over-sampled (Figure 1A). Based on the national model, the suitable habitat range of the species was 9867 km2, while at the level of the Sierra Juárez was 453 km2. However, the current distribution in the Sierra Juárez obtained from local knowledge and field study, was an area of 100 km2 (22% of the area predicted by the model) with discontinuous and patchy distribution in the middle of the cloud forest at an altitude range of 1356–1990 m above sea level and slopes of 20° to 60°.
The results obtained with MAXENT for the future climate scenarios showed a 96.6% ROC-tested curve and provided an AUC value of 0.964, indicating a good performance for our model. Out of two climate change scenarios, the most severe decline of potential suitable habitat was in the scenario RCP8.5 (A2) by 2050 and 2070 (Figure 1B). Climatically suitable areas for the species will decline on average 33% by 2050 and 55% by 2070 based on the scenario A2 (Figure 1B). Furthermore, under a conservative scenario A1 (RCP4.5) climatically suitable areas of the species will decline on average 26% by 2050 and under 36% by 2070. The losses of suitable habitat areas in both scenarios were located mainly in Chiapas, and Veracruz states, which will show an area contraction greater than 50% by 2070 (or greater than 30% by 2050). In contrast with this, in Oaxaca state the suitable habitat area (>85%) will remain unchanged and in the Sierra Juárez, the range of the species will decline on average by less than 5.5% under both scenarios (ranges from 2% to 9% for 2050 and 2070, respectively).

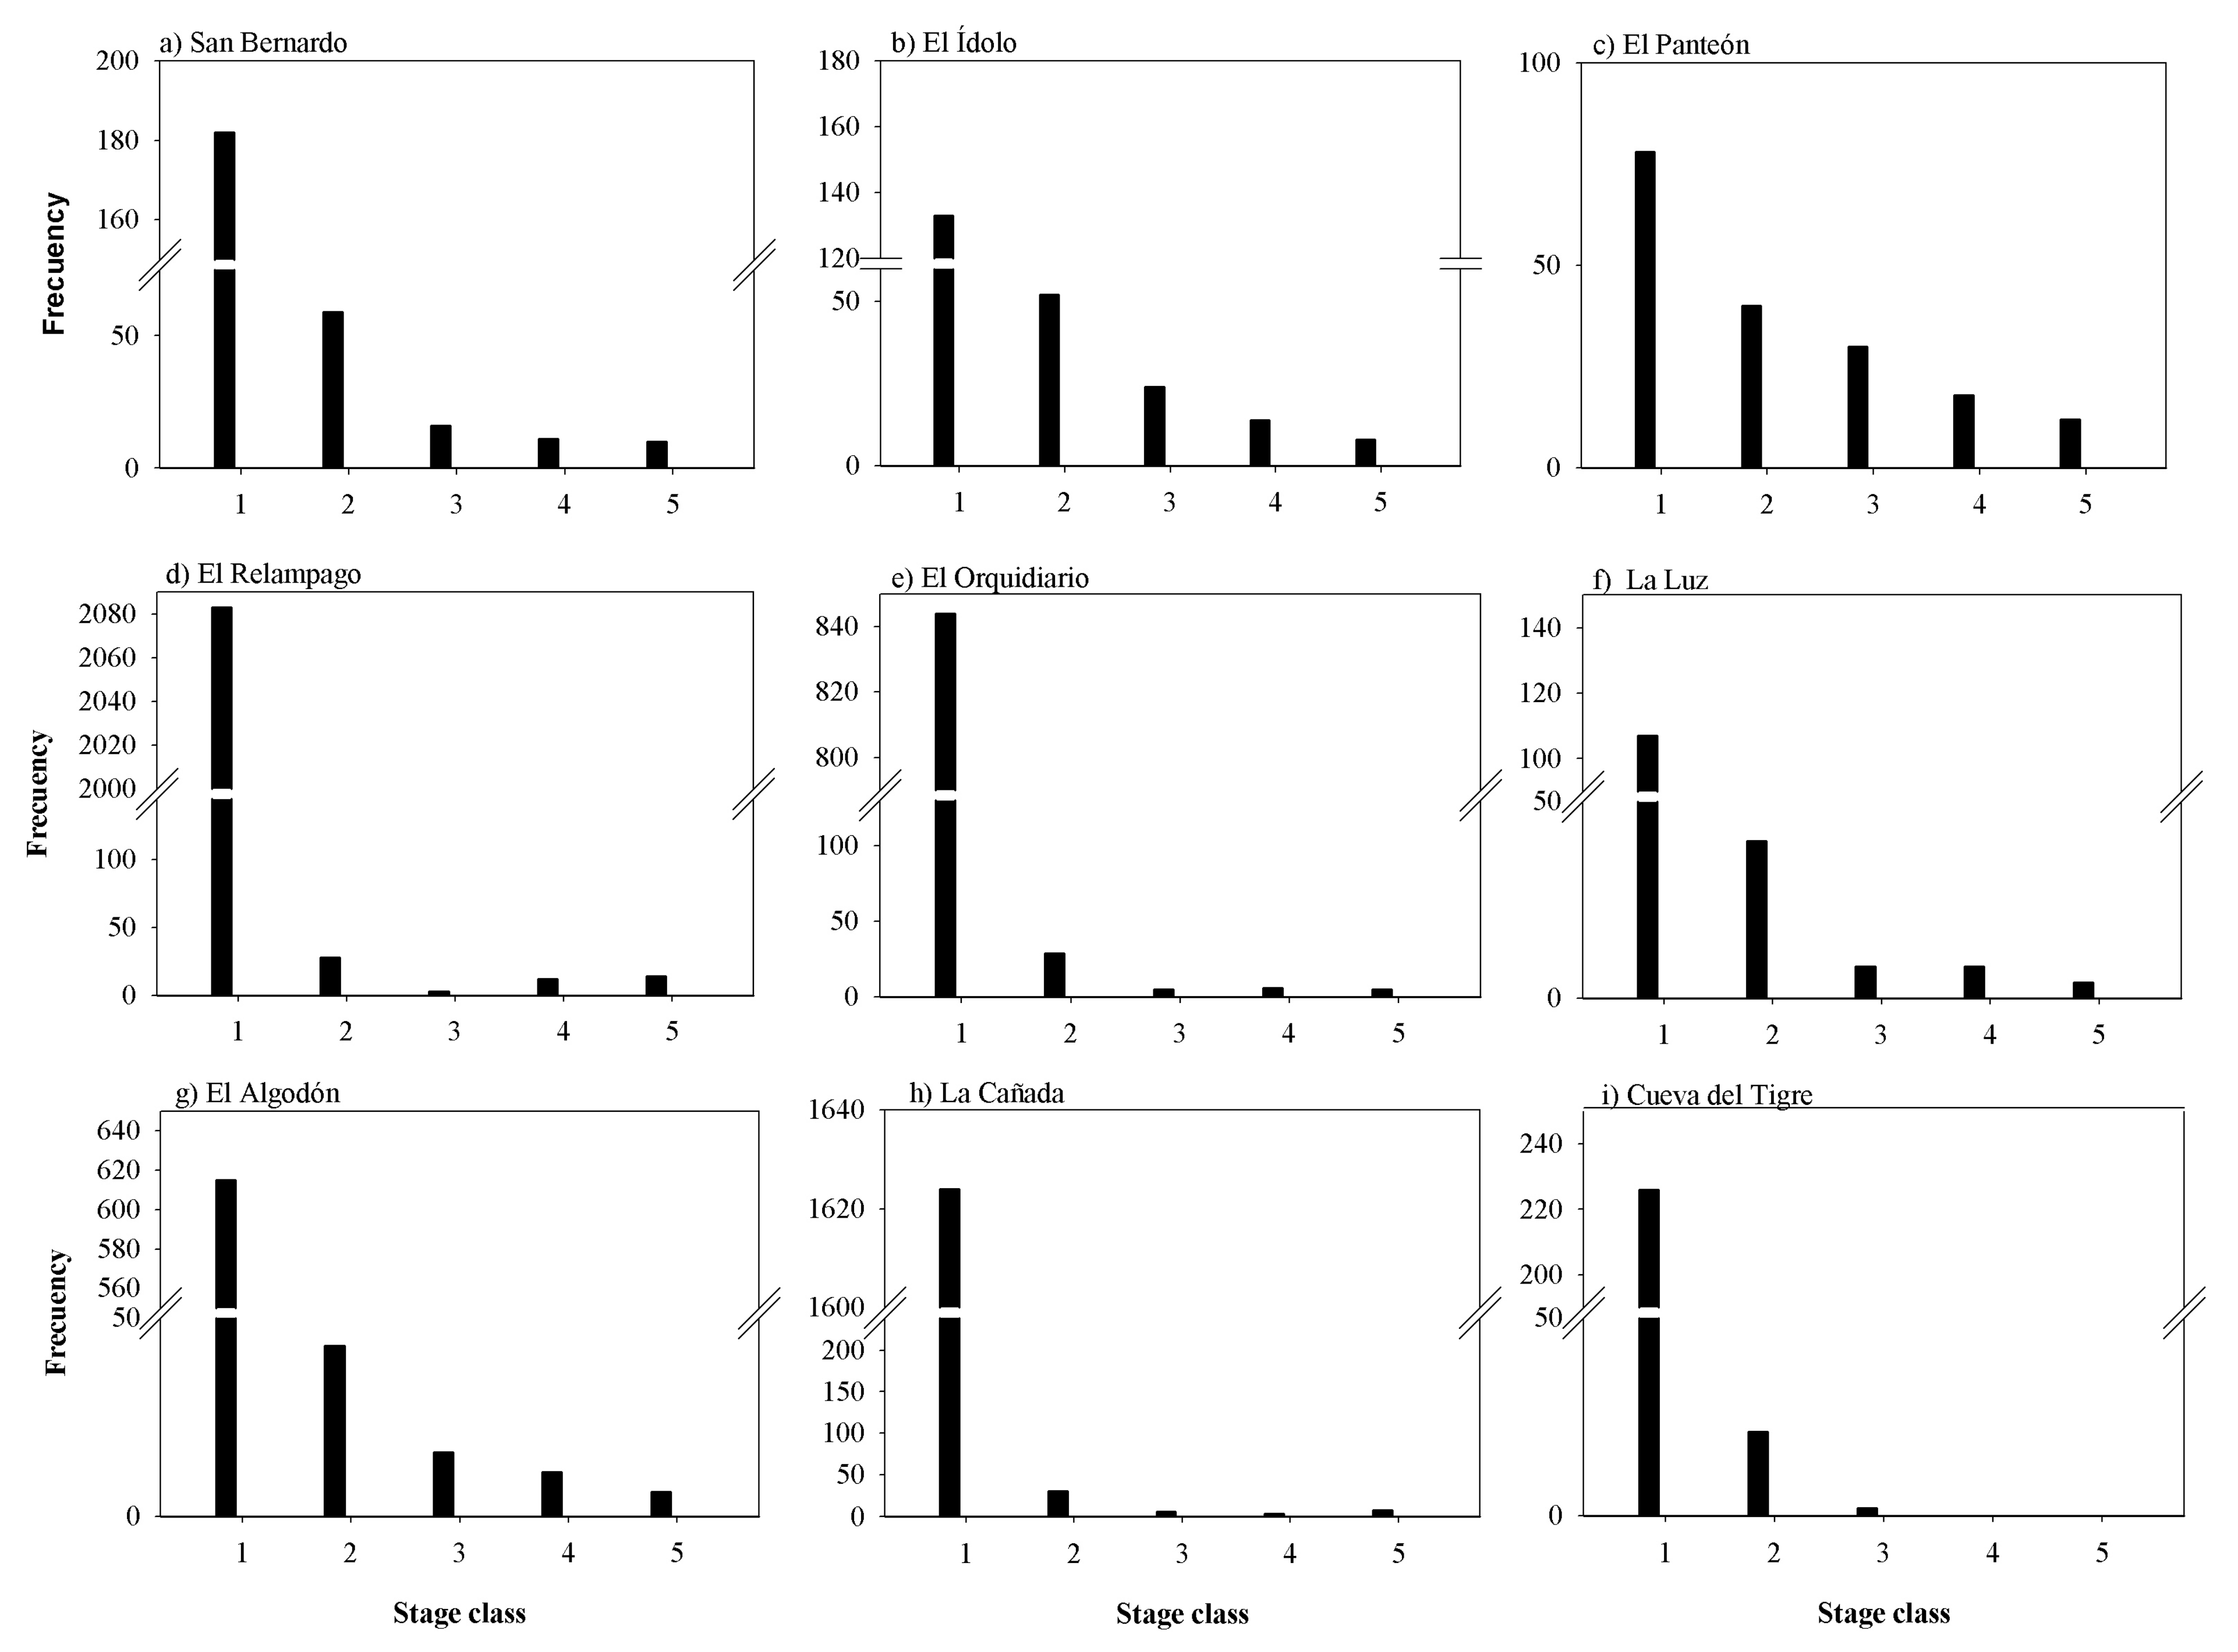
3.2. Abundance, Density, Age Structure and Spatial Distribution at Regional Level

The distribution of the species occurred in fragments of different sizes smaller than 1.5 km2 (mean of 0.65 ± 0.42 km2), shapes and composition. O. mexicana was associated with other tree species such as Pinus chiapensis (Martínez) Andresen, Liquidambar styraciflua L., Quercus corrugata Hooker, Q. laurina Humb et Bonpl., Sphaeropteris horrida Liebm. R.M. Tryon, Clethra integerrima (Turcz.) L.M. González, Ticodendron incognitum Gómez-Laur. and L.D. Gómez and Zinowiewia spp. However, when O. mexicana was present, it was a monodominant species of the forest.
In the nine sites analyzed in the Sierra Juárez, O. mexicana showed a total abundance of 5966 individuals, with an average density of 1.65 ± 1.44 indvs. m2. The age structure in all sampled plots analyzed was similar to a J-inverted (Figure 3). The first size category had a significantly higher abundance of individuals in all populations (q = 7.57, p < 0.05). This pattern was observed at the species level, where one size category had the highest percentage of individuals (90.1%). The population of El Relámpago featured the most individuals in this category (2080) while the population of El Panteón showed the lowest number (78 indvs.). In addition, size class 5 showed the lowest tree abundance (<2.0%) of the population structure, ranging from none (0%) in La Cueva del Tigre to 14 plants (6.8%) in El Relámpago (Figure 3).
The spatial distribution pattern of O. mexicana showed dependence on the scale of analysis. The spatial structure showed a clump distribution pattern at the plot level, whereas at the category level, only class 1 was significantly clumped, which contrasted with size categories 2 to 5 that showed a random or scattered distribution. Canonical axis 1 (90.85%) and axis 2 (6.28%) captured a higher significant proportion of the variance in structure population-environment relationships. It was observed that the size stage class showed no significant association with geographical variables (longitude, latitude, altitude and slope). However, it was found to be significantly associated with climatic variables. The Average Temperature in the coldest quarter (Bio11) and Precipitation in the driest trimester (Bio17) variables were those that showed the most positive influence on size stage class 1 and 2, while Average Temperature in the driest trimester (Bio9) and Annual Precipitation (Bio12) variables showed a negative influence on Size Stage Class 3 and 4 (Figure 4).

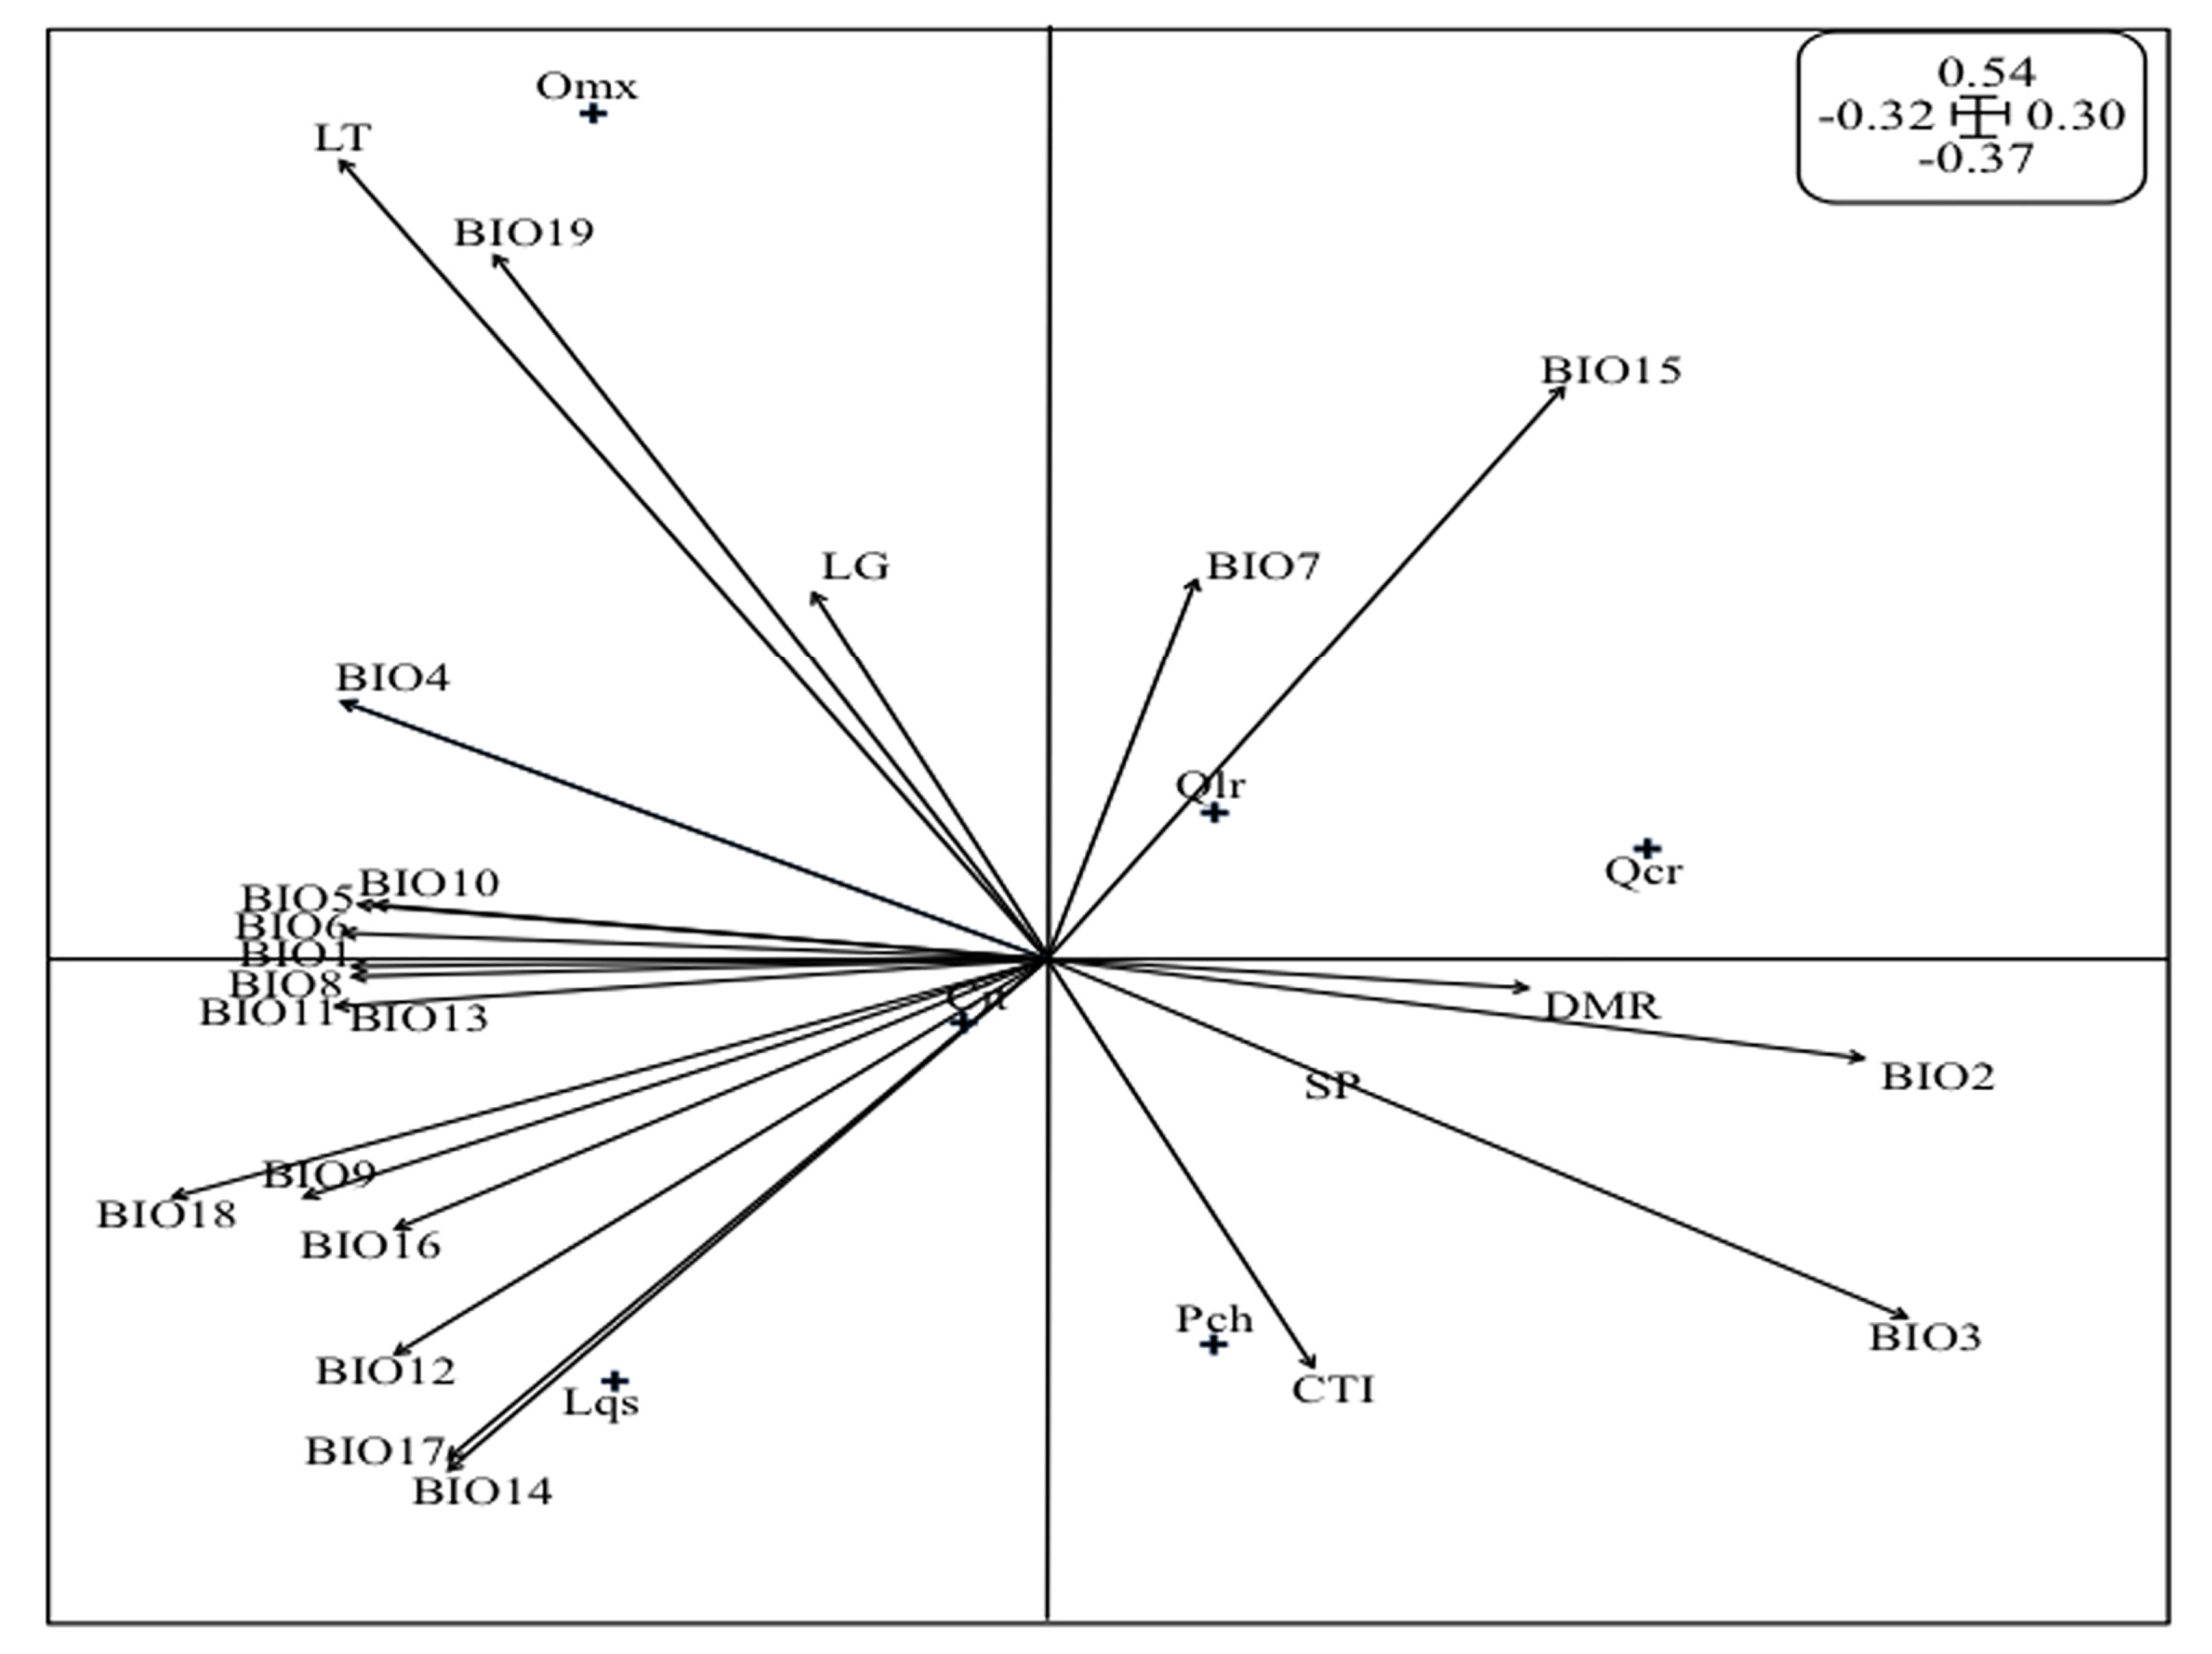
3.3. Analysis of the Oreomunnea mexicana Niche

The OMI analysis indicated a significant and direct effect of environmental variables on the abundance and distribution of the species and only one of the associated species (Table 1). The inertia values showed a significant niche separation between species (p < 0.031). The species with high marginality index values (OMI) were O. mexicana and Q. corrugata, whereas other associated species had a lower unit value (Table 1). The index tolerance values showed that those with high tolerance or amplitude in the municipality were L. styraciflua, C. integerrima and P. chiapensis, while those that were less tolerant were O. mexicana (Table 1). Environmental variables are a factor that affected the distribution of O. mexicana. The first two axes of the OMI analysis (90%) explained a very significant proportion of the variance in the species-environmental relationships. According to the arrow lengths, precipitation in the coldest quarter (Bio19), latitude (LT), compound topographic index (CTI), seasonality precipitation (Bio15), Isothermality (Bio3), Precipitation in the driest season (Bio14), Precipitation in the driest trimester (Bio17), Precipitation in the warmest trimester (Bio18), in descending order were recognized as the most important environmental variables (Figure 5). O. mexicana responded to higher LT and Bio19 and was opposite to Bio3 and CTI.

4. Discussion

The analysis of the distribution areas of relict’s species is a fundamental factor in understanding different bio-geographical and ecological processes that support their conservation [13]. Studies on distribution models usually address independent approaches to potential distribution, climatic scenarios and ecological niche with ecological variables (e.g., abundance, population structure). This work integrates these approaches in order to understand the distribution of the Oreomunnea mexicana, including the interpretation of the factors that could be influencing the conservation of this relict species.
Although, potential distribution of O. mexicana is consistent with cloud forest distribution in Mexico see [4,23], our results suggest that the predicted potential model exceeds actual distributional areas consisting of discontinuous populations. This result is common in this type of work due to an insufficient sampling, the presence of geographic barriers, stochastic processes, or biotic interactions, which affect the species potential prediction and generally increases the area with respect to actual distribution [33,45]. Discontinuous distributions of O. mexicana have also been described for other relict species in cloud forests [46,47,48]. These similarities have resulted because of natural events in the past (e.g., climatic and geomorphological), which led to the reduction in size, and fragmentation of the cloud forest of Mexico during the Tertiary Period [6].
Currently, land use change and accelerated climate change are two of the greatest threats to the cloud forest, especially in relict or threatened species like O. mexicana because they modify its distribution on the cloud forest. Fragmented distribution processes have been observed to be a primary result of land conversion [2,4], while climate change has been observed to be the principal driver of range contractions inside the cloud forests due to the fact that it produces alterations in climatic conditions which affect physiological, phenological and distributional conditions in plant species [23,49]. In Sierra Juárez, TMCF showed low anthropogenic disturbance [50] in contrast to Veracruz where it has been lost or replaced by pastures, crops or urban housing. The main causes of TMCF conservation in Sierra Juárez are voluntary establishment of community conservation areas and the implementation of governmental incentives, which favor their conservation and have an indirect effect on the occurrence of the species.
In this region, the inverse J-shaped population structure of the species suggests a favorable regeneration and a mature stable system according to de Souza et al. [51]. However, aggregate spatial structures of the species suggest that abiotic processes such as habitat heterogeneity, disturbances or other stochastic events contribute to nonrandom distributions of trees. Pacheco-Cruz [52] found that seedlings mainly survived when growing within the Oreomunnea stand. This associated with limited seed dispersion, specific soil conditions [52] and mutualistic relationships with ectomycorrhizae [11] has contributed to a discontinuous aggregated distribution of the species.
Traditionally, land-conversion and climate change are usually considered independently as primary threats to global biodiversity [53]. However, the synergistic interaction between these two processes greatly outweighs the impact on biodiversity of either factor alone, particularly if the combined effects are additive on demographic parameters [54]. Even though land use-change on TMCF at the Sierra Juárez is less than 5% [50], unsuitable governmental programs that promote incentives for agriculture, coffee plantations, forestry programs and cattle grazing development, have had a negative effect on forested areas, directly affecting the abundance and distribution of the species. On the other hand, the action of the climatic elements is unpredictable and unstoppable in the nature that suffers the greatest disasters [55].
In Sierra Juárez, an unusual event of strong winds (>100 km/h) caused severe damage to forests on March 9, 2016 [19]. This extreme event produced ≈60% of tree mortality of O. mexicana, because it toppled the largest trees, uprooted them and caused root system detachment of saplings and seedlings which negatively impacted the population structure of five sites (San Bernando, El Panteón, El Orquídiario, El Relámpago and La Cañada) compared to the initial population structure, however, future population dynamics based studies would allow precise evaluation of the effected from trees suppression by this wind storm. Although, one single weather event is not evidence of climate change, this unusual event can offer important lessons about specie´s vulnerabilities to climate change. Additionally, records over the last 70 years suggest an increase in temperature (0.3 °C) and anomaly variation of the precipitations in Sierra Juárez [19]. Although this average increase in regional temperature is lower to the one reported nationally and worldwide (0.85 °C) for the period 1880–2012 [56], it clearly identifies climate change as a risk factor.
At the national level, the climatic scenario trends significantly reduced the suitable habitat of O. mexicana and coincide with the habitat loss predicted by projections of climate change on Mexican cloud forests [4,5]. In relict species, this represents a serious risk considering their high susceptibility to climatic variation that significantly affects their distribution, fitness, and competitive interactions [54]. Despite the drastic national scenario, Sierra Juárez could provide shelter for a future climate due to low loss of the projected habitat. Although the exact relationship between levels of climatic scenarios and the environment is complex and not well understood, it is evident that Sierra Juárez is greatly influenced by different environmental factors (e.g., orographic, climatic, etc.) that provide a higher habitat heterogeneity and consequently impact on the distribution and dynamics of the species. Due to this habitat heterogeneity, the cloud forest at Sierra Juárez is considered a key conservation area against future climate change [5].
Habitat specialization based on niche differentiation of resources causes different species of trees to develop better in a small subset of patches in the ecosystem, showing competitive dominance and relatively higher abundance [57,58]. Our results suggest that O. mexicana showed a specialized habitat and specific environmental requirements than strongly influence it’s development and distribution, therefore being likely to play a key role in the structuring of the trees on the cloud forest. In relict species, the discontinuous distribution and monodominance of the patches by a single tree is common in the cloud forest, e.g., [10,58]. The habitat specialization of O. mexicana directly contributes to the discontinuous distribution and monodominance of the species at Sierra Juárez, where differences in soil parameters and ecological interaction on adjacent stands limit its sustenance in the ecological space, locally causing its replacement by other species such as L. styraciflua, S. horrida and P. chapensis. Also, their high environmental sensitivity and low tolerance of the species, causes a narrow range of resources that the species uses (e.g., its niche breadth) and high specificity for climatic and geographical variables, thereby increasing their vulnerability to climate change. Further investigations that distinguish climate effects from other factors, such as habitat fragmentation, genetic studies in small populations and the effects of toppled trees are necessary to improve conservation predictions.
Despite the lack of knowledge on how O. mexicana populations respond to climate change, our analysis represents a first step towards understanding the influences of environmental factors on the distribution of this species. Understanding and quantifying these interactions is essential for reliably managing ecosystems and biodiversity conservation in the face of future changes, as appropriately suggested by Oliver and Morecroft [54]. Assuming that O. mexicana is sensitive to climate and land use change as other cloud forest species are, e.g., [5,23], the ecological results and potential distribution predicted can be useful in the strategic planning for the conservation of the species. Recently, communities located in Sierra Juárez have implemented voluntary environmental policies such as community conservation areas and payment for hydrological services, which take the presence of O. mexicana into consideration due its high conservation value in the certification process [20,21]. In this context, the newly registered populations and the species’ biological information can help the community environmental policies and increase the areas of conservation of the cloud forest. The emblematic use of O. mexicana as a flagship species is not exclusive, as this has also been proposed for a sister species, O. pterocarpa in Costa Rica [59]. These types of synergic conservation and study activities can help the permanence of all species of flora and fauna that inhabit the region, which could be a good model for the conservation of cloud forests.
Given the international failure to reduce the loss of biodiversity and the need to act quickly at a global level, the results of this study represent a first step towards understanding the influences of environmental factors on the distribution of this species. Although in the Sierra Juarez the communities of this region are preserving the population of O. mexicana, the processes of climatic changes or particular environmental factors put at risk the future permanence of the species, making it necessary to implement conservation and restoration strategies.

Acknowledgments

The authors acknowledge the support of the FOMIX-CONACYT 195425 and the Program of Basic Science (SEP-CONACYT No. 180790). We also thank the community leaders of Santiago Comaltepec and Ixtlán de Juárez, Oaxaca (2014–2017), for his interest and support in carrying out this study; and the students of UNSIJ that helped with the field survey.

Author Contributions

Cecilia Alfonso-Corrado: designed the study, field sampling, statistical analysis, manuscript writing; Francisco Naranjo-Luna: study design, methodology determination, revision and editing of the manuscript; Ricardo Clark-Tapia: study design, statistical analysis, contributed information for the writing, revision and editing of the manuscript; Jorge E. Campos; revision and editing of the manuscript; Octavio Rojas-Soto: methodology determination, revision and editing of the manuscript; María Delfina Luna-Krauletz: revision and editing of the manuscript; Barbara Bodenhorn: revision and editing of the manuscript: Montserrat Gorgonio-Ramírez: revision and editing of the manuscript; Nelly Pacheco-Cruz: revision and editing of the manuscript.

Conflicts of Interest

The authors declare no conflict of interest.

References

  1. Bubb, P.; May, I.; Miles, L.; Sayer, J. Cloud Forest Agenda; UNEP World Conservation Monitoring Centre: Cambridge, UK, 2004. [Google Scholar]
  2. Toledo-Aceves, A.; Meave, A.J.; González-Espinosa, M.; Ramírez-Marcial, N. Tropical montane cloud forests: Current threats and opportunities for their conservation and sustainable management in Mexico. J. Environ. Manag. 2011, 92, 974–981. [Google Scholar] [CrossRef] [PubMed]
  3. Goldsmith, G.R.; Matzke, N.J.; Dawson, T.E. The incidence and implications of clouds for cloud forest plant water relations. Ecol. Lett. 2013, 16, 307–314. [Google Scholar] [CrossRef] [PubMed]
  4. Rojas-Soto, O.R.; Sosa, V.; Ornelas, J.F. Forecasting cloud forest in Eastern and southern México: Conservation insights under future climate change scenarios. Biodivers. Conserv. 2012, 21, 2671–2690. [Google Scholar] [CrossRef]
  5. Ponce-Reyes, R.; Reynoso-Rosales, V.H.; Watson, J.E.; VanDerWal, J.; Fuller, R.A.; Pressey, R.L.; Possingham, H.P. Vulnerability of cloud forest reserves in Mexico to climate change. Nat. Clim. Chang. 2012, 2, 448–452. [Google Scholar] [CrossRef]
  6. Challenger, A.; Soberón, J. Los Ecosistemas Terrestres. In Capital Natural de México. Vol. I Conocimiento actual de la biodiversidad, 1st ed.; CONABIO: Mexico D.F., Mexico, 2008; pp. 87–108. [Google Scholar]
  7. González-Espinosa, M.; Meave, J.A.; Lorea-Hernández, F.G.; Ibarra-Manríquez, G.; Newton, A.C. The Red List of Mexican Cloud Forest Trees, 1st ed.; Fauna and Flora International: Cambridge, UK, 2011; pp. 1–148. ISBN 9781903703281. [Google Scholar]
  8. Téllez-Valdés, O.; Dávila-Aranda, P.; Lira-Saade, R. The effects of climate change on the long-term conservation of Fagus grandifolia var. mexicana, an important species of the cloud forest in Eastern Mexico. Biodivers. Conserv. 2006, 15, 1095–1107. [Google Scholar] [CrossRef]
  9. Graham, A. The age and diversification of terrestrial New World ecosystems through Cretaceous and Cenozoic time. Am. J. Bot. 2011, 98, 336–351. [Google Scholar] [CrossRef] [PubMed]
  10. Williams-Linera, G.; Toledo-Garibaldi, M.; Gallardo-Hernández, C. How heterogeneous are the cloud forest communities in the central mountains of central Veracruz, México? Plant. Ecol. 2013, 214, 685–701. [Google Scholar] [CrossRef]
  11. Corrales, A.; Arnold, A.E.; Ferrer, A.; Turner, B.L.; Dalling, J.W. Variation in ectomycorrhizal fungal communities associated with Oreomunnea mexicana (Juglandaceae) in a Neotropical montane forest. Mycorrhiza 2016, 26, 1–17. [Google Scholar] [CrossRef] [PubMed]
  12. Zimmernann, M.; Vischer-Leopold, M.; Ellwanger, G.; Ssymank, A.; Schröder, E. The EC habitats directive and the German natura 2000 network of protected areas as tool for implementary. In Relic Species: Phylogeography and Conservation Biology, 1st ed.; Habel, J.C., Assaman, T., Eds.; Springer: Berlin/Heidelberg, Germany, 2010; pp. 323–340. [Google Scholar]
  13. Habel, J.C.; Assmann, T.; Schmitt, T. Relic Species: From past to future. In Relic Species: Phylogeography and Conservation Biology, 1st ed.; Habel, J.C., Assaman, T., Eds.; Springer: Berlin/Heidelberg, Germany, 2010; pp. 1–9. [Google Scholar]
  14. Rödder, D.; Dambach, J. Modeling futures trends of relic specie. In Relic Species: Phylogeography and Conservation Biology, 1st ed.; Habel, J.C., Assaman, T., Eds.; Springer: Berlin/Heidelberg, Germany, 2010; pp. 385–400. [Google Scholar]
  15. Russell, J.; Cohn, R. Oreomunnea mexicana, 1st ed.; Bookvika publishing: Alplaus, NY, USA, 2012. [Google Scholar]
  16. Rzedowski, J.; Palacios-Chávez, R. El bosque de Engelhardtia (Oreomunnea mexicana) en la región de la Chinantla, Oaxaca, México, una reliquia del Cenozoico. Bol. Soc. Bot. Mex. 1977, 36, 93–123. [Google Scholar] [CrossRef]
  17. Anta-Fonseca, S.; Galindo-Leal, C.; González-Medrano, F.; Koleff-Osorio, P.; Meave del Castillo, J.; Moya-Moreno, H.; Victoria-Hernández, A. Sierra Norte de Oaxaca. In El bosque mesófilo de montaña en México: Amenazas y Oportunidades Para su Conservación y su Manejo Sostenible, 1st ed.; CONABIO: Mexico D.F., Mexico, 2010; pp. 108–115. [Google Scholar]
  18. Gaston, K.J. Rarity, 1st ed.; Chapman & Hall: London, UK, 1994. [Google Scholar]
  19. Clark-Tapia, R.; Suárez-Mota, M.E.; Matías-Nolasco, M.; Velasco Hipólito, F. Clima: Pasado, presente y futuro. In Recursos Hídricos de la Sierra Norte de Oaxaca, Caracterización, Diagnóstico y Gestión, 1st ed.; Clark-Tapia, R., Ramos-Morales, M.F., Alfonso-Corrado, C., Mendoza-Díaz, M.G., Fuente-Carrasco, M., Eds.; Universidad de la Sierra Juárez: Oaxaca, Mexico, 2016; pp. 48–58. [Google Scholar]
  20. Naranjo-Luna, F.J. Ecología y Genética de Oreomunnea mexicana (Stand) J.F., (Juglandaceae), Especie Relicto del Bosque de Niebla de la Sierra Juárez, Oaxaca. Master’s Thesis, Universidad de la Sierra Juárez, Oaxaca, Mexico, 2014; p. 115. [Google Scholar]
  21. Unión de Comunidades Forestales Zapotecas-Chinantecas (UZACHI). Programa de Manejo Forestal para el Predio de Capulápam de Méndez, Municipio del Mismo Nombre (2003–2013); UZACHI: Oaxaca, Mexico, 2003; p. 200. [Google Scholar]
  22. Villaseñor, J.L.; Téllez-Valdés, O. Distribución potencial de las especies del género Jefea (Asteraceae) en México. An. Inst. Biol. Ser. Bot. Méx. 2004, 75, 205–220. [Google Scholar]
  23. Mota-Vargas, C.; Rojas-Soto, O.R. The importance of defining the geographic distribution of species for conservation: The case of the Bearded Wood-Partridge. J. Nat. Conserv. 2012, 20, 10–17. [Google Scholar] [CrossRef]
  24. Global Biodiversity Information Facility (GBIF). Available online: http://data.gbif.org (accessed on 14 July 2017).
  25. Comisión Nacional para el Conocimiento y Uso de la Biodiversidad (CONABIO). Available online: http://www.conabio.gob.mx/remib/doctos/remibnodosdb.html (accessed on 14 July 2017).
  26. Pearson, R.G.; Raxworthy, C.; Nakamura, M.; Peterson, A.T. Predicting species distributions from small numbers of occurrence records: A test case using cryptic geckos in Madagascar. J. Biogeogr. 2007, 3, 102–117. [Google Scholar] [CrossRef]
  27. Hijmans, R.J.; Cameron, S.E.; Parra, J.L.; Jones, P.G.; Jarvis, A. Very high resolution interpolated climate surfaces for global land areas. Int. J. Climatol. 2005, 25, 1965–1978. [Google Scholar] [CrossRef]
  28. Estrada-Contreras, I.; Equihua, M.; Castillo-Campos, G.; Rojas-Soto, O. Climate change and effects on vegetation in Veracruz, Mexico: An approach using ecological niche modelling. Acta Bot. Mex. 2015, 112, 73–93. [Google Scholar] [CrossRef]
  29. Intergovernmental Panel on Climate Change (IPCC). Climate Change 2013: The Physical Science Basis, Contribution of Working Group I to the Fifth Assessment Report of the Intergovernmental Panel on Climate Change; Cambridge University Press: Cambridge, UK, 2013. [Google Scholar]
  30. Environmental Scientific Research Institute (ESRI). ArcView, version 3.x; ESRI: Redlands, CA, USA, 2000. [Google Scholar]
  31. Phillips, S.J.; Anderson, R.P.; Schapire, R.E. Maximum entropy modeling of species geographic distribution. Ecol. Model. 2006, 190, 231–259. [Google Scholar] [CrossRef]
  32. Phillips, S.J.; Dudík, M. Modeling of species distributions with Maxent new extensions and comprehensive evaluation. Ecography 2008, 31, 161–175. [Google Scholar] [CrossRef]
  33. Menon, S.; Choudhury, B.I.; Khan, M.L.; Peterson, A.T. Ecological niche modeling and local knowledge predict new populations of Gymnocladus assamicus a critically endangered tree species. Endanger. Species Res. 2010, 11, 175–181. [Google Scholar] [CrossRef]
  34. Fielding, A.H.; Bell, J.F. A review of methods for the assessment of prediction errors in conservation presence/absence models. Environ. Conserv. 1997, 24, 38–49. [Google Scholar] [CrossRef]
  35. Thuiller, W.; Lavorel, S.; Araújo, M.B.; Sykes, M.T.; Prentice, I.C. Climate change threats to plant diversity in Europe. Proc. Natl. Acad. Sci. USA 2005, 102, 8245–8250. [Google Scholar] [CrossRef] [PubMed]
  36. Instituto Nacional de Estadística, Geografía e Informática (INEGI); Comisión Nacional para el Conocimiento y Uso de la Biodiversidad; Instituto Nacional de Ecología. Ecorregiones terrestres de México; CONABIO: Mexico D.F., Mexico, 2008. [Google Scholar]
  37. Brook, R.K.; McLachlan, S.M. Trends and prospects for local knowledge in ecological and conservation research and monitoring. Biodivers. Conserv. 2008, 17, 3501–3512. [Google Scholar] [CrossRef]
  38. Alfonso-Corrado, C.; Clark-Tapia, R.; Mendoza, A. Demography and management of two clonal oaks: Quercus eduardii and Q. potosina (Fagaceae) in central México. For. Ecol. Manag. 2007, 251, 129–141. [Google Scholar] [CrossRef]
  39. Addinsoft. XLSTAT (2014) XLSTAT Software. Paris, France. Available online: https://www.xlstat.com/es/1995-2014 (accessed on 15 March 2015).
  40. Ter Braak, C.J. Canonical correspondence analysis: A new eigenvector technique for multivariate direct gradient analysis. Ecology 1986, 67, 1167–1179. [Google Scholar] [CrossRef]
  41. Hammer, Q.; Harper, D.A.T.; Ryan, P.D. PAST: Paleontological statistics software package for education and data analysis. Palaeontol. Electron. 2001, 4, 1–9. [Google Scholar]
  42. Dolédec, S.; Chessel, D.; Gimaret-Carpentier, C. Niche separation in community analysis: A new method. Ecology 2000, 81, 2914–2927. [Google Scholar] [CrossRef]
  43. Thioulouse, J.; Chessel, D.; Dole, S.; Olivier, J.M. ADE-4 a multivariate analysis and graphical display software. Stat. Comput. 1997, 7, 75–83. [Google Scholar] [CrossRef]
  44. Tsiftsis, S.; Tsiripidisa, I.; Karagiannakidoua, V.; Alifragisb, D. Niche analysis and conservation of the orchids of East Macedonia (NE Greece). Acta Oecol. 2008, 33, 27–35. [Google Scholar] [CrossRef]
  45. Deka, J.; Bharali, S.; Kr Das, K.; Tripath, O.P.; Latif Khan, M. Mapping the potential distribution of Pinus merkusii Jungh Et De Vries. A vulnerable gymnosperm in eastern Arunachal Pradesh using maximum entropy model. Asian J. Geoinform. 2013, 13, 16–22. [Google Scholar]
  46. Contreras-Medina, R.; Luna-Vega, I.; Ríos-Muñoz, C.A. Distribución de Taxus globosa (Taxaceae) en México: Modelos ecológicos de nicho, efecto del cambio del uso de suelo y conservación. Rev. Chil. Hist. Nat. 2010, 83, 421–433. [Google Scholar] [CrossRef]
  47. Vargas-Rodríguez, Y.L.; Platt, W.J. Remnant sugar maple (Acer saccharum subsp. skutchii) populations at their range edge: Characteristics, environmental constraints and conservation implications in tropical America. Biol. Conserv. 2012, 150, 111–120. [Google Scholar] [CrossRef]
  48. Ruiz-Sanchez, E.; Ornelas, F.J. Phylogeography of Liquidambar styraciflua (Altingiaceae) in Mesoamerica: survivors of a Neogene widespread temperate forest (or cloud forest) in North America? Ecol. Evol. 2014, 4, 311–328. [Google Scholar] [CrossRef] [PubMed]
  49. Quante, M. The Changing Climate: Past, Present, Future. In Relic Species: Phylogeography and Conservation Biology, 1st ed.; Habel, J.C., Assaman, T., Eds.; Springer: Berlin/Heidelberg, Germany, 2010; pp. 10–57. [Google Scholar]
  50. Sandoval-García, R. Vulnerabilidad Hídríca de la Subcuenca Valle Nacional, Oaxaca. Master’s Thesis, Universidad de la Sierra Juárez, Oaxaca, Mexico, 2014. [Google Scholar]
  51. De Souza, I.; Souza, A.F.; Pizo, M.A.; Ganade, G. Using tree population tree size structures to assess the impacts of cattle grazing and eucalypts plantations in subtropical South America. Biodivers. Conserv. 2010, 19. [Google Scholar] [CrossRef]
  52. Pacheco-Cruz, N.J. Dinámica poblacional y regeneración de Oreomunnea mexicana, (Standl.) J.F. Leroy (Juglandaceae), Especie Relicto del Bosque de Niebla en la Sierra Juárez. Bachelor’s Thesis, Universidad de la Sierra Juárez, Oaxaca, Mexico, 2016. [Google Scholar]
  53. Brodie, H.J. The Bird´s Nest Fungi, 1st ed.; University of Toronto Press: Toronto, ON, Canada, 2016. [Google Scholar]
  54. Oliver, T.H.; Morecroft, M.D. Interactions between climate change and land use change on biodiversity: Attribution problems, risks, and opportunities. Wiley Interdisciplinary. Rev. Clim. Chang. 2014, 5, 317–335. [Google Scholar] [CrossRef] [Green Version]
  55. Huber, D.C.; Gulledge, J. Extreme Weather & Climatic Change: Understanding the Link and Managing the Risk, 1st ed.; Center for Climate and Energy Solutions: Arlington, VA, USA, 2011; pp. 1–11. [Google Scholar]
  56. SEMARNAT. Plan Nacional de Desarrollo Sustentable. Programa Especial de Cambio Climático 2014–2018 (PECC), 1st ed.; SERMANAT: Mexico City, Mexico, 2013–2018; pp. 1–85. [Google Scholar]
  57. Bazzaz, F.A. Habitat selection in plants. Am. Nat. 1991, 137, 116–130. [Google Scholar] [CrossRef]
  58. Harms, K.E.; Condit, R.; Hubbell, S.P.; Foster, R.B. Habitat associations of trees and shrubs in a 50 ha Neotropical forest plot. J. Ecol. 2001, 89, 947–959. [Google Scholar] [CrossRef]
  59. Guerrero-Aguirre, G.F. Caracterización poblacional de cinco especies arbóreas ecológicamente importantes en el Corredor Biológico Turrialba Jiménez Costa Rica. Master’s Thesis, Centro Agronómico Tropical de Investigación y Enseñanza, Turrialba, Costa Rica, 2005. [Google Scholar]
Figure 1. Areas in black indicate the potential current distribution; stars and circle indicate a historical and recent record of O. mexicana (A); Suitable potential distribution of the species (B) under two Representative Concentration Pathways: the RCP4.5 and RCP8.5 scenarios for the years 2050 and 2070.
Forests 08 00261 g001
Figure 2. Location of O. mexicana populations in the Sierra Juárez in Oaxaca, Mexico. Black tree indicates the nine ecological study sites, white circle indicates sites with presence of the species and black triangle indicate absence of O. mexicana in three municipalities in the Sierra Juárez.
Forests 08 00261 g002
Figure 3. Frequency distributions in O. mexicana according to stage class, expressed as abundance of individuals for each population: (a) San Bernando; (b) El Ídolo; (c) El Panteón; (d) El Relampago; (e) El Orquidiario; (f) La Luz; (g) El Algodón; (h) La Cañada and (i) Cueva del Tigre.
Forests 08 00261 g003
Figure 4. Canonical Correspondence Analysis (CCA) of each stage class (Cs1.Csn) (in the nine O. mexicana populations) and their association with environmental variables. Quantitative environmental variables are indicated by arrows. The length of the arrows describes the relative importance of each analyzed variable, and the direction of the arrow indicates among variables correlation.
Forests 08 00261 g004
Figure 5. Ordination diagrams on the first two axes of outlying mean index analysis (OMI). The origin of the biplot represents the most general conditions based upon all environmental variables used in the model. Environmental variables are depicted as vectors. The length of the arrows describes the relative importance of each analyzed variable, and the direction indicates how well correlated the environmental variable is with each axis. See Table 1 for the abbreviation of the species.
Forests 08 00261 g005
Table 1. Niche parameters of O. mexicana and associated species in the Sierra Juárez, Oaxaca.
SpeciesInertiaOMIT1T2P
O. mexicana (Omx)18.0510.877.268.690.03 *
L. styraciflua (Lqs)29.70.11514.528.80.45 NS
S. horrida (Sho)24.40.04814.59.220.36 NS
P. chiapensis (Pch)31.21.0611.019.10.35 NS
Q. corrugata (Qcr)23.97.386.4210.10.02 *
Q. laurina (Qlr)29.72.359.3117.10.29 NS
C. integerrima (Cit)26.30.12213.618.260.48 NS
Inertia = total variability, OMI = outlying mean index (%), T1 = tolerance index (%), T2 = residual tolerance (%), OMI, Values with asterisk represent the percentages of variability corresponding to a specific statistic, P = frequency based on number of random permutations (out of 1000) that yielded a higher value than the observed outlying mean index (p = 0.05), NS = Not significant.

