Article

Dynamics of Organic Matter in Leaf Litter and Topsoil within an Italian Alder (Alnus cordata (Loisel.) Desf.) Ecosystem

by
Michele Innangi
*,†,
Tiziana Danise
*,†,
Francesco D’Alessandro
,
Elena Curcio
and
Antonietta Fioretto
Department of Environmental, Biological, and Pharmaceutical Sciences and Technologies, University of Campania “Luigi Vanvitelli”, Via Vivaldi 43, 81100 Caserta, Italy
*
Authors to whom correspondence should be addressed.
These authors contributed equally to this work.
Forests 2017, 8(7), 240; https://doi.org/10.3390/f8070240
Submission received: 10 May 2017 / Revised: 22 June 2017 / Accepted: 3 July 2017 / Published: 7 July 2017

Abstract

:
Forests are the most important land ecosystems that can mitigate the earth’s ongoing climate change through their ability to sequester CO2 as C stock in forest biomass and soil. Short-rotation deciduous hardwoods or N2-fixing species are ideal candidates for afforestation and reforestation, given that most of the carbon accumulates in the first 30 years. Alders match both of the above-mentioned features, and Italian alder, which is less dependent on riparian habitats and more drought tolerant, is an ideal candidate. Despite this, few studies exist of this tree species and its effect on soil organic matter. In this study, we focused on litter input and leaf litter decomposition dynamics, forest floor leaf litter and topsoil (0–5 cm) organic matter, and patterns of covariation from litter to topsoil. The leaf litter was rich in nitrogen and decomposed quickly (k = 0.002 day−1). There was a large organic carbon stock, which varied in the leaf litter (from 1.7 ± 0.3 Mg/ha in January to 0.4 ± 0.1 Mg/ha in July) and was stable in the topsoil (on average 28.6 ± 1.5 Mg/ha). Stocks for total nitrogen, cellulose, lignin, water and ethanol extractables, and total phenols were also evaluated. In order to investigate patterns of covariation in these stocks from litter to soil, we used two-block partial least squares. The first axis showed that from January to July there was a reduction of total nitrogen, lignin and cellulose in the forest floor leaf litter, while in the topsoil there was a decrease in water extractables and total organic carbon. The second axis showed minor phenomena involving phenols, water and ethanol extractables, and total N. The fast turnover of dissolved organic matter fractions (water and ethanol extractables), linked with cellulose and lignin dynamics, might suggest that within the Italian alder ecosystem there is a reasonably fast formation of stable C compounds in the soil. Thus, Italian alder is an ideal species for afforestation and reforestation, which could be particularly interesting for land-use policies.

1. Introduction

Forests are the most important land ecosystems that can mitigate the earth’s ongoing climate change [1]. Carbon (C) stock in forest biomass and soil is mostly responsible for this mitigation potential [2,3,4]. The aforementioned stock is the highest in the organic and mineral soils of temperate and boreal forests [5]. Forest C accumulation in the soil is a complex ecosystem process involving several interacting factors, including litter decay [6,7,8], climate [9,10,11], and soil community [12,13,14]. Nevertheless, in temperate forest ecosystems, a key role belongs to the tree species that make up the largest part of the forest canopy [15,16,17].
Given the importance of forest ecosystems for the C cycle, afforestation and reforestation are common practices nowadays [18]. Moreover, plantations with fast-growing tree species could also mitigate CO2 emissions as their woody biomass could be a possible substitute for fossil fuels [19]. Afforestation in Northern European forests led to a significant increase of C stock in the first 0–20 cm of soil, although the changes were small from a 30-year perspective [20]. Thus, the identification of well-performing tree species for afforestation and reforestation appears crucial in land-use policies. Short-rotation deciduous hardwoods or N2-fixing species are ideal candidates, given that most of the carbon accumulates in the first 30 years [21]. Alders (Alnus sp. pl.) match both of the above-mentioned features, thus they appear to be a potential optimal choice for afforestation or reforestation. Many alder species are riverine trees, thus scientific research on them is often limited to such ecosystems [22] or to a few key species such as grey alder (Alnus incana (L.) Moench) [10,19,23]. Little is known about Italian alder (Alnus cordata (Loisel.) Desf.). This species is endemic to the western side of the Apennines in southern Italy, mountains in south-central Corsica, and north-west Albania, vegetating from 800 m to 1500 m of elevation, and frequently down to 300–400 m with higher rainfall regimes [24]. Compared to other alder species, Italian alder is less dependent on riparian habitats and is more drought tolerant [24], which constitutes its interest as a tree species for afforestation and reforestation. Although there are a few studies that included Italian alder and its impact on the forest C cycle [25,26,27], there is a substantial lack of a comprehensive study of this tree species and its effect on soil organic matter (SOM), despite the critical necessity of knowledge of ecosystem functioning for the planning and management of plantations with short-rotation species [19]. Thus, we studied an Italian alder wood in southern Italy, where this species can form pure and old growth formations [28]. We focused on: (a) litter input and leaf litter decomposition dynamics (for 270 days); (b) forest floor leaf litter and topsoil (0–5 cm) organic matter quality and quantity; and (c) patterns of covariation between the litter and topsoil. Our study aims to provide wide-ranging insight into organic matter quantity and dynamics in an Italian-alder-dominated ecosystem, which can be used to evaluate the potential impact of this species on soil during afforestation or reforestation strategies.

2. Materials and Methods

2.1. Site Description

We collected all of our samples in an Italian alder wood located in southern Italy, in the foothills of Mount Gelbison (1705 m a.s.l.) near the village of Rofrano in the region Campania (40°12′55.32″ N, 15°23′03.12″ E). Mean annual temperature and precipitation were 13.0 °C and 760 mm, respectively. Elevation was 700 m a.s.l., and the slope was 16.5°. The site belongs to the marl–sandstone mountain landscape of the region Campania, with scarce presence of urban areas and land use mostly consisting of wooded areas [29]. The parent material was marl and marl–sandstone conglomerates, with no carbonate content. According to FAO World Reference Base for Soil Resources, the soil had a sandy loam texture and was classified as Luvic Phaeozems [29]. Italian alders, along with a sparse presence of walnuts (Juglans regia L.) and chestnuts (Castanea sativa Miller) made up the canopy almost entirely. The understory had a strong abundance of nitrophilous species such as bracken (Pteridium aquilinum (L.) Kuhn) and berry bushes belonging to the group Rubus fruticosus L.

2.2. Litter Input Collection and Litterbag Experiment

Within an area of 1 ha, we randomly selected six plots where all sampling was carried out. Litter fall from trees was collected using six circular litter traps with a mesh size of 40 mm2, each with a sampling area of 0.5 m2 [30]. Litter was recovered each month from the traps from September to December 2014, in order to minimize leaching due to rainfall. The litter was oven dried at 75 °C until a constant weight. The litter input was visually subdivided in three fractions (Italian alder leaf litter, woody materials, and leaf litter from other species) and weighed in order to calculate the total annual litter input per unit area. Italian alder newly shed litter was pooled and stored. Subsequently, litterbags were prepared with the Italian alder leaf-litter fraction of the litter fall, using 28 × 14 cm terylene bags with a mesh size of 1.5 mm2, which allowed interaction with microflora and most of the mesofauna [7]. Each bag was filled with 3.5 g of leaf litter. In January 2015, we placed nine litterbags on top of the soil in each of the six plots, and we collected three litterbags per plot at 100, 180 and 270 decomposition days, corresponding to May, July and October 2015. After collection, each litterbag was opened and carefully cleaned with a soft brush in order to remove large fauna and particles of soil. After that, the litter was oven dried at 75 °C for 48 h and only then weighed to estimate residual mass. Decomposition trends were evaluated according to the single exponential model [31]. Subsequently, the three litterbag replicates per plot were pooled in order to gain enough material for the analyses, ground until able to pass a 0.5 mm screen, and stored for further chemical analyses.

2.3. Forest Floor and Topsoil Sampling

Along with the litterbag experiment, in the same plots, we also collected the forest floor and the topsoil (0–5 cm). The forest floor was collected by means of a 20 × 20 cm steel frame. All necromass within the frame was hand-collected until reaching the topsoil level and then stored in plastic bags. Subsequently, the forest floor was oven dried at 75 °C until a constant weight and then visually subdivided into three fractions (leaf litter, woody materials and other materials). The forest floor leaf litter was then ground until able to pass a 0.5 mm screen and stored for subsequent chemical analyses. Stocks for the forest floor leaf litter were estimated in Mg/ha, converting for the dry weights (1 g = 10−6 Mg) and the steel frame surface (400 cm2 = 4−6 ha). The topsoil was collected using steel cores (ø = 5 cm, l = 5 cm), which were carried in the laboratory undisturbed. Soil cores were oven dried at 105 °C until a constant weight and then weighed, correcting for the core’s tare. Soil was then sieved at 2 mm to remove the gravel fraction, which was weighed. The soil bulk density (g/cm3) was computed as ρhybrid according to [32], i.e., using the fine earth weight divided for the entire core volume. The fine earth fraction was then ground until able to pass a 0.5 mm screen and stored for further chemical analyses. The topsoil stocks were computed as in [11] and expressed as Mg/ha. Both forest floor leaf litter and topsoil were sampled in three subplots per field plot, which were later pooled together in the laboratory in order to have enough material for the analyses and to account for spatial variability.

2.4. Chemical Analyses

Total organic C and total nitrogen were measured using a CNS Elemental Analyzer (vario El III, Elementar Analysensysteme GmbH, Hanau, Germany), without carbonate removal, given the absence of carbonates [33]. Water and ethanol extractables were estimated gravimetrically according to [34]. Total phenols were measured spectrophotometrically according to [35]. Cellulose and lignin were measured spectrophotometrically according to [36,37], respectively.

2.5. Statistical Analysis

All data were inspected for outliers according to the Dixon’s Q ratio, and removed when necessary. Data were checked for normality and homoscedasticity and, in order to perform parametric statistics, were log-transformed when necessary. All variables are represented as mean ± standard error of the mean. Differences between seasonal samplings were tested using a one-way ANOVA followed by a Tukey post-hoc multiple comparison. Correlations were tested by means of the Pearson product–moment correlation coefficient. Patterns of covariance were tested using two-block partial least squares (Two-block PLS). This analysis is widely used in morphometrics to study covariation in shape [38,39]. In comparison to other well-established methods such as canonical correlation analysis (CCA), the two-block PLS method differs by being used to find latent variables that can account for the covariance between the two sets of variables, offering a simple, direct method to obtain variables that account for as much as possible of the covariation between two sets of variables [38]. Here we used the potential of the analysis using the same variables (i.e., the stocks) from two different layers of soil ecology as the two “blocks” (i.e., forest floor leaf litter and topsoil). Statistical analyses were carried out in PAST 3.14 [40].

3. Results

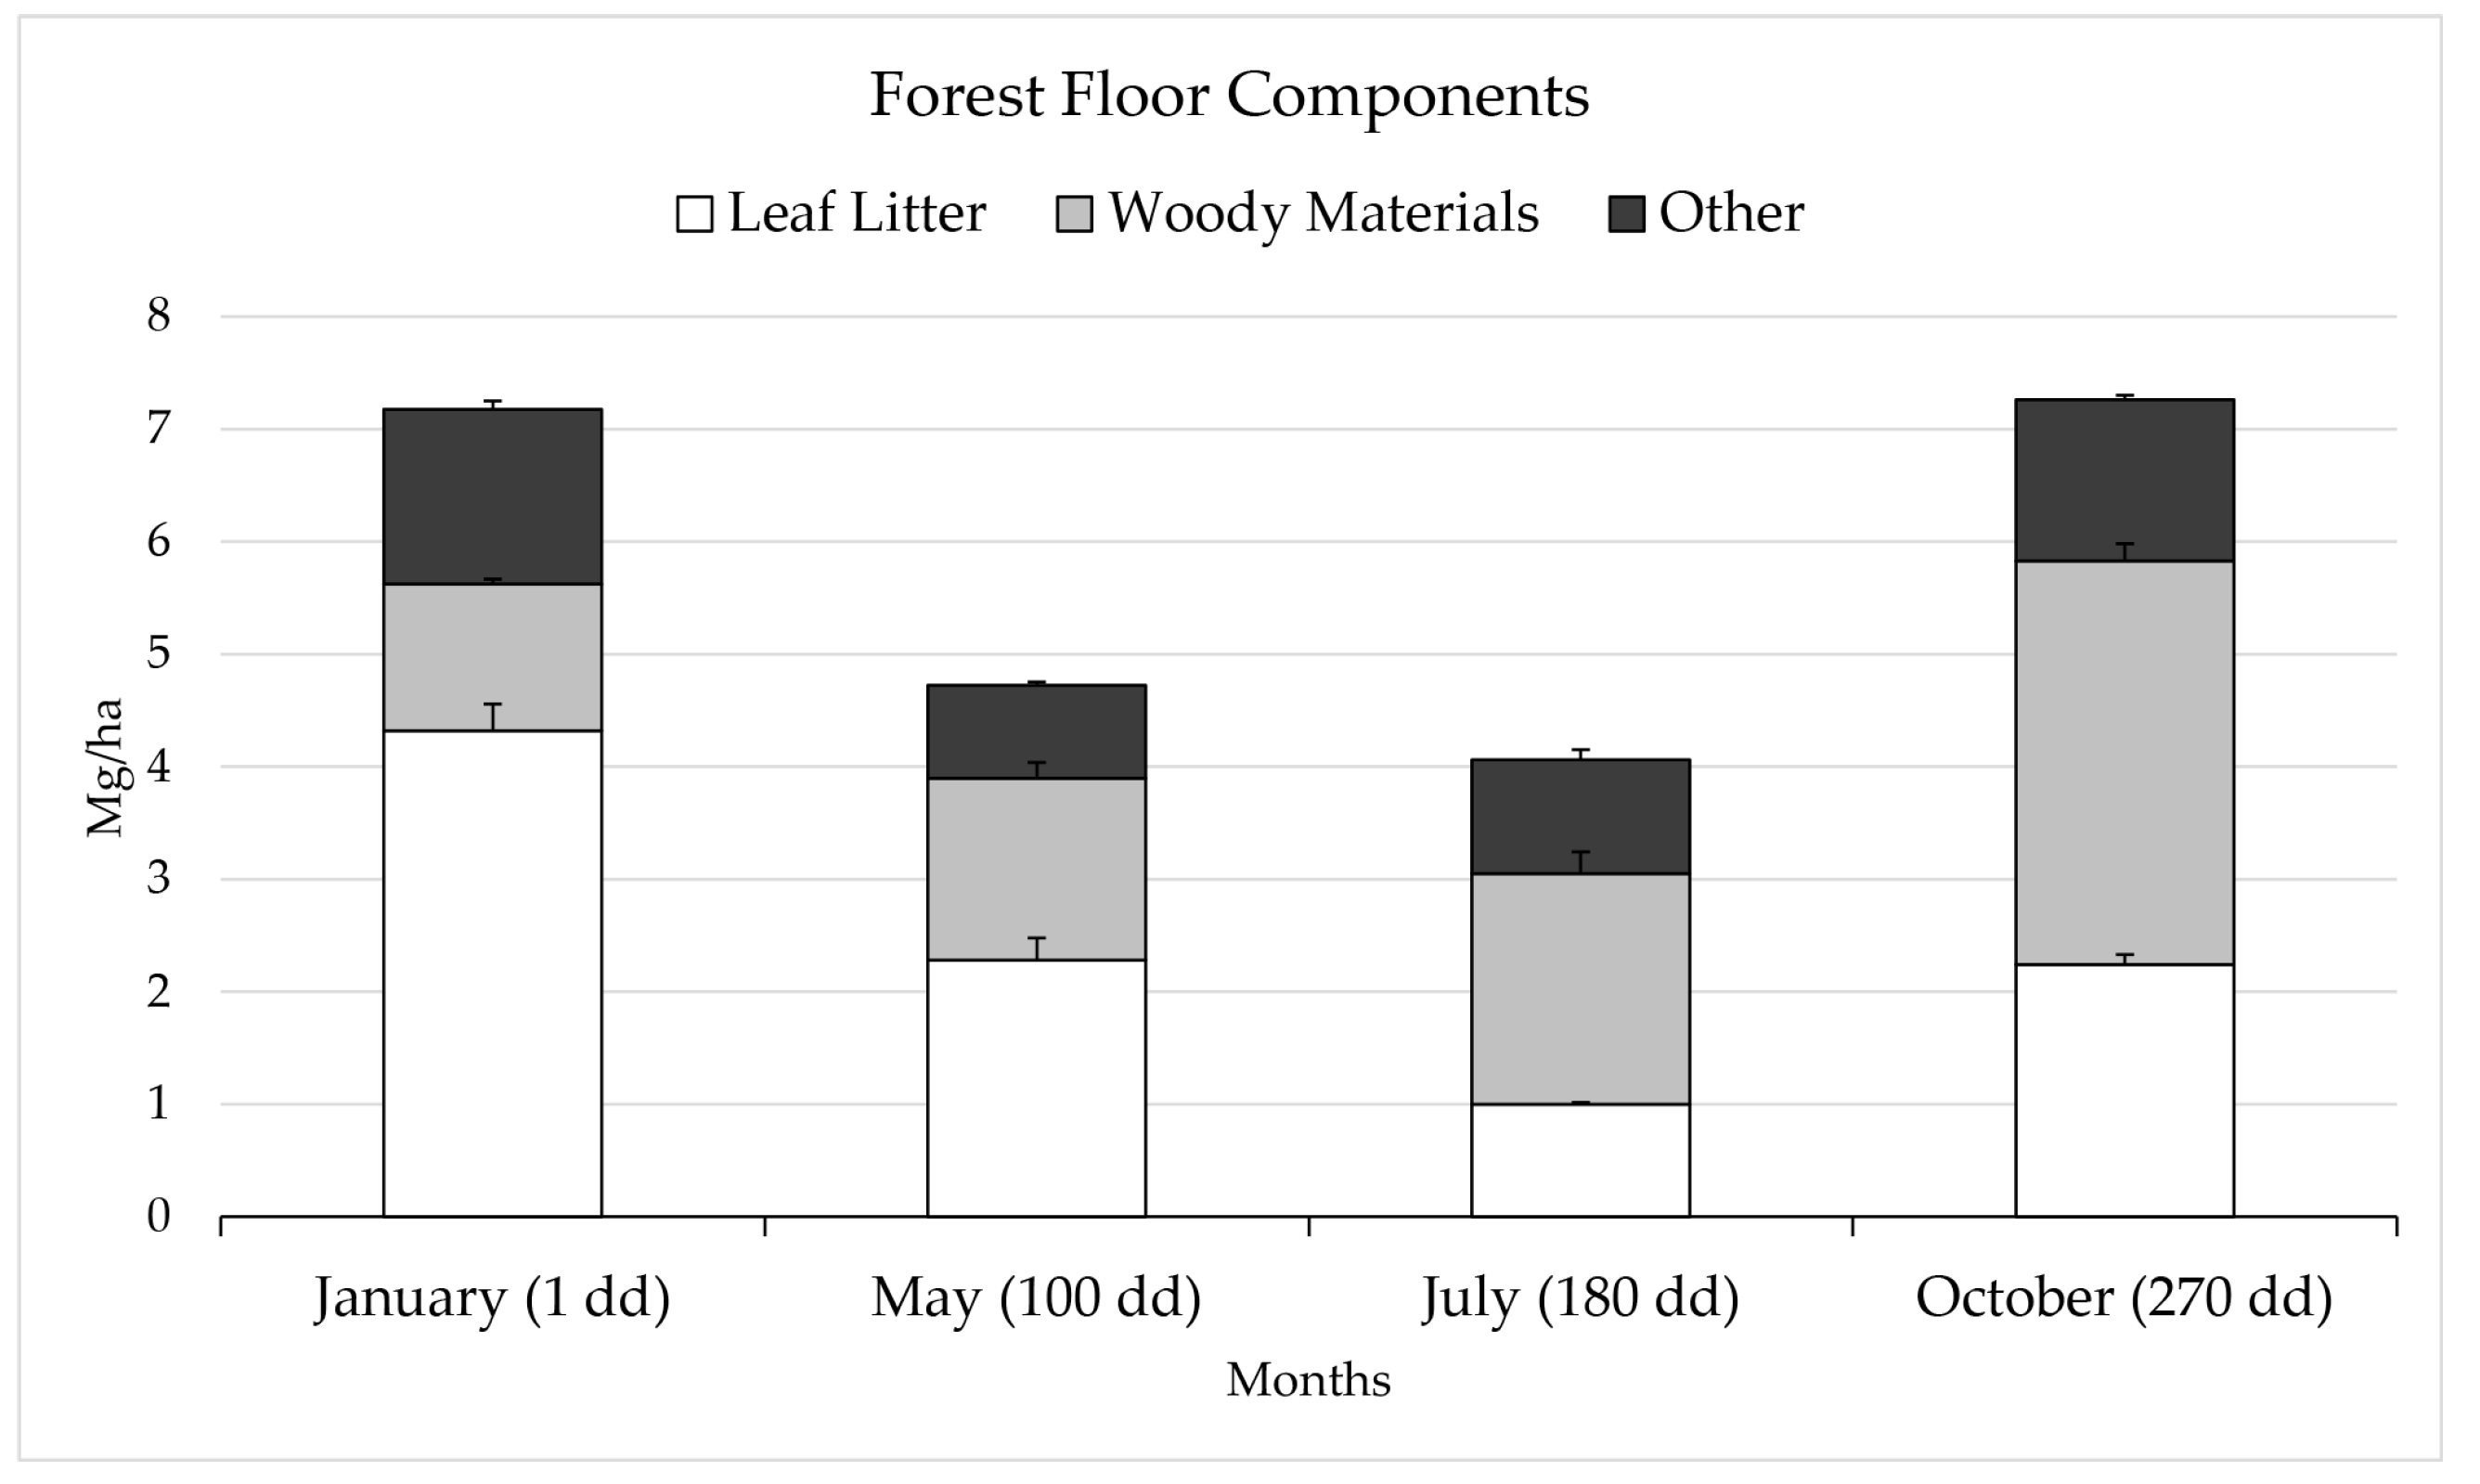
3.1. Litter Fall, Decomposition Dynamics and Forest Floor

Litter fall was 3.92 ± 0.64 Mg/ha, which could be divided into 2.62 ± 0.26 Mg/ha for Italian alder leaf litter, 1.15 ± 0.32 Mg/ha for woody materials (twigs, branches, alder fruit and other woody materials), and 0.15 ± 0.06 Mg/ha for walnut and chestnut leaf litter. Accordingly, Italian alder leaf litter represents 67% of total annual litter input, whose chemical composition can be seen in Table 1.
Over the overall decomposition time of 270 days, residual mass was 60.0 ± 1.4%, resulting in a decomposition constant (k) of 0.002 days−1 and the time estimated to reach 50% of the initial mass was approximately 347 days. The corresponding water and ethanol extractables, total phenols, nitrogen, cellulose, and lignin residual masses can be seen in Table 2, along with the changes in C:N and Lignin:N ratios.
The depletion of water extractable substances was similar to the total mass loss, stabilizing at 50.8 ± 4.1% of the initial amount after 270 days of decomposition. The loss of ethanol extractables, instead, was slightly slower, with a value of 56.9 ± 4.1% of the initial amount. Total phenols were already almost completely lost from the litterbags after 100 days of decomposition, nearly disappearing after 270 days. Residual nitrogen in the litterbags depleted 1.5 times faster than overall residual mass, whereas residual cellulose and lignin diminished both approximately three times faster than the total mass. Noticeably, at 100 and 180 decomposition days, residual lignin was lower than cellulose, whereas at 270 days of decomposition, residual lignin was higher than cellulose. The C:N ratio was stable during the whole decomposition time, while the Lignin:N ratio stayed even up to 100 days of decomposition, with a negative exponential decrease in the following days.
The quantitative and qualitative dynamics of the forest floor components can be seen in Figure 1.
On the day when the litterbags were set in the field (January 2015) the overall forest floor was 7.18 ± 0.90 Mg/ha, composed mainly of leaf litter (60% of the total) and an equal contribution of woody material and other materials (i.e., mostly fern and other understory residues). In the following months, namely May and July, corresponding to 100 and 180 decomposition days, the forest floor decreased down to 4.06 ± 0.57 Mg/ha, with a sharp decrease of leaf litter and an increase of woody material contribution. In October 2015, corresponding to 270 days of decomposition in the litterbag experiment, the forest floor was 7.26 ± 0.98 Mg/ha, with a prevalence of woody materials over leaf litter (50 vs. 30%, respectively). During the whole study period, other materials accounted for roughly 20% of the forest floor.

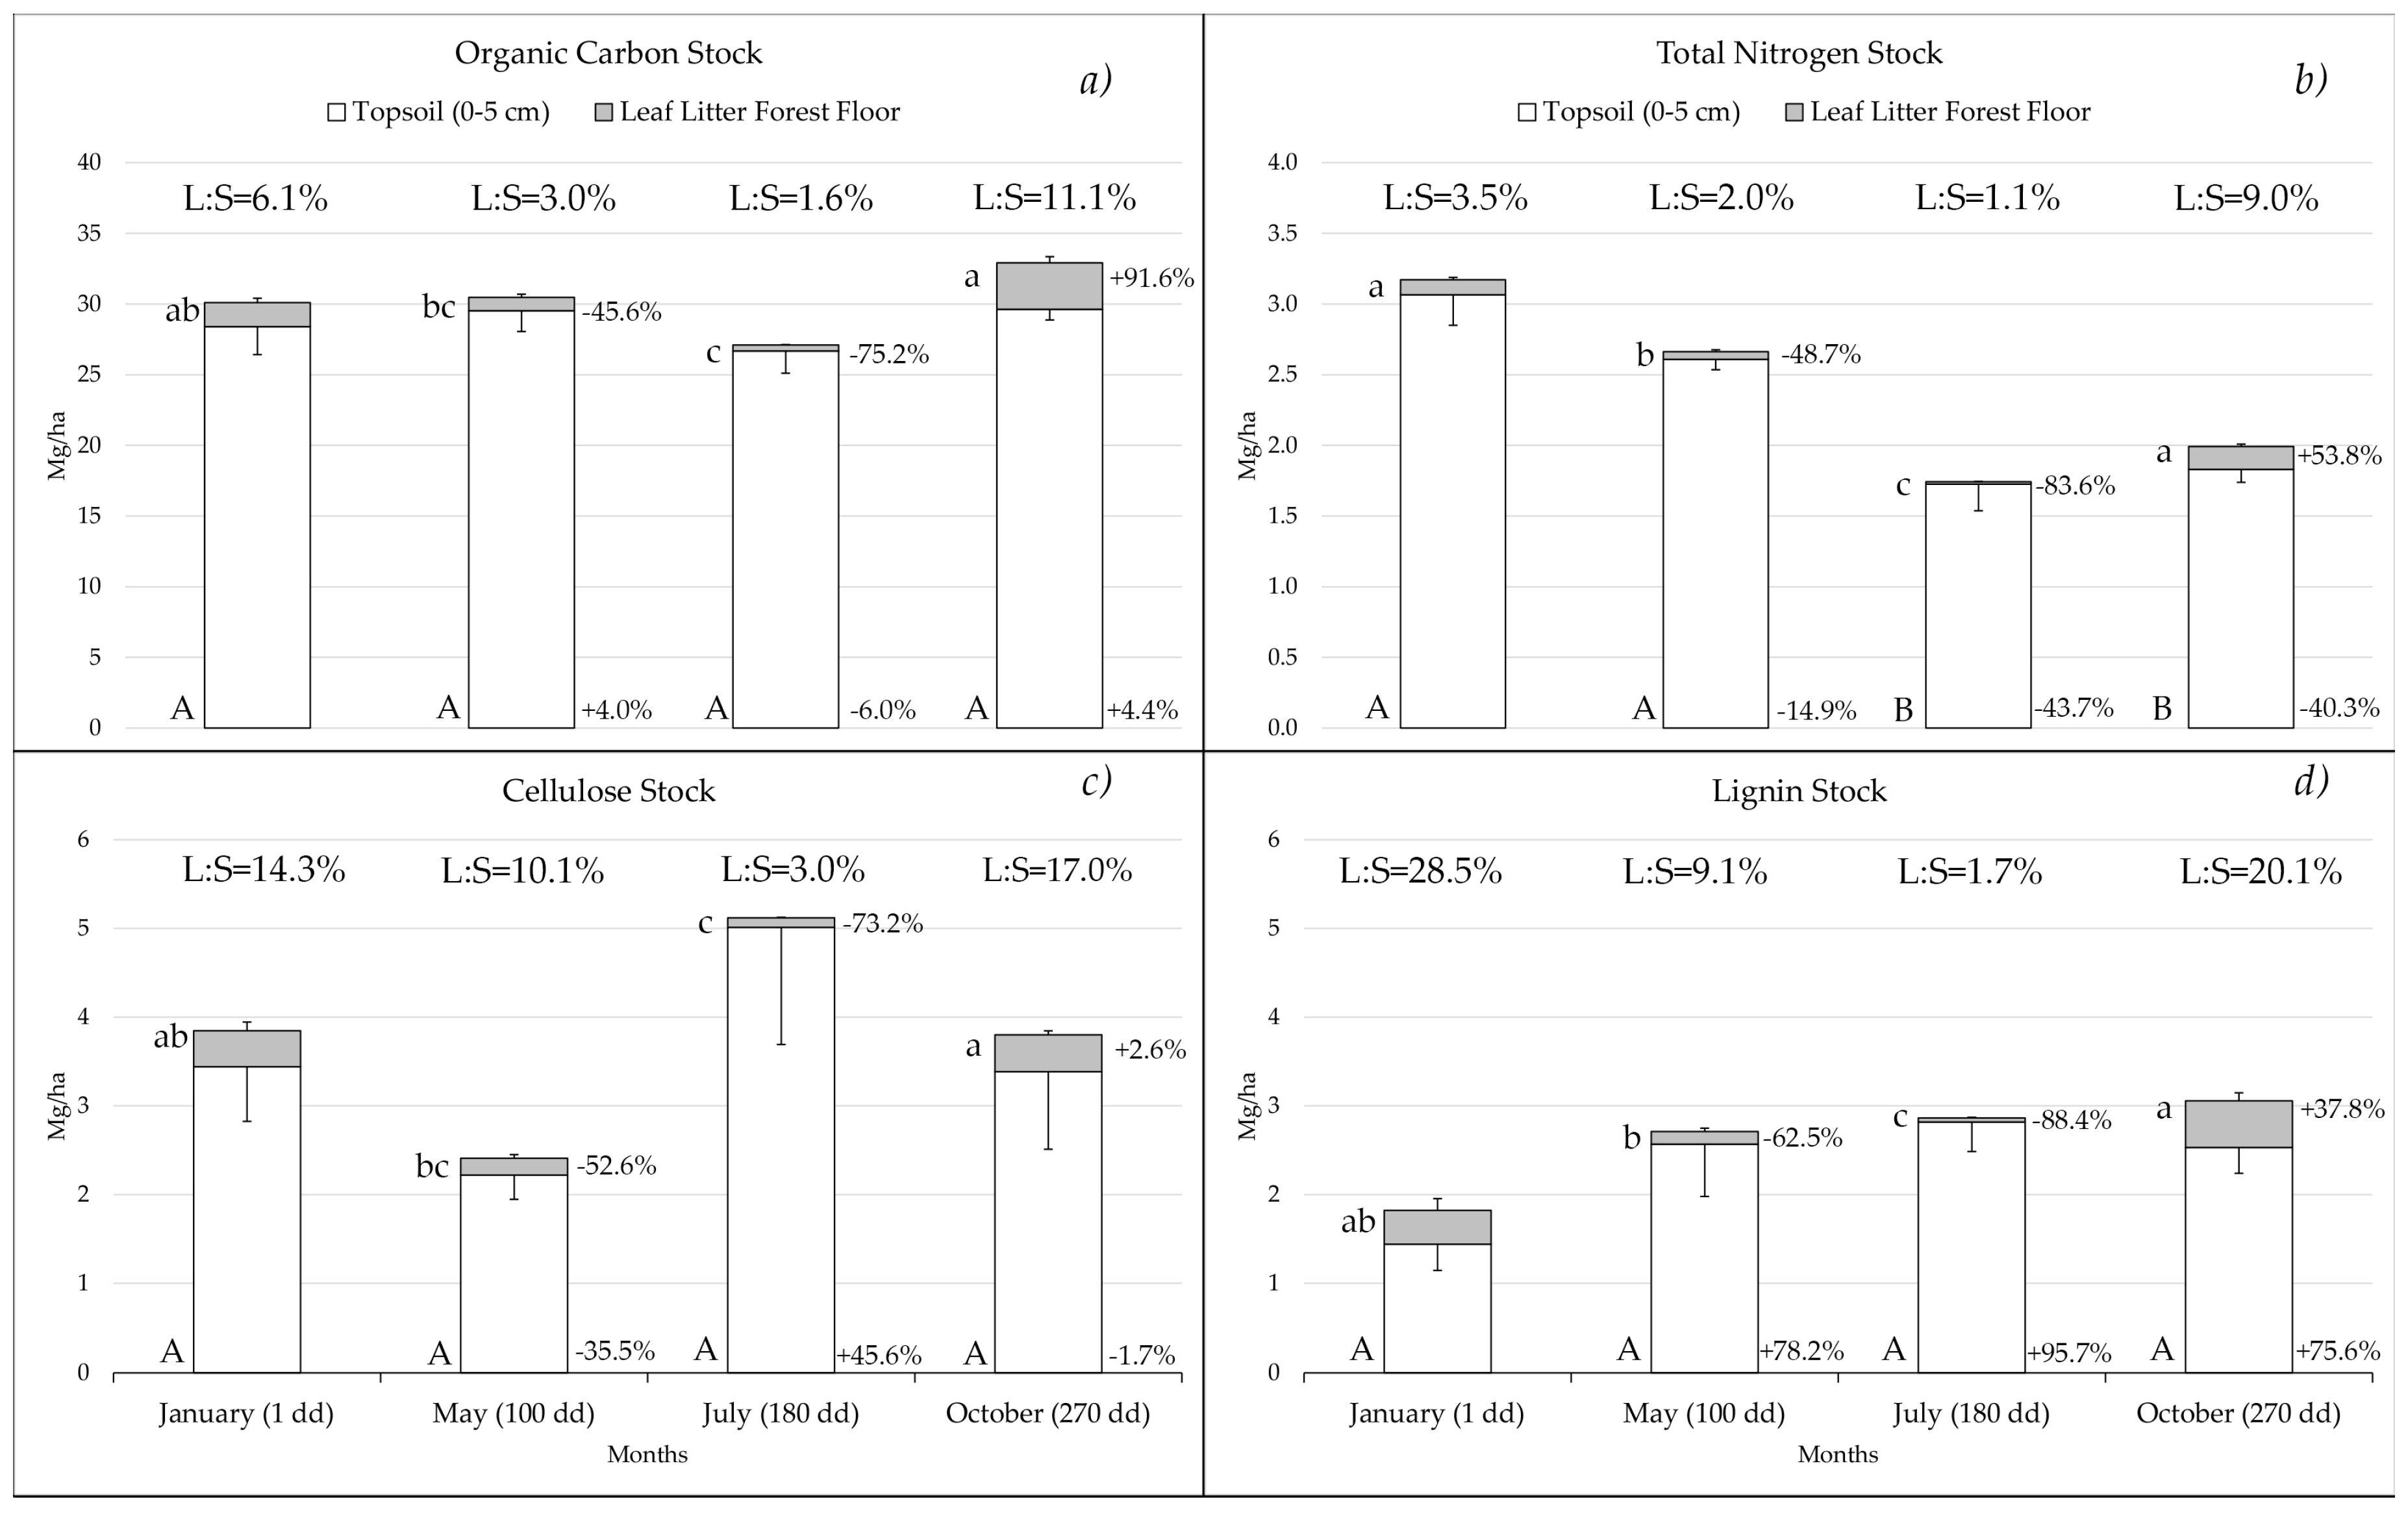
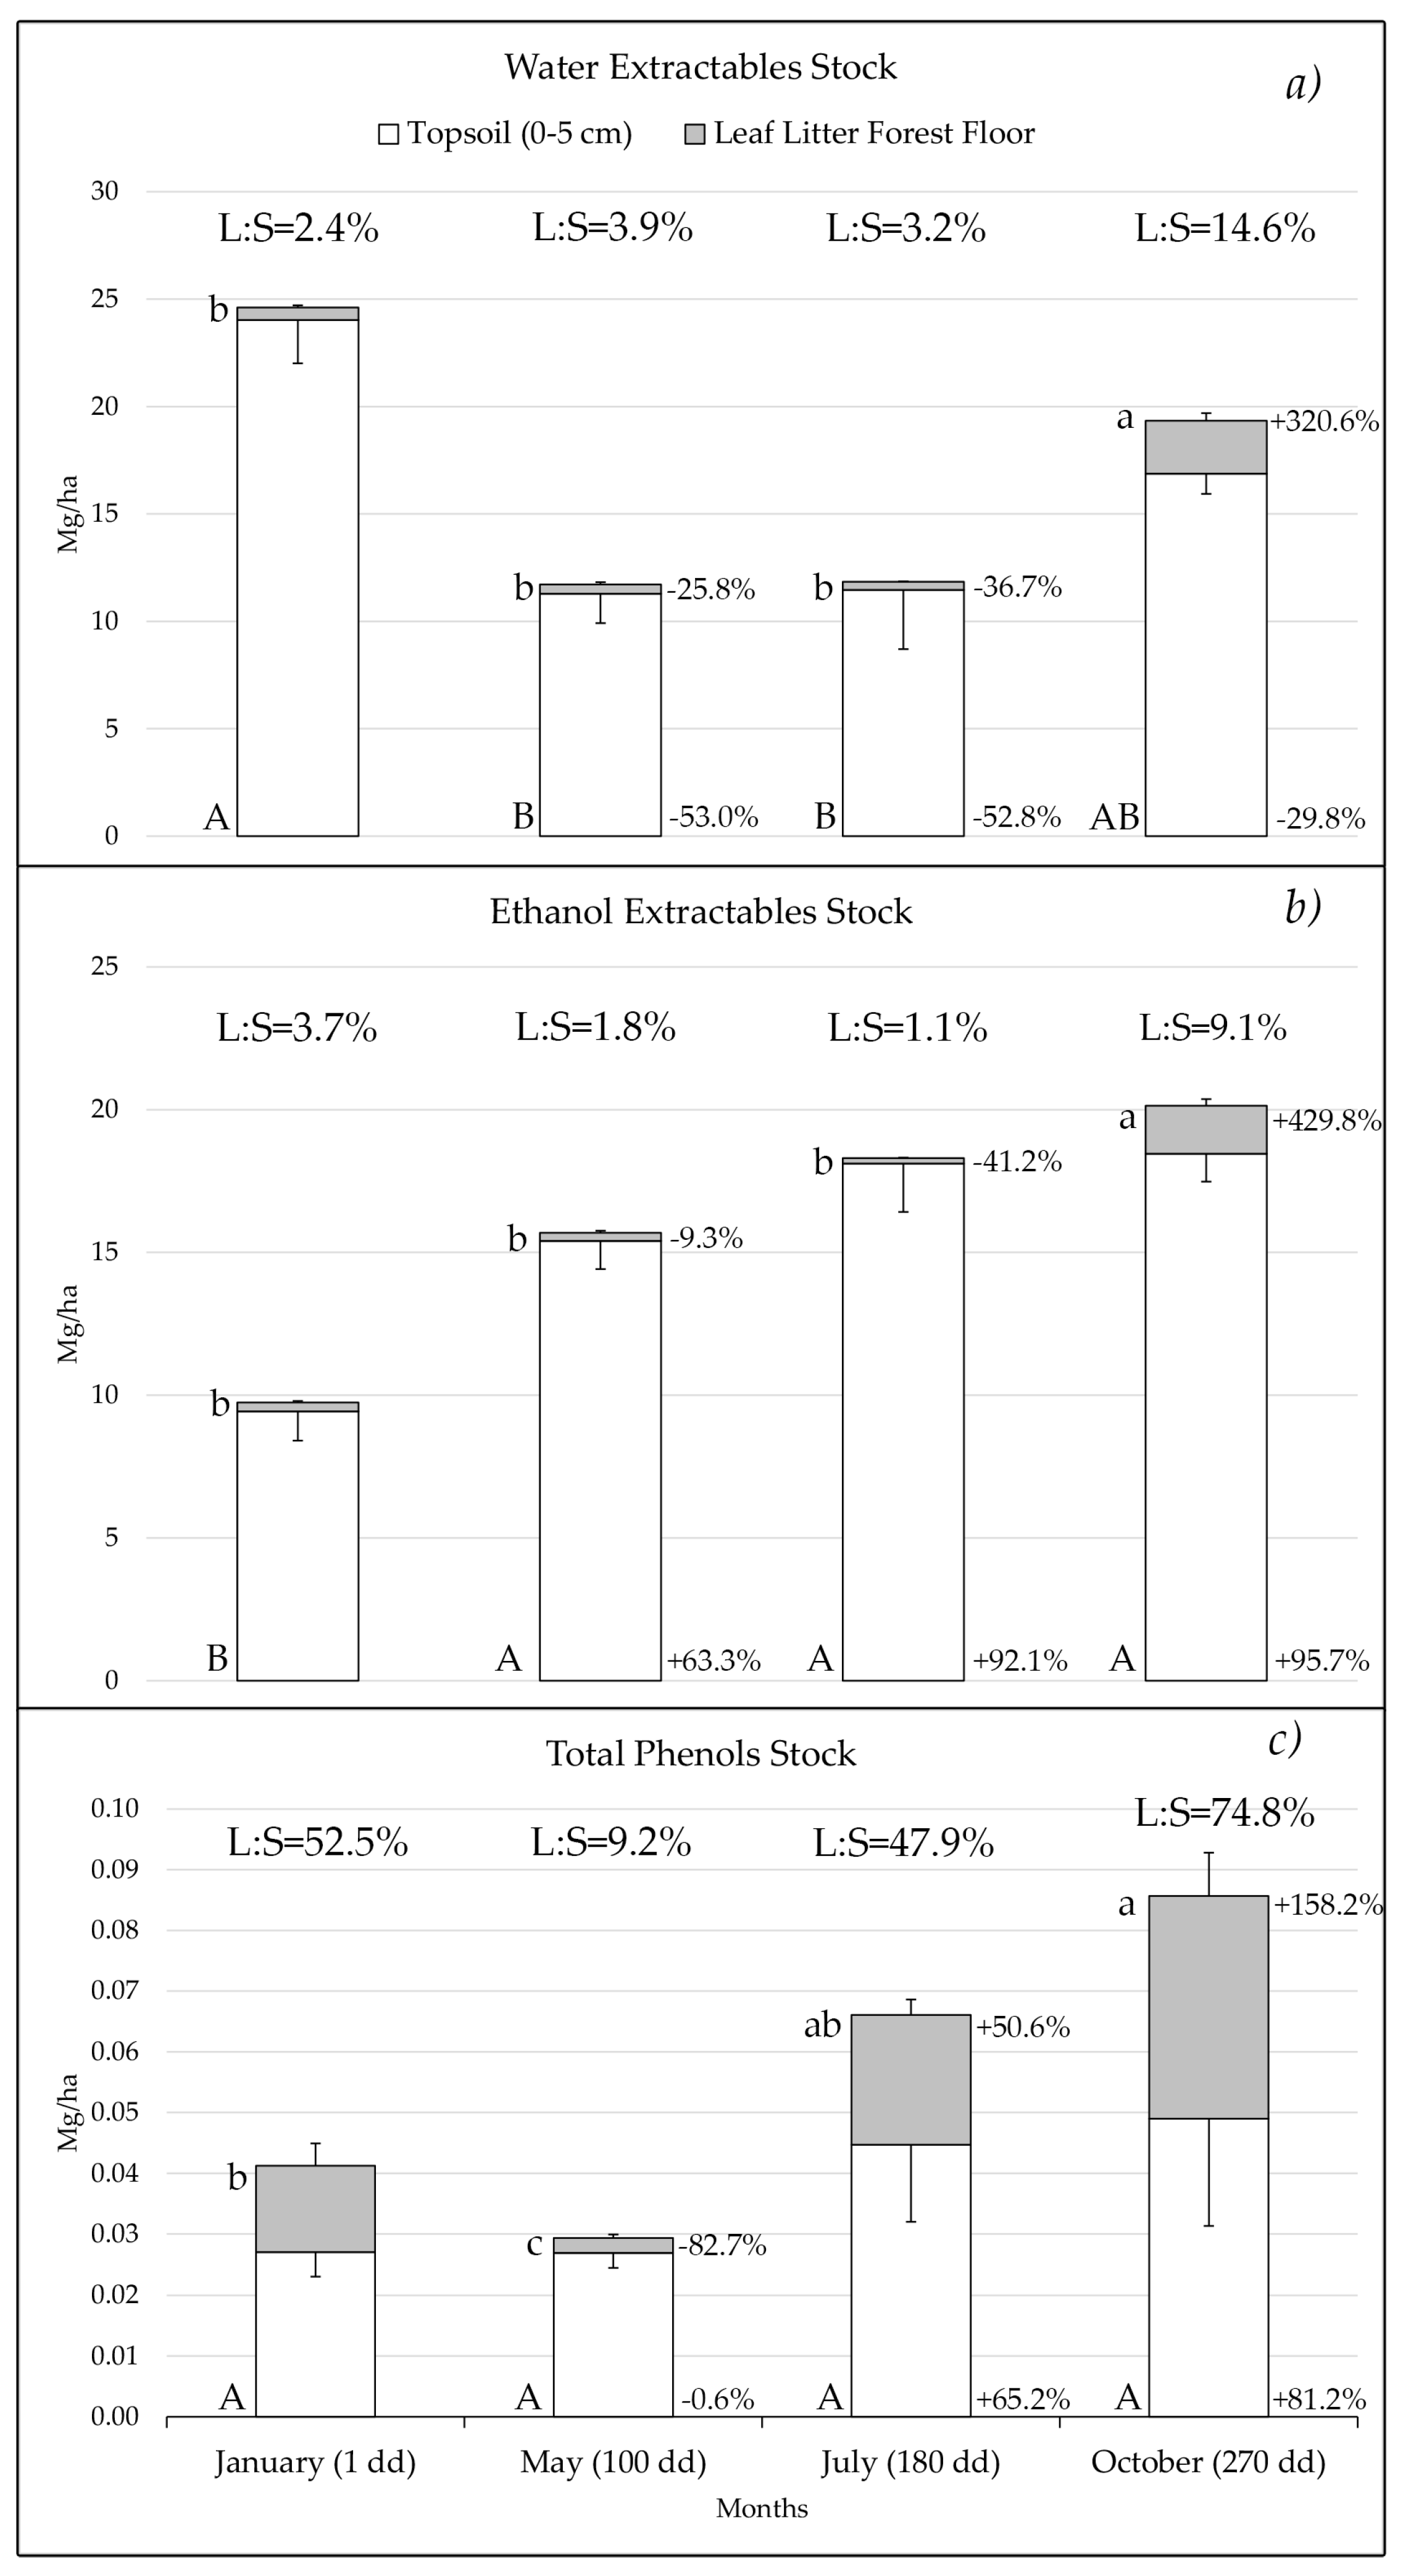
3.2. Dynamics of the Stocks in the Forest Floor Leaf Litter and Topsoil

Carbon stock in the forest floor leaf litter underwent significant changes throughout the year (Figure 2a), decreasing in amount from 1.7 ± 0.3 Mg/ha in January to 0.4 ± 0.1 Mg/ha in July. Subsequently, a net +91.6% of C stock in the leaf litter could be detected in October compared to January. In the topsoil, in contrast, despite some minor fluctuations, the organic C stock did not show significant changes and was on average 28.6 ± 1.5 Mg/ha (Figure 2a). Significant changes in the forest floor compartment and the stability of soil could also be detected in the forest floor leaf litter to topsoil ratio (L:S).
As for the nitrogen stock, the trend in the forest floor leaf litter was similar to C, although with sharper differences (Figure 2b). Nitrogen stock decreased five times from January to July, followed by an 8× increase in October, when the stock was similar to January. The topsoil nitrogen stock decreased from January to May, although not significantly, but lost 43.7% of its amount between January and July (Figure 2b). Despite the increase in nitrogen stock in the topsoil in October, the overall stock was not comparable to that in January (1.8 3 ± 0.1 vs. 3.0 7 ± 0.2 Mg/ha, respectively). The L:S ratio was, on the whole, more stable for nitrogen than for C stock, despite the relative higher increase of nitrogen stock in the leaf litter.
Cellulose stock in the forest floor leaf litter had the highest increase from July to October, when the stock increased from 0.11 ± 0.01 Mg/ha to 0.42 ± 0.05 Mg/ha, a value similar to the one in January. (Figure 2c). In a similar way to newly-shed litter, cellulose generally represented 10% of the whole C stock. As for the topsoil (Figure 2c), there were no significant changes throughout the year, although an increase could be detected in some field replicates during July. Generally, the cellulose stock in the topsoil was 3.5 ± 0.7 Mg/ha, approximately 12 times less than the whole C stock. The L:S ratio was also similar to the C stock, although the figures were higher.
With respect to the lignin stock, in the forest floor leaf litter it had the sharpest annual trend, with a remarkable loss from January to July of up to nine times, a loss which was completely recovered in October, where the lignin stock was higher than in January (Figure 2d). Generally, lignin was 17% of the whole C stock in the forest floor leaf litter. In contrast to the forest floor, the topsoil lignin stock increased, with a net +95.7% from January to July (Figure 2d). Conversely, topsoil lignin stock decreased in October, although lignin stock was still higher than January (+75.6%). Despite these fluctuations, differences in the topsoil were not significant. In the topsoil, lignin represented generally 8% of the whole C stock. The L:S ratio had the greatest differences compared to the other stocks, changing from 28.5% in January to 1.7% in July.
With regard to the stock of water extractables (Figure 3a) in the forest floor leaf litter, a peak was reached in October, when 2.5 ± 0.4 Mg/ha represented more than 75% of the whole C stock. Throughout the rest of the year, water extractables strongly decreased, remaining relatively low from January to July. Similarly, the stock of topsoil water extractables decreased from January to July with a slight rise in October. At the height of its stock (January), water extractables almost matched the overall C stock in the soil.
Similarly, the stock of ethanol extractables in the forest floor leaf litter had a peak in October, when its amount was +430% compared to January (Figure 3b). On the contrary, ethanol extractables in the topsoil had the lowest amount in January when compared to water extractables, and accounted for circa 60% of the whole C in October (Figure 3b). The L:S ratio had a similar trend for both water and ethanol extractables, with the highest amount in the leaf litter in October when compared to the topsoil.
Compared to the other stocks, total phenols were a lower fraction throughout the year, accounting for less than 0.10 Mg/ha when summing up leaf litter and topsoil (Figure 3c). Forest floor leaf litter showed a similar trend compared to other stocks, reaching a relative highest increase in October and a lowest point in May. Topsoil was, in contrast, stable throughout the year, despite an increase in October compared to January that was insignificant. Total phenols were the only stock that was higher in the leaf litter than in the topsoil, with a L:S ratio of 74.8% in October.
Almost all stocks were positively and significantly correlated in the forest floor leaf litter, with the exception of total phenols, which had a significant correlation only with water and ethanol extractable stocks (Table 3). In the topsoil, in contrast, many stocks were uncorrelated and most correlations were inverse (Table 3). It is worth mentioning the inverse correlation of nitrogen stock with both lignin and ethanol extractables, whereas a significant positive correlation is kept in the soil between total phenols and ethanol extractables.

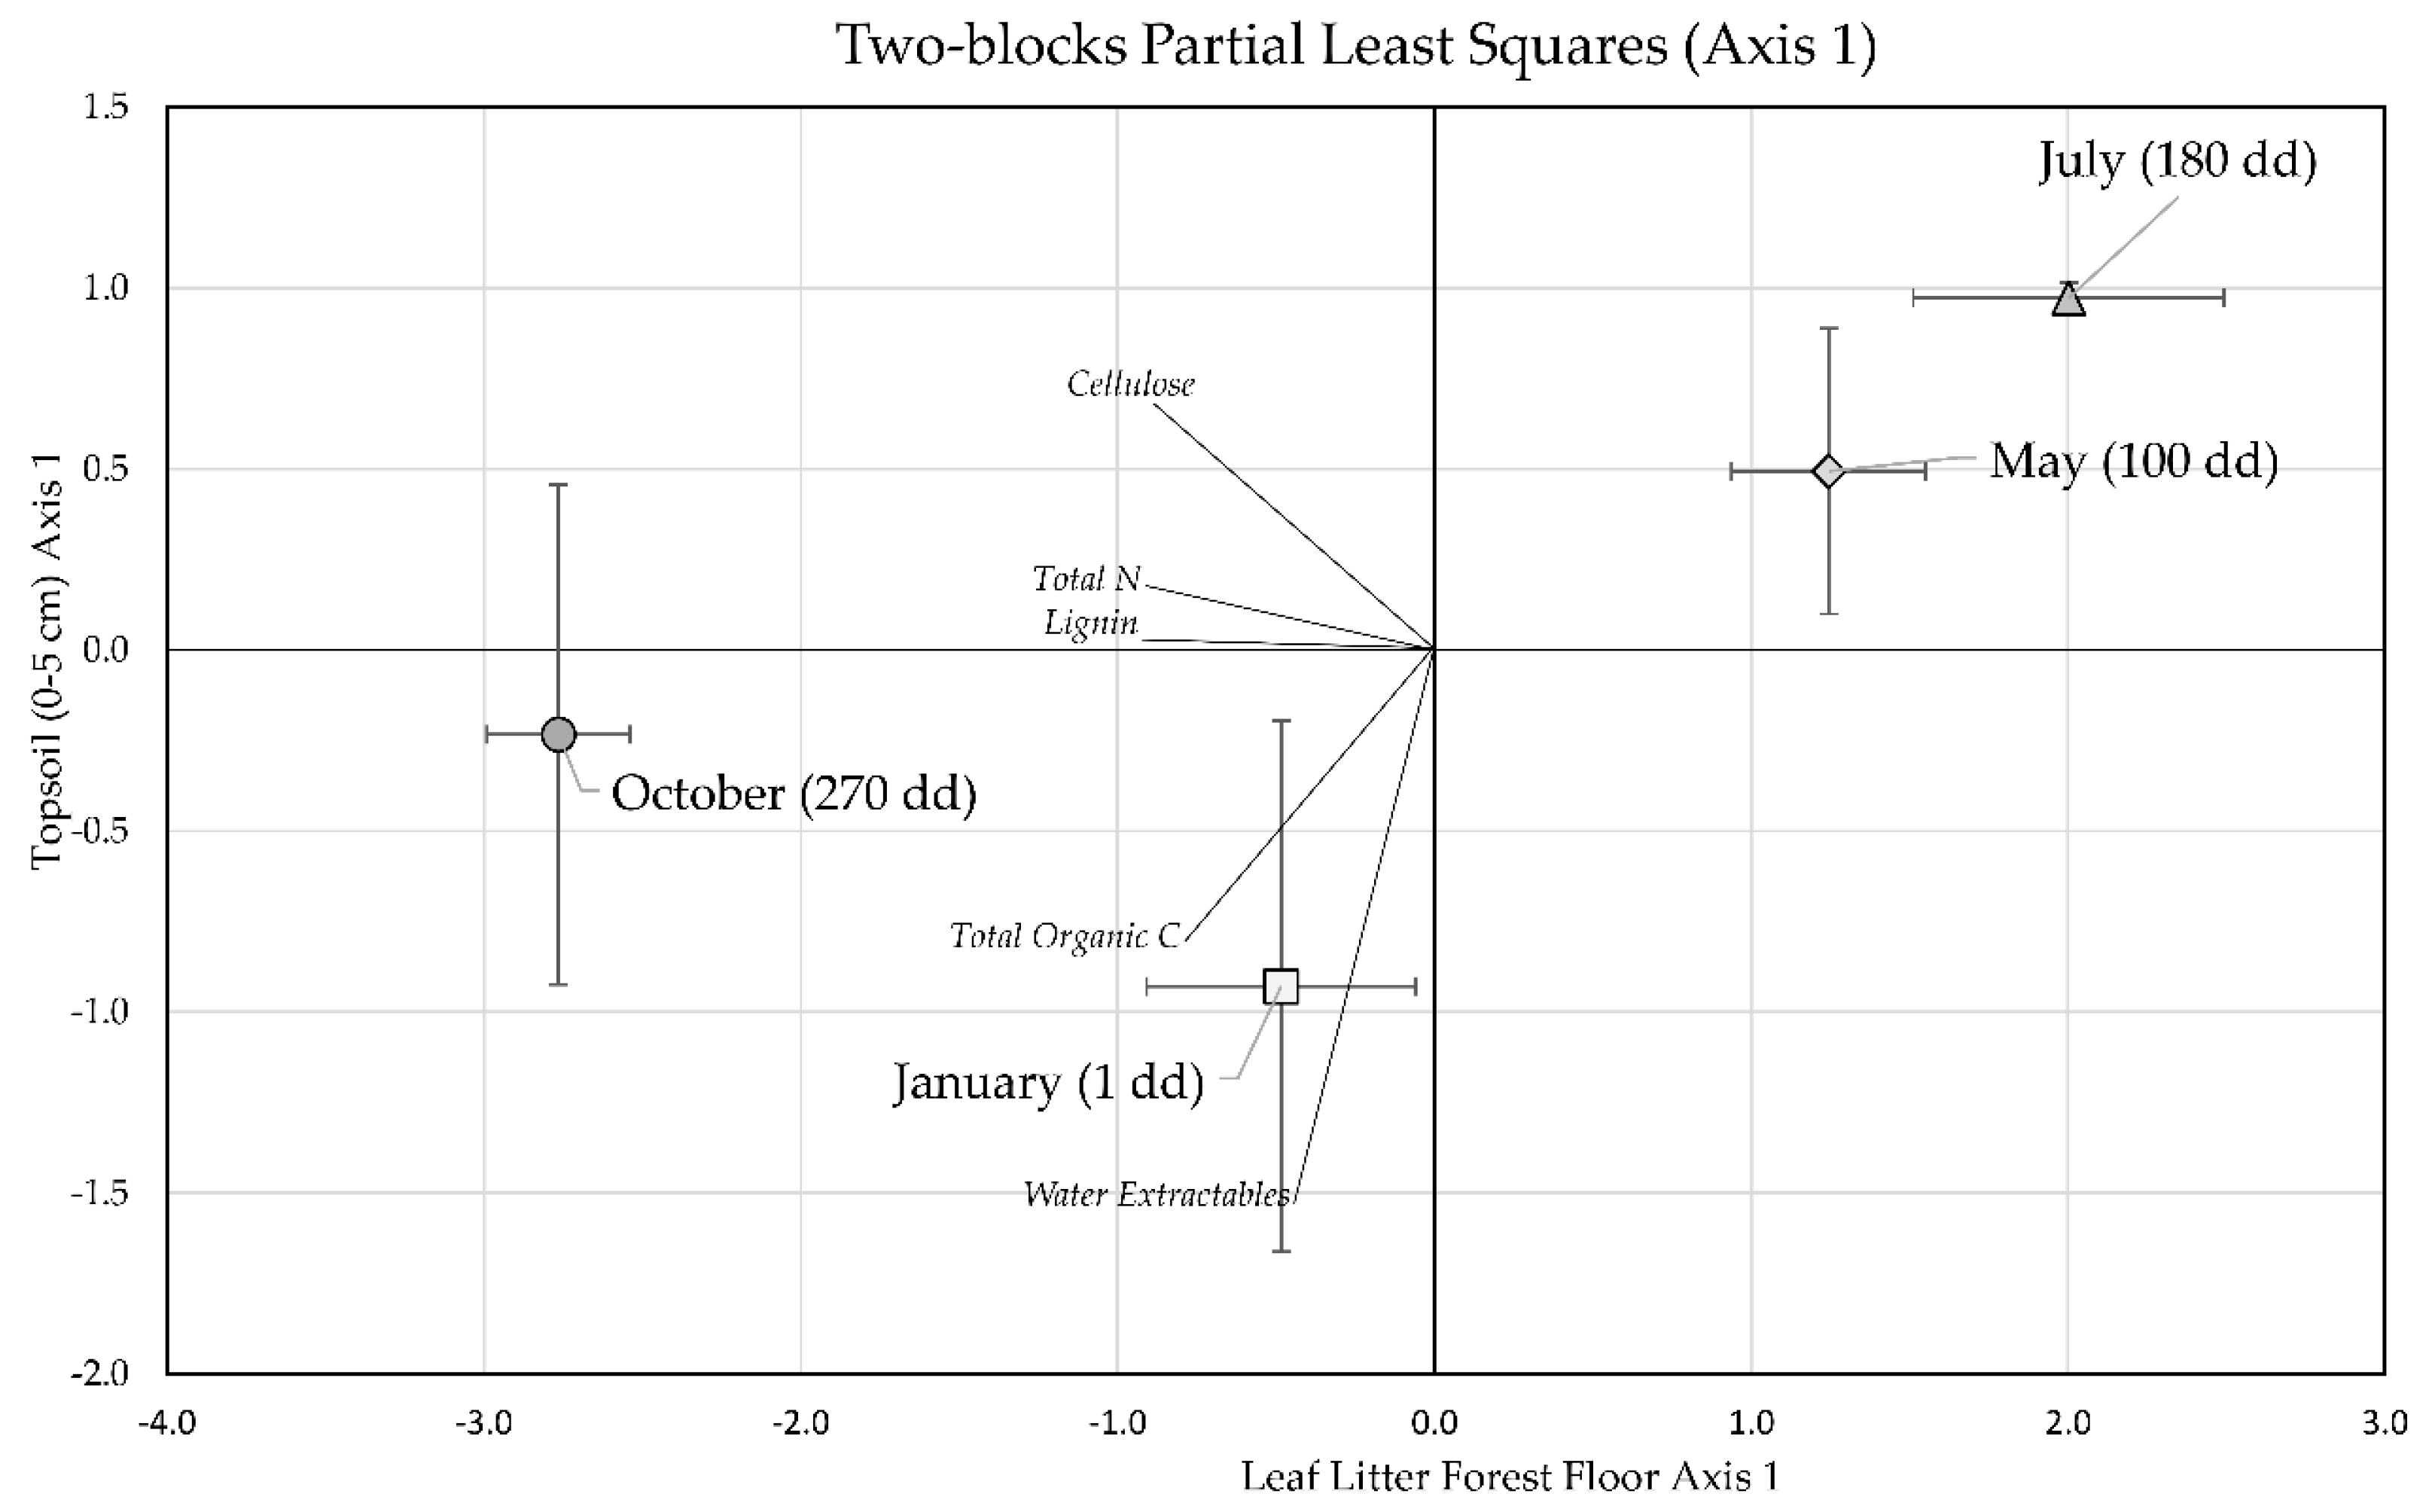
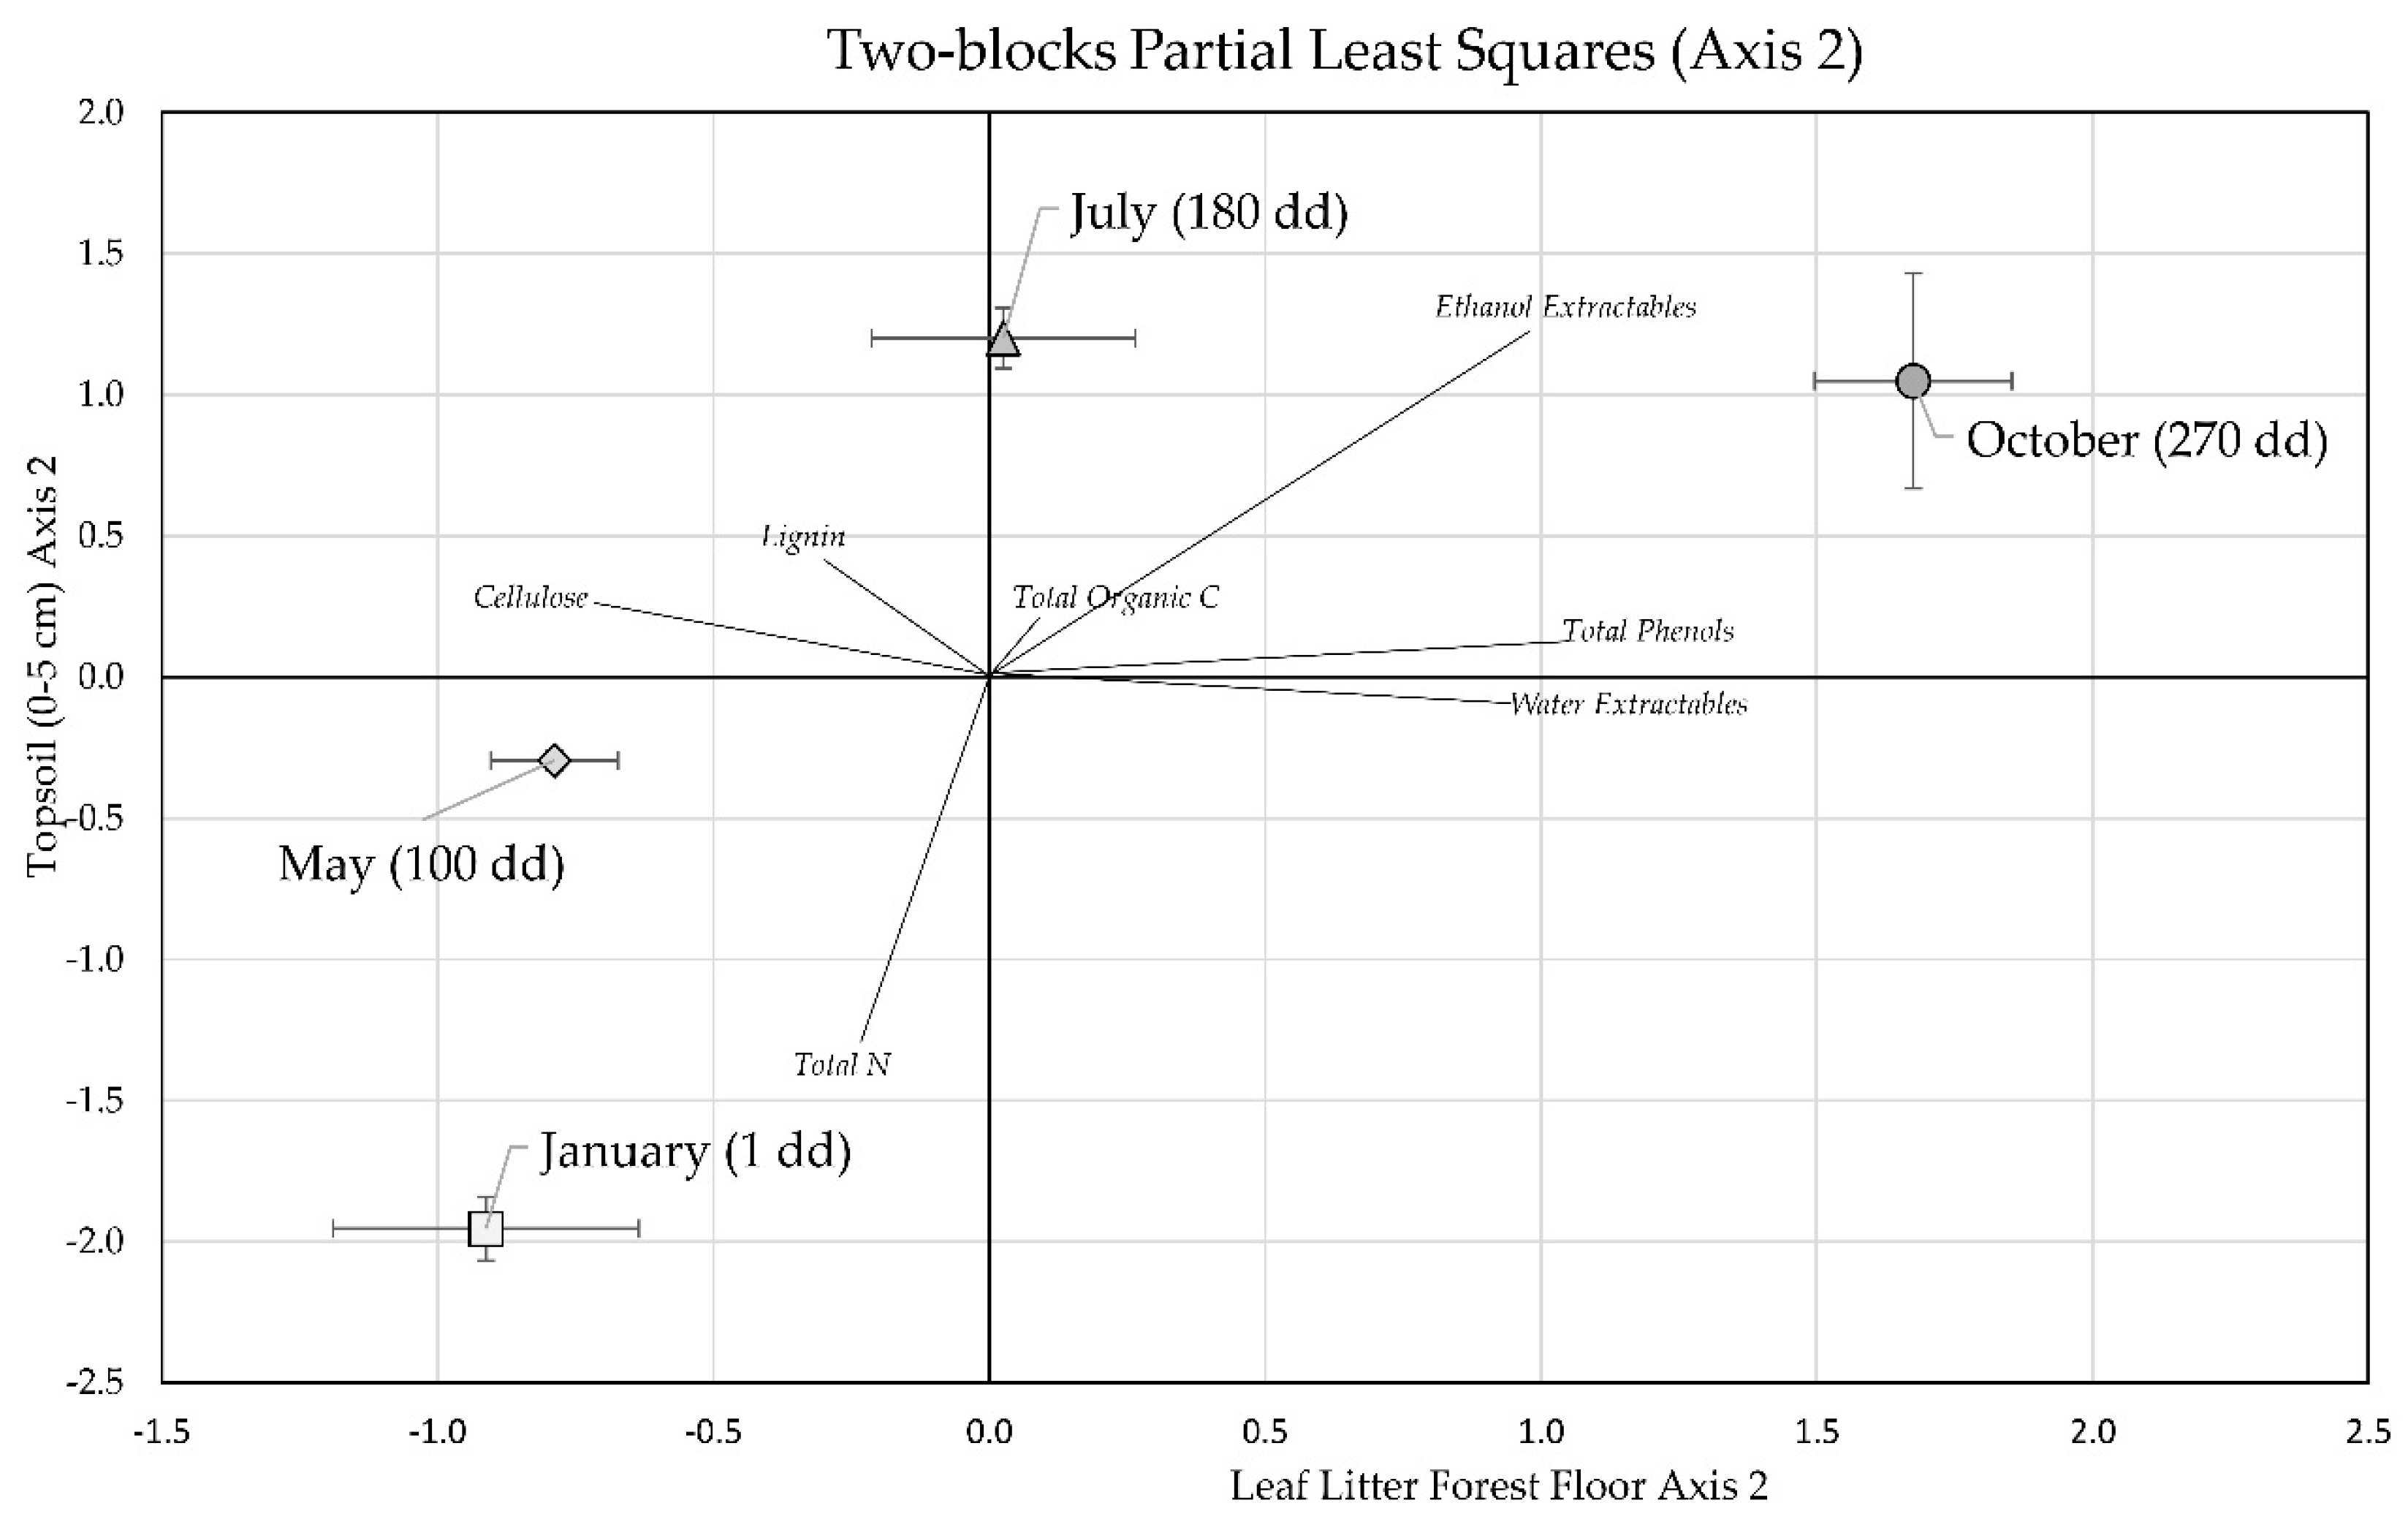
3.3. Two-Block Partial Least Squares Analysis of Forest Floor Leaf Litter and Topsoil Stocks

In order to summarize the information on the dynamics and mutual influence of stocks in both forest floor leaf litter and topsoil, we performed a two-block PLS using the data matrix of forest floor leaf litter as Block 1 and the data matrix of topsoil as Block 2. The squared covariance between the two matrices was 5.6%. In the first axis, there was 61.9% of total covariance, while the total on the second axis was 34.9%. A graphical output for the first and second axes can be seen in Figure 4 and Figure 5, along with Table 4, which displays the loadings of each block for the first and second axes.
In the first axis of the two-block PLS (Figure 4), which explained most of the covariance, the analysis put forward a greater variability in the forest floor leaf litter data (variation on the x of the graph) compared to the topsoil data (variation on the y of the graph). Data from May and July occupy the top-right quadrant of the graph, while data from January and October were in the opposite quadrant. The most informative variables for the forest floor leaf litter variability were the stocks of total N, lignin and cellulose, which had a strong positive correlation with water extractables stock in the topsoil and, with a lower correlation value, to total organic carbon. On the contrary, the topsoil cellulose stock was inversely correlated to the forest floor leaf litter stocks of total N, lignin and cellulose. Total nitrogen and lignin, which were important variables in the forest floor leaf litter, did not show relevant changes or correlation with the litter in the topsoil. Other stocks, namely total phenols and ethanol extractables, did not exert any relevant importance in either the forest floor leaf litter or the topsoil.
On the second axis of the two-block PLS, which explained the remainder of the covariance, considering the extent of the standard error bars, there was also a larger variability in the forest floor leaf litter data when compared to the topsoil. In contrast with the first axis, a chronological path from the bottom-left quadrant to the upper-right quadrant can be followed as the months proceeded. The most important variables responsible for the variation in the forest floor leaf litter were the stocks of total phenols, water extractables and ethanol extractables, which were inversely correlated with cellulose stocks. In the topsoil, in contrast, the leading variables were total N and ethanol extractable stocks, which were inversely correlated. Noticeably, total organic C stock expressed little importance in the second axis of the two-block PLS in both the forest floor leaf litter and the topsoil, as did Lignin stock.
The first axis of the two-block PLS allowed us to summarize that, in the 270 days of observation, in the forest floor leaf litter from January to July there was a reduction of total N, lignin and cellulose and, in the topsoil, a decrease of water extractables and total organic carbon, with a corresponding increase in cellulose. The aforementioned dynamics reversed from July to October, although the degree of variation was higher for forest floor leaf litter than for the topsoil. The second axis, in contrast, put forward information about total phenols and ethanol extractables, which were inversely correlated with cellulose and total N stock, highlighting a clear pattern of variation for these stocks between seasons.

4. Discussion

Italian alder litter input (3.92 ± 0.64 Mg/ha) was comparable to other alder species widespread in Europe such as black alder (Alnus glutinosa (L.) Gaerth.) [41], but generally inferior compared to non-European species such as Alnus nepalensis D.Don [42]. Compared to European beech (Fagus sylvatica L.), which is the most important forest species in Italy and the one with the highest C stocks in its soil [11], Italian alder litter input was intermediate between beech forests with a mean annual temperature of 6.0 °C (2.50 ± 0.18 Mg/ha) and 8.6 °C (4.31 ± 0.43 Mg/ha) [30].
In line with previous studies [43,44,45], Italian alder showed nutrient-rich, fast-decomposing leaf litter. Given their N2-fixing capabilities, alders may have a nitrogen concentration in their leaves exceeding 3%, but also other nutrients, such as potassium, are generally higher than in other forest species [43]. Compared to grey alder, Italian alder leaf litter had similar nitrogen, cellulose and water extractable concentrations, but lower lignin and higher ethanol extractable contents [46]. The chemical composition of the newly shed litter explained the fast decomposition rate, especially at the early stage [47]. Accordingly, although climatic variables should be taken into account, decomposition dynamics for Italian alder was similar to other alder species [26,44,48] and sensibly faster than other deciduous species such as Holm oak (Quercus ilex L.) or European beech, that reach 50% of initial mass in 2.3 [49] or 2.7–3.2 years [7], respectively, compared to approximately one year for Italian alder. Nevertheless, it should be pointed out that the later stages of decomposition for alder litter showed a limit value of 51% of residual mass after 500 days [46], which is a known phenomenon for nitrogen-rich litter [50]. On the one hand, our litterbag experiment lasted 270 days, thus we do not have direct evidence of the late-stage decomposition of Italian alder leaf litter. Then again, with the exception of residual total phenols, a noticeable slowdown of all residual masses was observed, which was more pronounced for ethanol and water extractables. These results are consistent with [46], although our evidence pointed to increased lignin decomposition. The stability of the C:N ratio showed that there was no evidence of a sharp increase in nitrogen concentration in our litterbag experiment. Conversely, there was a release comparable to the overall mass loss, whereas other studies with grey alder showed an increase in concentration up to 50 mg/g from 30 mg/g at approximately 50% residual mass, and only then nitrogen began to release from the litter [51].
Few other studies demonstrate such in-depth detail of the forest floor dynamics of an alder-dominated ecosystem [22]. Noticeably, the amount of litter input in January matched 50% of the total forest floor, whereas in an A. nepalensis ecosystem, this ratio was around 20% [42]. The sharp decrease of forest floor leaf litter from January to July matched the decomposition speed in the litterbags, whereas the increase in October is consistent with the new leaf litter input, which ends in December. Despite the forest floor in January and October being identical, there was a strong shift in composition, with woody materials predominant in October. Although most of the litter fall happens from late summer to the beginning of winter, in alder ecosystems there are minor litter inputs throughout the rest of the year [42], whereas woody litter is deposited sporadically through time and space, especially in managed ecosystems [43]. The strong increase in woody materials from July to October could be due to strong wind or heavy rain [43], which are common in autumn in southern Italy.
The trend of C stock in the forest floor leaf litter was coherent with the general mass decrease in the leaf litter stock. This trend was consistent for all forest floor variables. Generally, a seasonal trend can be observed in forest floor leaf litter, which is congruous with the minimum reached in July for all stocks and the reprise in October, with the beginning of the new litter fall. According to our results, only phenols appear to have a smaller impact in Italian alder ecosystems, and their role falls within the variability of ethanol extractables, as proved by the correlation coefficients for both forest floor leaf litter and topsoil (Table 3). Accordingly, soluble polyphenolic compounds are likely leached very quickly from the litter, as has been shown also for black alder, where they were leached out almost entirely from litter in less than 30 days of decomposition [52].
In the soil, the overall organic C stock was stable throughout the 270 days of observations, although with some minor fluctuations observed which could be consistent with soil C seasonal inputs that we did not measure [53]. Although we did not collect data from the deeper layers of the soil, the topsoil (0–5 cm) had a high organic C stock, comparable to the same layer in several European beech ecosystems (e.g., 20–50 Mg/ha) [11,30]. For comparison with other alder ecosystems, a previous study [54] found approximately 38 Mg/ha in the first 10 cm of the organo-mineral A soil layer under black alder, while between 30 and 40 Mg/ha were observed in the first 10 cm of the topsoil under 15–25 years old grey alder stands [10]. The topsoil also had a high total nitrogen stock, which underwent a strong reduction in July that could be compatible with bracken growth during summer. Arguably, bracken and its litter may play a significant role in litter decomposition and microbial diversity [55,56] that we were unable to discriminate completely in our study.
Our two-block PLS allowed us to discern both patterns of variation within the forest floor leaf litter and topsoil as well as patterns of covariation between the two layers. Among the variables explaining most of the variance on the first axis, water extractables exerted a relevant role. Dissolved organic matter is a mixture of soluble substances from plants and microbes, and it is generated mostly by leaching from decomposing litter [57]. Although soluble C and nitrogen are a relatively small fraction of the soil’s total organic C and nitrogen [58], they play an important role in linking the forest floor with the deeper layers of the soil. Admittedly, recent studies have also confirmed the importance of water extractables in forest ecosystems [30,57,59,60]. Several studies have shown that, during early-stage decomposition, a surprisingly high amount of litter C is present in dissolved organic matter and is sequestered next to silt and clay in mineral soils [61]. The strong importance and quantity of water extractable stocks in our soil might concur to emphasize this component in the formation of SOM [62], particularly in high-quality litter such as alder. An important contribution to the dissolved organic matter leaching from the litter to the mineral soil is provided by oxidised lignin fragments [63,64]. The nature and role of lignin, especially in mineral soil, is still poorly understood [65,66]. Lignin was a large contributing variable in forest floor leaf litter within our two-block PLS. Even though the biological degradation of lignin-derived phenols is minimal [67], these molecules have a strong tendency to become linked to soil minerals, especially iron and aluminium hydroxides [68,69,70]. In contrast to lignin, which was an important variable only in forest floor leaf litter in the two-block PLS, cellulose was inversely correlated between leaf litter and topsoil. Thus, a pattern of a decrease in litter and an increase in soil could be seen. Arguably, cellulose and lignin fragments, although different roles are given to their chemical composition and degradability [49], might contribute to the formation of stabile SOM as they favour aggregation and chemical adhesion to the mineral matrix [71,72].

5. Conclusions

In conclusion, this study of an Italian alder ecosystem showed (a) fast-decomposing, N-rich litter; (b) large organic C and total N stocks in both forest floor leaf litter and topsoil; (c) a pattern of covariation (highlighted by the first axis of the two-block PLS) involving total N, cellulose and lignin for the forest floor leaf litter and water extractables for the topsoil; and, in contrast; (d) a relevant role of total phenols, ethanol and water extractables in the forest floor leaf litter and total N and ethanol extractables in the topsoil (shown in the second axis of the two-block PLS). The fast turnover of dissolved organic matter fractions (water and ethanol extractables), linked with cellulose and lignin dynamics, might suggest that within Italian alder ecosystems there is a reasonably fast formation of stable C compounds in the soil. Thus, Italian alder is an ideal species for afforestation and reforestation which could be particularly interesting for land-use policies.

Acknowledgments

The authors are grateful to Maria Grazia Del Canto and Olimpia Pezone for their extraordinary help and support on both field samplings and laboratory analyses.

Author Contributions

M.I, T.D. and A.F. conceived and designed the experiments; M.I, T.D., E.C. and F.d.A. performed the experiments; M.I. and T.D. analyzed the data; A.F. contributed reagents/materials/analysis tools; M.I, T.D. and A.F. wrote the paper.

Conflicts of Interest

The authors declare no conflict of interest.

References

  1. Bonan, G.B. Forests and climate change: Forcings, feedbacks, and the climate benefits of forests. Science 2008, 320, 1444–1449. [Google Scholar] [CrossRef] [PubMed]
  2. Dixon, R.K.; Brown, S.; Houghton, R.A.; Solomon, A.M.; Trexler, M.C.; Wisniewski, J. Carbon pools and flux of global forest ecosystems. Science 1994, 263, 185–190. [Google Scholar] [CrossRef] [PubMed]
  3. Lal, R. Forest soils and carbon sequestration. For. Ecol. Manag. 2005, 220, 242–258. [Google Scholar] [CrossRef]
  4. Pan, Y.; Birdsey, R.A.; Fang, J.; Houghton, R.A.; Kauppi, P.E.; Kurz, W.A.; Phillips, O.L.; Shvidenko, A.; Lewis, S.L.; Canadell, J.G.; et al. A Large and Persistent Carbon Sink in the World’s Forests. Science 2011, 333, 988–993. [Google Scholar] [CrossRef] [PubMed]
  5. Pregitzer, K.S.; Euskirchen, E.S. Carbon cycling and storage in world forests: Biome patterns related to forest age. Glob. Chang. Biol. 2004, 10, 2052–2077. [Google Scholar] [CrossRef]
  6. Triadiati, S.; Tjitrosemito, B.; Guhardja, E.; Sudarsono, I.; Qayim, I.; Leuschner, C. Litterfall production and leaf-litter decomposition at natural forest and cacao agroforestry in Central Sulawesi, Indonesia. Asian J. Biol. Sci. 2011, 4, 221–234. [Google Scholar]
  7. Innangi, M.; Schenk, M.K.; D’Alessandro, F.; Pinto, S.; Menta, C.; Papa, S.; Fioretto, A. Field and microcosms decomposition dynamics of European beech leaf litter: Influence of climate, plant material and soil with focus on N and Mn. Appl. Soil Ecol. 2015, 93, 88–97. [Google Scholar] [CrossRef]
  8. Bradford, M.A.; Berg, B.; Maynard, D.S.; Wieder, W.R.; Wood, S.A. Understanding the dominant controls on litter decomposition. J. Ecol. 2016, 104, 229–238. [Google Scholar] [CrossRef]
  9. Muñoz-rojas, M.; Doro, L.; Ledda, L.; Francaviglia, R. Application of CarboSOIL model to predict the effects of climate change on soil organic carbon stocks in agro-silvo-pastoral Mediterranean management systems. Agric. Ecosyst. Environ. 2014, 16, 9–10. [Google Scholar] [CrossRef]
  10. Uri, V.; Aosaar, J.; Varik, M.; Becker, H.; Ligi, K.; Padari, A.; Kanal, A.; Lõhmus, K. The dynamics of biomass production, carbon and nitrogen accumulation in grey alder (Alnus incana (L.) Moench) chronosequence stands in Estonia. For. Ecol. Manag. 2014, 327, 106–117. [Google Scholar] [CrossRef]
  11. Innangi, M.; D’Alessandro, F.; Fioretto, A.; Di Febbraro, M. Modeling distribution of Mediterranean beech forests and soil carbon stock under climate change scenarios. Clim. Res. 2015, 66, 25–36. [Google Scholar] [CrossRef]
  12. Lucas-Borja, M.E.; Candel, D.; Jindo, K.; Moreno, J.L.; Andrés, M.; Bastida, F. Soil microbial community structure and activity in monospecific and mixed forest stands, under Mediterranean humid conditions. Plant Soil 2012, 354, 359–370. [Google Scholar] [CrossRef]
  13. Baldrian, P.; Kolařík, M.; Stursová, M.; Kopecký, J.; Valášková, V.; Větrovský, T.; Zifčáková, L.; Snajdr, J.; Rídl, J.; Vlček, C.; et al. Active and total microbial communities in forest soil are largely different and highly stratified during decomposition. ISME J. 2012, 6, 248–258. [Google Scholar] [CrossRef] [PubMed]
  14. Agnelli, A.; Ascher, J.; Corti, G.; Ceccherini, M.T.; Nannipieri, P.; Pietramellara, G. Distribution of microbial communities in a forest soil profile investigated by microbial biomass, soil respiration and DGGE of total and extracellular DNA. Soil Biol. Biochem. 2004, 36, 859–868. [Google Scholar] [CrossRef]
  15. Russell, A.E.; Raich, J.W.; Valverde-Barrantes, O.J.; Fisher, R.F. Tree Species Effects on Soil Properties in Experimental Plantations in Tropical Moist Forest. Soil Sci. Soc. Am. J. 2007, 71, 1389–1397. [Google Scholar] [CrossRef]
  16. Schulp, C.; Nabuurs, G. Effect of tree species on carbon stocks in forest floor and mineral soil and implications for soil carbon inventories. For. Ecol. Manag. 2008, 256, 482–490. [Google Scholar] [CrossRef]
  17. Prescott, C.E.; Grayston, S.J. Tree species influence on microbial communities in litter and soil: Current knowledge and research needs. For. Ecol. Manag. 2013, 309, 19–27. [Google Scholar] [CrossRef]
  18. Noble, I.; Bolin, B.; Ravindranath, N.H.; Verardo, D.J.; Dokken, D.J. Land Use, Land Use Change, and Forestry; Cambridge University Press: Cambridge, UK, 2000. [Google Scholar]
  19. Aosaar, J.; Varik, M.; Lõhmus, K.; Ostonen, I.; Becker, H.; Uri, V. Long-term study of above- and below-ground biomass production in relation to nitrogen and carbon accumulation dynamics in a grey alder (Alnus incana (L.) Moench) plantation on former agricultural land. Eur. J. For. Res. 2013, 132, 737–749. [Google Scholar] [CrossRef]
  20. Bárcena, T.G.; Kiær, L.P.; Vesterdal, L.; Stefánsdóttir, H.M.; Gundersen, P.; Sigurdsson, B.D. Soil carbon stock change following afforestation in Northern Europe: A meta-analysis. Glob. Chang. Biol. 2014, 20, 2393–2405. [Google Scholar] [CrossRef] [PubMed]
  21. Paul, K.I.; Polglase, P.J.; Nyakuengama, J.G.; Khanna, P.K. Change in Soil Carbon Following Afforestation or Reforestation. For. Ecol. Manag. 2000, 168, 241–257. [Google Scholar] [CrossRef]
  22. Pérez-Corona, M.E.; Hernández, M.C.P.; de Castro, F.B. Decomposition of Alder, Ash, and Poplar Litter in a Mediterranean Riverine Area. Commun. Soil Sci. Plant Anal. 2006, 37, 1111–1125. [Google Scholar] [CrossRef]
  23. Aosaar, J.; Varik, M.; Uri, V. Biomass production potential of grey alder (Alnus incana (L.) Moench.) in Scandinavia and Eastern Europe: A review. Biomass Bioenergy 2012, 45, 11–26. [Google Scholar] [CrossRef]
  24. San-Miguel-Ayanz, J.; de Rigo, D.; Caudullo, G.; Houston Durrant, T.; Mauri, A. (Eds.) European Atlas of Forest Tree Species; European Commision: Luxembourg, 2016. [Google Scholar]
  25. Cutini, A.; Giannini, T. Effects of thinning and mixed plantations with Alnus cordata on growth and efficiency of common walnut (Juglans regia L.). Forest@ 2009, 6, 29–38. [Google Scholar] [CrossRef]
  26. Incerti, G.; Bonanomi, G.; Giannino, F.; Cartenì, F.; Spaccini, R.; Mazzei, P.; Piccolo, A.; Mazzoleni, S. OMDY: A new model of organic matter decomposition based on biomolecular content as assessed by 13C-CPMAS-NMR. Plant Soil 2016, 411, 377–394. [Google Scholar] [CrossRef]
  27. Tani, A.; Maltoni, A.; Mariotti, B.; Buresti Lattes, E. Juglans regia L. tree plantations for wood production in mining area of S. Barbara (AR). Evaluation of N-fixing accessory trees effect. Forest@ 2006, 3, 588–597. [Google Scholar] [CrossRef]
  28. Blasi, C.; Burrascano, S.; Maturani, A.; Sabatini, F.M. Foreste Vetuste in Italia; Ministerio dell’Ambiente e della Tutela del Territorio e del Mare: Roma, Italy, 2010. [Google Scholar]
  29. Di Gennaro, A.; Aronne, G.; De Mascellis, R.; Vingiani, S.; Sarnataro, M.; Abalsamo, P.; Cona, F.; Vitelli, L.; Arpia, G. I Sistemi di Terre Della Campania; S.EL.CA.: Firenze, Italy, 2002. [Google Scholar]
  30. De Marco, A.; Fioretto, A.; Giordano, M.; Innangi, M.; Menta, C.; Papa, S.; Virzo De Santo, A. C Stocks in Forest Floor and Mineral Soil of Two Mediterranean Beech Forests. Forests 2016, 7, 181. [Google Scholar] [CrossRef]
  31. Olson, J. Energy storage and the balance of producers and decomposers in ecological systems. Ecology 1963, 44, 322–331. [Google Scholar] [CrossRef]
  32. Throop, H.L.; Archer, S.R.; Monger, H.C.; Waltman, S. When bulk density methods matter: Implications for estimating soil organic carbon pools in rocky soils. J. Arid Environ. 2012, 77, 66–71. [Google Scholar] [CrossRef]
  33. Wright, F.; Bailey, J.S. Organic Carbon, Total Carbon, and Total Nitrogen Determinations in Soils of Variable Calcium Carbonate Contents Using a Leco CN-2000 Dry Combustion Analyzer. Commun. Soil Sci. Plant Anal. 2001, 32, 3243–3258. [Google Scholar] [CrossRef]
  34. Berg, B.; Kjønaas, O.J.; Johansson, M.-B.; Erhagen, B.; Åkerblom, S. Late stage pine litter decomposition: Relationship to litter N, Mn, and acid unhydrolyzable residue (AUR) concentrations and climatic factors. For. Ecol. Manag. 2015, 358, 41–47. [Google Scholar] [CrossRef]
  35. Makkar, H.P.S. Quantification of Tannins in Tree and Shrub Foliage: A Laboratory Manual; Springer: Berlin, Germany, 2003. [Google Scholar]
  36. Updegraff, D.M. Semimicro determination of cellulose in biological materials. Anal. Biochem. 1969, 32, 420–424. [Google Scholar] [CrossRef]
  37. Fukushima, R.S.; Kerley, M.S.; Ramos, M.H.; Porter, J.H.; Kallenbach, R.L. Comparison of acetyl bromide lignin with acid detergent lignin and Klason lignin and correlation with in vitro forage degradability. Anim. Feed Sci. Technol. 2015, 201, 25–37. [Google Scholar] [CrossRef]
  38. Rohlf, F.J.; Corti, M. Use of two-block partial least-squares to study covariation in shape. Syst. Biol. 2000, 49, 740–753. [Google Scholar] [PubMed]
  39. Viscosi, V.; Fortini, P.; Slice, D.E.; Loy, A.; Blasi, C. Geometric morphometric analyses of leaf variation in four oak species of the subgenus Quercus (Fagaceae). Plant Biosyst. 2009, 143, 575–587. [Google Scholar] [CrossRef]
  40. Hammer, Ø.; Harper, D.A.T.; Ryan, P.D. PAST: Paleontological statistics software package for education and data analysis. Palaeontol. Electron. 2001, 4, 1–9. [Google Scholar]
  41. Miletić, Z.; Knežević, M.; Stajić, S.; Košanin, O.; Dordević, I. Effect of European black alder monocultures on the characteristics of reclaimed mine soil. Int. J. Environ. Res. 2012, 6, 703–710. [Google Scholar]
  42. Sharma, E.; Ambasht, R. Litterfall, decomposition and nutrient release in an age sequence of Alnus nepalensis plantation stands in the eastern Himalaya. J. Ecol. 1987, 75, 997–1010. [Google Scholar] [CrossRef]
  43. Berg, B.; McClaugherty, C. Plant Litter: Decomposition, Humus Formation, Carbon Sequestration, 3rd ed.; Springer: Berlin/Heidelberg, Germany, 2014. [Google Scholar]
  44. Edmonds, R.L.; Tuttle, K.M. Red alder leaf decomposition and nutrient release in alder and conifer riparian patches in western Washington, USA. For. Ecol. Manag. 2010, 259, 2375–2381. [Google Scholar] [CrossRef]
  45. Sharma, G.; Sharma, R.; Sharma, E. Influence of stand age on nutrient and energy release through decomposition in alder-cardamom agroforestry systems of the eastern Himalayas. Ecol. Res. 2008, 23, 99–106. [Google Scholar] [CrossRef]
  46. Berg, B.; Ekbohm, G. Litter mass-loss rates and decomposition patterns in some needles and leaf litter types. Long-term decomposition in a Scots pine forest 7. Can. J. Bot. 1991, 69, 1449–1456. [Google Scholar] [CrossRef]
  47. Berg, B. Decomposition patterns for foliar litter—A theory for influencing factors. Soil Biol. Biochem. 2014, 78, 222–232. [Google Scholar] [CrossRef]
  48. Dilly, O.; Munch, J.C.J. Microbial biomass content, basal respiration and enzyme activities during the course of decomposition of leaf litter in a black alder (Alnus glutinosa (L.) Gaertn.). Soil Biol. Biochem. 1996, 28, 1073–1081. [Google Scholar] [CrossRef]
  49. Fioretto, A.; Di Nardo, C.; Papa, S.; Fuggi, A. Lignin and cellulose degradation and nitrogen dynamics during decomposition of three leaf litter species in a Mediterranean ecosystem. Soil Biol. Biochem. 2005, 37, 1083–1091. [Google Scholar] [CrossRef]
  50. Berg, B.; Ekbohm, G.; Johansson, M.B.; McClaugherty, C.; Rutigliano, F.A.; Virzo De Santo, A. Maximum decomposition limits of forest litter types: A synthesis. Can. J. Bot. 1996, 74, 659–672. [Google Scholar] [CrossRef]
  51. Berg, B.; Cortina, J. Nutrient dynamics in some decomposing leaf and needle litter types in a Pinus sylvestris forest. Scand. J. For. Res. 1995, 10, 1–11. [Google Scholar] [CrossRef]
  52. Canhoto, C.; Graça, M.A.S. Decomposition of Eucalyptus globulus leaves and three native leaf species (Alnus glutinosa, Castanea sativa and Quercus faginea) in a Portuguese low order stream. Hydrobiologia 1996, 333, 79–85. [Google Scholar] [CrossRef]
  53. Wuest, S. Seasonal variation in soil organic carbon. Soil Sci. Soc. Am. J. 2014, 78, 1442–1447. [Google Scholar] [CrossRef]
  54. Frouz, J.; Pižl, V.; Cienciala, E.; Kalčík, J. Carbon storage in post-mining forest soil, the role of tree biomass and soil bioturbation. Biogeochemistry 2009, 94, 111–121. [Google Scholar] [CrossRef]
  55. Anderson, J.M.; Hetherington, S.L. Temperature, nitrogen availability and mixture effects on the decomposition of heather [Calluna vulgaris (L.) Hull] and bracken [Pteridium aquilinum (L.) Kuhn] litters. Funct. Ecol. 1999, 13, 116–124. [Google Scholar] [CrossRef]
  56. Frankland, J. Succession of Fungi on Decaying Petioles of Pteridium aquilinum. J. Ecol. 1966, 54, 41–63. [Google Scholar] [CrossRef]
  57. Magill, A.H.; Aber, J.D. Dissolved organic carbon and nitrogen relationships in forest litter as affected by nitrogen deposition. Soil Biol. Biochem. 2000, 32, 603–613. [Google Scholar] [CrossRef]
  58. Killham, K. Soil Ecology; Cambridge University Press: Cambridge, UK, 1994. [Google Scholar]
  59. Michalzik, B.; Kalbitz, K.; Park, J.; Solinger, S.; Matzner, E. Fluxes and concentrations of dissolved organic carbon and nitrogen—A synthesis for temperate forests. Biogeochemistry 2001, 52, 173–205. [Google Scholar] [CrossRef]
  60. McDowell, W.H. Dissolved organic matter in soils—Future directions and unanswered questions. Geoderma 2003, 113, 179–186. [Google Scholar] [CrossRef]
  61. Kaiser, K.; Kalbitz, K. Cycling downwards—Dissolved organic matter in soils. Soil Biol. Biochem. 2012, 52, 29–32. [Google Scholar] [CrossRef]
  62. Lehmann, J.; Kleber, M. The contentious nature of soil organic matter. Nature 2015, 528, 60–68. [Google Scholar] [CrossRef] [PubMed]
  63. Guggenberger, G.; Zech, W. Composition and dynamics of dissolved carbohydrates and lignin-degradation products in two coniferous forests, N.E. Bavaria, Germany. Soil Biol. Biochem. 1994, 26, 19–27. [Google Scholar] [CrossRef]
  64. Kaiser, K.; Guggenberger, G.; Haumaier, L.; Zech, W. Seasonal variations in the chemical composition of dissolved organic matter in organic forest floor layer leachates of old-growth Scots pine (Pinus sylvestris L.) and European beech (Fagus sylvatica L.) stands in northeastern Bavaria, Germany. Biogeochemistry 2001, 55, 103–143. [Google Scholar] [CrossRef]
  65. Hernes, P.J.; Kaiser, K.; Dyda, R.Y.; Cerli, C. Molecular trickery in soil organic matter: Hidden lignin. Environ. Sci. Technol. 2013, 47, 9077–9085. [Google Scholar] [CrossRef] [PubMed]
  66. Thevenot, M.; Dignac, M.F.M.; Rumpel, C. Fate of lignins in soils: A review. Soil Biol. Biochem. 2010, 42, 1200–1211. [Google Scholar] [CrossRef]
  67. Kalbitz, K.; Schwesig, D.; Schmerwitz, J.; Kaiser, K.; Haumaier, L.; Glaser, B.; Ellerbrock, R.; Leinweber, P. Changes in properties of soil-derived dissolved organic matter induced by biodegradation. Soil Biol. Biochem. 2003, 35, 1129–1142. [Google Scholar] [CrossRef]
  68. Scheel, T.; Haumaier, L.; Ellerbrock, R.H.; Rühlmann, J.; Kalbitz, K. Properties of organic matter precipitated from acidic forest soil solutions. Org. Geochem. 2008, 39, 1439–1453. [Google Scholar] [CrossRef]
  69. Gu, B.; Schmitt, J.; Chen, Z.; Liang, L.; McCarthy, J.F. Adsorption and desorption of different organic matter fractions on iron oxide. Geochim. Cosmochim. Acta 1995, 59, 219–229. [Google Scholar] [CrossRef]
  70. Kaiser, K.; Guggenberger, G.; Haumaier, L. Changes in dissolved lignin-derived phenols, neutral sugars, uronic acids, and amino sugars with depth in forested Haplic Arenosols and Rendzic Leptosols. Biogeochemistry 2004, 70, 135–151. [Google Scholar] [CrossRef]
  71. Cotrufo, M.F.; Soong, J.L.; Horton, A.J.; Campbell, E.E.; Haddix, M.L.; Wall, D.H.; Parton, W.J. Formation of soil organic matter via biochemical and physical pathways of litter mass loss. Nat. Geosci. 2015, 8, 776–779. [Google Scholar] [CrossRef]
  72. Cotrufo, M.F.; Wallenstein, M.D.; Boot, C.M.; Denef, K.; Paul, E. The Microbial Efficiency-Matrix Stabilization (MEMS) framework integrates plant litter decomposition with soil organic matter stabilization: Do labile plant inputs form stable soil organic matter? Glob. Chang. Biol. 2013, 19, 988–995. [Google Scholar] [CrossRef] [PubMed]
Figure 1. Quantitative and qualitative dynamics of the forest floor components. Months and decomposition days (dd, in parentheses) in the litterbag experiment are reported. Bars represent mean ± standard error of the mean (N = 6).
Forests 08 00240 g001
Figure 2. Dynamics of organic carbon (a), total nitrogen (b), cellulose (c) and lignin (d) stocks in the forest floor leaf litter (upper grey bars) and topsoil (lower white bars). Each bar is accompanied by the relative increase or decrease in the stock compared to January. The presence of significant differences between sampling per compartment was tested by the mean of a one-way ANOVA followed by a Tukey post-hoc test. Such differences are shown as lowercase letters for forest floor leaf litter and uppercase letters for topsoil. Bars which do not share a letter have significant differences (p < 0.05). At the top of each graph, the ratio between the stocks in the forest floor leaf litter and topsoil is shown. Months and decomposition days in the litterbag experiment (dd) are reported. L:S indicates the ratio between the stock in leaf litter forest floor and the topsoil.
Forests 08 00240 g002
Figure 3. Dynamics of water extractable (a), ethanol extractable (b) and total phenol (c) stocks in the forest floor leaf litter (upper grey bars) and topsoil (lower white bars). Each bar is accompanied by the relative increase or decrease in the stock compared to January. The presence of significant differences between sampling per compartment was tested by the mean of a one-way ANOVA followed by a Tukey post-hoc test. Such differences are shown as lowercase letters for forest floor leaf litter and uppercase letters for topsoil. Bars which do not share a letter have significant differences (p < 0.05). At the top of each graph, the ratio between the stocks in the forest floor leaf litter and topsoil is shown. Months and decomposition days (dd, in parentheses) in the litterbag experiment are reported. L:S indicates the ratio between the stock in leaf litter forest floor and the topsoil.
Forests 08 00240 g003
Figure 4. Graphical representation of Axis 1 of the two-block PLS. Variation on the x-axis is forest floor leaf litter and on the y-axis for the topsoil. Values represent the mean score for the replicates (N = 6) with standard error of the mean. Total phenols and ethanol extractables are not shown in the biplot given their lack of importance. Months and decomposition days (dd) in the litterbag experiment are reported.
Forests 08 00240 g004
Figure 5. Graphical representation of Axis 2 of the two-block PLS. Variation on the x-axis is forest floor leaf litter and on the y-axis the topsoil. Values represent the mean score for the replicates (N = 6) with standard error of the mean. Months and decomposition days in the litterbag experiment (dd) are reported.
Forests 08 00240 g005
Table 1. Newly shed litter chemical composition. Values represent mean ± standard error of the mean (N = 6).
Chemical VariableMean ± SEM
Nitrogen (mg/g d.w.)30.3 ± 0.6
Water extractables (mg/g d.w.)246.8 ± 1.3
Ethanol extractables (mg/g d.w.)149.5 ± 2.6
Total Phenols (mg/g d.w.)20.2 ± 2.3
Cellulose (mg/g d.w.)108.1 ± 2.9
Lignin (mg/g d.w.)100.6 ± 6.0
C:N16.5 ± 0.3
Lignin:N3.3 ± 0.2
Table 2. Dynamics of residual masses, C:N and Lignin:N in the litterbag experiment. Values represent mean ± standard error of the mean (N = 6).
VariableDecomposition Days
100180270
Total residual mass (%)76.6 ± 2.267.0 ± 4.160.0 ± 1.4
Residual water extractables (%)67.9 ± 2.557.4 ± 5.250.8 ± 4.1
Residual ethanol extractables (%)67.9 ± 3.364.2 ± 5.056.9 ± 4.1
Residual total phenols (%)10.1 ± 0.86.2 ± 1.40.8 ± 0.0
Residual nitrogen (%)66.2 ± 4.350.5 ± 5.444.0 ± 3.3
Residual cellulose (%)73.8 ± 8.538.4 ± 5.918.1 ± 2.9
Residual lignin (%)62.1 ± 4.829.8 ± 6.822.3 ± 2.5
C:N16.8 ± 0.617.2 ± 0.316.9 ± 1.0
Lignin:N3.2 ± 0.32.1 ± 0.51.7 ± 0.1
Table 3. Pearson correlation coefficients between the different stocks in the forest floor leaf litter and topsoil. Values in brackets are the significance of the correlation, highlighted by symbols.
Forest Floor Leaf Litter
Organic CarbonTotal NitrogenWater ExtractablesEthanol ExtractablesTotal PhenolsCellulose
Total Nitrogen0.969 ***
Water Extractables0.925 ***0.856***
Ethanol Extractables0.930 ***0.875 ***0.983 ***
Total Phenols0.455 n.s.0.365 n.s.0.549 **0.522 **
Cellulose0.893 ***0.866 ***0.805 ***0.811 ***0.368 n.s.
Lignin0.915 ***0.943 ***0.815 ***0.832 ***0.312 n.s.0.900 ***
Topsoil (0–5 cm)
Organic CarbonTotal NitrogenWater Extr.Ethanol Extr.Total PhenolsCellulose
Total Nitrogen0.403 n.s.
Water Extractables0.083 n.s.0.335 n.s.
Ethanol Extractables−0.017 n.s.−0.675 ***−0.303 n.s.
Total Stock0.234 n.s.−0.104 n.s.−0.154 n.s.0.415 *
Cellulose−0.019 n.s.−0.165 n.s.−0.087 n.s.−0.011 n.s.0.084 n.s.
Lignin−0.083 n.s.−0.482 *−0.338 n.s.0.349 n.s.−0.057 n.s.−0.088 n.s.
(*** p < 0.001, ** p < 0.010, * p < 0.050, n.s. non-significant).
Table 4. Loading of the two-block PLS in the first two axes. Absolute higher values within each block (forest floor leaf litter or topsoil) imply the stronger importance of the variable. Among and between blocks, variables that have the same sign are positively correlated and inversely correlated when the sign is opposite.
StockLoadings Axis 1Loadings Axis 2
Forest Floor Leaf LitterTopsoil (0–5 cm)Forest Floor Leaf LitterTopsoil (0–5 cm)
Total Organic C−0.42−0.430.060.13
Total N−0.490.09−0.12−0.69
Total Phenols−0.100.180.550.07
Ethanol Extractables−0.220.020.510.65
Water Extractables−0.25−0.800.50−0.05
Cellulose−0.470.37−0.380.14
Lignin−0.490.01−0.160.23

