Article

Mangrove Carbon Stocks and Ecosystem Cover Dynamics in Southwest Madagascar and the Implications for Local Management

1
Blue Ventures Conservation, 39-41 North Road, London N7 9DP, UK
2
Centre for Environment, Fisheries and Aquaculture Science, Lowestoft Laboratory, Lowestoft NR33 OHT, UK
3
Department of Forest Resources Management, 2424 Main Mall, University of British Columbia, Vancouver, BC V6T 1Z4, Canada
*
Author to whom correspondence should be addressed.
Forests 2017, 8(6), 190; https://doi.org/10.3390/f8060190
Submission received: 28 March 2017 / Revised: 11 May 2017 / Accepted: 20 May 2017 / Published: 31 May 2017

Abstract

:
Of the numerous ecosystem services mangroves provide, carbon storage is gaining particular attention for its potential role in climate change mitigation strategies. Madagascar contains 2% of the world’s mangroves, over 20% of which is estimated to have been deforested through charcoal production, timber extraction and agricultural development. This study presents a carbon stock assessment of the mangroves in Helodrano Fagnemotse in southwest Madagascar alongside an analysis of mangrove land-cover change from 2002 to 2014. Similar to other mangrove ecosystems in East Africa, higher stature, closed-canopy mangroves in southwest Madagascar were estimated to contain 454.92 (±26.58) Mg·C·ha−1. Although the mangrove extent in this area is relatively small (1500 ha), these mangroves are of critical importance to local communities and anthropogenic pressures on coastal resources in the area are increasing. This was evident in both field observations and remote sensing analysis, which indicated an overall net loss of 3.18% between 2002 and 2014. Further dynamics analysis highlighted widespread transitions of dense, higher stature mangroves to more sparse mangrove areas indicating extensive degradation. Harnessing the value that the carbon stored within these mangroves holds on the voluntary carbon market could generate revenue to support and incentivise locally-led sustainable mangrove management, improve livelihoods and alleviate anthropogenic pressures.

1. Introduction

Concerns over increasing atmospheric carbon emissions are driving the need to improve understanding of carbon sequestration within global ecosystems and investigate solutions to mitigate the effects of resulting climate change [1,2,3,4]. Coastal wetlands in particular are gaining increasing recognition as remarkably efficient carbon sinks [5,6]. Mangroves, sea grasses and tidal salt marshes are highly productive ecosystems, estimated to sequester carbon 10–50 times faster than terrestrial systems [1,7]. These ‘blue carbon’ ecosystems are capable of accumulating vast quantities of organic matter [8] and have been shown to contain markedly greater stores of carbon than terrestrial forest ecosystems [9]. A combination of high productivity, anaerobic conditions and high accumulation rates account for the high carbon storage capacity of mangrove ecosystems in particular [5]. Consequently, these marine forest ecosystems have been reported to be the most carbon dense forest type in the tropics, contributing significantly to tropical blue carbon stores [9,10].
As one of the most productive biomes on Earth [11], in addition to providing a climate change mitigation service through the storage of carbon, mangroves also supply a wide range of other ecosystem services [12], both on a global and local scale [1]. They can provide coastlines with protection against natural disasters such as tsunamis and hurricanes [13,14], local communities with products such as fuelwood and building materials [15] and habitats with breeding and nursery grounds, supporting commercially important fish stocks [16,17]. However, despite, and in part due to, this provision of goods and services, mangrove ecosystems are under threat from increasing anthropogenic exploitation, reaching a loss of an alarming 1–3% year−1 [15,18,19] with half of the world’s mangroves estimated to have been lost in the past 50 years [15,20]. These losses are driven by growing pressures from coastal development, agriculture and aquaculture, as well as the extraction of timber for construction and charcoal. Pressures are further exacerbated by escalating natural losses caused by extreme weather events and sea level rise due to climate change. The degradation and loss of these blue carbon sinks not only jeopardizes their ability to store carbon by reducing carbon sequestration rates but also contributes towards emissions by releasing stored carbon [19,21].
Economic evaluation of ecosystems provides estimates of the value of the goods and services they provide [14]. Associating ecosystems with economic values is considered to be an effective incentive for sustainable management [22] and mangroves are reported to have the highest value per hectare of any blue carbon ecosystem [10]. It is believed that many regulating and supporting services have often been undervalued, being harder to comprehend and evaluate [15]. However, with increasing concern over climate change, efforts to evaluate the rate and value of carbon sequestration in forest systems has been increasing [1,10,23].
Madagascar contains Africa’s fourth largest extent of mangroves, which in 2010 comprised approximately 213,000 ha, representing 2% of the global mangrove cover [20,24]. Madagascar’s coastal communities are heavily dependent on the resources mangroves provide. In particular, mangroves meet the majority of the energy demands of many coastal communities and surrounding urban areas, in addition to providing an important source of timber for building construction [25]. This heavy reliance on mangrove ecosystems is leading to increasing and wide-spread degradation and deforestation throughout Madagascar, with an estimated net loss of 21% between 1990 and 2010 [24].
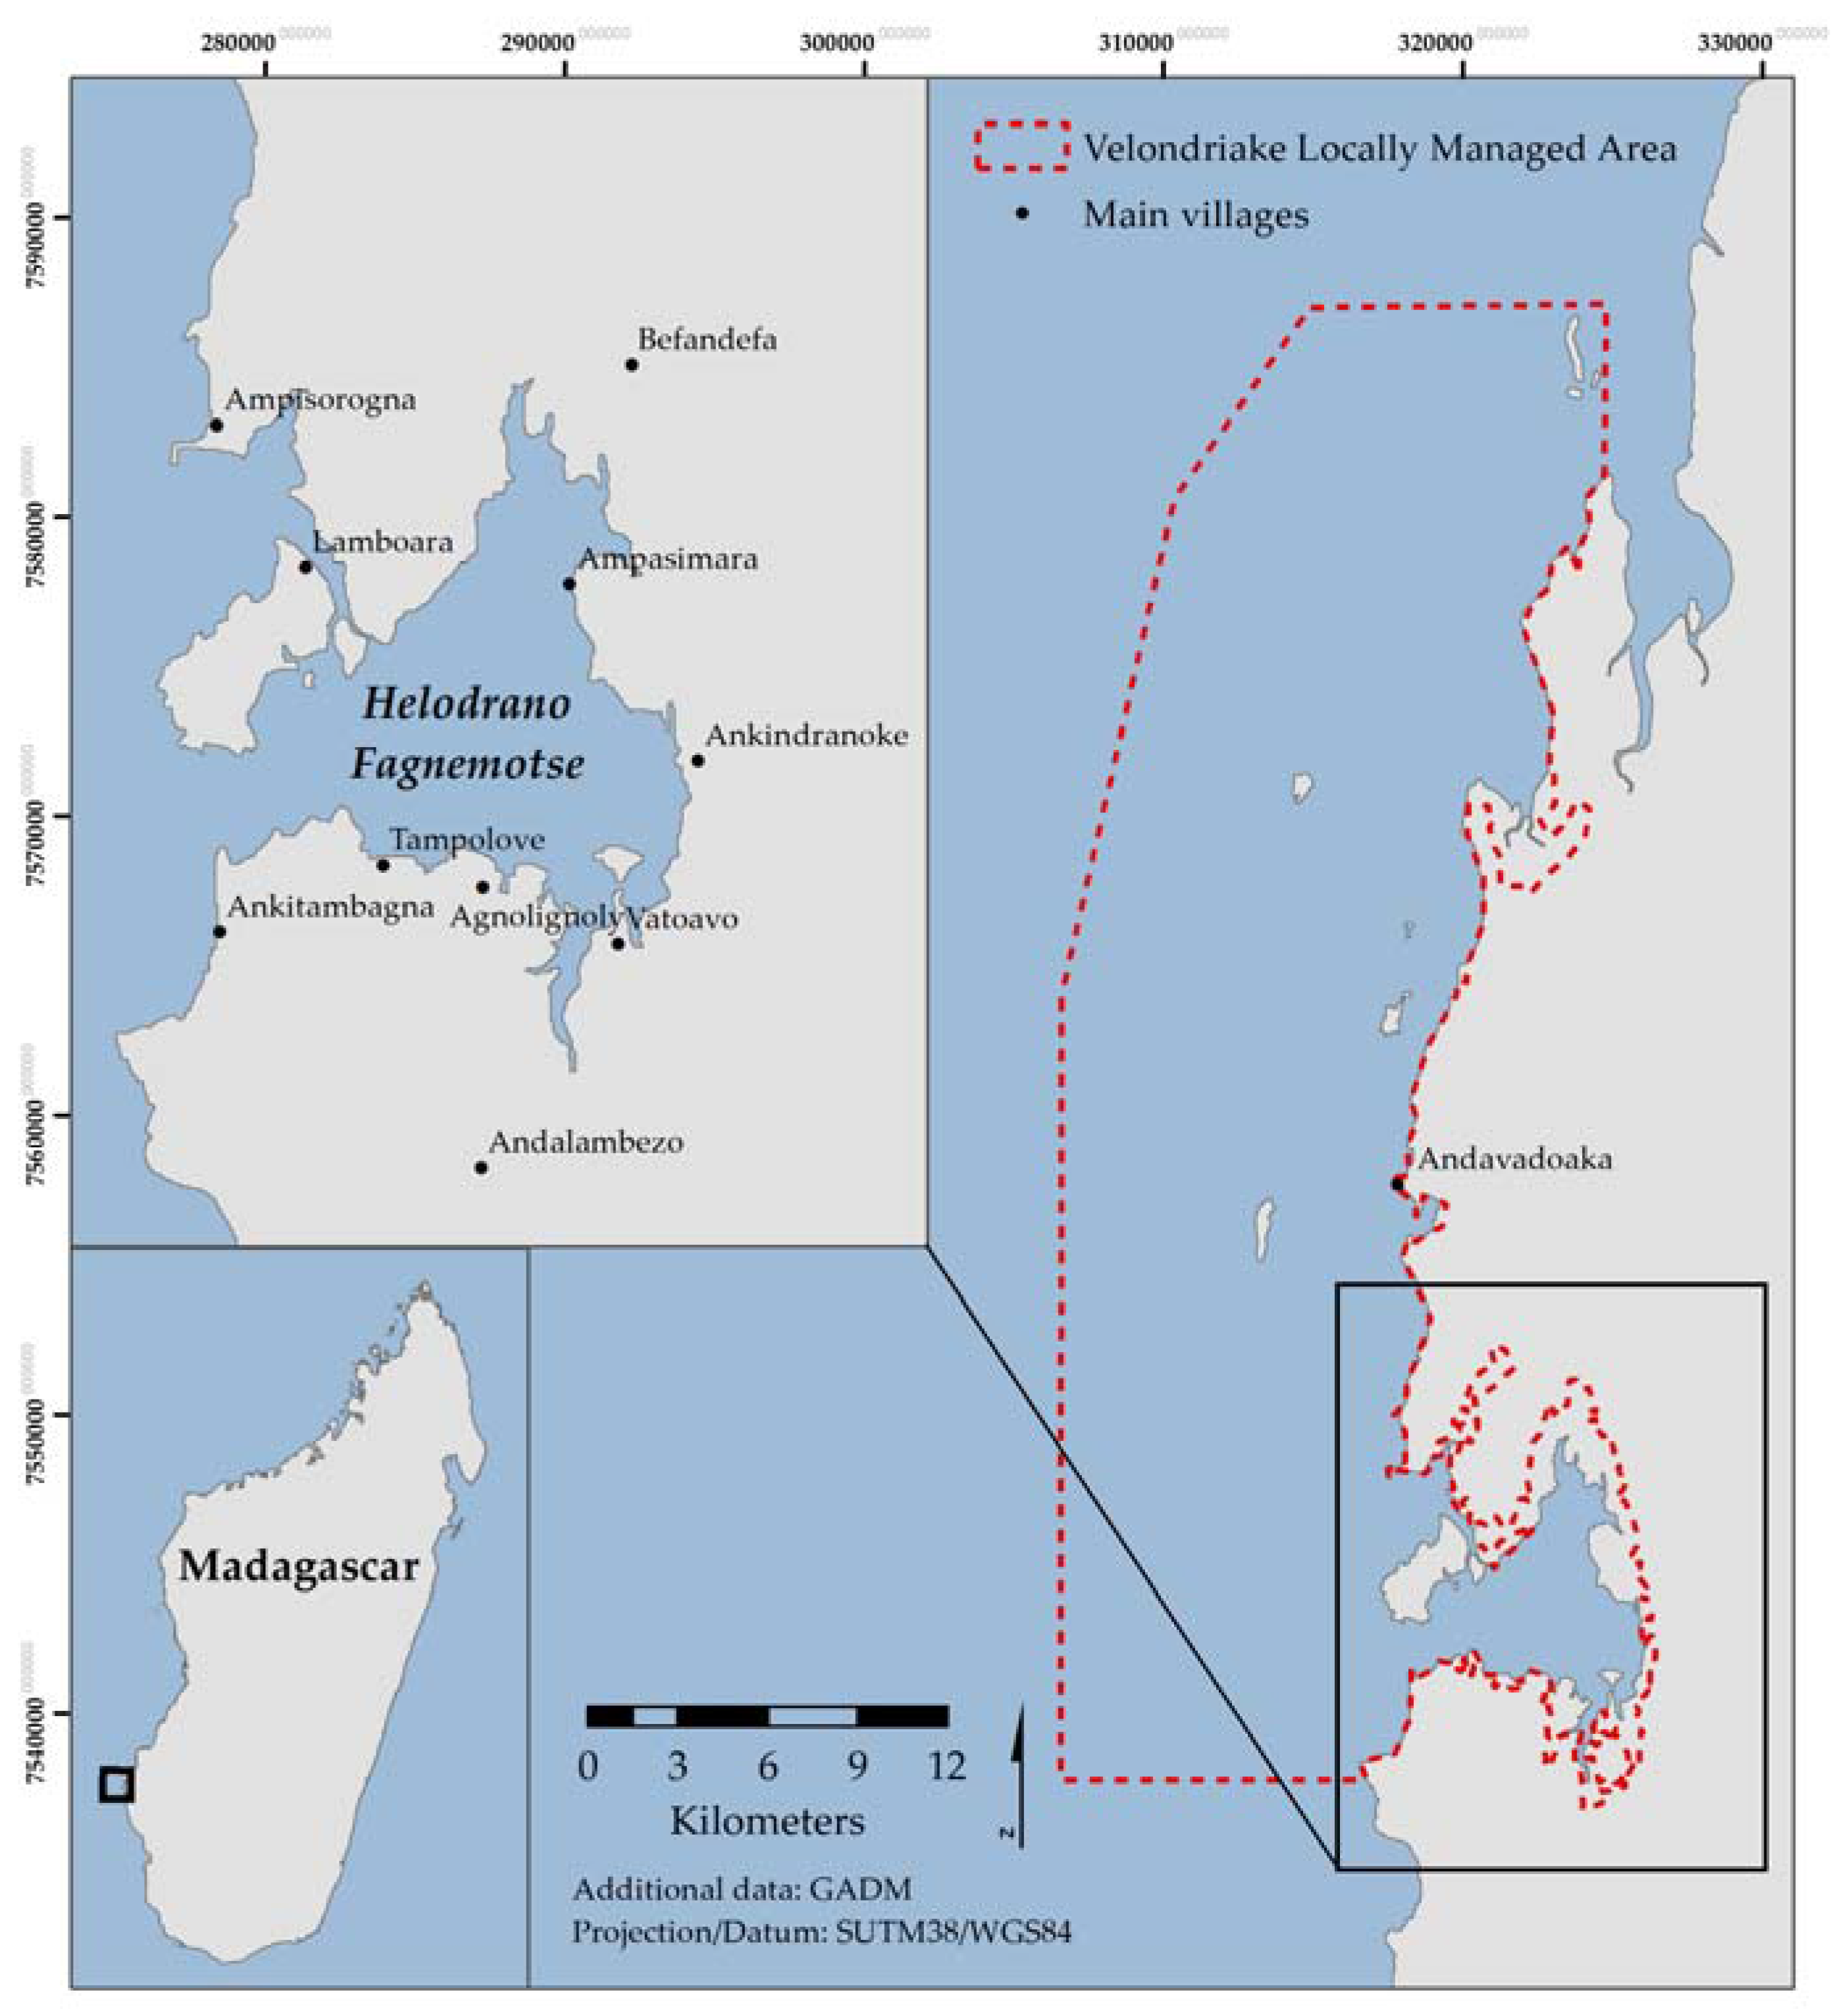
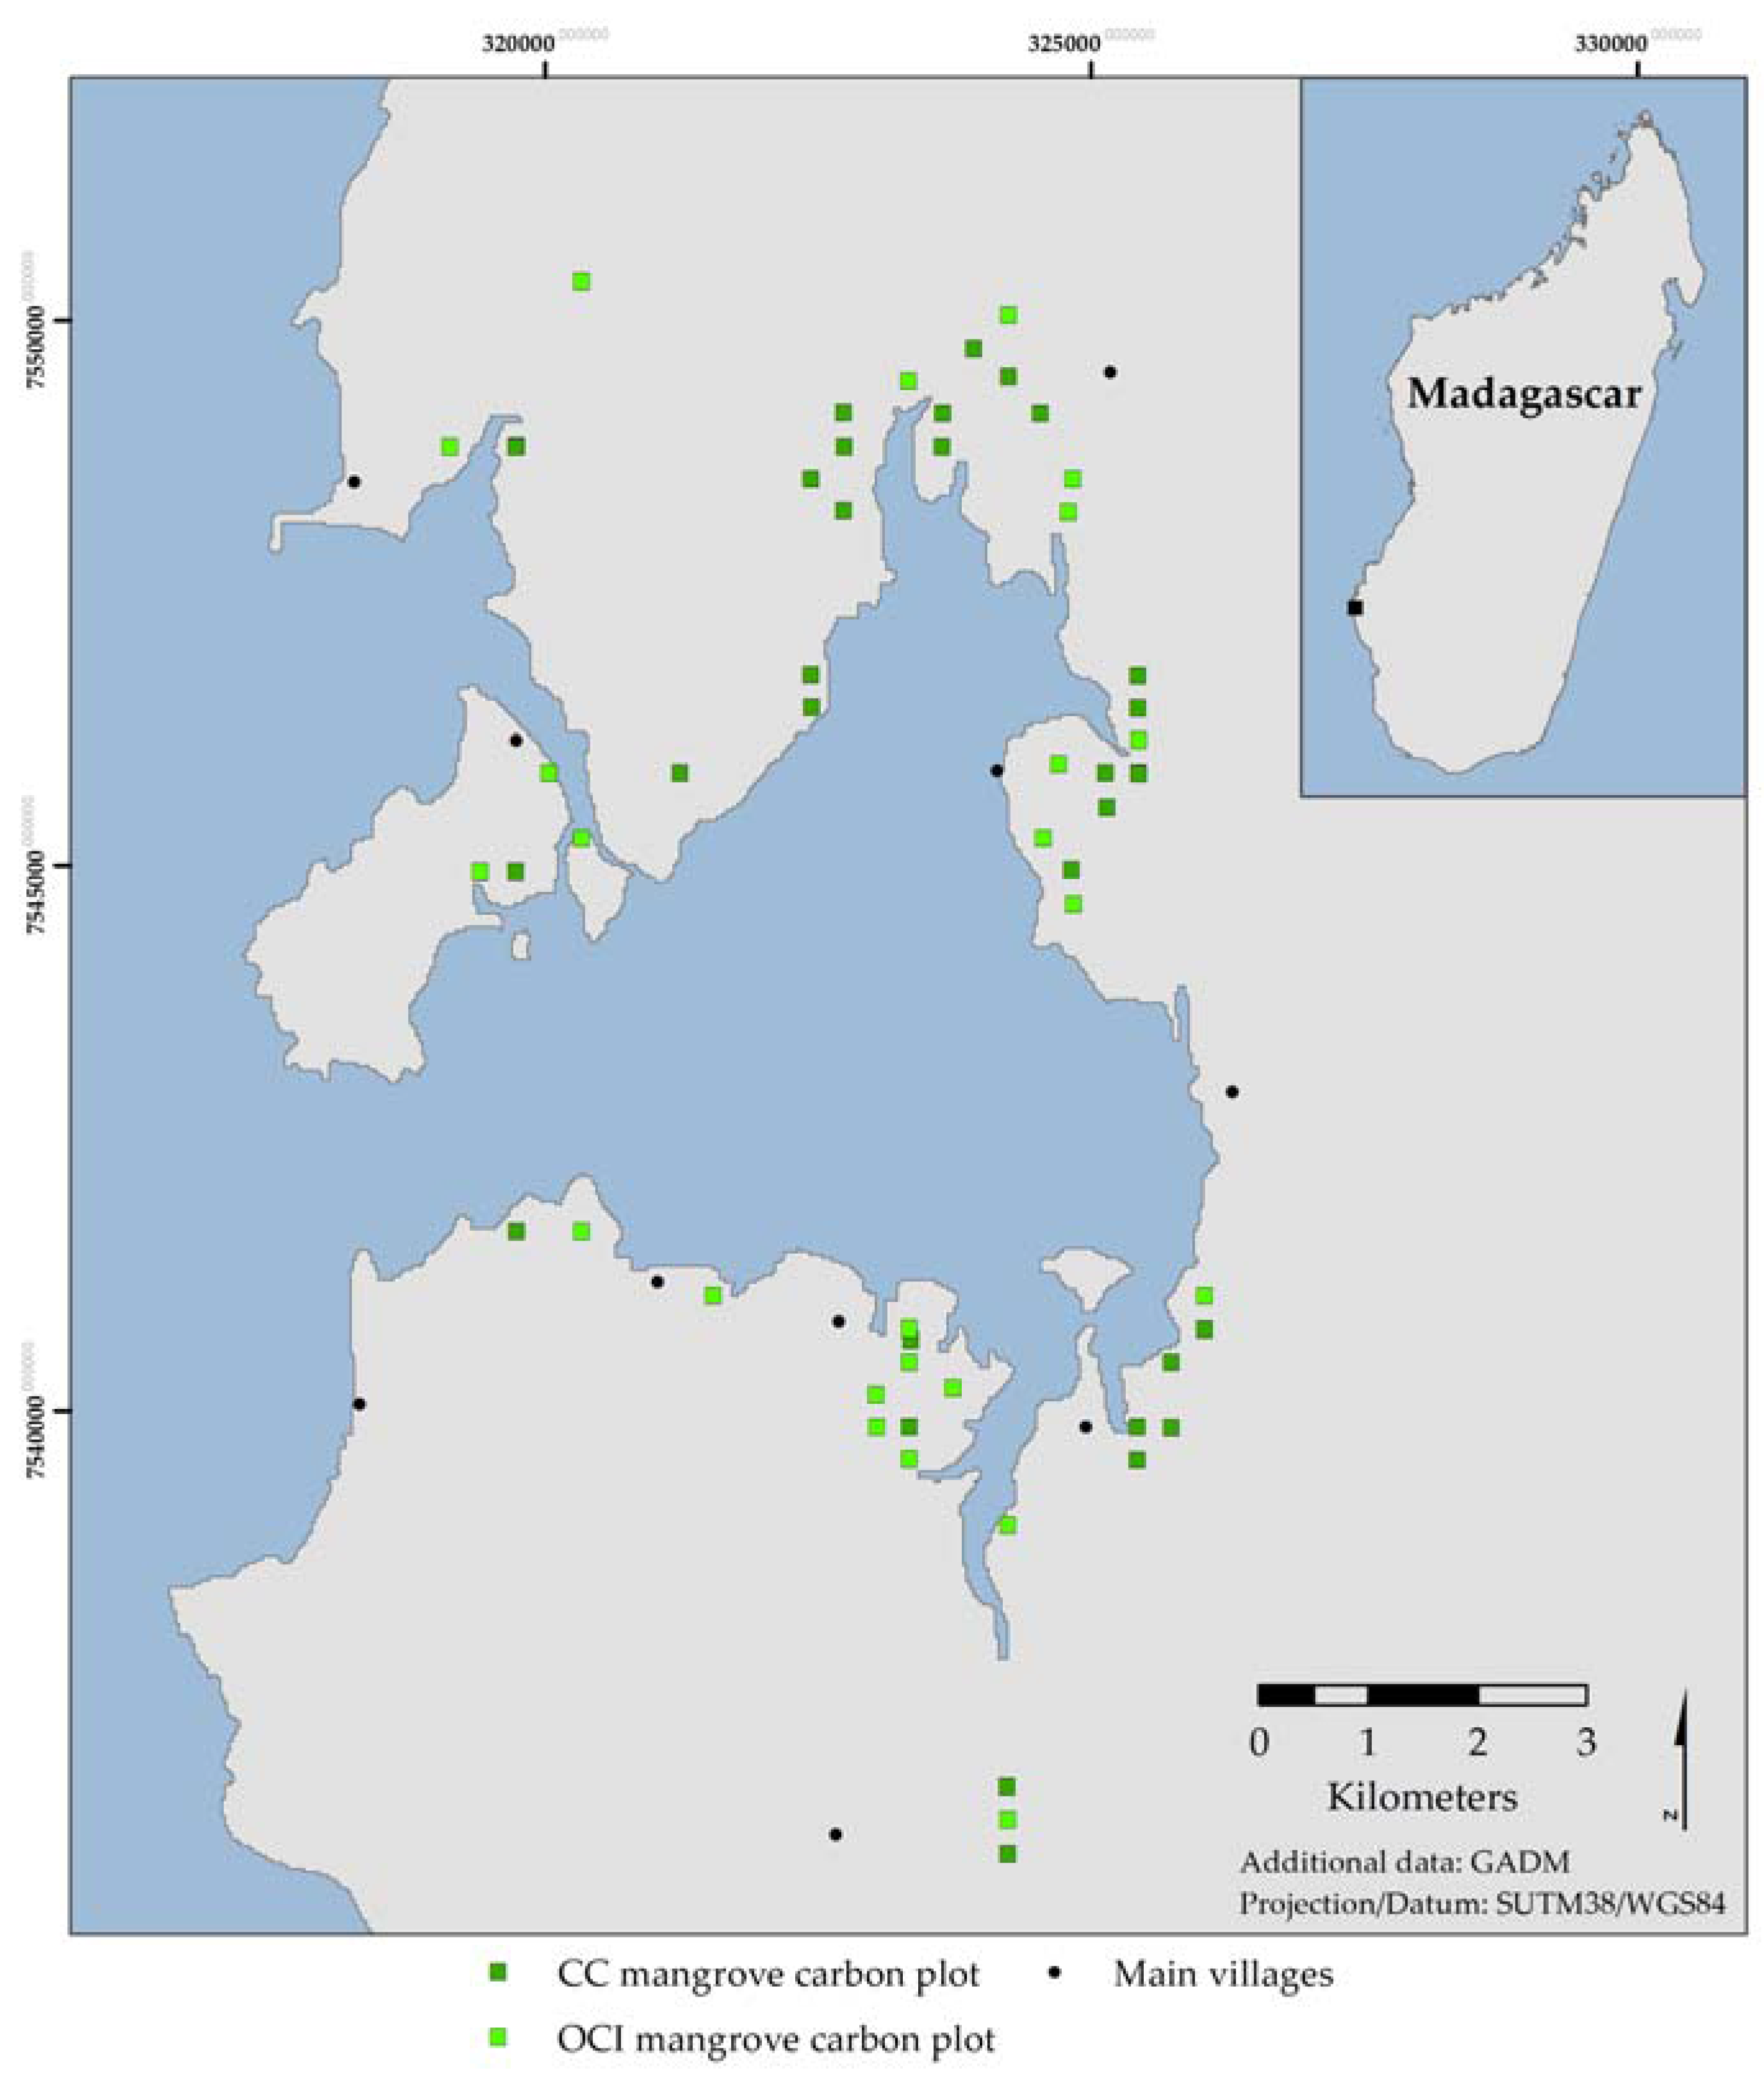
This study builds on a growing number of carbon stock inventories carried out throughout Africa [25,26,27,28], using well established inventory protocols to estimate the carbon stocks of the mangroves of Helodrano Fagnemotse (Baie des Assassins) in southwest Madagascar. In addition, it calculates forest land-cover change between 2002 and 2014 in order to assess the implications of forest exploitation on carbon storage and highlight the importance of a community-led mangrove management strategy aiming to conserve and restore the bay’s mangroves.
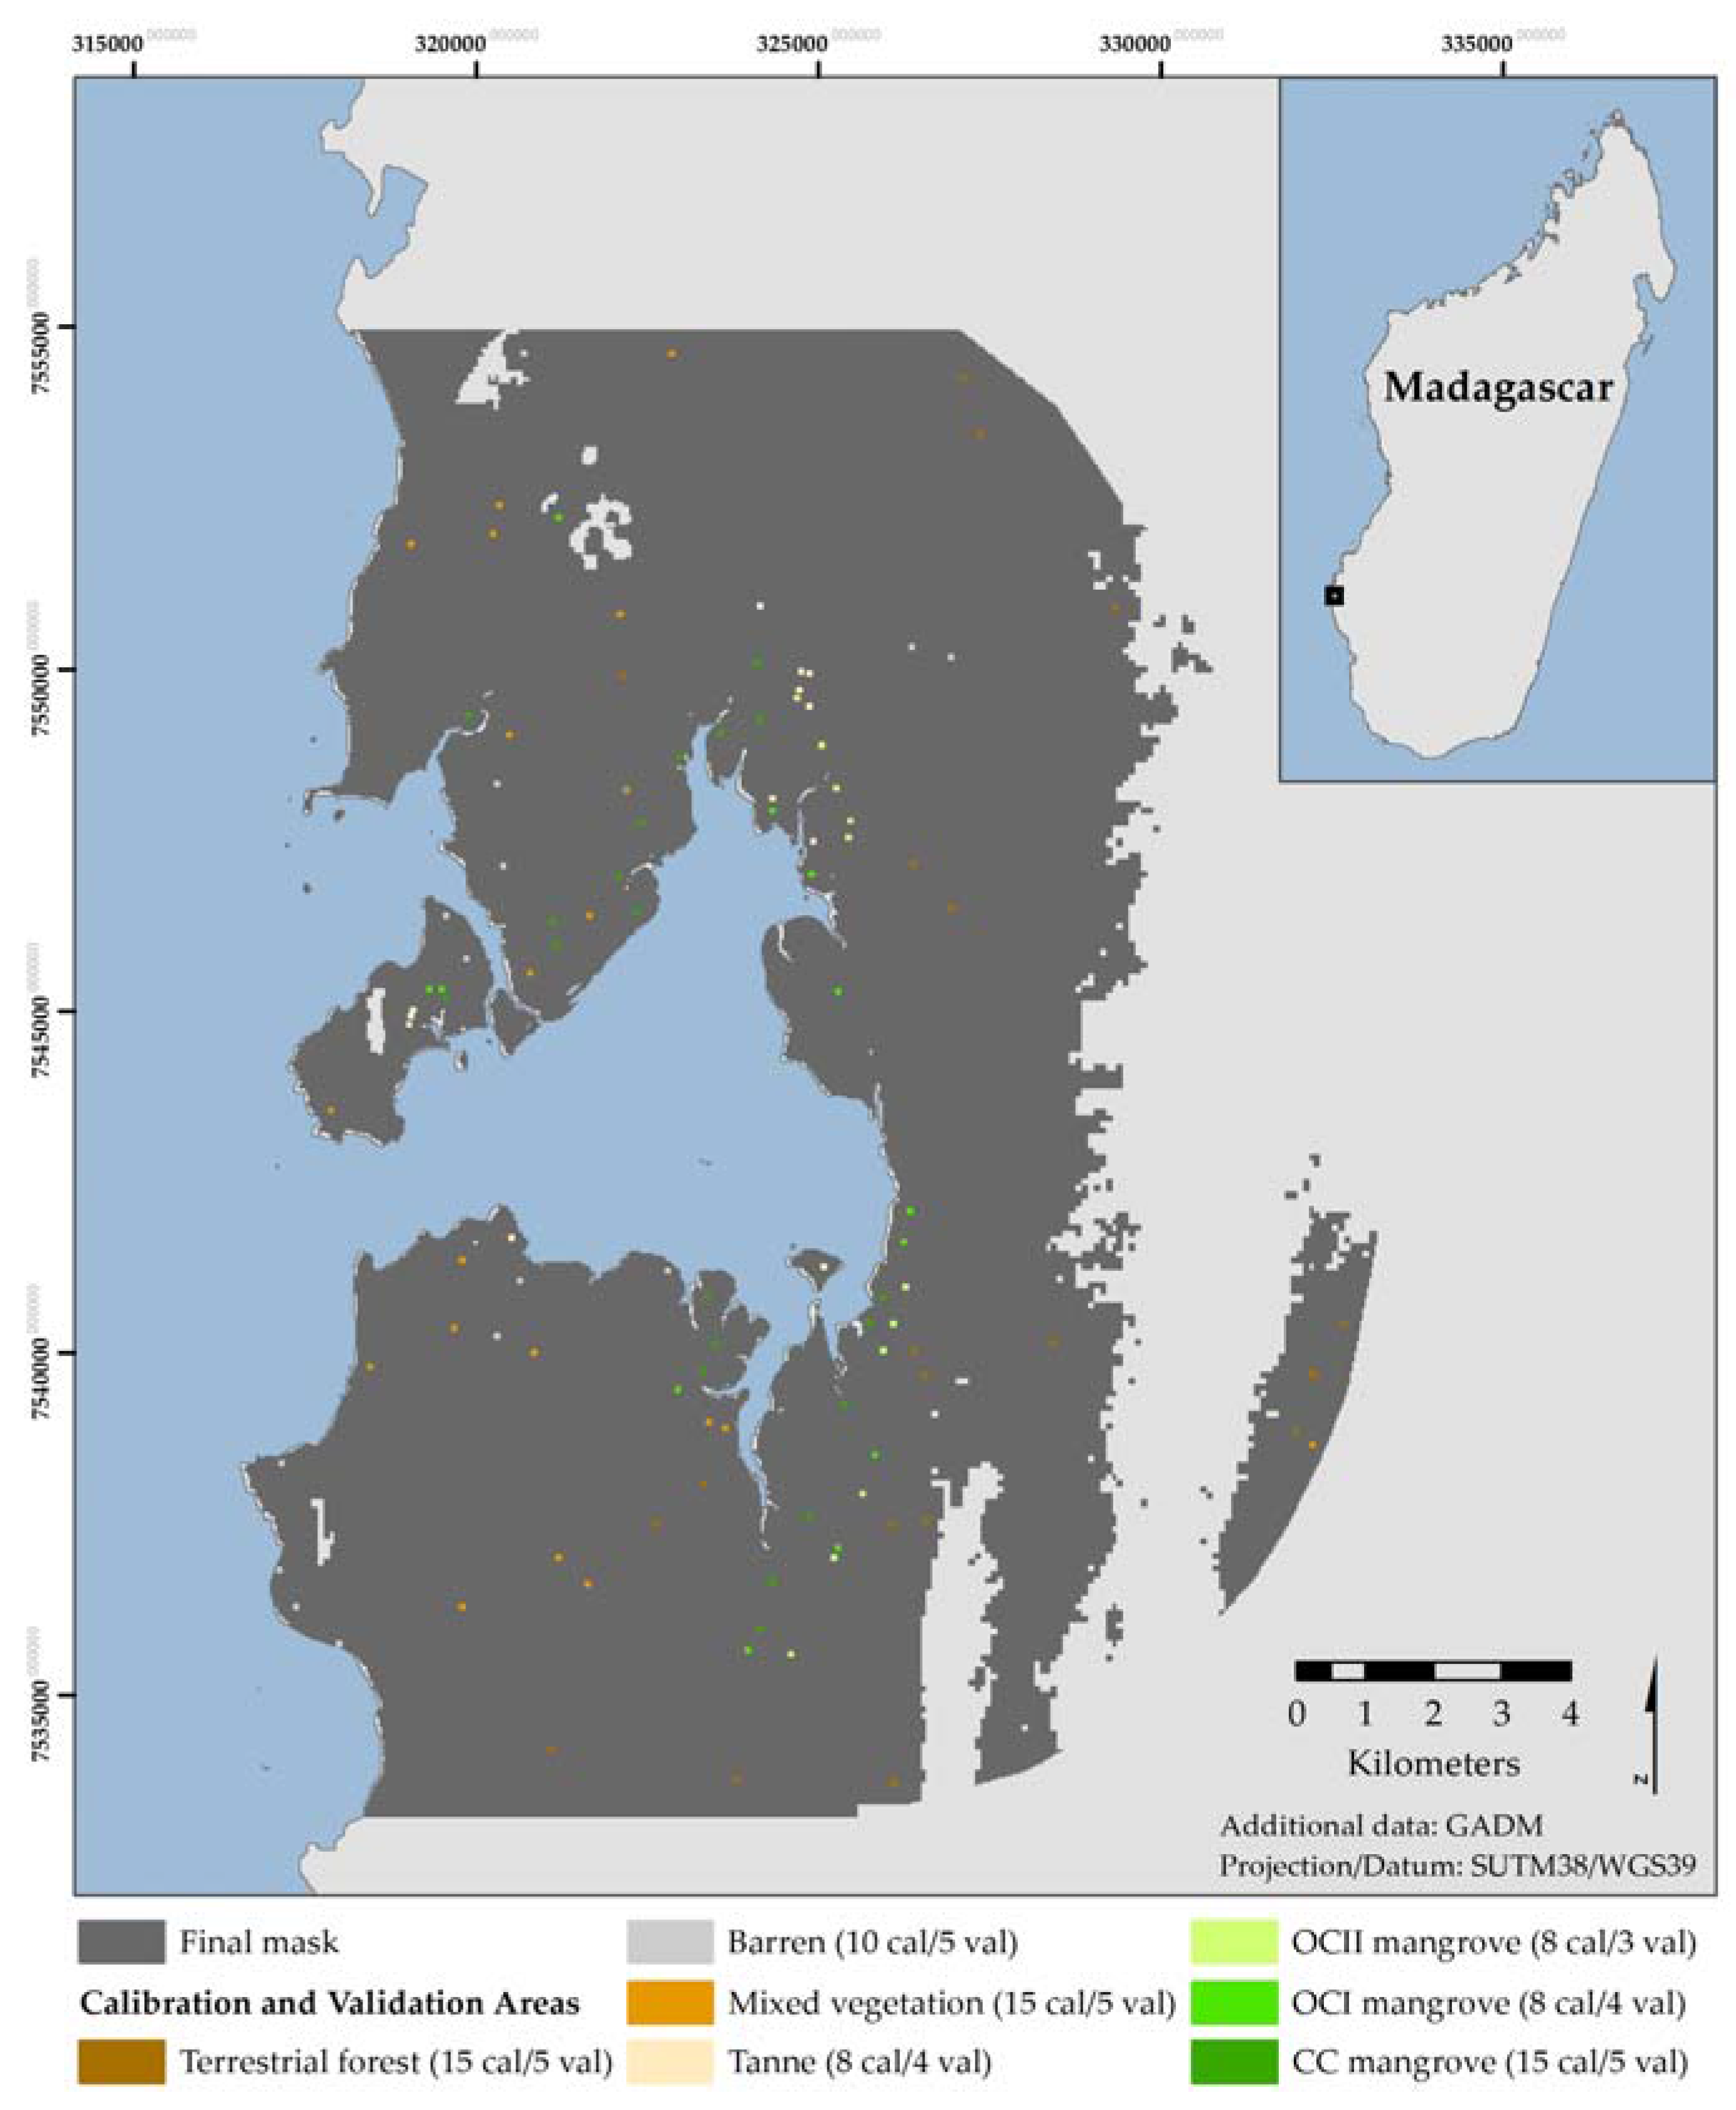
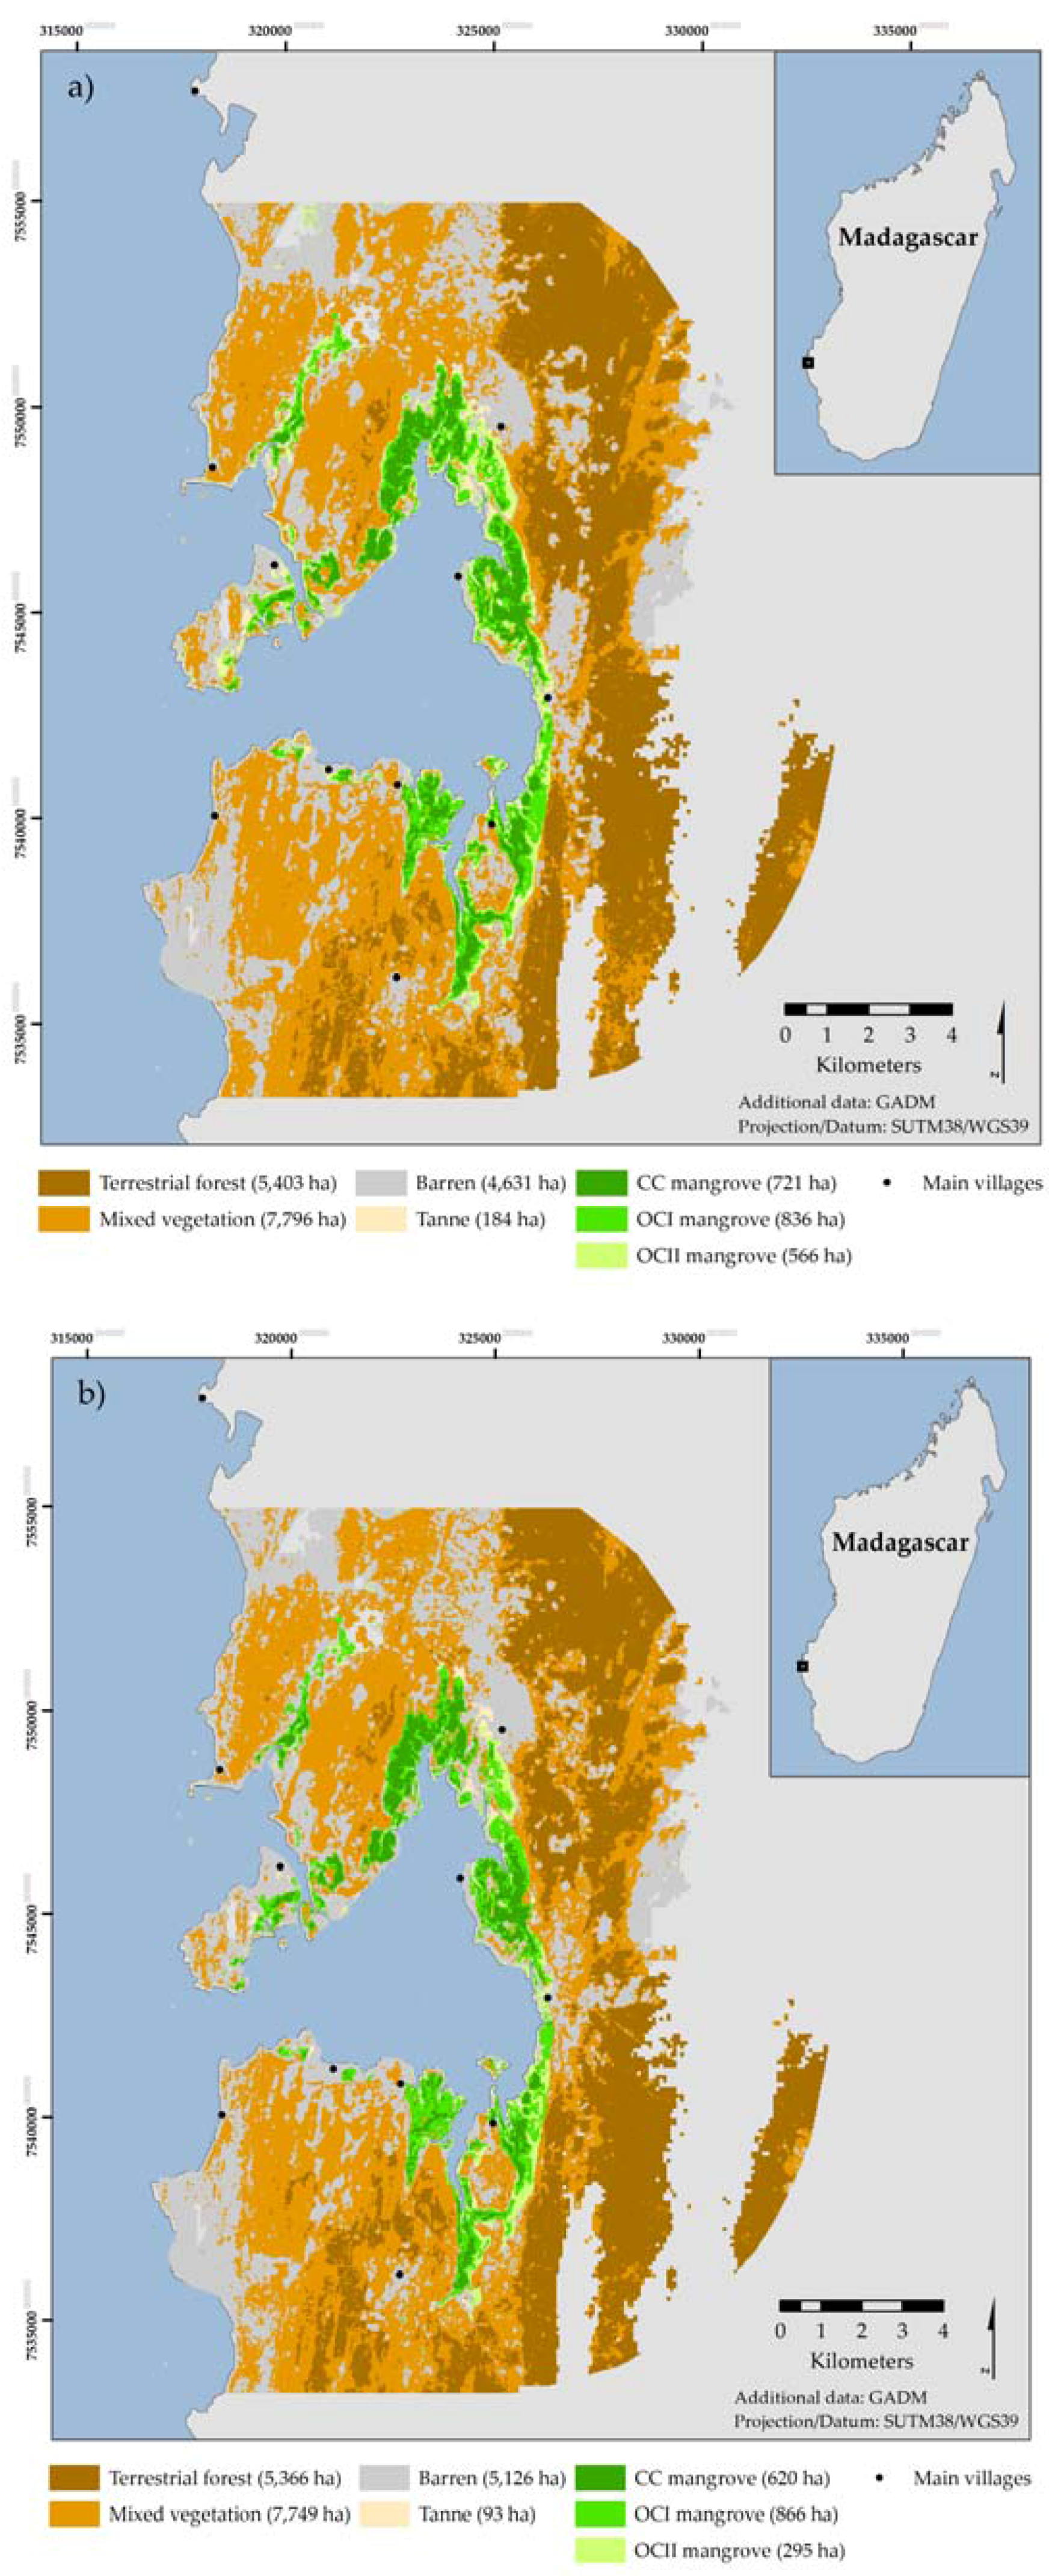
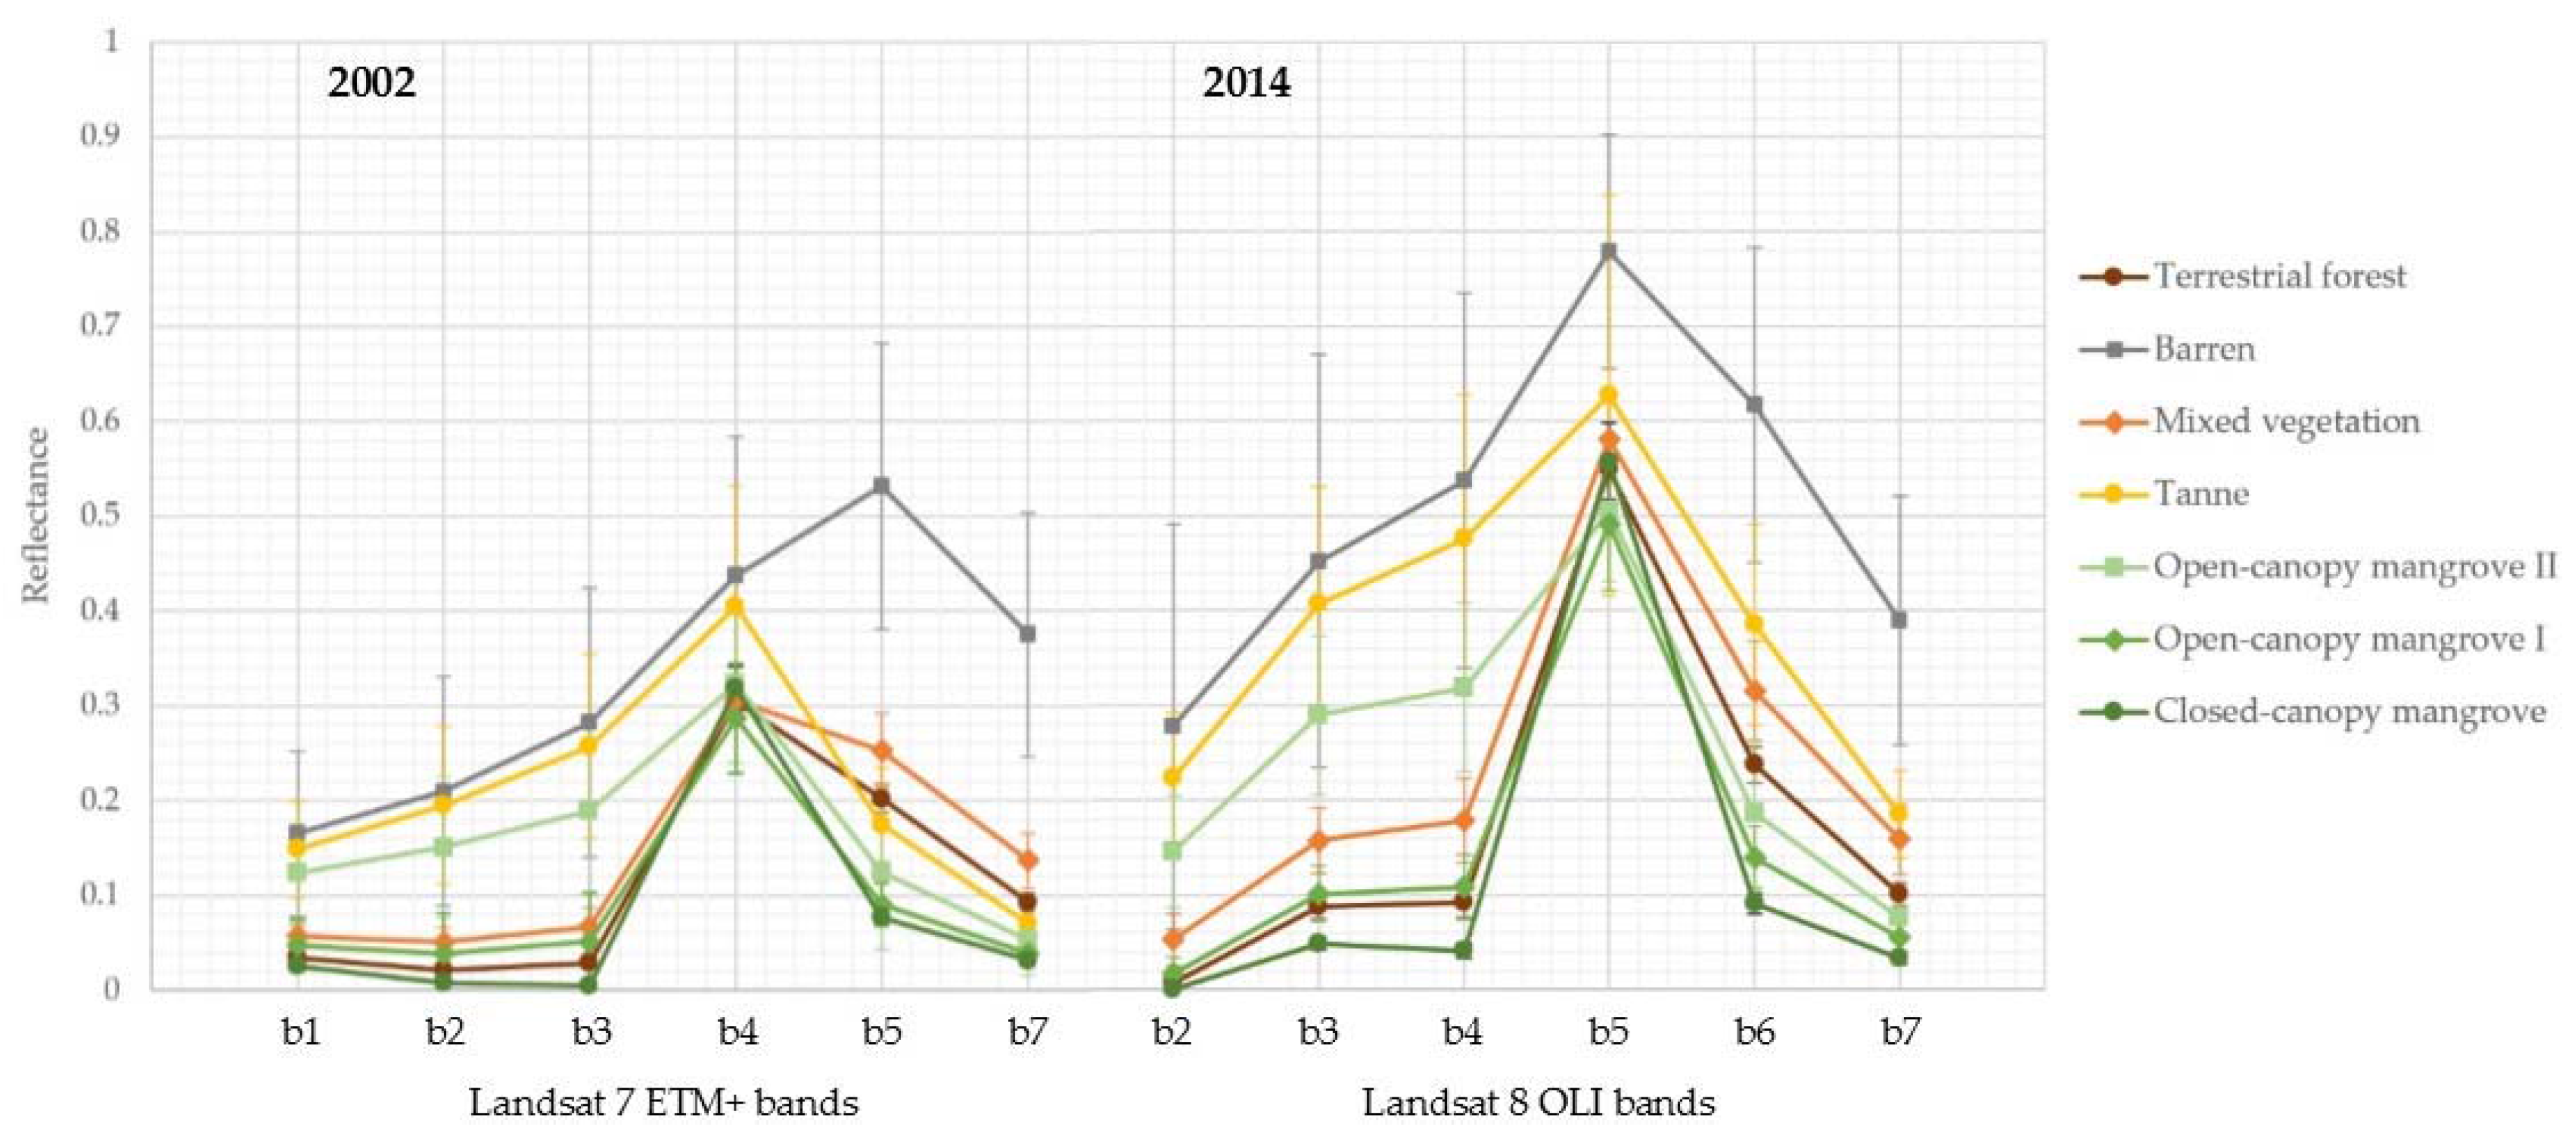
The remote sensing component of this study builds on the work of Jones et al. [24], who present a land-cover classification for Helodrano Fagnemotse derived from a Landsat image acquired in April 2014 and analyze mangrove dynamics between 1990 and 2010 within the bay using national-level mangrove distribution maps derived from Landsat data by Giri [29]. As discussed in Jones et al. [24], while offering unprecedented national-level coverage, the data produced by Giri [29] have only limited applicability at the local scale and, given that at the time of writing the primary data were captured over 6 years ago, also fail to capture recent patterns of mangrove gain or loss. This study further refines the 2014 classification presented in Jones et al. [24] and replicates the methodology using a Landsat image acquired in April 2002, enabling a contemporary, localized analysis of mangrove dynamics within the bay between 2002 and 2014.

2. Materials and Methods

2.1. Study Area

Helodrano Fagnemotse is a modest and contiguous mangrove ecosystem contained within a single bay inside the boundaries of the Velondriake Locally Managed Marine Area (LMMA) on the southwest coast of Madagascar [24] (Figure 1). Velondriake spans 620 km2 and includes seagrass habitats and coral reefs in addition to its mangroves. With a dry season that can last up to 11 months and an average annual rainfall of less than 36 cm, the southwest of Madagascar is one of the most arid areas of the country.
Comprising 10 villages, Helodrano Fagnemotse plays host to an estimated population of 3700 people. The coastal communities of Velondriake are almost entirely dependent on small-scale fisheries with 87% of adults employed within the sector [30]. In one of the poorest countries in the world, small-scale fisheries resources are vital in sustaining local livelihoods in remote coastal regions such as this, providing a daily household income of US$2.13 in Velondriake, just $0.13 above the international poverty line [30]. Destructive and unsustainable forest and fisheries harvesting practices by a rapidly growing population is putting increased strain on marine resources [30,31,32]. In particular, mangroves in Helodrano Fagnemotse are harvested for building materials and for use in the construction of kilns to produce lime [31,33].

2.2. Carbon Inventory Methods

2.2.1. Inventory Design

The carbon stock inventory was conducted over two field seasons conducted in November 2014 and August 2015. Plots were determined through random stratified sampling and final sample size was calculated using the known intra-strata variation obtained during the first sampling session and following the methods outlined by Pearson et al. [34]. The 2014 Landsat classification detailed in Jones et al. [24] was used to define the classes and the ‘Create Random Points’ tool in ArcMap 10.1 (© ESRI, Redland, CA, USA, 2014) was used to map potential plot locations in each class.
In addition to reporting the carbon stocks of the mangroves of Helodrano Fagnemotse, another aim of this study was to estimate the carbon footprint of anthropogenic mangrove deforestation within the study area. While three mangrove classes were distinguished by Jones et al. [24], due to its shrubby nature, the open-canopy mangrove II class is not a target of subsistence or commercial harvesting practices [33]. For this reason, the open-canopy mangrove II class was not incorporated into the carbon stock assessment.
Plots close to class boundaries/transitions were excluded, to ensure the field data accurately represented the class, and high resolution imagery in Google Earth (© Google, 2016) were used to remove plots that were clearly misclassified due to map error. Accordingly, a total of 56, 20 × 20 m plots were sampled (Figure 2).

2.2.2. Tree Biomass

For each plot, aboveground and belowground tree biomass and soil carbon were measured following methods laid out by Kauffman and Donato [35]. The species, diameter at breast height (dbh) and tree height were recorded for each tree rooted within each plot. Where necessary, adjustments were made to dbh measurements e.g., by measuring 50 cm above the highest prop root. Species specific allometric equations were chosen based on the region in which they were developed. The parameters used to derive them and have previously been reported, along with wood density values, by Jones et al. [25,27]. Belowground biomass was estimated using the standard equation by Komiyama et al. [36]. Biomass estimates for standing dead wood were made according to the decay classes determined by Kauffman and Donato [35], which take into account loss of biomass at different stages of decay. A density of 0.69 g·cm−3 was used to calculate dead tree biomass from its estimated volume. Tree biomass was summed at the plot level and normalised for the plot area to calculate biomass density (Mg·ha−1). The mass of carbon was calculated by converting biomass to carbon using the conversion factors 0.5 and 0.39 for above and belowground estimations, respectively [35]. The decision was made to exclude downed wood from field surveys as in other, ecologically similar, mangrove ecosystems throughout East Africa, this component has been found to constitute under 1% of total C stocks [26] and was therefore, not deemed to be significant.

2.2.3. Soils

Soil depth was measured to a maximum depth of 3 m at five points within each plot and the average depth calculated. The soil was sampled to a maximum of 200 cm using a 1 m long stainless steel gauge auger of 22.95 cm2 cross-sectional area. Within the first 100 cm of soil, 5 cm subsamples were extracted from the centre of four intervals; 0–15 cm, 15–30 cm, 30–50 cm, 50–100 cm. Where possible, a further sample was obtained within a 100+ cm interval. Following each field season, the samples were oven dried to constant weight at 60 °C. The bulk density (g·cm−3) of each sample was calculated as the mass of the sample divided by the known volume of the sample. Organic matter content of the samples was determined using the loss on ignition procedure whereby the dry samples were heated overnight at 400 °C [35]. Organic matter values were divided by a factor of 2.06 [35,37] to estimate the organic carbon content of the soil. It has been recognised that the range of organic carbon content of organic matter can vary greatly both within and between study sites, indicating shortcomings and potential error implications of using the loss of ignition procedure without correcting values to dry combustion results [35]. However, without the ability to conduct dry combustion analysis on samples and in the absence of a site-specific conversion factor, this value was deemed the most appropriate for use in this study.

2.2.4. Ecosystem Carbon Stocks

Total ecosystem carbon stocks were calculated by summing estimates of each component carbon pool for each forest classification and scaling up values for the area covered by each. The total values were then summed and the 95% confidence interval calculated [34,35].

2.2.5. Statistical Analysis

A one-way analysis of variance (ANOVA) was used to test the differences in the above and belowground carbon stocks, and the ecosystem carbon stocks of the open I- and closed-canopy mangrove. A post-hoc Tukey test was used to determine where means were significantly different. Additional, ANOVA tests were used to assess whether bulk density, carbon concentration and carbon density values significantly decreased with soil depth. Prior to statistical analysis, the data were examined using the Shapiro–Wilk’s and Levene’s test for normality and homogeneity of variance, respectively. Where required, in order to meet the assumptions of ANOVA, data were natural log transformed. A p value of 0.05 was applied to determine statistical significance.

2.3. Remote Sensing Methods

The applicability of Landsat data for mapping the distribution and ecological characteristics of mangroves at global [20], national [24,38,39,40] and—despite its moderate, 30 m spatial resolution—localised [27,41,42] scales is well proven. With an archive stretching back to the 1970s [43], Landsat data are also ideal for analysing and monitoring the dynamics of wetlands and their surrounding ecosystems [44,45,46,47]. The fact that the data are freely available to the general public also makes them a cost-effective choice for the academic and not-for-profit sectors.
In order to map the mangroves and surrounding ecosystems within the study area and investigate mangrove dynamics within Helodrano Fagnemotse, two Landsat images were downloaded from the United States Geological Survey’s Earth Explorer portal [48] (Table 1).
The 2014 image is the same as that used by Jones et al. [24]. The 2002 image was chosen because it provides cloud-free data across the entire study area and was captured within the same month of the year (April) as the 2014 data, thus minimising the potential for atmospheric and seasonal variations to impact the dynamics analysis. Another environmental variable that is of critical importance to mangrove remote sensing studies is tidal height [49]. The strong spectral absorbance of water can lead to changes in vegetation pixel classifications between images from different dates with significantly differing tidal heights/levels of water inundation, even in cases where there are no significant changes in the physical characteristics of the vegetation. By selecting two images with similar tidal heights, the aim was to decrease the probability of such classification confusion and minimise erroneous areas of gain/loss in the resulting dynamics analysis.
Pre-processing of the Landsat images followed the procedure outlined in Jones et al. [42]. The Cost(t) model [50] was employed to estimate the effects of atmospheric absorption and Rayleigh scattering, remove systematic atmospheric haze, and convert the images’ units to at-surface reflectance. While the surrounding terrestrial ecosystems were of interest, particularly for the dynamics analysis, the focus of this study was mangrove. Consequently, in order to simplify the spectral space and minimise processing time, both images were masked to include only pixels within 7 km of the coastline and with an elevation above sea level of 30 m or less, using the Shuttle Radar Topography Mission (SRTM) digital elevation model. All image processing was performed using the Idrisi Selva (Clark Labs, 2015).

2.3.1. Land-Use and Land Cover Classifications

In order to map land-use and land cover classes within the study area, the iterative, ISOCLUST/maximum likelihood unsupervised/supervised classification methodology detailed at length in Jones et al. [42] was replicated. This protocol is well tested and published for mangrove mapping applications in Madagascar [26,41] and as such is only summarized here.
Using the ISOCLUST classification algorithm, an unsupervised classification was performed on both images. Landsat 7 ETM+ bands 1–5 and 7, and the equivalent Landsat 8 bands 2–7 were used as inputs. The aim of these initial classifications was to define spectrally and ecologically distinct classes, refining the classes defined in Jones et al. [24]. Contextual ecological information gathered during the 2014 and 2015 field missions described in Section 2.1 along with high spatial resolution imagery available in Google Earth (© Google, 2016) were used to aggregate and define the finalized land-cover classes (Table 2; Figure 3).
Not included in this list, but also differentiated by the ISOCLUST algorithm as a spectrally distinct stratum and included in Jones et al. [24], was an inundated/water dominated class. While not of interest to this study, this class was used to mask water dominated areas within the study area prior to supervised classification. As stated above, differing tidal heights can cause classification confusion and thus erroneous errors in both the finalized maps and any consequent dynamics analyses. For this reason, the inundated layer of the image with the higher tidal height (2014) was used to mask both images. This also ensured that the area of analysis for each image was identical. While this process likely resulted in the masking of some ocean-fringing mangroves, one consequence of this that is beneficial considering the link between this work and the development of a carbon project, is that the aerial extents and thus the resulting landscape carbon estimates are conservative. Figure 3 shows this finalized mask.
The barren/exposed class featured in Jones et al. [24] was partitioned into two classes; barren and tanne—the latter representing the open mud flats that commonly fringe the mangroves in the study area. One of the objectives of this refinement was to improve distinction between the open-canopy classes and the unvegetated classes.
Following this masking and the definition of the classes listed in Table 2, a supervised maximum likelihood classification was performed on both images. The applicability of the maximum likelihood algorithm to mangrove classification exercises is well documented [47,51,52,53,54]. Spatially and temporally invariant calibration (total = 79) and validation (total = 31) areas were established for all classes using Google Earth and ecological context gathered during the 2014 and 2015 field seasons (Table 2; Figure 4). Each of these areas were 3 × 3 Landsat pixels in size (90 m × 90 m or 8100 m2). The calibration areas were used to train the maximum likelihood algorithm, while the validation areas were used to test the accuracy of the resulting maps using confusion matrices and Kappa indices of agreement, the latter of which assesses the extent to which the classifications are better than random [55].

2.3.2. Mangrove Dynamics Analysis

The two finalized classifications were used to conduct a class loss/gain analysis in ENVI version 4.7 (ITT Visual Information Solutions, Boulder, CO, USA, 2009). The finalized classification raster files were exported from TerrSet to the GeoTIFF format and imported into ENVI. The change detection modules of the ENVI software package were used to quantify the dynamics of each class between 2002 and 2014. The numerical analysis was augmented by visual examination of the classifications, to establish spatial trends and patterns.

3. Results

3.1. Carbon Inventory Results

3.1.1. Vegetation Carbon

Although up to six of the eight mangrove species found in Madagascar have been identified previously by trained local community members within Helodrano Fagnemotse, only four species were recorded during this inventory; Avicennia marina (Forsk.) Vierh., Bruguiera gymnorrhiza Lam., Ceriops tagal (Perr) CB.Rob and Rhizophora mucronata Lam. Of these species, C. tagal and R. mucronata were the most consistently distributed and dominant species in the study area, dominating 69% and 20% of total plots respectively. A. marina and B. gymnorrhiza dominated only 6% of total plots each, which were contained within the open-canopy mangrove I forest (Table 3).
Levels of mangrove exploitation were high throughout the study area with 91% of plots containing the stumps from cut trees. Within C. tagal dominated, closed-canopy mangrove areas where tree density and tree height were highest (Table 3) stump density was also higher (1243 ± 223 stumps·ha−1; p < 0.01) than in open-canopy mangrove I areas (679 ± 142 stumps·ha−1).
Total vegetation carbon ranged from 4.87 Mg·C·ha−1 in the open-canopy mangrove I to 127.95 Mg·C·ha−1 in the closed-canopy mangrove area. Mean vegetation carbon in the taller and denser, closed-canopy mangroves was found to be significantly higher (73.90 ± 4.60 Mg·C·ha−1; p < 0.01) than in the lower stature and less dense, open-canopy I mangroves (46.23 ± 5.15 Mg·C·ha−1; Table 4; Figure 5). The biomass of standing dead wood contributed to an average of 8% of the total vegetation biomass.

3.1.2. Soils

Mean soil depth was 142 ± 7 cm and showed no significant variation throughout the study area. Bulk density ranged from 0.27–1.72 g·cm−3 with an overall mean of 1.05 (±0.02) g·cm−3 and was higher in open-canopy I areas throughout the depth profile (Figure 6; p < 0.05). Significant differences throughout the depth profile could only be observed between the upper four and the lowest intervals. There was a large range in carbon concentration of 0.31–12.71% with a mean of 3.50 (±0.16) %. As with bulk density, carbon concentration only differed significantly between classes over the top three depth intervals and the only significant differences with depth occurred within the closed-canopy forest. Although there were significant differences in bulk density and carbon concentrations over the sampling depth, upon the multiplication and integration of these values, these differences were reduced. Overall soil carbon density, to the maximum sampling depth of 150 cm, varied significantly between classes (p < 0.01) with closed-canopy areas containing higher stocks (381.02 ± 27.11 Mg·C·ha−1) than open-canopy mangrove I areas (294.63 ± 36.41 Mg·C·ha−1).

3.1.3. Ecosystem Carbon Stocks

Total carbon density from all measured pools combined ranged from 113.17 Mg·C·ha−1 in open-canopy mangrove I areas to 797.48 Mg·C·ha−1 in closed-canopy mangroves. Closed-canopy areas contained significantly higher total carbon density (454.92 ± 26.58 Mg·C·ha−1) than open-canopy mangrove I areas (340.87 ± 38.82 Mg·C·ha−1) (Table 4; Table 5; p < 0.05). Soil carbon stocks were the largest of the carbon pools, containing an average of 86% of total C stocks. The total carbon stock of the 1507 ha of mangroves in the Bay of Assassins, Madagascar, was estimated to be 5.84 × 10⁵ ± 0.35 × 10⁵ Mg·C with the resulting 95% confidence interval equivalent to ± 0.70 × 10⁵ of the overall mean (Table 5).

3.2. Remote Sensing Results

3.2.1. Landsat Classification Results

Figure 7 depicts the results of the unsupervised maximum likelihood classifications of the 2002 and 2014 Landsat data and the confusion matrices shown in Table 6 demonstrate the accuracy of these classifications.
In the 2014 classification, a total of 620 ha of closed-canopy mangrove, 866 ha of open-canopy mangrove I and 295 ha of open-canopy mangrove II were mapped. As in Jones et al. [24], both classifications showed high levels of accuracy, particularly in the vegetation classes, with minimal confusion between the mangrove and terrestrial vegetation classes. With a Kappa index of 0.98, the only observed areas of confusion in the 2014 classification were between the barren and tanne classes. While the 2002 classification resulted in a lower Kappa index of 0.92, 92.8% of the validation regions were correctly classified, including 96% of the closed and open-canopy mangrove I areas. The highest confusion in this image was between the open-canopy mangrove II and the barren and tanne classes. Akin to Jones et al. [24], classification confusion between mangrove and other vegetation classes was largely avoided.
Whilst every effort was made to select spatio-temporally invariant calibration and validation areas, inclusion of such areas due to the lack of high resolution imagery in Google Earth that dates from 2002 is a potential cause of the lower levels of accuracy exhibited by the 2002 map compared to the 2014 results.
The spectral signatures of each class in both the 2002 and the 2014 images are shown in Figure 8. As found by Jones et al. [42], the near-infrared and shortwave-infrared bands (bands 4 and 5–7 in Landsat 7 ETM+; bands 5–7 in Landsat 8 OLI) are of particular relevance for mangrove distinction and classification.
While the spectral signatures of the open-canopy mangrove II, tanne and barren classes exhibit different levels of reflectance, the overall shape of the signatures are similar. One potential cause for the confusion between these classes could be varying levels of surface moisture, which would have decreased levels of reflectance in all bands irrespective of class [56], resulting in spectral similarity between these classes. Whilst every effort was made to select images with similar tidal heights, this does not remove the potential for varying levels of surface moisture across the study area and adds to the complexity of remote sensing analyses in mangrove and coastal environments.

3.2.2. Dynamics Results

With respect to the mangrove classes, over the twelve years from 2002 to 2014 the largest changes in the Landsat-derived maps were observed in the open-canopy mangrove II class, with an apparent net loss of 47.9% (Table 7). However, it is likely that a significant portion of this change was due to confusion between the open-canopy mangrove II, barren and tanne classes. All showed large spatial fluctuations between the two dates, with over 70% of pixels changing classification in both the tanne and open-canopy mangrove II classes. The results suggest that 49.3% of open-canopy mangrove II pixels- or 279 ha- changed from vegetated to barren/tanne over this period. However, as stated in Section 2.2.1, the shrub-like open-canopy mangroves II are rarely a target of human-induced mangrove deforestation [33]. Whilst natural mortality is another potential explanation for this loss, no extensive areas of erosion, retreat or natural dieback were noted during either the 2014 or 2015 field seasons and there have been no reports of such areas by local residents. Therefore, it is concluded that this loss is an artifact of the confusion between the open-canopy mangrove II class and the bare ground classes.
The dynamics of the closed-canopy and open-canopy mangrove I classes highlighted some interesting trends. Between 2002 and 2014, 22.4% or 162 ha of closed-canopy mangroves transitioned to open-canopy mangrove I. Additionally, 9.7% of open-canopy mangrove I transitioned to open-canopy II.
The dynamics analysis further underscored the accuracy of the closed-canopy and open-canopy mangrove I classes, with no changes from closed-canopy mangrove to either of the terrestrial vegetation classes—a transition not seen on the ground—and only 0.25% of open-canopy mangrove I transitioning to terrestrial vegetation.
Combining these figures to assess net changes in the mangrove classes resulted in a net loss of 15.11% or 321 ha between 2002 and 2014, if all three mangrove classes were included in the calculation (Table 8). Excluding the open-canopy mangrove II class from these equations, given the aforementioned inconsistencies in these data, resulted in a more conservative net mangrove loss of 3.18% or 49 ha over the same period, implying an average annual net loss of 0.264% within Helodrano Fagnemotse.
The spatial distribution of the loss, gain and persistence of the closed-canopy and open-canopy I classes is shown in Figure 9.

4. Discussion

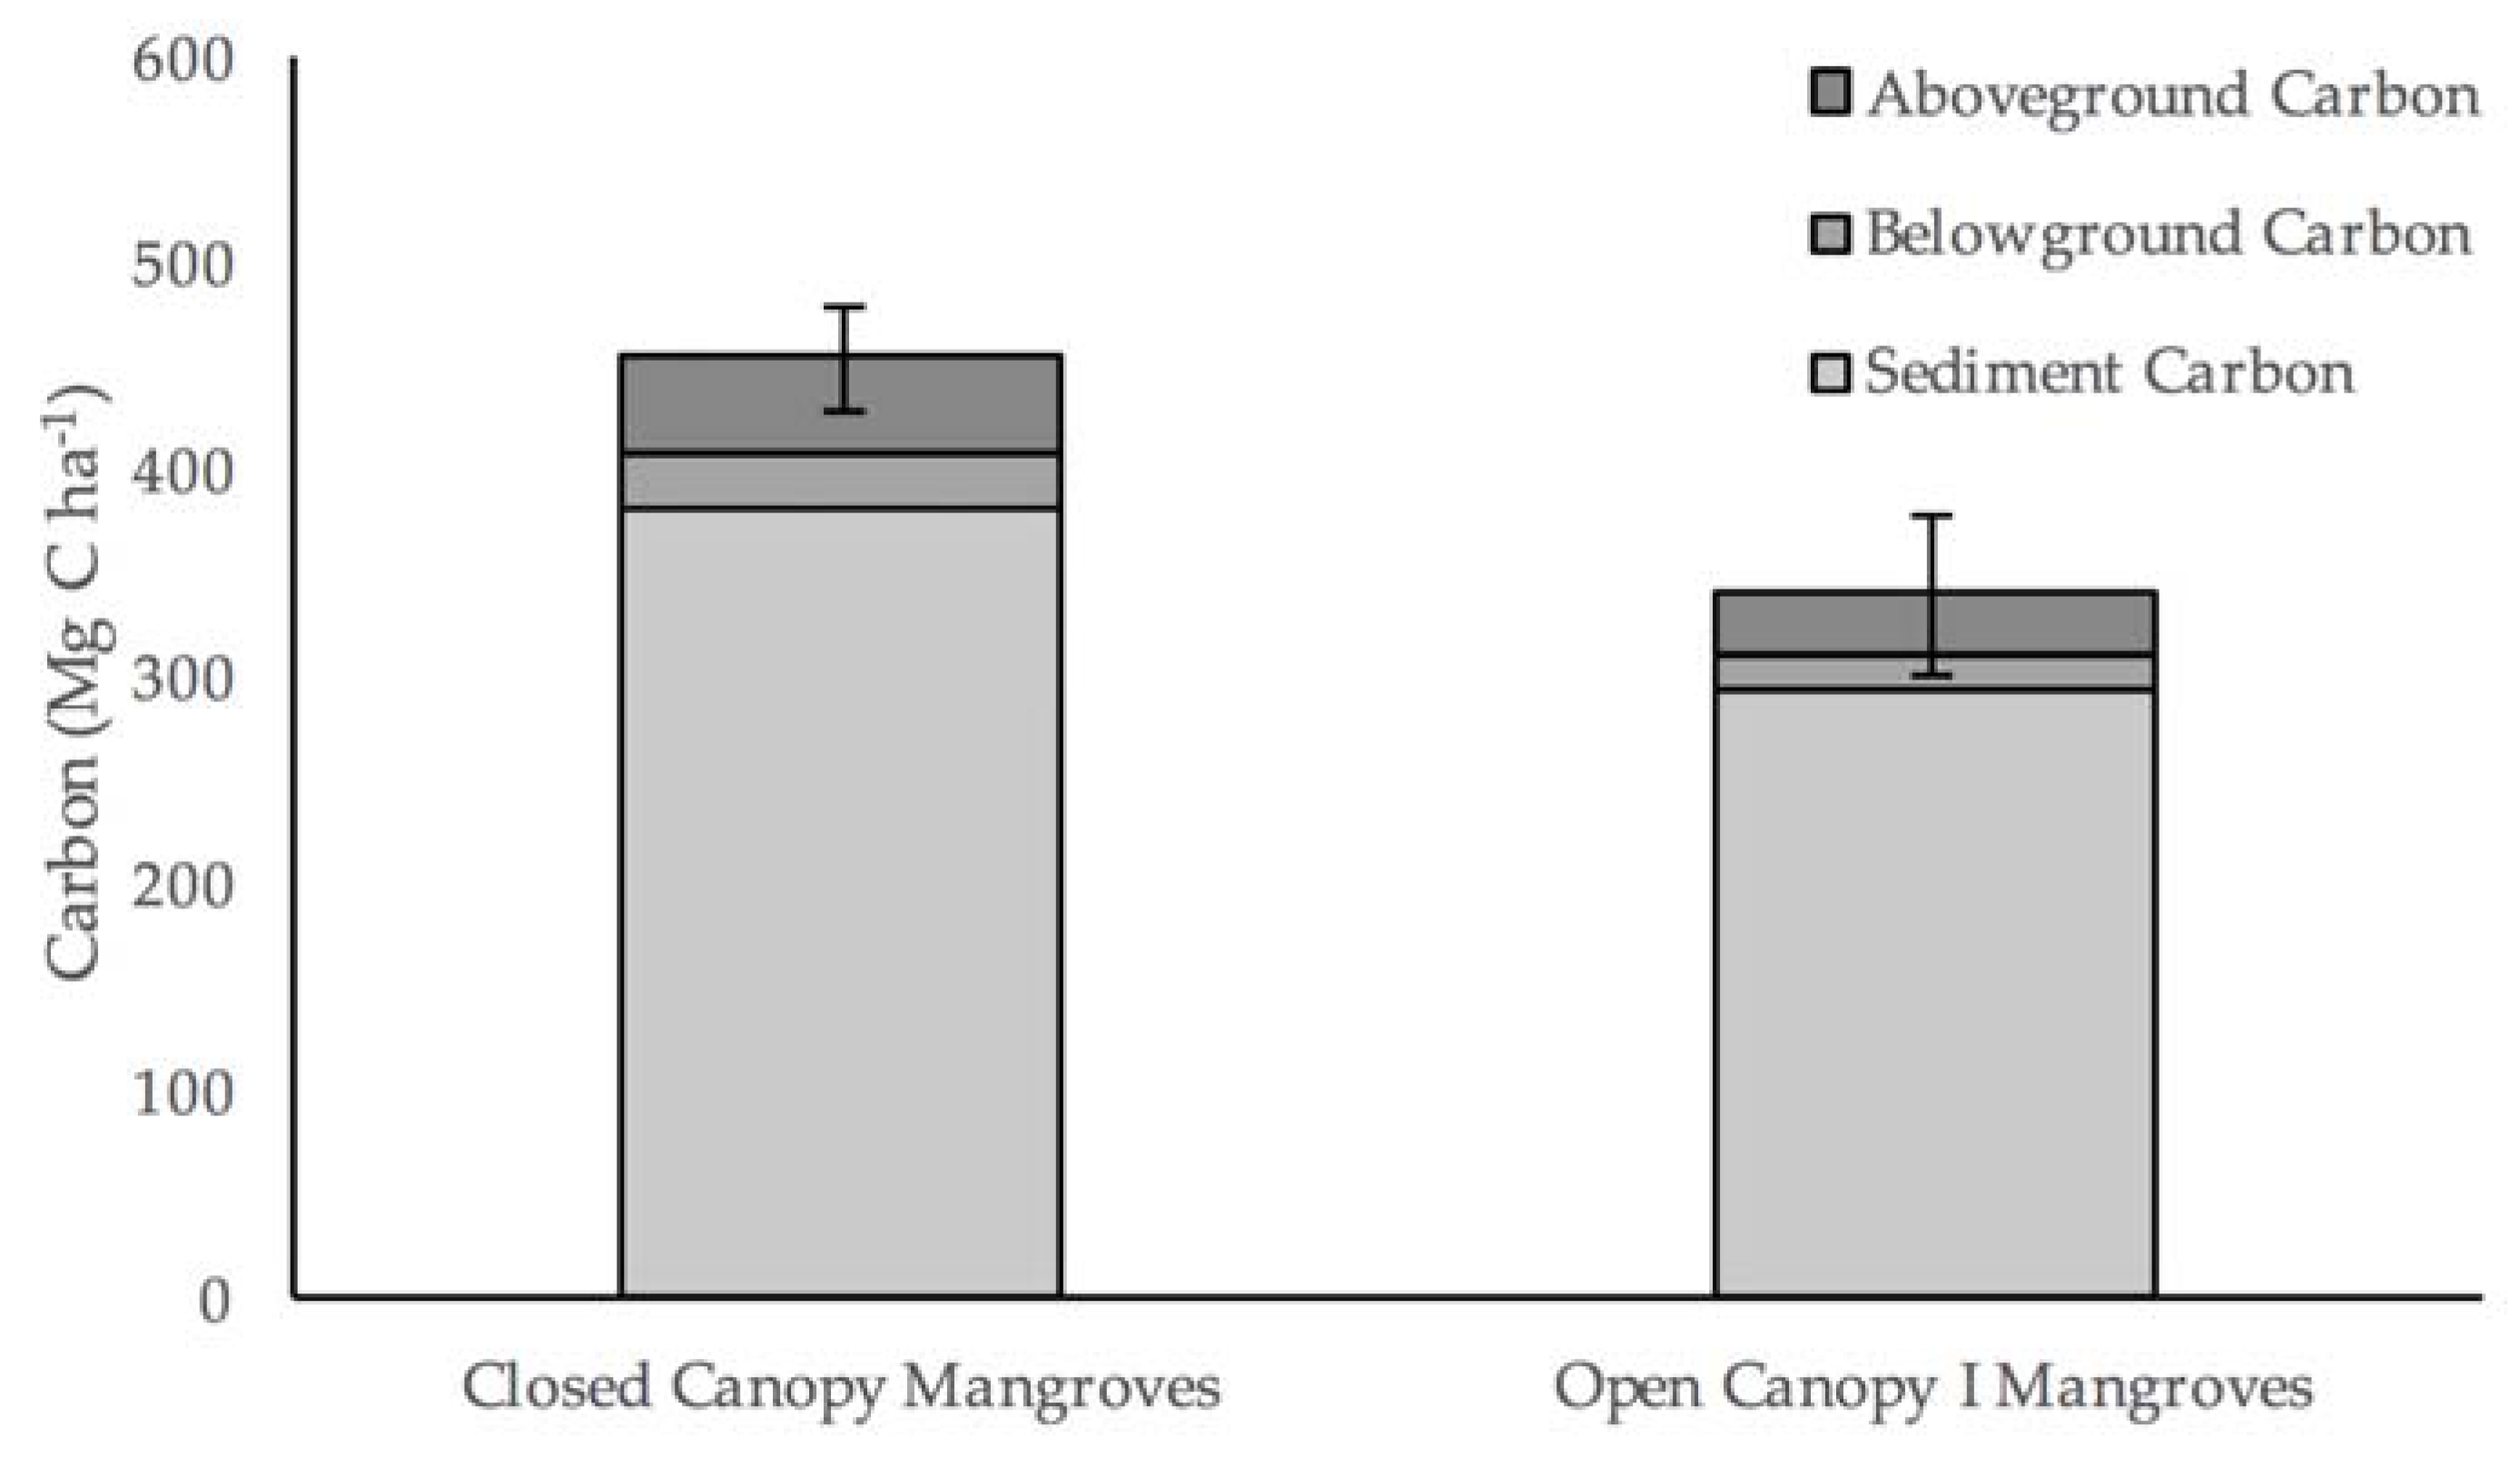
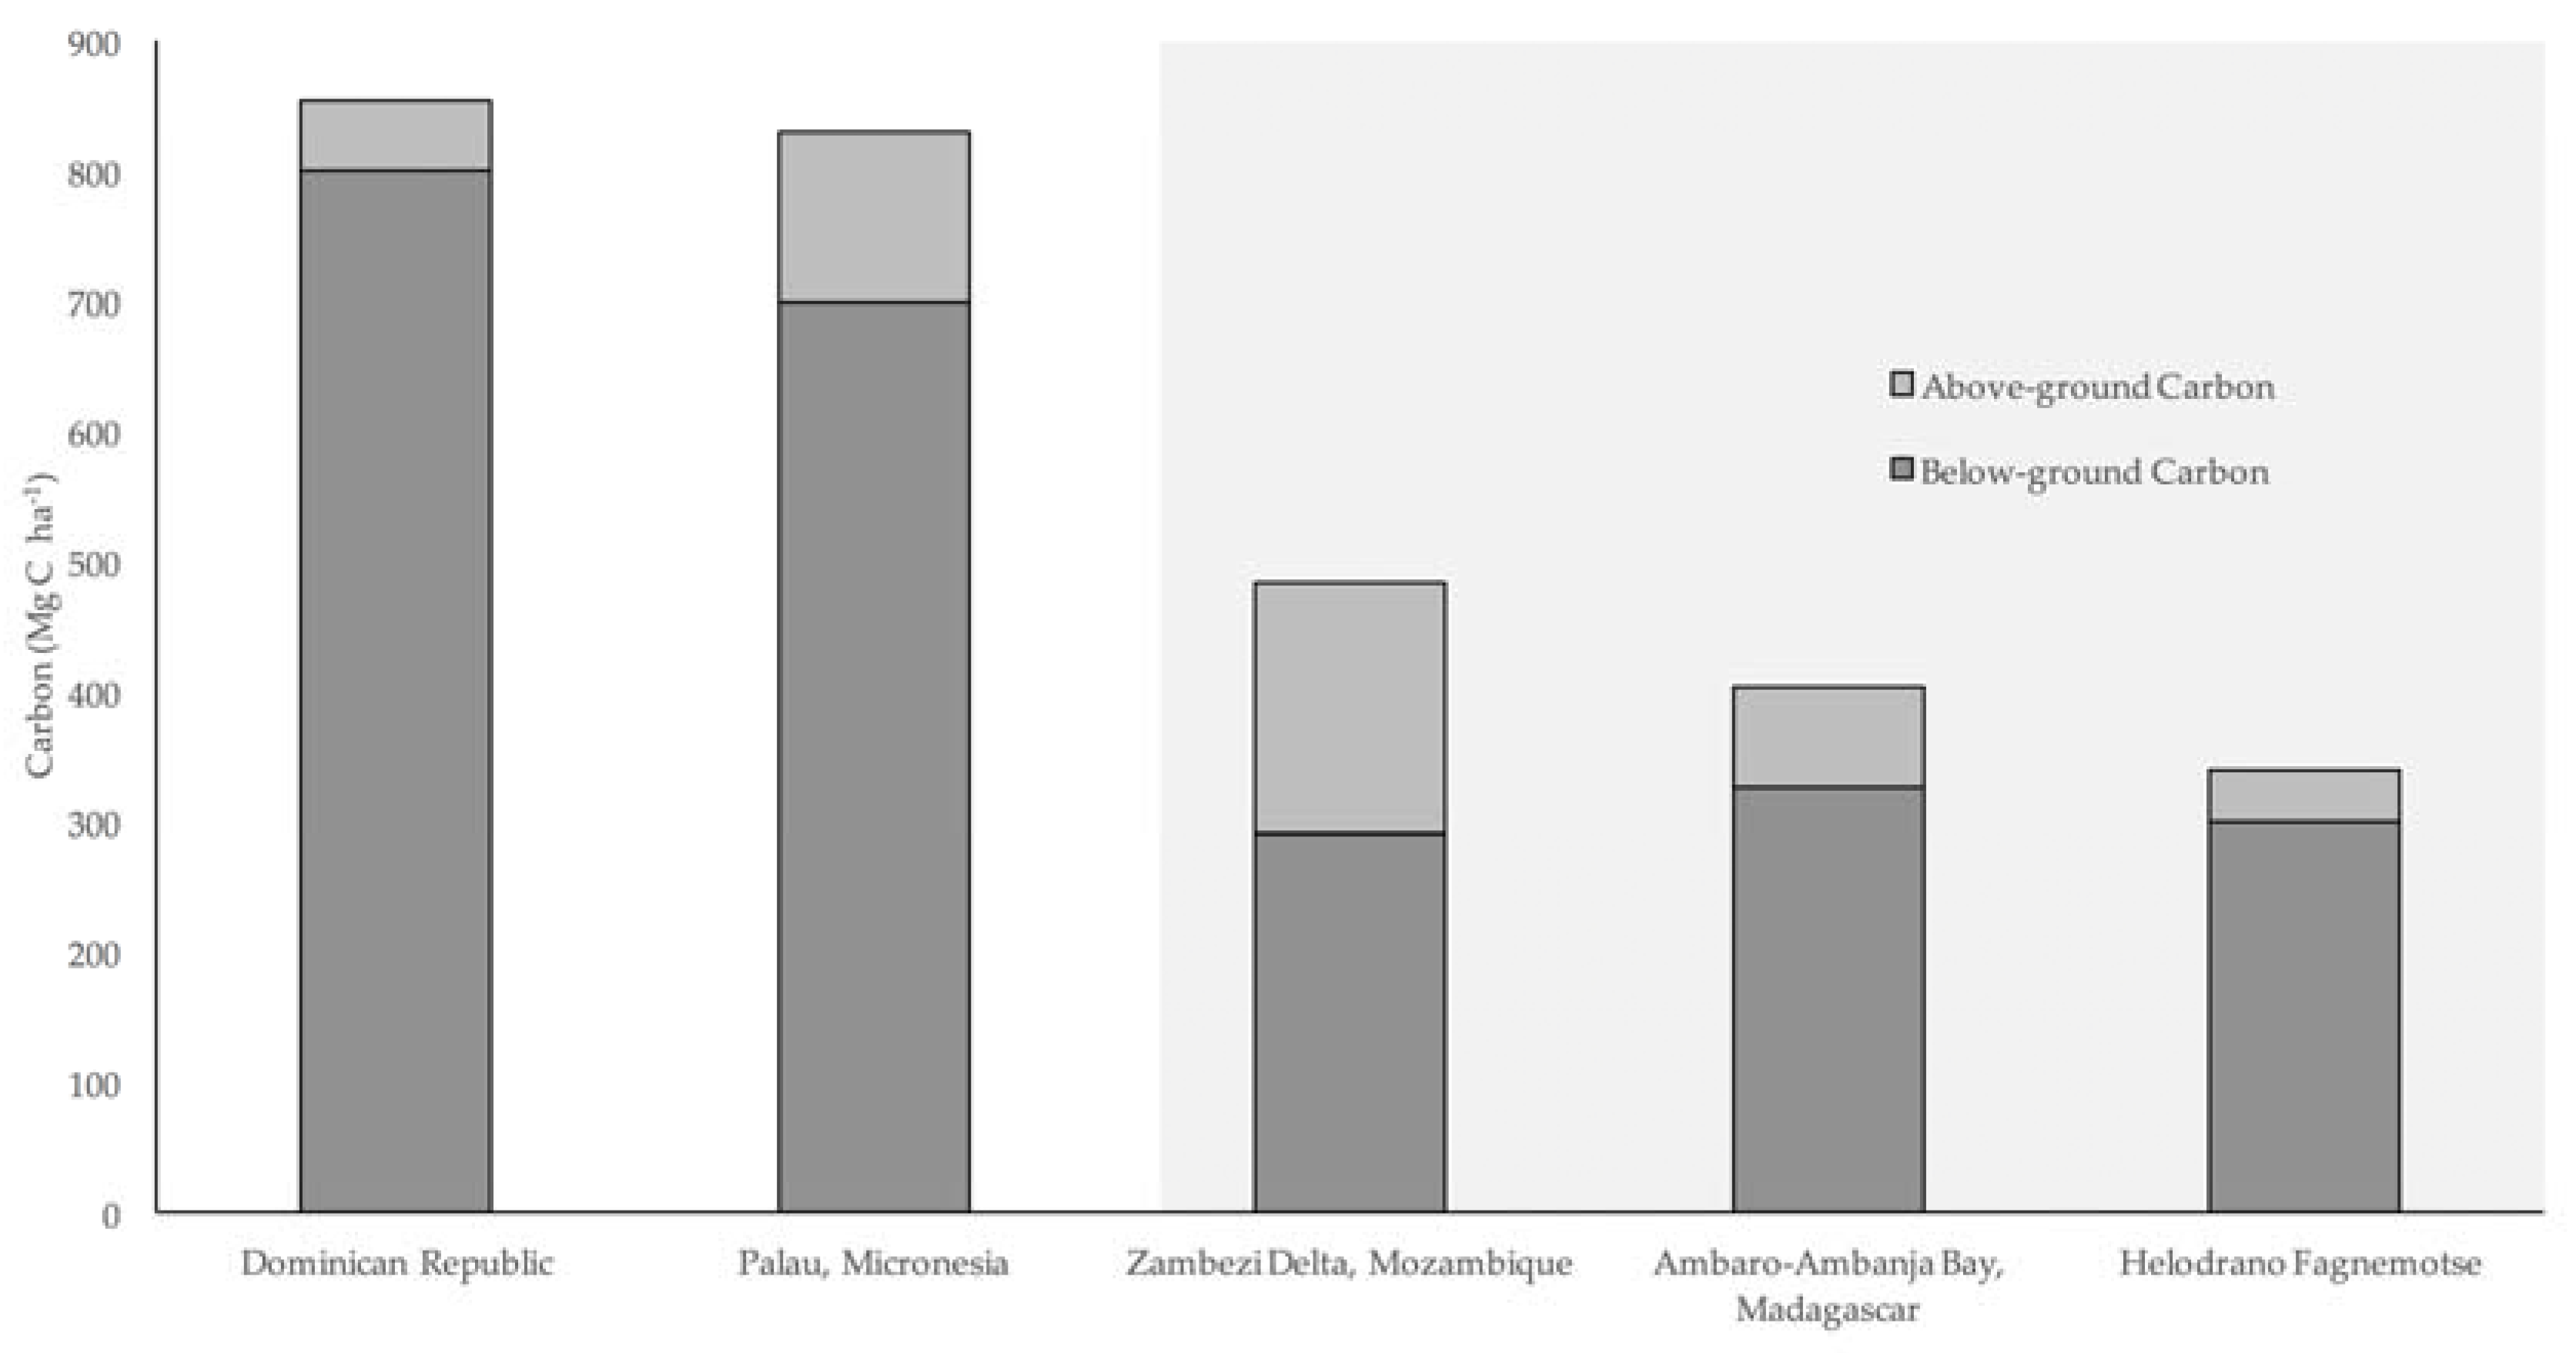
Total carbon stocks within both mangrove classes in Helodrano Fagnemotse were substantially lower than the global mean of approximately 965 Mg·C·ha−1 [57]. Although soil carbon stocks were comparable, total carbon stocks were also lower than values estimated by other mangrove carbon inventories carried out in East Africa in recent years [25,26] (Figure 10). The difference in total stocks is mostly due to lower vegetation carbon values owing to the comparably smaller stature of mangroves in Helodrano Fagnemotse, which is most likely due to the climatic differences between the study areas. Due to the arid nature of the southwest region of Madagascar, this mangrove system receives less rainfall and is likely to be more saline in nature, both of which are environmental parameters that have previously been shown to impact mangrove productivity [11,57,58,59].
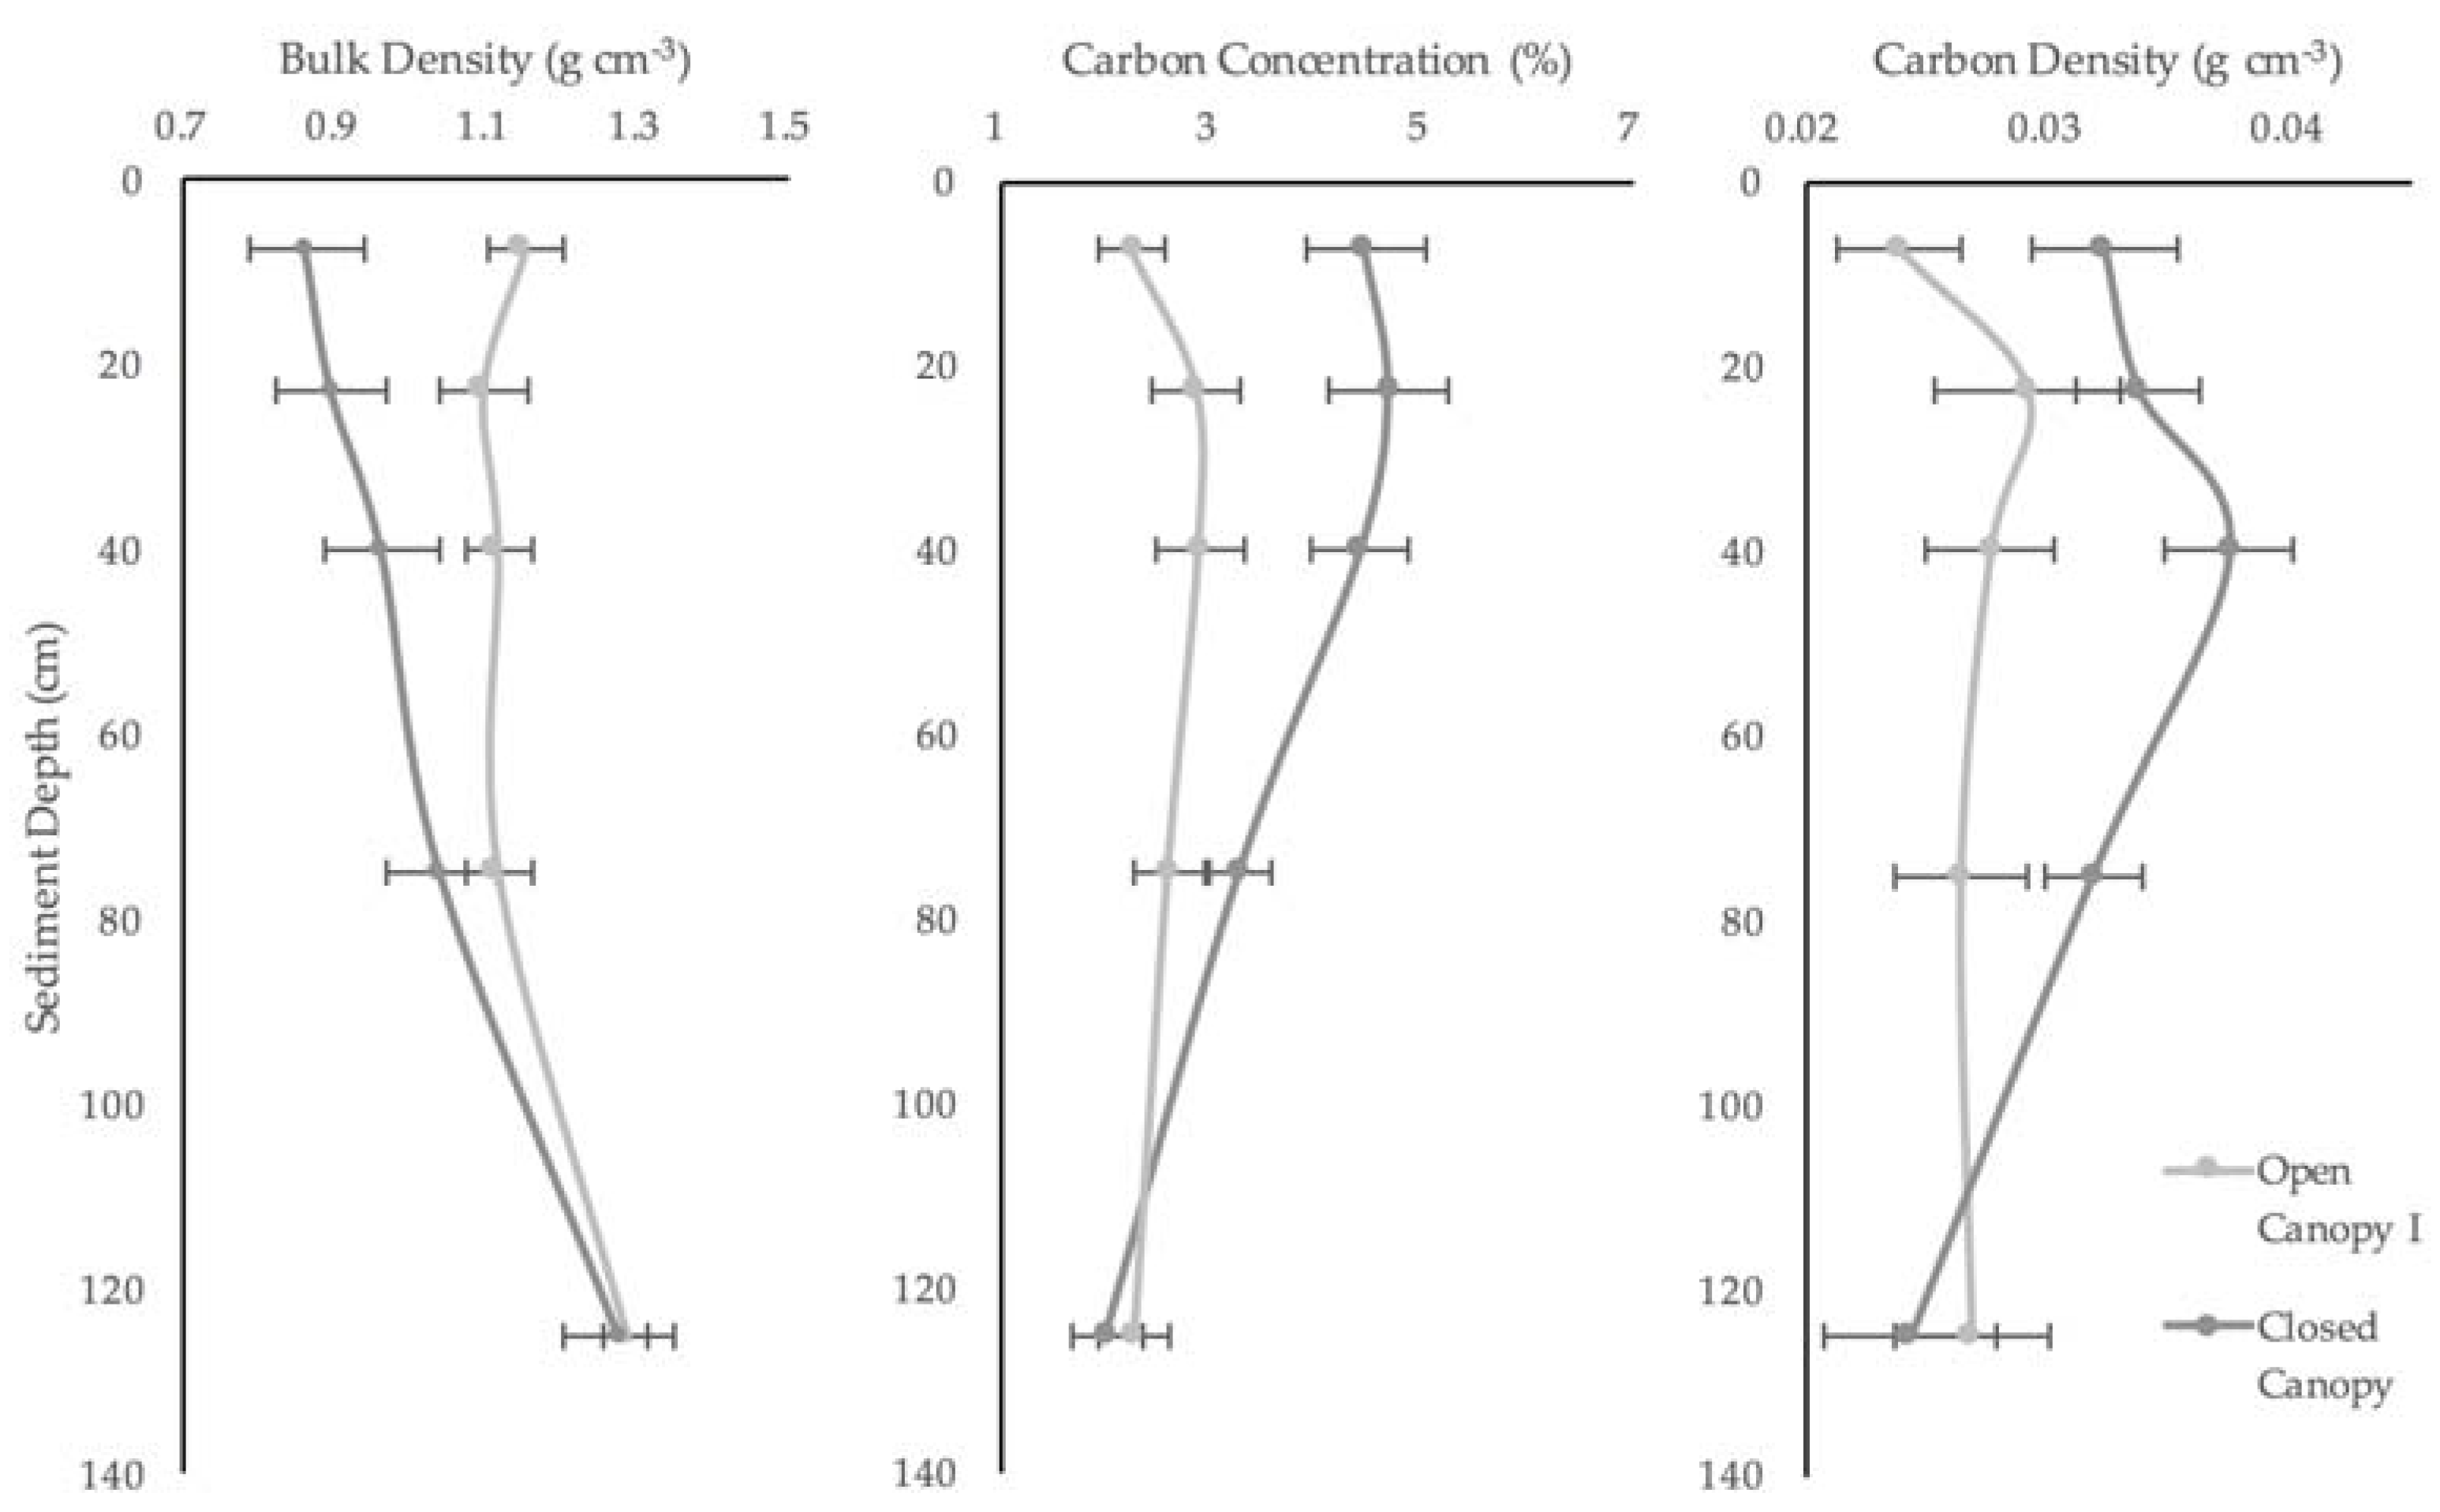
The percentage of total carbon stocks made up by soil stores falls into the reported range of 49–98% [9]. Similarities within the Western Indian Ocean region as well as at the global scale were apparent in soil characteristics where mean carbon concentration fell within the global range of 2–5% [60]. Bulk density values were estimated at the higher end of other reported values [37,42,61] but were similar to other studies in the region [26,61], which is likely due to the high mineral content of the soil in the area.
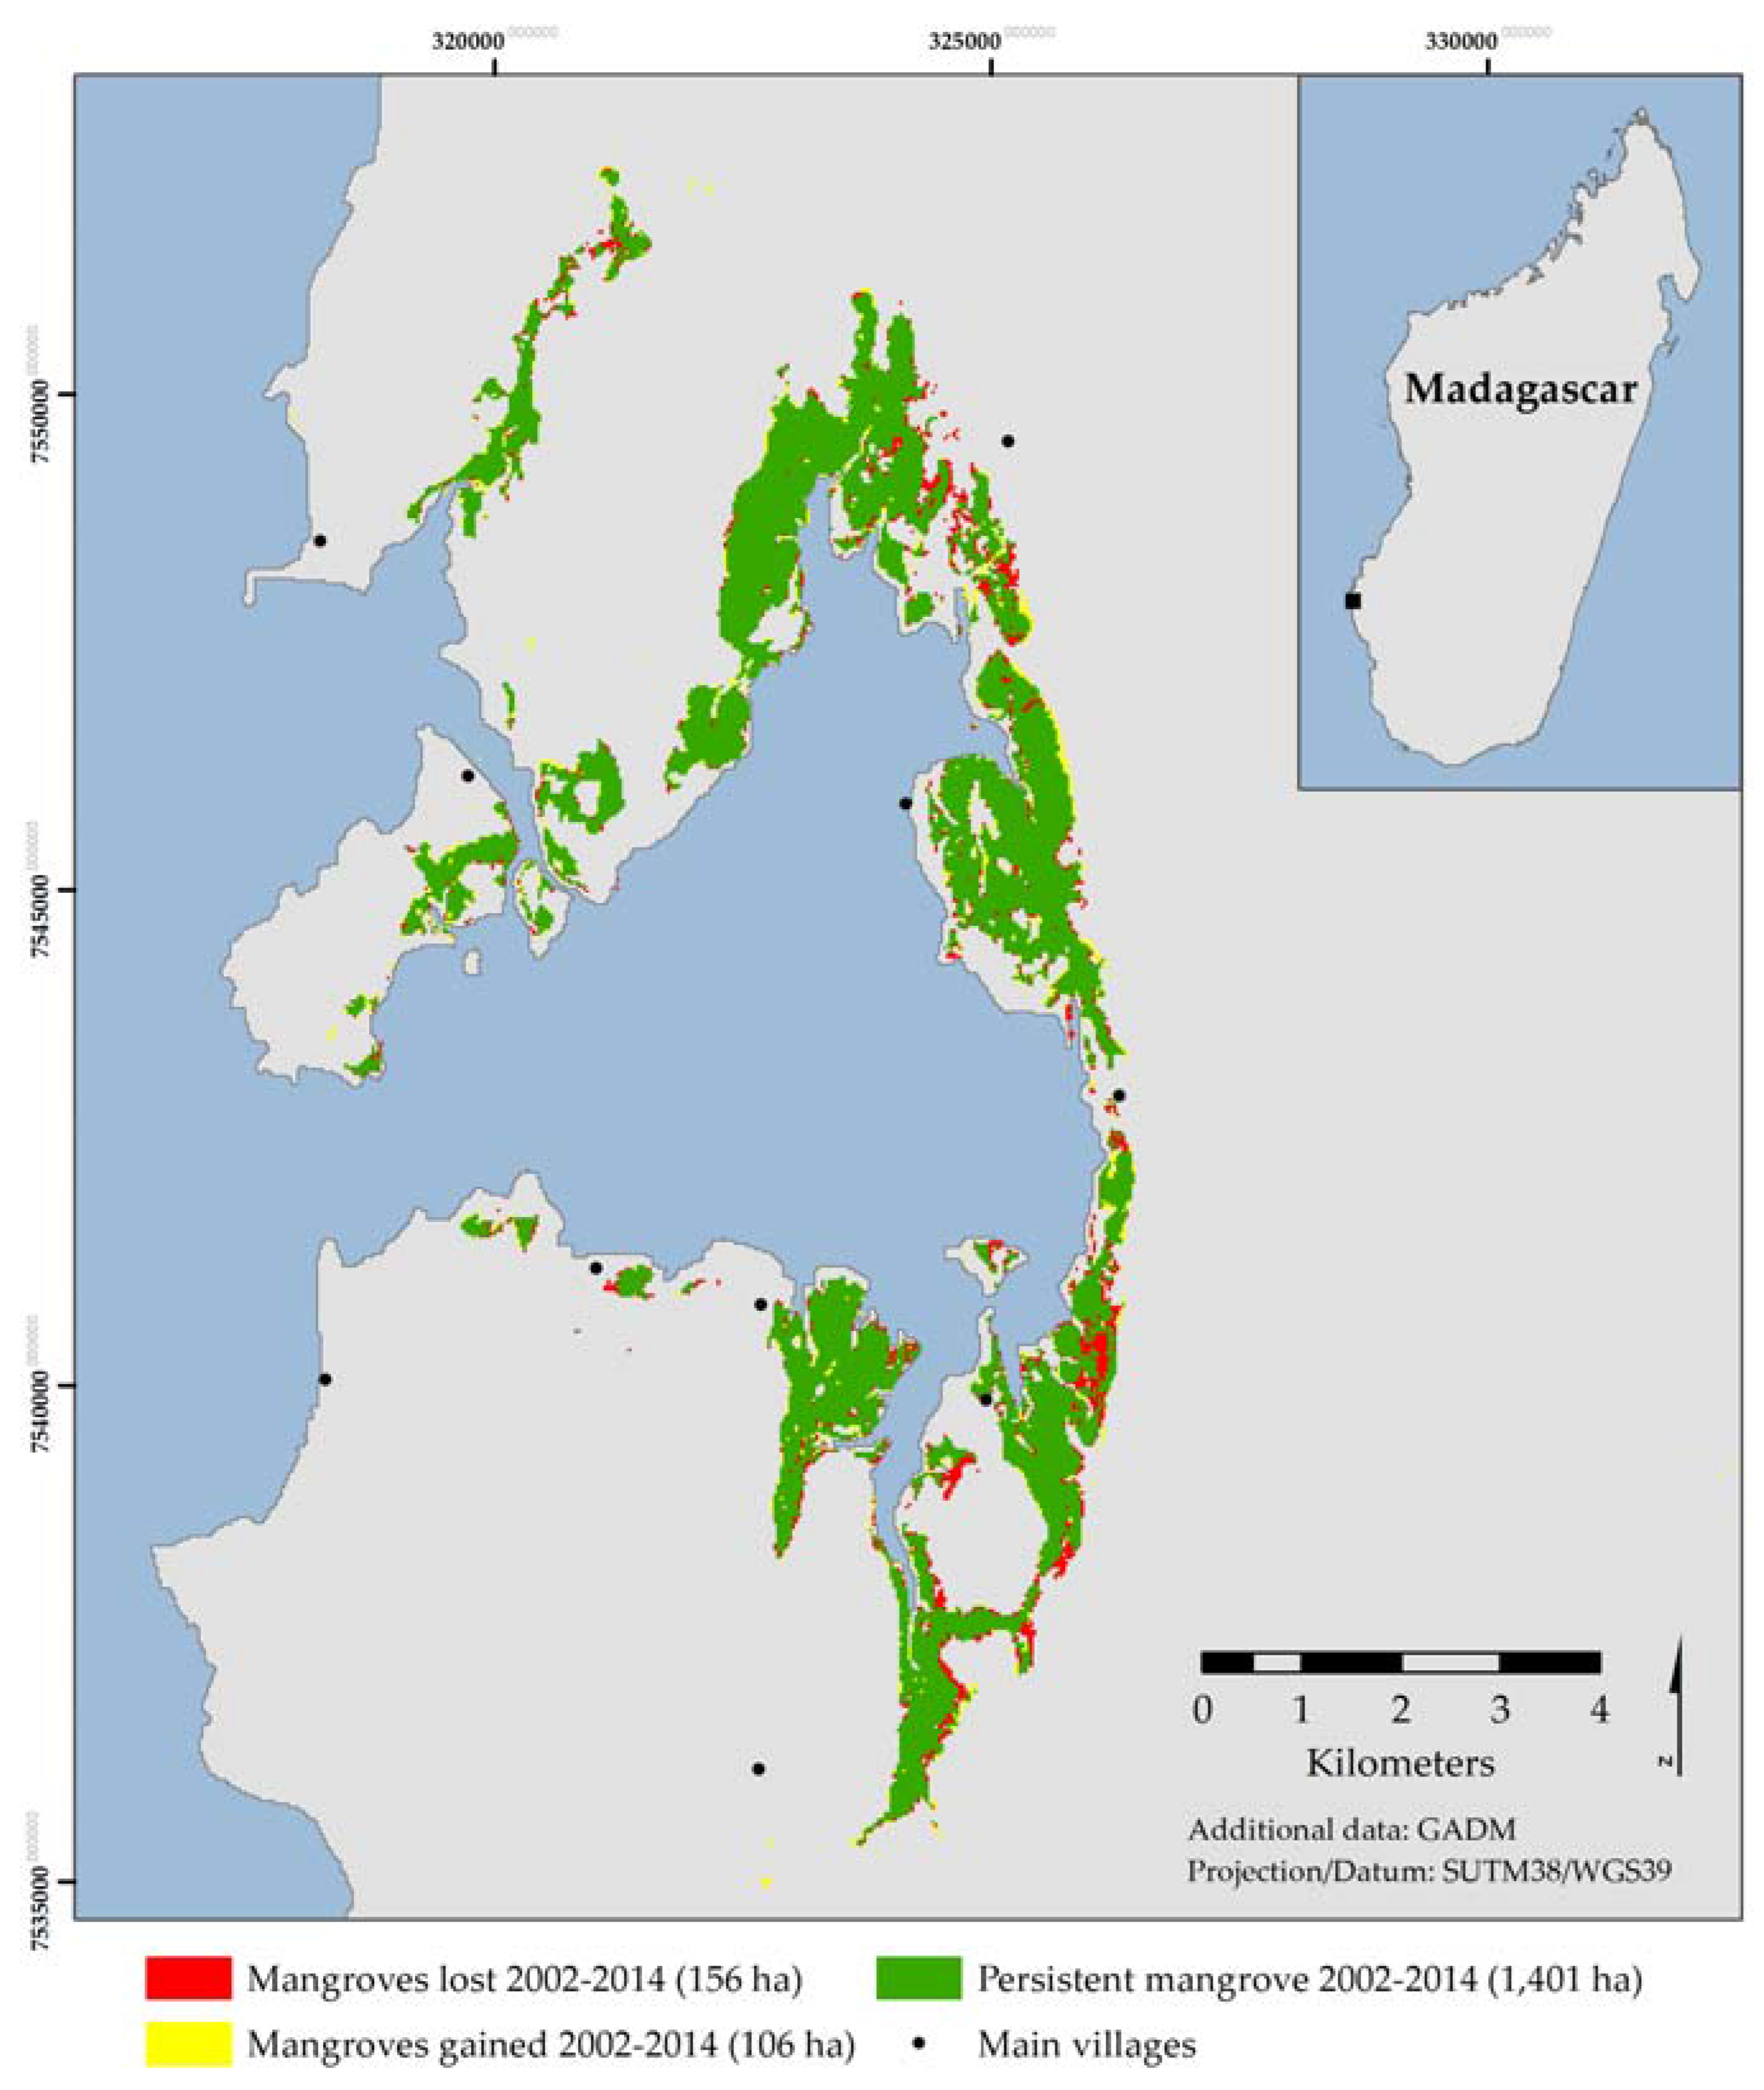
Although total carbon stocks were found to be lower than other studied mangrove systems, the mangroves of Helodrano Fagnemotse are clearly an extremely important resource for local coastal communities, which was highlighted by the evidence of mangrove loss observed in both the remote sensing and inventory data analyses. The remote sensing analysis indicated an overall net loss of 3.18% between 2002 and 2014. This is comparable to losses reported in Mahajamba Bay [27], but substantially lower than those estimated in the Ambaro-Ambanja Bays in northwest Madagascar [24,25]. However, because the net loss figures only account for total deforestation—mangrove classes transitioning to non-vegetated classes—these figures alone do not accurately reflect the extent of mangrove exploitation within the bay. The dynamics analysis highlighted that 22.4% of closed-canopy mangroves transitioned to open-canopy mangrove I between 2002 and 2014 and a further 9.7% of open-canopy mangrove I transitioned to the more sparse open-canopy mangrove II. These trends suggest widespread, extensive degradation, an observation which is further reinforced by the high stump densities recorded during the carbon inventory surveys, particularly in the denser, taller, closed canopy C. tagal dominated plots. Similar observations were also made by Scales et al. [31] who found that 28.7% of trees in 60 randomly selected plots within Helodrano Fagnemotse showed signs of harvesting.
This study focusses on the regulating, carbon storage service that mangroves provide, however, the observed, decreasing mangrove ecosystem health is likely to have a negative impact on the ability of the system to provide additional services that are of importance to coastal communities in the immediate-term e.g., coastal protection and supporting commercially important fisheries [57,64,65]. Approximately 80% of global fisheries are either directly or indirectly dependent on mangroves [17]. This is of critical importance to the communities of Helodrano Fagnemotse where small-scale fisheries sustain local livelihoods, providing 82% of daily household income, preventing a fall into further poverty [30].
Due to the strong local dependence on mangrove resources and the lack of viable alternatives in this remote and arid region—where the adjacent, endemic Mikea Forest ecosystem experienced the country’s highest deforestation rate between 1995 and 2005 [66]—total, strict conservation is not a viable option if local livelihoods are to be unaffected. In addition, despite extensive national legislation governing mangrove forests and protected areas in Madagascar [67], state authorities lack capacity for implementation and enforcement, especially in remote areas such as Helodrano Fagnemotse [68,69].
Mangroves are remarkably resilient species [13,70], making them suitable for locally-led sustainable harvesting and conservation regimes. However, this needs to be made a feasible option for people existing on the edge of, or below, the national poverty line. Despite the relatively low levels of carbon stored in the mangroves of Helodrano Fagnemotse, given the low levels of wealth in the area, harnessing the value that this conserved and restored carbon holds on the voluntary carbon market could generate revenue to support and incentivise locally-led sustainable mangrove management, improve livelihoods and alleviate anthropogenic pressures [2,71]. As the mangroves of Helodrano Fagnemotse sit within the Velondriake LMMA, there is also the potential for this revenue to support broader community-led marine conservation initiatives. The carbon stocks and the remote sensing-derived ‘business as usual’ deforestation rate presented herein could form the basis of a carbon project’s baseline scenario.
Despite the increasing interest in the use of carbon financing as an incentive for sustainable mangrove management, improvements to carbon project methodologies are needed in order to optimise them for use in wetland ecosystems. The fate of vegetation carbon following deforestation can be predicted with relative ease and the loss of soil organic carbon due to mangrove conversion for aquaculture is relatively well established [62,72]. However, there remains insufficient information on the fate of soil organic carbon following cutting for timber or charcoal, which is the predominant cause of mangrove deforestation both in Madagascar and the broader East Africa region [17,73]. In fact, it is estimated that 26% of mangrove forests worldwide are degraded due to over-exploitation for fuelwood and timber production [74]. However, despite a growing number of studies highlighting the impact of ecosystem conversion and degradation on soil organic carbon stocks, the predictions of carbon losses through in-situ oxidation and soil export to estuarine and offshore areas are wide ranging [2,19,71,75].
Addressing these outstanding uncertainties should be a priority in order to include significant soil carbon stocks in blue carbon accounting and improve carbon sequestration accounting in the mangrove environment [71]. This would ensure that the maximum potential offsets are achieved for specific wetlands conservation and/or restoration projects, increasing the carbon financing available for project activities and to support local communities.

5. Conclusions

This study presents, for the first time, ecosystem carbon stocks and loss rates of mangroves in the arid region of southwest Madagascar. While total stocks are comparatively lower than global and regional averages, this does not diminish the importance of the mangroves of Helodrano Fagnemotse to local people. The high levels of exploitation indicated by the carbon inventory surveys and remote sensing analysis suggest a high dependence on mangrove timber. However, in an area where the small-scale fisheries sector employs 87% of the adult population and provides the sole protein source in 99% of all household meals [30], it is the indirect services provided by mangroves that are of most importance to local wealth and wellbeing. Increasing fragmentation of mangroves in the bay could diminish their capacity to act as habitats and breeding and nursery grounds for fisheries thus threatening not only biodiversity but also local livelihoods.
In such remote regions, pragmatic, locally-led solutions to marine management are necessary. The carbon stored by the mangroves of Helodrano Fagnemotse is currently an unrealised financial asset of local communities. If this value can be harnessed it has the potential to catalyse and support locally-led mangrove management.

Acknowledgments

This research was funded by the Global Environmental Facility’s Blue Forest project and the John D. and Catherine T. MacArthur Foundation. The authors would like to thank Dolce Randrianandrasaziky, Raymond Raherindray, Zo Andriamahenina, Jaona Ravelonjatovo, Aina Celestin and all other Blue Ventures staff and volunteers who assisted with field missions. Additional thanks also go to Harifidy Ratsimba and Ismaël Philippe Ratefinjanahary at the Department of Forestry, University of Antananarivo for their contribution to laboratory analysis. Special thanks goes, finally, to the many community members, who acted as guides and field assistants, for their endless hospitality, guidance and support during fieldwork.

Author Contributions

L.B. led on the design and undertaking of the carbon stock assessments, data analysis and writing the manuscript; L.G. wrote and edited a significant portion of the manuscript; L.G. and T.G.J. carried out the remote sensing analysis; L.R. and C.R. provided extensive ground support and carried out carbon stock fieldwork, provided study area insight and assisted with data analysis. T.G.J., L.R. and C.R. contributed to manuscript edits.

Conflicts of Interest

The authors are either former (L.B.) or current (L.G., L.R. and C.R.) employees of, or an advisor (T.G.J.) to Blue Ventures Conservation, the NGO that co-manages the Velondriake locally managed marine area (LMMA) and is the applicant organization for the Tahiry Honko community mangrove carbon project. This study analyses carbon stock survey results and mangrove cover dynamics from inside the Velondriake LMMA. The funding sponsors had no role in the design of the study; in the collection, analyses, or interpretation of data; in the writing of the manuscript, or in the decision to publish the results.

References

  1. McLeod, E.; Chmura, G.L.; Bouillon, S.; Salm, R.; Bjork, M.; Duarte, C.M.; Lovelock, C.E.; Schlesinger, W.H.; Silliman, B.R. A blueprint for blue carbon: Toward an improved understanding of the role of vegetated coastal habitats in sequestering CO2. Front. Ecol. Environ. 2011, 9, 552–560. [Google Scholar] [CrossRef]
  2. Siikamäki, J.; Sanchirico, J.N.; Jardine, S.L. Global economic potential for reducing carbon dioxide emissions from mangrove loss. Proc. Natl. Acad. Sci. USA 2012, 109, 14369–14374. [Google Scholar] [CrossRef] [PubMed]
  3. Alongi, D.M. Carbon Cycling and Storage in Mangrove Forests. Ann. Rev. Mar. Sci. 2014, 6, 195–219. [Google Scholar] [CrossRef] [PubMed]
  4. Howard, J.; Sutton-Grier, A.; Herr, D.; Kleypas, J.; Landis, E.; Mcleod, E.; Pidgeon, E.; Simpson, S. Clarifying the role of coastal and marine systems in climate mitigation. Front. Ecol. Environ. 2017, 15, 42–50. [Google Scholar] [CrossRef]
  5. Chmura, G.L.; Anisfeld, S.C.; Cahoon, D.R.; Lynch, J.C. Global carbon sequestration in tidal, saline wetland soils. Glob. Biogeochem. Cycles 2003, 17, 1–22. [Google Scholar] [CrossRef]
  6. Bouillon, S.; Borges, A.V.; Castaneda-Moya, E.; Diele, K.; Dittmar, T.; Duke, N.C.; Kristensen, E.; Lee, S.Y.; Marchand, C.; Middelburg, J.J.; et al. Mangrove production and carbon sinks: A revision of global budget estimates. Glob. Biogeochem. Cycles 2008, 22, 1–12. [Google Scholar] [CrossRef]
  7. Da Silva Copertino, M. Add coastal vegetation to the climate critical list. Nature 2011, 473, 255. [Google Scholar] [CrossRef] [PubMed]
  8. Alongi, D. The Energetics of Mangrove Forests; Springer Science & Business Media: Amsterdam, The Netherlands, 2009. [Google Scholar]
  9. Donato, D.C.; Kauffman, J.B.; Murdiyarso, D.; Kurnianto, S.; Stidham, M.; Kanninen, M. Mangroves among the most carbon-rich forests in the tropics. Nat. Geosci. 2011, 4, 293–297. [Google Scholar] [CrossRef]
  10. Nellemann, C.; Corcoran, E.; Duarte, C.M.; Valdés, L.; De Young, C.; Fonseca, L.; Grimsditch, G. (Eds.) Blue Carbon: A Rapid Response Assessment, United Nations Environment Programme, GRID-Arendal. 2009. Available online: www.grida.no (accessed on 1 November 2016).
  11. Tue, N.T.; Ngoc, N.T.; Quy, T.D.; Hamaoka, H.; Nhuan, M.T.; Omori, K. A cross-system analysis of sedimentary organic carbon in the mangrove ecosystems of Xuan Thuy National Park, Vietnam. J. Sea Res. 2012, 67, 69–76. [Google Scholar] [CrossRef]
  12. Alongi, D.M. Carbon sequestration in mangrove forests. Carbon Manag. 2012, 3, 313–322. [Google Scholar] [CrossRef]
  13. Alongi, D.M. Mangrove forests: Resilience, protection from tsunamis, and responses to global climate change. Estuar. Coast. Shelf Sci. 2008, 76, 1–13. [Google Scholar] [CrossRef]
  14. Gilman, E.L.; Ellison, J.; Duke, N.C.; Field, C. Threats to mangroves from climate change and adaptation options: A review. Aquat. Bot. 2008, 89, 237–250. [Google Scholar] [CrossRef]
  15. Alongi, D.M. Carbon payments for mangrove conservation: Ecosystem constraints and uncertainties of sequestration potential. Environ. Sci. Policy 2011, 14, 462–470. [Google Scholar] [CrossRef]
  16. Clough, B.F.; Dixon, P.; Dalhaus, O. Allometric Relationships for Estimating Biomass in Multi-stemmed Mangrove Trees. Aust. J. Bot. 1997, 45, 1023. [Google Scholar] [CrossRef]
  17. Mcnally, C.G.; Uchida, E.; Gold, A.J. The effect of a protected area on the tradeoffs between short-run and long-run benefits from mangrove ecosystems. Proc. Natl. Acad. Sci. USA 2011, 108, 13945–13950. [Google Scholar] [CrossRef] [PubMed]
  18. Duke, N.C.; Meynecke, J.O.; Dittmann, S.; Ellison, A.M.; Anger, K.; Berger, U.; Cannicci, S.; Diele, K.; Ewel, K.C.; Field, C.D.; et al. A World Without Mangroves? Science 2007, 317, 41–42. [Google Scholar] [CrossRef] [PubMed]
  19. Pendleton, L.; Donato, D.C.; Murray, B.C.; Crooks, S.; Jenkins, W.A.; Sifleet, S.; Craft, C.; Fourqurean, J.W.; Kauffman, J.B.; Marbà, N.; et al. Estimating global “blue carbon” emissions from conversion and degradation of vegetated coastal ecosystems. PLoS ONE 2012, 7, e43542. [Google Scholar] [CrossRef] [PubMed]
  20. Giri, C.; Ochieng, E.; Tieszen, L.L.; Zhu, Z.; Singh, A.; Loveland, T.; Masek, J.; Duke, N. Status and distribution of mangrove forests of the world using earth observation satellite data. Glob. Ecol. Biogeogr. 2011, 20, 154–159. [Google Scholar] [CrossRef]
  21. Wylie, L.; Sutton-Grier, A.E.; Moore, A. Keys to successful blue carbon projects: Lessons learned from global case studies. Mar. Policy 2016, 65, 76–84. [Google Scholar] [CrossRef]
  22. Turner, R.E.; Lewis, R.R., III. Hydrologic restoration of coastal wetlands. Wetl. Ecol. Manag. 1996, 4, 65–72. [Google Scholar] [CrossRef]
  23. Cerón-Bretón, J.G.; Cerón-Bretón, R.M.; Rangel-Marrón, M.; Estrella-Cahuich, A. Evaluation of carbon sequestration potential in undisturbed mangrove forest in Términos Lagoon, Campeche. Dev. Energy Environ. Econ. 2010, 295–300. [Google Scholar]
  24. Jones, T.; Glass, L.; Gandhi, S.; Ravaoarinorotsihoarana, L.; Carro, A.; Benson, L.; Ratsimba, H.; Giri, C.; Randriamanatena, D.; Cripps, G. Madagascar’s Mangroves: Quantifying Nation-Wide and Ecosystem Specific Dynamics, and Detailed Contemporary Mapping of Distinct Ecosystems. Remote Sens. 2016, 8, 106. [Google Scholar] [CrossRef]
  25. Jones, T.G.; Ratsimba, H.R.; Carro, A.; Ravaoarinorotsihoarana, L.; Glass, L.; Teoh, M.; Benson, L.; Cripps, G.; Giri, C.; Zafindrasilivonona, B.; et al. The Mangroves of Ambanja and Ambaro Bays, Northwest Madagascar: Historical Dynamics, Current Status and Deforestation Mitigation Strategy. In Estuaries: A Lifeline of Ecosystem Services in the Western Indian Ocean; Springer International Publishing: Cham, Switzerland, 2016; pp. 67–85. [Google Scholar]
  26. Stringer, C.E.; Trettin, C.C.; Zarnoch, S.J.; Tang, W. Carbon stocks of mangroves within the Zambezi River Delta, Mozambique. For. Ecol. Manag. 2015, 354, 139–148. [Google Scholar] [CrossRef]
  27. Jones, T.; Ratsimba, H.; Ravaoarinorotsihoarana, L.; Glass, L.; Benson, L.; Teoh, M.; Carro, A.; Cripps, G.; Giri, C.; Gandhi, S.; et al. The Dynamics, Ecological Variability and Estimated Carbon Stocks of Mangroves in Mahajamba Bay, Madagascar. J. Mar. Sci. Eng. 2015, 3, 793–820. [Google Scholar] [CrossRef]
  28. Ajonina, G.N.; Kairo, J.; Grimsditch, G.; Sembres, T.; Chuyong, G.; Diyouke, E. Assessment of mangrove carbon stocks in Cameroon, Gabon, the Republic of Congo (RoC) and the Democratic Republic of Congo (DRC) including their potential for reducing emissions from deforestation and forest degradation (REDD+). In The Land/Ocean Interactions in the Coastal Zone of West and Central Africa; Springer: Dordrecht, The Netherlands, 2014; pp. 177–189. [Google Scholar]
  29. Giri, C. National-Level Mangrove Cover Data-Sets for 1990, 2000 and 2010; United States Geological Survey: Sioux Falls, SD, USA, 2011.
  30. Barnes-mauthe, M.; Oleson, K.L.L.; Zafindrasilivonona, B. The total economic value of small-scale fisheries with a characterization of post-landing trends: An application in Madagascar with global relevance. Fish. Res. 2013, 147, 175–185. [Google Scholar] [CrossRef]
  31. Scales, I.; Friess, D.; Glass, L.; Ravaoarinorotsihoarana, L. Rural livelihoods and Mangrove degradation in southwestern Madagascar: Lime production as an emerging threat. Oryx 2017, 1–5. [Google Scholar] [CrossRef]
  32. Bruggemann, J.H.; Rodier, M.; Guillaume, M.M.M.; Arfi, R.; Joshua, E.; Pichon, M.; Rasoamanendrika, F.; Zinke, J.; Mcclanahan, T.R. Wicked Social—Ecological Problems Forcing Unprecedented Change on the Latitudinal Margins of Coral Reefs: The Case of Southwest. Ecol. Soc. 2012, 17, 47. [Google Scholar] [CrossRef]
  33. Blue Ventures. Mangrove Use in the Bay of Assassins; Blue Ventures Conservation: London, UK, 2015. [Google Scholar]
  34. Pearson, T.; Walker, S.; Brown, S. Sourcebook for Land Use, Land-Use Change and Forestry Projects; BioCF and Winrock International: Little Rock, AR, USA, 2005. [Google Scholar]
  35. Kauffman, J.B.; Donato, D. Protocols for the Measurement, Monitoring and Reporting of Structure, Biomass and Carbon Stocks in Mangrove Forests; Working Paper 86; CIFOR: Bogor, Indonesia, 2012; p. 40. [Google Scholar]
  36. Komiyama, A.; Poungparn, S.; Kato, S. Common allometric equations for estimating the tree weight of mangroves. J. Trop. Ecol. 2005, 21, 471–477. [Google Scholar] [CrossRef]
  37. Kauffman, J.B.; Heider, C.; Cole, T.G.; Dwire, K.A.; Donato, D.C. Ecosystem carbon stocks of micronesian mangrove forests. Wetlands 2011, 31, 343–352. [Google Scholar] [CrossRef]
  38. Coleman, T.L.; Manu, A.; Twumasi, Y.A. Application of Landsat Data to the Study of Mangrove Ecologies Along the Coast of Ghana; Center for Hydrology, Soil Climatology, and Remote Sensing Alabama A&M University: Huntsville, AL, USA, 2004. [Google Scholar]
  39. Giri, C.; Muhlhausen, J. Mangrove Forest Distribution and Dynamics in Madagascar (1975–2005). Sensors 2008, 8, 204–2117. [Google Scholar] [CrossRef] [PubMed]
  40. Ferreira, M.A.; Andrade, F.; Mendes, R.N.; Paula, J. Use of satellite remote sensing for coastal conservation in the eastern african coast: Advantages and shortcomings. Eur. J. Remote Sens. 2012, 45, 293–304. [Google Scholar] [CrossRef]
  41. Shapiro, A.C.; Trettin, C.C.; Küchly, H.; Alavinapanah, S. The Mangroves of the Zambezi Delta: Increase in Extent Observed via Satellite from 1994 to 2013. Remote Sens. 2015, 7, 16504–16518. [Google Scholar] [CrossRef]
  42. Jones, T.; Ratsimba, H.; Ravaoarinorotsihoarana, L.; Cripps, G.; Bey, A. Ecological Variability and Carbon Stock Estimates of Mangrove Ecosystems in Northwestern Madagascar. Forests 2014, 5, 177–205. [Google Scholar] [CrossRef]
  43. Cohen, W.B.; Loveland, T.R.; Woodcock, C.E. Opening the archive: How free data has enabled the science and monitoring promise of Landsat. Remote Sens. Environ. 2012, 122, 2–10. [Google Scholar]
  44. Rahman, M.M.; Begum, S. Land cover change analysis around the Sundarbans Mangrove forest of bangladesh using remote sensing and GIS application. J. Sci. Found. 2011, 9, 95–107. [Google Scholar] [CrossRef]
  45. Dahanayaka, D.D.G.L.; Tonooka, H.; Minato, A.; Ozawa, S. Monitoring mangrove distribution and changes in Mekong Delta, Vietnam using Remote Sensing approach. In Proceedings of the 2013 IEEE International Geoscience and Remote Sensing Symposium—IGARSS, Melbourne, VIC, Australia, 21–26 July 2013; pp. 1583–1586. [Google Scholar]
  46. Giri, C.; Long, J.; Abbas, S.; Murali, R.M.; Qamer, F.M.; Pengra, B.; Thau, D. Distribution and dynamics of mangrove forests of South Asia. J. Environ. Manag. 2015, 148, 101–111. [Google Scholar] [CrossRef] [PubMed]
  47. Kanniah, K.D.; Sheikhi, A.; Cracknell, A.P.; Goh, H.C.; Tan, K.P.; Ho, C.S.; Rasli, F.N. Satellite images for monitoring mangrove cover changes in a fast growing economic region in southern Peninsular Malaysia. Remote Sens. 2015, 7, 14360–14385. [Google Scholar] [CrossRef]
  48. USGS Earth Explorer. Available online: http://earthexplorer.usgs.gov/ (accessed on 1 February 2016).
  49. Kuenzer, C.; Bluemel, A.; Gebhardt, S.; Quoc, T.V.; Dech, S. Remote sensing of mangrove ecosystems: A review. Remote Sens. 2011, 3, 878–928. [Google Scholar] [CrossRef]
  50. Chávez, P.S.J. Image-Based Atmospheric Corrections—Revisited and Improved. Photogramm. Eng. Remote Sens. 1996, 62, 1025–1036. [Google Scholar]
  51. Tong, P.H.S.; Auda, Y.; Populus, J.; Aizpuru, M.; Al Habshi, A.; Blasco, F. Assessment from space of mangroves evolution in the Mekong Delta, in relation to extensive shrimp farming. Int. J. Remote Sens. 2004, 25, 4795–4812. [Google Scholar] [CrossRef]
  52. Satyanarayana, B.; Mohamad, K.A.; Idris, I.F.; Husain, M.-L.; Dahdouh-Guebas, F. Assessment of mangrove vegetation based on remote sensing and ground-truth measurements at Tumpat, Kelantan Delta, East Coast of Peninsular Malaysia. Int. J. Remote Sens. 2011, 32, 1635–1650. [Google Scholar] [CrossRef]
  53. Kirui, K.B.; Kairo, J.G.; Bosire, J.; Viergever, K.M.; Rudra, S.; Huxham, M.; Briers, R.A. Mapping of mangrove forest land cover change along the Kenya coastline using Landsat imagery. Ocean Coast. Manag. 2013, 83, 19–24. [Google Scholar] [CrossRef]
  54. Rhyma Purnamasayangsukasih, P.; Norizah, K.; Ismail, A.A.M.; Shamsudin, I. A review of uses of satellite imagery in monitoring mangrove forests. IOP Conf. Ser. Earth Environ. Sci. 2016, 37, 12034. [Google Scholar] [CrossRef]
  55. Congalton, R.G. A review of assessing the accuracy of classifications of remotely sensed data. Remote Sens. Environ. 1991, 37, 35–46. [Google Scholar] [CrossRef]
  56. Mougenot, B.; Pouget, M.; Epema, G.F. Remote sensing of salt affected soils. Remote Sens. Rev. 1993, 7, 241–259. [Google Scholar] [CrossRef]
  57. United Nations Environment Programme (UNEP). The Importance of Mangroves to PEOPLE: A call to Action; Van Bochove, J., Sullivan, E., Nakamura, T., Eds.; United Nations Environment Programme World Conservation Monitoring Centre: Cambridge, UK, 2014; p. 128. [Google Scholar]
  58. Duke, N.C.; Ball, M.C.; Ellison, J.C. Factors Influencing Biodiversity and Distributional Gradients in Mangroves. Glob. Ecol. Biogeogr. Lett. 1998, 7, 27–47. [Google Scholar] [CrossRef]
  59. Mizanur Rahman, M.; Nabiul Islam Khan, M.; Fazlul Hoque, A.K.; Ahmed, I. Carbon stock in the Sundarbans mangrove forest: Spatial variations in vegetation types and salinity zones. Wetl. Ecol. Manag. 2015, 23, 269–283. [Google Scholar] [CrossRef]
  60. Kristensen, E.; Bouillon, S.; Dittmar, T.; Marchand, C. Organic carbon dynamics in mangrove ecosystems: A review. Aquat. Bot. 2008, 89, 201–219. [Google Scholar] [CrossRef]
  61. Stringer, C.E.; Trettin, C.C.; Zarnoch, S.J. Soil properties of mangroves in contrasting geomorphic settings within the Zambezi River Delta, Mozambique. Wetl. Ecol. Manag. 2016, 24, 139–152. [Google Scholar] [CrossRef]
  62. Kauffman, J.B.; Heider, C.; Norfolk, J.; Payton, F. Carbon stocks of intact mangroves and carbon emissions arising from their conversion in the Dominican Republic. Ecol. Appl. 2014, 24, 518–527. [Google Scholar] [CrossRef] [PubMed]
  63. Donato, D.C.; Kauffman, J.B.; Mackenzie, R.A.; Ainsworth, A.; Pfleeger, A.Z. Whole-island carbon stocks in the tropical Pacific: Implications for mangrove conservation and upland restoration. J. Environ. Manag. 2012, 97, 89–96. [Google Scholar] [CrossRef] [PubMed]
  64. Din, N.; Saenger, P.; Jules, P.R.; Siegried, D.D.; Basco, F. Logging activities in mangrove forests: A case study of Douala Cameroon. Afr. J. Environ. Sci. Technol. 2008, 2, 22–30. [Google Scholar]
  65. Nagelkerken, I.; Kleijnen, S.; Klop, T.; Van den Brand, R.; de La Moriniere, E.C.; Van der Velde, G. Dependence of Caribbean reef fishes on mangroves and seagrass beds as nursery habitats: A comparison of fish faunas between bays with and without mangroves/seagrass beds. Mar. Ecol. Prog. Ser. 2001, 214, 225–235. [Google Scholar] [CrossRef]
  66. Harper, G.J.; Steininger, M.K.; Tucker, C.J.; Juhn, D.; Hawkins, F. Fifty years of deforestation and forest fragmentation in Madagascar. Found. Environ. Conserv. 2007, 34, 1–9. [Google Scholar] [CrossRef]
  67. Andriamahefazafy, M.; Carro, A.; England, K.; Aigrette, L.; Gardner, C.; Dewar, K.; Glass, L. Toward a national mangrove conservation strategy in Madagascar: Empirical analysis of the challenges for mangrove conservation under management transfers and protected areas frameworks. Manuscript in preparation.
  68. McConnell, W.J.; Sweeney, S.P. Challenges of forest governance in Madagascar. Geogr. J. 2005, 171, 223–238. [Google Scholar] [CrossRef]
  69. Aymoz, B.G.P.; Randrianjafy, V.R.; Randrianjafy, Z.J.N.; Khasa, D.P. Community Management of Natural Resources: A Case Study from Ankarafantsika National Park, Madagascar. Ambio 2013, 42, 767–775. [Google Scholar] [CrossRef] [PubMed]
  70. Sillanpää, M.; Vantellingen, J.; Friess, D.A. Vegetation regeneration in a sustainably harvested mangrove forest in West Papua, Indonesia. For. Ecol. Manag. 2017, 390, 137–146. [Google Scholar] [CrossRef]
  71. Lane, R.R.; Mack, S.K.; Day, J.W.; DeLaune, R.D.; Madison, M.J.; Precht, P.R. Fate of Soil Organic Carbon During Wetland Loss. Wetlands 2016, 36, 1167–1181. [Google Scholar] [CrossRef]
  72. Sidik, F.; Lovelock, C.E. CO2 Efflux from Shrimp Ponds in Indonesia. PLoS ONE 2013, 8, e66329. [Google Scholar] [CrossRef] [PubMed]
  73. Food and Agiculture Organization (FAO). The World’s Mangroves 1980–2005; FAO Forestry Paper 153; FAO: Rome, Italy, 2007. [Google Scholar]
  74. Valiela, I.; Bowen, J.L.; York, J.K. Mangrove Forests: One of the World’s Threatened Major Tropical Environments. Bioscience 2001, 51, 807. [Google Scholar] [CrossRef]
  75. DeLaune, R.D.; White, J.R. Will coastal wetlands continue to sequester carbon in response to an increase in global sea level?: A case study of the rapidly subsiding Mississippi river deltaic plain. Clim. Chang. 2012, 110, 297–314. [Google Scholar] [CrossRef]
Figure 1. The location of the study area—Helodrano Fagnemotse—in the southwest of Madagascar as well as the main villages within the bay and the its location within the Velondriake Locally Managed Marine Area (LMMA).
Forests 08 00190 g001
Figure 2. The location and distribution of the 56, 20 × 20 m carbon inventory plots surveyed as part of this study. The plot symbol sizes were selected for visual clarity and do not accurately represent the spatial coverage of the individual plots on the ground.
Forests 08 00190 g002
Figure 3. The appearance of each of the seven mapped classes as viewed in high resolution Google Earth imagery (3a, 3c, 3e, 3g, 3i, 3k and 3m) and a Landsat false color composite (3b, 3d, 3f, 3h, 3j and 3n). The Landsat false color composite utilizes band 5 (near-infrared) in the red channel, band 4 (red) in the green channel and band 3 (green) in the blue channel. The yellow polygons represent 3 × 3 pixel (90 m × 90 m) reference areas.
Forests 08 00190 g003
Figure 4. The finalized mask used to subset the Landsat data in order to exclude areas more than 7 km from the coast, elevations of greater than 30 m above mean sea level and inundated areas. Also shown are the 3 × 3 pixel calibration and validation areas used to train and test the maximum likelihood classification algorithm. The numbers in brackets indicate number of calibration (cal) and validation (val) areas for each class.
Forests 08 00190 g004
Figure 5. Ecosystem carbon densities of vegetation and soil carbon to 1 m depth in open- and closed-canopy mangroves in Helodrano Fagnemotse. Error bars indicate ±1 standard error of total stocks.
Forests 08 00190 g005
Figure 6. Mean soil bulk density, C concentration, and C density with depth for open- and closed- canopy mangroves; error bars represent ±1 standard error.
Forests 08 00190 g006
Figure 7. The 2002 Landsat classification results (a). The 2014 Landsat classification results. Individual class areas are shown in brackets (b).
Forests 08 00190 g007
Figure 8. The spectral signatures extracted from the calibration areas for each class from the 2002 and 2014 Landsat images.
Forests 08 00190 g008
Figure 9. The spatial distribution of areas of mangrove loss, gain and persistence over the period 2002–2014.
Forests 08 00190 g009
Figure 10. Ecosystem carbon densities up to a soil depth of 1 m reported for carbon inventories in the Dominican Republic [62], Palau, Micronesia [63], the Zamezi Delta, Mozambique [26], Ambaro-Ambanja Bay, Madagascar [25] and Helodrano Fagnemotse from this study. Grey shading indicates studies in the Western Indian Ocean.
Forests 08 00190 g010
Table 1. Summary of the Landsat images used for land-cover stratification, mapping and mangrove dynamics analysis. Tide height (m) indicates average height above mean sea level.
Sensor:Spatial Resolution:Earth Explorer ID:Date of Image Acquisition:Path/Row:Cloud Cover:Tide Height (Range):
Landsat 7 ETM+30mLE71610752002120SGS0130 April 2002161/0750%2.0 m (0.8–3.4 m)
Landsat 8 OLI30mLC81610752014113LGN0023 April 2014161/0750%2.3 m (1.6–2.5 m)
Table 2. Summary of the finalized map classes, their descriptions and the number 3 × 3 pixel of calibration and validation areas used to train/test the maximum likelihood algorithm for each class.
ClassDescription of Typical ConstituentsSignal DominanceCalibrationValidation
Terrestrial forestWell formed, moderate-high stature, relatively closed-canopyCanopy155
BarrenRock, sand, dry soil; interspersed with sparse vegetation; fallow cultivation; recently burntGround constituents105
Mixed vegetationActive cultivation; degraded/moderate-sparse terrestrial forest; moderate-sparse woodland; old burntMixed155
TanneMud-flatsGround constituents84
Open-canopy mangrove IIStunted, short trees, very sparse; canopy <30% closed; greatly influenced by exposed soil/mudGround constituents83
Open-canopy mangrove IShort-medium trees; canopy 30–70% closed; influenced by background soil/mudMixed: canopy; ground constituents84
Closed-canopy mangroveTall mature stands; canopy >80% closedCanopy155
Total7931
Table 3. Mangrove class, species dominance, average tree height ± standard error (SE) (m), average diameter at breast height (dbh) ± SE (cm), and average trees per hectare ± SE (ha) for mapped and inventoried mangrove classes.
ClassCodeDescriptionSpecies DominanceNAverage Height (m)Average dbh (cm)Average Stem Density (ha−1)
Closed-canopy mangroveCCTall, mature stands; canopy >80% closedC. tagal226.10 ± 0.278.03 ± 0.373927 ± 244
R. mucronata95.89 ± 0.458.78 ± 0.913564 ± 478
Open-canopy mangrove IOCIShort-medium trees; canopy 30–70% closed; moderately influenced by background soil/mudA. marina34.37 ± 0.658.02 ± 1.501242 ± 342
B. gymnorrhiza34.74 ± 0.7510.09 ± 0.621275 ± 293
C. tagal154.71 ± 0.328.51 ± 0.542653 ± 343
R. mucronata24.42 ± 0.409.35 ± 0.751800 ± 600
Table 4. Mean carbon densities of vegetation and soil carbon pools up to 100 cm (± SE) in Helodrano Fagnemotse.
Mangrove ClassNVegetation Carbon (Mg·C·ha−1)Soil Carbon (Mg·C·ha−1)Total Carbon (Mg·C·ha−1)
Closed-Canopy Mangrove3173.90 ± 4.60381.02 ± 27.11454.92 ± 26.58
Open-Canopy Mangrove I2346.23 ± 5.15294.63 ± 36.41340.87 ± 38.82
Table 5. Mean ± standard error and total carbon mass calculated for each height class and the resulting ecosystem C stock estimate for inventoried mangroves in Helodrano Fagnemotse.
Mangrove ClassTotal Carbon Stock (Mg·C·ha−1)Area (ha)Total Carbon (Mg × 105)
Closed-canopy mangrove454.92 ± 26.586202.82 ± 0.16
Open-canopy mangrove I340.87 ± 38.828863.02 ± 0.34
Total 15075.84 ± 0.35
Table 6. Confusion matrices for the 2002 and 2014 Landsat classifications. Rows represent mapped classes and columns represent independent validation pixels.
20021234567TotalUsers (%)Commission (%)
Terrestrial forest (1)43000000431000
Barren (2)0420400046918.7
Mixed vegetation (3)204500004795.74.3
Tanne (4)000294003387.912.1
Open-canopy mangrove II (5)030322102975.924.1
Open-canopy mangrove I (6)000013303497.12.9
Closed-canopy mangrove (7)000002454795.74.3
Total45454536273645279
Producers (%)95.693.310080.681.591.7100 Overall92.8
Omission (%)4.46.7019.418.58.30 Kappa0.92
20141234567TotalUsers (%)Commission (%)
Terrestrial forest (1)45000000451000
Barren (2)045030004893.86.3
Mixed vegetation (3)00450000451000
Tanne (4)00033000331000
Open-canopy mangrove II (5)00002700271000
Open-canopy mangrove I (6)00000360361000
Closed-canopy mangrove (7)00000045451000
Total45454536273645279
Producers (%)10010010091.7100100100 Overall98.9
Omission (%)0008.3000 Kappa0.99
Table 7. Numeric summary of the class changes between the 2002 and 2014 Landsat classification. (a) shows percentage changes and (b) shows aerial changes in square meters. Highlighted cells indicate changes greater than 15%. OCII = open-canopy mangrove II; OCI = open-canopy mangrove I; CC = closed-canopy mangrove.
(a)2002
TFBarrenMixed VegTanneOCIIOCICCClass Total
2014TF87.4940.0238.17900.0480.0110100
Barren3.19478.99511.65145.53946.854.5780.012100
Mixed Veg9.30219.70779.9112.94112.0273.6620100
Tanne00.6220.00624.8532.4180.2910.212100
OCII00.5540.00820.73526.1069.6620.25100
OCI0.010.0990.2445.93112.55274.05222.421100
CC000.001007.74577.105100
Class Total100100100100100100100
Class Changes12.50621.00520.08975.14773.89425.94822.895
Image Difference−0.67610.693−0.603−49.608−47.9326.075−13.902
(b)2002
TFBarrenMixed VegTanneOCIIOCICCClass Total
2014TF47,268,90010,8006,376,5002,70090053,659,800
Barren1,725,30036,582,3009,083,700836,1002,650,500382,50090051,261,300
Mixed Veg5,025,6009,126,00062,301,60054,000680,400306,00077,493,600
Tanne288,0004,500456,300136,80024,30015,300925,200
OCII256,5006,300380,7001,476,900807,30018,0002,945,700
OCI5,40045,900189,900108,900710,1006,187,5001,615,5008,863,200
CC900647,1005,555,7006,203,700
Class Total54,025,20046,309,50077,963,4001,836,0005,657,4008,355,6007,205,400
Class Changes6,756,3009,727,20015,661,8001,379,7004,180,5002,168,1001,649,700
Image Difference-365,4004,951,800−469,800−910,800−2,711,700507,600−1,001,700
Table 8. Aerial and net changes in each mangrove class within the study area between 2002 and 2014. These figures were combined to give aerial and net changes of all mangroves (closed-canopy, open-canopy I and open-canopy II) and only for closed-canopy and open-canopy I.
Area (hectares)2002–20142002–2014
20022014Net Change (ha)Net Change (%)
Open-canopy mangrove II565.74294.57−271.17−47.93%
Open-canopy mangrove I835.56886.3250.766.07%
Closed-canopy mangrove720.54620.37−100.17−13.90%
Combined mangrove class (CC, OCI & OCII)2121.841801.26−320.58−15.11%
Combined mangrove class (CC & OCI)1556.101506.69−49.41−3.18%

