Article

Evaluating the Effects of Carbon Prices on Trade-Offs between Carbon and Timber Management Objectives in Forest Spatial Harvest Scheduling Problems: A Case Study from Northeast China

1
Department of Forestry Economics, College of Economics & Management, Northeast Forestry University, Harbin 150040, China
2
Department of Forest Management, College of Forestry, Northeast Forestry University, Harbin 150040, China
*
Author to whom correspondence should be addressed.
Forests 2017, 8(2), 43; https://doi.org/10.3390/f8020043
Submission received: 15 December 2016 / Revised: 9 February 2017 / Accepted: 10 February 2017 / Published: 14 February 2017

Abstract

:
To mitigate global climatic changes, long-term carbon trading and carbon taxes have been implemented in many countries. However, carbon prices have varied in many of these regions. Therefore, the goal of this paper was to evaluate the effects of carbon prices on trade-offs between forest carbon and timber management objectives in spatial harvest scheduling problems. The objective function of the planning problem was designed to maximize the discounted net present value of harvested timber and the differences of carbon stocks in living tree biomass between the beginning and end of the planning horizon (DoC) within a 30-year time frame for a large forest region in northeast China. The constraints primarily related to maintaining an even flow of harvested timber and guaranteeing the maximum opening size. Forest developments were simulated using a set of standard stand-level growth and yield models, and the solutions of the planning problem were generated using the standard version of a simulated annealing algorithm. The effects of a wide range of carbon prices on the harvested timber and DoC levels were examined. The results showed that the trade-offs between forest harvested timber and the DoC displayed a typical nonlinear tendency as carbon prices increased. The current carbon prices (i.e., 25, 50 and 75 ¥/ton) in China had no significant effects on the optimal forest management plans compared with a scenario that used a carbon price of zero. The minimum carbon price that can provide the financial incentive for the forests to function as a significant carbon sink was estimated to be somewhat over 800 ¥/ton. This result could be useful in determining the appropriate carbon offset standard in this region.

1. Introduction

Forest ecosystems provide a number of economic (e.g., timber and non-timber products), ecological (e.g., carbon sequestration, water resources, and biodiversity) and social values (e.g., recreation and employment opportunities for local residents) [1]. However, in many countries, forest management policies have generally focused on timber production over the past decades. The carbon sequestration of forest ecosystems is now receiving substantially more attention as a result of global climate change. For example, China is an extensively forested country with productive forests that in 2013 covered approximately 22% of the land area, provided a volume of 15,137 million m3, and 8427 million stored tons of carbon [2]. The annual volume of forest growth was estimated to be 283 million m3, the annual harvest was 84 million m3, and the annual carbon sequestration in forests was estimated to be 115 million tons in the 8th Forest Resources Inventory (2009–2013) [2]. Therefore, China’s forests play important roles as carbon sinks in mitigating global climatic changes [3]. However, the carbon emissions from fossil fuels in China reached 2260 million tons in 2010 [4]. It is estimated that approximately 5% of these emissions can be sequestered in forest biomass. Obviously, China faces serious pressure to reduce carbon emissions from fossil fuels and increase carbon stocks in forest biomass. Thus, understanding the carbon dynamics of the forest ecosystem and its response to forest management efforts and climate change has become one of the most important research topics in forestry.
Previous studies have demonstrated that planting trees in suitable areas and increasing forest biomass carbon stocks through adaptive forest management are among the most effective alternative strategies for reducing atmospheric CO2 concentrations [5]. The first strategy has been widely implemented in many countries over past decades. For example, Fang et al. [3] estimated that planted forests (e.g., forestation and reforestation) in China have sequestered 0.45 Pg of carbon since the mid-1970s. The second strategy has been long overlooked. However, in the last few decades, it has drawn more attention worldwide [6,7,8]. The literature indicates that adaptive forest management strategies could significantly affect carbon dynamics in forest ecosystems and thus are effective for mitigating global climate change. The carbon benefits of forest management prescriptions (e.g., selective cutting) typically vary according to the methods used to utilize trees (e.g., part or whole tree), the methods used to harvest trees (e.g., thinning from below vs. from above), the rotation length, the management intensity, and the length of time after a thinning treatment [9,10,11]. In addition, species composition, development stage, and characteristic variables (e.g., stand density and site quality) within a stand influence the carbon benefits of different management prescriptions. In general terms of short-term monitoring, live biomass carbon pools have significantly decreased relative to the no-harvest forest because trees have been directly removed from stands. However, because the soil carbon pool is more resistant to forest management changes, it may not distinctly change [10,12,13]. For long-term monitoring, the differences between the total and all sub-carbon pools of forest ecosystems may be not significant [7]. In addition, forest management prescriptions produce certain end-use products that can store significant amounts of carbon for much longer periods than dead wood and residue materials (e.g., branches and barks) in forest ecosystems [14]. From this perspective, most forest management prescriptions should be effective in improving the amount of carbon in forest ecosystems.
However, an experiment to evaluate the effects of these forest management prescriptions on improving the level of carbon stocks across a broad forest landscape would be costly and time-consuming. Therefore, the forest management planning process, which can provide details of where, when and how management prescriptions should be scheduled across a landscape, has been widely used to support the assessment of economic and ecological (e.g., wildlife habitat, water quality and carbon sequestration) goals during the last few decades [1,15,16,17]. Several studies have incorporated the carbon objective into the forest management planning model [1,16,18,19]. These studies evaluate trade-offs between harvested timber and carbon sequestration and examine the effects of different constraints or policies on forest carbon management objectives using traditional and exact mathematical techniques, such as goal programming and linear programming. However, harvest adjacency and green-up constraints have become some of the most important components of laws, regulations and forest certification programs worldwide [20,21,22]. These constraints may have significant effects on the fragmentation of the forest landscape and other ecological processes. However, few studies have incorporated the necessary spatial requirements (i.e., the adjacency and green-up constraints) into forest carbon objective management planning models in the manner used by Boston and Bettinger [21] and Borges et al. [23] for forest economic and commodity production goals. An exception is the research of Dong et al. [24], who incorporated an area restriction model [25] and forest spatial value [26] in their planning problems but without investigating trade-offs between harvested timber and carbon sequestration.
Based on a broad survey of the forestry literature, one can state that numerous variables affect forest management decision making (e.g., forest characteristics, management policies and economic factors). Of these variables, economic factors might be one of the clearest and most credible bases for forest management practices. Today, long-term carbon trading or carbon taxes have been implemented in many countries. However, carbon prices vary from region to region and country to country [27]. For example, the carbon prices in countries that have adopted carbon trading are typically less than 100 ¥/ton (1¥≈0.16$; e.g., Europe: 31 ¥/ton, China: 50 ¥/ton, New Zealand: 81 ¥/ton). In contrast, the carbon prices in countries that employ carbon taxes are approximately 1000 ¥/ton (e.g., Sweden: 818 ¥/ton). Therefore, the quantitative assessment of the effects of carbon prices on decision making is an important prerequisite when a forest planning model is applied in practice.
Thus, the aim of this paper is to evaluate the effects of carbon prices on trade-offs between forest carbon and timber management objectives in spatial harvest scheduling problems for a large forest region in northeast China. The objective function of the planning problem is designed to maximize the discounted net present value (NPV) of harvested timber and the differences of carbon stocks in living tree biomass between the beginning and end of the planning horizon (DoC) within a 30-year time frame, i.e., three 10-year time periods. The constraints primarily consider maintaining an even flow of harvested timber and guaranteeing the maximum opening size. A wide set of carbon prices was employed to evaluate trade-offs between forest harvest levels and the DoC. The results could be useful in determining the appropriate carbon offset standard for this region.

2. Materials and Methods

2.1. Forest Planning Data Sets

The study area was located at the Pangu forest farm (52°41′57.1″ N, 123°51′56.5″ E), Heilongjiang Province, northeast China (Figure 1). The farm is characterized by rolling mountainous terrain with elevations that range from 230 to1397 m. The average slope of the land is approximately 8.63°, with a standard deviation of 6.95°. The climate is a typical cold-temperate continental monsoon climate with a mean annual precipitation of 428 mm, which is primarily concentrated in July and August. The mean annual temperature is −2.4 °C, with the lowest temperature of −46 °C typically occurring in January and the highest temperature of 37 °C typically occurring in July. The period of snow cover can be as long as five months, and the thickness of the snow cover usually varies from 30 to 50 cm. The soil is dominated by dark-brown coniferous forest soil, with a small amount of meadow soil and boggy soil. The main canopy species consist of Larix gmelinii (Rupr.) Kuzen., Pinus sylvestris var. mongolica, Picea koraiensis Nakai, Betula platyphylla Suk., and Populus davidiana Dode.
The total forest area is 123,434 ha, which was divided into 6421 management units in the forest inventory that was performed by the Forestry Center of Great Xing’an Mountain in 2009. The vegetation in this area could be classified into five different forest types, in which natural Larix gmelinii forest (NLG), natural Betula platyphylla forest (BPF), mixed coniferous forest (CF), mixed broadleaf–conifer forest (BCF), and mixed broad-leaved forest (BF) account for 27%, 18%, 30%, 19%, and 3%, respectively, of the total area of the forestland. In addition, approximately 3% non-forest lands coexist within the landscape. The initial age distribution is as follows: younger than 20 years: 6%; 20–39 years: 10%; 40–59 years: 35%, 60–79 years: 35%, 80–99 years: 11%, and more than 100 years: 3%.
The planning horizon of this analysis was 30 years, which was divided into three 10-year periods. The potential management prescriptions for each management unit included three selective cutting intensities of total stand volume (i.e., 10%, 20% and 30%) or no harvest. These management prescriptions were designed to satisfy the requirements of the forest management policy of Heilongjiang Province, northeast China [28]. The forest development forecasts were accomplished with a standard stand-level growth and yield model system created by Wang [29]. This simulation system consists of five components: (1) a maximum density-size line model; (2) a recruitment model; (3) a survival model; (4) a basal area prediction model; and (5) a volume prediction model. All the models were established based on commonly applied empirical and theoretical functions using a large national forest resource inventory dataset. From the perspective of harvested timber, the upper-thinning prescription would be implemented for each management unit once the stand age reached a user-specific minimum thinning age. The minimum harvest ages primarily depended on the dominant tree species, which was determined based on previous studies that address optimal stand management treatments [30,31]. The minimum harvest ages for NLG, CF and BCF were assumed to be 40 years; for BPF and BF, 30 years. The carbon stocks in the living tree biomass continually accumulate in a logged forest as a result of the growth of residual and recruitment trees. Overall, twelve alternative uneven-age management prescriptions (i.e., three time periods × three intensities of selective cutting + no harvest) were simulated for each stand within the planning horizon.
The timber prices for different forest types were retrieved from the 2012 price list of the Forestry Department of Heilongjiang Province, northeast China: 980¥/m3 for NLP,930¥/m3 for BPF, 1020¥/m3 for CF, 1100¥/m3 for BCF, and 800¥/m3 for BF. The mean costs of management prescriptions included selection harvesting and silvicultural and transportation activities, which were only associated with the area of management unit: 800¥/ha, 1600¥/ha and 2400¥/ha for low intensity (10%), medium intensity (20%), and high intensity (30%) selective cutting prescriptions, respectively. However, the mean carbon-trading price in China was only approximately 50¥/ton (with a lowest price of approximately 20 ¥/ton and a highest price of 75 ¥/ton) during the last two years (2014–2015) [32]. All these variables were tested in our planning problem.

2.2. Forest Planning Problems

To evaluate the effects of carbon prices on trade-offs between forest carbon and timber management objectives in spatial harvest scheduling problems, a reasonable multi-objective forest management planning model should be initially formulated. The objective function of the planning problem discussed in this paper is designed to maximize the NPV of harvested timber and the DoC when subjected to several constraints. Therefore, the forest planning problem can be formulated as follows:
Maximize Z = NPVtimber + NPVcarbon − NPVharvest
subject to:
H V t = i M j N A i V i j t X i j t t
P V t t i m b e r = i M j N P s ( A i V i j t X i j t )   t
N P V t i m b e r = t = 1 T P V t t i m b e r ( 1 + p ) ( t 0.5 ) T P L
P V t h a r v e s t = i M j N A i P j X i j t t
N P V h a r v e s t = t = 1 T P V t h a r v e s t ( 1 + p ) ( t 0.5 ) T P L
C S t = i = 1 M j = 1 N A i C i j t X i j t t
Δ t = C S t C S t 1 t
P V t c a r b o n = P c Δ t t
N P V c a r b o n = t = 1 T P V t c a r b o n ( 1 + p ) ( t 0.5 ) T P L
B l t H V t H V t + 1 0     t = 1 ,   2 ,   , T - 1
- B h t H V t + H V t + 1 0     t = 1 ,   2 ,   ,   T - 1
A i X i j t + k N i S i A k X k j t U max
i M A g e i t A g e s min t
t = 1 T X i j t 1 i
X i j t { 0 , 1 }
where NPVtimber, NPVcarbon and NPVharvest are the discounted net present value of harvested timber, the DoC and harvest activities, respectively; PVttimber, PVtcarbon and PVtharvest are the present value of the harvested timber, the DoC and harvest activities in period t, respectively; HVt and CSt are the amounts of actual scheduled harvested timber and carbon stock residues in living tree biomass in period t, respectively (whereby CS0 represents the amount of carbon stocks in living tree biomass at the beginning of the planning horizon); M, N, and T are the total number of management units, potential management activities for each unit, and planning periods, respectively; Ai and Ak are the areas of management units i and k, respectively,; Vijt is the amount of harvested timber during period t from management unit i when managed under prescription j; Xijt is a binary variable that indicates whether (1) or not (0) management unit i would be harvested with prescription j during time period t; Ps represents the mean stumpage price for forest type s (which represents one of the five forest types, i.e., NLG, CF, BCF, BPF or BF); Pj is the harvest costs for management prescription j; TPL is the length of the time period; Cijt is the amount of carbon stocks for management unit i after harvest with management prescription j in time period t; Δt denotes the differences of carbon stocks in living tree biomass from time period t to t-1; Blt represents the lower bound on decreases in the harvest level between period t and t+1; Bht represents the upper bound on increases in the harvest level between period t and t+1; k is a management unit adjacent to unit i or to a management unit that is adjacent to unit i; Ni is the entire set of all management units adjacent to management unit i; Si is the entire set of all management units adjacent to the set of management units (Ni) adjacent to management unit i (which were formulated in the form of a recursive function, as shown in Murray [25]); Umax is the assumed maximum concurrent harvest area; Ageit is the stand age of management unit i in time period t; Agesmin is the minimum harvest age assumed for forest type s; and p is the discount rate expressed as a percentage.
Equation (1) specifies the objective function of the planning problem: to maximize the discounted net present value from harvested timber and the DoC during the planning horizon minus the costs of harvest activities. As implemented here, all revenues (or costs) associated with harvested timber, the DoC and management prescriptions would be discounted using a 3% discount rate at the middle of each time period. Equation (2) consists of harvest accounting constraints that aggregate the harvest volume for each time period to harvest accounting variables (HVt). Equation (3) similarly aggregates the present value of harvested timber from each time period to timber revenue accounting variables (PVttimber). Equation (4) is used to aggregate the total discounted net present value of timber production (NPVtimber) during the entire time horizon.
Equation (5) assigns the present value of harvest activities from each time period to harvest costs accounting variables (PVtharvest). Equation (6) accumulates the total discounted net present value of harvest costs (NPVharvest) during the entire time horizon. Equation (7) consists of the residual carbon stocks accounting constraints that assign the carbon stocks after harvest under the assigned management prescription for each time period to carbon accounting variables (CSt). Equation (8) indicates the differences of the amount of carbon stocks in living tree biomass between two adjacent time periods. Equation (9) assigns the present value of the carbon objective from time period t to the carbon revenue accounting variables (PVtcarbon). Equation (10) represents the total NPV of the DoC (NPVcarbon) during the entire time frame. Since an even flow constraint of harvested timber typically plays an important role in ensuring full utilization of felling equipment and labor, constraint sets (11) and (12) are employed to restrict the deviation proportion of harvested timber from one period to the next within 10% in this analysis.
Constraint set (13) assists with maximum harvest opening size constraints, which was termed an area restriction model (ARM) by Murray [25]. The concepts of the area restriction model are typically complex and complicated when integrated into a specific planning problem. Briefly, the constraints allow the concurrent harvest of adjacent management units if the combined area of the contiguous harvests area does not exceed the maximum harvest opening size (Umax). As implemented here, adjacency only refers to the management units that share a common boundary (i.e., not a single point). Details regarding maximum harvest opening size constraints can be found in Murray [25], McDill et al. [33], and Boston and Bettinger [21].
Constraint (14) ensures that the minimum harvest age for assigning a potential management prescription should not be violated. Constraint (15) indicates that each management unit can only be harvested no more than once during the entire time horizon. Finally, constraint (16) requires that decision variables should be binary, which means that a management prescription should be applied to an entire management unit rather than to part of it when it is assigned.

2.3. Forest Planning Process

Simulated annealing was developed and used to schedule the potential prescription for each management unit for the forest planning problem. This technique was initially inspired by an algorithm developed by Metropolis et al. [34] to simulate the cooling process of heated materials. Subsequently, it was introduced as a technique for solving optimization problems in the early 1980s [35]. It is a typical neighborhood search technique that only examines a single solution to a forest plan and then proposes a change to the status of a single management unit (i.e., randomly change harvest time or prescription), i.e., by generating a new candidate solution. Then, the following three logical processes are gradually conducted. (1) If any constraints are violated, the process reverts to the previous feasible solution (S), and then a new change of management unit and its status (i.e., harvest time period and prescription) are randomly selected, i.e., generating a new candidate solution (S’); (2) Changes to the solution are evaluated with respect to Constraints (11)–(15). If the new candidate solution is feasible (i.e., does not violate any constraints) and the results from this proposed solution are better than those of the best previous solution, then the proposed solution becomes the best solution (S*) and the current solution (S). However, (3) if the results of the proposed solution are worse than those of the best previous solution, then the proposed solution can only be accepted with a probability of Prob=Exp((f(S’) − f(S*))/Temperature), where f() is the objective function formulation. The necessary parameters for simulated annealing are initial temperature (T0), final temperature (ft), cooling rate (cr) and the number of iterations at each temperature (nrep). Obviously, if the initial temperature is very high, the algorithm will accept all proposed solutions (i.e., Prob = 1), which resembles a random search process. The probability for accepting a poor solution will decrease continuously (i.e., 0 < Prob < 1) with the decrease in current temperature T. However, if the initial temperature is too low, the search process will reject all poor solutions (i.e., Prob = 0) and become a greedy hill-climbing method.
The performance of simulated annealing typically depends on the parameters used [36]. Therefore, forest planners should carefully evaluate the effects of parameters prior to applying them in forest management planning practices. To identify the set of parameters that will result in optimal solutions, wide ranges of T0 (i.e., 104, 5 × 10⁴, 105, 5 × 10⁵ and 106), cr (i.e., 0.95, 0.975, 0.99, 0.995 and 0.999), and nrep (i.e., from 100 to 500 in step of 100) were considered using trial-and-error tests, as in Boston and Bettinger [37]. Finally, the values of parameters T0, ft, cr and nrep were set as 104, 10, 0.995 and 100, respectively, which resulted in 137,900 iterations per independent run. To minimize the effects of potential parameter combinations with respect to the objective function value, the parameter values were held constant for all planning scenarios. The forest planning process was developed using the Visual Basic 6.0 programming language. All solutions (i.e., forest plans) were generated on a 2.6 GHz Core i5 processor and a Windows 7 operating system.

3. Results

The carbon-trading prices in China between 2014 and 2015 varied from 20 to 75 ¥/ton. When these prices were entered into the planning model, nearly all management units were harvested using a high intensity (30%) selective cutting prescription. Therefore, a wide range of carbon prices that varied from zero to 5000 ¥/ton was evaluated.
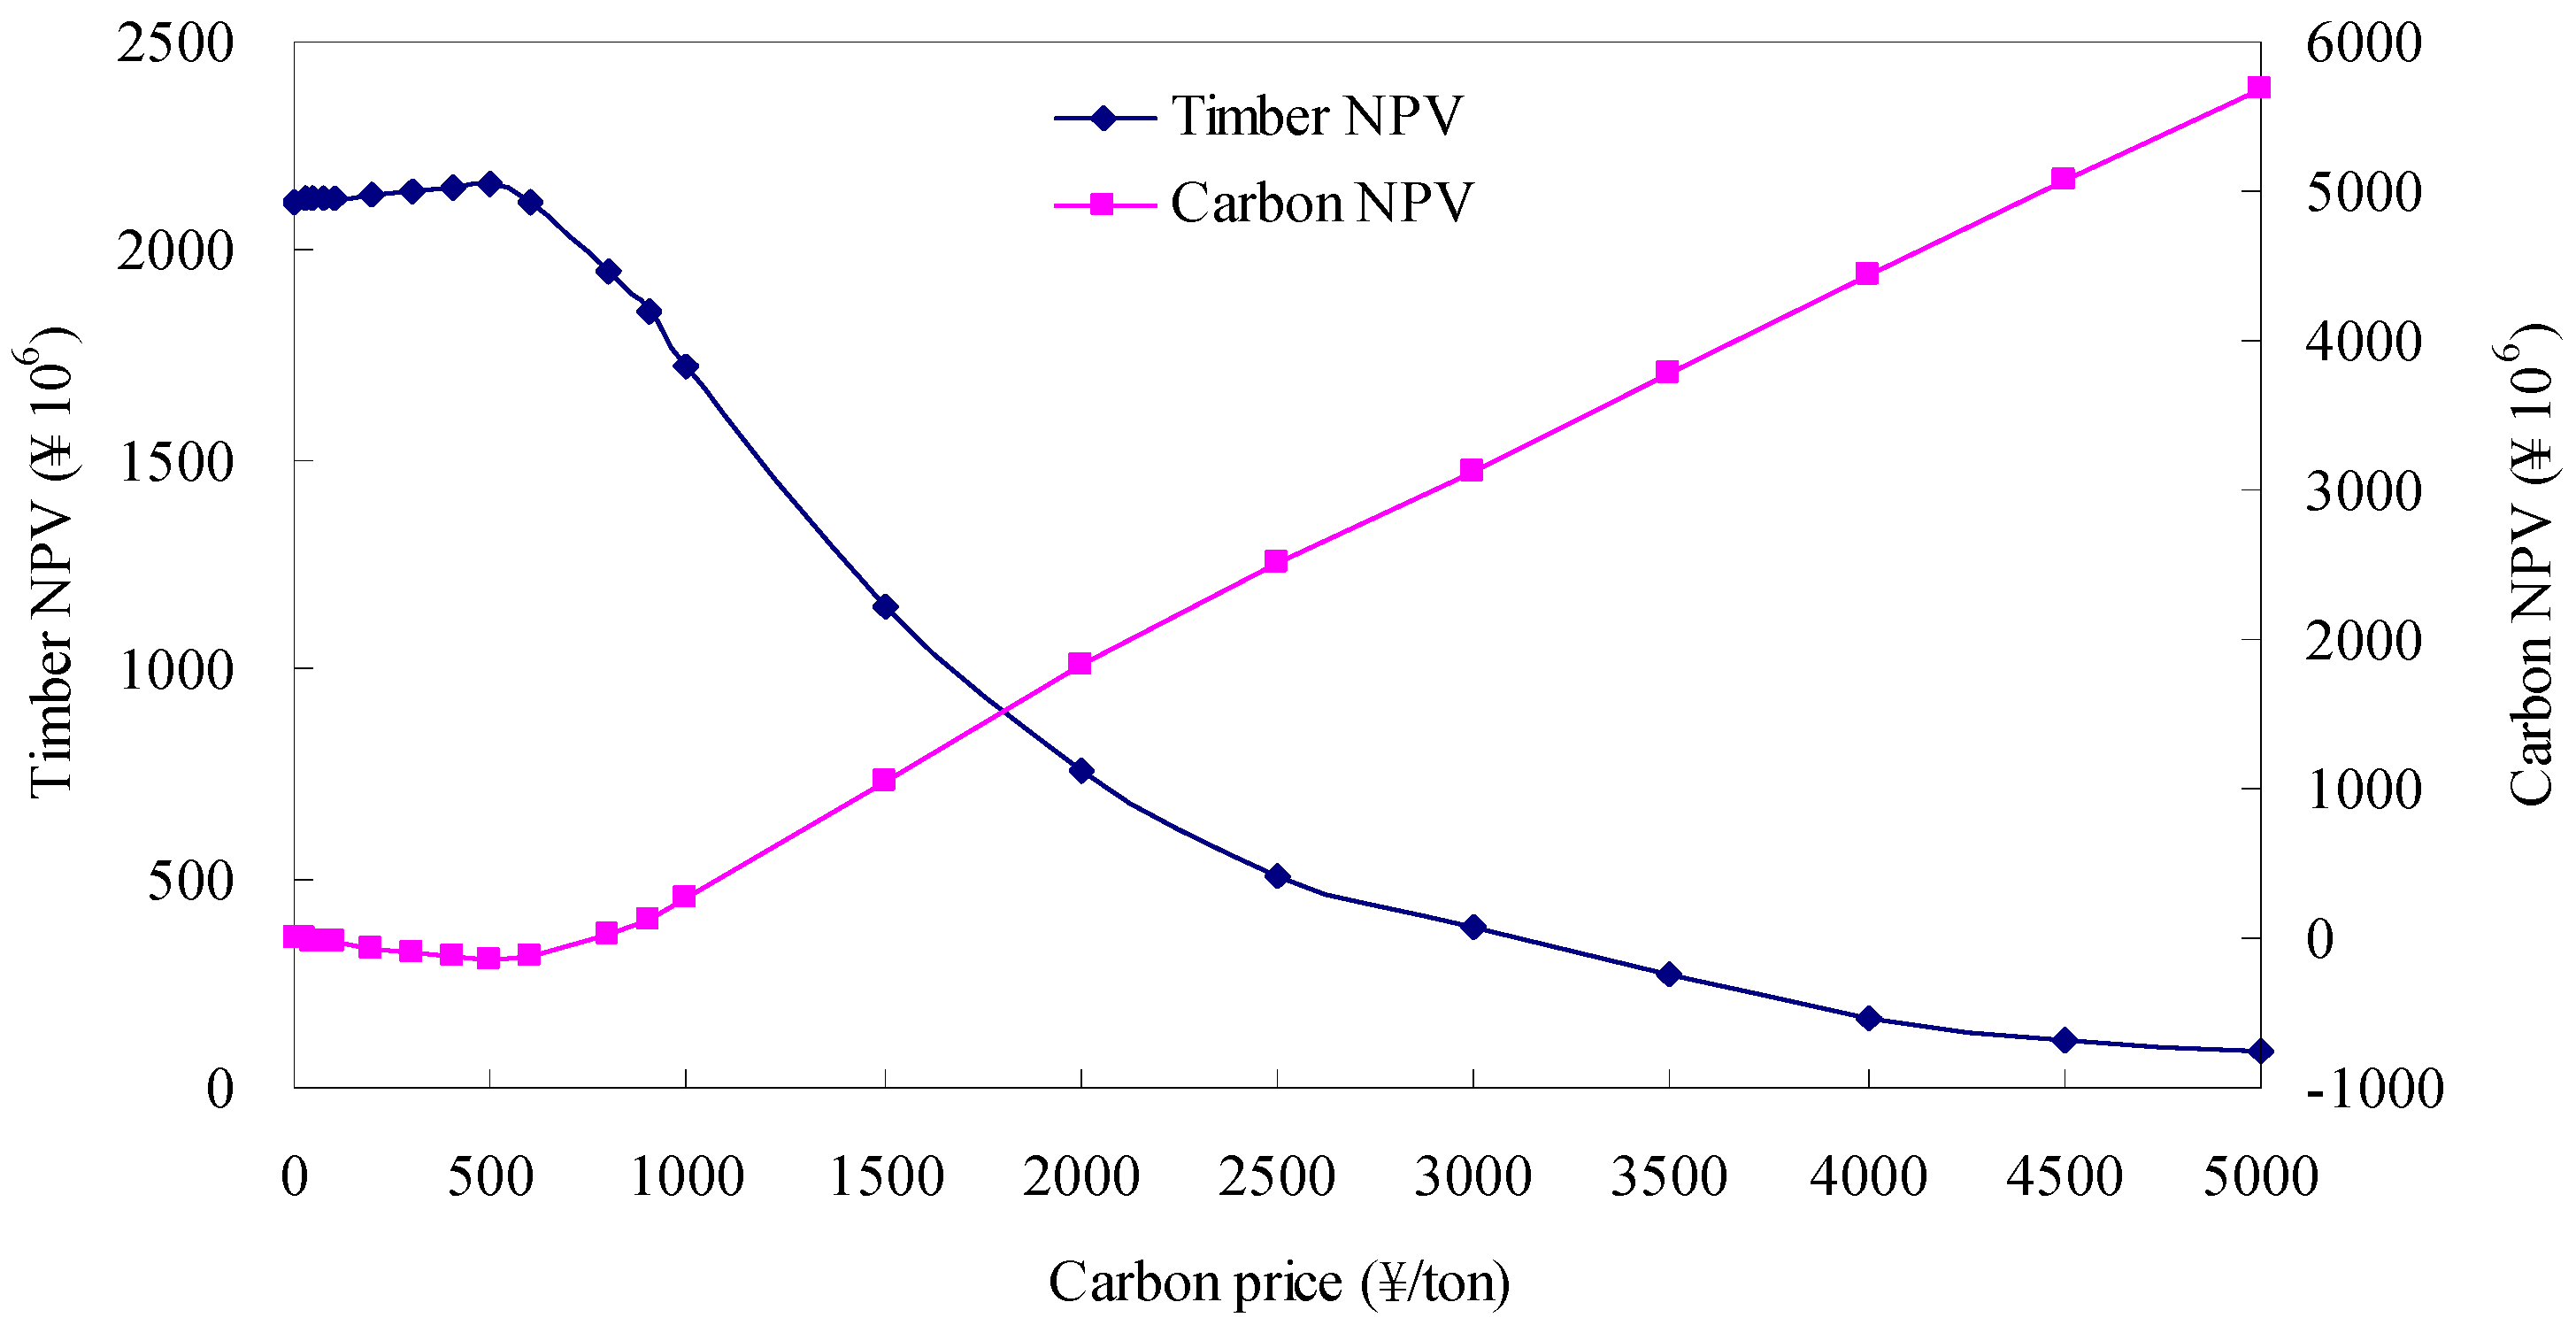
The levels of NPV of assigned harvest timber and its corresponding DoC both presented typical nonlinear tendencies with increases in carbon prices (Figure 2) primarily because of the necessity of maintaining an even flow of harvested volume and the harvest adjacency constraint. The NPV of harvested timber increased moderately when the carbon price was less than 500 ¥/ton and then decreased more quickly with continuous increases in carbon price. The mean NPV of assigned harvest timber given a carbon price of zero was approximately ¥2120.94 million during the entire horizon, and a zero NPV of assigned harvest timber could be reached at a carbon price somewhat over 5000 ¥/ton, which was substantially higher than the current carbon trading prices (i.e., 20–75 ¥/ton) in China. The forest might function as a significant source of carbon because the amount of DoC within the entire planning horizon was less than zero (i.e., from −0.59 to −0.01 million tons) when employed at carbon prices below 800 ¥/ton. However, with increases in the carbon price, the carbon-sink function of the forest might predominate, which varied from 0.19 to 1.82 million tons within the entire time frame. These values correspond to an average annual net carbon change from−0.16 to 0.52 ton/ha.
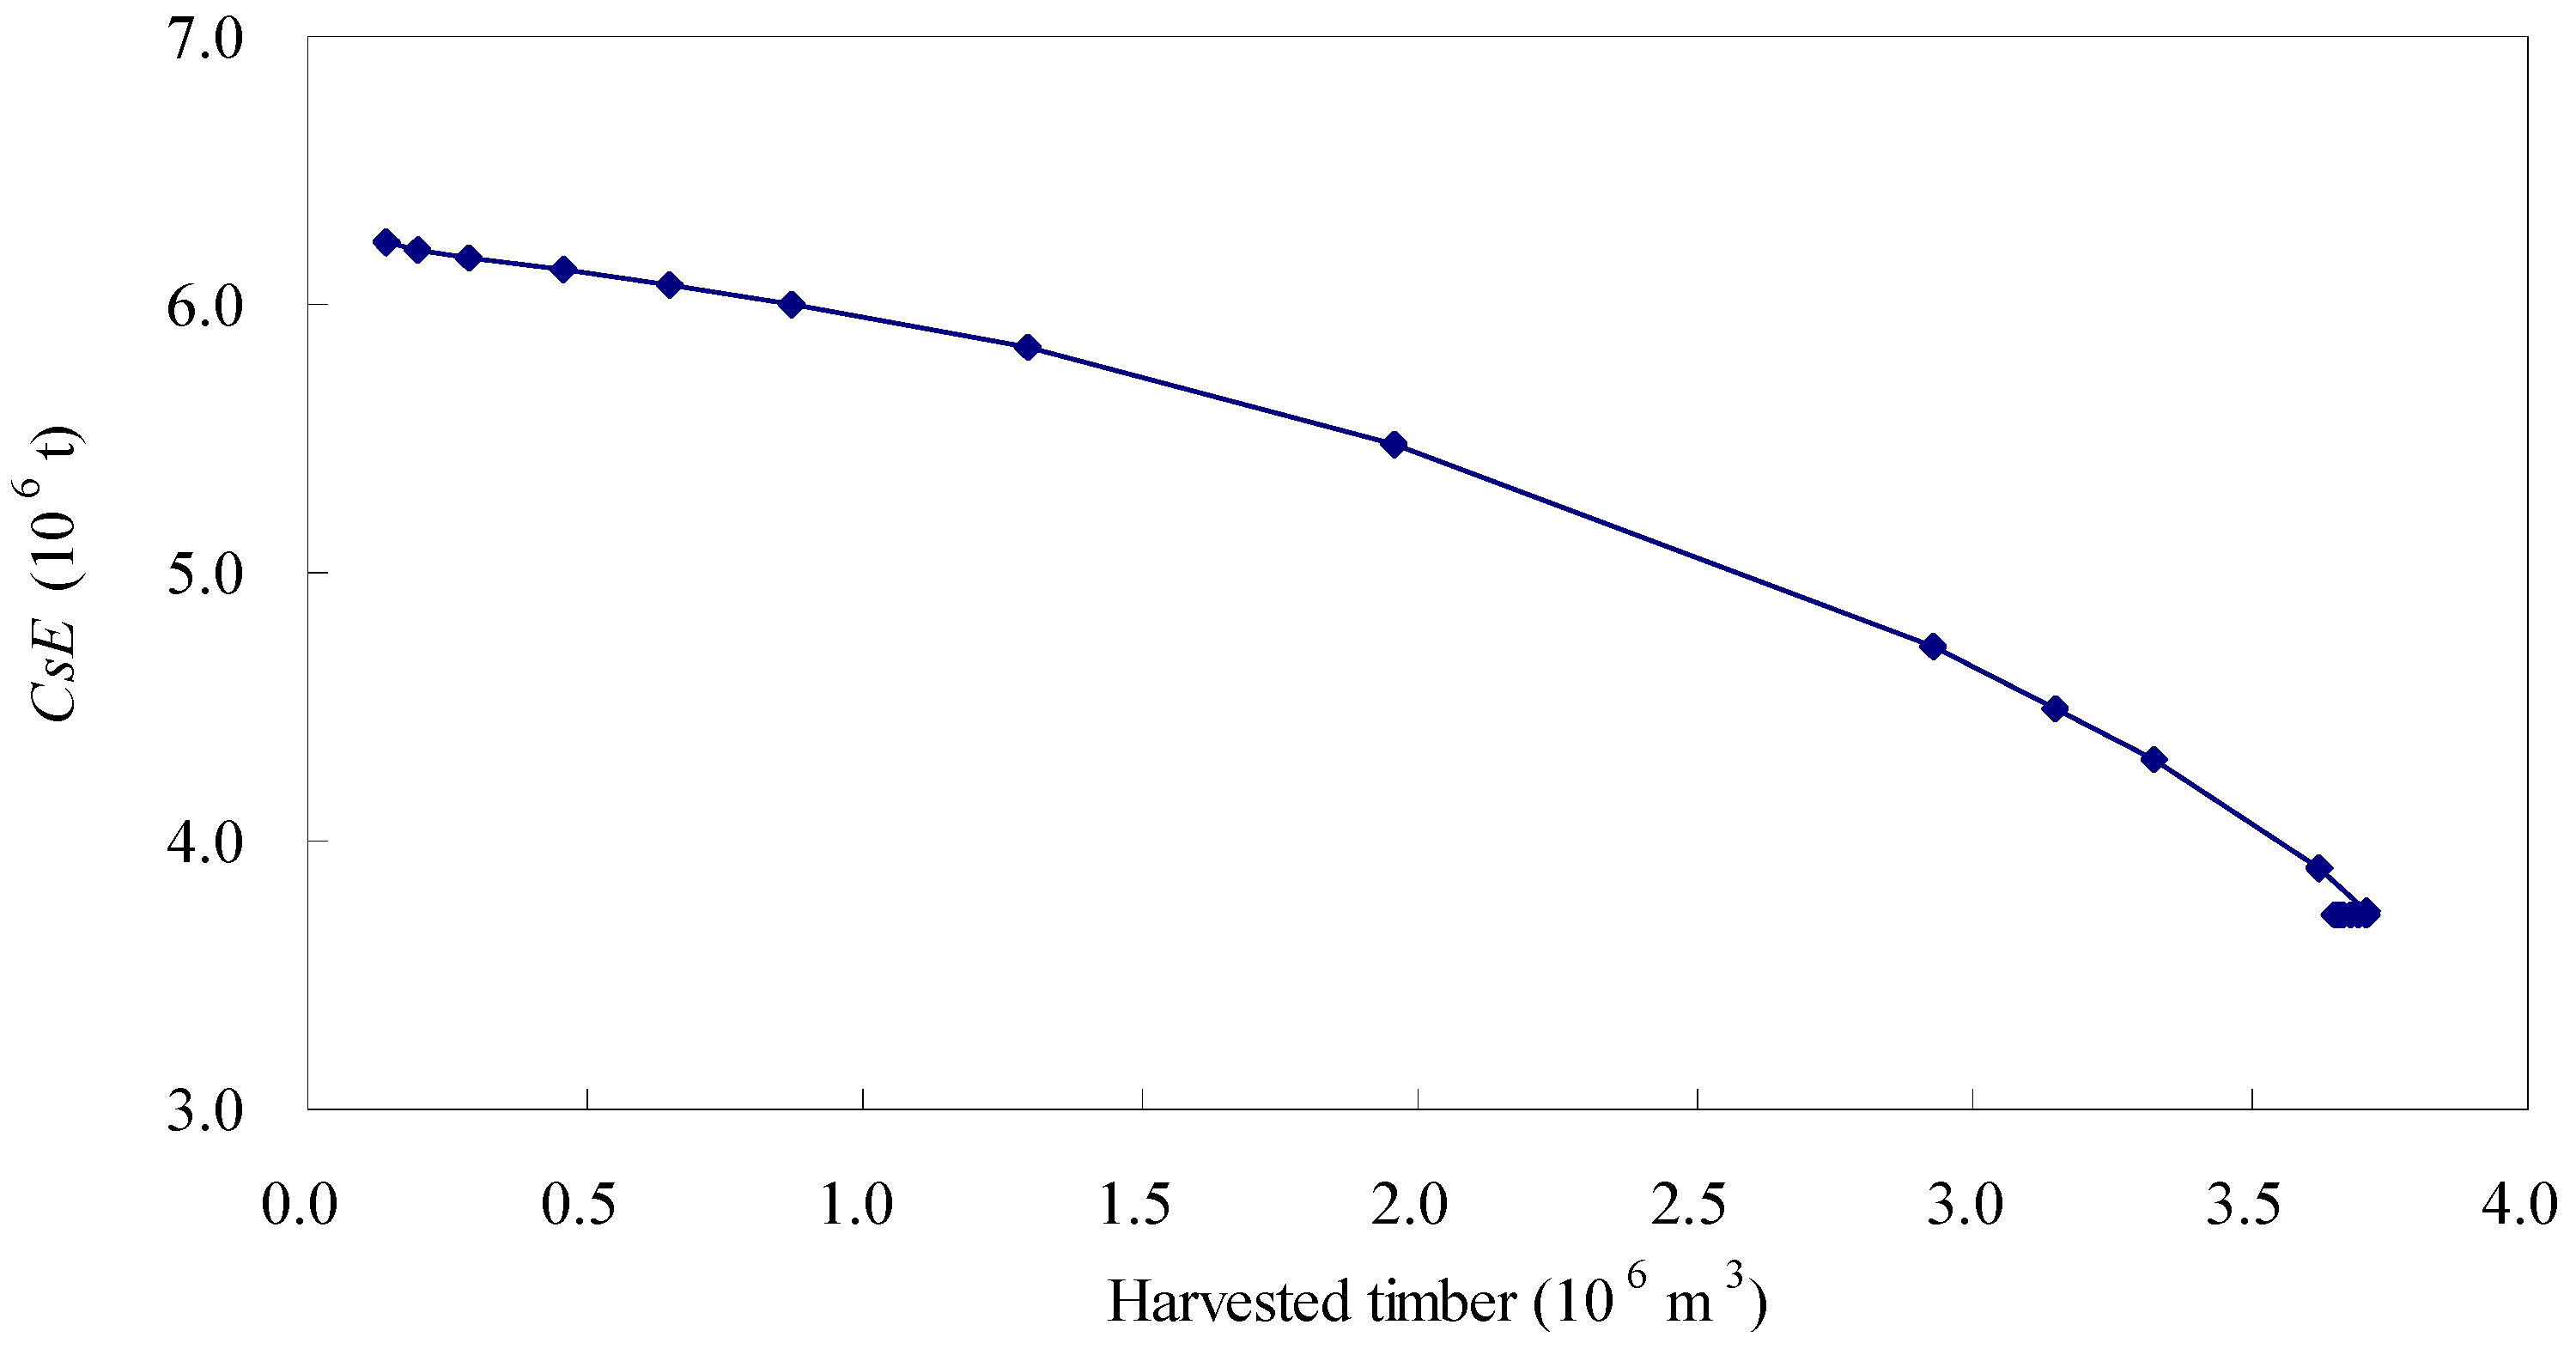
The levels of carbon stocks in living tree biomass at the end of the planning horizon (CsE) as a function of assigned harvest timber within the entire time frame also exhibited a significant nonlinear tendency (Figure 3). The relevancies between harvested timber and the CsE could be fitted as a typical quadratic polynomial: CsE = −0.184HT2 + 0.017HT + 6.1783 (R2=0.998), where HT represents the level of harvested timber and R2 represents the coefficient of determination between the predicted and observed values. For the minimum harvested timber level (1.91 million m3), the level of the CsE was approximately 6.23 million tons, which was increased by 45% compared with the levels of carbon stocks at the beginning of the planning horizon. However, for the maximum harvested timber level (3.71 million m3), the CsE level decreased by 13% (i.e., 3.73 million tons) compared with the levels of carbon stocks at the beginning of the planning horizon. As previously mentioned, the differences of carbon stocks between the beginning and end of the planning horizon were not significant when a carbon price of 800 ¥/ton was employed.
The levels of harvested timber were nearly consistent when the carbon price was less than 500 ¥/ton and then quickly decreased with increases in the carbon price (Figure 4a). The allocation patterns of harvested timber for each time period reflected the constraints of even flow of harvest volume (Equations (11) and (12)) when evaluated for different carbon prices. However, the pattern of DoC changes was reversed (Figure 4b), i.e., the DoC increased with carbon prices. The minimum carbon price that could increase the levels of total carbon stocks at the end of the planning horizon was also somewhat over 800 ¥/ton in our analysis. The mean percentages of the DoC for the first and second time periods decreased significantly (i.e., from 39% to 17% and from 37% to 15%), whereas the mean percentages of the DoC for the third time period increased from 24% to 68% when carbon prices were less than 500 ¥/ton. However, small differences in the percentages among different carbon prices that varied from 1000 to 5000 ¥/ton were observed, i.e., 40%, 34% and 26%, for the three time periods. Obviously, the DoC levels decreased significantly with the increasing time period. A possible explanation is that the growth rates of forest biomass for young- and middle-age stands are typically significantly larger than that of mature and over-mature forests.
The optimal forest management plans indicated that carbon prices had significant effects on the optimal spatial and temporal assignments of alternative management prescriptions (Table 1). The percentages of no harvest units increased significantly from 0.2% (0 ¥/ton) to 88% (5000 ¥/ton) as the carbon price increased. However, the percentages of harvested units with alternative management prescriptions decreased dramatically from 95% (0 ¥/ton) to 7% (5000 ¥/ton). Because of the constraint of the even flow of harvested timber (i.e., Equations (11) and (12)), the total percentages of harvested units in each period were approximately identical. Within each planning period for all planning scenarios, the percentages of harvested units with a high-intensity selective cutting prescription presented a typical downtrend as carbon prices increased. However, the percentages of harvested units with a low-intensity selective cutting prescription increased moderately.

4. Discussion

To evaluate the effects of carbon prices on trade-offs between forest carbon and timber management objectives in spatial harvest scheduling problems, a persuasive multi-objective forest management planning model was formulated. Similar to Backéus et al. [1] and Charles et al. [18], we integrated carbon management objectives in a wood supply model. However, in addition to using the traditional forest management model, which only includes the typical even flow of harvested timber and minimum harvest age constraints, we considered the adjacency constraints (i.e., ARM) of assigned management prescriptions in temporal and spatial scales. We also employed a well-known heuristic technique (i.e., simulated annealing) capable of greatly accelerating the search process for complex combinatorial optimization problems. The results of the case study indicated that the assigned harvest timber and its corresponding DoC both presented typical nonlinear responses as the carbon price increased. This result agreed precisely with Backéus et al. [1] and Raymer et al. [19]. Given the harvest quota management constraints of China’s State Forestry Bureau, the realistic annual harvest level was set at approximately 15 thousand m3 per year in this region for the long term, which resembles the simulated forest management scenario in which a carbon price of 3500 ¥/ton was used. The results of this scenario corresponded to an average annual DoC of approximately 0.49 ton/ha, which was consistent with the values (i.e., 0.45 ton/(year·ha)) reported by Fu et al. [38]. Therefore, the planning model presented here can be immediately applied in forest management practices in northeast China. However, the planning model ignored several important factors, which require additional discussion.
The first and perhaps most important factor is that not all the components of carbon sequestration related to forest and forestry were included, such as carbon in the soil, litter, shrub and herbal layers in forest ecosystems. Forest soil carbon stocks typically account for 29%–56% of the total carbon stocks for different development stages of the forests in this region [39]. However, the amount of soil carbon stocks may change dramatically over a short period [12], particularly in forests that grow in high latitudes, such as our study area. Additionally, because of the significant spatial heterogeneity of other vegetation layers (i.e., shrub and herbal), the carbon stocks in these components were not considered. Moreover, the harvested timber within the entire time horizon can also store a significant amount of carbon. Based on an average biomass expansion factor of 0.56 t/m3 for all forest types within this region [40] and a carbon content of 0.45 (figures that have been widely used in scientific research [1,41]), the carbon stocks of the harvested timber within the entire time horizon for different management planning scenarios were estimated to be 0.36–0.92 million tons. Therefore, the carbon emissions process of various forest products (i.e., sawlogs) also should be integrated into the planning process [1,16].
A second factor that requires additional discussion is the effect of climate change on the forest management planning process. Under boreal conditions, climate changes are expected to increase the annual temperature and precipitation and thus may increase forest growth and productivity [42]. However, the frequency and severity of unproductive events (i.e., fire, wind and insect damage) may also be increased significantly [43]. To evaluate the effects of climate change, a process-based growth model or a modified empirical model can be integrated into the forest planning process [42]. Among the various counterproductive events, forest fires represent a key natural disturbance factor in this region. Hu et al. [44] reported as many as 1614 forest fires with a burned area of approximately 35.23 million hectares from 1965 to 2010. The total carbon emissions of these fires were estimated to be 29.32 million tons, and the mean annual carbon emissions were approximately 0.64 tons per year, which accounted for 6% of the total carbon emissions from forest fires in China. Therefore, these unproductive events should also be integrated into traditional forest planning models, as in Peter and Nelson [45], Couture and Reynaud [46], and Garcia-Gonzalo et al. [47].
The final factor that requires discussion is that forest characteristics, economic factors, and management policies have significant effects on the forest planning process. For example, Borges et al. [48] examined the effects of site productivity on forest harvest scheduling problems that involved green-up and maximum area restrictions. Prices not only significantly affect the search process of heuristics but also reflect the priorities of multi-objective forest management. Therefore, in this study, we only focused on the effects of carbon prices, as in Backéus et al. [1]. However, the prices of various forest products and management activities represent a complex system from the economic perspective. A change to one economic parameter may affect other parameters. Thus, the interactions among such parameters might be important in forest management practices. Finally, the management policies of adjacency and green-up constraints also have significant effects on the forest planning process. Boston and Bettinger [21], Borges et al. [48], and Nalle et al. [49] have confirmed that the economic profitability of an optimal management plan typically increased as the period of green-up constraints and the size of the maximum clear-cut area increased. However, the fragmentation of forest landscapes or habitat patches might be aggravated significantly [32].

5. Conclusions

The case study presented here confirmed that integrating a carbon management objective into the traditional forest harvest scheduling model significantly reduced the levels of assigned harvest timber. However, trade-offs between the carbon management objective and traditional timber harvest presented a typical nonlinear tendency primarily due to the constraints of the even flow of harvested timber and harvest adjacency. The differences of the optimal solutions (i.e., forest management plans) between the current carbon prices (25, 50 and 75 ¥/ton) in China and the assumed minimum carbon price (0 ¥/ton) were not significant. The minimum carbon price that can increase the total carbon stocks at the end of the planning horizon was estimated to be somewhat over 800 ¥/ton. This outcome can be used in determining the appropriate carbon offset standard in this region. However, we recognize that this value might be overestimated because not all products (e.g., berry and mushroom yields) and services (e.g., water conservation, habitat maintenance) from forest ecosystems were considered. The percentage of harvest units also decreased as carbon prices increased.

Acknowledgments

This study was financially supported by Fundamental Research Funds of the Central Universities of China (2572015EC03, 2572015AC03) and the National Social Science Foundation of China (13BJY032). The authors would like to thank the reviewers for their helpful comments and suggestions.

Author Contributions

Y. Huang conceived and designed the experiments. L. Dong contributed analysis tools for the simulated annealing algorithm. H. Qin, L. Dong and Y. Huang analyzed the data and wrote the paper.

Conflicts of Interest

The authors declare no conflict of interest.

References

  1. Backéus, S.; Wikström, P.; Lämås, T. Modelling carbon sequestration and timber production in a regional case study. Silva Fenn. 2006, 40, 615–629. [Google Scholar] [CrossRef]
  2. State Forestry Bureau. Forest Resources Statistics of China for 2009–2013; Chinese Forestry Press: Beijing, China, 2014. (In Chinese)
  3. Fang, J.; Chen, A.; Peng, C.; Zhao, S.; Ci, L. Changes in forest biomass carbon storage in China between 1949 and 1998. Science 2001, 292, 2320–2322. [Google Scholar] [CrossRef] [PubMed]
  4. Carbon Dioxide Information Analysis Centre. World’s countries Ranked by 2011 Total Fossil-Fuel CO2 Emissions from Fossil-Fuel Burning, Cement Production, and Gas Flaring. Available online: http://cdiac.ornl.gov/ (accessed on 17 November 2016).
  5. Krcmar, E.; Kooten, G.C.V.; Vertinsky, I. Managing forest and marginal agricultural land for multiple tradeoffs: Compromising on economic, carbon and structural diversity objectives. Ecol. Model. 2005, 185, 451–468. [Google Scholar] [CrossRef]
  6. Saunders, M.; Tobin, B.; Black, K.; Gioria, M.; Nieuwenhuis, M.; Osborne, B.A. Thinning effects on the net ecosystem carbon exchange of a Sitka spruce forest are temperature-dependent. Agric. For. Meteorol. 2012, 157, 1–10. [Google Scholar] [CrossRef]
  7. Liu, Q.; Cai, H.; Jin, G. Effects of selective cutting on the carbon density and net primary productivity of a mixed broadleaved-Korean pine forest in northeast China. Chin. J. Appl. Ecol. 2013, 24, 2709–2716. [Google Scholar]
  8. Bravo-Oviedo, A.; Ruiz-Peinado, R.; Modrego, P.; Alonso, R.; Montero, G. Forest thinning impact on carbon stock and soil condition in Southern European populations of P. sylvestris L. For. Ecol. Manag. 2015, 357, 259–267. [Google Scholar] [CrossRef]
  9. Jandl, R.; Lindner, M.; Vesterdal, L.; Bauwens, B.; Baritz, R.; Hagedorn, F.; Johnson, D.W.; Minkkinen, K.; Byme, K.A. How strongly can forest management influence soil carbon sequestration? Geoderma 2007, 137, 253–268. [Google Scholar] [CrossRef]
  10. Ruiz-Peinado, R.; Bravo-Oviedo, A.; López-Senespleda, E.; Montero, G.; Rio, M. Do thinning influence biomass and soil carbon stocks in Mediterranean maritime pinewoods? Eur. J. For. Res. 2013, 132, 253–262. [Google Scholar] [CrossRef]
  11. Primicia, I.; Artázcoz, R.; Imbert, J.B.; Puertas, F.; Traver, M.D.C.; Castillo, F.J. Influence of thinning intensity and canopy type on Scots pine stand and growth dynamics in a mixed managed forest. For. Syst. 2016, 25, e057. [Google Scholar] [CrossRef]
  12. Johnson, D.W.; Curtis, P.S. Effects of forest management on soil C and N storage: Metaanalysis. For. Ecol.Manag. 2001, 140, 227–238. [Google Scholar] [CrossRef]
  13. Campbell, J.; Alberti, G.; Martin, J.; Law, B.E. Carbon dynamics of a ponderosa pine plantation following a thinning treatment in the northern Sierra Nevada. For. Ecol. Manag. 2009, 257, 453–463. [Google Scholar] [CrossRef]
  14. Eriksson, E.; Gillespie, A.R.; Gustavsson, L.; Langvall, O.; Olsson, M.; Sathre, R.; Stendahl, J. Integrated carbon analysis of forest management practices and wood substitution. Can. J. For. Res. 2007, 37, 671–681. [Google Scholar] [CrossRef]
  15. Kurttila, M.; Pukkala, T.; Loikkanen, J. The performance of alternative spatial objective types in forest planning calculations: A case for flying squirrel and moose. For. Ecol. Manag. 2002, 166, 245–260. [Google Scholar] [CrossRef]
  16. Baskent, E.Z.; Keles, S. Developing alternative forest management planning strategies incorporating timber, water and carbon values: An examination of their interactions. Environ. Model. Assess. 2009, 14, 467–480. [Google Scholar] [CrossRef]
  17. Başkent, E.Z.; Küçüker, D.M. Incorporating water production and carbon sequestration into forest management planning: A case study in Yalnızçam planning unit. For. Syst. 2010, 19, 98–111. [Google Scholar] [CrossRef]
  18. Bourque, C.P.A.; Neilson, E.T.; Gruenwald, C.; Perrin, S.F.; Hiltz, J.C.; Blin, Y.A.; Horsman, G.V.; Parker, M.S.; Thorburn, C.B.; Corey, M.M.; et al. Optimizing carbon sequestration in commercial forests by integrating carbon management objectives in wood supply modeling. Mitig. Adapt. Strateg. Glob. Chang. 2007, 12, 1253–1275. [Google Scholar] [CrossRef]
  19. Annkristin, R.; Terje, G.; Birger, S.; Hans-Fredrik, H.; Even, B. A forest optimization model including carbon flows: Application to a forest in Norway. For. Ecol. Manag. 2009, 258, 579–589. [Google Scholar]
  20. Dahlin, B.; Sallnas, O. Harvest scheduling under adjacency constraints-A case study from the Swedish sub-alpine region. Scand. J. For. Res. 1993, 8, 281–290. [Google Scholar] [CrossRef]
  21. Boston, K.; Bettinger, P. An economic and landscape evaluation of the green-up rules for California, Oregon, and Washington (USA). For. Policy Econ. 2006, 8, 251–266. [Google Scholar] [CrossRef]
  22. Sustainable Forestry Initiative. SFI 2015–2019 Forest Management Standard; Sustainable Forestry Initiative Inc.: Washington, DC, USA, 2015. [Google Scholar]
  23. Borges, P.; Bergseng, E.; Eid, T.; Gobakken, T. Impact of maximum opening area constraints on profitability and biomass availability in forest-a large, real world case. Silva Fenn. 2015, 49, 1347. [Google Scholar] [CrossRef]
  24. Dong, L.; Bettinger, P.; Liu, Z.; Qin, H. Spatial forest harvest scheduling for areas involving carbon and timber management goals. Forests 2015, 6, 1362–1379. [Google Scholar] [CrossRef]
  25. Murray, A.T. Spatial restrictions in harvest scheduling. For. Sci. 1999, 45, 45–52. [Google Scholar]
  26. Chen, B.; Gadow, K.V. Timber harvest planning with spatial objectives, using the method of simulated annealing. Eur. J. Oper. Res. 2002, 121, 25–34. [Google Scholar]
  27. World Bank, Ecofys. State and Trends of Carbon Pricing; World Bank, Ecofys: Washington, DC, USA, 2015. [Google Scholar]
  28. State Development Planning Commission; State Forestry Bureau. The Ecological Protection and Economic Transformation Plans of Great Xing’an Mountain in 2010–2020; Chinese Forestry Press: Beijing, China, 2010. (In Chinese)
  29. Wang, H. Dynamic Simulating System for Stand Growth of Forests in Northeast China. Ph.D. Thesis, Northeast Forestry University, Harbin, China, 2012. [Google Scholar]
  30. State Forestry Bureau. The Technical Regulations of National Forest Investigation; Chinese Forestry Press: Beijing, China, 2003. (In Chinese)
  31. Lei, X.; Lu, Y.; Peng, C.; Zhang, X.; Chang, J.; Hong, L. Growth and structure development of semi-natural larch-spruce-fir (Larix olgensis-Picea jezoensis-Abies nephrolepis) forests in northeast China: 12-year results after thinning. For. Ecol. Manag. 2007, 240, 165–177. [Google Scholar] [CrossRef]
  32. Website of China Carbon Emission and Trading. Available online: http://www.tanpaifang.com/ (accessed on 17 November 2016).
  33. McDill, M.E.; Rebain, S.A.; Braze, J. Harvest scheduling with area-based adjacency constraints. For. Sci. 2002, 48, 631–642. [Google Scholar]
  34. Metropolis, N.; Rosenbluth, A.; Rosenbluth, M.; Teller, A.H.; Teller, E. Equation of state calculations by fast computing machines. J. Chem. Phys. 1953, 21, 1087–1101. [Google Scholar] [CrossRef]
  35. Kirkpatrick, S.; Gelatt, C.D.; Vecchi, M.P. Optimization by simulated annealing. Science 1983, 220, 671–680. [Google Scholar] [CrossRef] [PubMed]
  36. Pukkala, T.; Heinonen, T. Optimizing heuristic search in forest planning. Nonlinear Anal.: Real World Appl. 2006, 7, 1284–1297. [Google Scholar] [CrossRef]
  37. Boston, K.; Bettinger, P. An analysis of Monte-Carlo integer programming simulated annealing and tabu search heuristics for solving spatial harvest scheduling problems. For. Sci. 1999, 45, 292–301. [Google Scholar]
  38. Fu, H.; Yan, W.; Chen, J. Forest carbon storage and its dynamics in Daxing’an Mountains of Inner Mongolia. J. Arid Land Resour. Environ. 2013, 27, 166–170. (In Chinese) [Google Scholar]
  39. Wei, Y.; Zhou, W.; Zhou, L.; Qin, S.; Dai, L. Carbon storage and its distribution pattern in the natural larix gmelinii forest on Daxing’an Mountains. Acta Ecol. Sin. 2015, 35, 189–195. (In Chinese) [Google Scholar]
  40. Dong, L. Developing Individual and Stand-Level Biomass Equations in NortheastChina Forest Area. Ph.D. Thesis, Northeast Forestry University, Harbin, China, 2015. [Google Scholar]
  41. Pan, Y.; Birdsey, R.A.; Fang, J.; Houghton, R.; Kauppi, P.E.; Kurz, W.A.; Phillips, O.L.; Shvidenko, A.; Lewis, S.L.; Canadell, J.G.; et al. A large and persistent carbon sink in the world’s forests. Science 2011, 333, 988–993. [Google Scholar] [CrossRef] [PubMed]
  42. Garcia-Gonzalo, J.; Pukkala, T.; Borges, J.G. Integrating fire risk in stand management scheduling: An application to Maritime pine stands in Portugal. Ann. Oper. Res. 2014, 219, 379–395. [Google Scholar] [CrossRef]
  43. Bettinger, P.; Siry, J.; Merry, K. Forest management planning technology issues posed by climate change. For. Sci. Technol. 2013, 9, 9–19. [Google Scholar] [CrossRef]
  44. Hu, H.; Wei, S.; Sun, L. Estimation of carbon emissions due to forest fire in Daxing’an Mountains from 1965 to 2010. Chin. J. Plant Ecol. 2012, 36, 629–644. (In Chinese) [Google Scholar] [CrossRef]
  45. Peter, B.; Nelson, J. Estimating harvest schedules and profitability under the risk of fire disturbance. Can. J. For. Res. 2005, 35, 1378–1388. [Google Scholar] [CrossRef]
  46. Couture, S.; Reynaud, A. Forest management under fire risk when forest carbon sequestration has value. Ecol. Econ. 2011, 70, 2002–2011. [Google Scholar] [CrossRef]
  47. Garcia-Gonzalo, J.; Borges, J.G.; Palma, J.H.N.; Zubizarreta-Gerendiain, A. A decision support system for management planning of Eucalyptus plantations facing climate change. Ann. For. Sci. 2014, 71, 187–199. [Google Scholar] [CrossRef]
  48. Borges, P.; Martins, I.; Berseng, E.; Eid, T.; Gobakken, T. Effects of site productivity on forest harvest scheduling subject to green-up and maximum area restriction. Scand. J. For. Res. 2015, 31, 507–516. [Google Scholar] [CrossRef]
  49. Nalle, D.J.; Arthur, J.L.; Montgomery, C.A. Economic impacts of adjacency and green-up constraints on timber production at a landscape scale. J. For. Econ. 2005, 10, 189–205. [Google Scholar] [CrossRef]
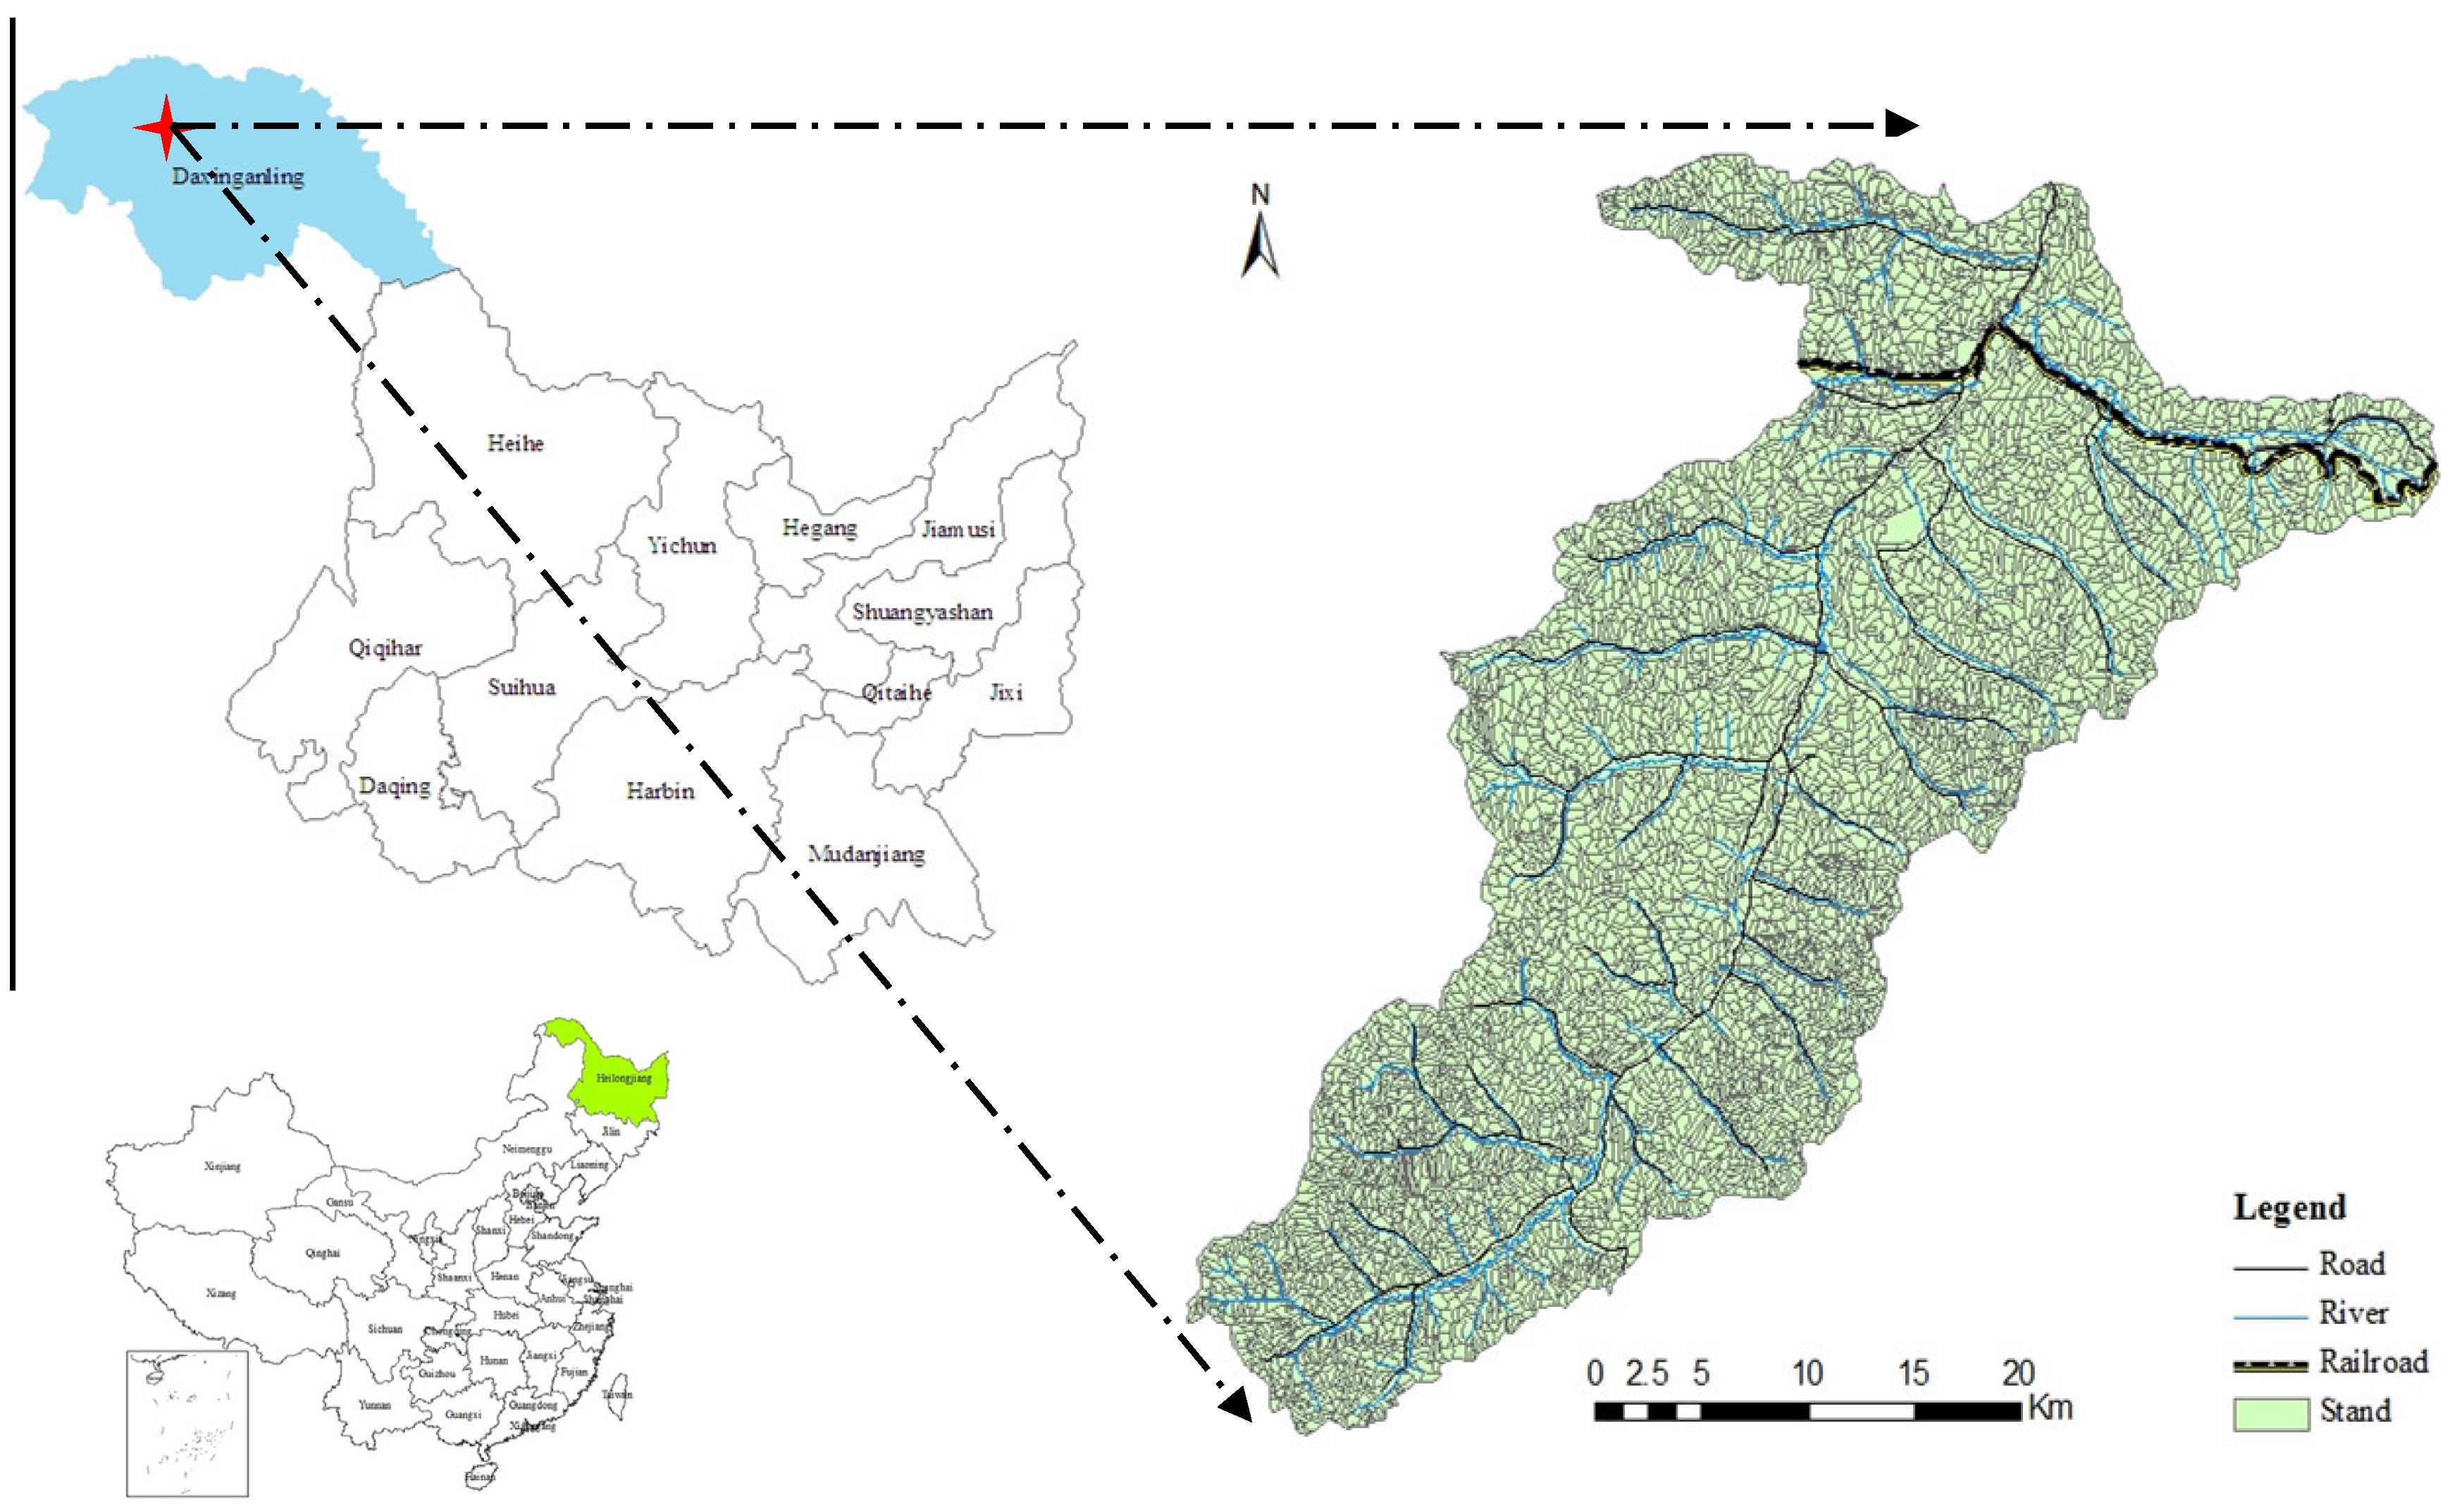
Figure 1. Study area of Pangu forest farm in Heilongjiang Province, northeast China.
Forests 08 00043 g001
Figure 2. Developments of the discounted net present values of harvested timber and the DoC together with carbon prices that varied from zero to 5000 ¥/ton, where DoC represents the differences of carbon stocks in living tree biomass between the beginning and the end of the planning horizon.
Forests 08 00043 g002
Figure 3. Trade-offs between harvested timber and the CsE for a 30-year time frame when carbon prices varied from zero to 5000 ¥/ton, where CsE represents the levels of carbon stocks in living tree biomass at the end of the planning horizon.
Forests 08 00043 g003
Figure 4. Levels of harvested timber (a) and the DoC (b) for each time period when carbon prices varied from zero to 5000 ¥/ton, where DoC represents the differences of carbon stocks in living tree biomass between the beginning and end of the planning horizon.
Forests 08 00043 g004
Table 1. Percentage of harvested units with alternative management prescriptions when a carbon price of 0, 50, 500, 800, 1000, and 5000 ¥/ton was used.
Period (a)Prescription (b)Carbon Price (¥/ton)
05050080010005000
−1−14.364.364.364.364.364.36
000.220.230.405.449.6188.40
110.000.000.000.000.020.47
20.510.340.301.763.820.44
342.1941.6839.9032.0826.150.19
210.000.000.000.250.702.27
20.020.030.033.367.090.16
329.8130.0927.9122.9216.570.03
310.000.030.095.268.913.69
20.370.450.938.4713.880.00
322.5222.7826.0716.098.910.00
(a) represents the three different time periods; (b) represents the three intensities of the selective cutting prescriptions: low intensity (10%), medium intensity (20%), and high intensity (30%). Period = −1 and prescription = −1 represents non-forest land, and period = 0 and prescription = 0 indicate that no harvest was assigned.