Allometry of Sapwood Depth in Five Boreal Trees


1
Geomatics Engineering, Schulich School of Engineering, University of Calgary, 2500 University Drive NW, Calgary, AB T2N 1N4, Canada
2
Mechanical Engineering, University of Victoria, P.O. Box 1700 STN CSC, Victoria, BC V8W 2Y2, Canada
*
Author to whom correspondence should be addressed.
Forests 2017, 8(11), 457; https://doi.org/10.3390/f8110457
Submission received: 28 September 2017
/
Revised: 19 October 2017
/
Accepted: 7 November 2017
/
Published: 20 November 2017
(This article belongs to the Section Forest Ecophysiology and Biology)
Abstract
:This paper analyzes sapwood variability and allometry within individuals of Populus tremuloides, Pinus contorta, Pinus banksiana, Picea mariana, and Picea glauca. Outside bark diameter at breast height (DBH) and sapwood depth (sd) in four cardinal directions were measured in individuals in stands in Alberta and Saskatchewan, Canada. The microscopical analysis of wood anatomy was used to measure sd, and the error associated with the measures was observed. Sapwood allometry analyses examined the influence of DBH on sd and on sapwood area (SA). All species were observed to have varying sapwood depths around the trunk with statistical analyses showing that Pinus banksiana has a well defined preference to grow thicker in the North-East side. The largest sd values were observed for the Populus tremuloides set. Unlike Populus tremuloides and Picea glauca, for the species Pinus contorta, Pinus banksiana, and Picea mariana, incremental growth in DBH does not directly drive sapwood growth in any direction. For these three species, SA increases only because of increases in DBH as sd remains nearly constant. These results show that sapwood depth and sapwood area seem to behave differently in each studied species and are not always proportional to the tree size as is normally assumed.
1. Introduction
Cross-sectional sapwood area (SA) is commonly used as a scaling parameter to obtain tree sap flow rates and is considered a strong predictor of tree- and plot-level leaf area, leaf biomass, and leaf area index [1,2,3,4,5,6,7,8,9,10]. Studies have reported that sapwood depth has a high correlation with diameter at breast height and sapwood area [11,12,13,14,15,16,17]. Sapwood depth, together with diameter at breast height, is considered a strong predictor of sapwood area. However, accurate measures of sapwood depth are time consuming, and it is commonly observed that sapwood depth values differ based on the method or methods used to measure a tree’s sapwood depth [18,19]. Sapwood morphological and physiological characteristics vary among species (e.g., color, water content, transition zones, wood tissues structure) and may constrain the accuracy of most methods used to measure sapwood depth [20], which can later lead to inaccurate conclusions regarding tree-water relationships [21,22,23].
There is a good body of work demonstrating the allometric correlation between sapwood area and leaf area [1,2,3,4,24,25,26,27,28,29,30,31,32]. However, one of the biggest problems in using these allometric correlations is the species-specific physio- and morphological variations that influence the tree’s allometry. For instance, it is well known that sapwood depth is heterogeneous around the tree trunk, and thus, measuring sapwood depth (e.g., by extracting wood cores) from a single side of the tree may be non-representative of the total amount of sapwood, and therefore, will not be reflected in the allometric model. Furthermore, other studies have listed several issues related to the allometric models. For example, Kumagai et al. [33] felt that most allometric models were computed with very small sample sizes, thus creating concern as to their reliability for scaling up sapwood area and transpiration values. Another study [17] gave detailed explanations of anatomical differences among trees and how they can lead to variations in sapwood tissues, and therefore, in sapwood amount. Site conditions, such as thinning, stand density, and stand age, were listed as modifiers of allometric correlations not only between sapwood area and leaf area [34], but between all the size variables of the tree [35,36].
The analysis of sapwood depth variability around a tree trunk can help to reduce the error potentially carried into allometric correlations and in the study of tree-water relationships. Therefore, the objective of this paper is to describe and analyze the within, and between tree sapwood area variations of five boreal species, Pinus banksiana Lambert, Pinus contorta Douglas ex Loudon var. latifolia Engelm., Picea glauca (Moench) Voss, Picea mariana (Miller) Britton Sterns, & Poggenburg and Populus tremuloides Michx, as a function of sapwood depth, in each cardinal direction, and outer bark diameter at breast height. This analysis will provide insight into creating more accurate sapwood depth-leaf area allometric models.
2. Materials and Methods
2.1. Field Sites and Data Collection
Wood cores were collected during two different field campaigns (2003 and 2004) in three sites: Kananaskis Valley and White Court, Alberta; and Prince Albert National Park (PANP), Saskatchewan; all in Canada. Kananaskis Valley is a Montane closed forest formation [37] within the Rocky Mountains [38,39]. The Montane forest is classified as an ecoregion within the Cordilleran Ecoprovince with a particular mix of physiography and air masses leading to unique climatic conditions [39]. The average altitude of the region within the Kananaskis Valley that was sampled in this study was 1390 m above sea level (m.a.s.l.). In general, the Montane forest has an average annual precipitation of about 515 mm. The summer mean annual temperatures range from 5.1 °C to 18.9 °C while the winter mean annual temperatures are from −11.3 °C to −0.2 °C. The average annual temperature is 3.6 °C but temperatures can easily drop to freezing at anytime of the year as the annual average minimum temperature is −2.7 °C [40]. Within Alberta, the Montane forest maintains the warmest temperatures during the winter than any other forested ecosystem. The reference soil is eutric-brunisol (Eutric Cambisol in World Reference Base for Soil Resources (WRB) [41]), but gray-luvisols (Gleyed Luvisol in WRB [41]) are also common [39]. This type of forest has ridged foothills and a marked rolling topography [42]. The species sampled at this site were Pinus contorta, Picea glauca, and Populus tremuloides.
The Whitecourt forest is within the mid boreal mixedwood ecoregion [39] and considered a closed forest formation [43] in the Southern Alberta uplands [42]. The mean altitude of the sampled location in the Whitecourt forest is 782 m.a.s.l. This area receives roughly 544 mm of precipitation annually and experiences a mean annual temperature of 2.9 °C, a miminum temperature of −2.7 °C, and a maximum average annual temperature of 8.5 °C [40]. Like the Kananaskis Valley, Whitecourt´s soil types are eutric-brunisol (Eutric Cambisol in WRB [41]) and gray-luvisol (Gleyed Luvisol in WRB [41]), but the latter one is the reference soil [38,39]. The soil type in very-poorly drained sites is mainly gleysol (Eutric Gleysol in WRB [41]) with a high concentration of organic matter, which are the preferred sites of Picea mariana [38]. Opposite to this, the well-drained areas with eutric-brunisols are populated by Pinus banksiana individuals [38,39]. Two pure stands of Pinus banksiana and Picea mariana were selected for sampling.
PANP straddles the northern boreal forest (in the northern part of the park) and aspen parkland (in the southern part of the park) ecozones of Saskatchewan. With gentley rolling hills, the elevation ranges from 430 m.a.s.l. to 730 m.a.s.l. across the park with the study site elevation being closer to 530 m.a.s.l. The park experiences an annual precipitation of 428 mm per year, an annual average temperature of 1.4 °C, a minimum average annual temperature of −4.7 °C and a maximum average annual temperature of 7.5 °C [40]. The soils are primarily a grey wooded podzol [44] (Humic Podzol in WRB [41]) with fibrisol (Histosol in WRB [41]). Stands of Populus tremuloides, Picea mariana and Pinus banksiana were selected for sampling in PANP.
Sampling sites were selected by identifying the dominant species in a stand/plot and by selecting as pure a plot as possible (i.e., only containing one or at most two species). We selected mature trees (i.e., not saplings) in relatively small regions that involved only small variations in slope and elevation. The crown class of all sampled trees were relatively high and could be considered “dominant” or “co-dominant”. To the authors’ knowledge, no active, managed or intentional silviculture occurred in any of the sampled stands. Two of the study sites sampled are in protected parks (PANP is a national park and Kananaskis is a provincial park) in which logging is prohibited and only natural processes and the natural fire cycle govern stand history and development. The authors believe that the trees in PANP and Kananaskis are anywhere from 50 to 75 years old (as affected by the last fire). The Whitecourt field sites were located close to the town of Whitecourt, Alberta and are believed to be as old as the trees in PANP and Kananaskis.
Using a Haglof Increment Borer of 200 mm length and 5.15 mm diameter, trunk wood cores were extracted at a height of 1.3 m from trees of the five diffferent species and analyzed with the microscope. The sampled trees were selected based on their outer bark diameter at breast height (DBH), applying the stratified sampling method. Stratified sampling is where the population is divided into levels or strata that represent clearly defined groups within the population which are then sampled independently (and randomly) from each of those levels [45]. Within a stand, the authors observed the DBH of all trees, and based on the maximum and minimum values of DBH within the stand, we then sampled trees that were close to the maximum, minimum and average DBH and values in between. Each tree was cored in its four cardinal points, and all cores were extracted during August of each year. The holes in the trees were sealed with a wax made of natural resins to prevent infestations. The cores were wrapped in foil and kept in sealed bags in a cold environment until they were analyzed to determine sapwood depths (sd). The DBH of each cored tree was also measured.
2.2. Measurement of Sapwood Depth and Estimation of Sapwood Area
The sapwood depth of the extracted wood cores was measured by differentiating wood tissues on safranin stained, thin cross-sectional slices of each wood core using a microscope with an ocular micrometer accuracy of 0.01 mm [46]. Basic concepts of wood tissue anatomy were used for differentiation of primary and secondary xylem (e.g., vessels, tracheids, density of conducting elements, parenchyma, starch grains, etcetera). Also, to avoid over- or under-estimations, close attention to some confounding factors was taken into account, such as the water content in heartwood and wetwood [47], pathological conditions (e.g., wood invasion for pathogens, injuries, age-growth), and change in wood coloration that can create false sapwood identification at a first glance [48,49].
To illustrate each species’ wood tissue anatomy, images of sapwood and heartwood were captured on Scanning Electron Micrographs (Figure 1, Figure 2 and Figure 3). Micrographs of conifer trees show some singular sapwood characteristics such as the presence of bordered pits and open resin canals. Here, the open resin canals are rounded, empty holes randomly distributed in the sapwood, and they are larger than the tracheids. The heartwood lacks bordered pits and pit membranes adhere to one side of the pit. The pits are filled with fibres and the tracheids’ walls become thicker.
In the Populus tremuloides samples, the vessels are widely spread in the sapwood (diffuse-porous) and fibres between them sustain the entire sapwood structure. When the sapwood loses its sap-conducting capability, those vessels are sealed either with tyloses or gums, and the sapwood becomes heartwood (see the micrographs in Figure 3). Tyloses are the key feature for distinguishing between sapwood and heartwood. Populus tremuloides has tyloses in its sapwood as well; however, the increment of tyloses in its heartwood is considerably higher.
Other features used for sapwood recognition were the presence of bacteria and starch grains (not visible in the micrographs), as well as pitting between tracheids and the ray tracheids. For the majority of the samples, it was possible to measure sapwood depth to an accuracy of 0.01 mm by using the microscope ocular micrometer. The number of cores per species in which sapwood depth was successfully measured are shown in Table 1 for each species and in each cardinal direction. We did not include in the analysis some cores that were damaged to an extent that prevented an accurate estimate of sapwood depth. Basic statistics for the cores are shown in Table 1.
Sapwood cross-sectional area (SA) may be estimated as the region lying between two concentric circles within a tree’s cross-section. The outermost circle borders the bark and vascular cambium, while the innermost one bounds the heartwood. These circles by nature are irregular but tree trunks can be deemed as having a cylindrical shape, and thus, Equation (1) can be used to estimate the cross-sectional sapwood area:
where is the average sapwood depth (to take into account the variation around the tree), computed using each tree’s sapwood depth (cm) at each cardinal point—North (N), South (S), East (E), West (W)—sdN, sdS, sdE and sdW, respectively. The symbol sd simply refers to a sapwood depth and sdcp refers to a sapwood depth in a cardinal direction.
3. Results
3.1. Pinus banksiana Allometry
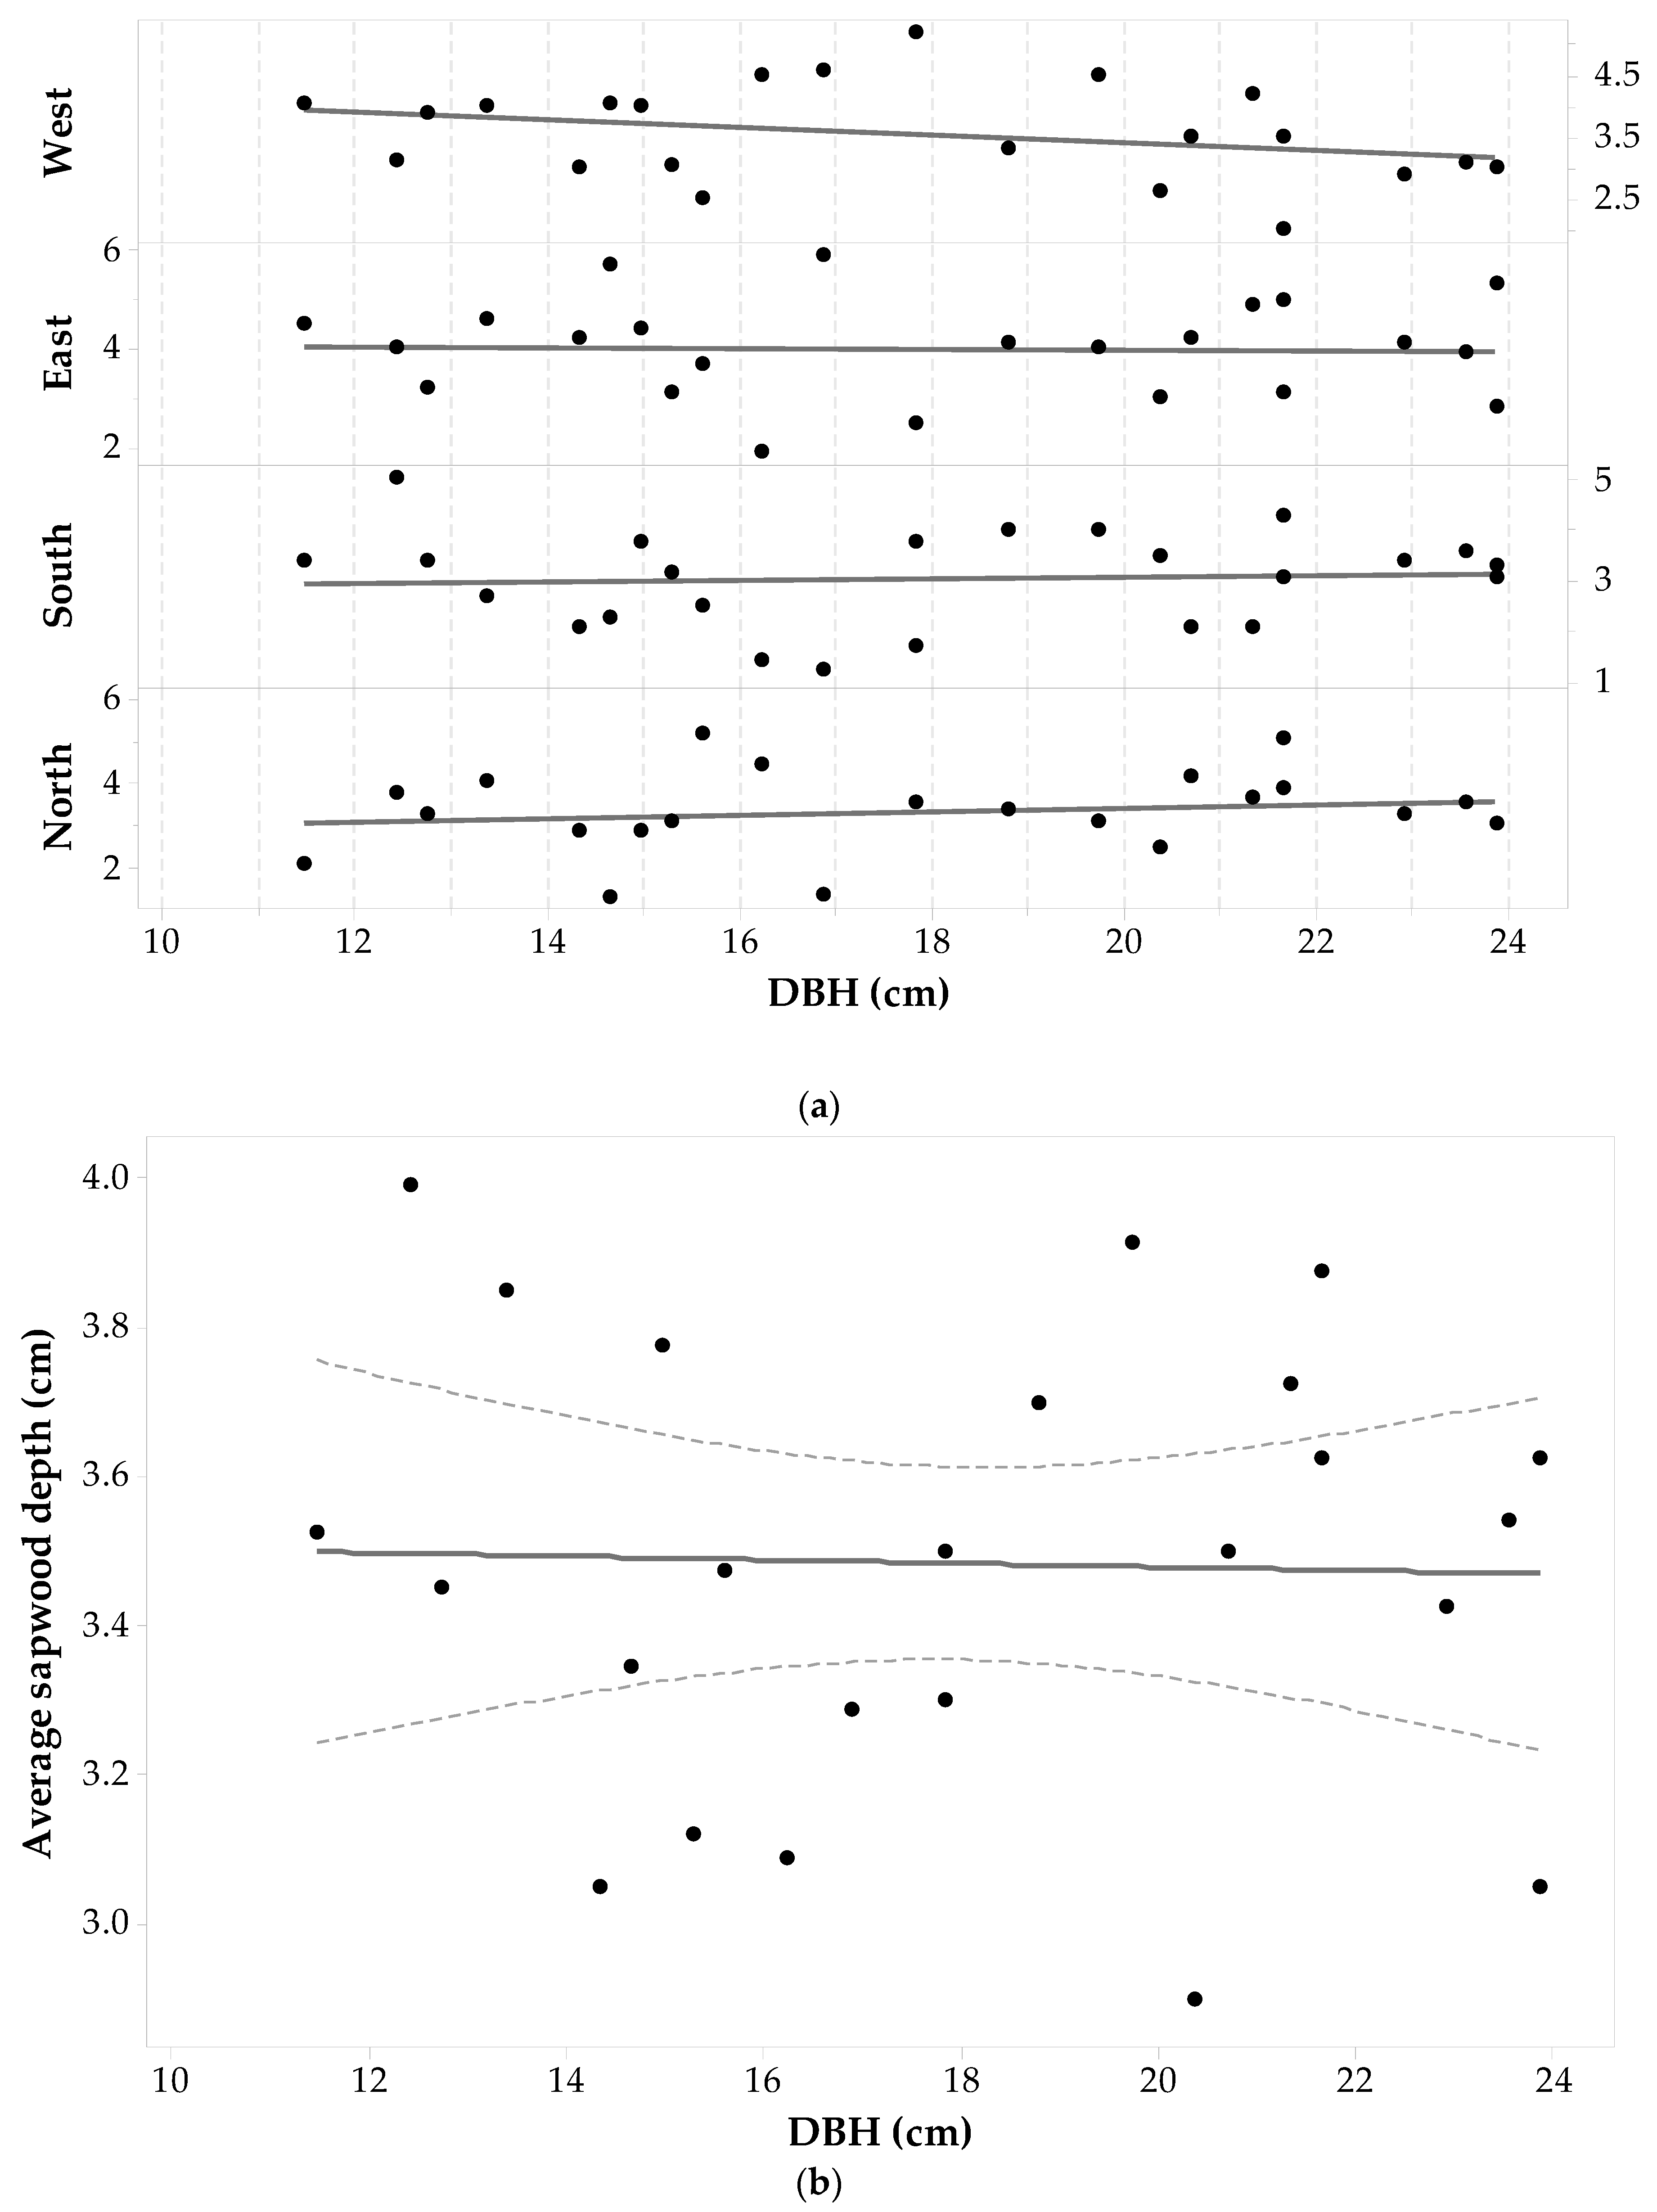
The cores of 24 Pinus banksiana trees (96 wood cores) were successfully analyzed under the microscope. The presence of tylosis—a mechanism that seals injured sapwood—makes it difficult to determine the heartwood-sapwood boundaries (tylosis is well explained by [50]) resulted in two cores being thrown out (as seen in Table 1). Pinus banksiana DBH ranged from 11.5 cm to 23.9 cm. Table 1 shows that the sdE value had the largest standard deviation (1.01 cm), and sdW had the lowest, for this species (0.79 cm). All the minimum values shown in Table 1 for this species were observed in individuals with a less than average DBH (i.e., DBH ≤ 17.83 cm) with the exception of a tree with a DBH of 21.65 cm and an sdW of 2.00 cm. For two individuals in which sdE and sdW are missing due to wood decay, the is the average of the remaining three sides.
Figure 4a shows the sapwood depths determined for each core plotted versus DBH in each direction. The largest sapwood depths are observed on the North-East sides for 66% of the trees, leaving 34% with the largest sapwood depths on the South-West sides. A one-way Analysis of variance (ANOVA) with repeated measures suggests that cardinal direction has a significant effect on Pinus banksiana sapwood depths (α = 0.05, F3,91 = 3.78, p-value = 0.013). A pairwise comparison indicates that there is a significant statistical difference between sdS and sdE (with Bonferroni p-value = 0.031). There was also a significant difference between sdE and sdW (with Bonferroni p-value = 0.031).
Pinus banksiana sapwood depth is heterogeneous around the tree trunk and there is no significant relationship between sapwood depth and DBH (ANOVA statistics for a general linear model between DBH and sd in each cardinal direction for each tree, produces F3,31 = 0.37, p-value = 0.993, α = 0.05). Pearson’s correlation (ρ) between DBH and each set of cores for each cardinal point shows low negative correlations with the East and West sides (−0.03 and −0.32, respectively), and low positive correlations with the North and South sides (0.18 and 0.06, respectively), none of which were significant. Figure 4b shows that the average sapwood depth is not well correlated with DBH (ρ = −0.3) and the hypothesis of their Pearson’s correlation coefficient being zero resulted in a p-value > 0.9 (α = 0.05). Fitting a general linear regression model between and DBH produced an adjusted coefficient of determination equal to 0.00.
With regards to DBH--SA allometry, (Equation (1) and Figure 4b) increases in SA for this species would be predominantly a function of increasing tree diameter and not related to sapwood depth, which seems to remain constant and independent of tree size. This suggests that in mature Pinus banksiana, the sapwood depth may be quasi-constant as the individual grows (at least for individuals with DBH ranging from 11.5 cm to 23.9 cm). This constancy in sapwood depth was also found by [51] for eight different rain forest species.
3.2. Pinus contorta Allometry
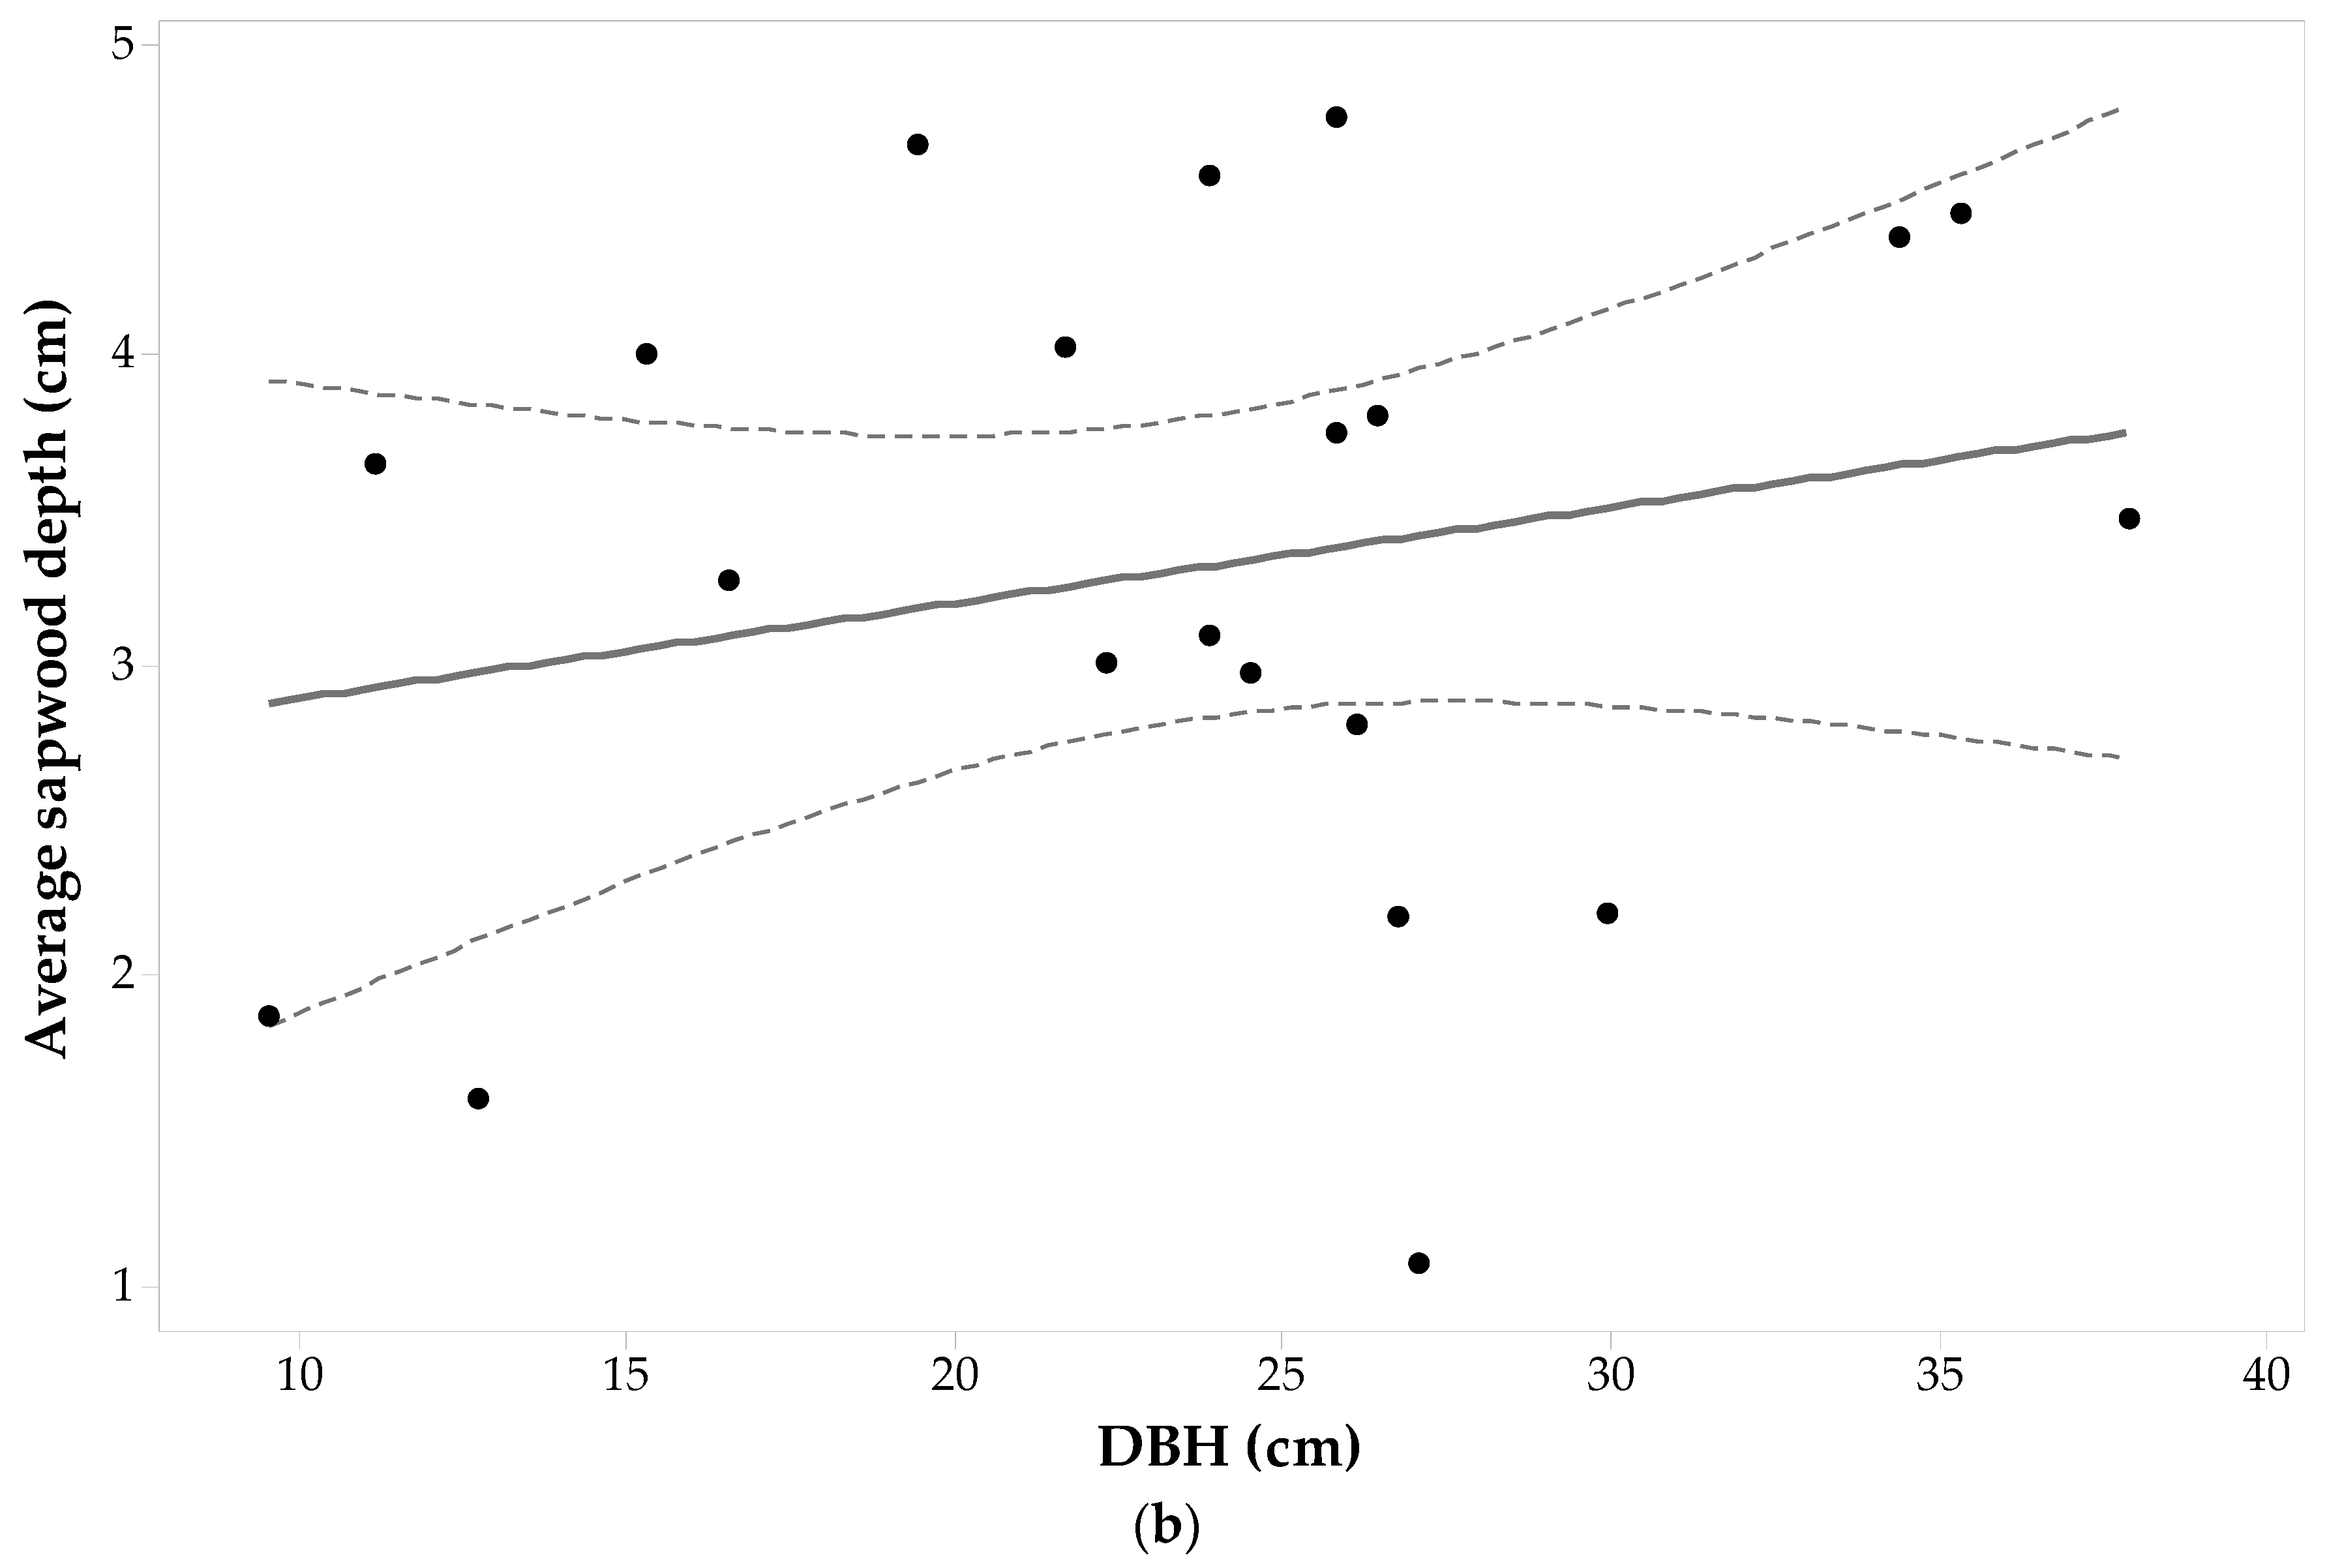
A total of 36 wood cores from 9 Pinus contorta trees were analyzed but only 35 were used for analysis due to the presence of tylosis. At the four cardinal points, the maximum sapwood depths ranged from 4.8 cm to 5.8 cm and these maximum values pertain to trees with DBH > 23.80 cm (the sample mean). The sapwood depth minimum values were also observed in trees with DBH > 23.80 cm. The data also demonstrate a heterogeneous sapwood growth pattern around the tree trunk. For instance, the smallest sd (0.9 cm) was found in the East side of one of the largest trees (DBH roughly 27.40 cm). Such a small sdE value is accompanied by an sd value that is considerably larger at the other cardinal points (e.g., this tree had sdN equal to 5.10 cm). The smallest standard deviation was observed for the sdS and sdW set of values, while larger standard deviations in sd were seen in the East and North sides.
Each individuals’ sapwood depth was plotted against its DBH and shown in Figure 5a. From the Pinus contorta sample set, 33% of the largest sapwood depths were on the East side, 33% at the North side, and 33% at the South side. Just 11% of the sample has the shortest sapwood depth in the West side, 67% at the East side, and 22% at the North side. A one-way ANOVA with repeated measures shows that cardinal direction does not have a significant effect on Pinus contorta sapwood depths (α = 0.05, F3,32 = 0.81, p-value = 0.499). Figure 5a,b both do not show any clear relationship between sd in each direction, or average sapwood depth, with increases in DBH. This is also supported by ANOVA testing a general linear model between DBH and sd in all cardinal directions for each tree. The test demonstrated no significant relationship between sapwood depth and DBH (F7,28 = 0.72, p-value = 0.659, α = 0.05). In addition, the average sapwood depth is not significantly correlated with DBH (ρ = −0.056). Thus, incremental growth in Pinus contorta DBH does not directly drive sapwood depth growth.
3.3. Populus tremuloides Allometry
The wood cores of 26 trees of Populus tremuloides (104 cores) were anatomically analyzed under the microscope. Due to the anatomical structure of this species, it was the most complex one for microscopically differentiating sapwood-heartwood boundaries. During the analysis of the Populus tremuloides sample set, eight wood cores had to be eliminated from the sample set due to the complexity involved in differentiating the wood structure.
Statistics per cardinal point for the Populus tremuloides sample set are given in Table 1. For Populus tremuloides, maximum sapwood depth values were related to trees above the average DBH, while minimum sapwood depths were found both in trees that were above or below the average DBH. The standard deviations in sapwood depth for each cardinal direction are the largest of the five-studied species with sdE having the largest in the whole data set, followed by the West and South sides. Each individuals’ sd value for each direction was plotted against its corresponding DBH and shown in Figure 6a. The figure shows that sapwood depth (for each direction) increases as DBH increases. The ANOVA for observing the relationship between sapwood depth along a cardinal direction and DBH (F20,75 = 7.97, p-value < 0.001, α = 0.05) shows that changes in sdcp correspond to changes in DBH, assuming that sdcp is independent of cardinal direction. The largest standard deviation between sdcp for a single tree occurs for the bigger trees (DBH from 27.7 cm to 38.2 cm). From the whole set of wood cores of Populus tremuloides, 58% percent have the largest sapwood depths at the North and East sides, while 50% have the shortest sapwood depths at the South and West sides. There are individuals having the largest sapwood depths at the South-West sides (42%) and the shortest at the North and East sides as well (38.5%). A one-way ANOVA test with repeated measures suggests that there is no significant cardinal directional effect on sapwood depth (F3,75 = 0.733, p-value = 0.536, α = 0.05).
Figure 5b shows a fitted linear regression model between average sapwood depth and DBH. A regression analysis produced a model of the following form—Equation (2):
The linear relationship is significant with a F1,24 = 26.41, p-value < 0.001, α = 0.05 and suggesting that sapwood depth increases at a rate of approximately 24% of diameter increase. With respect to DBH--SA allometry for this species, for the whole sample set, there are increases in both and DBH, thus compounding the contribution to increases in SA. However, it can be appreciated that small individuals can reach large SA if is large (e.g., individual with SA = 558.02 cm2); and conversely, larger trees have a small SA if is small (e.g., individual with SA = 148.35 cm2).
3.4. Picea mariana Allometry
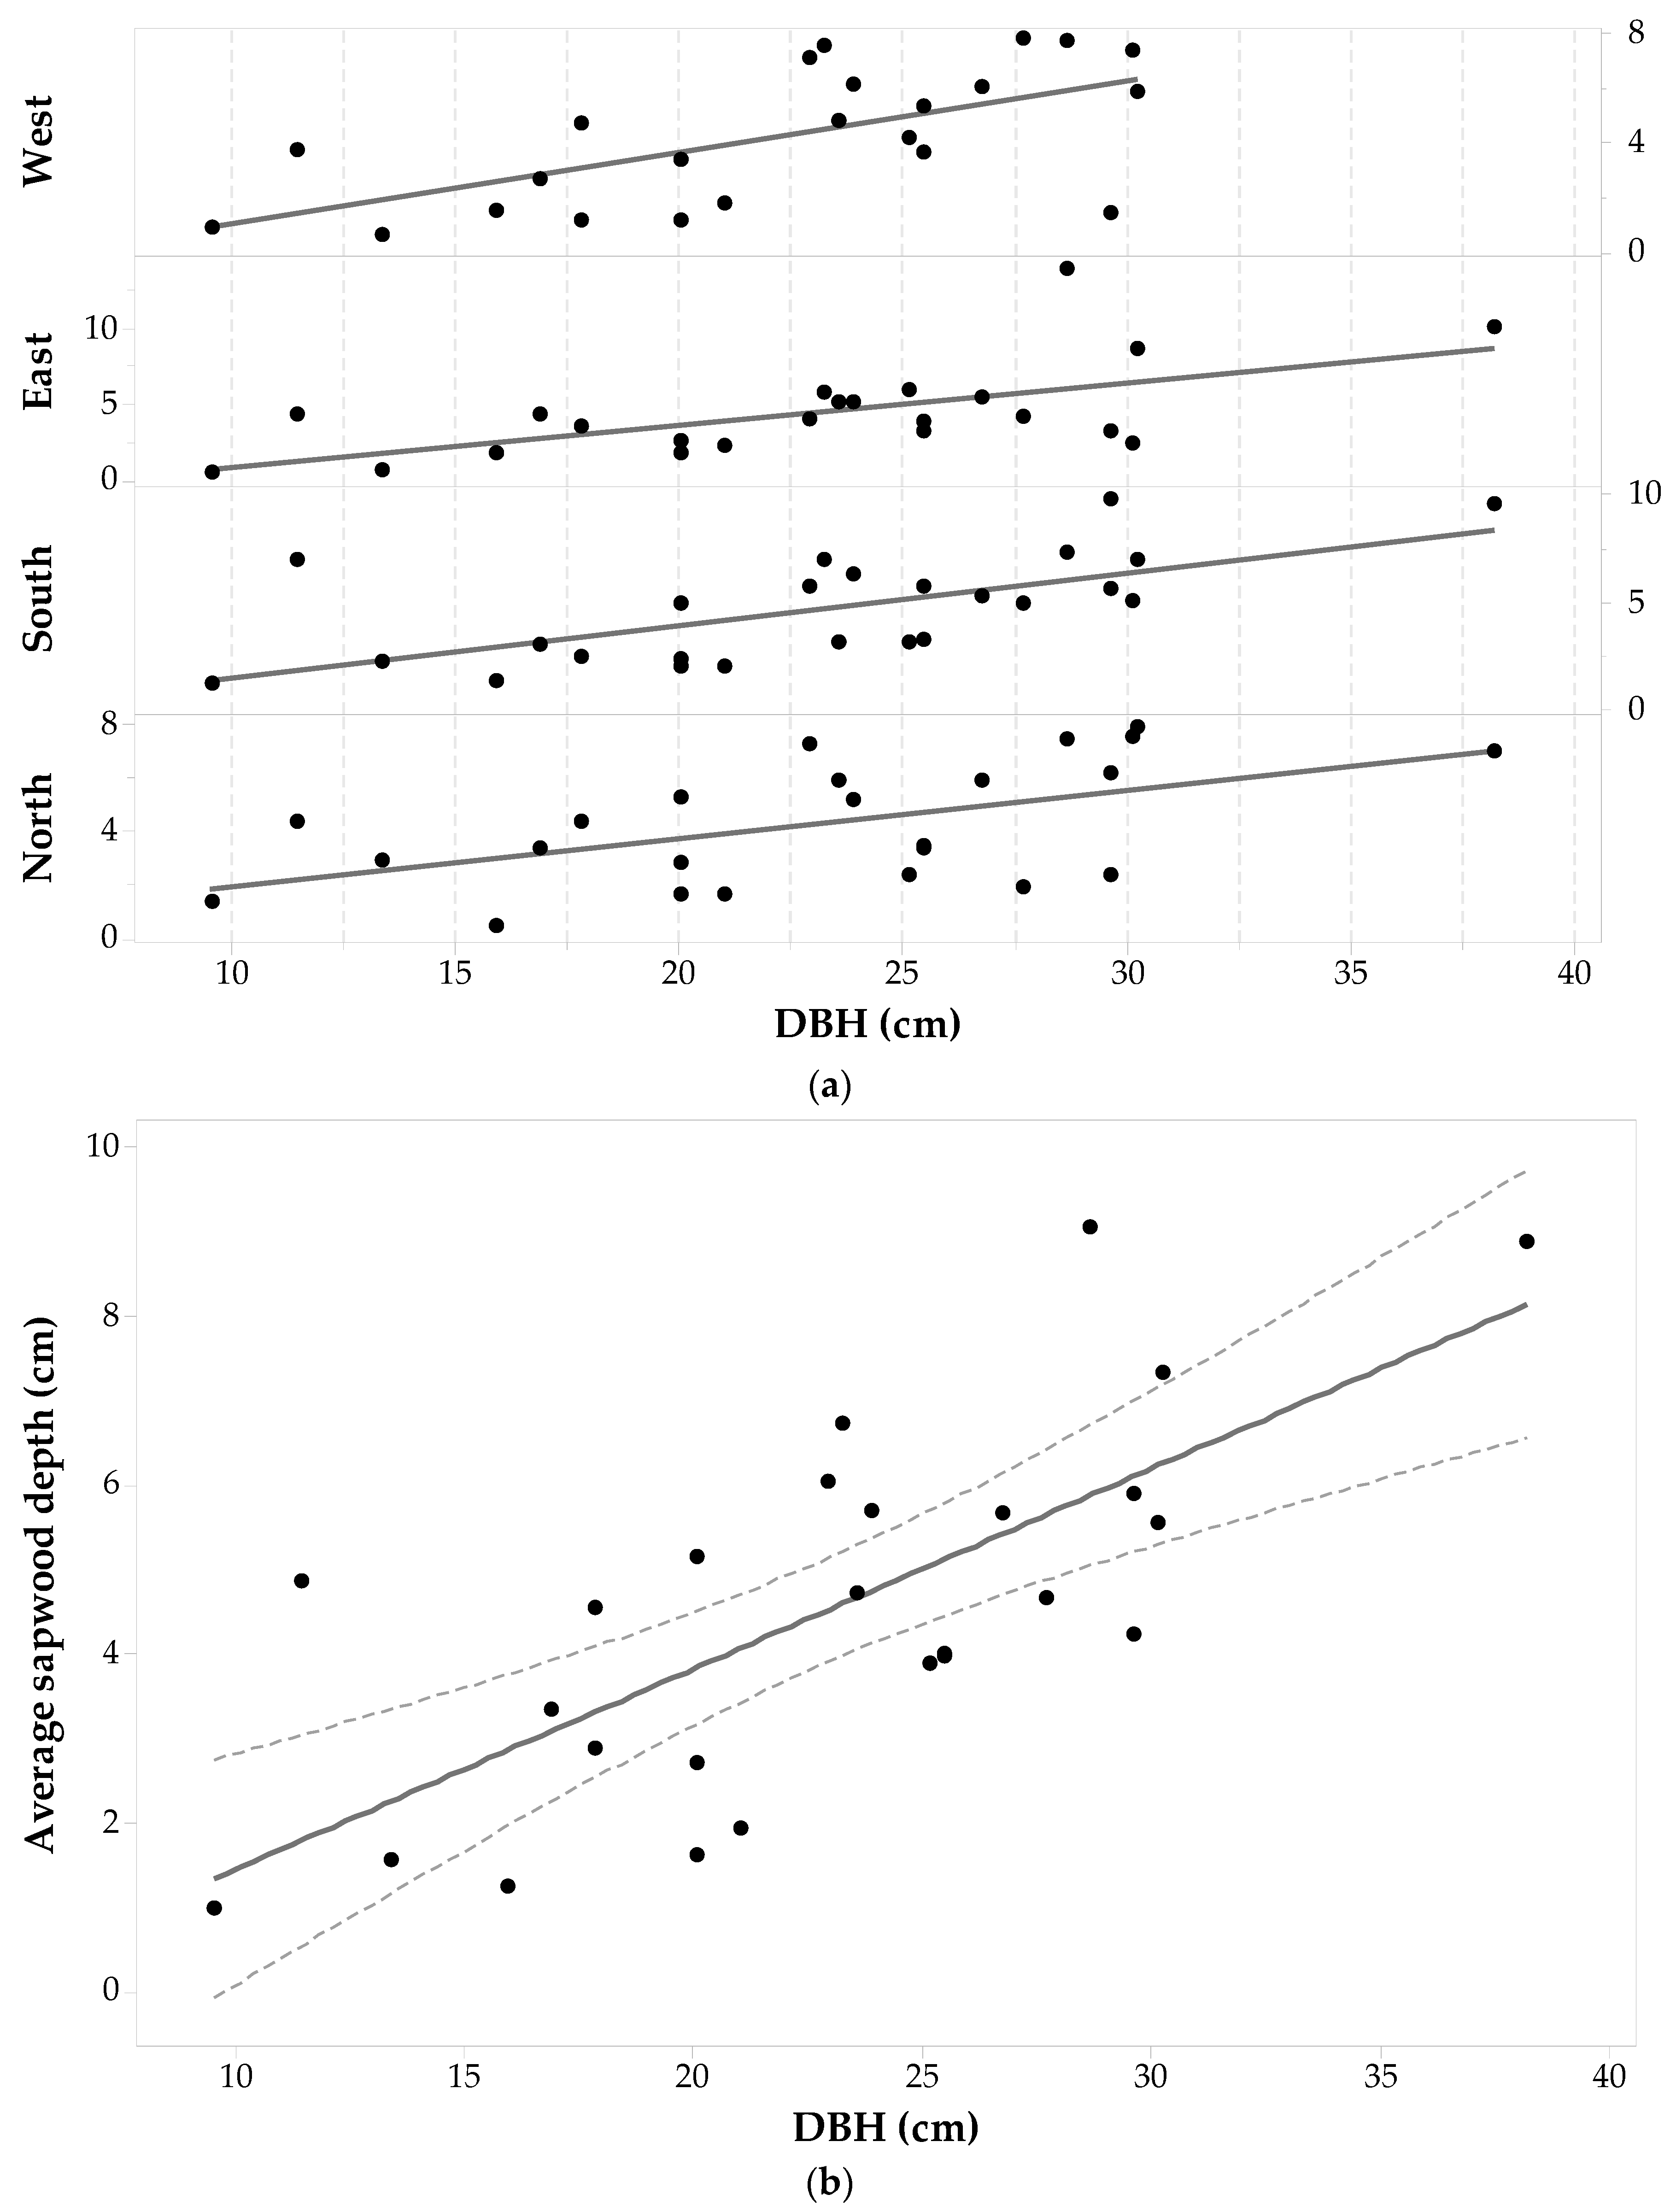
Twenty-one Picea mariana trees (84 cores) were suitable for analysis with the microscope. This coniferous species presented several problems due to wood decay and malformations that made the differentiation of sapwood-heartwood boundaries difficult. The final Picea mariana sample set (see Table 1) consisted of trees with DBH ranging from 9.5 cm to 37.9 cm. In this sample set, an outlier was found on the West side of an individual with a DBH of 15.28 cm (sdcp = 7.30 cm) and was removed from the analysis. Statistics of sapwood depths for the Picea mariana sample set are given in Table 1. The last column of Table 1 shows the standard deviation in sapwood depth across each cardinal point. The smallest standard deviation is observed for sdN values, followed by the sdW values. The largest is seen in the sdE values. Note that these sdcp values have similar patterns to Pinus contorta and Pinus banksiana individuals.
Individual sdcp values are plotted against DBH and shown in Figure 7a. Sixty seven percent of the Picea mariana sample set have the largest sapwood depths at the North and East sides (38% from the East side and 29% from the North side), while 52% have the shortest sapwood depths on the South and West sides (38% from the South and 14% from the West). Furthermore, there are trees having the largest sapwood depths on the South-West sides (33% with 4% from the South and 29% on the West) and the shortest on the North and East sides as well (48% with 24% on the East and 24% on the North). Thus, the North-East side dominates the largest sapwood depth values, and the South-West side develops the smallest sdcp. However, a one-way ANOVA with repeated measures shows that the effect of cardinal direction on sd values is not statistically significant (F3,63 = 0.906, p-value = 0.444, α = 0.05). Figure 7a does not appear to show a clear relationship between DBH and sapwood depth but ANOVA statistics report that there is a significant relationship with F18,61 = 4.01, p-value < 0.001, α = 0.05. Figure 7b is a plot of and DBH with the following fitted linear regression model—Equation (3):
This regression (between and DBH) is not statistically significant (unlike the general linear model ANOVA between all sdcp and DBH quoted above) with F1,19 = 0.97, p = 0.338, α = 0.05. The low value of fitted line slope (0.031) clearly shows that the average sapwood depth does not increase significantly with increasing DBH. This is likely due to the influence of the sd on the East side which is actually seen to decrease with DBH, as shown in Figure 7a.
3.5. Picea glauca Allometry
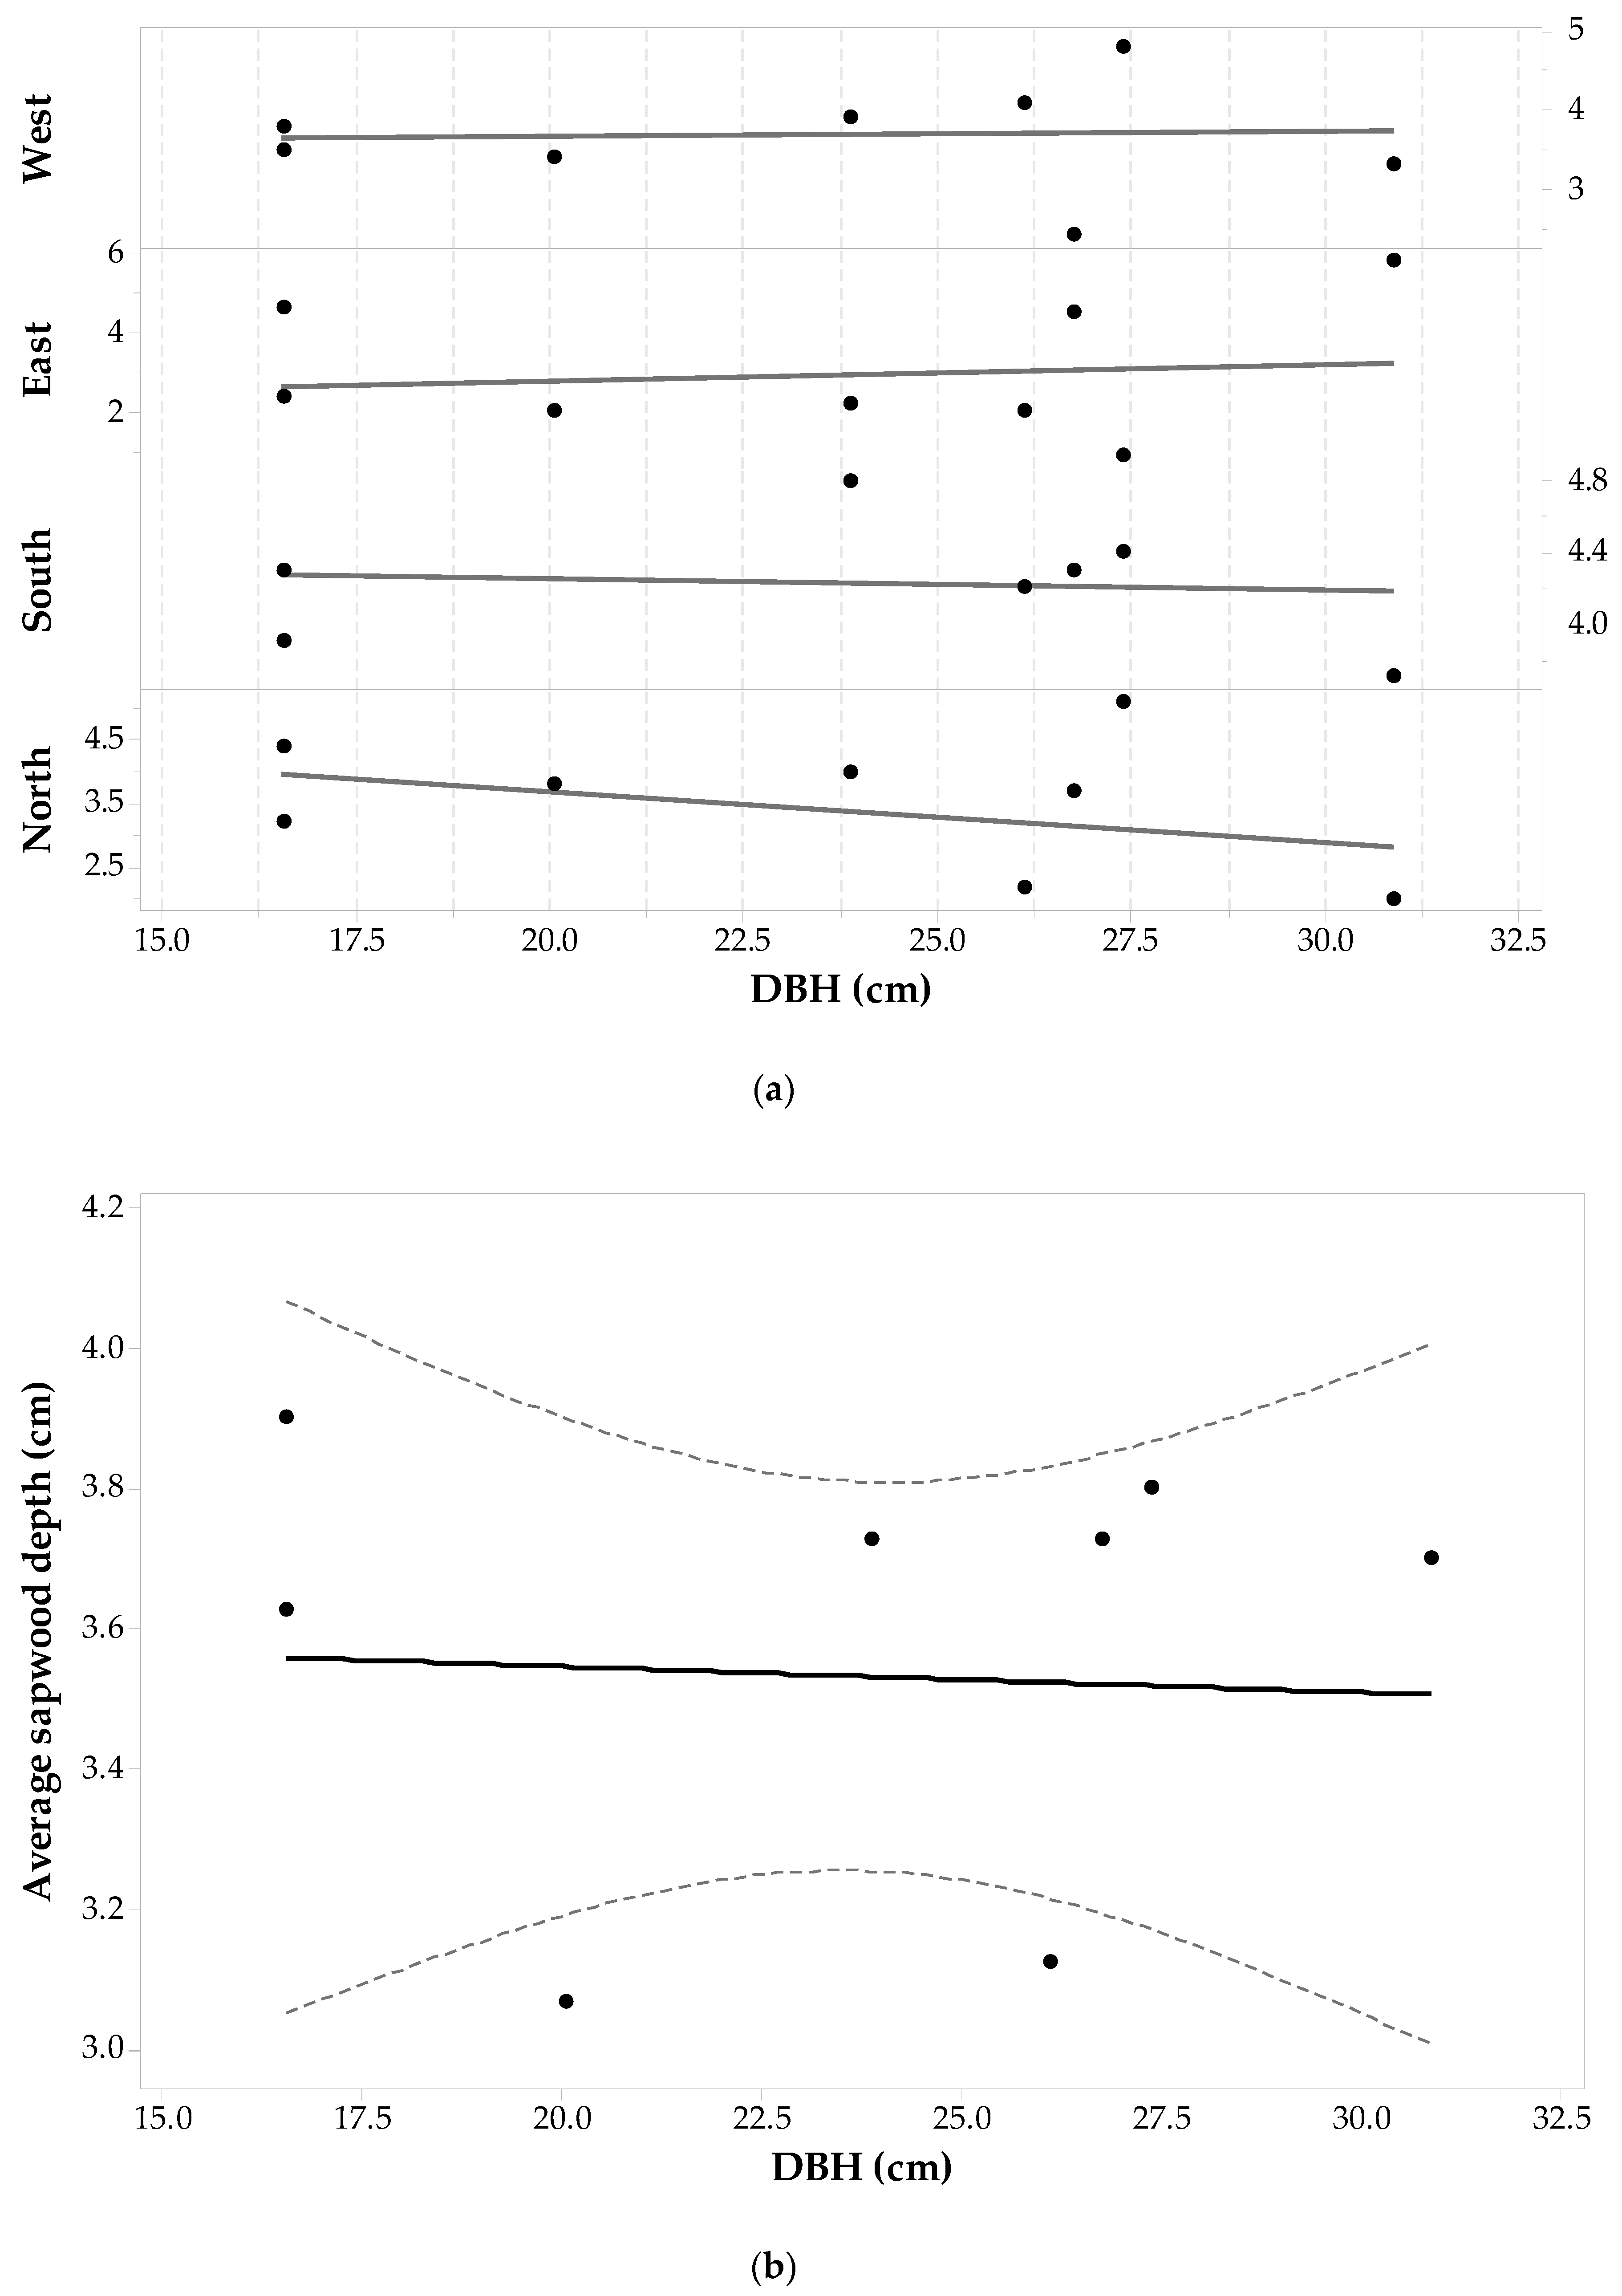
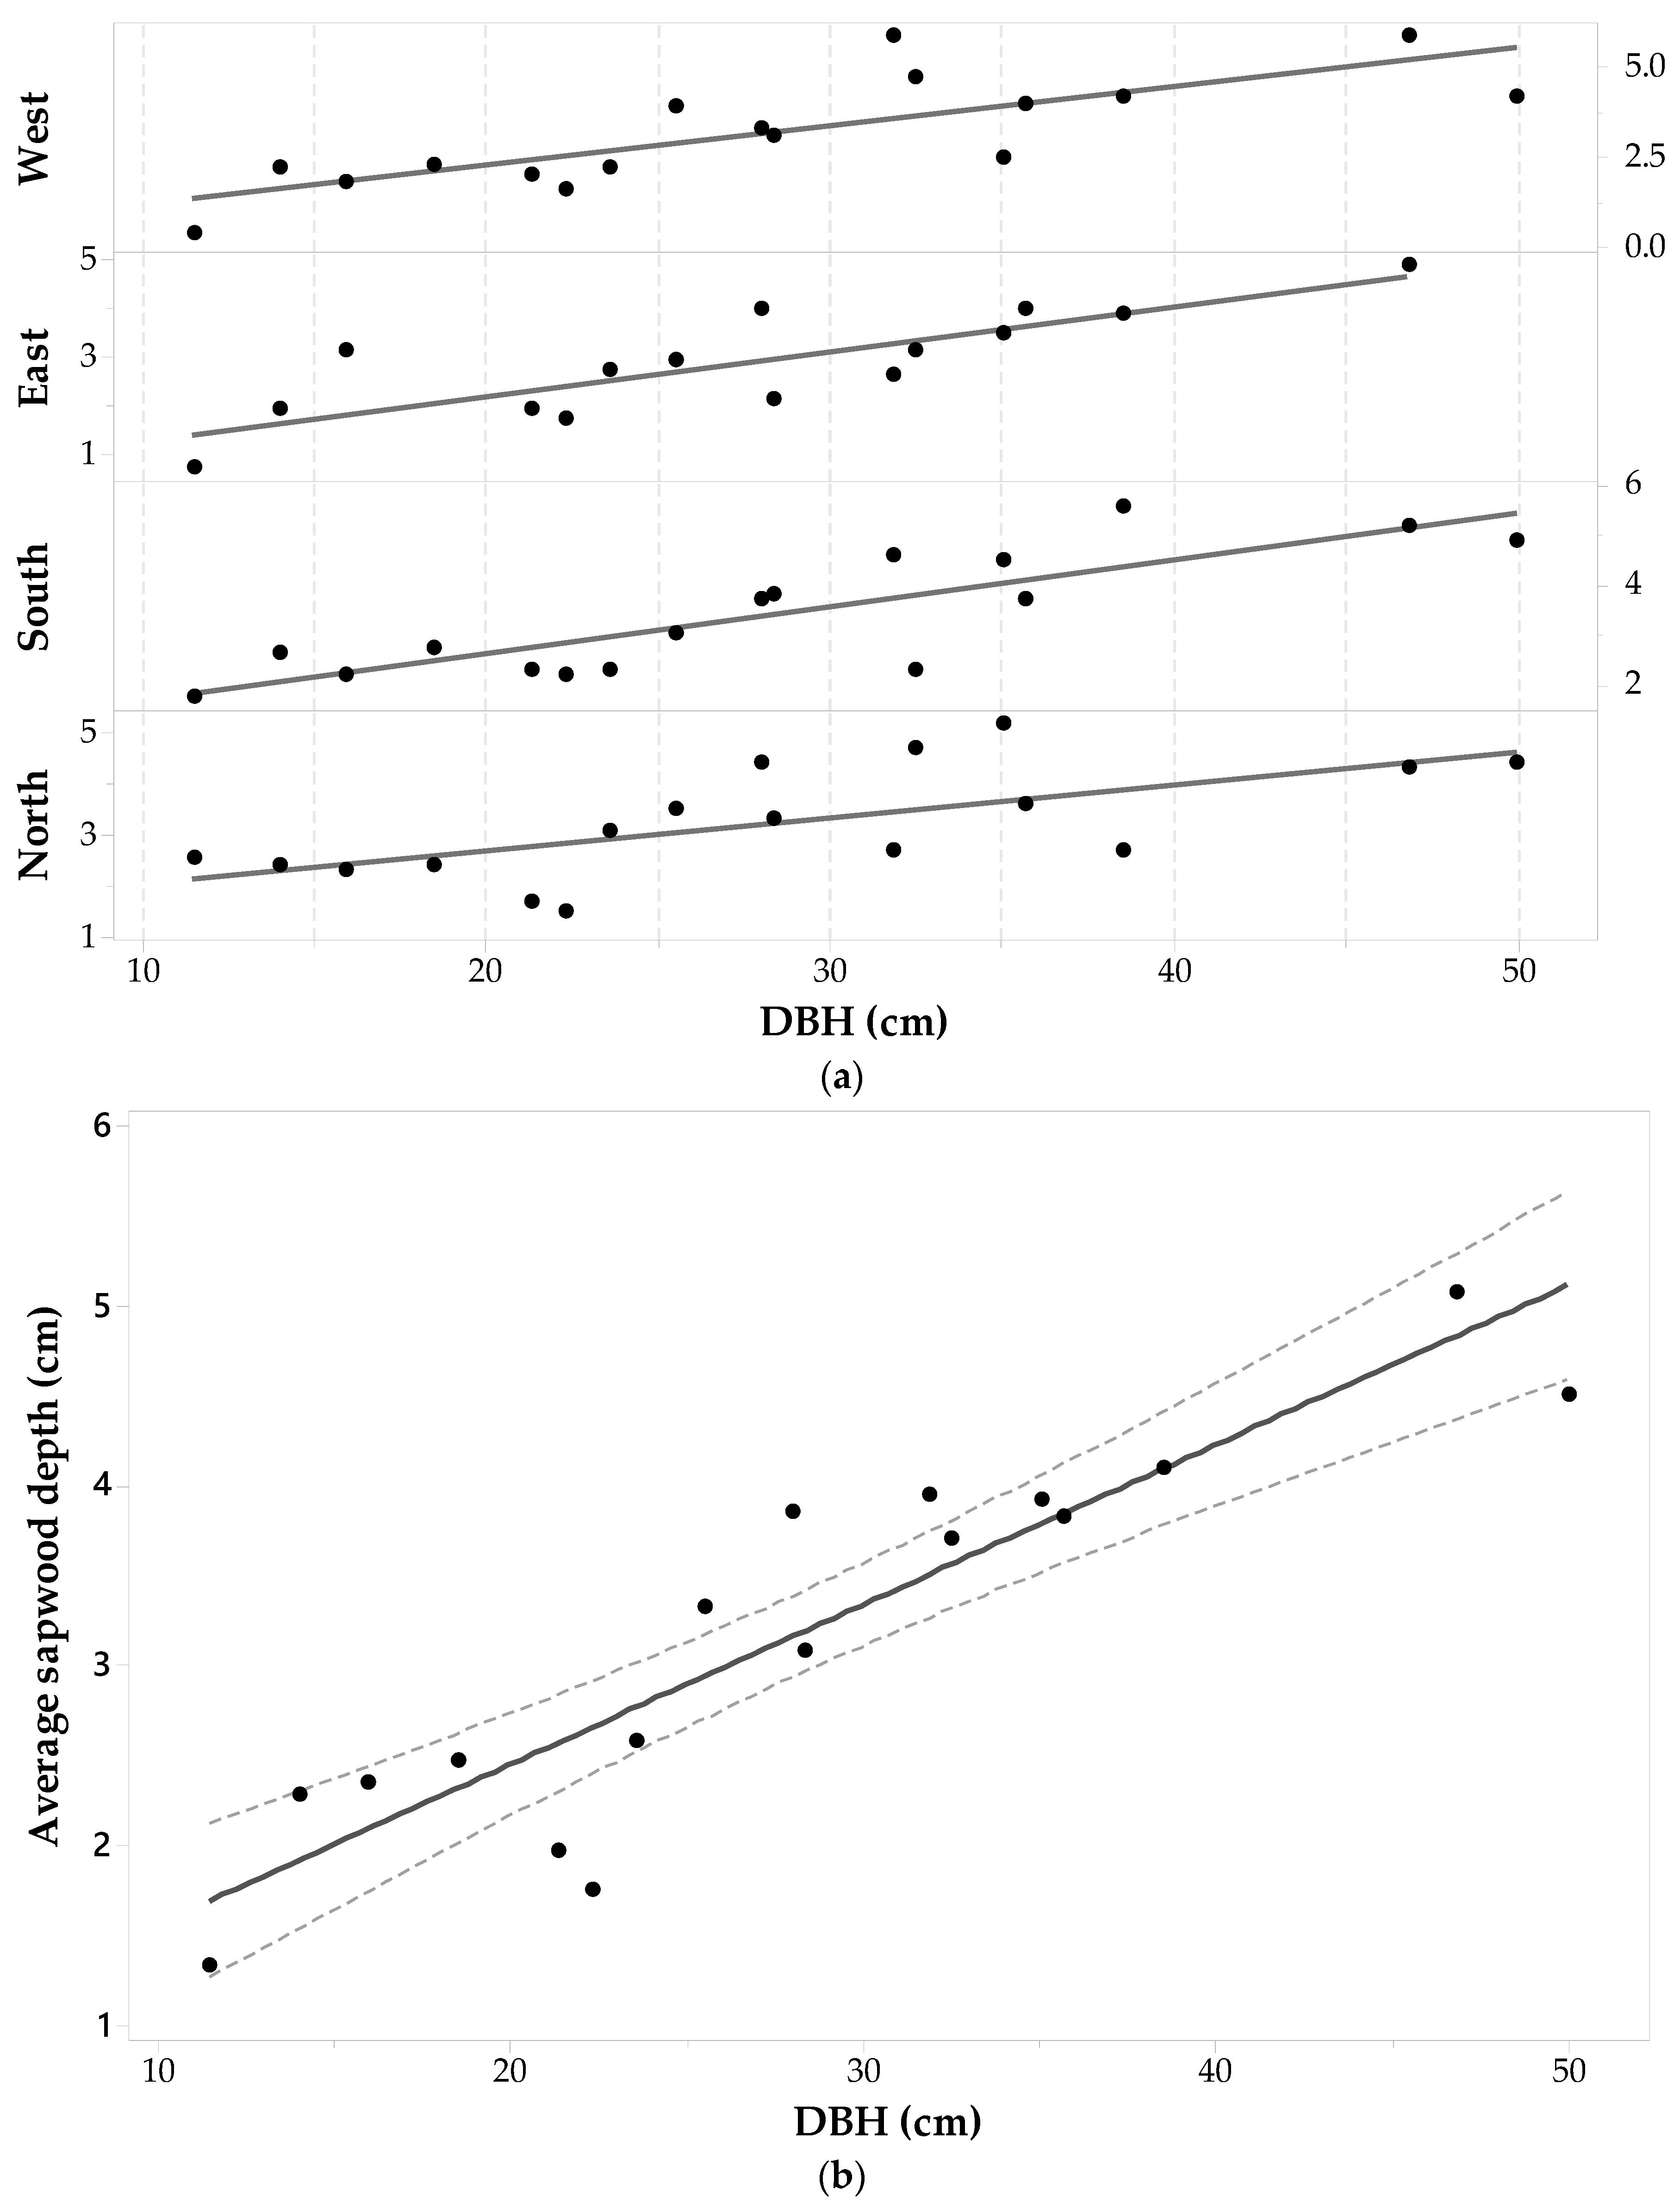
The Picea glauca sample set was comprised of 68 wood cores from 17 individuals with a DBH ranging from 11.5 cm to 50 cm. Statistics of measured sapwood depths in the four cardinal points are given in Table 1 (with two cores on the east side being removed because no sapwood depth value could be obtained) and Figure 8a shows a plot of sdcp versus DBH for each core. The maximum sdcp values range between 4.90 cm and 5.90 cm and were measured in trees with a DBH > 28.18 cm (i.e., the average DBH). Minimum sdcp values range between 0.35 cm and 1.72 cm and pertain to trees with DBH ≤ 28.18 cm. The last column of Table 1 shows that the largest standard deviation is for sdW values, with lower variations for sdE and sdS. While the smallest standard deviation was observed for the sdN values, it is still a large value (1.08 cm). A one-way ANOVA with repeated measurements shows no significant effect of cardinal direction on sd. Thus, it seems that there is no preference in Picea glauca to grow thicker or thinner in a specific direction (F3,51 = 2.41, p-value = 0.078, α = 0.05). This last statement is independent of the fact that each Picea glauca individual still has a maximum, minimum and intermediate sdcp around the tree trunk.
Figure 8a does show that each individual’s sdcp generally tends to increase as DBH increases. The ANOVA testing the similarity between mean values of sdcp and DBH drew similar conclusions: there is a significant trend in sdcp with DBH (F16,49 = 7.01, p-value < 0.001, α = 0.05). Therefore, changes in sdcp are driven by changes in DBH. Figure 8b is a plot of versus DBH and a fitted linear regression model, which took the following form—Equation (4):
This relationship was significant with F1,15 = 78.01, p-value < 0.001, α = 0.05 and showed the strongest linearity between sapwood depth and diameter at breast height for all the species.
4. Discussion
The sapwood allometry results for the five boreal species results concur with previous works stating that the depth in sapwood is not homogenous around the tree trunk [49,52,53]. The five studied species tended to have small sd values which is attributed to the fact that in the Northern Hemisphere, the South sides are exposed to much more solar radiation than North-facing sides [54,55]; thus, the South sides tend to have xeric conditions that are a constraint for the trees with respect to water availability and variability in microclimate. Hence, it is believed that trees tend to have smaller sapwood depths as a defence mechanism (i.e., to avoid losing large amounts of water).
In comparison with the other three coniferous species, the Picea mariana sdcp and values have the lowest standard deviation which could be attributed to tree growth requirements. This species is known to grow in high soil moisture conditions. Thus, Picea mariana individuals are normally found in flat areas, where there are high water concentrations and the sunlight is more evenly distributed at the four cardinal points along the day than on terrains with slope. Therefore, sapwood in Picea mariana is likely to grow at the same rate on any side of the tree. For Pinus banksiana and Pinus contorta individuals, there is low variability in sdW and sdN that may be attributed to a well-balanced supply of water (mesic conditions) in the North-facing sides (most of the samples were collected in sites with a North-East aspect). In Pinus contorta and Pinus banksiana individuals, there is only a small variability (seen in the standard deviation) in sdcp as the individuals grow. This may imply that for these two species in particular, the tree sapwood depth does not vary greatly as the individuals grow. Even though Picea mariana, Pinus banksiana and Pinus contorta sapwood depths remain relatively constant as the trees grow, their sapwood cross-sectional area will increase with DBH. Equation (1) gives an adequate and simple explanation of the latter statement by using the geometry of two concentric circles, where cross-sectional sapwood area is a function of sapwood depth, and DBH.
The sdcp and values for Populus tremuloides are larger than any of the coniferous species reported here. The large sdcp values in Populus tremuloides concur with the knowledge that angiosperm vascular tissues are less efficient in transporting water [50]; thus, more sapwood area might be required to fulfill the tree’s water demands. What remains similar to the coniferous trees is that each individual shows a pattern of variation in sdcp around the tree (i.e., individuals have a maximum, minimum and intermediate sdcp value). Populus tremuloides intolerance to shade [56] could expose it to warmer periods all the year round, which might also imply a larger water demand and would require the increase of sapwood to attain cool temperature as the tree grows. Also, the water demand agrees with its root system that is widely spread very close to the soil surface [56] and with the presence of larger sapwood depth in larger trees. This species adapts to a wide variety of soil types and climatic conditions [56] that makes it less sensitive in drought periods and cold temperatures. During the winter season, Populus tremuloides structure, together with the biophysical conditions of its habitat, could explain the positive, linear correlation between and DBH.
The extreme weather in the Boreal forest limits the growth rates of the trees [57]. Most gymnosperms are sensitive to weather conditions, and they have mechanisms to adapt that include tree structure and water use [57]. Picea glauca seems to be one gymnosperm that adapts to a wider range of biophysical conditions, which has earned it the adjective of being “plastic” [57]. However, within the Rocky Mountains, this species occupies sites with elevations from 1220 m to 1520 m above sea level, which exposes it to extreme temperatures [56], and during the summer time this will create a greater water demand that will translate into larger sapwood depth. The root system of Picea glauca is very flexible and widely spreads close to the ground surface—as in the case of Populus tremuloides—which will also allow the trees of P. glauca to access water and therefore, the tree will grow larger sapwood depths. The differences of wood anatomy among the four species of gymnosperms was not indicative of drastic anatomical differences that could explain why Picea glauca shows a direct relationship with DBH. However, it would be very interesting to observe if these differences are also explained by their diurnal sap flow. If sap flow data were available, it could be hypothesized that Picea glauca has a greater water demand throughout the day, and that its sap flow rates could be higher than those of Picea mariana, Pinus contorta and Pinus banksiana.
In the case of Picea glauca and Populus tremuloides, it is concluded that indeed, sapwood depth is directly proportional to DBH. Consequently, SA for these two species would show proportional increments with respect to growth in both DBH and . In contrast, increments on SA for the other three species are mainly related to increments in DBH and not to . In the case of Picea glauca, a simple linear regression analysis conclusively demonstrates the correlation between the Picea glauca, and DBH. Linear functions were fitted for each direction in Populus tremuloides but these attempts yielded lower coefficients of determination than that shown in Equation (2). Therefore, these results suggest that any attempt to estimate SA as a function of sapwood depth requires measuring sd in at least the four cardinal directions and create an average.
Table 2 shows the results of a retrospective Power analysis conducted in Minitab using the sample size and the standard deviation for each sample set in each direction. A Power of 0.8 was chosen to determine the smallest detectable difference in sapwood depth. When the difference was larger than the standard deviation, the Power was reduced and the Power analysis was re-run to provide a difference that was as close to the standard deviation as possible. Thus, for Pinus contorta in the south direction in which microscopical analysis produced only eight useable cores, a detectable difference of 0.34 cm (roughly equal to the standard deviation) with significance is possible with a Power of 70%. The power of any test is related to the probability of making a Type II error in a test of the null hypothesis; this describes the suitability of the sample size for detecting a significant effect when one actually exists. This is a function of the sample size and standard deviation. A Power of 0.8 is considered high (and the probability of a Type II error is 20%, which is a conclusion that there is no effect when one actually exists) typically. In this study, the effect of cardinal direction on sapwood depth was tested to determine if sapwood depth was influenced by cardinal direction. Of the five species studied, Pinus banksiana was the only species that showed an influence of sapwood depth with cardinal direction in a one-way Anova test with repeated measures. All other species accepted the null hypothesis that the means of all the sapwood depths in each cardinal direction were equal. For Pinus contorta, which had the smallest sample size, the Power of the test to detect a difference equal to the standard deviation was only 75% in three directions. In the sample size of eight cores compared to the samples of nine cores, the probability of a Type II error was anywhere from 25 to 30%; in fact, a significant difference between sapwood depths amoung the four cardinal directions existed that was roughly the size of one standard deviation. This is still fairly low comparatively speaking, and thus, with regard to cardinal direction, we feel that the samples sizes in this study are sufficient for producing reasonably accurate conclusions on the effect of cardinal direction on sapwood depth. For Pinus contorta, further cores analyzed using a microscopy method would strengthen the results found in this study.
In ecological studies, sample size is one of the most challenging topics. Sampling in a natural environment is challenging, time consuming and expensive, and furthermore, it was significantly challenging to apply the microscopical methods to as large a sample size as was conducted in this study. This is why techniques like the microscopical method are not widely used. Over 480 cores were extracted but even with microscopy, a reliable method for determining sapwood depths, many cores had to be discarded (over 23% of the whole sample). To the authors’ knowledge, no other study has conducted microscopic analysis for sapwood depth on as many cores as this study. Our concerns regarding the sample size and the use of those estimates to create allometric correlations concur with Kumagai [33], who reported that to avoid large errors associated with estimates of stand transpiration—scaled up using estimates of stand sapwood area—the adequate sample size is “at least 20 trees, but not necessarily more”.
In the present study, one of the advantages of using the microscopical analysis of wood anatomy is that the error associated with the sapwood depth is measurable, unlike with several of the non-destructive, destructive, and visual methods to measure sapwood depth. This error can also be taken into account for further allometric estimates. Reporting the error associated with field and laboratory measures is an alternative way to reflect the impact that small sample sizes could have on inferences or estimates. Furthermore, the variation of sapwood depth around a tree trunk is also a source of error that can be decreased by taking several wood cores around a tree trunk. Taking as an example a couple of the species sampled in this study, one could obtain large discrepancies between estimated sapwood cross-sectional areas when only measuring sapwood depth on one side of a tree (Table 3). Table 3 shows that if only one of the cardinal points of a tree is used to calculate SA, it is observed that none of the estimates will represent the actual tree’s SA. Moreover, there could be large under or overestimates of the tree’s SA resulting in potentially large errors in transpiration or allometric correlations between SA and Leaf Area, for instance. One way to avoid carrying large uncertainty into allometric studies would be to take wood core samples in the four cardinal points to measure their sapwood depth, and then using an average of sapwood depth to estimate sapwood area. The suggestion of coring in the four cardinal points is to obtain a representative sample of the site conditions based on slope, aspect, and cardinal direction.
Additionally, it was observed in our sample sets that crown class was homogenous (either dominant or codominant trees). It may be suggested to integrate crown class as another factor influencing sapwood depth; however, crown class is not rigorously defined [58]. Thus, if the crown class classification is a subjective method, it could be a hindrance in obtaining objective outcomes. It should also be noted that it is common in studies of DBH--SA allometry to simply develop functional relationships (often linear) between SA and DBH using Equation (1) and observations of and DBH. This is misleading as any metric to describe the performance of this relationship will be overinflated as SA is computed as a function of DBH. Hence, we here have only shown relationships between and DBH with Picea glauca data lending itself to a linear relationship quite well with the high coefficient of determination.
Similar studies are needed to reinforce the results of this study and to observe the variations of sapwood depth and sapwood area in different site conditions, such as slope, aspect, and climate. Also, studies rigorously classifying trees by crown class—i.e., trying to increase the objectivity of the classification method as described by Bechtold [58]—will give insight in sapwood depth variations leading to plot-level transpiration rates.
5. Conclusions
For the five boreal species Populus tremuloides, Pinus contorta, Pinus banksiana, Picea mariana, and Picea glauca studied in this paper, it is proven that there is significant sapwood depth heterogeneity at the four cardinal points. Thus, it is possible that using a single wood core to measure a tree’s sapwood depth will inaccurately estimate the tree’s cross-sectional sapwood area. It appears that the structural design and growth of sapwood depth is species-specific, and it is inaccurate to assume similar tree growth patterns in non-studied tree species. Thus, to decrease the error that sapwood depth could contribute to allometric models, or be used as a scaling factor, it is appropriate to find measurement methods that will account for the sapwood depth variability with respect to the species and tree size. Despite its complexity and time demand, the microscopical analysis of wood anatomy to measure sapwood depth reduces the error that could be carried into sapwood area estimates and into further scaling purposes, and it could be considered a compensation for the fact that in many of these studies, it is difficult to have statistically adequate sample sizes.
Acknowledgments
The authors would like to thank the anonymous reviewers for their insightful comments and review. The authors would like to thank Alberta Ingenuity Fund, The National Council of Science and Technology (CONACyT, Mexico), The Center for Environmental Engineering Research and Education (CEERE, University of Calgary), and The Autonomus Metropolitan University (UAM-Iztapalapa, Mexico) for funding this work. Thanks are also due to the Department of Geomatics Engineering and the Department of Biology (University of Calgary), the Kananaskis Field Station and their staff for in-kind contributions and assistance. Thanks are also due to field assistants Lynn D. Raaflab and D. M. McAllister.
Author Contributions
M.R.Q.-P. conducted the lab and field experiments, and together with C.V. conducted the data analysis and wrote the paper.
Conflicts of Interest
The authors declare no conflict of interest. The founding sponsors had no role in the design of the study; in the collection, analyses, or interpretation of data; in the writing of the manuscript, and in the decision to publish the results.
References
- Grier, C.C.; Waring, R.H. Conifer Foliage Mass Related to Sapwood Area. For. Sci. 1974, 20, 205–206. [Google Scholar]
- Kaufmann, M.R.; Troendle, C.A. The relationship of leaf area and foliage biomass to sapwood conducting area in four Subalpine forest tree species. For. Sci. 1981, 27, 477–482. [Google Scholar]
- Marchand, J.P. Sapwood area as an estimator of foliage biomass and projected leaf area for Abies balsamea and Picea rubens. Can. J. For. Res. 1984, 14, 85–87. [Google Scholar] [CrossRef]
- Dean, T.J.; Long, J.N. Variation in sapwood area-leaf area relations within two stands of Lodgepole pine. For. Sci. 1986, 32, 749–758. [Google Scholar]
- Gilmore, W.; Seymour, S.; Maguire, A. Foliage-sapwood area relationships for Abies balsamea in Central Maine, USA. Can. J. For. Res. 1996, 26, 2071–2079. [Google Scholar] [CrossRef]
- Sievänen, R.; Nikinmaa, E.; Perttunen, J. Evaluation of importance of sapwood senescence on tree growth using the model LIGNUM. Silva Fenn. 1997, 31, 329–340. [Google Scholar] [CrossRef]
- Mokany, K.; McMurtrie, R.E.; Atwell, B.J.; Keith, H. Interaction between sapwood and foliage area in alpine ash (Eucalyptus delegatensis) trees of different heights. Tree Physiol. 2003, 23, 949–958. [Google Scholar] [CrossRef] [PubMed]
- Delzon, S.; Sartore, M.; Burlett, R.; Dewar, R.; Loustau, D. Hydraulic responses to height growth in maritime pine trees. Plant Cell Environ. 2004, 27, 1077–1087. [Google Scholar] [CrossRef]
- Forrester, D.I.; Collopy, J.J.; Morris, J.D. Transpiration along an age series of Eucalyptus globulus plantations in southeastern Australia. For. Ecol. Manag. 2010, 259, 1754–1760. [Google Scholar] [CrossRef]
- Jones, D.A.; O’Hara, K.L.; Battles, J.J.; Gersonde, R.F. Leaf Area Prediction Using Three Alternative Sampling Methods for Seven Sierra Nevada Conifer Species. Forests 2015, 6, 2631–2654. [Google Scholar] [CrossRef]
- Vertessy, R.A.; Benyon, R.G.; O’Sullivan, S.K.; Gribben, P.R. Relationships between stem diameter, sapwood area, leaf area and transpiration in a young mountain ash forest. Tree Phys. 1995, 15, 559–567. [Google Scholar] [CrossRef]
- Cienciala, E.; Kucera, J.; Malmer, A. Tree sap flow and stand transpiration of two Acacia mangium plantations in Sabah, Borneo. J. Hydrol. 2000, 236, 109–120. [Google Scholar] [CrossRef]
- Wullschleger, S.D.; Norby, T.J. Sap velocity and canopy transpiration in a sweetgum stand exposed to free-air CO2 enrichment (FACE). New Phytol. 2001, 150, 489–498. [Google Scholar] [CrossRef]
- Wullschleger, S.D.; Hanson, P.; Todd, D. Transpiration from a multi-species deciduous forest as estimated by xylem sap flow techniques. For. Ecol. Manag. 2001, 143, 205–213. [Google Scholar] [CrossRef]
- Roberts, S.; Vertessy, R.; Grayson, R. Transpiration from Eucalyptus sieberi (L. Johnson) forests of different age. For. Ecol. Manag. 2001, 143, 153–161. [Google Scholar] [CrossRef]
- Bond-Lamberty, B.; Wang, C.; Gower, S.T. Above ground and below ground biomass and sapwood area allometric equations for six boreal tree species of northern Manitoba. Can. J. For. Res. 2002, 32, 1441–1450. [Google Scholar] [CrossRef]
- Meinzer, F.C.; Bond, B.J.; Warren, J.M.; Woodruff, D.R. Does water transport scale universally with tree size? Funct. Ecol. 2005, 19, 558–565. [Google Scholar] [CrossRef]
- Pfautsch, S.; Keitel, C.; Turnbull, T.L.; Braimbridge, M.J.; Wright, T.E.; Simpson, R.R.; O’Brien, J.; Adams, M.A. Diurnal patterns of water use in Eucalyptus victrix indicate pronounced desiccation-rehydration cycles despite unlimited water supply. Tree Physiol. 2011, 31, 1041–1051. [Google Scholar] [CrossRef] [PubMed]
- Pfautsch, S.; Macfarlane, C.; Ebdon, N.; Meder, R. Assessing sapwood depth and wood properties in Eucalyptus and Corymbia spp. using visual methods and near infrared spectroscopy (NIR). Trees 2012, 26, 963–974. [Google Scholar] [CrossRef]
- Hart, J.H. Morphological differences between sapwood, discolored sapwood and heartwood in Black locust and Osage orange. For. Sci. 1968, 14, 334–338. [Google Scholar]
- James, S.A.; Clearwater, M.J.; Meinzer, F.C.; Goldstein, G. Heat dissipation sensors of variable length for the measurement of sap flow in trees with deep sapwood. Tree Physiol. 2002, 22, 277–283. [Google Scholar] [CrossRef] [PubMed]
- Nadezhdina, N.; Nadezhdin, V.; Ferreira, M.A.; Pitacco, A. Variability with xylem depth in sap flow in trunks and branches of mature olive trees. Tree Physiol. 2006, 27, 105–113. [Google Scholar] [CrossRef]
- Wullschleger, S.D.; Childs, K.W.; King, A.W.; Hanson, P.J. A model of heat transfer in sapwood and implications for sap flux density measurements using thermal dissipation probes. Tree Physiol. 2011, 31, 669–679. [Google Scholar] [CrossRef] [PubMed]
- Waring, R.H.; Gholz, H.L.; Grier, C.C.; Plummer, M.L. Evaluating stem conducting tissue as an estimator of leaf area in four woody angiosperms. Can. J. Bot. 1977, 55, 1474–1477. [Google Scholar] [CrossRef]
- Whitehead, D. The estimation of foliage area from sapwood basal area in Scots pine. Forestry 1978, 51, 137–149. [Google Scholar] [CrossRef]
- Blanche, C.A.; Hodges, J.D.; Nebeker, T.E. A leaf area-sapwood area ratio developed to rate loblolly pine tree vigor. Can. J. For. Res. 1985, 15, 1181–1184. [Google Scholar] [CrossRef]
- Keane, M.G.; Weetman, G.F. Leaf area-sapwood cross-sectional area relationships in repressed stands of lodgepole pine. Can. J. For. Res. 1987, 17, 205–209. [Google Scholar] [CrossRef]
- Dean, T.J.; Long, J.N.; Smith, F.W. Bias in leaf area-sapwood area ratios and its impact on growth analysis in Pinus contorta. Trees 1988, 2, 104–109. [Google Scholar] [CrossRef]
- Coyea, M.R.; Margolis, H.A. Factors affecting the relationship between sapwood area and leaf area of balsam fir. Can. J. For. Res. 1992, 22, 1684–1693. [Google Scholar] [CrossRef]
- Shelburne, V.B.; Hedden, R.L.; Allen, R.M. The effects of site, stand density and sapwood permeability on the relationship between leaf area and sapwood area in loblolly pine (Pinus taeda L.). For. Ecol. Manag. 1993, 58, 193–209. [Google Scholar] [CrossRef]
- Gartner, B. Sapwood and inner bark quantities in relation to leaf area and wood density in Douglas fir. IAWA J. 2002, 23, 267–285. [Google Scholar] [CrossRef]
- Meadows, S.J.; Hodges, D.J. Sapwood area as an estimator of leaf area and foliar weight in cherrybark oak and green ash. For. Sci. 2002, 48, 69–76. [Google Scholar]
- Kumagai, T.; Nagasawaa, H.; Mabuchia, T.; Ohsakia, S.; Kubotaa, K.; Kogia, K.; Utsumia, Y.; Kogaa, S.; Otsuki, K. Sources of error in estimating stand transpiration using allometric relationships between stem diameter and sapwood area for Criptomeria japonica and Chamaecyparis obtusa. For. Ecol. Manag. 2005, 206, 191–195. [Google Scholar] [CrossRef]
- Medhurst, J.L.; Beadle, C.L. Sapwood hydraulic conductivity and leaf area sapwood area relationships following thinning of a Eucalyptus nitens plantation. Plant Cell Environ. 2002, 25, 1011–1019. [Google Scholar] [CrossRef]
- Coletta, V.; Menguzzato, G.; Pellicone, G.; Veltri, A.; Marziliano, P.A. Effect of thinning on above-ground biomass accumulation in a Douglas-fir plantation in southern Italy. J. For. Res. 2016, 27, 1313–1320. [Google Scholar] [CrossRef]
- Marziliano, P.A.; Coletta, V.; Menguzzato, G.; Nicolaci, A.; Pellicone, G.; Veltri, A. Effects of planting density on the distribution of biomass in a douglas-fir plantation in southern Italy. iForest—Biogeosci. For. 2015, 8, 368–376. [Google Scholar] [CrossRef]
- Peet, R.K. Forests and Meadows of the Rocky Mountains. In North American Terrestrial Vegetation, 1st ed.; Barbour, M.G., Billings, W.D., Eds.; Cambridge University Press: New York, NY, USA, 1988; ISBN 13-978-0-52-126198-2. [Google Scholar]
- Rowe, J.S. Forest Regions of Canada; Department of the Environment Canadian Forestry Service: Ottawa, ON, Canada, 1972; p. 177.
- Strong, W.L.; Leggat, K.R. Ecoregions of Alberta; Forestry, Lands, and Wildlife (1986–1993): Edmonton, AB, Canada, 1992; p. 59. [Google Scholar]
- Government of Canada Activities and Initiatives. Available online: climate.weather.gc.ca/climate_normals/results_1981_2010_e.html (accessed on 9 October 2017).
- Chapter 16: Correlation of Canadian Soil Taxonomy with Other Systems. Available online: sis.agr.gc.ca/cansis/taxa/cssc3/chpt16.html (accessed on 9 October 2017).
- Strong, W.L. Ecoregions and Ecodistricts of Alberta; Alberta Forestry, Lands and Wildlife, Land Information Services Division, Resource Information Branch: Edmonton, AB, Canada, 1992; Volume 1. [Google Scholar]
- Elliot-Frisk, D.L. The taiga and boreal forest. In North American Terrestrial Vegetation, 1st ed.; Barbour, M.G., Billings, W.D., Eds.; Cambridge University Press: New York, NY, USA, 1988; ISBN 13-978-0-52-126198-2. [Google Scholar]
- Soil Map of Saskatchewan. Available online: sis.agr.gc.ca/cansis/publications/surveys/sk/sk_1967/index.html (accessed on 9 October 2017).
- Quinn, G.P.; Keough, M.J. Experimental Design and Data Analysis for Biologists; Cambridge University Press: Cambridge, UK, 2002. [Google Scholar]
- Quiñonez-Piñón, M.R. Improved Techniques for Measuring and Estimating Scaling Factors Used to Aggregate Forest Transpiration. Ph.D. Thesis, University of Calgary, Schulich School of Engineering, Geomatics Engineering Department, Calgary, AB, Canada, 2007. [Google Scholar]
- Jeremic, D.; Cooper, P.; Srinivasan, U. Comparative analysis of Balsam fir wetwood, heartwood and sapwood properties. Can. J. For. Res. 2004, 34, 1241–1250. [Google Scholar] [CrossRef]
- Ward, J.C.; Pong, W.Y. Wetwood in Trees: A Timber Resource Problem; Department of Agriculture, Forest Service, Pacific Northwest Forest and Range Experiment Station: Portland, OR, USA, 1980. [Google Scholar]
- Kozlowski, T.T.; Pallardy, S.G. Physiology of Woody Plants, 2nd ed.; Academic Press, Inc.: Burlington, MA, USA, 1997; p. 411. ISBN 978-0-12-424162-6. [Google Scholar]
- Tyree, M.T.; Zimmermann, M.H. Xylem Structure and the Ascent of Sap, 2nd ed.; Springer: Berlin/Heidelberg, Germany, 2002; p. 257. ISBN 978-3-66-204931-0. [Google Scholar]
- Granier, A.; Huc, R.; Barigah, S.T. Transpiration of natural rain forest and its dependence on climate factors. Agric. For. Meteorol. 1996, 78, 19–29. [Google Scholar] [CrossRef]
- Philipson, W.R.; Ward, J.M.; Butterfield, B.G. Reaction of the cambium to gravity and to the displacement of branches. In The Vascular Cambium, Its Development and Activity, 1st ed.; Philipson, W.R., Ward, J.M., Butterfield, B.G., Eds.; Chapman and Hall LTD: Bungay, UK, 1971; pp. 159–169. [Google Scholar]
- Philipson, W.R.; Ward, J.M.; Butterfield, B.G. Variations in the size of fusiform cambial initials. In The Vascular Cambium, Its Development and Activity, 1st ed.; Philipson, W.R., Ward, J.M., Butterfield, B.G., Eds.; Chapman and Hall LTD: Bungay, UK, 1971. [Google Scholar]
- Auslander, M.; Nevo, E.; Inbar, M. The effects of slope orientation on plant growth, developmental instability and susceptibility to herbivores. J. Arid Environ. 2003, 55, 402–416. [Google Scholar] [CrossRef]
- Cienciala, E.; Mellander, P.E.; Kucera, J.; Oplustilova, M.; Ottosson-Lofvenius, M.; Bishop, K. The effect of a north-facing forest edge on tree water use in a boreal Scots pine stand. Can. J. For. Res. 2002, 32, 693–702. [Google Scholar] [CrossRef]
- Burns, R.M.; Honkala, B.H. Silvics of North America: Hardwoods; Agriculture handbook 654; U.S. Department of Agriculture, Forest Service: Washington, DC, USA, 1990; Volume 2, p. 1711.
- Andersson, F. (Ed.) Ecosystems of the World 6. Coniferous Forests, 2nd ed.; Elsevier Science: Amsterdam, The Netherlands, 2005; p. 646. ISBN 978-0-08-093313-9. [Google Scholar]
- Bechtold, W.A. Crown position and Light Exposure Classification—An Alternative to field-assigned Crown Class. North. J. Appl. For. 2003, 20, 154–160. [Google Scholar]
Figure 1.
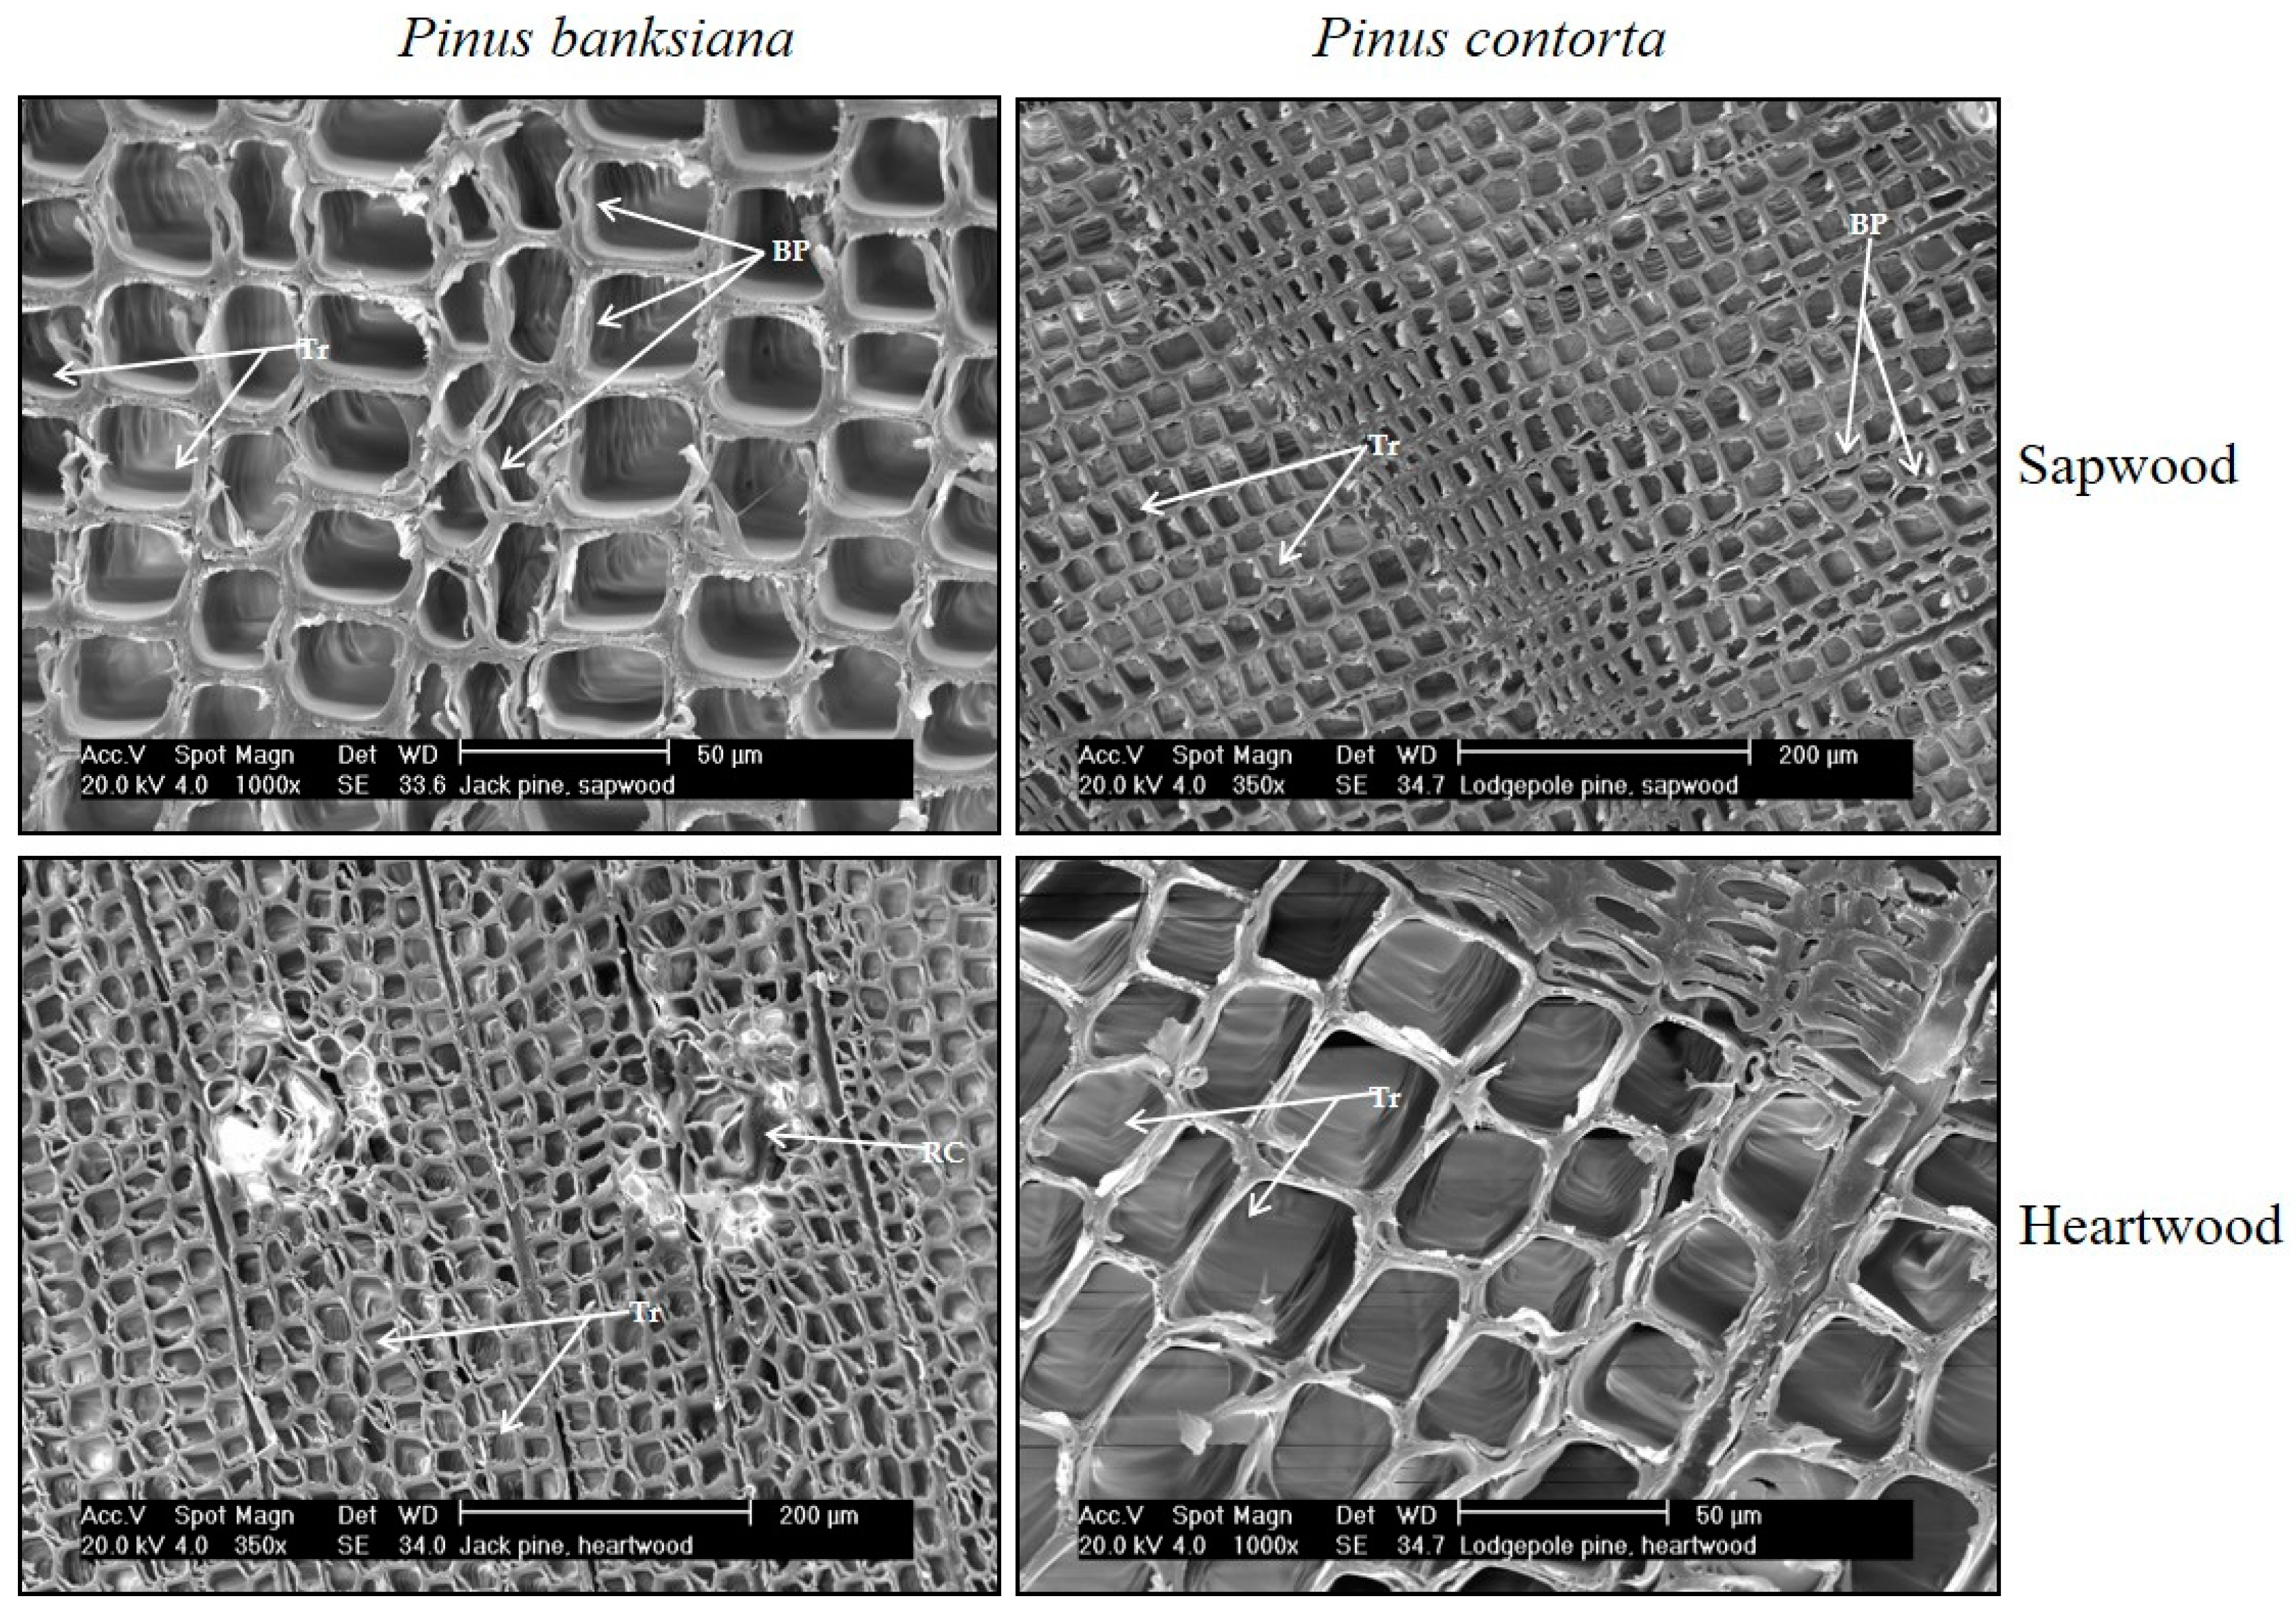
Scanning electron micrographs of Pinus banksiana and Pinus contorta stems tissues. Notice the clogged resin canals (RC) in the Pinus banksiana heartwood. The sapwood micrographs show the bordered pits (BP) between tracheids (Tr).
Figure 1.
Scanning electron micrographs of Pinus banksiana and Pinus contorta stems tissues. Notice the clogged resin canals (RC) in the Pinus banksiana heartwood. The sapwood micrographs show the bordered pits (BP) between tracheids (Tr).

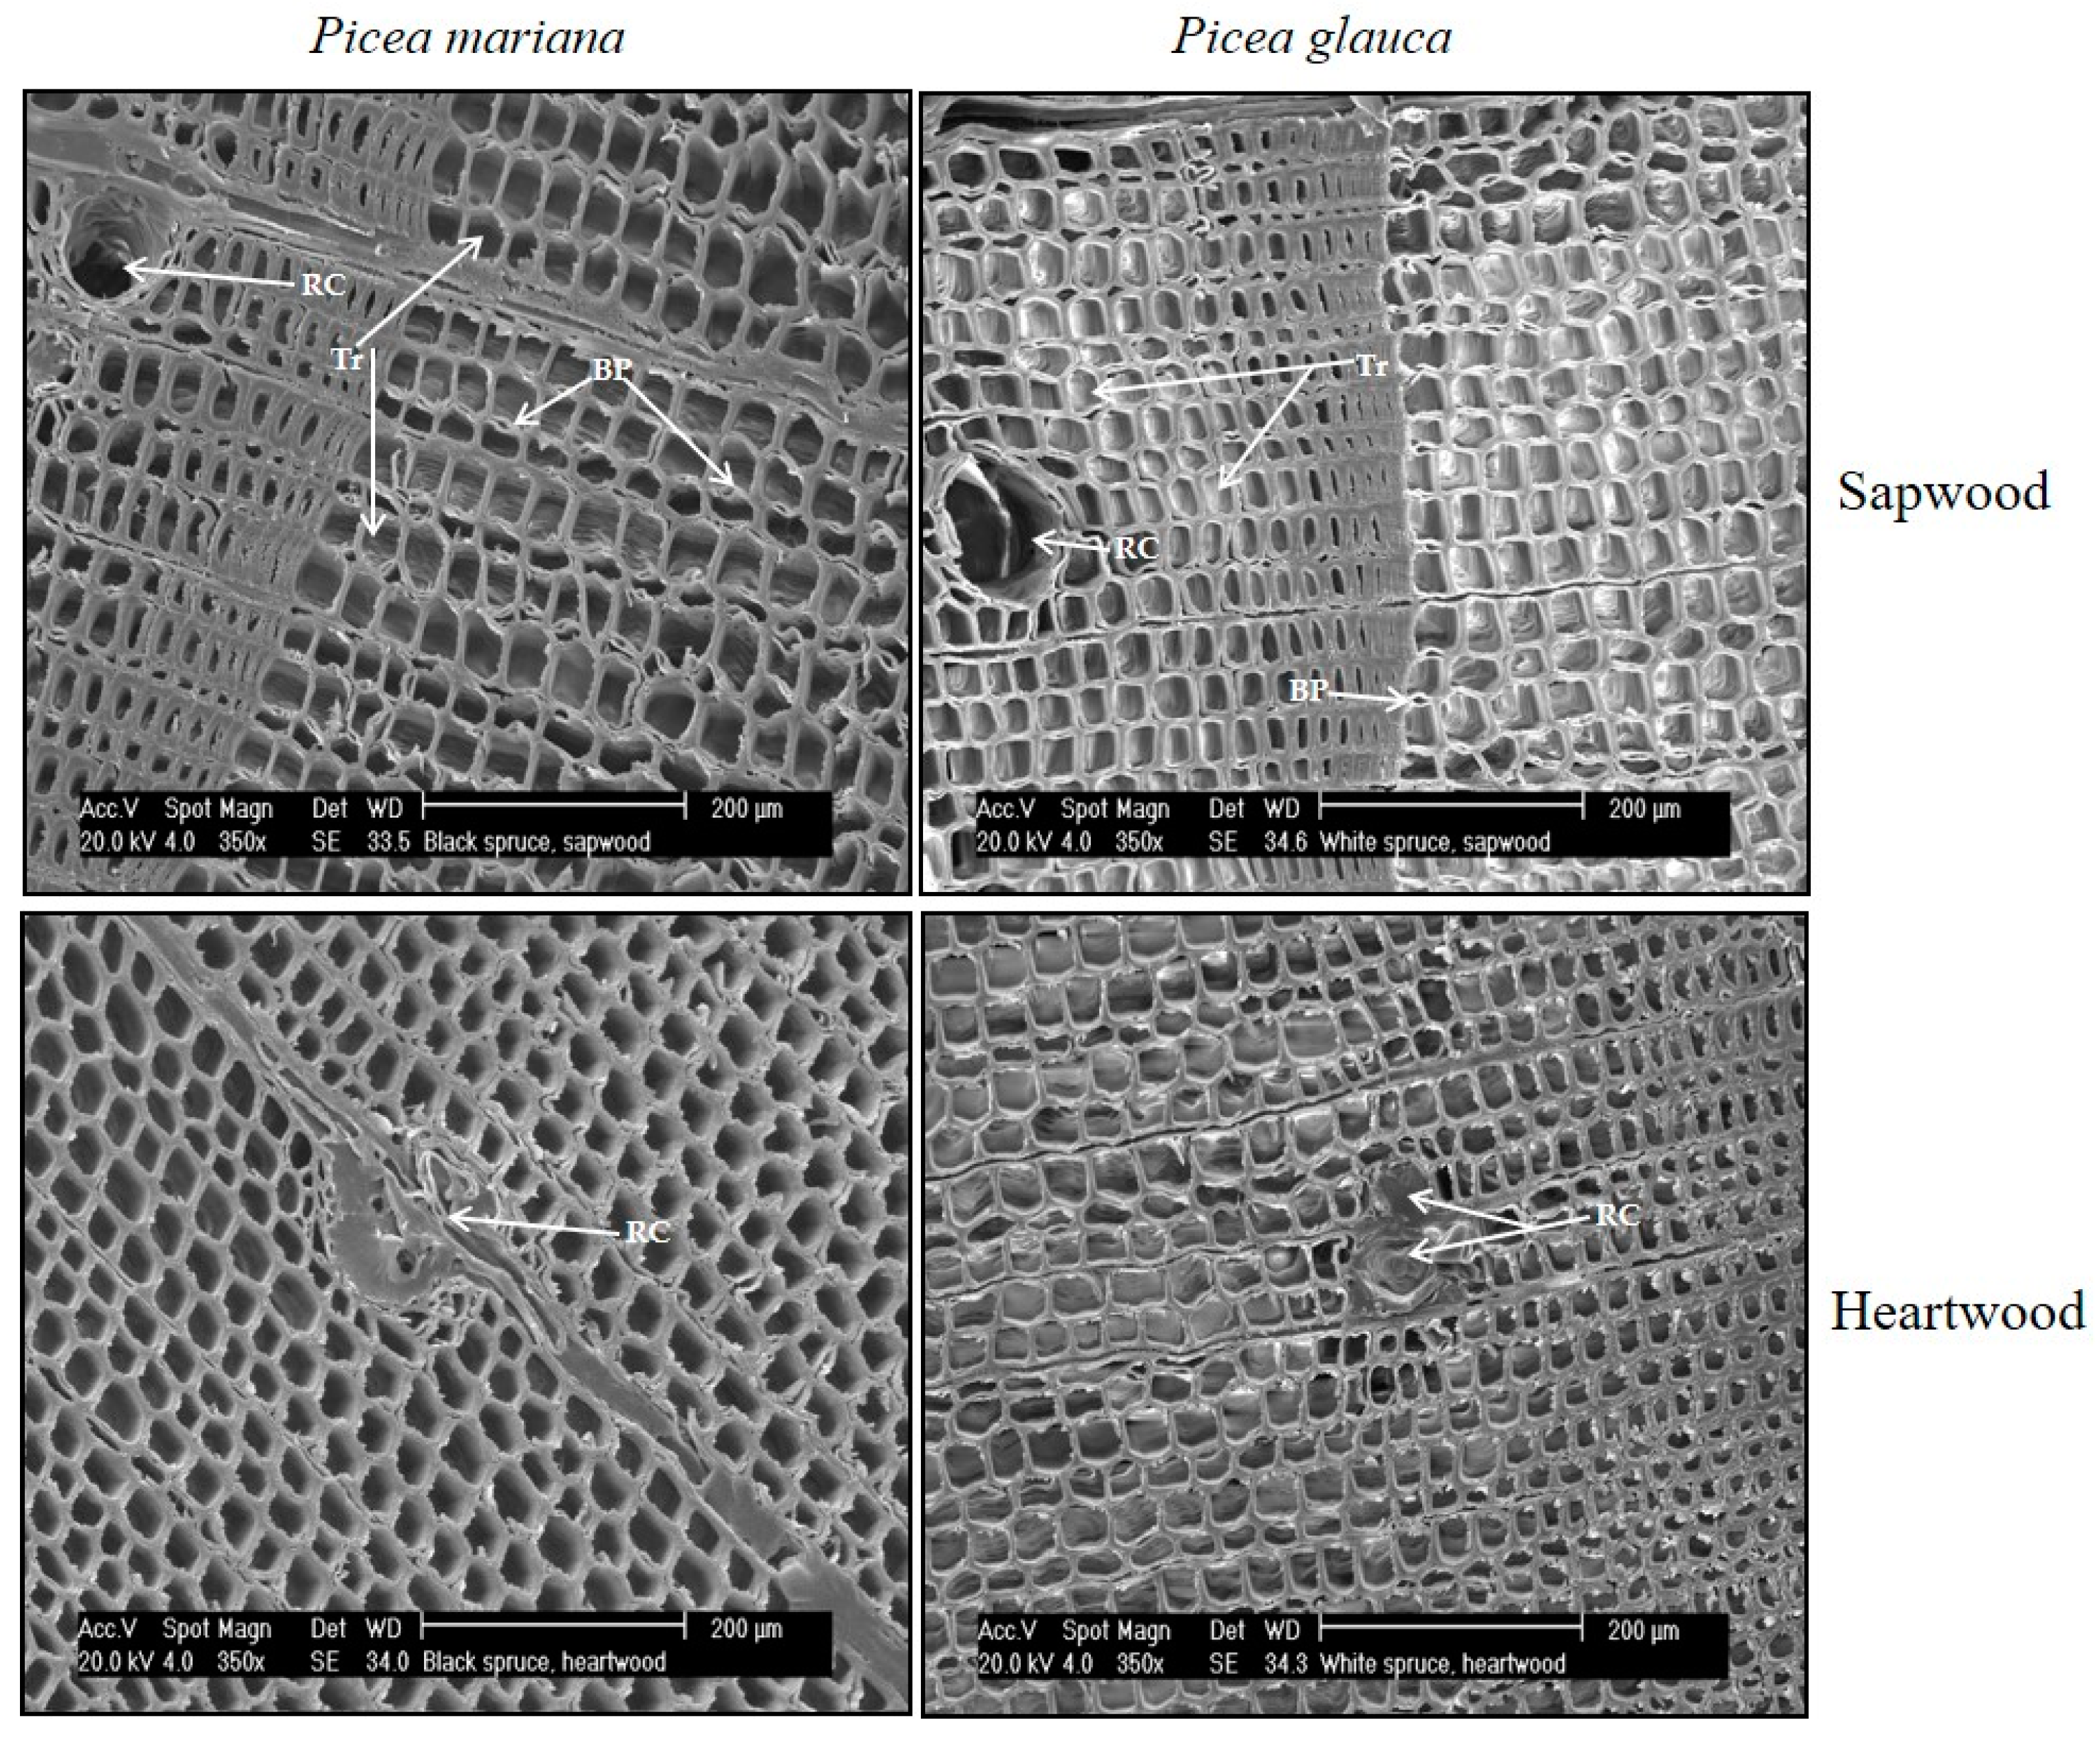
Figure 2.
Scanning electron micrographs of Picea mariana and Picea glauca stems tissues. The sapwood micrographs for both species show open resin canals (RC) and bordered pits (BP) between tracheids (Tr). Notice that the resin canals are clogged in the heartwood tissues.
Figure 2.
Scanning electron micrographs of Picea mariana and Picea glauca stems tissues. The sapwood micrographs for both species show open resin canals (RC) and bordered pits (BP) between tracheids (Tr). Notice that the resin canals are clogged in the heartwood tissues.

Figure 3.
Scanning electron micrographs of Populus tremuloides stem tissues. On the right, micrographs are at a scale of 200 μm. Micrographs on the right are at higher magnification (50 μm). The sapwood micrographs show the vessels (V) and fibers (F), and arrows show the lateral pitting between vessels. The heartwood vessels (T) do not conduct sap anymore since they are sealed by tyloses.
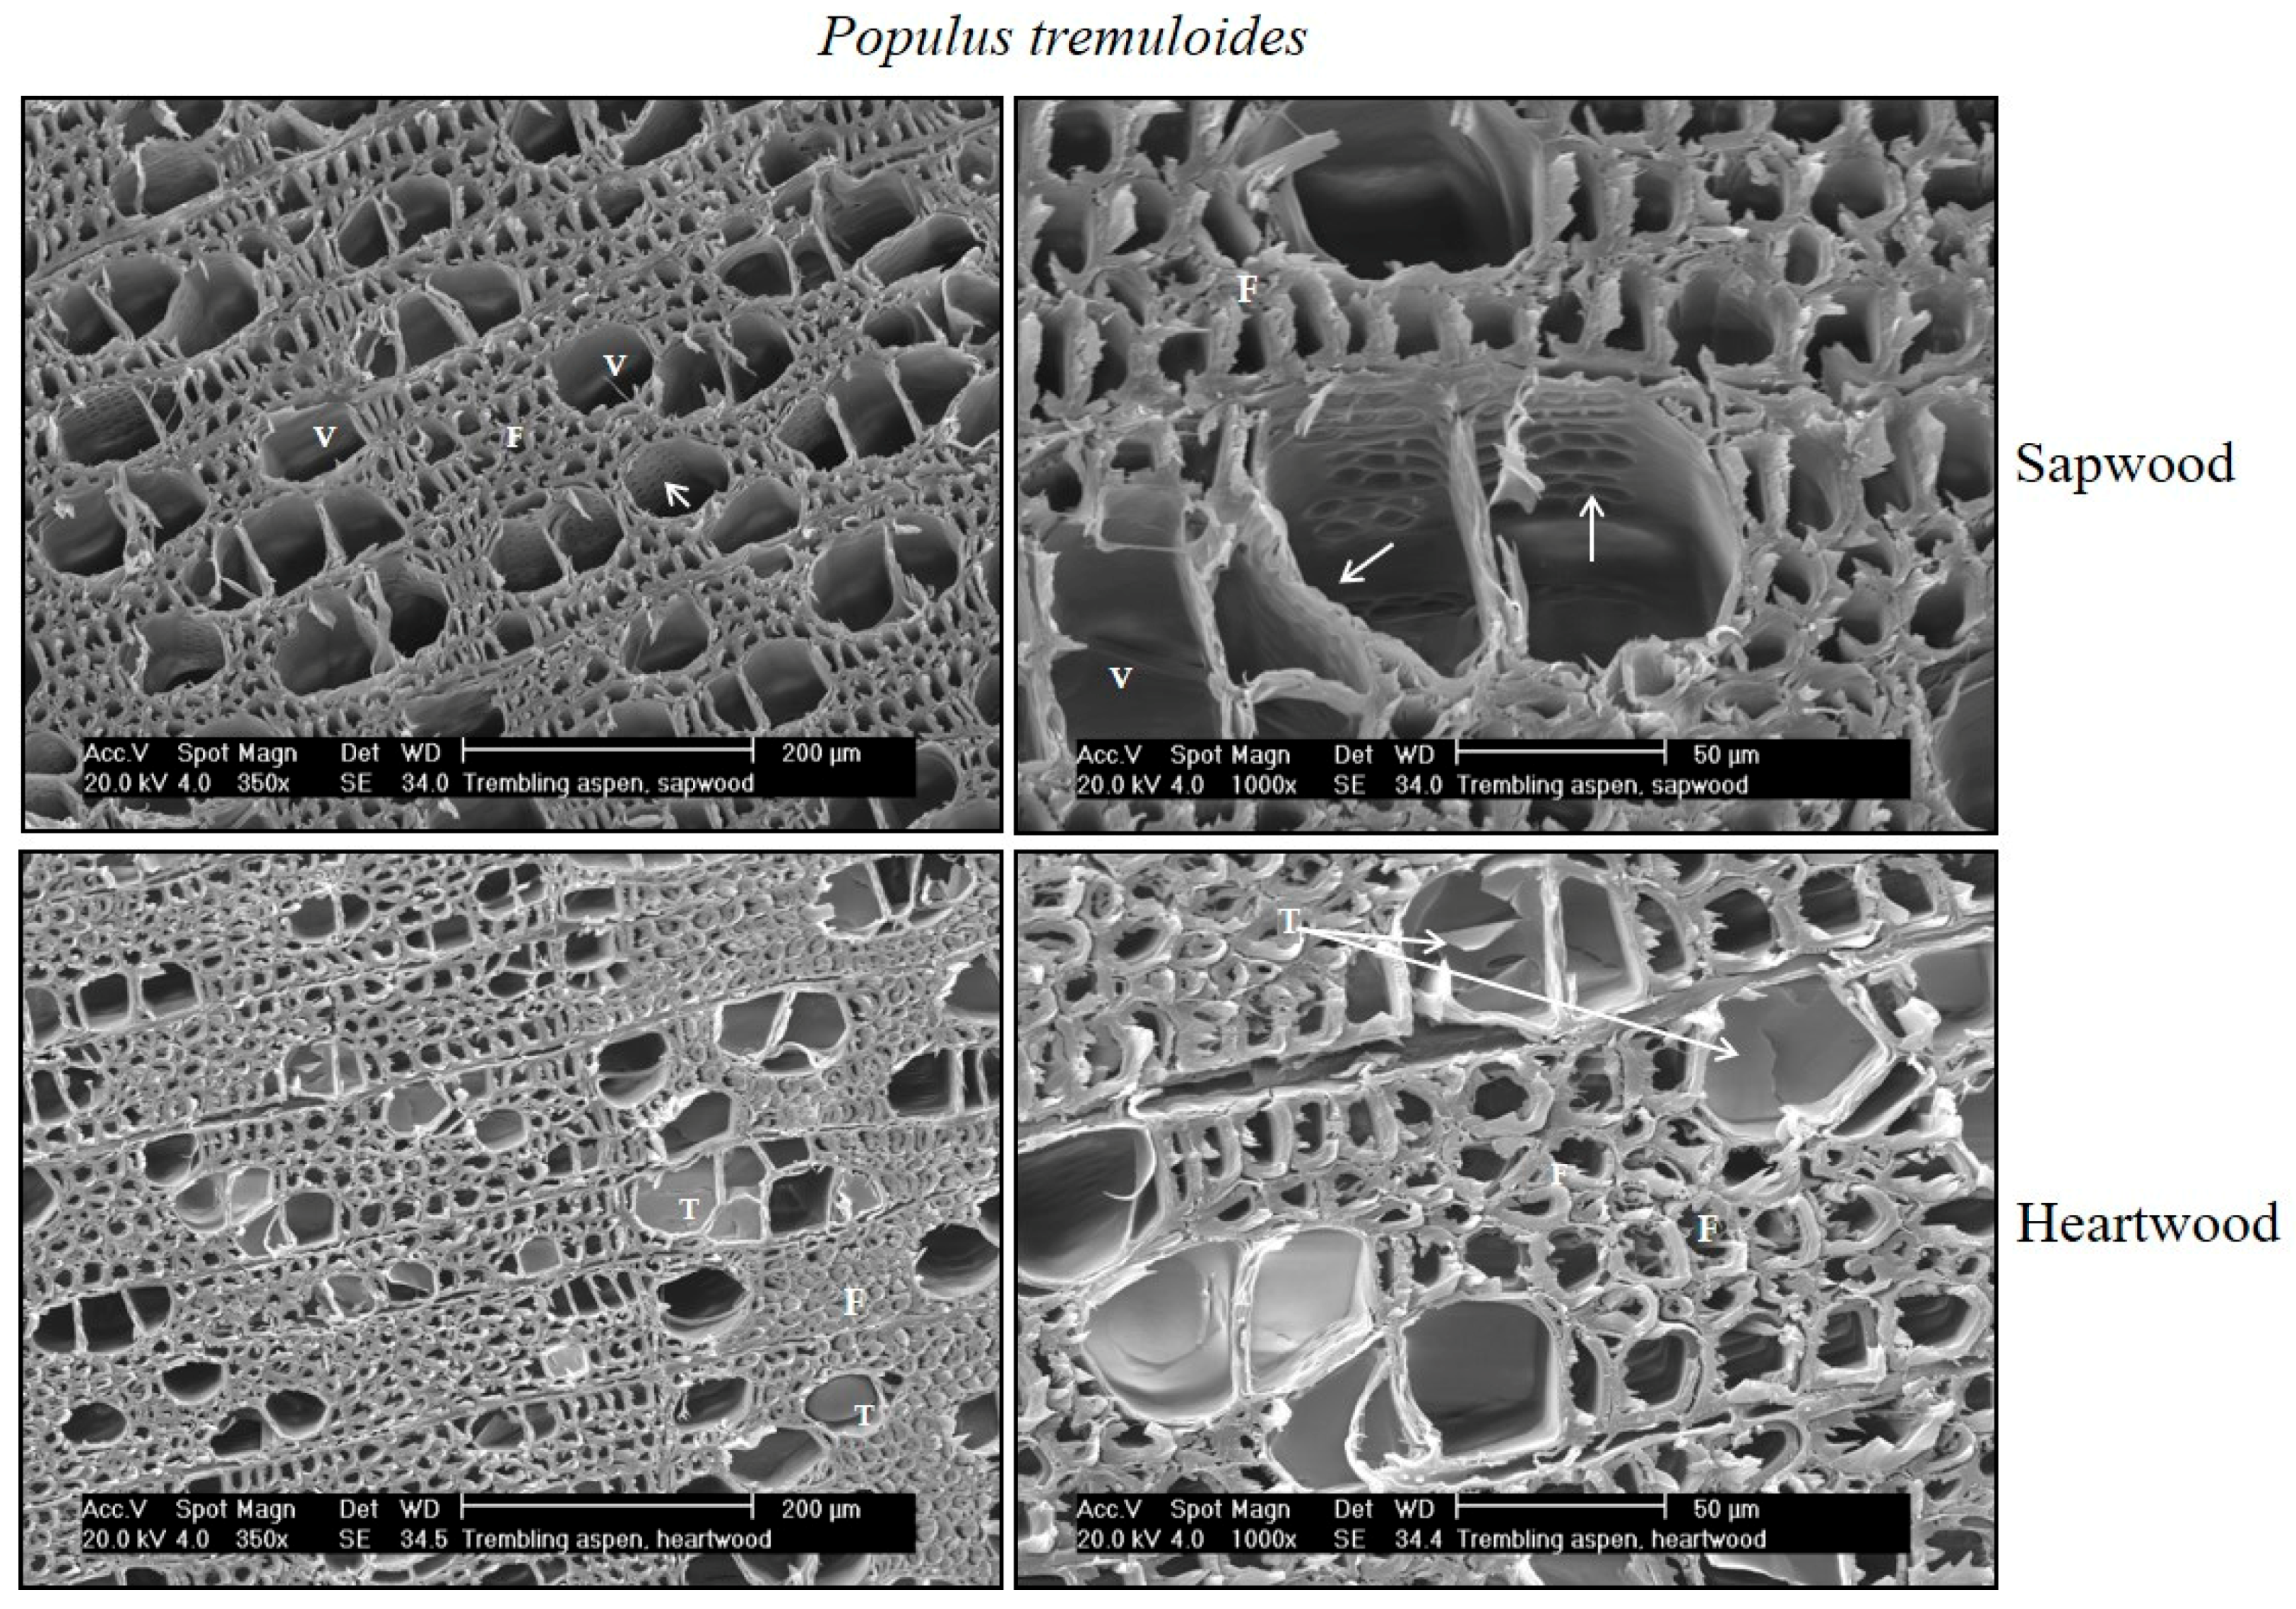
Figure 4.
Pinus banksiana (a) sapwood depth (cm) at each cardinal point for each tree versus diameter at breast height (DBH); and (b) average sapwood depth (points) with 95% confidence intervals (dashed lines) and a fitted linear regression model (solid line).
Figure 4.
Pinus banksiana (a) sapwood depth (cm) at each cardinal point for each tree versus diameter at breast height (DBH); and (b) average sapwood depth (points) with 95% confidence intervals (dashed lines) and a fitted linear regression model (solid line).

Figure 5.
Pinus contorta (a) sapwood depth (cm) at each cardinal point for each tree versus DBH; and (b) average sapwood depth (points) with 95% confidence intervals (dashed lines) and a fitted linear regression model (solid line).
Figure 5.
Pinus contorta (a) sapwood depth (cm) at each cardinal point for each tree versus DBH; and (b) average sapwood depth (points) with 95% confidence intervals (dashed lines) and a fitted linear regression model (solid line).

Figure 6.
Populus tremuloides (a) sapwood depth (cm) at each cardinal point for each tree versus DBH; and (b) average sapwood depth (points) with 95% confidence intervals (dashed lines) and a fitted linear regression model (solid line).
Figure 6.
Populus tremuloides (a) sapwood depth (cm) at each cardinal point for each tree versus DBH; and (b) average sapwood depth (points) with 95% confidence intervals (dashed lines) and a fitted linear regression model (solid line).

Figure 7.
Picea mariana (a) sapwood depth (cm) at each cardinal point for each tree versus DBH; and (b) average sapwood depth (points) with 95% confidence intervals (dashed lines) and a fitted linear regression model (solid line). Three values are missing on sdW and one on sdE. Two values were not estimated due to wood decay and one sdW was an outlier (DBH = 15.28 cm)
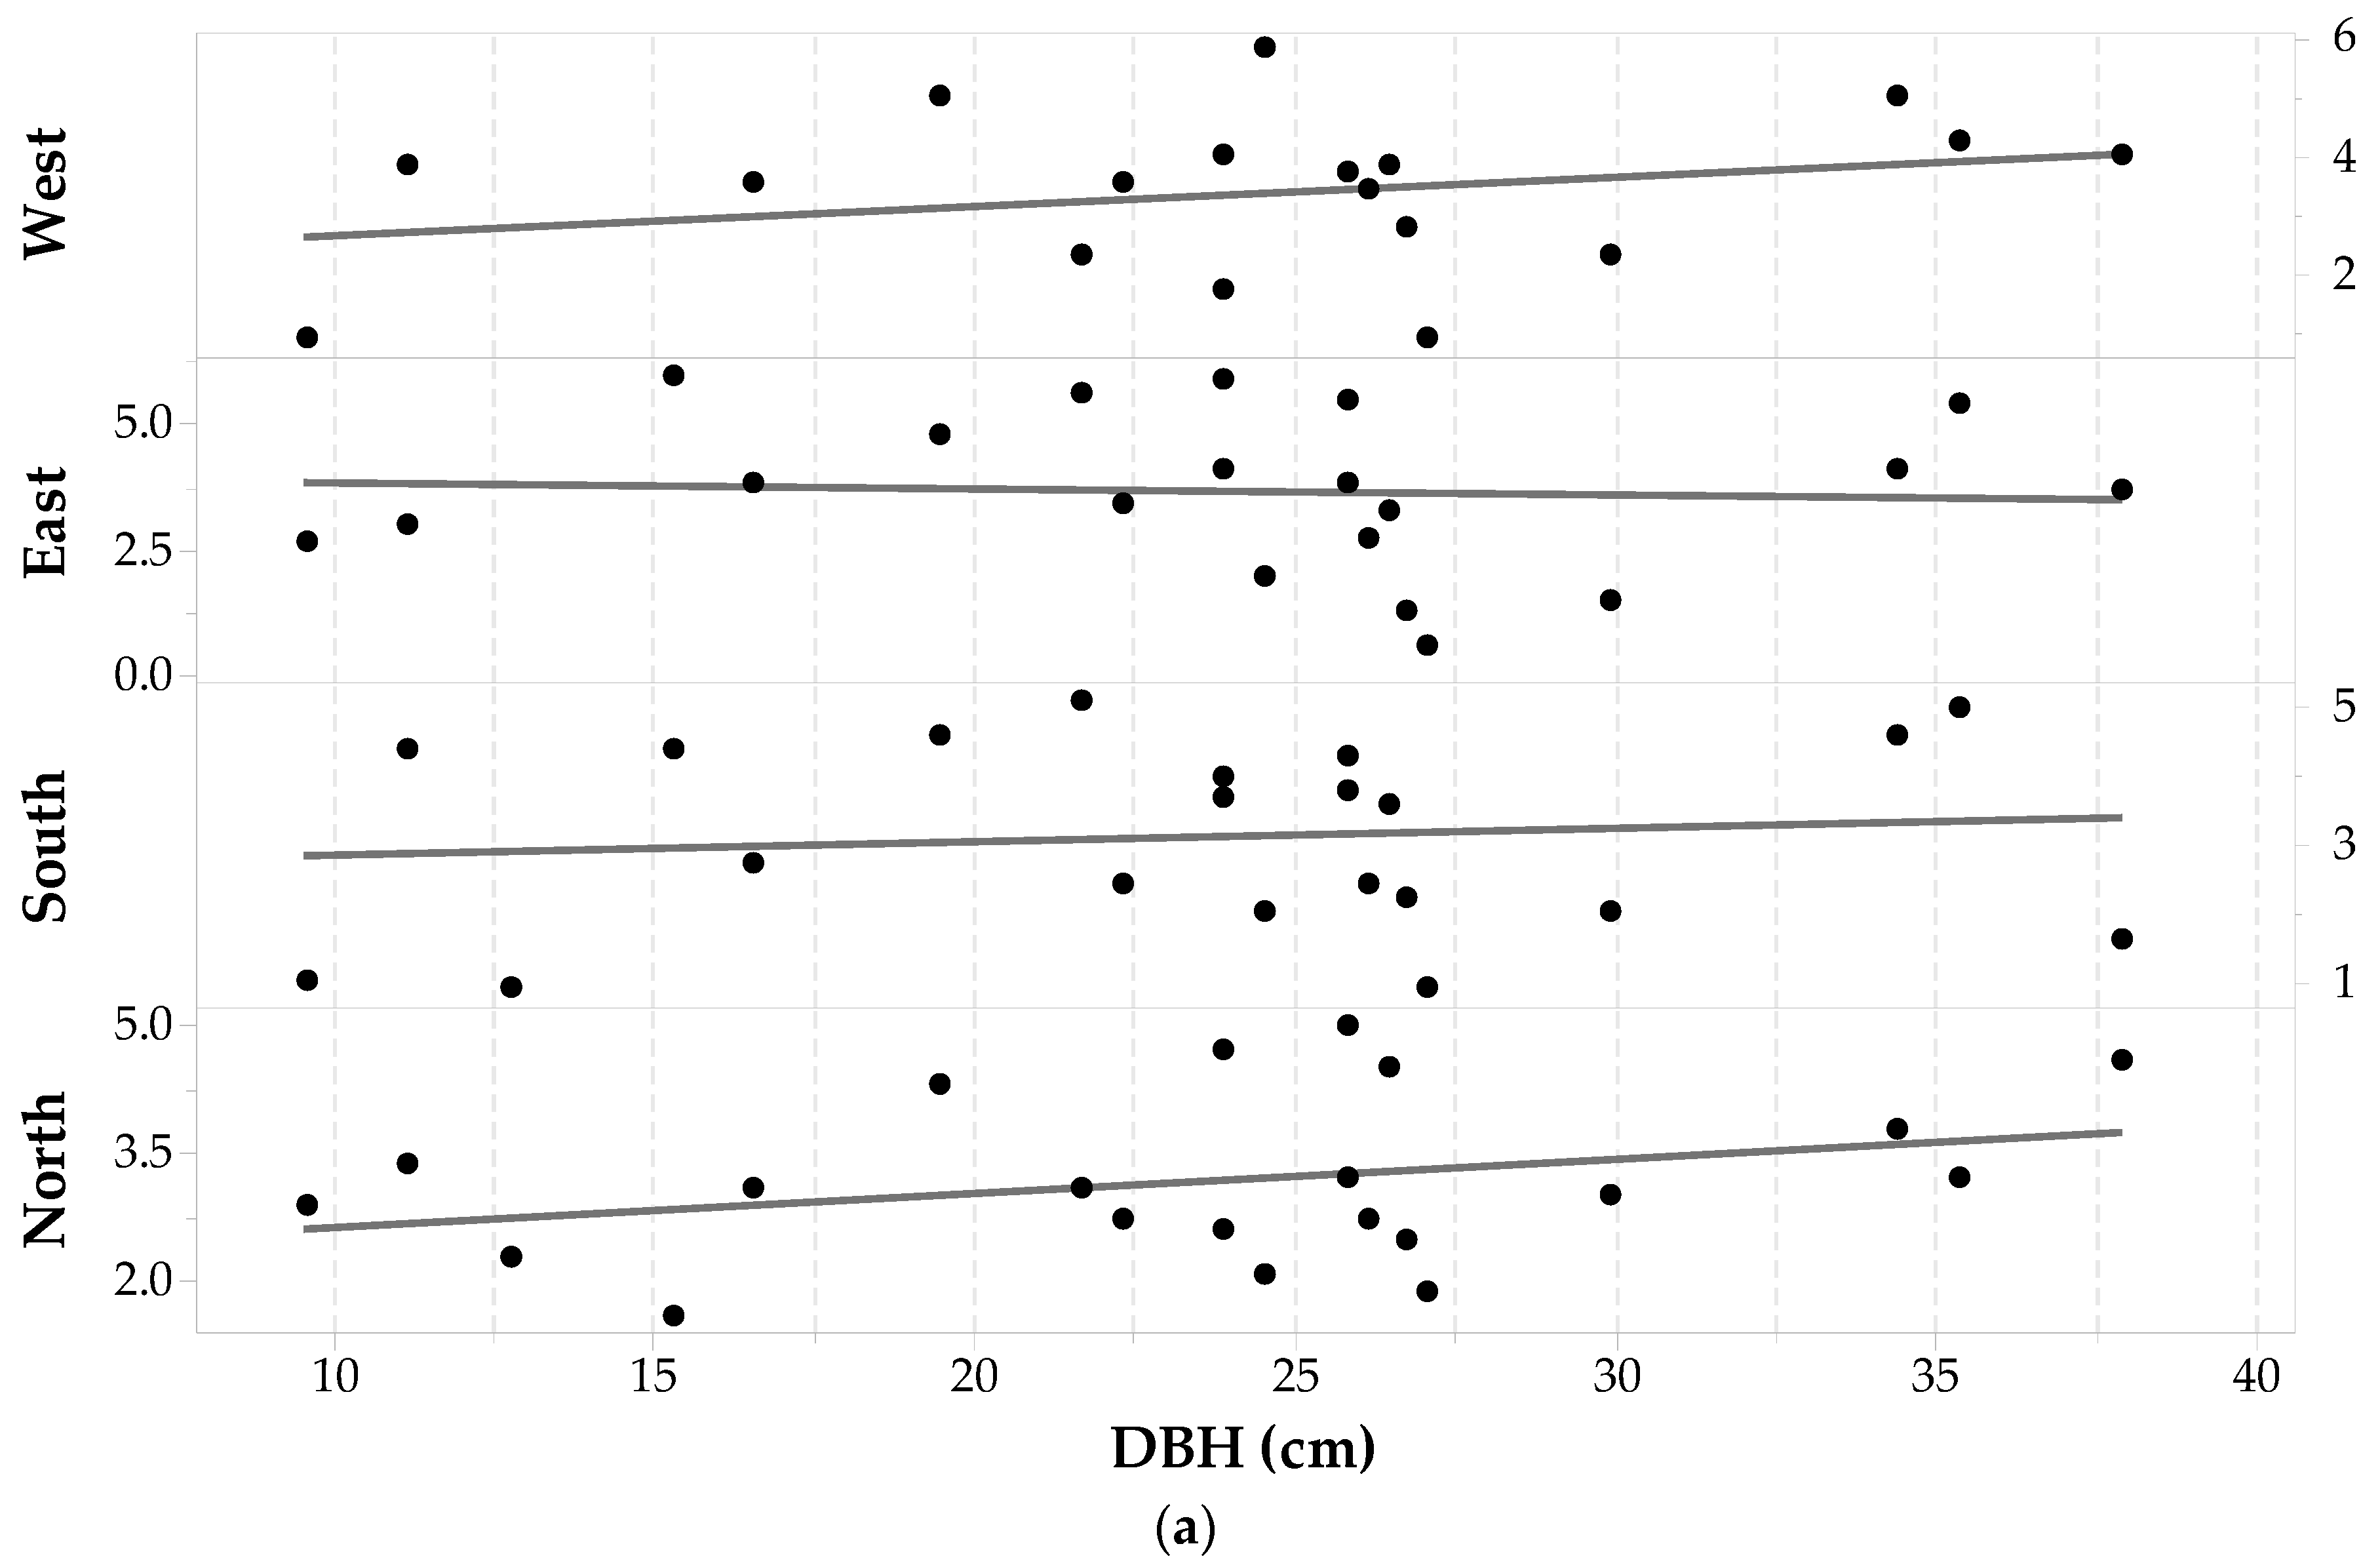

Figure 8.
Picea glauca (a) sapwood depth (cm) at each cardinal point for each tree versus DBH; and (b) average sapwood depth (points) with 95% confidence intervals (dashed lines) and a fitted linear regression model (solid line). There are two missing sdE values. One value is missing since it was not possible to sample the individual on that side; the other was dismissed due to wood decay.


Table 1.
Basic statistics of sdcp for each species sample set. N is the total number of wood cores, and statistical values are reported in centimeters (cm).
Table 1.
Basic statistics of sdcp for each species sample set. N is the total number of wood cores, and statistical values are reported in centimeters (cm).
| Cardinal Point | N | Sapwood Depth | |||||
|---|---|---|---|---|---|---|---|
| Maximum | Minimum | Mean | Mode | Standard Deviation | |||
| Pinus bansksiana | North | 24 | 5.20 | 1.34 | 3.37 | 3.30 | 0.94 |
| South | 24 | 5.06 | 1.25 | 3.05 | 2.10 | 0.95 | |
| East | 23 | 5.90 | 1.90 | 4.00 | 4.00 | 1.01 | |
| West | 23 | 5.20 | 2.00 | 3.54 | 3.00 | 0.79 | |
| Pinus contorta | North | 9 | 5.10 | 2.00 | 3.40 | 2.20 | 1.08 |
| South | 8 | 4.80 | 3.70 | 4.22 | 4.30 | 0.33 | |
| East | 9 | 5.80 | 0.90 | 2.93 | 2.00 | 1.16 | |
| West | 9 | 4.80 | 2.40 | 3.70 | 4.10 | 0.67 | |
| Populus tremuloides | North | 25 | 7.90 | 0.50 | 4.27 | 4.40 | 2.19 |
| South | 25 | 9.90 | 1.20 | 4.70 | 7.00 | 2.46 | |
| East | 23 | 13.90 | 0.50 | 4.45 | 4.40 | 3.07 | |
| West | 23 | 7.80 | 0.60 | 4.16 | 1.10 | 2.47 | |
| Picea mariana | North | 21 | 5.00 | 1.60 | 3.20 | 2.72 | 0.96 |
| South | 21 | 5.10 | 0.90 | 3.12 | 0.90 | 1.40 | |
| East | 20 | 6.00 | 0.60 | 3.66 | 4.10 | 1.58 | |
| West | 18 | 5.80 | 0.90 | 3.36 | 0.90 | 1.35 | |
| Picea glauca | North | 17 | 5.20 | 1.50 | 3.22 | 4.40 | 1.08 |
| South | 17 | 5.60 | 1.72 | 3.37 | 2.30 | 1.22 | |
| East | 15 | 4.90 | 0.69 | 2.87 | 3.10 | 1.10 | |
| West | 17 | 5.90 | 0.35 | 3.19 | 4.20 | 1.53 | |
Table 2.
Detectable difference in significance tests for a Power (1-β) of 0.8 and α = 0.05. N is the total number of wood cores, and the furthest column on the right reports the difference for the Power shown in brackets.
Table 2.
Detectable difference in significance tests for a Power (1-β) of 0.8 and α = 0.05. N is the total number of wood cores, and the furthest column on the right reports the difference for the Power shown in brackets.
| Cardinal Point | N | Standard Deviation (cm) | Difference (Power = 0.8) (cm) | Difference (Power) (cm) | |
|---|---|---|---|---|---|
| Pinus bansksiana | North | 24 | 0.94 | 0.56 | |
| South | 24 | 0.95 | 0.57 | ||
| East | 23 | 1.01 | 0.62 | ||
| West | 23 | 0.79 | 0.48 | ||
| Pinus contorta | North | 9 | 1.08 | 1.15 | 1.08 (0.75) |
| South | 8 | 0.33 | 0.38 | 0.34 (0.70) | |
| East | 9 | 1.16 | 1.24 | 1.16 (0.75) | |
| West | 9 | 0.67 | 0.71 | 0.67 (0.75) | |
| Populus tremuloides | North | 25 | 2.19 | 1.28 | |
| South | 25 | 2.46 | 1.44 | ||
| East | 23 | 3.14 | 1.92 | ||
| West | 23 | 2.56 | 1.56 | ||
| Picea mariana | North | 21 | 0.96 | 0.62 | |
| South | 21 | 1.40 | 0.90 | ||
| East | 20 | 1.58 | 1.04 | ||
| West | 18 | 1.35 | 0.95 | ||
| Picea glauca | North | 17 | 1.08 | 0.78 | |
| South | 17 | 1.22 | 0.88 | ||
| East | 15 | 1.10 | 0.86 | ||
| West | 17 | 1.53 | 1.11 |
Table 3.
Sapwood depth (sdcp) and sapwood cross-sectional area (SA) of a Picea mariana tree (DBH = 38 cm) and a Populus tremuloides tree (DBH = 30.11). Sapwood depth and cross-sectional area units are cm and cm2 respectively.
Table 3.
Sapwood depth (sdcp) and sapwood cross-sectional area (SA) of a Picea mariana tree (DBH = 38 cm) and a Populus tremuloides tree (DBH = 30.11). Sapwood depth and cross-sectional area units are cm and cm2 respectively.
| sdcp | SA | ||
|---|---|---|---|
| Picea mariana | North | 4.60 | 480.94 |
| East | 1.60 | 182.36 | |
| South | 3.70 | 397.30 | |
| West | 4.00 | 425.75 | |
| Populus tremuloides | North | 7.50 | 532.74 |
| East | 5.10 | 400.71 | |
| South | 2.35 | 204.94 | |
| West | 7.30 | 523.12 |
© 2017 by the authors. Licensee MDPI, Basel, Switzerland. This article is an open access article distributed under the terms and conditions of the Creative Commons Attribution (CC BY) license (http://creativecommons.org/licenses/by/4.0/).
Share and Cite
MDPI and ACS Style
Quiñonez-Piñón, M.R.; Valeo, C. Allometry of Sapwood Depth in Five Boreal Trees. Forests 2017, 8, 457. https://doi.org/10.3390/f8110457
AMA Style
Quiñonez-Piñón MR, Valeo C. Allometry of Sapwood Depth in Five Boreal Trees. Forests. 2017; 8(11):457. https://doi.org/10.3390/f8110457
Chicago/Turabian StyleQuiñonez-Piñón, M. Rebeca, and Caterina Valeo. 2017. "Allometry of Sapwood Depth in Five Boreal Trees" Forests 8, no. 11: 457. https://doi.org/10.3390/f8110457
Note that from the first issue of 2016, this journal uses article numbers instead of page numbers. See further details here.