Article

Climate Change Mitigation Potential in Boreal Forests: Impacts of Management, Harvest Intensity and Use of Forest Biomass to Substitute Fossil Resources

1
School of Forest Sciences, Faculty of Science and Forestry, University of Eastern Finland, P.O. Box 111, FI-80101 Joensuu, Finland
2
Institute of Forestry and Environmental Sciences, University of Chittagong, Chittagong 4331, Bangladesh
3
Natural Resources Institute Finland, Joensuu Unit, P.O. Box 111, FI-80101 Joensuu, Finland
*
Author to whom correspondence should be addressed.
Forests 2017, 8(11), 455; https://doi.org/10.3390/f8110455
Submission received: 29 September 2017 / Revised: 1 November 2017 / Accepted: 14 November 2017 / Published: 18 November 2017
(This article belongs to the Section Forest Economics, Policy, and Social Science)

Abstract

:
The impacts of alternative forest management scenarios and harvest intensities on climate change mitigation potential of forest biomass production, utilization and economic profitability of biomass production were studied in three boreal sub-regions in Finland over a 40-year period. Ecosystem modelling and life cycle assessment tools were used to calculate the mitigation potential in substituting fossil materials and energy, expressed as the net CO2 exchange. Currently recommended management targeting to timber production acted as a baseline management. Alternative management included maintaining 20% higher or lower stocking in forests and final felling made at lower breast height diameter than used in the baseline. In alternative management scenarios, logging residues and logging residues with coarse roots and stumps were harvested in final felling in addition to timber. The net CO2 exchange in the southern and eastern sub-regions was higher compared to the western one due to higher net ecosystem CO2 exchange (NEE) over the study period. Maintaining higher stocking with earlier final felling and intensified biomass harvest appeared to be the best option to increase both climate benefits and economic returns. Trade-offs between the highest net CO2 exchange and economic profitability of biomass production existed. The use of alternative displacement factors largely affected the mitigation potential of forest biomass.

1. Introduction

The Paris agreement on climate change aims to limit the global mean temperature increase below 2 °C relative to the pre-industrial level [1]. This would require a substantial reduction in CO2 and other greenhouse gas (GHG) emissions within the coming decades [2]. One of the pathways towards the reduction in CO2 is forest-based climate change mitigation including sequestering and storing of carbon and use of harvested biomass in substituting fossil-intensive materials and fossil fuels [2,3,4]. Accordingly, the European Union (EU) policy of climate change mitigation is to raise the share of renewable energy to 27% and 55% of the total energy consumption by 2030 and 2050, respectively [5,6].
The Nordic countries with extensive forest resources could offer a potentially significant source of biomass [7,8] to be used to achieve Nordic targets for CO2 emission reduction in energy and climate policy [9]. Therefore, use of forest biomass for substituting fossil-intensive materials is highlighted in climate change mitigation policies in these countries [10]. In Finland and Sweden, forest biomass is currently widely used for the manufacturing of wood products. Consequently, the major share of forest-derived renewable energy is from industrial by-products (wood chips, bark, sawdust and black liquor) [11,12]. Besides, a large share of energy biomass that is harvested directly from forest stands (i.e., logging residues and small-sized trees in energy wood thinnings) is being used in power generation and district heating [9]. In Finland, the annual harvest removals for timber and energy biomass were 55 and 8 million m3, respectively in 2013 [13], constituting 63% of the annual total volume growth of the forests. However, to increase the output of Finnish bioeconomy, the level of biomass harvests is aimed to be increased by 10–30 million m3 in the near future [14].
Current Finnish forest management recommendations aim mainly at timber (sawlogs and pulpwood) production and there may be a need to modify these if both carbon sequestration and production of timber and energy biomass are aimed to be increased to promote emission mitigation (e.g., Matala et al. [15]; Routa et al. [16]). Carbon sequestration into forests can be increased by using less intensive thinnings and higher stocking over a rotation period, but this may decrease the economic profitability of the production due to a delay in harvesting (e.g., Pyörälä et al. [17]). Instead, the amount of harvested timber can be increased in thinnings by leaving lower stocking than recommended [18], but this may decrease carbon sequestration of forests [19,20]. However, increased harvests from thinnings and final fellings may increase the potential of wood-based products and energy biomass to substitute fossil-intensive materials (e.g., concrete, steel and plastic) and fuels [3,12,21] and economic benefits as well [22]. The capability of the management measures to enhance carbon sequestration and amount of harvestable biomass within a certain time period will also depend on the initial forest structure [23,24,25,26,27]. Interactive effects of forest management and development of forest structure on biomass production have been studied earlier by applying model simulations together with information on initial conditions of forest resources [28,29,30,31].
Substitution of fossil-intensive materials with long-lived products (e.g., sawn wood) increases emission mitigation most by improving both carbon stock in wood products and avoiding emissions from the use of fossil-intensive materials [32,33,34,35,36,37,38,39]. The emission reductions from the use of energy biomass have been found lower and taking a longer time to realize than those from the use of sawn wood [40,41,42]. Displacement factors (i.e., a ton of fossil carbon emission reduction per ton of carbon used in wood product, tC tC−1) are often used from available literature to assess the substitution impacts of using wood products and energy biomass [35,43,44]. For example, Sathre and O’Connor [44] conducted a meta-analysis of 21 studies and reported average displacement factor of 2.1 tC tC−1 with a range from −2.3 to 15.0 tC tC−1. The variability in displacement factors was due to the difference in comparisons of building materials (e.g., wood vs. steel, wood vs. concrete) and properties assumed for alternative final wood products (e.g., sawn wood, pulp/paper products, without or with associated processing residues). For example, average value of displacement factors presented by Sathre and O’Connor (2010) have been applied by Malmsheimer et al. [24] and Lundmark et al. [37] in national-level studies of fossil materials and fuels substitution. Moreover, in the Swiss construction sector, the displacement factors varied from 1.1 to 1.7 tC tC−1 depending on final products, without or with processing residues [45], while in the Finnish construction sector, the values ranging from 0.5 to 2 tC tC−1 were used for sawn wood and wood-based panels [46,47].
In the above context, the principal aim of this study is to investigate the impacts of alternative forest management scenarios and harvest intensities on climate change mitigation potential of forest biomass production and utilization in managed southern and middle boreal forests in Finland over a 40-year period (2016–2055). The sensitivity of the mitigation potential to alternative displacement factors used for wood-based products was also studied along with economic profitability of biomass production (net present value with a 3% interest rate).

2. Materials and Methods

In this study, ecosystem modelling with National Forest Inventory data and life cycle assessment tool were used to calculate the mitigation potential when forest biomass replaced fossil materials and energy, expressed as the net CO2 exchange. Currently recommended management targeting to timber production acted as a baseline. Alternative management scenarios included maintaining 20% higher or lower stocking in forests and final felling made at lower breast height diameter (22 cm) than used in the baseline (26 cm). In alternative management scenarios, logging residues and logging residues with coarse roots and stumps were harvested in final felling in addition to timber.

2.1. SIMA Ecosystem Model

SIMA, a gap-type ecosystem model, (e.g., Kellomäki et al. [48,49]) was utilized to simulate the net ecosystem CO2 exchange (NEE) and the forest biomass production relevant to this study. In the model, potential growth of a single tree is based on stem diameter growth (at breast height; 1.3 m above ground level) and it is then adjusted according to species-specific multiplier for environmental factors (e.g., temperature and light). In addition, atmospheric CO2 concentration and nitrogen deposition affect the growth [49]. The calculation of biomass of various organs of a tree (stem, foliage, branches, and roots) is based on the allometric relationship between the stem diameter and mass of organs. The model runs on an annual basis and utilizes a calculation area of 100 m2, the results for which are upscaled to a stand representing 1 hectare (10,000 m2). The model is parameterized for the major tree species growing in Finland between the latitudes N 60° and N 70° and longitudes E 20° and E 32°.
In the model, the growth and development of a tree stand are simulated under the influences of available resources and environmental factors such as temperature sum, within-stand light availability, soil moisture and nitrogen availability. Temperature sum (+5 degrees Celsius) controls annual growth responses of each species and their ecotypes. The available nitrogen for growth is determined by the amount of nitrogen released and immobilized in the decomposition of the soil organic matter (i.e., litter and humus layer). The soil moisture is described by using precipitation, evaporation and physical properties of soil (i.e., wilting point and field capacity of soil) [22]. The competition for light is determined by the tree species on the stand and their height distribution. The stand dynamics are determined by the number and mass of trees as a function of their regeneration, growth, and death [48,49]. Management controls the ecosystem dynamics including regeneration (planting of given species in the desired spacing and natural regeneration), thinning and final felling.
Tree mortality is a stochastic event meaning that any tree may die either randomly or due to competition for resources. Dead trees are added to litter layer of the forest floor. In addition to dead trees, the litter from different components of living trees (foliage, branches, and fine roots) are decomposed in the soil system and converted to humus. The decomposition rate of litter and humus is related to the evapotranspiration and the content of nitrogen, lignin, and ash in litter and humus. Whenever the nitrogen concentration of the decaying litter of a particular cohort exceeds the critical concentration, the organic matter and nitrogen of the cohort are transferred to matter and nitrogen in humus. The decomposition of humus controls the mineralization of nitrogen, which makes nitrogen bound in humus available for tree growth.
In this study, each simulation was repeated 20 times based on Monte Carlo technique following stochastic events (e.g., regeneration and death of trees). The algorithm computes whether an event will occur by comparing a random number with the probability of the occurrence of the event. Each run of a Monte Carlo code is one realization of all possible time courses of the forest ecosystem and the mean values of the replicated output variables were used in the analyses.
The model outputs such as sequestration of carbon, emissions from soil carbon decomposition and amount of harvested biomass were used for further analysis. Carbon sequestration indicated the annual growth of stem, branches, and foliage including coarse and fine roots. Soil carbon decomposition indicated emissions of carbon from the litter and humus layer of the forest floor. The performance of SIMA model has been reported earlier and the simulated growth and the measured mean annual volume growth (1996–2003) of main Finnish tree species on the permanent upland National Forest Inventory (NFI) plots for different regions of Finland have shown a good agreement [49]. In addition, the simulations have found a good agreement with the empirical growth and yield model Motti [50] in the simulations of volume growth of managed Norway spruce (Picea abies L. Karst) and Scots pine (Pinus sylvestris L.) stands in 13 different locations from southern to northern Finland on medium fertile sites over an 80-year rotation period [16].

2.2. Forest Input Data for the Initialization of the Simulations

The ground true 10th (2004–2008) Finnish National Forest Inventory (NFI) data were used as an input in the model for running the simulations. The subsample of this data used in this study consisted of sample plots on upland mineral soils throughout southern Finland (former administrative Forest Centres 1–10). Data from one sample plot of each L-shaped cluster were used in the simulations. A cluster of the 10th NFI refers to as a sampling unit consisting of sample plots measured. The average distance between the clusters is 6 × 6 km. The total number of plots in the subsample used was 1718, representing the area of ca. 8.8 million ha of forestry land on mineral upland stands between 60° N and 64° N. In our study, the studied forest area was further divided into the southern, western and eastern sub-regions according to former administrational Forest Centers [13]. Southern sub-region consisted of the Centers 1, 2, 3 and 4; western sub-region of the Centers 5, 7 and 8 and eastern sub-region of the Centers 6, 9 and 10.
The initial distribution of development classes (age classes) of stands on sub-regions differed so that the relative distribution of young and advanced seedling stands was higher in the western sub-region (11% and 15% of the total land area, respectively) compared to the eastern (10% and 13%) and southern region (7% and 11%) [13]. The shares of young thinning stands were 26%, 31% and 30% in western, southern and eastern sub-region and the corresponding values for advanced thinning stands were 33%, 30% and 28%. In addition, the share of mature stands was the lowest in western sub-region, 13%, whereas in eastern and southern sub-regions it was, 18% and 19%, respectively. In our simulations, Norway spruce, Scots pine, and birch (Betula pendula Roth. and Betula pubescens Ehrh.) were considered, since they cover ca. 95% of the total growing stock volume in all of Finland [13].
The initial amount of litter and humus on the site was defined on the basis of the humus layer measured from permanent sample plots undertaken in the National Forest Inventory (NFI) in Finland. The thickness is converted into the mass of soil organic matter (SOM) using the bulk density of SOM, considering the site type and tree species dominating the plot [51,52]. Thereafter, the mass of SOM was regressed against the prevailing temperature sum of the plot by the site types [49].

2.3. Simulations and Forest Management Scenarios

The simulations for management scenarios of the stands were done annually for the 40-year period (2016–2055). In the simulations, atmospheric nitrogen deposition of 10 kg ha−1 year−1 was used regardless of location. The baseline management followed the current Finnish forest management recommendations for thinning and final felling at a tree breast height diameter (basal area weighted) [18]. The thinning rules are based on thresholds for the basal area (cross-sectional area of stems of all trees in a stand) as a function of the dominant height of trees (i.e., the average heights of the 100 tallest trees in the stand). In alternative forest management scenarios, both upper and lower thinning thresholds were increased or decreased by 20% compared to the baseline management to maintain higher or lower stocking, respectively, in the forests. The adjusted thresholds resulted in later or earlier thinnings and change in the number of thinnings over a rotation. Thinning was done from below meaning that mainly suppressed trees were removed. The management scenarios were simulated by using mean breast height diameter (DBH) of 26 cm (baseline) for the final felling of the stands and alternatively 22 cm (Table 1).
In regeneration, planting was utilized. In addition, tree species that were present in the stand before regeneration may occupy the stand depending on species-specific thresholds in environmental conditions. In planting, the stand was regenerated with same tree species as was there before, using a planting density of 2500 seedlings per hectare for Norway spruce and Scots pine and of 1600 seedlings per hectare for birch.
In Finland, management rules of thinning and final felling are disregarded in reality and cuttings are delayed compared to those suggested by the management rules. Therefore, a mean delay of 13 years in thinnings and final fellings was used in all simulations in order to mimic the reality of how forest management in Finland is generally practiced in field. This delay meant that there was no major change in the stocking at the beginning of the simulation, with an implication that simulated cuttings were comparable to the business-as-usual management currently practiced in Finland (see Kellomäki et al. [48,49]).
Timber (sawlogs and pulpwood) (T) was harvested in thinnings and final fellings in all management scenarios (Table 1). Wood density was assumed to be 400 kg m−3, on average. For pulpwood, logs with the top diameter of 6.5 to <17 cm were considered and for sawlogs with the top diameter of 17 cm and above. Additionally, logging residues (BN) and logging residues with coarse roots and stumps (BNR) were harvested in final felling. Logging residues included top parts of the stems and 70% of branches and needles/leaves and they were harvested from stands dominated by Norway spruce and Scots pine (Table 1).

2.4. Simulation Outputs and Their Analyses

The net CO2 exchange calculated in this study for the biomass production and utilization (Mg CO2 ha−1 year−1) is expressed in Equation (1):
Net CO2 exchange = NEE + dChwp +Ceb + Cwaste + Cavoided emissions,
where NEE is the annual net ecosystem CO2 exchange; dChwp is annual carbon stock change in wood products (sawn wood and pulp/paper products); Ceb is annual carbon emissions from the combustion of energy biomass (logging residues, coarse roots, and stumps from final fellings); Cwaste is annual carbon emissions from the combustion of waste wood from processing (sawdust, bark, black liquor) and Cavoided emissions is the annual carbon emissions avoided by using wood products and bioenergy to substitute fossil-intensive materials and fuels. For the net CO2 exchange, negative (−) values were considered for CO2 flow from the atmosphere into the ecosystem and positive (+) values for CO2 flow into the atmosphere [53]. The values for increasing dChwp and Cavoided emissions we considered as negative (−).
The annual net ecosystem CO2 exchange (NEE, Mg CO2 ha−1 year−1, Equation (2)) refers to the carbon sequestration of below- and above-ground living biomass (Cseq) and carbon emissions from decaying of soil organic matter (litter and humus) (Cdecomp).
NEE = Cseq + Cdecomp
In the case of calculating dChwp, we used the amount of wood products produced annually (inflow) and the emissions from the degradation of wood products (outflow). We applied the Equation (3) to calculate the emissions from the degradation of wood products [54].
PU = Da/1 + bect,
where PU is the fraction of products in use and a (120), b (5), and D (120) are dimensionless fixed parameters regardless of the product’s lifespan. C (year−1) represents 0.5, 0.15, 0.065, and 0.03 for short, medium-short, medium-long, and long lifespans of a product, respectively and t (year) is time. The constant e equals 2.72, the base of the natural logarithm. In our calculations, sawn wood acted as an item with a medium-long (35 years) lifespan and pulp as an item with a medium-short (6 years) lifespan. One-half (50%) of the sawlogs produced sawn wood and the other half (50%) was considered as sawing residues (sawdust, bark). Similarly, half of the amount of pulpwood was considered as pulp/paper products and the other half as black liquor from the chemical pulping process. The combustion of energy biomass and processing waste (sawdust, bark, black liquor) emitted carbon, which was assumed to convert completely into CO2 instantly in the same year than the harvesting of biomass. We did not consider any initial carbon stock of wood products at the beginning of the study.
In calculating the avoided emissions, all of the produced sawn wood and pulp/paper products were used as substitutes for fossil-intensive materials (e.g., concrete, steel, and plastic products). Energy biomass (logging residues, coarse roots, and stumps) and processing waste were assumed to substitute for fossil coal and oil. The avoided emissions for the biomass products were quantified by multiplying the amount of carbon (CO2) in a ton of dry mass with displacement factors for energy biomass/processing waste, pulp, and sawn wood [43,44]. The amount of avoided emission was expressed in Mg CO2 ha−1 year−1. The carbon content of the dry biomass was assumed to be 50% [55].
We used the default values of displacement factors that were: 0.5, 1 and 2 tC tC−1 for energy biomass/processing waste, pulp, and sawn wood, respectively. Additionally, a sensitivity analysis was performed by doubling (1, 2 and 4 tC tC−1) and lowering (0, 0.5 and 1 tC tC−1) the default displacement factors for energy biomass/processing waste, pulp/paper, and sawn wood. In the case of lowering the values, we also assumed that there is no carbon benefit of using energy biomass/processing waste in substitution. This sensitivity analysis demonstrates how large the substitution impact would be in emission reduction without changing the other components (e.g., carbon sequestration).
The mean annual yield of timber included pulpwood and sawlogs in Mg ha−1 year−1. Energy biomass referred to the amount of logging residues, coarse roots, and stumps in Mg ha−1 year−1. In data analysis, the yield of timber and energy biomass obtained from the alternative management scenarios was compared to that in the baseline management, without and with energy biomass production for the same period. Moreover, total yield (Mg ha−1 year−1) of harvested biomass (timber and energy biomass together) was calculated over the 40-year period.
The economic profitability of harvested biomass (sawlogs, pulpwood and energy biomass) yield was calculated in terms of net present value (NPV, € ha−1, Equation (4)) for all management scenarios for the 40-year period. To determine the NPV, the incomes (€ ha−1) from sawlogs (51 € m3), pulpwood (17 € m3), and energy biomass (5 € m3) were discounted with a 3% interest rate. The initial investment included the average cost of site preparation (265 € ha−1) and planting of seedlings (0.2 € seedling−1). The stumpage price per m3 for pulpwood, sawlogs and energy biomass was based on the 10-year (2004–2013) mean prices for Finland [13].
NPV = Σ B/(1 + i)t Initial investment,
where, B is the income (€ ha−1) obtained from pulpwood, sawlogs and energy biomass, i is the interest rate (0.03) and t is the time of thinning or final felling.

3. Results

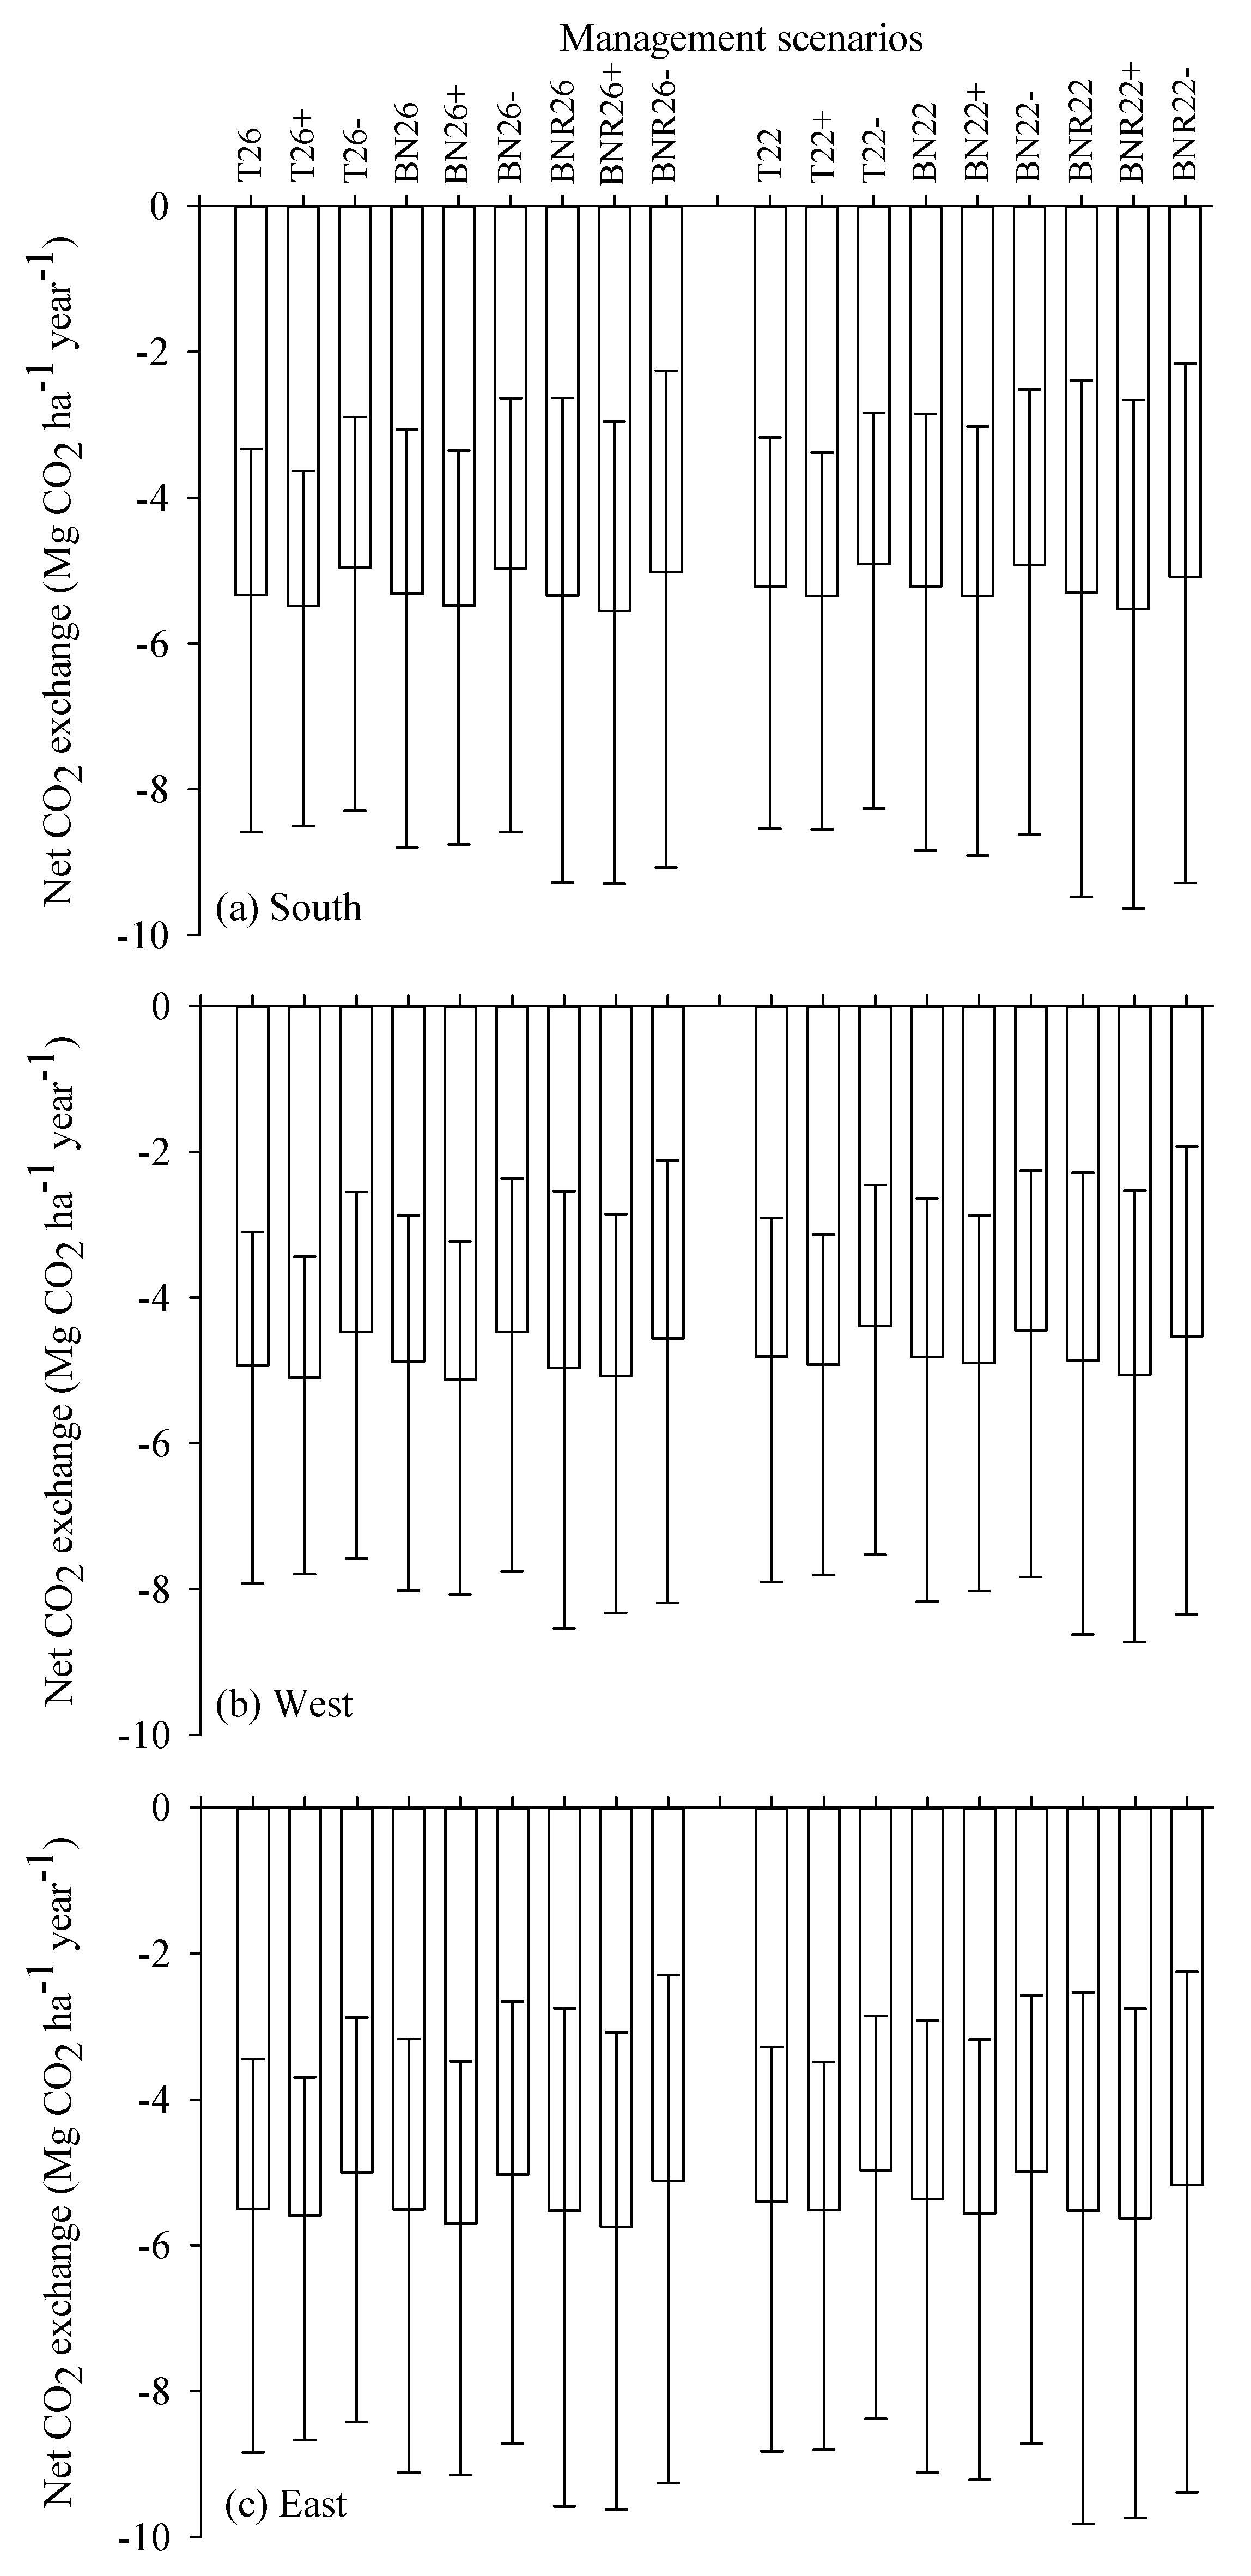
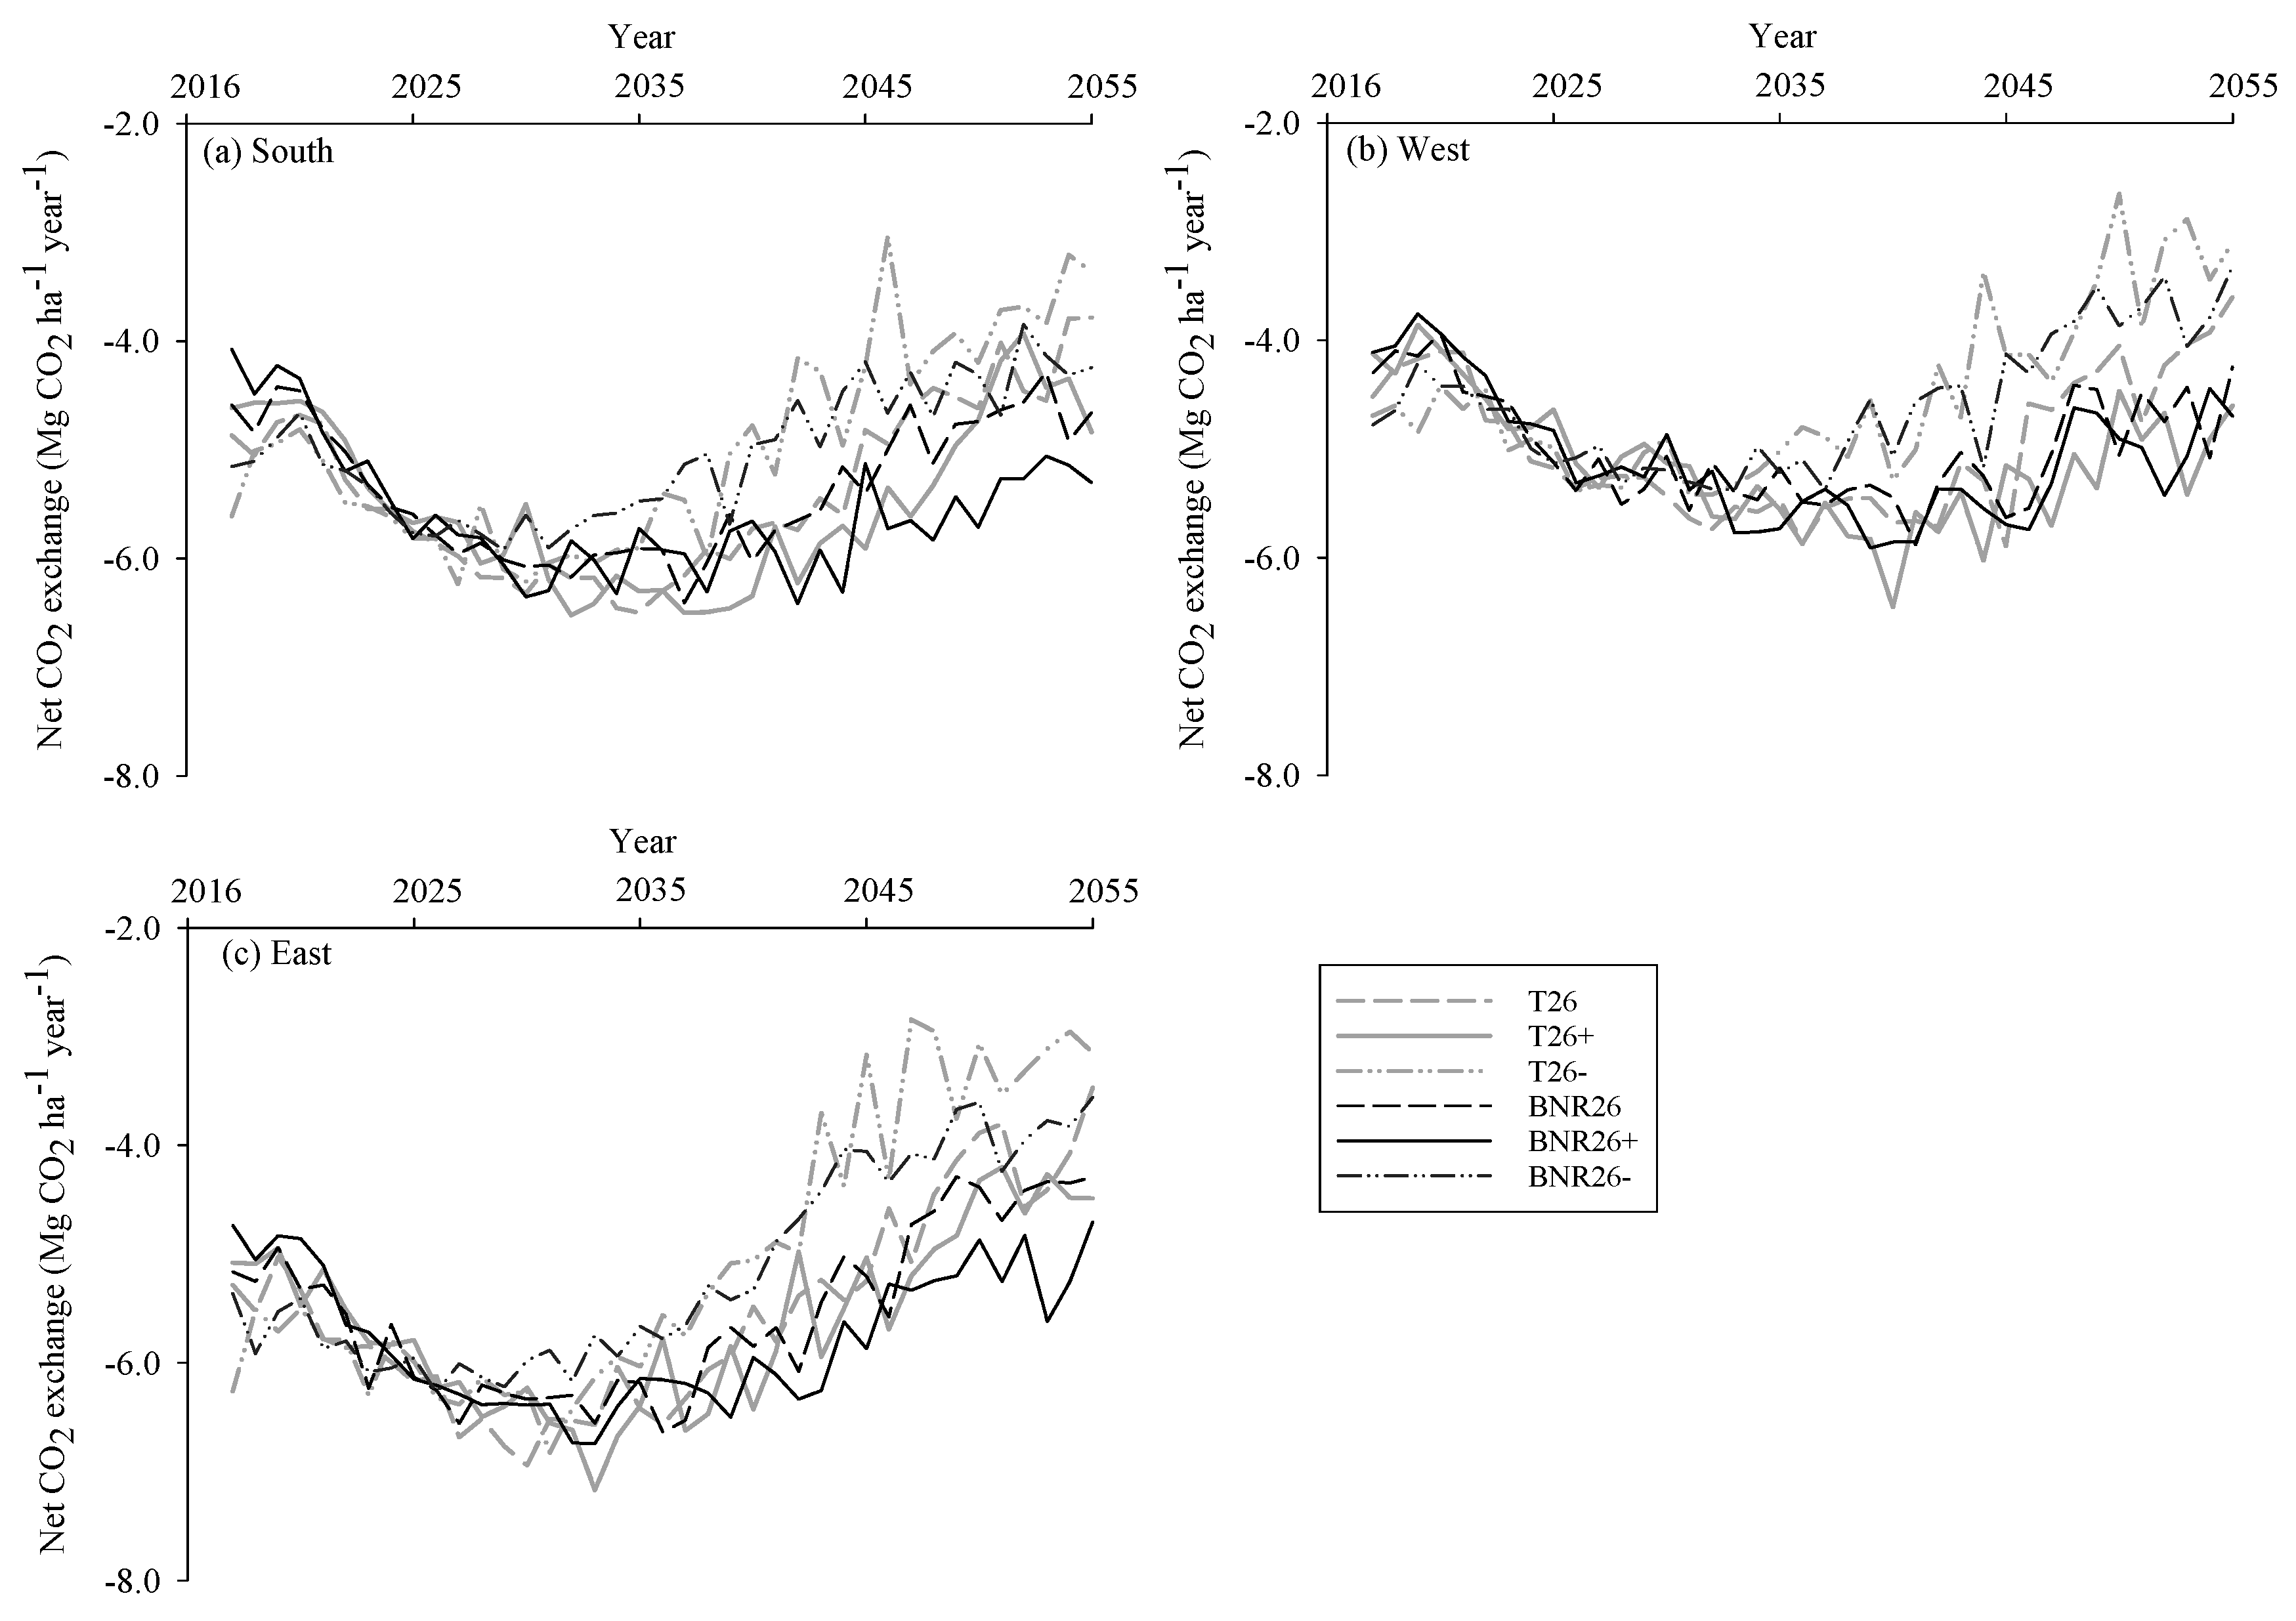
3.1. Effects of Forest Management and Harvest Intensity on Net CO2 Exchange

Annual net CO2 exchange increased (lowest absolute values) for the first 20 years but thereafter decreased until the end of the study period in all the sub-regions (Figure 1). Maintenance of higher stocking increased net CO2 exchange over the study period compared to the baseline (T26) (Figure 1) because of the increased NEE and less frequent thinnings. Intensive harvesting of biomass (BNR and BN) decreased emissions from decay of logging residues and coarse roots and stumps, which led to improved NEE and avoided emissions (with default displacement factors). The largest differences between the management scenarios and harvest intensities were found after 2030 (Figure 1).

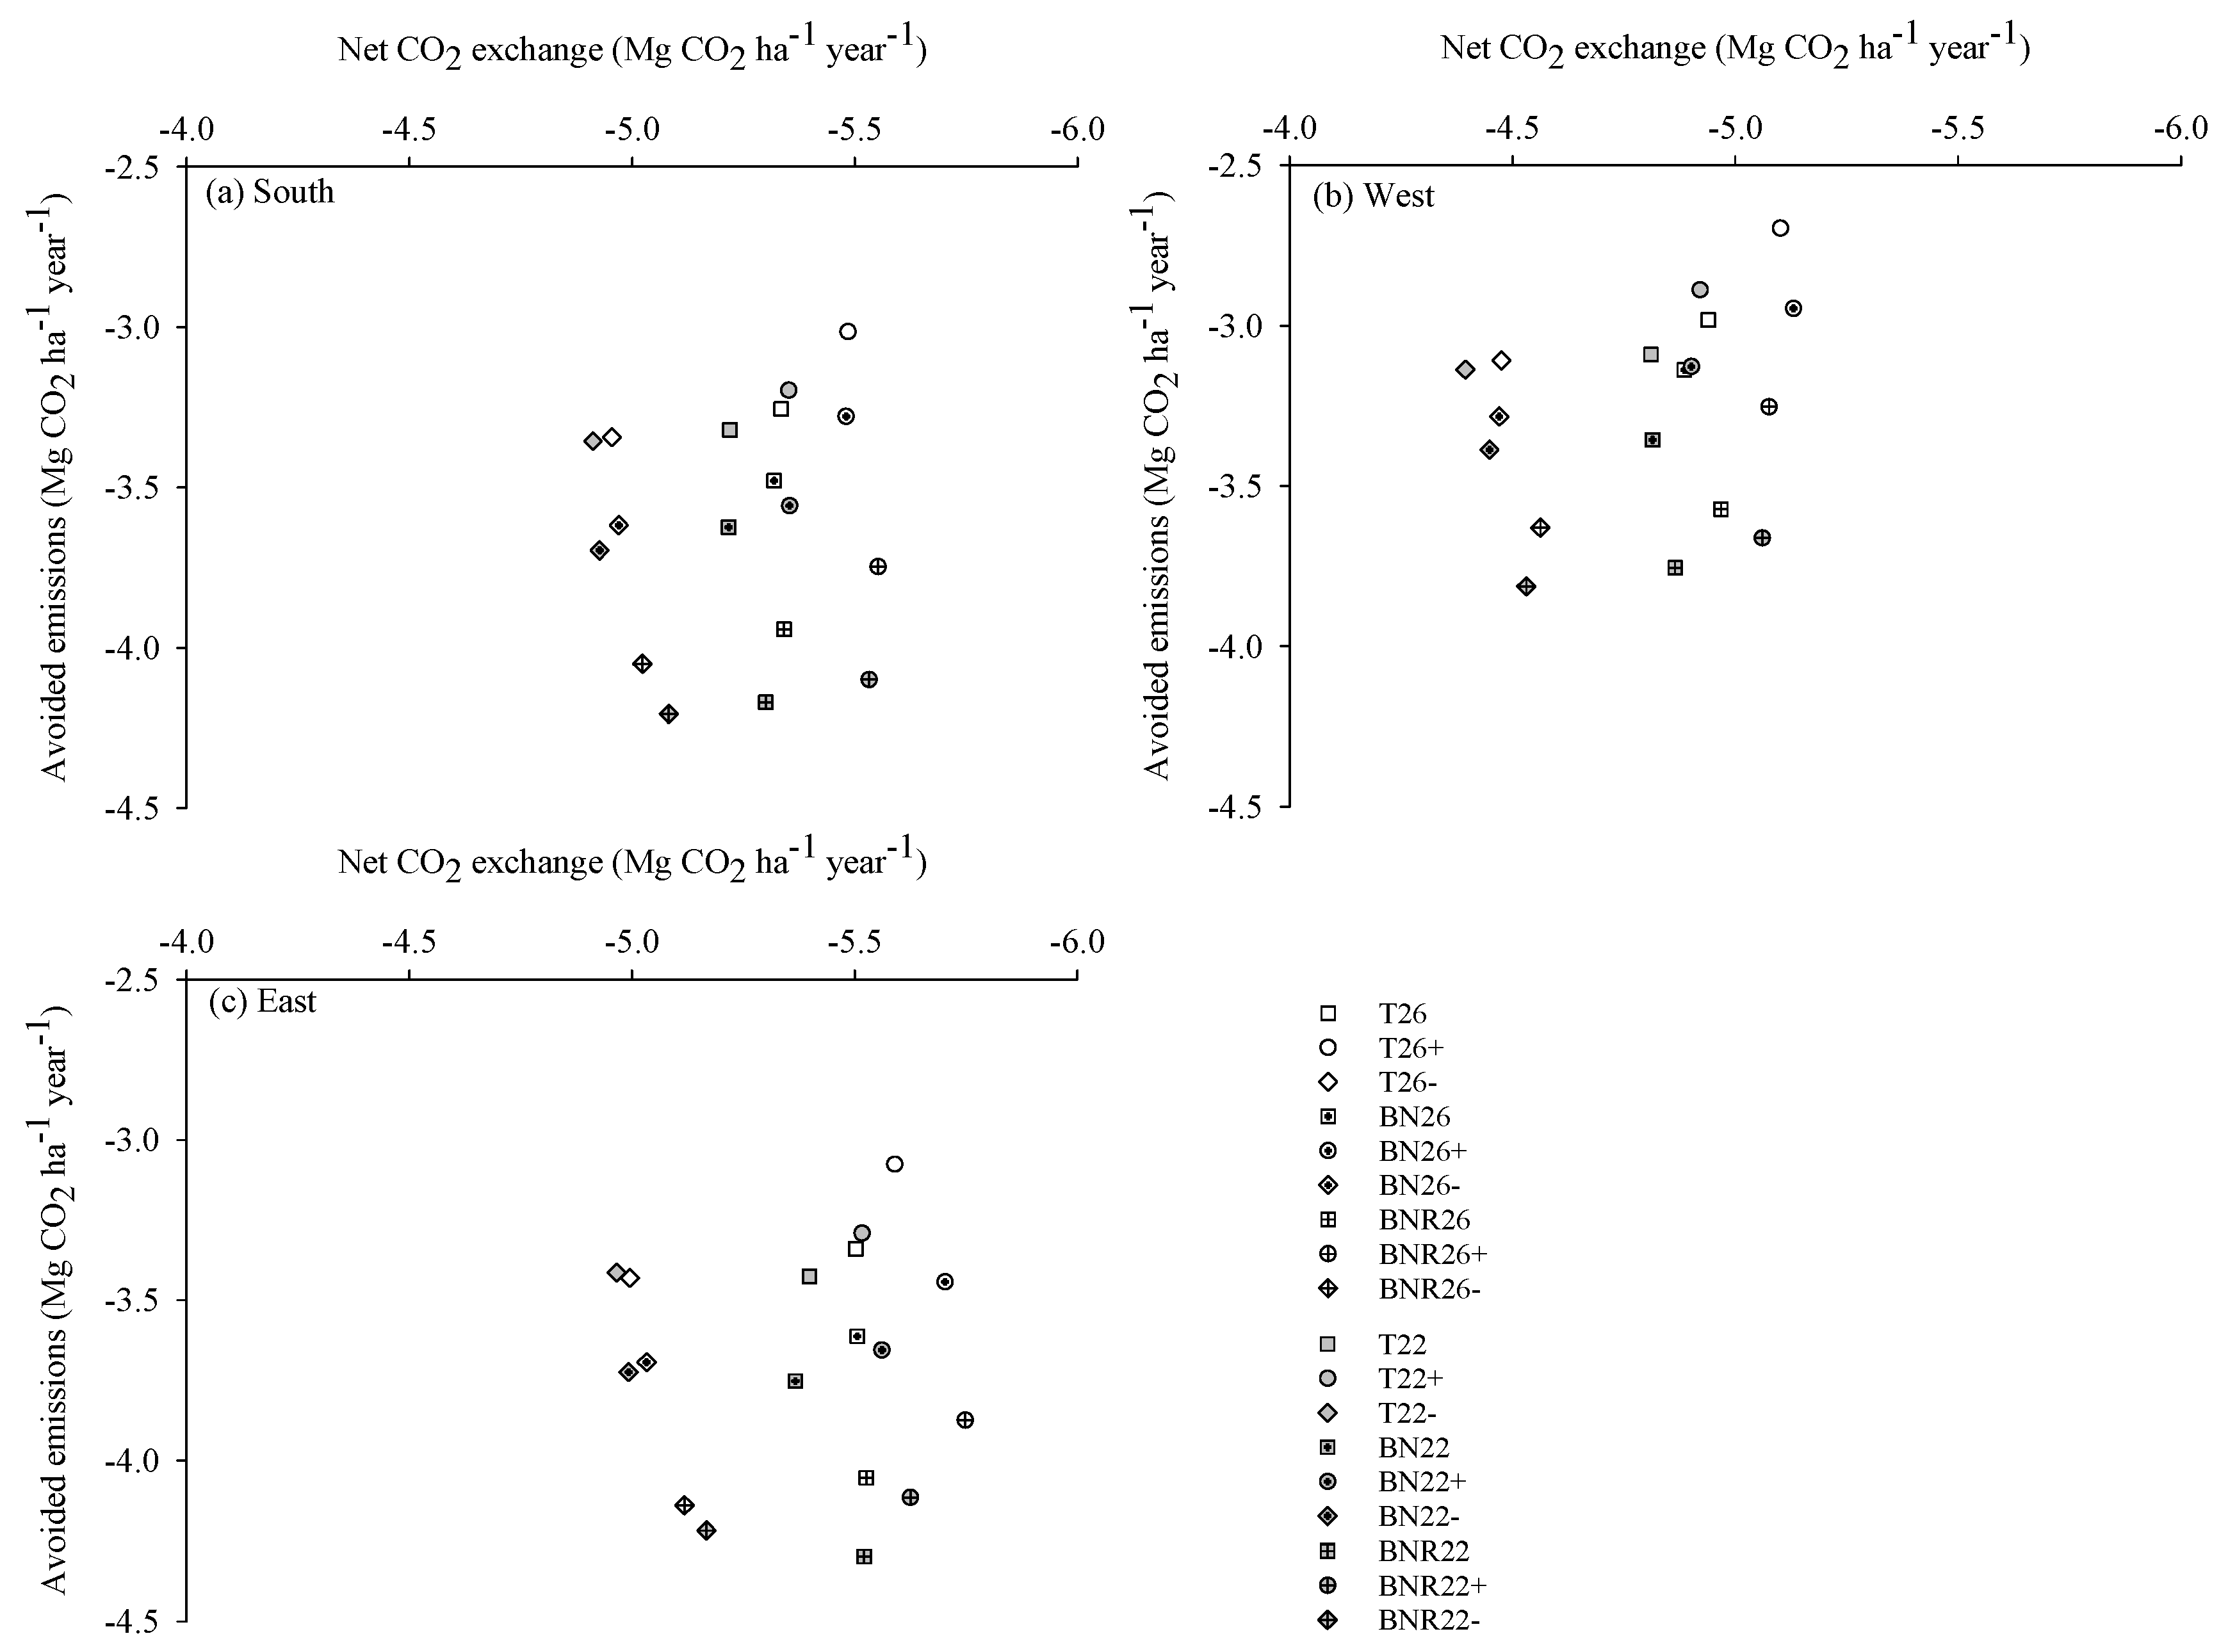
3.2. Relationships between Net CO2 Exchange, Avoided CO2 Emissions and Economic Profitability of Biomass Production

Greatest values (lowest absolute values) for net CO2 exchange, avoided emissions and NPV were found in southern and eastern sub-regions compared to the western one over the study period (Figure 2 and Figure 3). The net CO2 exchange was higher in the final felling made at DBH of 26 cm than at 22 cm (Figure 2). More intensive biomass harvesting than only timber in final felling led to higher values, regardless of the management scenarios. The net CO2 exchange also increased when higher stocking than in the baseline was maintained (Supplementary Materials, Table S1). The avoided emissions and NPV were higher in the final felling made at DBH of 22 cm than made at 26 cm (Figure 2 and Figure 3). Compared to the baseline, the avoided emissions increased up to 29% and NPV up to 30% under maintaining lower stocking (Supplementary Materials, Table S1). On average, the net CO2 exchange over the study period in southern and eastern sub-regions was up to 31–34% higher than that in the western one.

3.3. Effects of Forest Management and Harvest Intensity on Net Ecosystem CO2 Exchange (NEE)

On average, the NEE was higher (lower absolute values) in southern and eastern sub-regions, compared to the western one over the study period, regardless of the management scenarios (Figure 4). In absolute terms, the NEE increased most during the first two periods reaching values up to −4 Mg CO2 ha−1 year−1. The NEE was at the lower level during the last two periods reaching values up to 1 Mg CO2 ha−1 year−1, especially in case of harvesting of timber with logging residues (Figure 4). Compared to the baseline, NEE in higher stocking with timber harvesting increased most during the last two periods up to 179%, 154% and 118% in the southern, eastern and western sub-region, respectively. The corresponding increases with the harvesting of logging residues (BN) were up to 301%, 293% and 164% and with the harvesting of logging residues, coarse roots and stumps (BNR) up to 463% (Figure 4). Conversely, NEE in lower stocking with BN increased only in the final period (up to 245%, 125% and 95%) compared to the baseline. NEE in lower stocking with BNR increased up to 393% and 231% during the last two periods in the southern and eastern sub-region and only in the final period in the western one (up to 185%). The NEE under the final felling made at a DBH of 26 cm was higher compared to that made at a DBH of 22 cm during the first three periods (Figure 4).

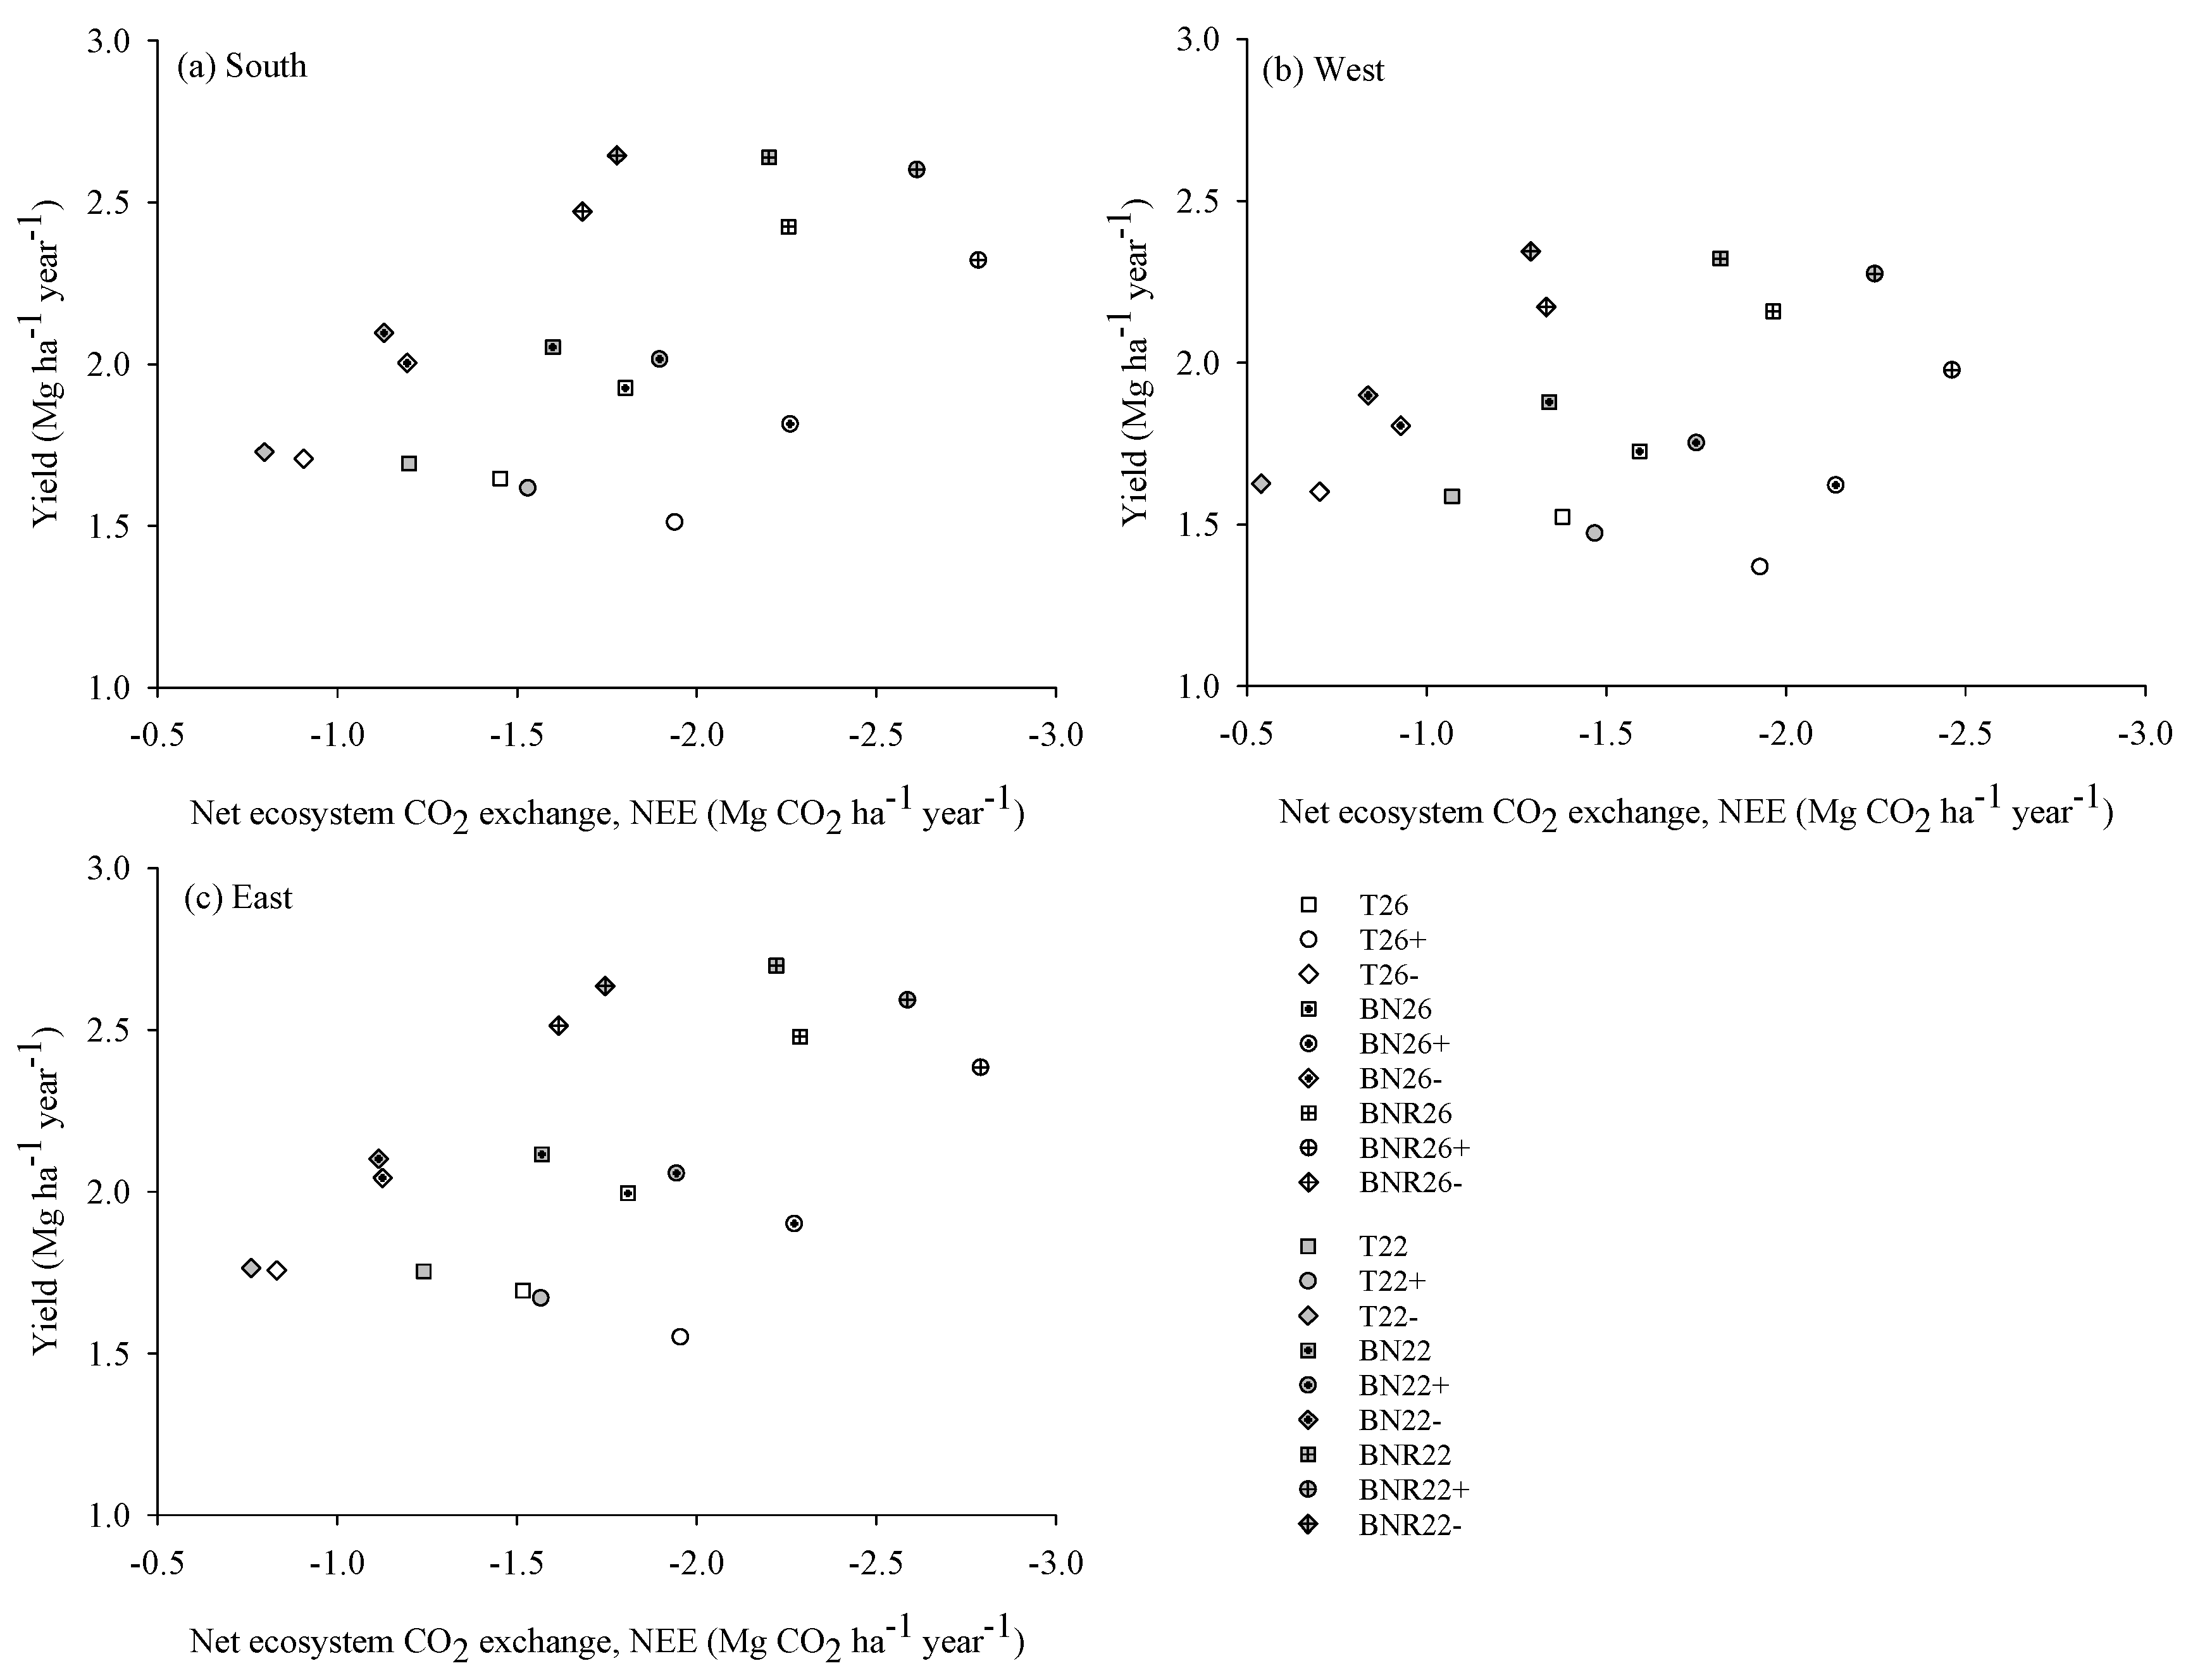
3.4. Relationships between Net Ecosystem CO2 Exchange (NEE) and Harvested Biomass Yield

The southern and eastern sub-regions appeared as prominent for increasing both NEE and biomass yield (both timber and energy biomass) over the study period (Figure 5). Both the NEE and yields were the highest under harvesting of timber together with logging residues, coarse roots and stumps (BNR), regardless of the management scenarios. Biomass yield was lower in the final felling made at DBH of 26 cm than that made at DBH of 22 cm, which was opposite to NEE over the study period (Supplementary Materials, Table S1). Maintenance of lower stocking also increased the yield over the study period (Figure 5; Supplementary Materials, Table S1).
Compared to the baseline, maintaining lower stocking resulted in up to 80% and 48% higher yield of sawlogs and pulpwood, respectively, during the first two periods depending on the regions. In the last two periods, their yield was lower, decreasing mostly in the last period (up to 38% and 15% lower) (Supplementary Materials, Table S2). The yield of timber was higher under the final felling made at DBH of 22 cm than that made at DBH of 26 cm, but only in the first two periods and then decreased in the last two periods (Supplementary Materials, Table S2).
Compared to BN26 and BNR26, maintaining lower stocking resulted in higher (logging residues, without and with coarse roots and stumps: up to 104% and 110%) energy biomass yield during the first two periods depending on the regions but produced lower yield during the last two periods (Supplementary Materials, Table S3). On the contrary, the yield of energy biomass increased when higher stocking was maintained during the last two periods. Generally, the yield of energy biomass was higher under the final felling made at DBH of 22 cm than that made at DBH of 26 cm except in the final period, where final felling at DBH of 26 cm produced higher yield (Supplementary Materials, Table S3).

3.5. Sensitivity of Avoided Emissions to Displacement Factors

Doubling of the factors increased the net CO2 exchange up to 53–84% and lowering of factors decreased it up to 33–58% in the management and harvesting scenarios, depending on the sub-regions (Figure 6). The relative contribution of avoided emissions to the net CO2 exchange shifted up to 50–60% and down to 13–22% when the default displacement factors were doubled and lowered, respectively (Supplementary Materials, Figure S1). The avoided emissions (with default displacement factors) and NEE contributed to the net CO2 exchange at highest up to 33–43% and 7–25%, respectively, depending on the management and harvesting scenarios and sub-regions. The contribution of the carbon stock change in sawn wood was up to 10–15% and in pulp/paper products up to 7–15% (Supplementary Materials, Figure S1, Table S4). In addition, the contributions of emissions from combustion of processing waste and energy biomass were up to 12–20% and 5–15%, respectively (Supplementary Materials, Figure S1, Table S4).

4. Discussion

We investigated the impacts of alternative forest management scenarios and harvest intensities on climate change mitigation potential of forest biomass production and utilization and economic profitability of biomass production in managed southern and middle boreal forests in Finland over a 40-year period (2016–2055) by using forest ecosystem modelling and life cycle assessment tool as integrated. The net CO2 exchange was considered as emission mitigation potential of biomass production and utilization in substituting fossil-intensive materials and fossil fuels. The modelling work strictly obeyed the management scenarios and all the produced biomass was assumed to substitute for fossil materials and fossil fuels. Therefore, the potential should be considered as a maximum biological potential. Abiotic and biotic risks to forests such as insect attacks, wind damages and forest fires on tree mortality were excluded in the simulations.
We found the highest mitigation potential (net CO2 exchange) over the study period in southern and eastern sub-regions, which was up to 31–34% higher than that in the western one. In the southern and eastern sub-regions, forests were initially dominated more by younger forests with higher growth rate, which caused higher net carbon sequestration into forests. Nevertheless, the differences in effects of management scenarios on the net CO2 exchange under alternative sub-regions were marginal. Regardless of sub-regions, net carbon sequestration increased and decomposition of logging residues decreased under higher stocking because of less frequent thinnings and lower amount of logging residues compared to the baseline. When logging residues, coarse roots and stumps together with timber were harvested, the net CO2 exchange and NEE increased over the study period up to 4% and 92% compared to the baseline (see Grelle et al. [56]). Over the 40-year study period, net CO2 exchanges ranged from 4.4 to 5.8 Mg CO2 ha−1 year−1 (or 39–51 million Mg CO2 year−1 if scaled up to the total study area) with default displacement factors and depending on forest management and harvesting scenario and sub-region. These values are comparable with other studies done in Sweden and Switzerland, which ranged from 2.3 to 8.1 Mg CO2 ha−1 year−1 [37,57].
Intensified harvesting (BN and BNR scenarios) with the maintenance of lower stocking in forests and using earlier final felling generated 29% higher avoided emissions compared to the baseline over the study period. However, the decreasing effect of NEE on mitigation potential could not be totally compensated by the use of default displacement factors in lower stocking and/or earlier final felling (at 22 cm) (see also Kallio et al. [3]). The use of higher displacement factors favored earlier final fellings and also use of energy biomass in substitution, but they decreased the climate benefits from maintaining higher stocking. Use of lower factors switched the NEE more important component of mitigation potential (up to 10–32% relative share of the net CO2 exchange depending on management) than the stock increase in wood products or emissions avoided. This result emphasizes the importance of displacement factors and their use as integrated with ecosystem responses, which finally may affect the preference of forest management for climate change mitigation.
The carbon stock change in sawn wood and pulp contributed 10–15% and 7–15%, respectively, to the mitigation potential over the study period depending on management scenarios and harvest intensities. The production of pulpwood and sawlogs was the highest in lower stocking, but the relatively larger flow of pulpwood to the technosystem in the initial two decades, compared to the latter two decades, caused higher emissions due to degradation. However, under this same management, the flow of sawlogs to the technosystem in the latter two decades was higher, compared to that in the initial two decades. Sawn wood products kept carbon out of the atmosphere longer compared to that of pulp/paper products. This was because of their longer lifespan [33,58,59,60]. Thus, the increase in carbon stock of sawn wood has positive impacts on climate change mitigation in addition to substitution benefits, which has also been found in previous studies [42,61,62]. This occurred in our study, although we did not consider recycling or reuse of wood products in our analysis which could have extended the lifespan of the products and benefitted the climate through carbon storing [63].
In the viewpoint of economic profitability, lower stocking with earlier final felling (at DBH of 22 cm) and more intensive biomass harvesting compared to the baseline management increased the NPV up to 30%. On the contrary, maintaining higher stocking in thinnings with final felling at DBH of 26 cm and more intensive biomass harvesting provided lower NPV due to later final felling. Forest management focusing on the highest NPV may reduce its mitigation potential [17,41], as was also found in our case over the 40-year study period.

5. Conclusions

The southern and eastern sub-regions of Finland appear to be prominent regions for climate change mitigation over the next 40 years. The best option to increase the potential was to maintain higher stocking in forests by increasing thinning thresholds, increase biomass harvesting intensity in final fellings and make final fellings earlier than recommended. However, the use of alternative displacement factors for biomass greatly affected the calculated substitution benefits for biomass and mitigation potential of forest biomass. Estimation of more detailed product- and country-specific displacement factors would be needed to improve climate change mitigation estimates for forestry.

Supplementary Materials

The following are available online at www.mdpi.com/1999-4907/8/11/455/s1, Table S1: Relative differences (% changes) in total annual biomass (timber and energy biomass) yield (Mg ha−1 year−1), NPV (€ ha−1), NEE (Mg CO2 ha−1 year−1), avoided emission (Mg CO2 ha−1 year−1) and net CO2 exchange (Mg CO2 ha−1 year−1) for alternative management scenarios and harvest intensities, compared to baseline management (T26) over the 40-year period under the final felling made at DBH of 26 cm and 22 cm in southern, western and eastern sub-regions of Finland. For the key of the management scenarios, see Table 1, Table S2: Mean annual yield (Mg ha−1 year−1) and % change in annual yield of timber (compared to baseline management) for four 10-year periods for different management scenarios under the final felling made at DBH of 26 cm and 22 cm in southern, western and eastern sub-regions of Finland. The yield obtained in alternative management scenarios was compared to that in the baseline management (T26) for the same period and expressed in percentage (%). For the key of the management scenarios, see Table 1, Table S3: Mean annual yield (Mg ha−1 year−1) of energy biomass (logging residues, without and with coarse roots and stumps) and % change in annual yield of energy biomass (compared to BN26 and BNR26) for four 10-year period for different management scenarios under the final felling made at DBH of 26 cm and 22 cm in southern, western and eastern sub-regions of Finland. For the key of the management scenarios, see Table 1, Table S4: The shares of different components of the net CO2 exchange (in absolute values, Mg CO2 ha−1 year−1) over the 40-year period using default substitution factors for different management scenarios and three different harvest intensities including timber (T), timber and logging residues, without (BN) and with coarse roots and stumps (BNR) in the final felling made at DBH of 26 cm and 22 cm in southern, western and eastern sub-regions of Finland. For the key of the management scenarios, see Table 1, Figure S1: Relative shares of each component of the net CO2 exchange against the sum of their absolute values over the 40-year period using default, higher (doubled) and lower (halved) substitution factors for different management scenarios and three different harvest intensities including timber (T), timber and logging residues, without (BN) and with coarse roots and stumps (BNR) in the final felling made at DBH of 26 cm and 22 cm in southern, western and eastern sub-regions of Finland. For the key of the management scenarios, see Table 1.

Acknowledgments

Authors gratefully acknowledge all financial supports of this study. This work was mainly funded by the Ph.D. scholars (Tarit Kumar Baul) of Finnish Society of Forest Science and Finnish Cultural Foundation. The work was also supported by the ADAPT project funded by Academy of Finland (14907) and the ongoing FORBIO project (14970), funded by the Strategic Research Council of Academy of Finland. Natural Resources Institute Finland is acknowledged for providing the sub-sample of forestry data (NFI10) on upland mineral soils. We thank the anonymous reviewers for their useful comments on the manuscript.

Author Contributions

Research idea: Antti Kilpeläinen, Ashraful Alam and Antti Ikonen, Data extraction: Tarit Kumar Baul and Harri Strandman, Data compilation and analysis: Tarit Kumar Baul and Antti Ikonen, Manuscript writing, commenting and editing: Tarit Kumar Baul, Ashraful Alam, Antti Kilpeläinen, Antti Ikonen, Antti Asikainen and Heli Peltola.

Conflicts of Interest

The authors declare no conflict of interest.

References

  1. United Nations Framework Convention on Climate Change (UNFCCC). Adoption of the Paris Agreement; Proposal by the President; United Nations Office: Geneva, Switzerland, 2015; p. 32. Available online: http://unfccc.int/documentation/documents/advanced_search/items/6911.php?priref=600008831 (accessed on 10 December 2016).
  2. Intergovernmental Panel on Climate Change (IPCC). Climate Change 2014: Synthesis Report, Summary for Policymakers; IPCC: Geneva, Switzerland, 2014; p. 32. Available online: http://www.ipcc.ch/ (accessed on 10 December 2016).
  3. Kallio, A.M.I.; Salminen, O.; Sievänen, R. Sequester or substitute—Consequences of increased production of wood based energy on the carbon balance in Finland. J. For. Econ. 2013, 19, 402–415. [Google Scholar] [CrossRef]
  4. Smyth, C.; Kurz, W.A.; Rampley, G.; Lemprière, T.C.; Schwab, O. Climate change mitigation potential of local use of harvest residues for bioenergy in Canada. GCB Bioenergy 2017, 9, 817–832. [Google Scholar] [CrossRef]
  5. European Commission (EC). Proposal for a Directive of the European Parliament and of the Council on the Promotion of the Use of Energy from Renewable Sources (Recast); EC: Brussels, Belgium, 2016; Volume COM(2016), p. 115. [Google Scholar]
  6. European Commission (EC). Communication from the Commission to the European Parliament, the Council, the European Economic and Social Committee and the Committee of the Regions, Energy Roadmap 2050; EC: Brussels, Belgium, 2011; Volume COM(2011), p. 20. [Google Scholar]
  7. Rytter, L.; Ingerslev, M.; Kilpeläinen, A.; Torssonen, P.; Lazdina, D.; Löf, M.; Madsen, P.; Muiste, P.; Stener, L.-G. Increased forest biomass production in the Nordic and Baltic countries—A review on current and future opportunities. Silva Fenn. 2016, 50, 1–33. [Google Scholar] [CrossRef]
  8. Rytter, L.; Andreassen, K.; Bergh, J.; Ekö, P.-M.; Grönholm, T.; Kilpeläinen, A.; Lazdiòa, D.; Muiste, P.; Nord-Larsen, T. Availability of biomass for energy purposes in Nordic and Baltic Countries: Land areas and biomass amounts. Balt. For. 2015, 21, 375–390. [Google Scholar]
  9. International Energy Agency (IEA). Nordic Energy Technology Perspectives 2016, Cities, Flexibility and Pathways to Carbon-Neutrality; IEA: Paris, France, 2016; p. 269. Available online: http://www.iea.org/bookshop/719-Energy_Technology_Perspectives_2016 (accessed on 10 December 2016).
  10. Portin, A.; Barua, S.; Clarke, M.; Camargo, M.; Viding, J.; Pekkanen, M. The Role of Forests in Climate Change: Nordic Experience; TemaNord 2013: 559; Nordic Council of Ministers: Copenhagen, Denmark, 2013; p. 119. Available online: http://dx.doi.org/10.6027/TN2013-559 (accessed on 10 December 2016).
  11. Statistics Finland. Suomen Kasvihuonekaasupäästöt 1990–2012; Statistics Finland: Helsinki, Finland, 2014; p. 71. ISBN 978-952-244-502-5. [Google Scholar]
  12. Koponen, K.; Sokka, L.; Salminen, O.; Sievänen, R.; Pingoud, K.; Ilvesniemi, H.; Routa, J.; Ikonen, T.; Koljonen, T.; Alakangas, E.; et al. Sustainability of Forest Energy in Northern Europe; VTT Technology 237; VTT Technical Research Centre of Finland Ltd.: Espoo, Finland, 2015; ISBN 9789513883645. [Google Scholar]
  13. Ylitalo, E. Finnish Statistical Yearbook of Forestry; Metsätilastollinen Vuosikirja; Finnish Forest Research Institute: Vantaa, Finland, 2014; Available online: http://www.metla.fi/metinfo/tilasto/julkaisut/vsk/2014/index.html (accessed on 10 December 2016).
  14. Ministry of Economic Affairs and Employment. The Finnish Bioeconomy Strategy; Ministry of Economic Affairs and Employment: Helsinki, Finland, 2014; p. 31. Available online: http://www.tem.fi/files/40366/The_Finnish_Bioeconomy_Strategy.pdf (accessed on 10 December 2016).
  15. Matala, J.; Kärkkäinen, L.; Härkönen, K.; Kellomäki, S.; Nuutinen, T. Carbon sequestration in the growing stock of trees in Finland under different cutting and climate scenarios. Eur. J. For. Res. 2009, 128, 493–504. [Google Scholar] [CrossRef]
  16. Routa, J.; Kellomäki, S.; Kilpeläinen, A.; Peltola, H.; Strandman, H. Effects of forest management on the carbon dioxide emissions of wood energy in integrated production of timber and energy biomass. GCB Bioenergy 2011, 3, 483–497. [Google Scholar] [CrossRef]
  17. Pyörälä, P.; Peltola, H.; Strandman, H.; Kilpeläinen, A.; Asikainen, A.; Jylhä, K.; Kellomäki, S. Effects of management on economic profitability of forest biomass production and carbon neutrality of bioenergy use in Norway Spruce stands under the changing climate. Bioenergy Res. 2014, 7, 279–294. [Google Scholar] [CrossRef]
  18. Äijälä, O.; Koistinen, A.; Sved, J.; Vanhatalo, K.; Väisänen, P. Hyvän Metsänhoidon Suositukset—Metsänhoito; Recommendations for Forest Management in Finland; Forestry Development Centre Tapio Publications: Helsinki, Finland, 2014. (In Finnish) [Google Scholar]
  19. Alam, A.; Kilpeläinen, A.; Kellomäki, S. Impacts of thinning on growth, timber production and carbon stocks in Finland under changing climate. Scand. J. For. Res. 2008, 23, 501–512. [Google Scholar] [CrossRef]
  20. Kilpeläinen, A.; Alam, A.; Torssonen, P.; Ruusuvuori, H.; Kellomäki, S.; Peltola, H. Effects of intensive forest management on net climate impact of energy biomass utilisation from final felling of Norway Spruce. Biomass Bioenergy 2016, 87, 1–8. [Google Scholar] [CrossRef]
  21. Holtsmark, B. Harvesting in boreal forests and the biofuel carbon debt. Clim. Chang. 2012, 112, 415–428. [Google Scholar] [CrossRef]
  22. Torssonen, P.; Kilpeläinen, A.; Strandman, H.; Kellomäki, S.; Jylhä, K.; Asikainen, A.; Peltola, H. Effects of climate change and management on net climate impacts of production and utilization of energy biomass in Norway spruce with stable age-class distribution. GCB Bioenergy 2016, 8, 419–427. [Google Scholar] [CrossRef]
  23. Garcia-Gonzalo, J.; Peltola, H.; Gerendiain, A.Z.; Kellomäki, S. Impacts of forest landscape structure and management on timber production and carbon stocks in the boreal forest ecosystem under changing climate. For. Ecol. Manag. 2007, 241, 243–257. [Google Scholar] [CrossRef]
  24. Malmsheimer, R.W.; Bowyer, J.L.; Fried, J.S.; Gee, E.; Izlar, R.L.; Miner, R.A.; Munn, I.A.; Oneil, E.; Stewart, W.C. Managing forests because carbon matters: Integrating energy, products, and land management policy. J. For. 2011, 109, S7. [Google Scholar] [CrossRef]
  25. Eliasson, P.; Svensson, M.; Olsson, M.; Ågren, G.I. Forest carbon balances at the landscape scale investigated with the Q model and the CoupModel—Responses to intensified harvests. For. Ecol. Manag. 2013, 290, 67–78. [Google Scholar] [CrossRef]
  26. Kilpeläinen, A.; Strandman, H.; Grönholm, T.; Ikonen, V.-P.; Torssonen, P.; Kellomäki, S.; Peltola, H. Effects of initial age structure of managed Norway spruce forest area on net climate impact of using forest biomass for energy. BioEnergy Res. 2017, 10, 499–508. [Google Scholar] [CrossRef]
  27. Routa, J.; Kellomäki, S.; Peltola, H. Impacts of intensive management and landscape structure on timber and energy wood production and net CO2 emissions from energy wood use of Norway Spruce. BioEnergy Res. 2012, 5, 106–123. [Google Scholar] [CrossRef]
  28. Kärkkäinen, L.; Matala, J.; Härkönen, K.; Kellomäki, S.; Nuutinen, T. Potential recovery of industrial wood and energy wood raw material in different cutting and climate scenarios for Finland. Biomass Bioenergy 2008, 32, 934–943. [Google Scholar] [CrossRef]
  29. Hynynen, J.; Salminen, H.; Ahtikoski, A.; Huuskonen, S.; Ojansuu, R.; Siipilehto, J.; Lehtonen, M.; Eerikäinen, K. Long-term impacts of forest management on biomass supply and forest resource development: A scenario analysis for Finland. Eur. J. For. Res. 2015, 134, 415–431. [Google Scholar] [CrossRef]
  30. Heinonen, T.; Pukkala, T.; Mehtätalo, L.; Asikainen, A.; Kangas, J.; Peltola, H. Scenario analyses for the effects of harvesting intensity on development of forest resources, timber supply, carbon balance and biodiversity of Finnish forestry. For. Policy Econ. 2017, 80, 80–98. [Google Scholar] [CrossRef]
  31. Pilli, R.; Grassi, G.; Kurz, W.A.; Fiorese, G.; Cescatti, A. The European forest sector: Past and future carbon budget and fluxes under different management scenarios. Biogeosciences 2017, 14, 2387–2405. [Google Scholar] [CrossRef]
  32. Eriksson, L.O.; Gustavsson, L.; Hänninen, R.; Kallio, M.; Lyhykäinen, H.; Pingoud, K.; Pohjola, J.; Sathre, R.; Solberg, B.; Svanaes, J.; et al. Climate change mitigation through increased wood use in the European construction sector-towards an integrated modelling framework. Eur. J. For. Res. 2012, 131, 131–144. [Google Scholar] [CrossRef]
  33. Lemprière, T.C.; Kurz, W.A.; Hogg, E.H.; Schmoll, C.; Rampley, G.J.; Yemshanov, D.; McKenney, D.W.; Gilsenan, R.; Beatch, A.; Blain, D.; et al. Canadian boreal forests and climate change mitigation. Environ. Rev. 2013, 21, 293–321. [Google Scholar] [CrossRef]
  34. Gustavsson, L.; Pingoud, K.I.M.; Sathre, R. Carbon dioxide balance of wood substitution: comparing concrete- and wood-framed buildings. Mitig. Adapt. Strateg. Glob. Chang. 2006, 11, 667–691. [Google Scholar] [CrossRef]
  35. Smyth, C.; Rampley, G.; Lemprière, T.C.; Schwab, O.; Kurz, W.A. Estimating product and energy substitution benefits in national-scale mitigation analyses for Canada. GCB Bioenergy 2017, 9, 1071–1084. [Google Scholar] [CrossRef]
  36. Gustavsson, L.; Haus, S.; Lundblad, M.; Lundström, A.; Ortiz, C.A.; Sathre, R.; Le Truong, N.; Wikberg, P.E. Climate change effects of forestry and substitution of carbon-intensive materials and fossil fuels. Renew. Sustain. Energy Rev. 2017, 67, 612–624. [Google Scholar] [CrossRef]
  37. Lundmark, T.; Bergh, J.; Hofer, P.; Lundström, A.; Nordin, A.; Poudel, B.C.; Sathre, R.; Taverna, R.; Werner, F. Potential roles of Swedish forestry in the context of climate change mitigation. Forests 2014, 5, 557–578. [Google Scholar] [CrossRef]
  38. Eriksson, E.; Gillespie, A.R.; Gustavsson, L.; Langvall, O.; Olsson, M.; Sathre, R.; Stendahl, J. Integrated carbon analysis of forest management practices and wood substitution. Can. J. For. Res. 2007, 37, 671–681. [Google Scholar] [CrossRef]
  39. Haus, S.; Gustavsson, L.; Sathre, R. Climate mitigation comparison of woody biomass systems with the inclusion of land-use in the reference fossil system. Biomass Bioenergy 2014, 65, 136–144. [Google Scholar] [CrossRef]
  40. Gustavsson, L.; Sathre, R. Energy and CO2 analysis of wood substitution in construction. Clim. Chang. 2011, 105, 129–153. [Google Scholar] [CrossRef]
  41. Baul, T.K.; Alam, A.; Strandman, H.; Kilpeläinen, A. Net climate impacts and economic profitability of forest biomass production and utilization in fossil fuel and fossil-based material substitution under alternative forest management. Biomass Bioenergy 2017, 98, 291–305. [Google Scholar] [CrossRef]
  42. Kilpeläinen, A.; Torssonen, P.; Strandman, H.; Kellomäki, S.; Asikainen, A.; Peltola, H. Net climate impacts of forest biomass production and utilization in managed boreal forests. GCB Bioenergy 2016, 8, 307–316. [Google Scholar] [CrossRef]
  43. Schlamadinger, B.; Marland, G. The role of forest and bioenergy strategies in the global carbon cycle. Biomass Bioenergy 1996, 10, 275–300. [Google Scholar] [CrossRef]
  44. Sathre, R.; O’Connor, J. Meta-analysis of greenhouse gas displacement factors of wood product substitution. Environ. Sci. Policy 2010, 13, 104–114. [Google Scholar] [CrossRef]
  45. Werner, F.; Taverna, R.; Hofer, P.; Richter, K. Carbon pool and substitution effects of an increased use of wood in buildings in Switzerland: First estimates. Ann. For. Sci. 2005, 62, 889–902. [Google Scholar] [CrossRef]
  46. Soimakallio, S.; Saikku, L.; Valsta, L.; Pingoud, K. Climate change mitigation challenge for wood utilization—The case of Finland. Environ. Sci. Technol. 2016, 50, 5127–5134. [Google Scholar] [CrossRef] [PubMed]
  47. Pingoud, K.; Perälä, A. Studies on Greenhouse Impacts of Wood Construction: 1. Scenario Analysis of Potential Wood Utilisation in Finnish New Construction in 1990 and 1994 2. Inventory of Carbon Stock of Wood Products in the Finnish Building Stock in 1980, 1990 and 1995; VTT Julkaisuja: Espoo, Finland, 2000. [Google Scholar]
  48. Kellomäki, S.; Strandman, H.; Nuutinen, T.; Peltola, H.; Korhonen, K.T.; Väisänen, H. Adaptation of Forest Ecosystems, Forests and Forestry to Climate Change. FINADAPT Working Paper 4; Mimeographs 334; Finnish Environment Institute: Helsinki, Finland, 2005. [Google Scholar]
  49. Kellomäki, S.; Peltola, H.; Nuutinen, T.; Korhonen, K.T.; Strandman, H. Sensitivity of managed boreal forests in Finland to climate change, with implications for adaptive management. Philos. Trans. R. Soc. Lond. B 2008, 363, 2341–2351. [Google Scholar] [CrossRef] [PubMed] [Green Version]
  50. Hynynen, J.; Ojansuu, R.; Hökkä, H.; Siipilehto, J.; Salminen, H.; Haapala, P. Models for Predicting Stand Development in MELA System; Research Paper 835; Finnish Forest Research Institute: Helsinki, Finland, 2002; p. 116. [Google Scholar]
  51. Tamminen, P. Expression of soil nutrient status and regional variation in soil fertility of forested sites in southern Finland. Folia For. 1991, 777, 40, (In Finnish with English Summary). [Google Scholar]
  52. Talkkari, A.; Hypén, H. Development and assessment of a gap-type model to predict the effects of climate change on forests based on spatial forest data. For. Ecol. Manag. 1996, 83, 217–228. [Google Scholar] [CrossRef]
  53. Kilpeläinen, A.; Alam, A.; Strandman, H.; Kellomäki, S. Life cycle assessment tool for estimating net CO2 exchange of forest production. GCB Bioenergy 2011, 3, 461–471. [Google Scholar] [CrossRef]
  54. Karjalainen, T.; Kellomäki, S.; Pussinen, A. Role of wood-based products in absorbing atmospheric carbon. Silva Fenn. 1994, 28, 67–80. [Google Scholar] [CrossRef]
  55. Hakkila, P.; Parikka, H. Fuel resources from the forest. In Bioenergy from Sustainable Forestry; Richardson, J., Björheden, R., Hakkila, P., Lowe, A.T., Smith, C.T., Eds.; Springer: Dordrecht, The Netherlands, 2002; Volume 71, pp. 19–48. ISBN 978-0-306-47519-1. [Google Scholar]
  56. Grelle, A.; Strömgren, M.; Hyvönen, R. Carbon balance of a forest ecosystem after stump harvest. Scand. J. For. Res. 2012, 27, 762–773. [Google Scholar] [CrossRef]
  57. Werner, F.; Taverna, R.; Hofer, P.; Thürig, E.; Kaufmann, E. National and global greenhouse gas dynamics of different forest management and wood use scenarios: A model-based assessment. Environ. Sci. Policy 2010, 13, 72–85. [Google Scholar] [CrossRef]
  58. Bowyer, J.; Bratkovich, S.; Howe, J.; Fernholz, K. Recognition of Carbon Storage in Harvested Wood Products: A Post-Copenhagen Update; Dovetail Partners, Inc.: Minneapolis, MN, USA, 2010; Available online: www.dovetailinc.org (accessed on 5 July 2017).
  59. Bergman, R.; Puettmann, M.; Taylor, A.; Skog, K.E. The carbon impacts of wood products. For. Prod. J. 2014, 64, 220–231. [Google Scholar] [CrossRef]
  60. Pingoud, K.; Pohjola, J.; Valsta, L. Assessing the integrated climatic impacts of forestry and wood products. Silva Fenn. 2010, 44, 155–175. [Google Scholar] [CrossRef]
  61. Jasinevičius, G.; Lindner, M.; Pingoud, K.; Tykkylainen, M. Review of models for carbon accounting in harvested wood products. Int. Wood Prod. J. 2015, 6, 198–212. [Google Scholar] [CrossRef]
  62. Sathre, R.; Gustavsson, L. Time-dependent radiative forcing effects of forest fertilization and biomass substitution. Biogeochemistry 2012, 109, 203–218. [Google Scholar] [CrossRef]
  63. Kim, M.H.; Song, H.B. Analysis of the global warming potential for wood waste recycling systems. J. Clean. Prod. 2014, 69, 199–207. [Google Scholar] [CrossRef]
Figure 1. Annual net CO2 exchange (Mg CO2 ha−1 year−1) over the 40-year period for the baseline (T26) and some selected alternative management scenarios and harvest intensities in the final felling made at breast height diameter (DBH) of 26 cm in southern (a), western (b) and eastern (c) sub-regions of Finland. For the key of the management scenarios, see Table 1.
Forests 08 00455 g001
Figure 2. Annual avoided emissions (Mg CO2 ha−1 year−1) and annual net CO2 exchange (Mg CO2 ha−1 year−1) over the 40-year period for different management scenarios and three different harvest intensities including timber (T), timber and logging residues, without (BN) and with coarse roots and stumps (BNR) in the final felling made at DBH of 26 cm and 22 cm in southern (a), western (b) and eastern (c) sub-regions of Finland. For the key of the management scenarios, see Table 1.
Forests 08 00455 g002
Figure 3. Net present value (NPV, € ha−1) and annual net CO2 exchange (Mg CO2 ha−1 year−1) over the 40-year period for different management scenarios and three different harvest intensities including timber (T), timber and logging residues, without (BN) and with coarse roots and stumps (BNR) in the final felling made at DBH of 26 cm and 22 cm in southern (a), western (b) and eastern (c) sub-regions of Finland. For the key of the management scenarios, see Table 1.
Forests 08 00455 g003
Figure 4. Mean annual net ecosystem CO2 exchange, NEE (Mg CO2 ha−1 year−1) (left) and relative difference (% changes) in NEE (right) for four 10-year period for different management scenarios, compared to baseline management (T26) and under three different harvest intensities including timber (T), timber and logging residues, without (BN) and with coarse roots and stumps (BNR) in the final felling made at DBH of 26 cm and 22 cm in southern (a,b), western (c,d) and eastern (e, f) sub-regions of Finland. For the key of the management scenarios, see Table 1.
Forests 08 00455 g004
Figure 5. Mean annual net ecosystem CO2 exchange, NEE (Mg CO2 ha−1 year−1) against harvested biomass yield (Mg ha−1 year−1) over the 40-year period for different management scenarios and three different harvest intensities including timber (T), timber and logging residues, without (BN) and with coarse roots and stumps (BNR) in the final felling made at DBH of 26 cm and 22 cm in southern (a), western (b) and eastern (c) sub-regions of Finland. For the key of the management scenarios, see Table 1.
Forests 08 00455 g005
Figure 6. Annual net CO2 exchange (Mg CO2 ha−1 year−1) using default displacement factors over the 40-year period for different management scenarios and under three different harvest intensities including timber (T), timber and logging residues, without (BN) and with coarse roots and stumps (BNR) in the final felling made at DBH of 26 cm and 22 cm in southern (a), western (b) and eastern (c) sub-regions of Finland. Upper cap (lowest value) and lower cap (highest value) shown in the bar represent for doubling and lowering the default displacement factors. For the key of the management scenarios, see Table 1.
Forests 08 00455 g006
Table 1. Forest management scenarios (baseline and alternative forest management scenarios) and biomass harvest intensities utilized for the study. Baseline management followed current recommendations for thinning and final felling made at tree diameter at breast height (DBH) of 26 cm. In the alternative scenarios, changes in thinning thresholds (+/−), DBH in final felling (26/22 cm) and harvesting intensity (T/BN/BNR) were considered.
Management ScenariosHarvesting Intensity in Final FellingManagement Scenario Acronym
Thinning Threshold ChangesFinal Felling DBH (cm)Timber (T)Timber and Logging Residues (BN)Timber, Logging Residues and Coarse Roots and Stumps (BNR)
0%26/22T/BN/BNRT26 *, BN26, BNR26
T22, BN22, BNR22
+20%26/22T/BN/BNRT26+, BN26+, BNR26+
T22+, BN22+, BNR22+
−20%26/22T/BN/BNRT26−, BN26−, BNR26−
T22−, BN22−, BNR22−
* Baseline management.

