Decision Support System for Adaptive Regional-Scale Forest Management by Multiple Decision-Makers


1
Department of Forest Management, Forestry and Forest Products Research Institute, 1 Matsunosato, Tsukuba, Ibaraki 305-8687, Japan
2
Department of Forest Vegetation, Forestry and Forest Products Research Institute, 1 Matsunosato, Tsukuba, Ibaraki 305-8687, Japan
3
Fenner School of Environment and Society, Australian National University, Canberra 2601, Australia
*
Author to whom correspondence should be addressed.
Forests 2017, 8(11), 453; https://doi.org/10.3390/f8110453
Submission received: 27 October 2017
/
Revised: 13 November 2017
/
Accepted: 15 November 2017
/
Published: 17 November 2017
(This article belongs to the Special Issue Decision Support Approaches in Adaptive Forest Management—Selected Papers from the IUFRO 125th Anniversary Congress)
Abstract
:Various kinds of decision support approaches (DSAs) are used in adaptive management of forests. Existing DSAs are aimed at coping with uncertainties in ecosystems but not controllability of outcomes, which is important for regional management. We designed a DSA for forest zoning to simulate the changes in indicators of forest functions while reducing uncertainties in both controllability and ecosystems. The DSA uses a Bayesian network model based on iterative learning of observed behavior (decision-making) by foresters, which simulates when and where zoned forestry activities are implemented. The DSA was applied to a study area to evaluate wood production, protection against soil erosion, preservation of biodiversity, and carbon retention under three zoning alternatives: current zoning, zoning to enhance biodiversity, and zoning to enhance wood production. The DSA predicted that alternative zoning could enhance wood production by 3–11% and increase preservation of biodiversity by 0.4%, but decrease carbon stock by 1.2%. This DSA would enable to draw up regional forest plans while considering trade-offs and build consensus more efficiently.
1. Introduction
Adaptive management (AM) has been advocated for achieving sustainable forest management [1,2,3]. AM supports management of natural resources while reducing uncertainties through iterative learning and improving management by incorporating environmental and social changes [4,5]. Various cases or methods have been proposed to facilitate AM while reducing uncertainties. Some of these decision support approaches (DSAs) are powerful tools for implementing AM [6,7,8].
Williams [9] identified four forms of uncertainties concerned with natural resource management: environmental variation, partial observability, partial controllability, and structural or process uncertainty. Environmental variation is caused by such factors as climate variability and strongly affects natural resources. Partial observability arises from a lack of ability and finances to investigate a whole ecosystem, and it results in sampling variation. Partial controllability expresses the differences between the intent of a management plan and actual actions. Structural or process uncertainty refers to incomplete knowledge of the structure and processes of ecosystems, which can change during investigations. These uncertainties can be grouped as ecosystem uncertainties (such as environmental variations or structural uncertainties) and social uncertainties (such as partial controllability or economic changes). The integration of these uncertainties is reflected in the differences in the consequences between a DSA simulation and actual management.
The importance of uncertainties in controllability is acknowledged in natural resource management [10]. In particular, where multiple decision-makers or stakeholders are involved, it is necessary to consider the influence of broad-scale management (e.g., zoning; see [11]) on local-scale decision-making [12,13]. Discordances between scales of management can be understood only by examining differences between the intentions and observed behaviors of decision-makers [14]. Although some DSAs designed to deal with social uncertainties related to economic change have been established (e.g., [15,16]), no DSAs designed to apply AM to regional forestry while reducing uncertainties of controllability have been offered.
We established a DSA for sustainable AM to support regional forest zoning plans by simulating changes of forest functions relevant to controllability and ecosystem uncertainties. The target scale of the DSA is the municipality, which is the minimum unit of governance and plays a central role in regional forest management in Japan. Most forest owners in Japan have only tiny forest areas, so each municipality usually includes many decision-makers for each forestry activity. We then applied the DSA to a study area to validate its efficacy.
To consider decision-making by individual foresters, the DSA (1) simulates the allocation of future forest resources by predicting when and where forestry activities will be implemented on the basis of observed behavior; and (2) estimates indicators of forest ecological services in simulated forest scenarios. To improve the controllability and effectiveness of regional forest management, the DSA uses a Bayesian network (BN) model to reduce uncertainties through iterative learning.
The case study estimated changes in three indicators of forest functions (wood production, protection against soil erosion, and preservation of biodiversity) under three alternative zoning plans (current zoning, zoning to enhance protection against soil erosion, and zoning to enhance biodiversity). Differences from current zoning indicate the effectiveness of each alternative. Such results will enable municipal governments to implement AM for local forest more efficiently.
Ecological services simulated by DSAs include uncertainties in controllability and ecosystem function. In the case study, we did not interpret the consequences of individual uncertainties, which are often not important for forest managers, who want to know the influences of their plans and management on the resultant ecosystem services.
2. Materials and Methods
To construct a DSA for sustainable regional forest management, we integrated a long-term simulation of spatial allocation of forest resources and methods for evaluation of multiple forest functions based on a BN model, which improves accuracy by iterative learning and is suitable for AM [17,18]. BN is a directed acylic graph with a set of variables and a set of directed edges between variables, which can factor the joint probability distribution for the variables [19,20,21]. For classification problems such as a classification of whether a forest activity is implemented or not, BN have many successful applications reported in literature as Bayesian networks classifier (see [22]).
2.1. Simulation Model
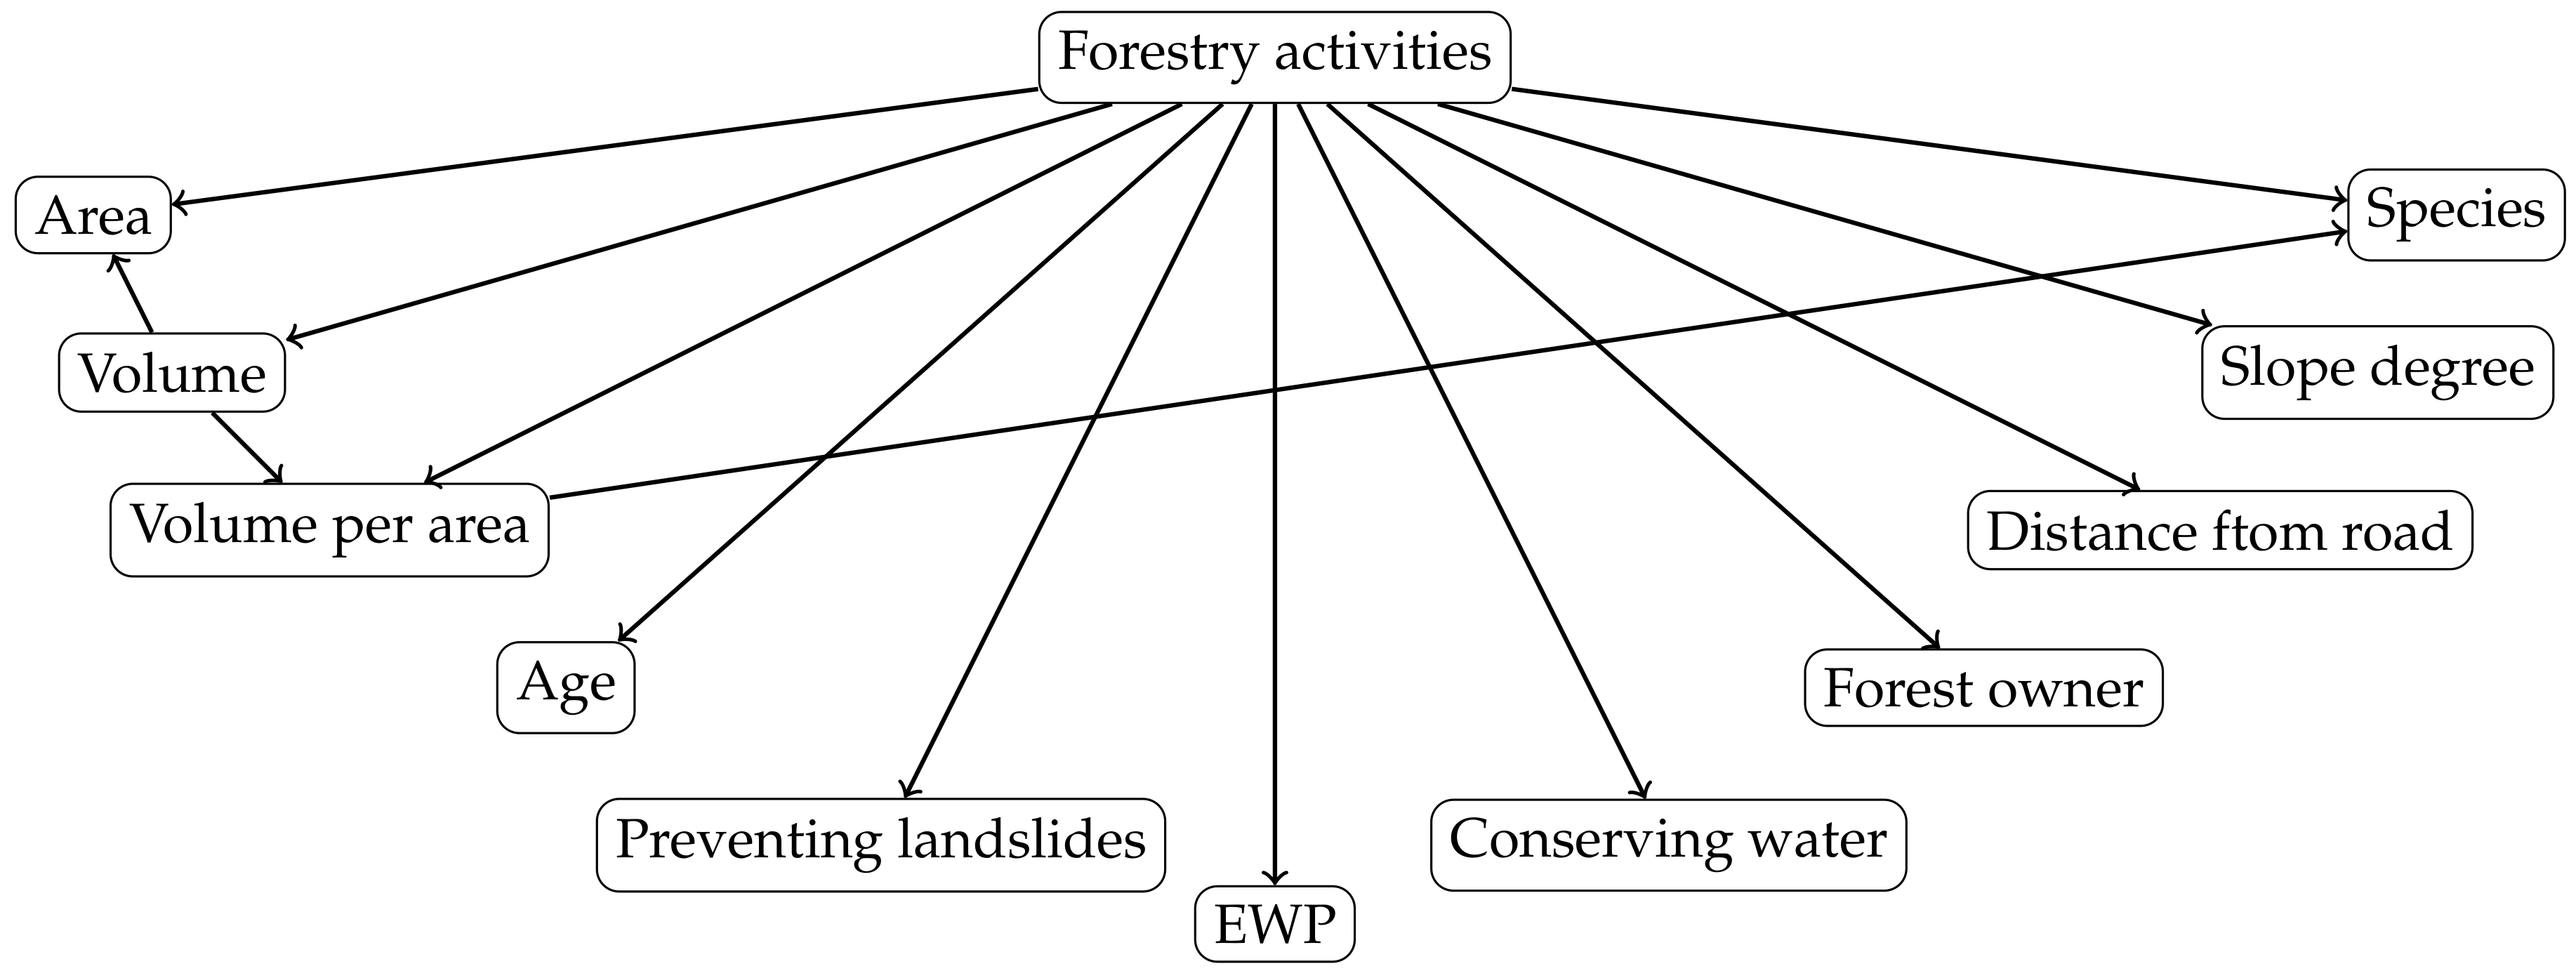
To construct a model for a DSA that can reduce uncertainties of decision-making for each forestry activity, simulations must be based on observed behavior of forest owners (e.g., harvesting, planting), because even forest owners themselves do not often know how they arrive at decisions [23]. We based our model on an earlier model [24] constructed to calculate the probability of an operation in a forest stand by a BN model based on observed behavior in forestry activities in the region by Maximum-Likelihood with BNLearn R package [25]. Probabilities, which are based on the forest type, geology, and social factors relevant to target forest stands were inferred with gRain R package [26]. The estimated probability indicates whether or not a particular forestry activity, including clear-cutting, occurs in each stand. Generally speaking, clear-cutting is not the most environmentally-friendly method for having great impacts on soil erosion, wildlife (biodiversity) and other public functions, whereas selective cutting is more environmentally benign. Even so, we only focused on clear-cutting because methods such as selective cutting is not a common way to harvest in Japan. We included zoning as a key factor to reveal its influence on future forest functions. As decision-making in forestry should be affected by subsidies and guidelines designed for individual zones, we also incorporated biological, geographical, and social factors to estimate probabilities (Table 1).
The calculated probabilities are then used to simulate the assignment of forestry activities in space and over time. The model compares the probability with a random number (0–1); if the probability is larger than the random number, the activity is applied to the stand. The model uses random numbers in the simulation, so the Simulations over 100 years were carried out 100 times, and means ± variances were compared.
2.2. Methods for Evaluation of Multiple Forest Functions
We evaluated timber production, protection against soil erosion, preservation of biodiversity, and carbon retention. Timber production was evaluated from the simulated amount of harvested timber. The timber volume of each harvest was estimated from a yield table. Indicators for other functions were determined as follows.
2.2.1. Protection Against Soil Erosion
Soil supplies ecological services such as water, clean air, and biodiversity [27], so the protection of soil against erosion is crucial [28,29]. In forest, soil erosion is caused mainly by rain and by surface streams [30], and pillar, rill, and gully erosion are typical [31,32,33]. The occurrence of erosion depends on the terrain and on objects on the forest floor [34,35].
We evaluated the risk of soil erosion with a BN model to reveal the relationships with terrain factors and forest floor cover percentage (FCP). In general, steep slopes and poor FCP often contribute to erosion [36,37]. The BN model was trained with data from the National Forest Inventory of Japan (NFI). The NFI is based on a forest resource monitoring survey implemented every 5 years in permanent sampling plots on a 4-km grid [38]. Tree variables such as species and size, FCP, and degree of soil erosion are measured, as well as site conditions such as slope and surface features. The existence of pillar, rill, and gully erosion in every plot is recorded as a binary variable. FCP is measured by eye in increments of 10%. Vegetation cover and large stones are assessed from FCP (Figure 1). FCP is low in crowded forests because the understory vegetation is sparse [35,39].
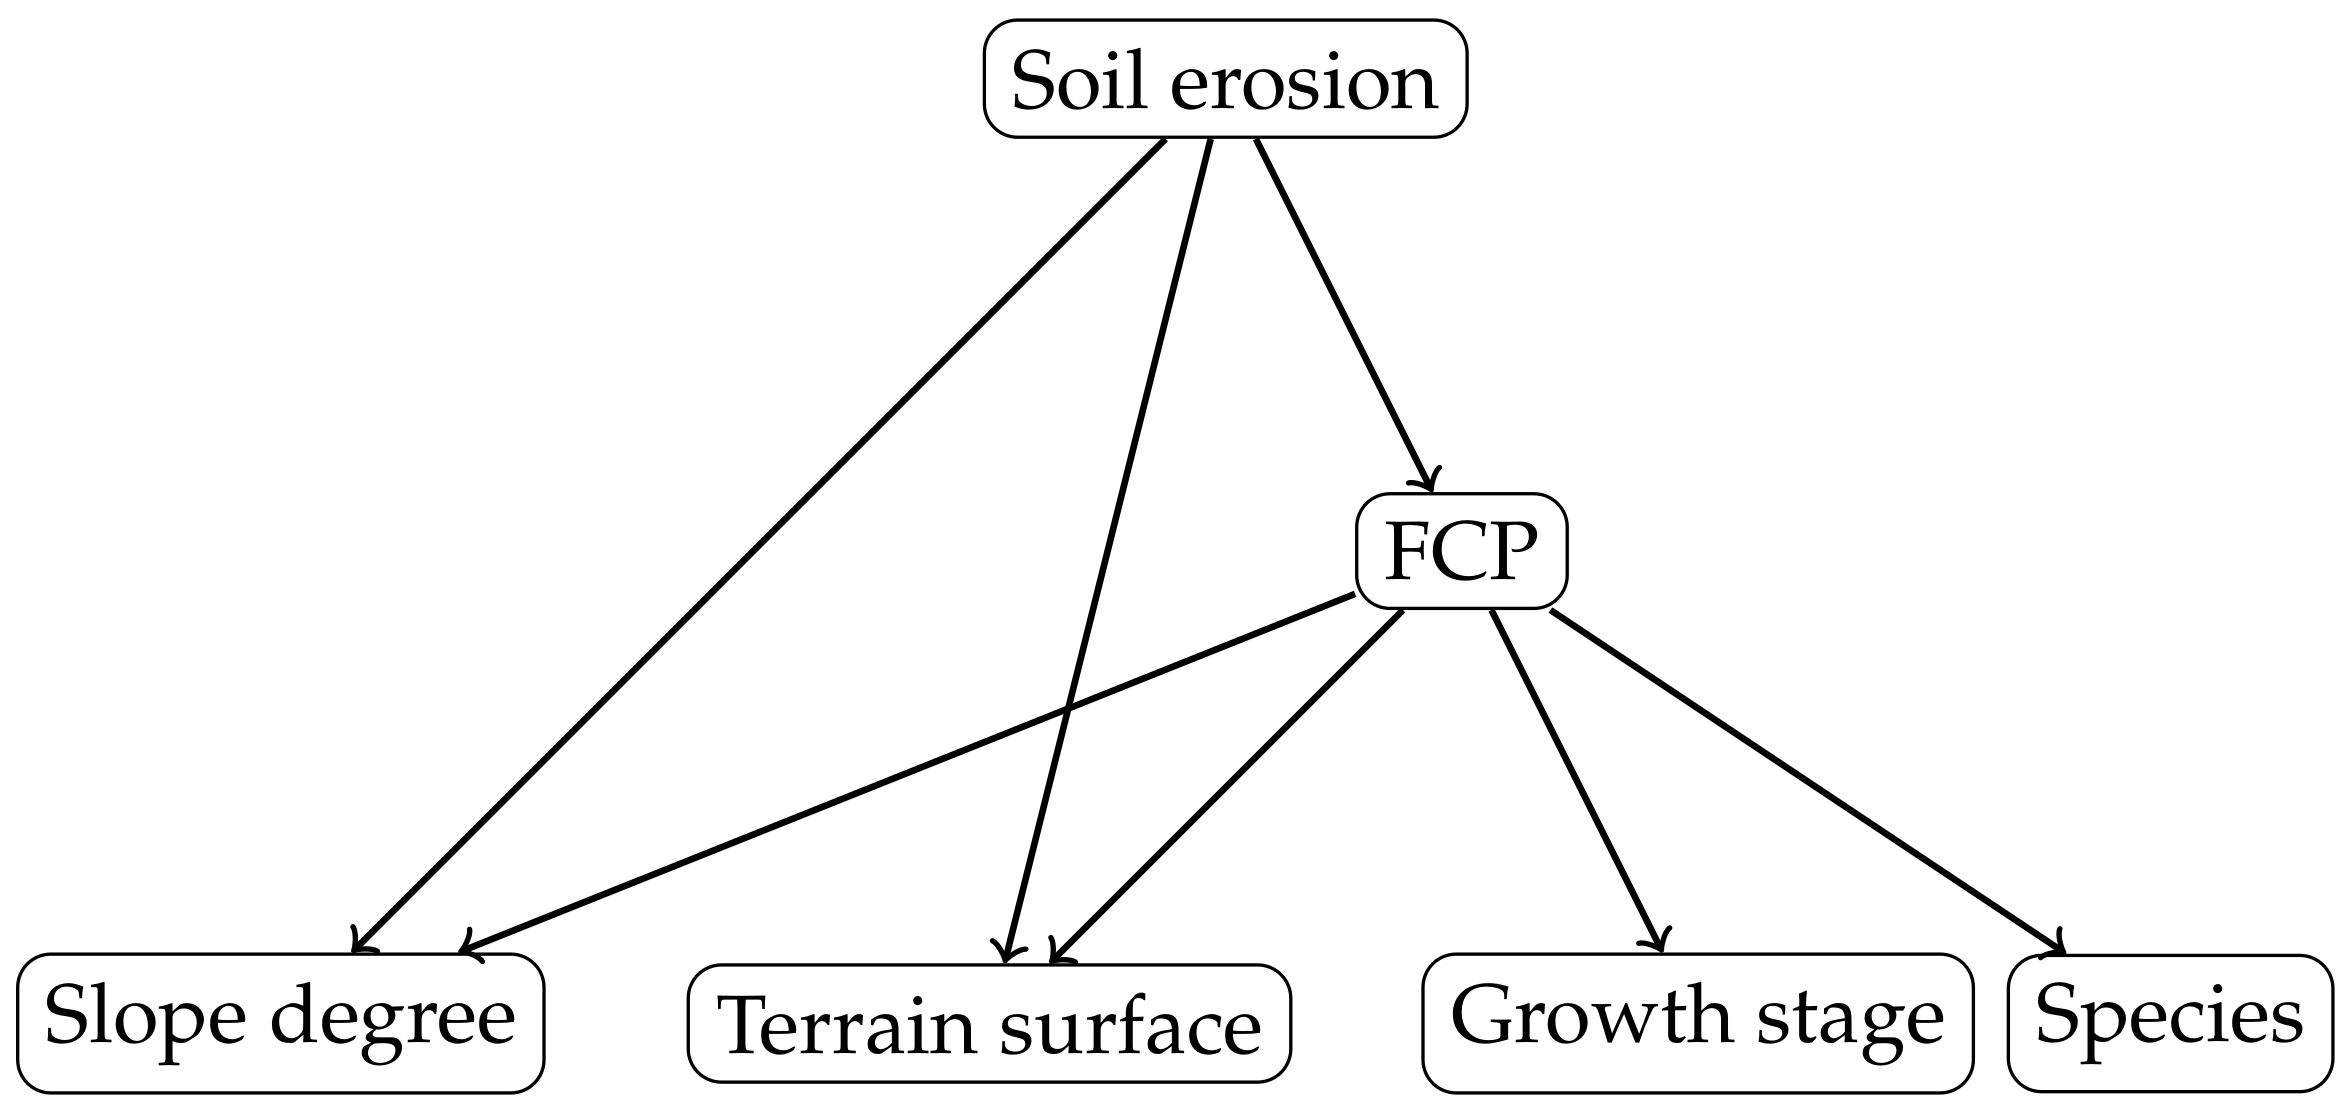
The structure of the BN model is shown in Figure 2. Slope and surface topography are used as terrain factors. Forest growth stage and dominant species, which determine the forest density, influence FCP. FCP tends to be lower in young forest than in very young and older forest on account of crowding. Forest stage is determined by eye in the NFI. Elements for surface are integrated in two categories to reduce complexity, gentle and steep. We determined the structure of the BN model considering a mechanism of soil erosion, which occur by raindrops and surface stream, and is protected by FCP. The BN model learned NFI of third term (2009–2013), which contains 12,497 plots data for estimating parameters by Maximum-Likelihood with BNLearn R package. States of variables are shown in Table 2.
The area where the DSA is applied is divided into 10-m square cells, each of which is evaluated to determine probabilities. Then the probability of soil erosion is inferred for each cell by the forest conditions with gRain R package. The forest conditions for each cell are determined based on Fundamental Geospatial Data [40] and forest inventory data provided by a local government. Slope degree, terrain surface, forest growth stage, and dominated species were used for inference as factors. FCP was inferred from those data because there is no direct information available about it. Cells with p > 15% (the proportion of plots with soil erosion in the NFI) are regarded as high-risk cells. The total high-risk area is treated as an indicator of the function of protection against soil erosion. If regional management has a good influence on the function, this indicator should be low.
2.2.2. Preserving Biodiversity
The preservation of biodiversity is crucial owing to its relationships with other forest functions, as well as its own economic, ecological, spiritual, and aesthetic values [41]. Old-growth or primary forests have high biodiversity values because they provide habitat to many species (e.g., [42,43]). Studies suggest that the value of biodiversity can be maintained by certain management methods such as establishing unharvested nature reserves [44] and retaining trees during the harvest [45].
Because studies of the retention of old-growth components during harvest (retention forestry) are lacking in Japan and the available information is easily managed, we evaluated the preservation of biodiversity using the areas of natural old-growth forests as indicators. We defined old-growth forest as forest over 80 years old. Ohsawa and Shimokawa [46] also treated forest over 80 years as old-growth forest and found high conservation values.
2.2.3. Carbon Retention
The importance of forest as a carbon sink is likely incontrovertible in this era of climate change [47]. There is increased need to evaluate the effect of forest management on carbon stocks to contribute to the global warming prevention [48]. Regional forest management can prevent decrease of carbon retention by suppressing excessive logging.
We evaluated the function for carbon retention by estimating living woody biomass with an equation provided by Greenhouse Gas Inventory Office of Japan [49]. The carbon stocks are calculated by multiplying the stand volume of each tree species by wood density, the biomass expansion factor, the root-to-shoot ratio and the carbon fraction of dry matter:
where C is carbon stock in living biomass [] , V is stem volume [m], D is wood density [m], BEF is biomass expansion factor for conversion of stem volume, R is root-to-shoot ratio, CF is carbon fraction of dry matter []. The parameters for each tree species (j) are shown in Table 3.
2.3. Case Study
We applied the DSA that we established to a study area. Using data collected in the study area, the model simulated the changes in indicators of forest functions among the three zoning alternatives. We did not investigate individual uncertainties, only integrated uncertainties, which is what planners need to know. The ability to reduce uncertainties was not verified, because not enough data for iterative learning were available.
2.3.1. Study Area
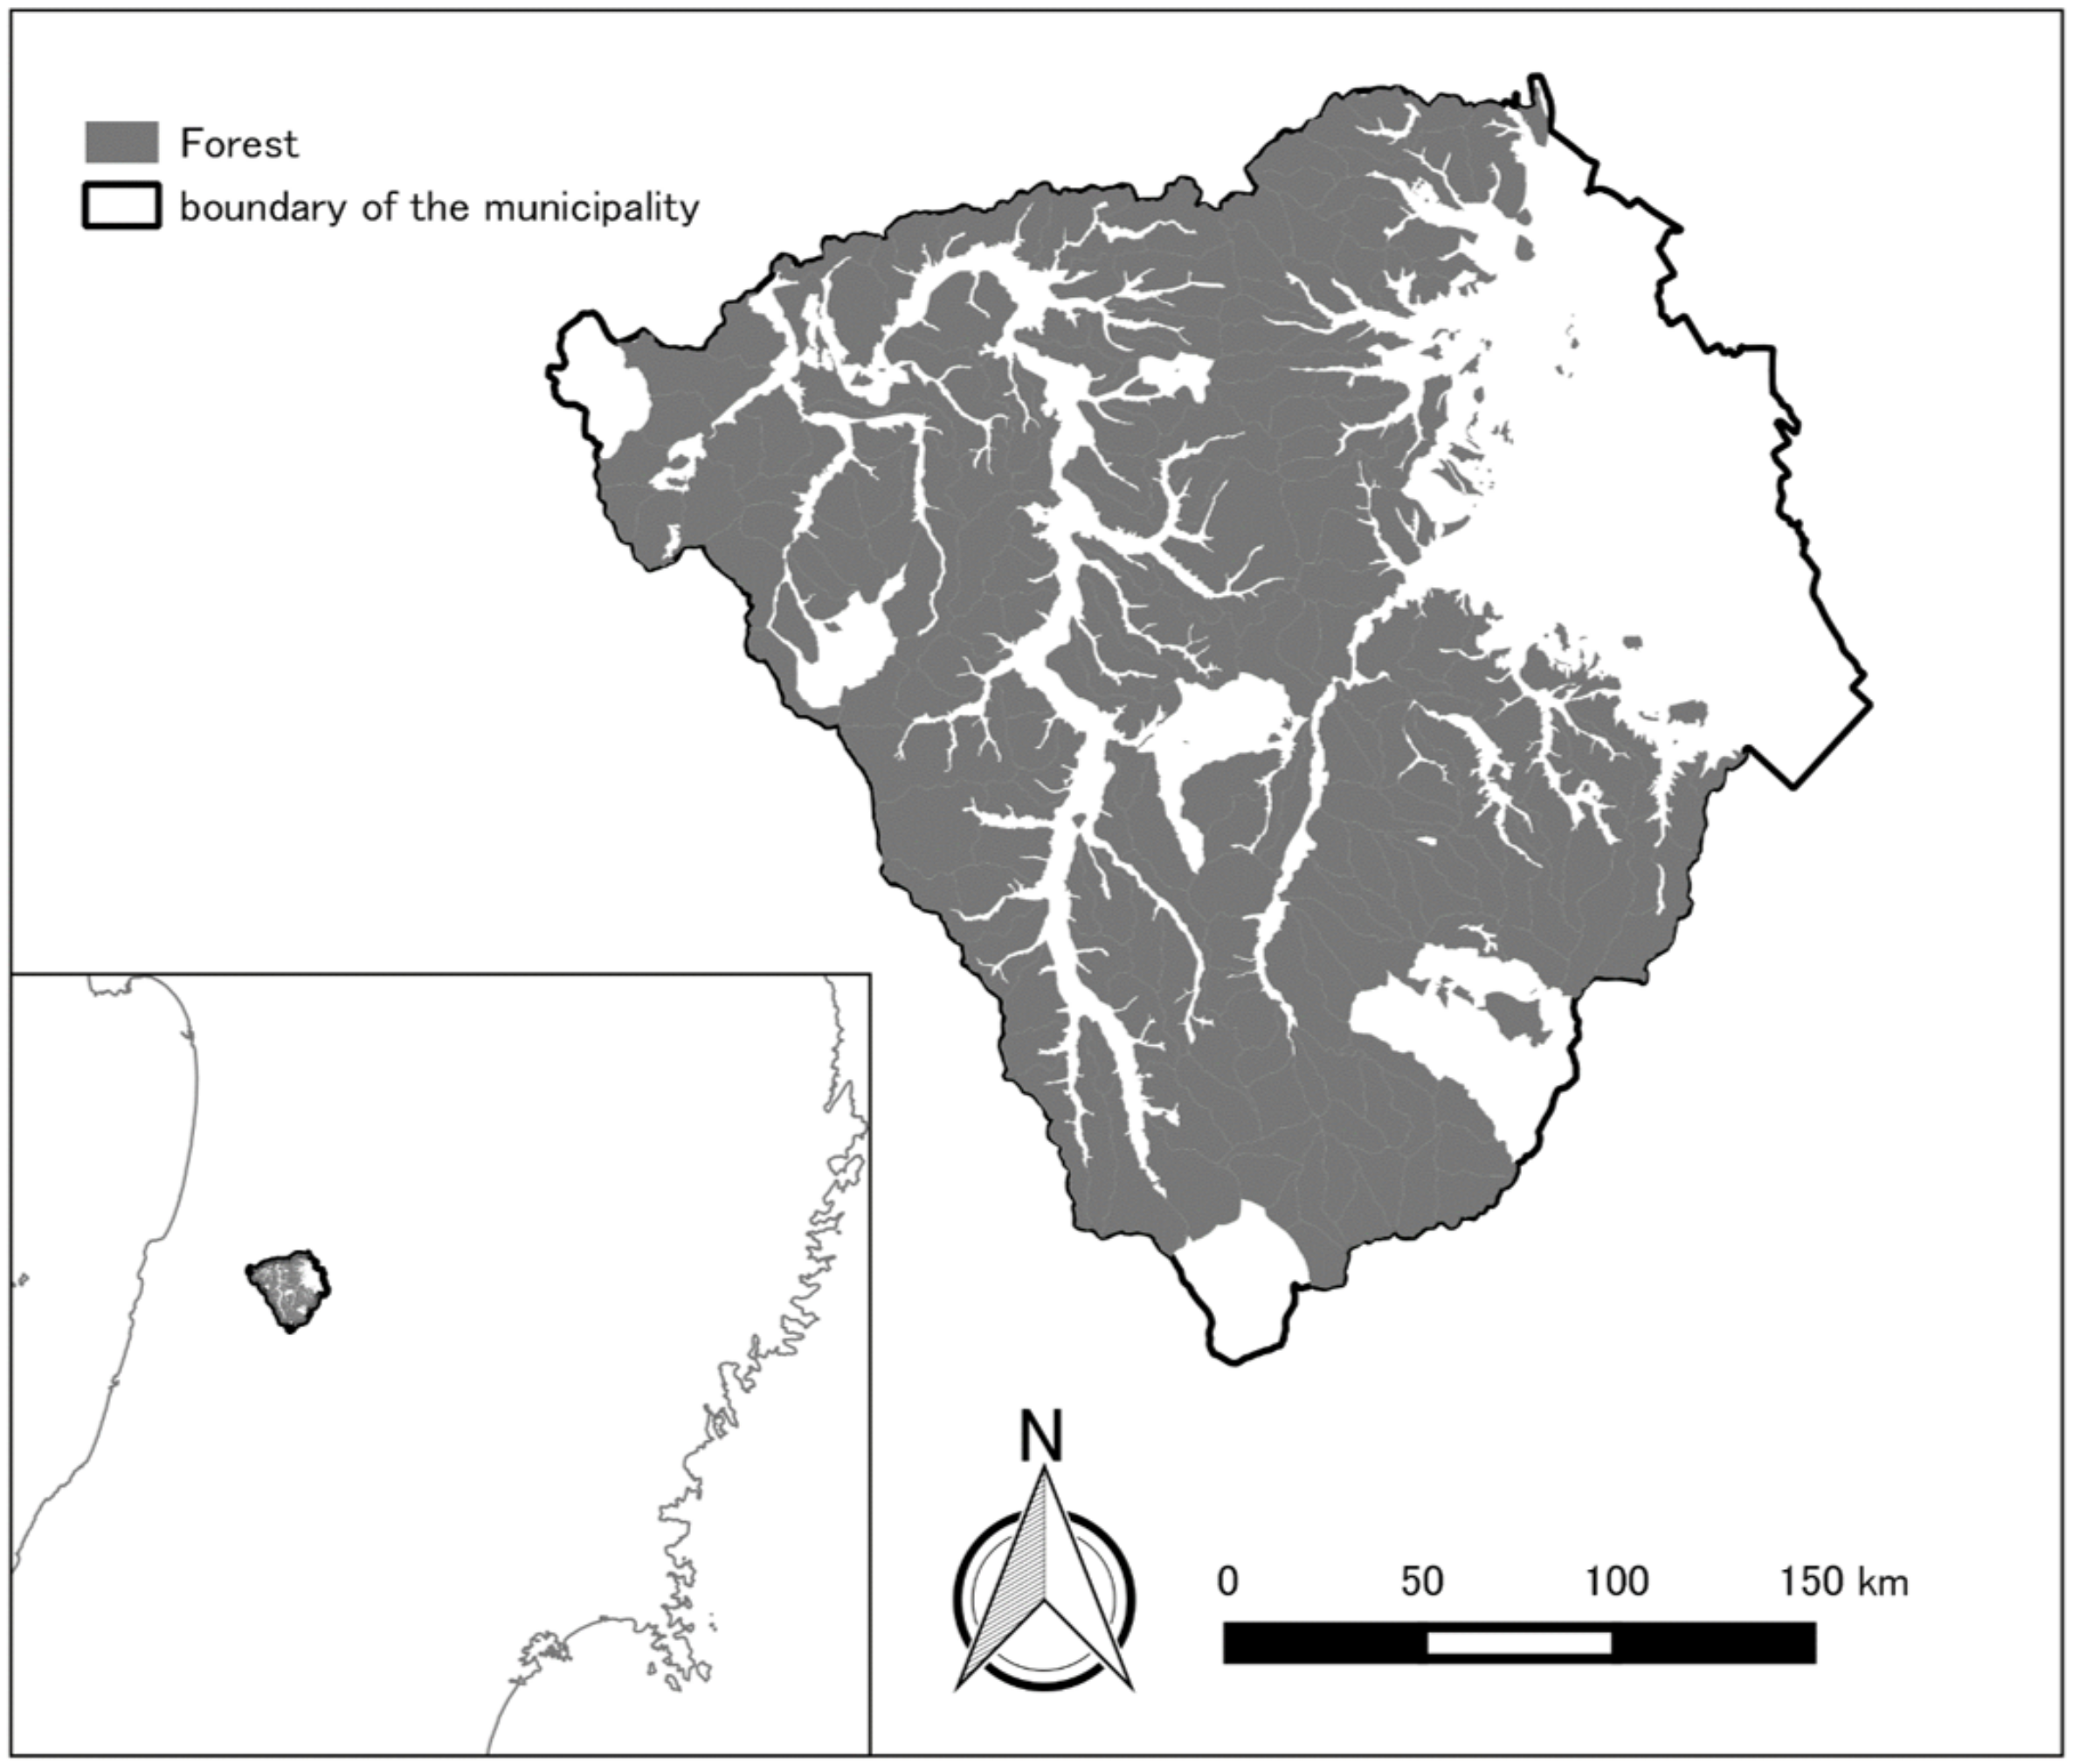
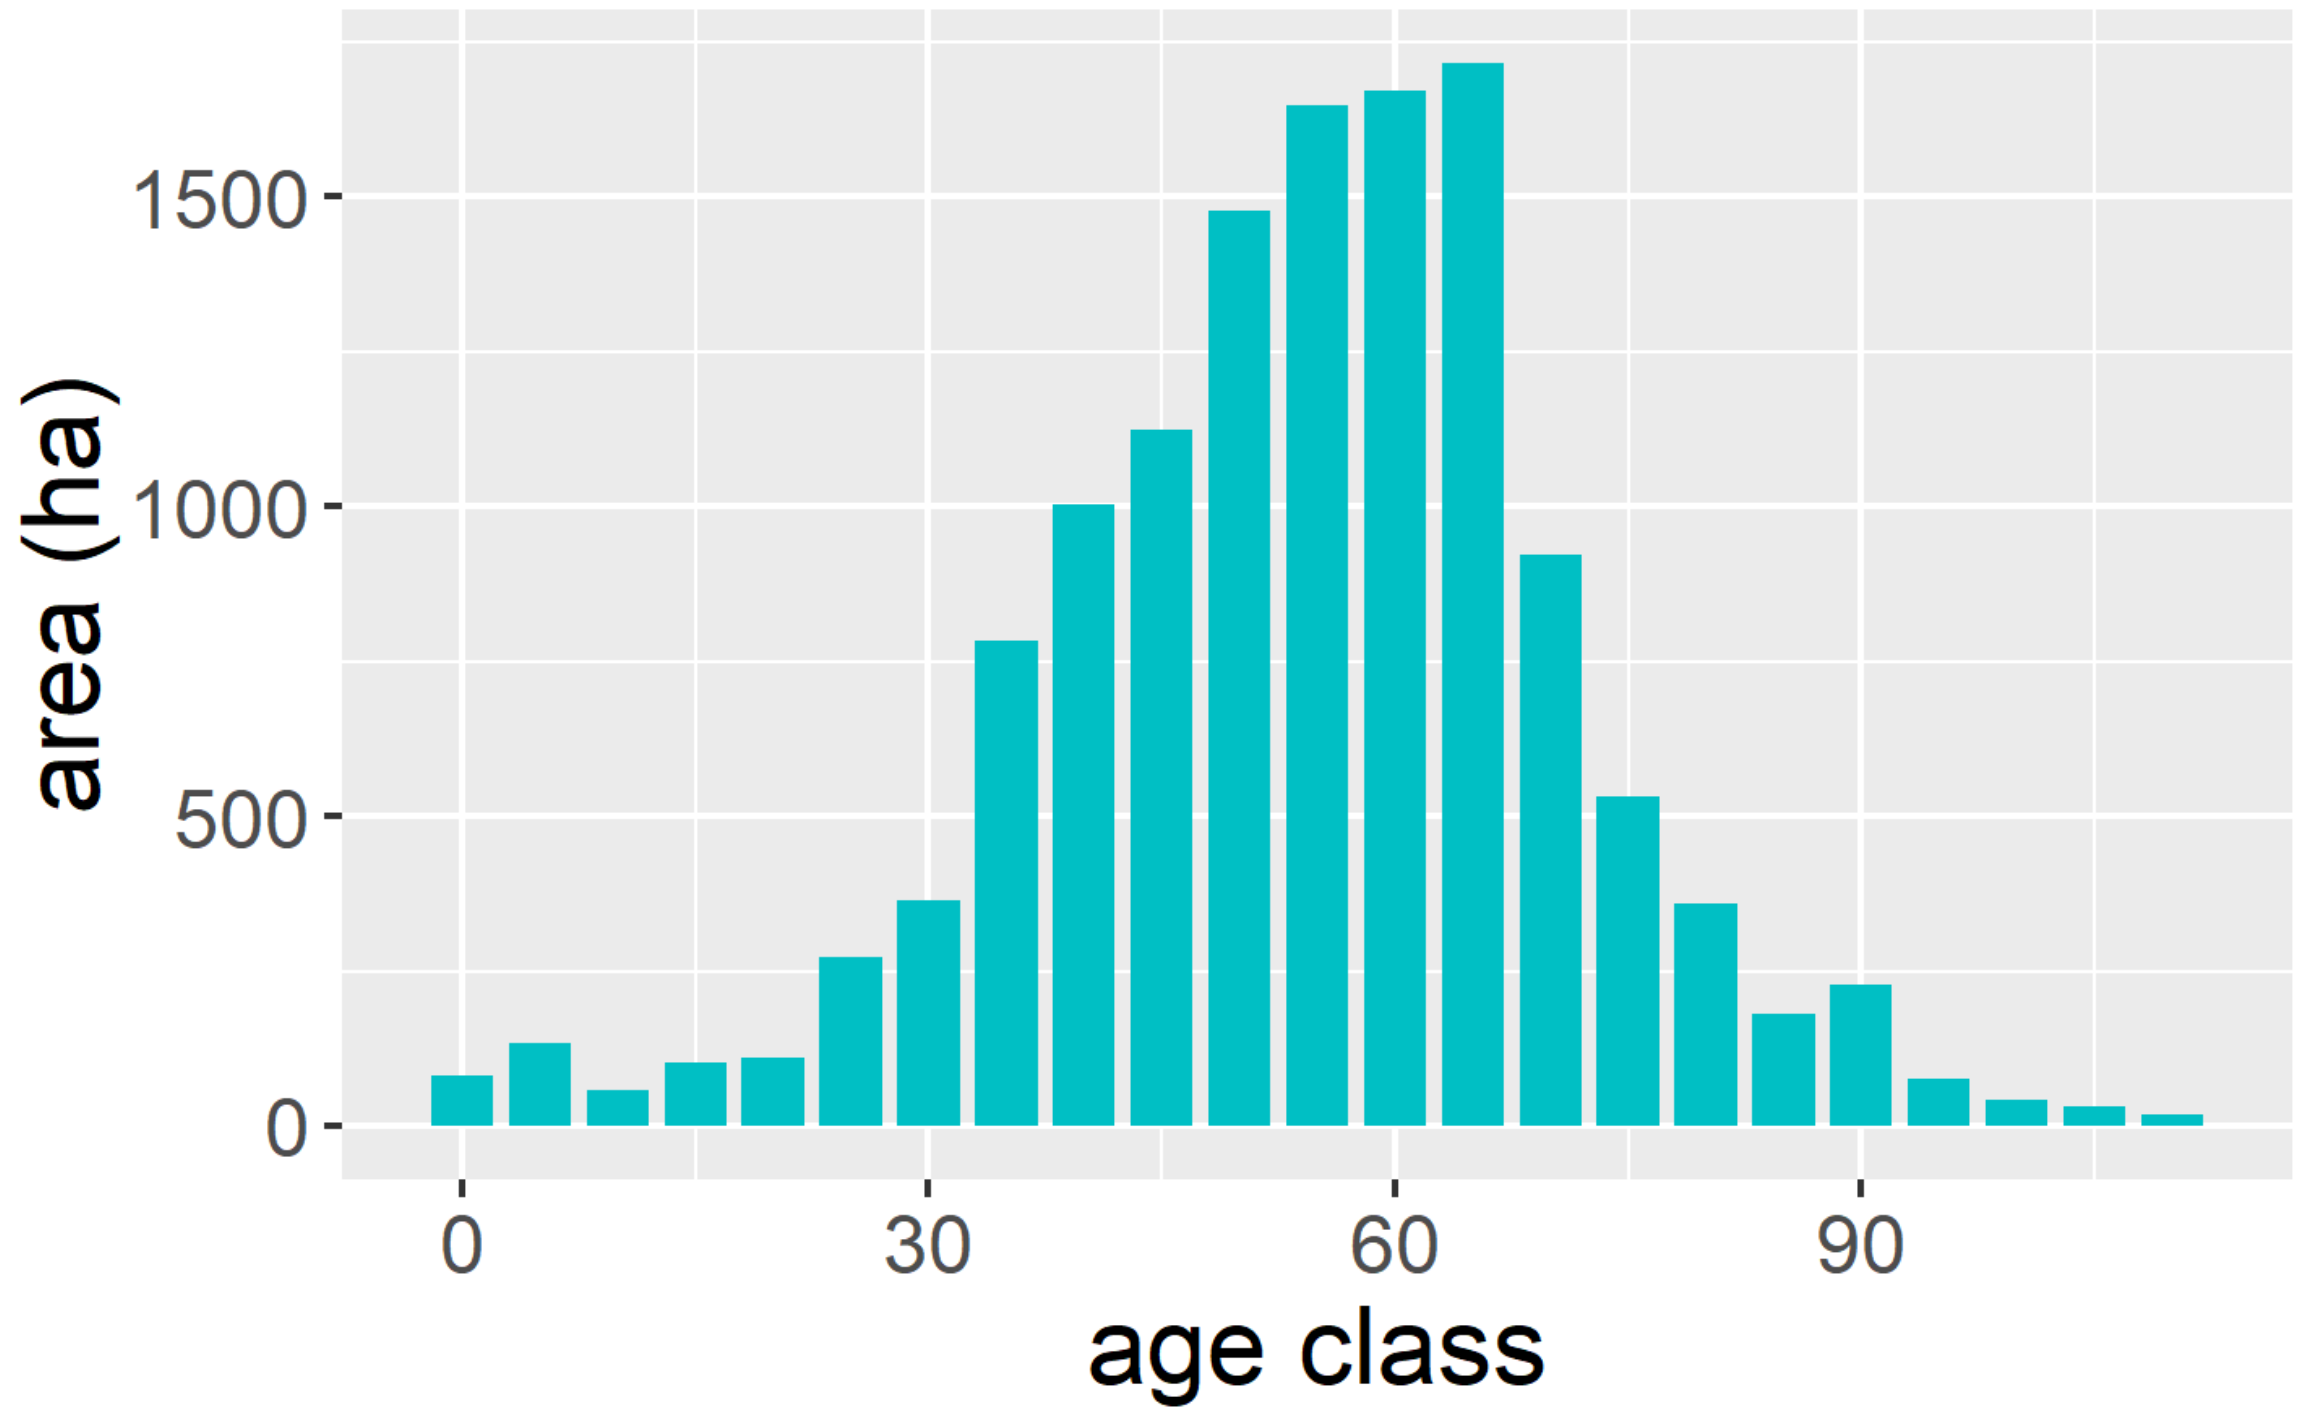
We modeled alternative plans for forest zoning in Ugo municipality, Akita prefecture (Figure 3). Here, 90% of forest is privately owned (most by small-scale owners), of which half is plantation forest. The dominant species in most plantation forests is sugi (Japanese cedar, Cryptomeria japonica), which is the major forestry species in Japan. Forestry is one of the main pillars of the economy in the region; however, low timber prices have caused economic stagnation in forestry for several decades. This situation gives the age distribution of forests a peaked shape (Figure 4). Timber production must be enhanced to activate the regional economy.
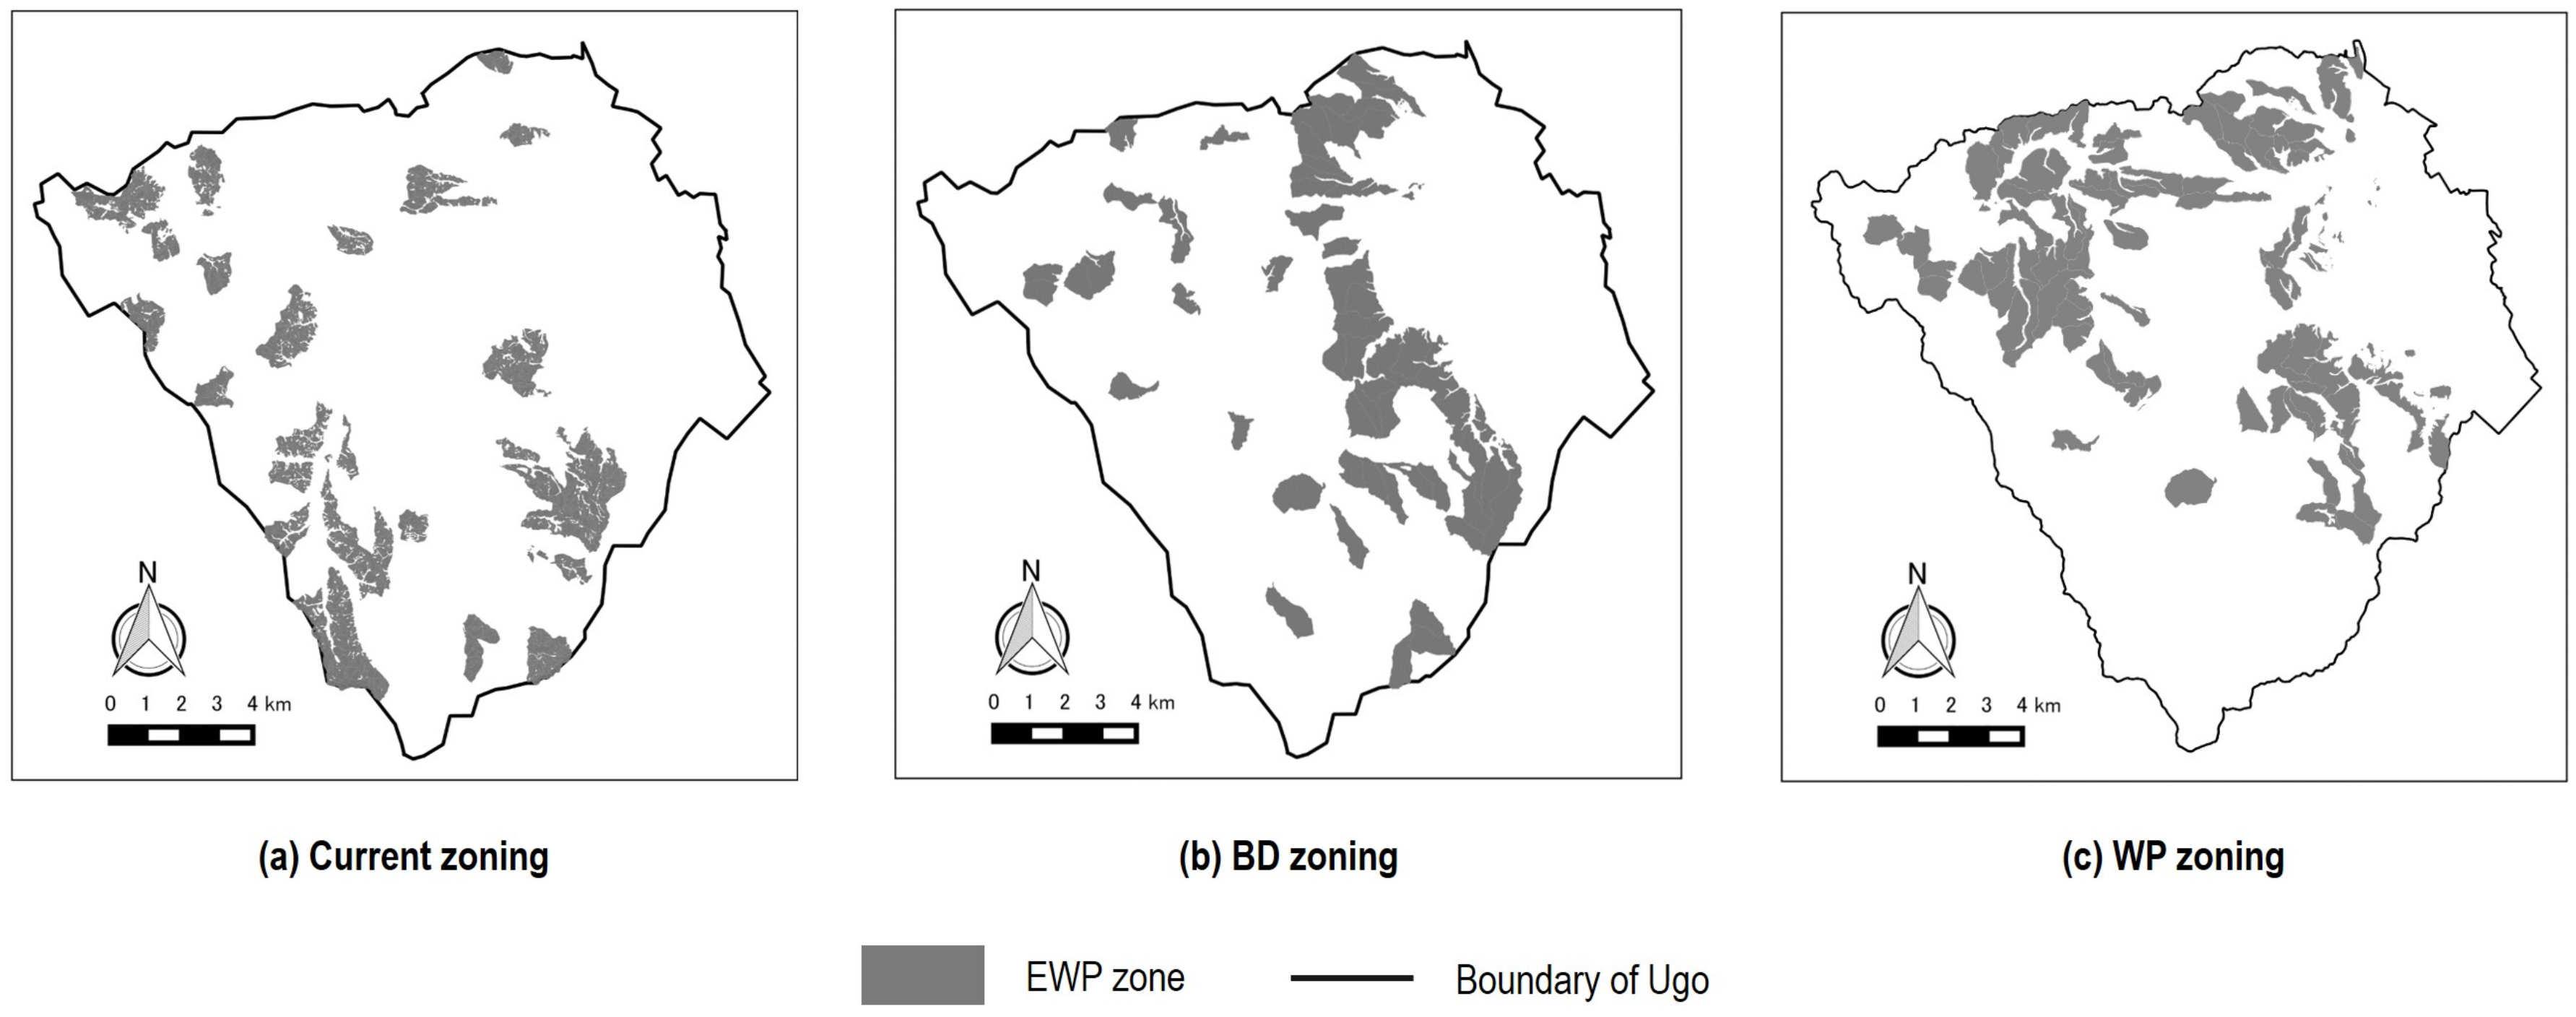
The municipality designates 23% of privately owned forest as an “enhancing wood production” (EWP) zone, which is intended to promote timber production by preferential treatments such as subsidies. The percentage and assignation of EWP zone were initially determined according to the distribution of mature plantation forest when the first municipality plan was established in 1999, and have not been varied since. The designation may not be efficient in terms of forestry promotion.
Forest functions are significant in the region. Rice, which requires plentiful clean water, is extensively cropped, and thus relies on forest to provide clean water and to conserve soil.
Figure 5 shows a structure and variables of the BN model used to simulate the allocation of forestry activities in the case study. The structure of BN was estimated by the authors, and the parameters were estimated by Maximum-Likelihood with BNLearn R package. The model was trained on data on forest resources and forestry activities from 2013 to 2015 (forest inventory and tree felling records supplied by the prefectural government), which contains 12,011 forest stands data for each year. Clear-cutting occurred in both plantations and natural forest. Probabilities of forestry activities were inferred with gRain R package. The probabilities of stands with conditions, which did not appear in training data, were inferred with evidences of species and age, although such stands were very few. Forest older than 150 years excluded from the list of clear-cutting because a sawmill in the region refuses to accept logs beyond a certain diameter.
2.3.2. Forest Zoning Alternatives
Sustainable forest management depends on the application of scientific zoning methods. We considered three forms of zoning: current zoning, zoning to enhance biodiversity (BD zoning), and zoning to enhance wood production (WP zoning) (Figure 6). In BD zoning, compartments with the lowest proportion of natural forest were assigned an EWP zone. In WP zoning, slope degree, stand index, and area of plantation Japanese cedar, which is the major forestry species in Japan were considered. Each district was given a score for the ratio of area of less than slope to the total area, the average stand index, and the ratio of ceder plantation area to the total area, with each parameter assigned a score of 1 to 5 for each conditions. As a final score for each district, individual parameter scores were summed. Then districts were converted from their current condition to EWP, starting with the stands that received the highest score. The total area of the EWP zone was adjusted to be about the same in each plan. Forest compartments were determined by the local government according to natural landscape features. The mean area is 66.4 ha.
3. Results
We examined changes in the indicators to investigate the influence of zoning.
3.1. Wood Production
In the 100-year simulation of wood production, volumes increased for the first 50 years and then decreased (Figure 7). This trend seems to be due to the distribution of current forest age (Figure 4): the proportion of forest old enough for clear-cutting first increased and then decreased. Because the area of clear-cutting was relatively high in WP zoning, a large amount of harvestable forest was felled. The mean volume of wood production in WP zoning was 3000 to 10,000 m larger than in current zoning, or 3% to 11% of the total volume of clear-cutting. These differences could be interpreted in terms of efficacy of zoning and be explained by the EWP zone within WP zoning, which tended to cover area where it is convenient for forestry activities. Such areas have appeal for decision-makers to harvest, and can be increased with EWP zoning. Hence, WP zoning was likely to improve the efficacy of the EWP zone. On the other hand, wood production in BD zoning was also slightly higher than in current zoning. The EWP zone of BD zoning covered plantation forest, which is designed for forestry, efficiency was improved, however it was less compared to WP zoning. This result indicates that for wood production, it is more efficient to assign an EWP zone based on terrain features than forest type.
3.2. Protection against Soil Erosion
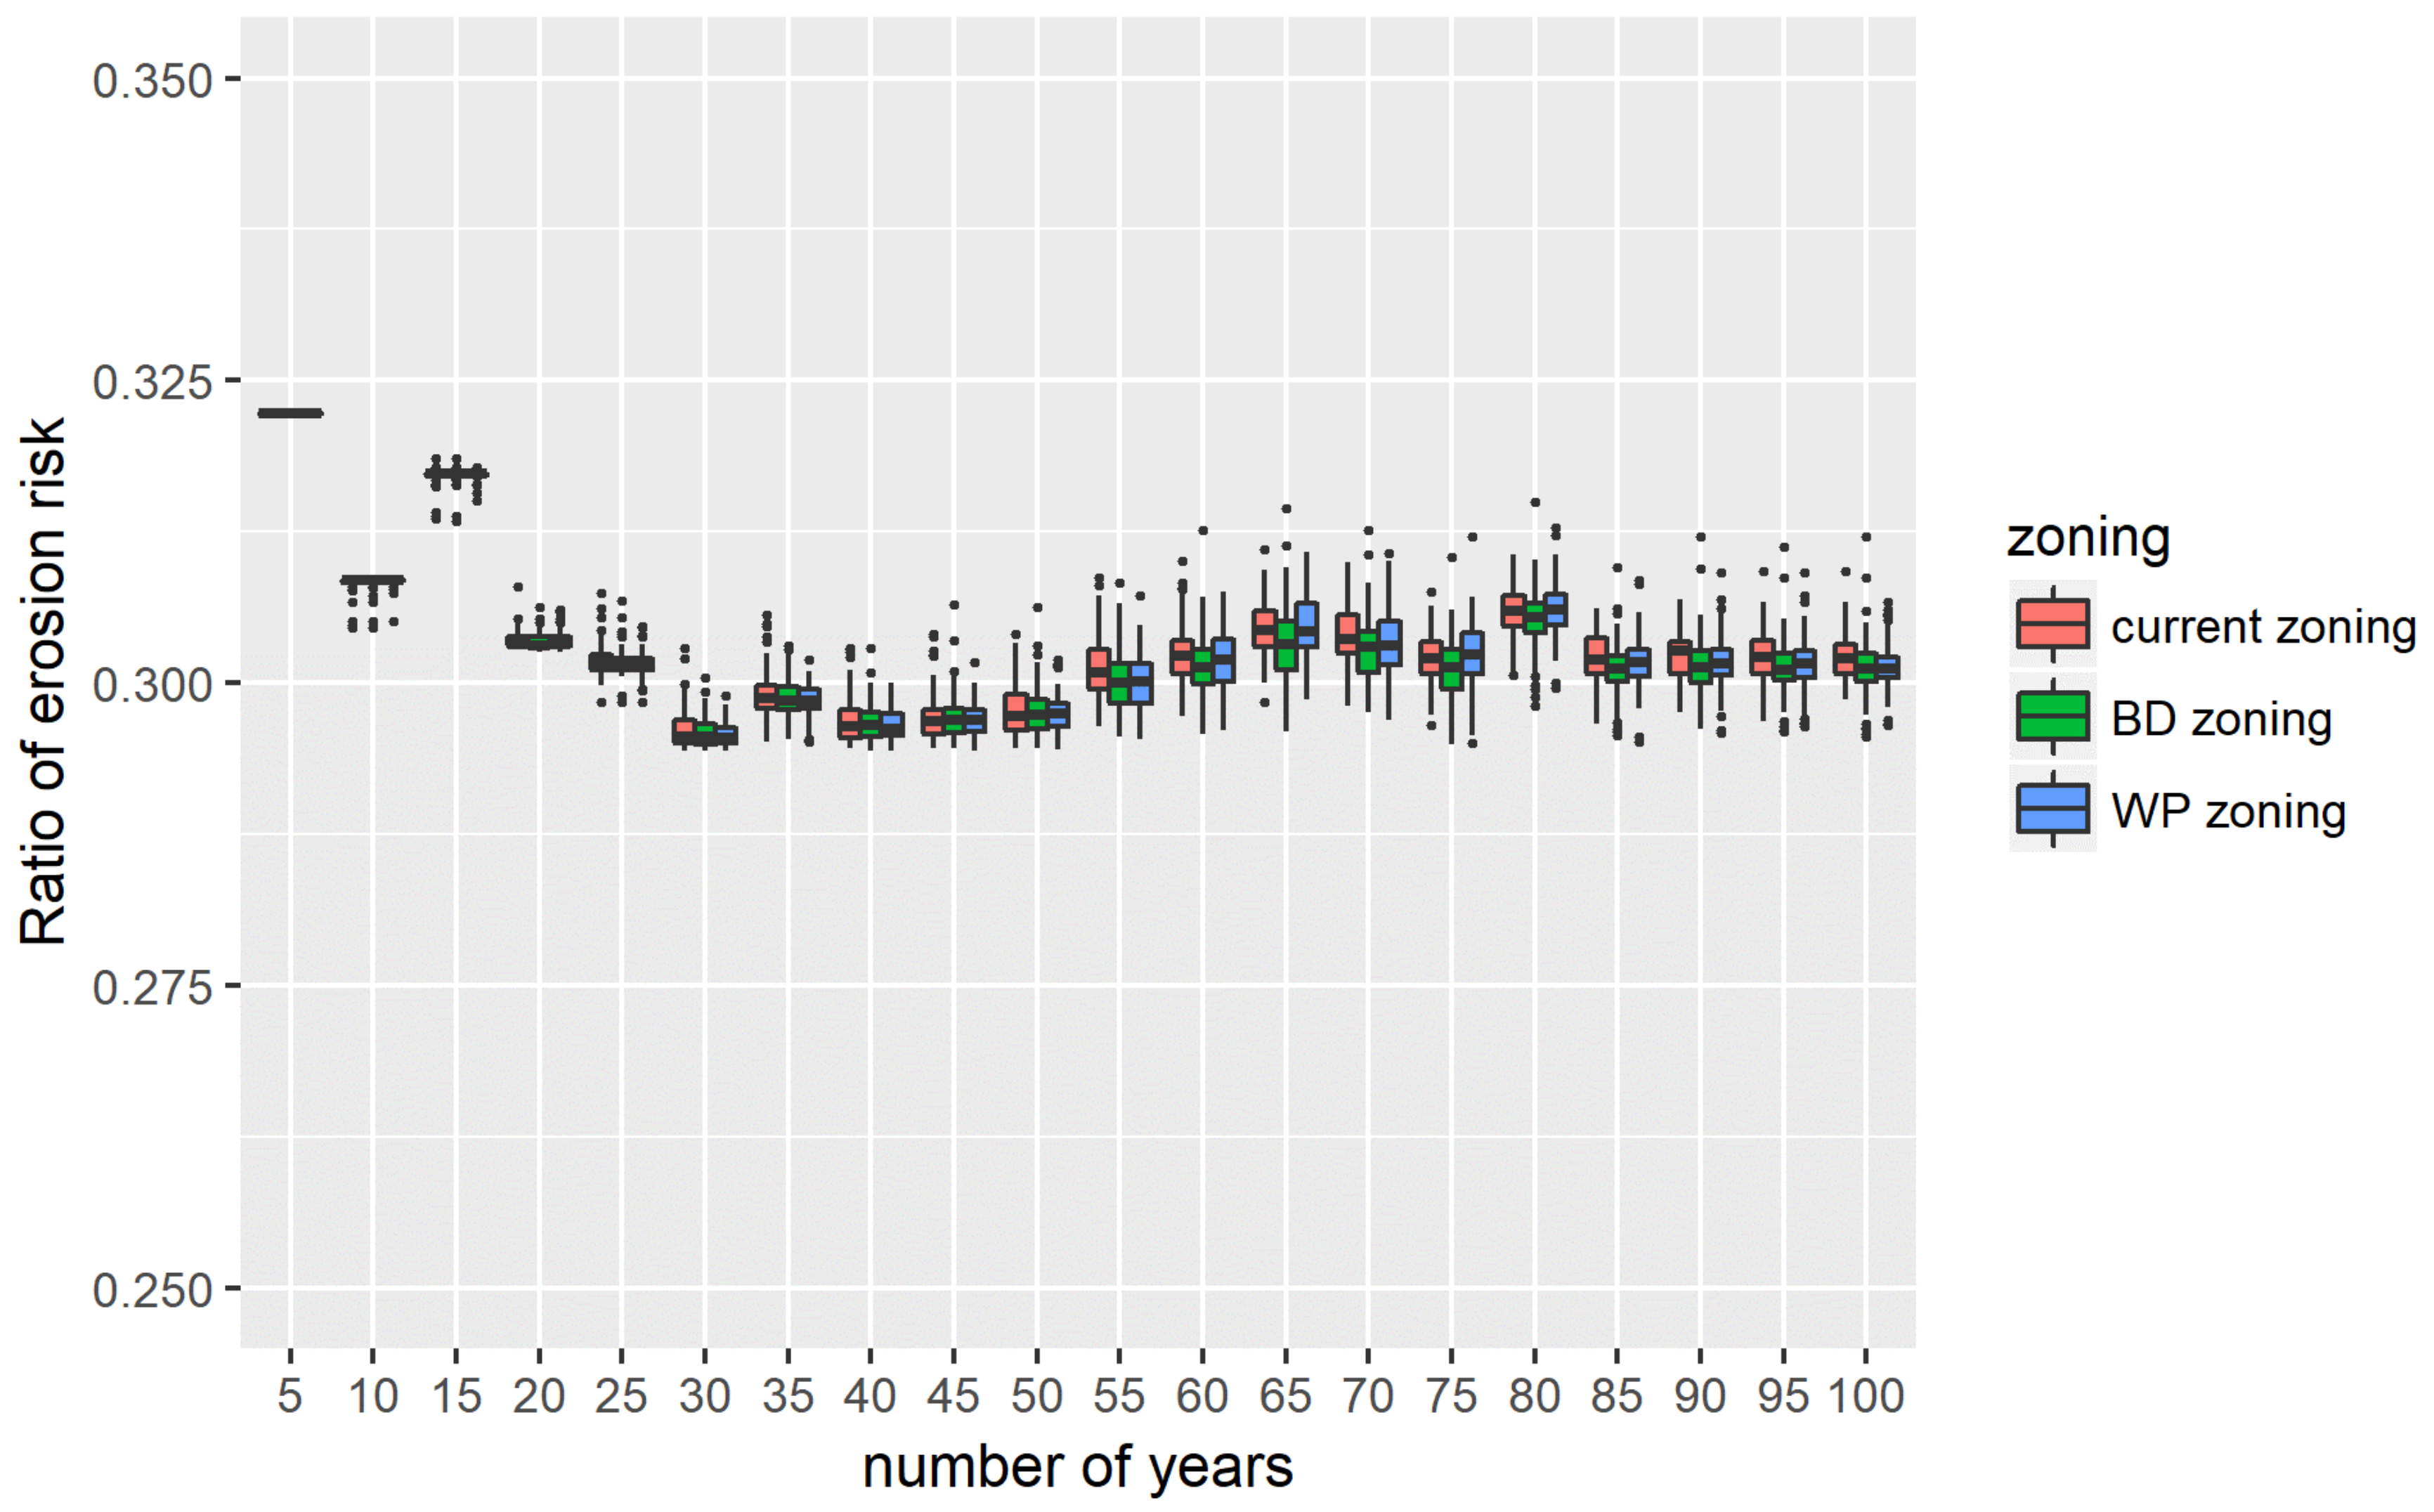
Overall, the proportion of the area at high risk of erosion declined for the first 30 years, then increased slightly until around 70 years to a stable level (Figure 8). The initial decline was due also to the distribution of forest age: the area of young forest, where the risk of soil erosion is higher, dropped over time. Part of the bulge in the age distribution (Figure 4) overlaps the range of the trees in the young forest. In addition, very young forest was scarce, because the area of recently clear-cut forest is small.
There were only little differences among the three zoning types. Although WP zoning had more clear-cut area than the other zoning types, it had almost the same area at risk of erosion. Thus, timber production may be compatible with protection against soil erosion.
3.3. Conserving Biodiversity
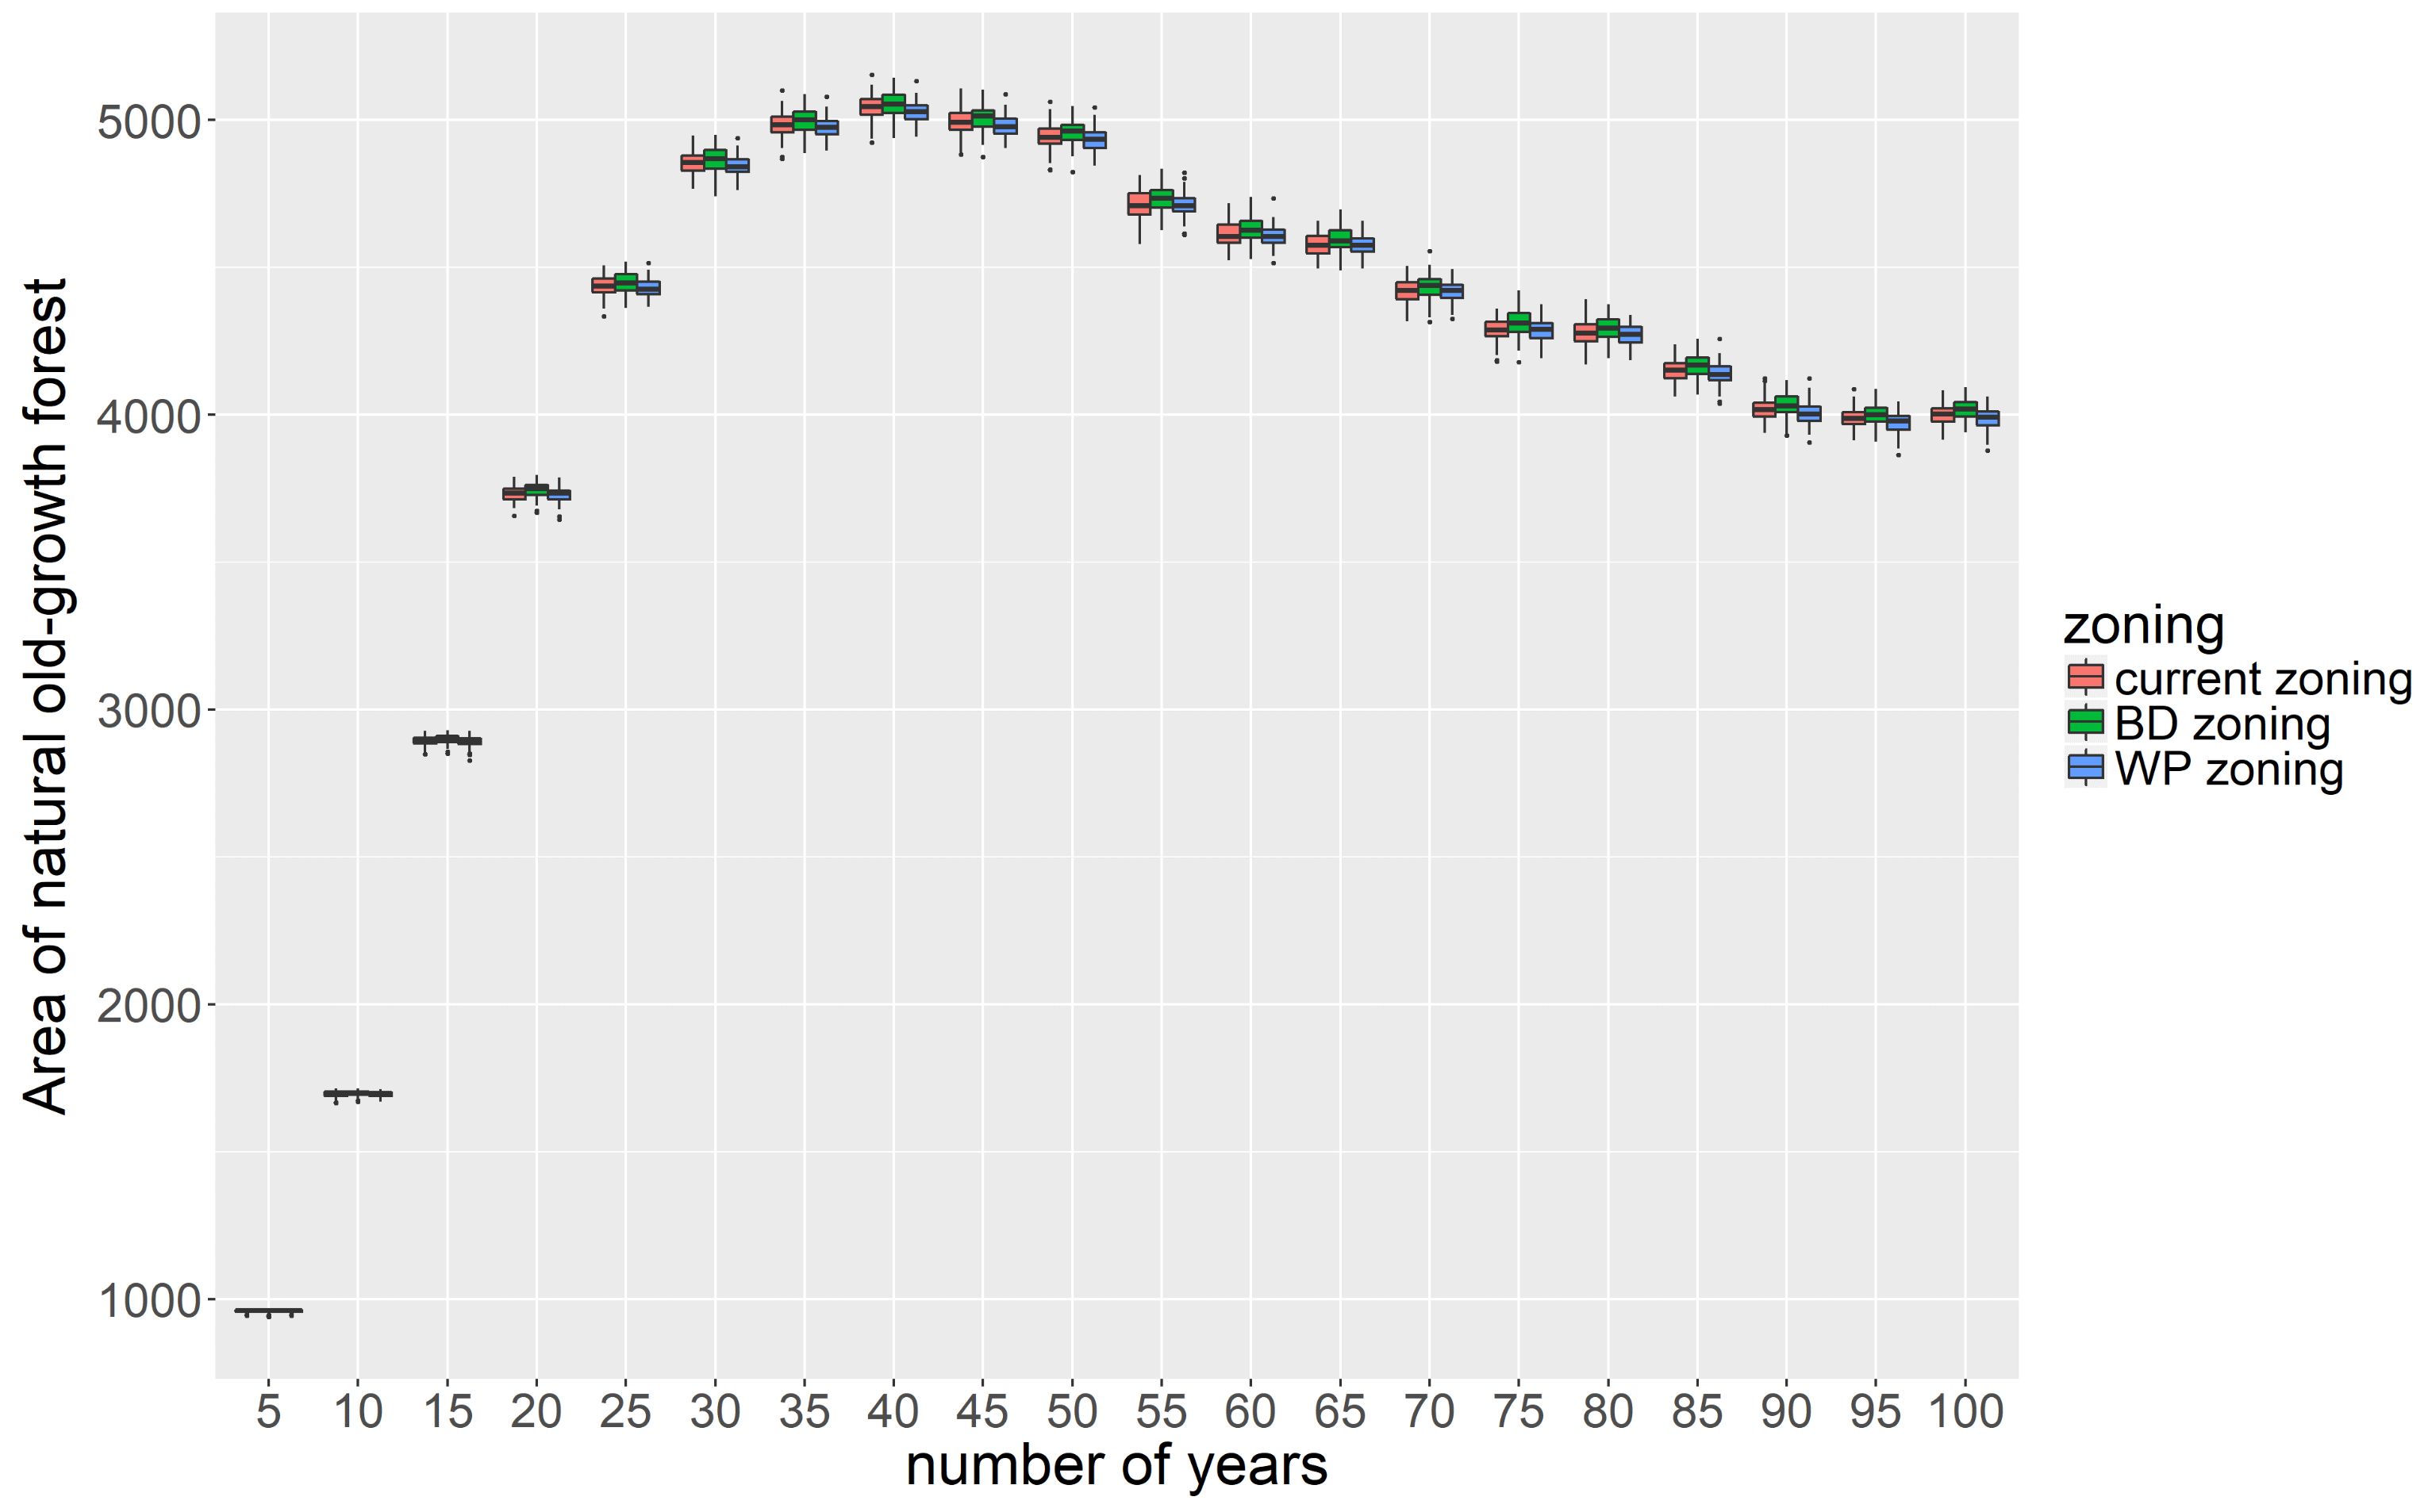
In general, the total area of natural old-growth forest increased for the first 40 years owing to the current age distribution then decreased slightly until around 90 years. Thereafter, there were only slight differences as clear-cutting balanced the growth of forest across the whole region (Figure 9). BD zoning maximized the total area; at 100 years, the area was 16 ha or 0.4% more than in current zoning and 33 ha or 0.8% more than in WP zoning. The smaller area in WP zoning could be explained by its greater clear-cut volume. These results indicate the possibility of enhancing biodiversity by zoning and trade-offs between wood production and biodiversity.
The area of old-growth forest was relatively high in BD zoning, although wood production and protection against soil erosion were almost the same as in current zoning. Flexible assignment of the EWP zone can let forest owners avoid clear-cutting in natural and nearby plantation old-growth forest. We designated BD zoning only by considering current factors, such as forest type, rather than static factors such as terrain, even though zoning may affect some forest functions. The results indicate that zoning considered in relation to current factors could enhance certain forest functions as well as terrain factors do.
3.4. Carbon Retention
Carbon stocks of living woody biomass increased during the simulation (Figure 10). The rate of increase was gradually decreasing. The differential of attractions for forestry activities of forest stands can be assumed as a reason of this trend. Forest stands with factors such as gentle slope or EWP zone, which make them more attractive to forest owners can be clear-cut repeatedly, on the other hand, stands with less attractiveness tend to be avoided for clear-cutting. Less attractive stands got old in an early stage while favorable stands for forest owners stay relatively young to the end due to clear-cutting and reforestation.
Current zoning maximized the total area; at 100 years, the area was 8000 ton or 0.4% more than in BD zoning and 23,000 or 1.2% more than in WP zoning. The carbon stock of living biomass was relatively high in current zoning. The relative low wood production in current zoning can cause this trend. These results indicate the possibility of trade-offs between wood production and carbon retention.
4. Discussion
The results indicate the efficacy of DSAs in adaptive regional forest management. Scientifically designed zoning can ensure long-term ecosystem services. It is possible to enhance forest functions of both wood production and protection against soil erosion by assigning an EWP zone to cover areas of gentle terrain. However, such zoning might place biodiversity at risk. In this study, biodiversity was evaluated only by the area of old-forest, although landscape patterns can enhance or deteriorate it [50]. Further research might achieve to integrate landscape evaluations for biodiversity with the DSAs to conserve biodiversity while maintaining wood production and reducing soil erosion.
The results show the effects of zoning on ecosystem functions. Zoning is typically assigned without consideration of the effects on forest resources; two main approaches are used: comparing alternatives or functions with contemporary factors (e.g., [51,52]), and comparing scenarios to impose fixed forestry activities (e.g., [53,54]). The former cannot assess sustainability, and the latter can easily be idealistic. In contrast, a DSA designed for uncertainties in both controllability and ecosystem functions enables spatial planning such as zoning to be integrated with temporal planning. In addition, such a DSA adapts to observed behaviors to make the predicted results more realistic. This type of DSA accommodates trade-offs among forest functions during planning.
Although we created the DSA to decrease uncertainties, the case study did not test this outcome, as continuous data collection and inspections are required to verify it: it has not been a long period since the municipal government began to collect data about forestry activities in the study area, so there is not enough data yet to allow iterative learning. In addition, FCP and the occurrence of soil erosion have been recorded only since 2009 and have been measured only once or twice in each plot. Neither was it possible to update the BN model to estimate the risk of soil erosion due to a lack of iterative survey data. However, the ability of the DSA model to reduce uncertainties of controllability was verified by simulation in Yamada [24]. The scientific and adaptive management of local forest will need information gathered continuously and the use of such DSAs.
In spite of these problems, however, our results show how the DSA can benefit regional forest management by providing useful information for zoning to acquire sustainable ecosystem services while including partial controllability.
Participatory planning is one method used for managing regional forests where multiple decision-makers are involved [55,56]. It promotes collaboration and consensus-building among various stakeholders in establishing plans, and has high affinity with AM [57,58]. Its goal is to establish plans to fulfill forest functions by satisfying all needs through trade-offs. Plans based on common sense should have a degree of controllability [59]. Although decision-makers are involved in broad-scale planning in adaptive participatory planning, it is unlikely that every activity is totally suited to a plan [60], and they seldom know how far they can follow the plan in deciding activities. It is important to understand the degree of controllability by management to achieve sustainability. The DSA established in this study can provide a basis for decision-making in participatory planning considering uncertainties of controllability. The DSA improves the feasibility of a plan by simulating consequences of regional management at the local scale. Integrating both participatory planning and a DSA can efficiently reduce uncertainty about controllability. This kind of DSA will support adaptive participatory management of regional forests while reducing uncertainties.
5. Conclusions
Prior works have developed various DSAs for adaptive forest management, which aim to achieve sustainability while improving management and reducing uncertainties. Those DSAs tend to pay attention on uncertainties about ecosystems rather than controllability of management, which is important in regional scale management. This research established a DSA for zoning to manage regional forest coping with uncertainties of both controllability and ecosystem. A BN model based on observable behavior was constructed to estimate influences, or controllability of zoning on the allocation of forestry activities. Adding to that, models including BN were established to evaluate ecosystem services such as protecting soil erosion, preserving biodiversity, or carbon retention. The DSA in this research integrated these models to simulate future trends of forest functions.
The DSA was applied to the study area as a case study to assess efficiency. We compared three zoning alternatives that aimed to enhance different forest functions. The results of the simulation indicated the possibility of the DSA to establishing an efficient zoning by considering the effects of zoning on the target functions in the long-term perspectives. However, the differences of forest functions simulated by the DSA among the alternatives were only slight. Future works should focus on the factors to establish zoning that can enhance target functions more efficiently by arranging attractiveness of forest for forest activities with the DSA of this research.
Acknowledgments
The authors would like to thank T. Nakajima for his valuable comments and S. Miura for lending his expertise on soil erosion. We are also grateful to Akita prefectural government and Ugo municipal government for providing dataset. This study was conducted with the data of the National Forest Inventory of Japan (third term, ver.1.0). All data used in this study is unpublished. Yuichi Yamaura was supported by JSPS KAKENHI Grant Number JP16H03004.
Author Contributions
Yusuke Yamada conceived and designed the experiments; Yuichi Yamaura designed some experiments concerned with forest functions for biodiversity; Yusuke Yamada wrote the paper; Yuichi Yamaura helped write the paper.
Conflicts of Interest
The authors declare no conflict of interest. The founding sponsors had no role in the design of the study; in the collection, analyses, or interpretation of data; in the writing of the manuscript; or in the decision to publish the results.
Abbreviations
The following abbreviations are used in this manuscript:
| AM | Adaptive management |
| DSS | Decision support system |
| BN | Bayesian network model |
| FCP | Floor cover percentage |
| NFI | National Forest Inventory |
| EWP | Enhancing wood production |
| SE | Soil erosion |
| BD | Biodiversity |
References
- Rist, L.; Campbell, B.M.; Frost, P. Adaptive management: Where are we now? Environ. Conserv. 2012, 40, 5–18. [Google Scholar] [CrossRef]
- Bormann, B.T.; Haynes, R.W.; Martin, J.R. Adaptive Management of Forest Ecosystems: Did Some Rubber Hit the Road? Bioscience 2007, 57, 186–191. [Google Scholar] [CrossRef]
- DellaSala, D.A.; Baker, R.; Heiken, D.; Frissell, C.A.; Karr, J.R.; Nelson, S.K.; Noon, B.R.; Olson, D.; Strittholt, J. Building on Two Decades of Ecosystem Management and Biodiversity Conservation under the Northwest Forest Plan, USA. Forests 2015, 6, 3326–3352. [Google Scholar] [CrossRef]
- Walters, C. Adaptive Management of Renewable Resources; The Blackburn Press: Caldwell, NJ, USA, 1986; p. 374. [Google Scholar]
- Allen, C.R.; Fontaine, J.J.; Pope, K.L.; Garmestani, A.S. Adaptive management for a turbulent future. J. Environ. Manag. 2011, 92, 1339–1345. [Google Scholar] [CrossRef] [PubMed]
- Vacik, H.; Lexer, M.J. Past, current and future drivers for the development of decision support systems in forest management. Scand. J. For. Res. 2014, 29, 2–19. [Google Scholar] [CrossRef]
- Arnott, D.; Pervan, G. A critical analysis of decision support systems research. J. Inf. Technol. 2005, 20, 67–87. [Google Scholar] [CrossRef]
- Rammer, W.; Schauflinger, C.; Vacik, H.; Palma, J.H.; Garcia-Gonzalo, J.; Borges, J.G.; Lexer, M.J. A web-based ToolBox approach to support adaptive forest management under climate change. Scand. J. For. Res. 2014, 29, 96–107. [Google Scholar] [CrossRef]
- Williams, B.K. Adaptive management of natural resources-framework and issues. J. Environ. Manag. 2011, 92, 1346–1353. [Google Scholar] [CrossRef] [PubMed]
- Acosta, M.; Corral, S. Multicriteria Decision Analysis and Participatory Decision Support Systems in Forest Management. Forests 2017, 8, 116. [Google Scholar] [CrossRef]
- Mitsuda, Y.; Iehara, T.; Matsumoto, M.; Oka, H. Methodologies of forest planning using criteria and indicators. Jpn. J. For. Plan. 2009, 42, 1–14. (In Japanese) [Google Scholar]
- Borges, J.G.; Nordström, E.M.; Garcia Gonzalo, J.; Hujala, T.; Trasobares, A. Computer-Based Tools for Supporting Forest Management; Technical Report; Department of Forest Resource Management, Swedish University of Agricultural Sciences, Umeå: Uppsala, Sweden, 2014. [Google Scholar]
- Davis, L.S.; Liu, G. Integrated Forest Planning Across Multiple Ownerships and Decision Makers. For. Sci. 1991, 37, 200–226. [Google Scholar]
- Hengeveld, G.M.; Schüll, E.; Trubins, R.; Sallnäs, O. Forest Landscape Development Scenarios (FoLDS)—A framework for integrating forest models, owners’ behaviour and socio-economic developments. For. Policy Econ. 2017. [Google Scholar] [CrossRef]
- Marques, A.F.; de Sousa, J.P.; Rönnqvist, M.; Jafe, R. Combining optimization and simulation tools for short-term planning of forest operations. Scand. J. For. Res. 2014, 29, 166–177. [Google Scholar] [CrossRef]
- Reeves, L.H.; Haight, R.G. Timber harvest scheduling with price uncertainty using Markowitz portfolio optimization. Ann. Oper. Res. 2000, 95, 229–250. [Google Scholar] [CrossRef]
- Nyberg, B.J.; Marcot, B.G.; Sulyma, R. Using Bayesian belief networks in adaptive management. Can. J. For. Res. 2006, 36, 3104–3116. [Google Scholar] [CrossRef]
- Keith, D.A.; Martin, T.G.; McDonald-Madden, E.; Walters, C. Uncertainty and adaptive management for biodiversity conservation. Biol. Conserv. 2011, 144, 1175–1178. [Google Scholar] [CrossRef]
- Pearl, J. Probabilistic Reasoning in Intelligent Systems; Morgan Kaufmann Publishers: Minneapolis, MN, USA, 1988; Volume 88, p. 552. [Google Scholar]
- Friedman, N.; Geiger, D.; Goldszmidt, M. Bayesian Network Classifiers. Mach. Learn. 1997, 29, 131–163. [Google Scholar] [CrossRef]
- Cheng, J.; Greiner, R. Comparing Bayesian Network Classifiers. In Proceedings of the 5th Conference on Uncertainty in Artificial Intelligence (UAI1999), Stockholm, Sweden, 30 July–1 August 1999; pp. 101–108. [Google Scholar]
- Bielza, C.; Larrañaga, P. Discrete Bayesian Network Classifiers. ACM Comput. Surv. 2014, 47, 1–43. [Google Scholar] [CrossRef]
- Silver, E.J.; Leahy, J.E.; Weiskittel, A.R.; Noblet, C.L.; Kittredge, D.B. An Evidence-Based Review of Timber Harvesting Behavior among Private Woodland Owners. J. For. 2015, 113, 490–499. [Google Scholar] [CrossRef]
- Yamada, Y. Can a Regional Level Forest Management Policy Achieve Sustainable Forest Management? For. Policy Econ. 2017. under review. [Google Scholar]
- Scutari, M. Learning Bayesian Networks with the bnlearn R Package. J. Stat. Softw. 2010, 35, 1–22. [Google Scholar] [CrossRef]
- Højsgaard, S. Graphical Independence Networks with the gRain Package for R. J. Stat. Softw. 2012, 46, 1–26. [Google Scholar]
- Montanarella, L.; Pennock, D.J.; McKenzie, N.; Badraoui, M.; Chude, V.; Baptista, I.; Mamo, T.; Yemefack, M.; Singh Aulakh, M.; Yagi, K; et al. World’s soils are under threat. SOIL 2016, 2, 79–82. [Google Scholar] [CrossRef]
- Thees, O.; Olschewski, R. Physical soil protection in forests—Insights from production-, industrial- and institutional economics. For. Policy Econ. 2017, 80, 99–106. [Google Scholar] [CrossRef]
- Pimentel, D.; Kounang, N. Ecology of Soil Erosion in Ecosystems. Ecosystems 1998, 1, 416–426. [Google Scholar] [CrossRef]
- Römkens, M.; Helming, K.; Prasad, S. Soil erosion under different rainfall intensities, surface roughness, and soil water regimes. CATENA 2002, 46, 103–123. [Google Scholar] [CrossRef]
- Terry, J.P.; Shakesby, R.A. Soil hydrophobicity effects on rainsplash: Simulated rainfall and photographic evidence. Earth Surf. Process. Landf. 1993, 18, 519–525. [Google Scholar] [CrossRef]
- Toy, T.J.; Foster, G.R.; Renard, K.G. Soil Erosion: Processes, Prediction, Measurement, and Control; John Wiley & Sons: NewYork, NY, USA, 2002; p. 338. [Google Scholar]
- Morgan, R.P.C. Soil Erosion and Conservation, 3rd ed.; Wiley: Hoboken, NJ, USA, 2005; p. 304. [Google Scholar]
- El Kateb, H.; Zhang, H.; Zhang, P.; Mosandl, R. Soil erosion and surface runoff on different vegetation covers and slope gradients: A field experiment in Southern Shaanxi Province, China. CATENA 2013, 105, 1–10. [Google Scholar] [CrossRef]
- Miura, S.; Yoshinaga, S.; Yamada, T. Protective effect of floor cover against soil erosion on steep slopes forested with Chamaecyparis obtusa (hinoki) and other species. J. For. Res. 2003, 8, 27–35. [Google Scholar] [CrossRef]
- Miura, S.; Ugawa, S.; Yoshinaga, S.; Yamada, T.; Hirai, K. Floor cover percentage determines splash erosion in chamaecyparis obtusa forests. Soil Sci. Soc. Am. J. 2015, 79, 1782–1791. [Google Scholar] [CrossRef]
- Hartanto, H.; Prabhu, R.; Widayat, A.S.; Asdak, C. Factors affecting runoff and soil erosion: Plot-level soil loss monitoring for assessing sustainability of forest management. For. Ecol. Manag. 2003, 180, 361–374. [Google Scholar] [CrossRef]
- Hirata, Y.; Hosoda, K.; Nishizono, T.; Kitahara, F.; Nagame, I.; Nakamura, M. National Forest Inventory Reports: Japan. In Natl for Invent; Vidal, C., Alberdi, I., Hernández, L., Redmond, J.J., Eds.; Springer: Berlin, Germany, 2016; pp. 507–520. [Google Scholar]
- Cole, E.; Newton, M.; Bailey, J.D. Understory vegetation dynamics 15 years post-thinning in 50-year-old Douglas-fir and Douglas-fir/western hemlock stands in western Oregon, USA. For. Ecol. Manag. 2017, 384, 358–370. [Google Scholar] [CrossRef]
- United Nations Committee of Experts on Global Geospatial Information Management. Fundamental Geospatial Data Themes. In Proceedings of the Seventh Session of the Committee of Experts on UN GGIM SIDE EVENT, New York, NY, USA, 31 July 2017. [Google Scholar]
- Hunter, M.L. Maintaining Biodiversity in Forest Ecosystems; Cambridge University Press: Cambridge, UK, 1999; p. 698. [Google Scholar]
- Hunter, M.L. Wildlife, Forests, and Forestry. Principles of Managing Forests for Biological Diversity; Prentice Hall: Englewood Cliffs, NJ, USA, 1990; p. 370. [Google Scholar]
- Gibson, L.; Lee, T.M.; Koh, L.P.; Brook, B.W.; Gardner, T.A.; Barlow, J.; Peres, C.A.; Bradshaw, C.J.A.; Laurance, W.F.; Lovejoy, T.E.; et al. Primary forests are irreplaceable for sustaining tropical biodiversity. Nature 2011, 478, 378–381. [Google Scholar] [CrossRef] [PubMed]
- Barlow, J.; Lennox, G.D.; Ferreira, J.; Berenguer, E.; Lees, A.C.; Nally, R.M.; Thomson, J.R.; Ferraz, S.F.D.B.; Louzada, J.; Oliveira, V.H.F.; et al. Anthropogenic disturbance in tropical forests can double biodiversity loss from deforestation. Nature 2016, 535, 144–147. [Google Scholar] [CrossRef] [PubMed]
- Gustafsson, L.; Baker, S.C.; Bauhus, J.; Beese, W.J.; Brodie, A.; Kouki, J.; Lindenmayer, D.B.; Lohmus, A.; Pastur, G.M.; Messier, C.; et al. Retention Forestry to Maintain Multifunctional Forests: A World Perspective. Bioscience 2012, 62, 633–645. [Google Scholar] [CrossRef]
- Ohsawa, M.; Shimokawa, T. Extending the rotation period in larch plantations increases canopy heterogeneity and promotes species richness and abundance of native beetles: Implications for the conservation of biodiversity. Biol. Conserv. 2011, 144, 3106–3116. [Google Scholar] [CrossRef]
- Pan, Y.; Birdsey, R.A.; Fang, J.; Houghton, R.; Kauppi, P.E.; Kurz, W.A.; Phillips, O.L.; Shvidenko, A.; Lewis, S.L.; Canadell, J.G.; et al. A Large and Persistent Carbon Sink in the World’s Forests. Science 2011, 333, 988–993. [Google Scholar] [CrossRef] [PubMed]
- Birdsey, R.; Pregitzer, K.; Lucier, A. Forest carbon management in the United States: 1600–2100. J. Environ. Qual. 2006, 35, 1461–1469. [Google Scholar] [CrossRef] [PubMed]
- Greenhouse Gas Inventory Office of Japan. National Greenhouse Gas Inventory Report of Japan; Technical Report; Center for Global Environmental Research, National Institute for Environmental Studies, Ministry of the Environment: Tsukuba, Japan, 2017.
- Fischer, D.; Lindenmayer, J. Landscape modification and habitat rfragmentation: A synthesis. Glob. Ecol. Biogeogr. 2007, 17, 265–280. [Google Scholar] [CrossRef]
- Seymour, R.S.; Hunter, M.L.J. New Forestry in Eastern Spruce-Fir Forests: Principles and Applications to Maine. Maine Misc. Publ. 1992, 716, 1–36. [Google Scholar]
- Wu, S.; Minowa, M.; Shimada, K.; Tsuyuki, S.; Hiroshima, T.; Lee, J. A study of forest function valuation and zoning based on GIS technique for Asahi Forest. Bull. Tokyo Univ. For. 2004, 111, 59–83. [Google Scholar]
- Côté, P.; Tittler, R.; Messier, C.; Kneeshaw, D.D.; Fall, A.; Fortin, M.J. Comparing different forest zoning options for landscape-scale management of the boreal forest: Possible benefits of the TRIAD. For. Ecol. Manag. 2010, 259, 418–427. [Google Scholar] [CrossRef] [Green Version]
- Montigny, M.K.; MacLean, D.A. Triad forest management: Scenario analysis of forest zoning effects on timber and non-timber values in New Brunswick, Canada. For. Chron. 2006, 82, 496–511. [Google Scholar] [CrossRef]
- Ananda, J. Implementing Participatory Decision Making in Forest Planning. Environ. Manag. 2007, 39, 534–544. [Google Scholar] [CrossRef] [PubMed]
- Kangas, J.; Loikkanen, T.; Pukkala, T.; Pykäläinen, J. A participatory approach to tactical forest planning. Acta For. Fenn. 1996, 251, 1–24. [Google Scholar] [CrossRef]
- Williams, B.K.; Brown, E.D. Adaptive management: From more talk to real action. Environ. Manag. 2014, 53, 465–479. [Google Scholar] [CrossRef] [PubMed]
- Pollino, C.A.; Henderson, C. Bayesian Networks: A Guide for Their Application in Natural Resource; Technical Report 14; Australian Government Department of the Environment, Water, Heritage and the Arts: Parkes, Australia, 2010.
- Armitage, D.; Berkes, F.; Doubleday, N. Adaptive Co-Management: Collaboration, Learning, and Multi-Level Governance; UBC Press: Vancouver, BC, USA, 2007; p. 344. [Google Scholar]
- Nordström, E.M.; Eriksson, L.O.; Karin, Ö. Multiple criteria decision analysis with consideration to place-specific values in participatory forest planning. Silva Fenn. 2011, 45, 253–265. [Google Scholar] [CrossRef]
Figure 1.
Criteria assessed in inspection of forest floor cover in National Forest Inventory of Japan, adapted from the NFI manual (unpublished).
Figure 1.
Criteria assessed in inspection of forest floor cover in National Forest Inventory of Japan, adapted from the NFI manual (unpublished).
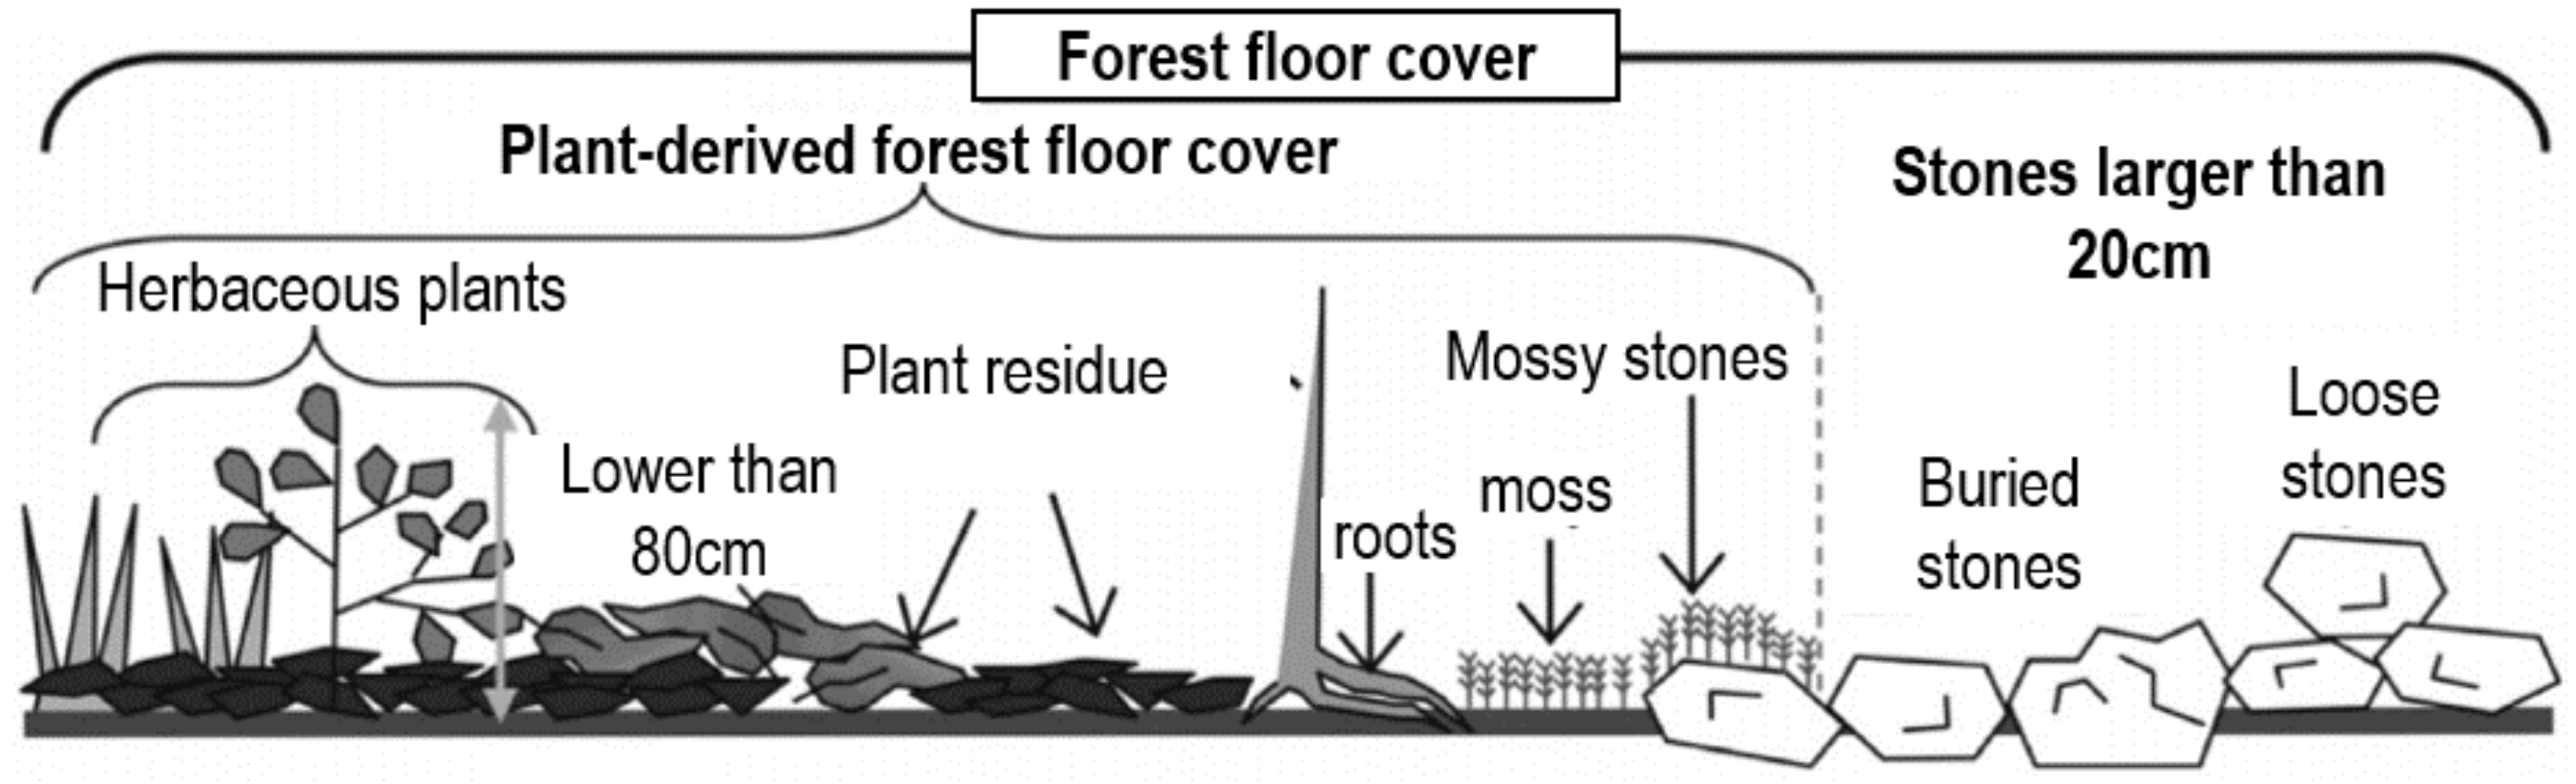
Figure 2.
Structure of the Bayesian network model used to estimate the possibility of soil erosion.

Figure 3.
Location of the study area, Ugo, Akita prefecture in the Tohoku district of Japan.

Figure 4.
Current distribution of forest age classes in the study area: forest age was separated by every five years in each class.
Figure 4.
Current distribution of forest age classes in the study area: forest age was separated by every five years in each class.

Figure 5.
Structure of the Bayesian network model to estimate the probability of forestry activities.
Figure 5.
Structure of the Bayesian network model to estimate the probability of forestry activities.

Figure 6.
Three zoning alternatives compared in the case study.

Figure 7.
Change of wood production over 100 years simulated with the DSS. Boxes show median values, maximum and minimum values, and quartiles of each trial.
Figure 7.
Change of wood production over 100 years simulated with the DSS. Boxes show median values, maximum and minimum values, and quartiles of each trial.
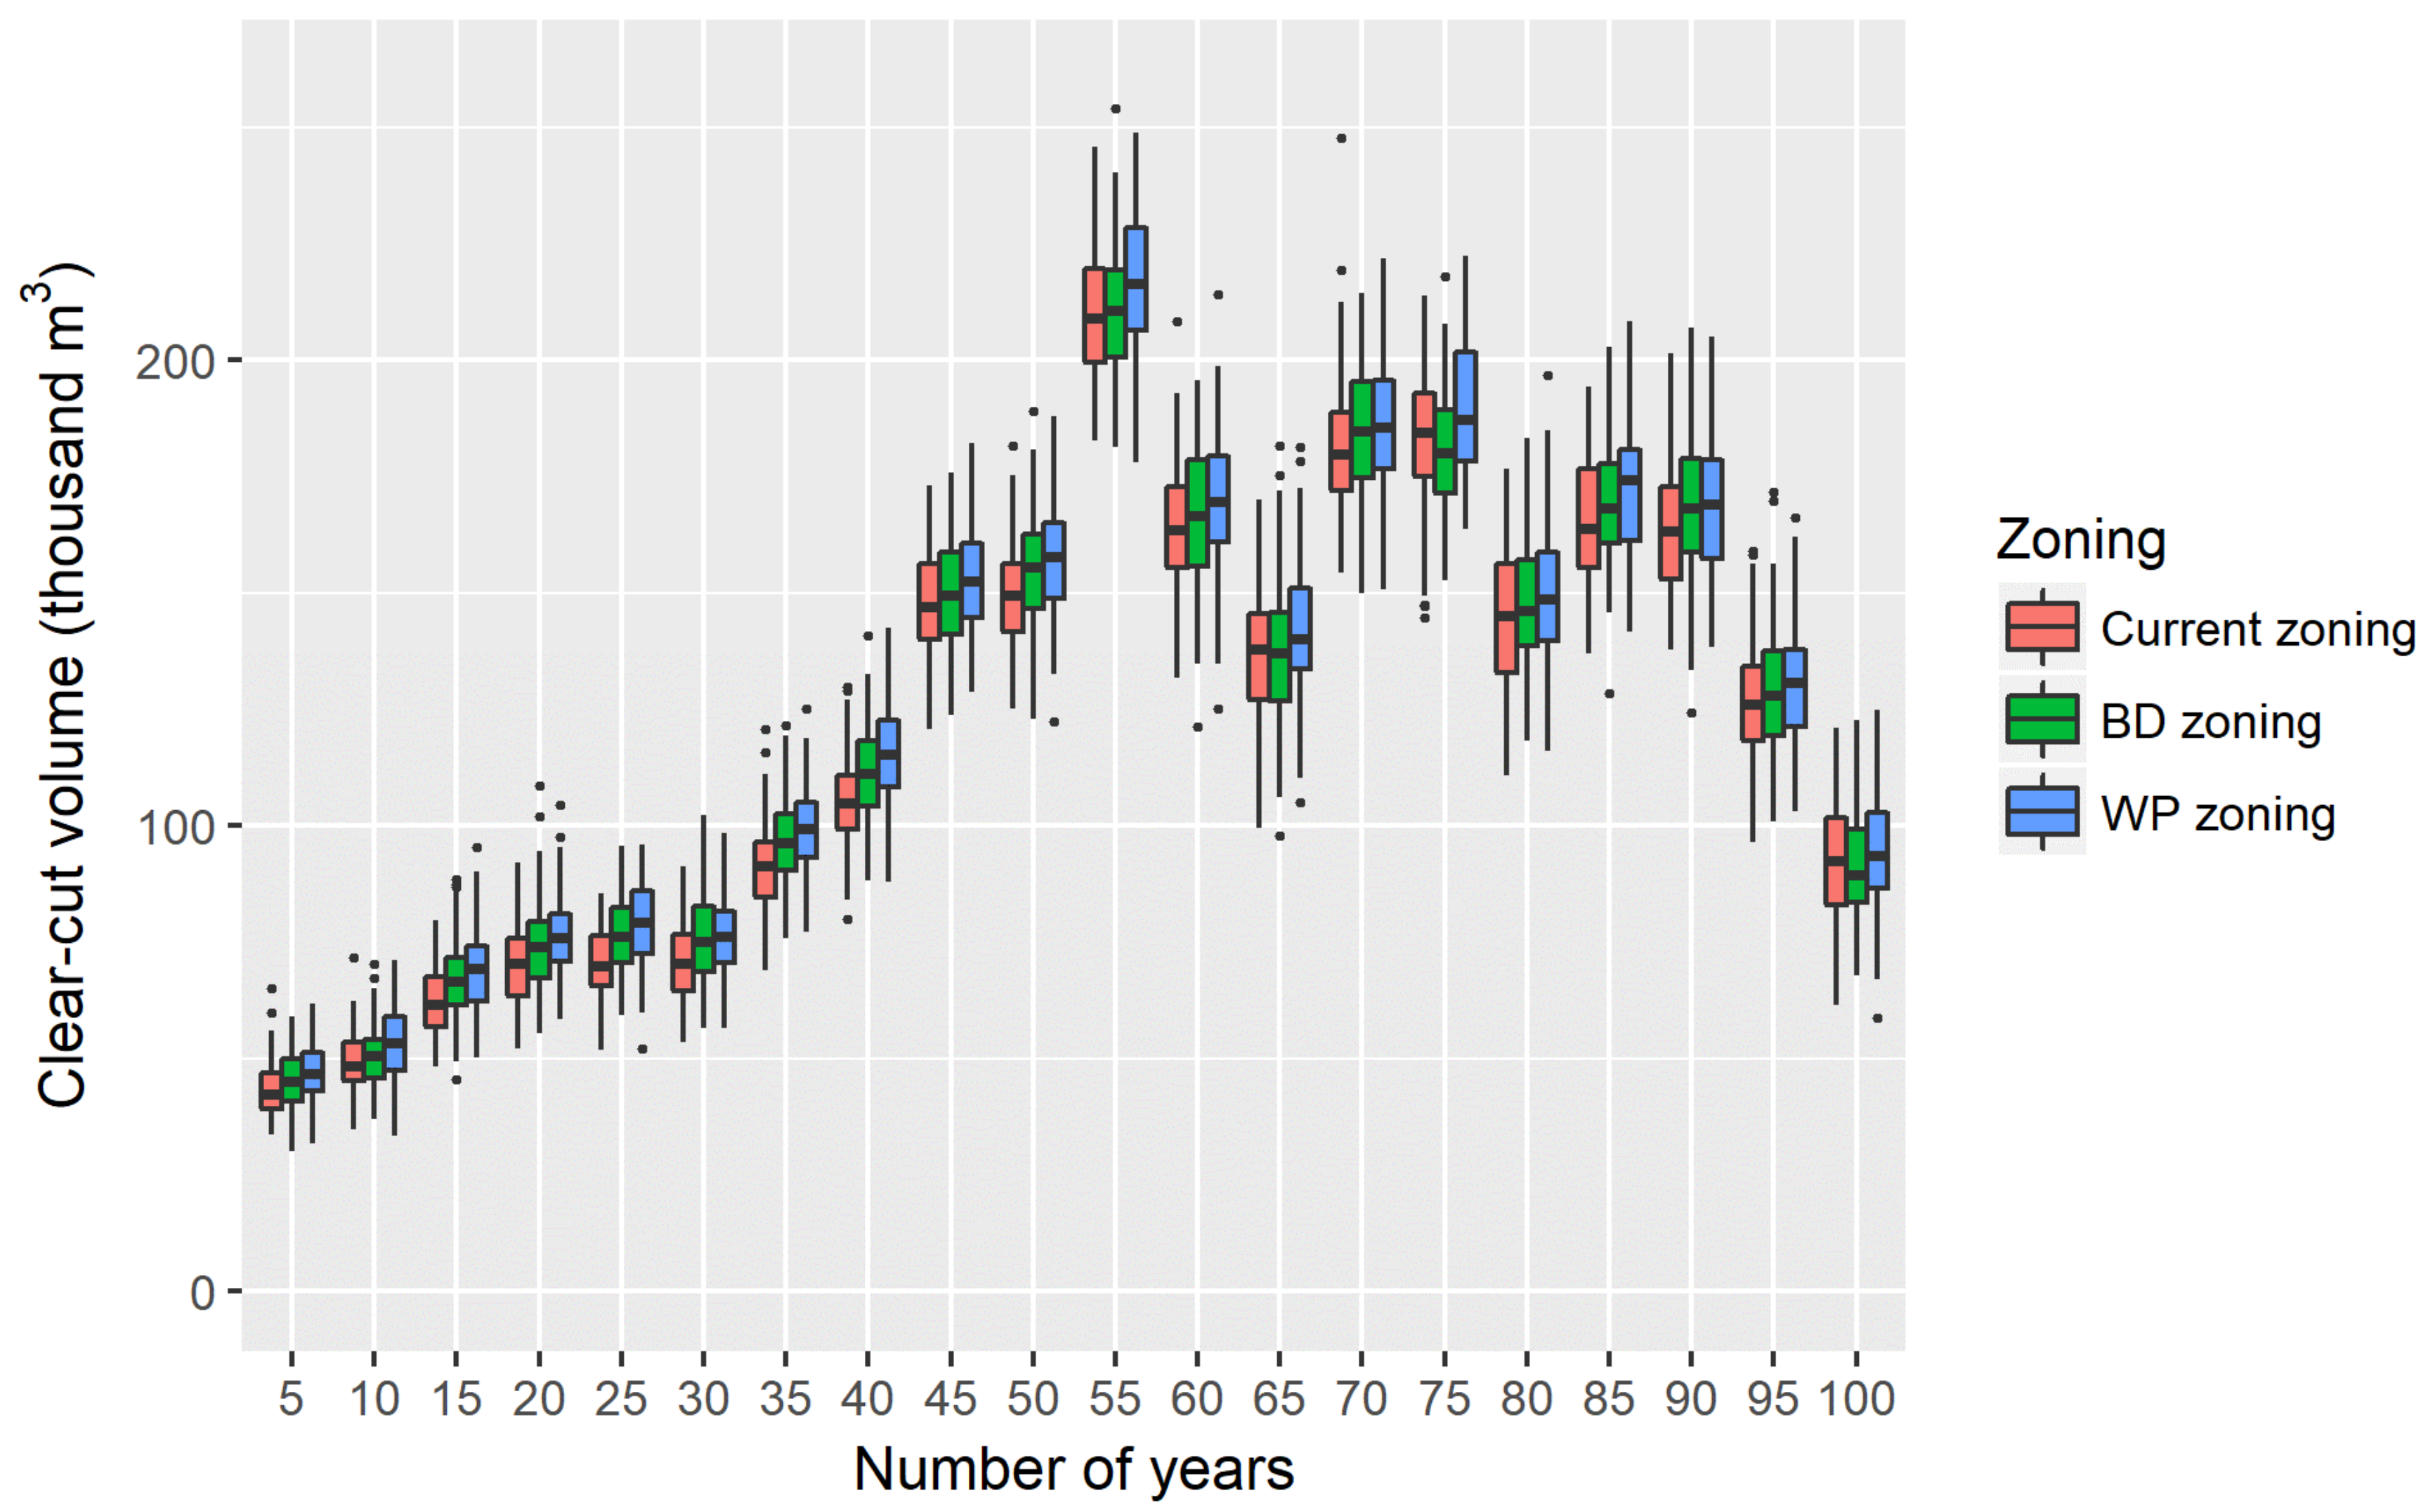
Figure 8.
Change in area at >15% risk of soil erosion over 100 years simulated with the DSS. Boxes show median values, maximum and minimum values, and quartiles of each trial.
Figure 8.
Change in area at >15% risk of soil erosion over 100 years simulated with the DSS. Boxes show median values, maximum and minimum values, and quartiles of each trial.

Figure 9.
Change of old-growth forest area simulated with the DSS. Boxes show median values, maximum and minimum values, and quartiles of each trial.
Figure 9.
Change of old-growth forest area simulated with the DSS. Boxes show median values, maximum and minimum values, and quartiles of each trial.

Figure 10.
Change of carbon stock simulated with the DSA. Boxes show median values, maximum and minimum values, and quartiles of each trial.
Figure 10.
Change of carbon stock simulated with the DSA. Boxes show median values, maximum and minimum values, and quartiles of each trial.


Table 1.
Variables and states used for the model to reveal the influence of regional forest management on individual forestry activities.
Table 1.
Variables and states used for the model to reveal the influence of regional forest management on individual forestry activities.
| Variables | States |
|---|---|
| Forestry activities | No operations |
| Clear-cutting | |
| Volume (m) | 0 to <100 |
| 100 to <200 | |
| 200 to <300 | |
| 300 to <400 | |
| 400 to <500 | |
| 500 to <600 | |
| ≥600 | |
| Volume per unit area (m) | 0 to <100 |
| 100 to <200 | |
| 200 to <300 | |
| 300 to <400 | |
| 400 to <500 | |
| 500 to <600 | |
| ≥600 | |
| Age | 0 to <10 |
| 10 to <20 | |
| 20 to <30 | |
| 30 to <40 | |
| 40 to <50 | |
| 50 to <60 | |
| 60 to <70 | |
| 70 to <80 | |
| 80 to <90 | |
| ≥90 | |
| Area (ha) | 0.2 to <0.5 |
| 0.5 to <1 | |
| 1 to <1.5 | |
| 1.5 to <2 | |
| 2 to <3 | |
| ≥3 | |
| Species | Japanese ceder |
| Japanese larch | |
| Others | |
| Slope degree | 0 to <15 |
| 15 to <20 | |
| 20 to <30 | |
| ≥30 | |
| Distance from road (m) | 0 to <25 |
| 25 to <50 | |
| 50 to <100 | |
| 100 to <200 | |
| ≥200 | |
| Whether or not forest owner | Absent |
| Lives in DSA area | Within the area |
| Zoning to enhance wood | True |
| production | False |
| Zoning to conserve water | True |
| False | |
| Zoning to prevent landslides | True |
| False |
Table 2.
Variables and states used for the model to reveal the influence of regional forest management on individual forestry activities.
Table 2.
Variables and states used for the model to reveal the influence of regional forest management on individual forestry activities.
| Variables | States |
|---|---|
| Soil erosion | True |
| False | |
| FCP(%) | 0 to <40 |
| 40 to <70 | |
| 70 to <90 | |
| 90 to ≤100 | |
| Slope degree | 0 to <10 |
| 10 to <20 | |
| 20 to <30 | |
| 30 to <40 | |
| ≥40 | |
| Terrain surface | Gentle |
| Steep | |
| Forest growth stage | Young |
| Others | |
| Dominant species | Japanese ceder |
| Japanese larch | |
| Others |
Table 3.
Parameters used for calculating carbon stock.
| Species | BEF | R | D | CF | |
|---|---|---|---|---|---|
| Age ≤ 20 | Age > 20 | ||||
| Japanese ceder | 1.57 | 1.23 | 0.25 | 0.314 | 0.51 |
| Japanese larch | 1.50 | 1.15 | 0.29 | 0.404 | 0.51 |
| Others | 1.40 | 1.26 | 0.26 | 0.624 | 0.48 |
© 2017 by the authors. Licensee MDPI, Basel, Switzerland. This article is an open access article distributed under the terms and conditions of the Creative Commons Attribution (CC BY) license (http://creativecommons.org/licenses/by/4.0/).
Share and Cite
MDPI and ACS Style
Yamada, Y.; Yamaura, Y. Decision Support System for Adaptive Regional-Scale Forest Management by Multiple Decision-Makers. Forests 2017, 8, 453. https://doi.org/10.3390/f8110453
AMA Style
Yamada Y, Yamaura Y. Decision Support System for Adaptive Regional-Scale Forest Management by Multiple Decision-Makers. Forests. 2017; 8(11):453. https://doi.org/10.3390/f8110453
Chicago/Turabian StyleYamada, Yusuke, and Yuichi Yamaura. 2017. "Decision Support System for Adaptive Regional-Scale Forest Management by Multiple Decision-Makers" Forests 8, no. 11: 453. https://doi.org/10.3390/f8110453
Note that from the first issue of 2016, this journal uses article numbers instead of page numbers. See further details here.